1. Introduction
Surface roughness is an important quality criterion of functional components [
1]. To achieve low roughness values in manufacturing process chains, finishing operations can be used. Thereby, additional manufacturing steps, like polishing, are often costly and still need to be carried out manually. To design an optimized manufacturing line, the resulting roughness values of each process have to be known. However, due to the dependence on a high number of influencing factors in each machining step, the prediction of these values is challenging. Cutting parameters, choice of material, process dynamics and cutting edge geometry are of decisive importance. This is valid for both the geometrically undefined as well as the geometrically defined cutting edges [
2].
First approaches for predicting roughness values were developed for turning processes, by considering the engagement situation and the tool geometry in an analytical model. One approach to calculate the theoretical peak-to-valley roughness
Rth as
was presented by Bauer [
3], which takes the corner radius
rε and the feed rate
f into account. In literature, however, a more frequently applied equation
by Shaw [
4] can be found. Martelotti [
5] extended this mathematical relationship, by considering the process specific feed per tooth
fz, as well as properties of the tool, such as corner radius
rε and number of teeth
z, as
to calculate
Rth for milling processes. Although the occurrence of ploughing effects, tool deviations or geometric properties of the cutting edge are not considered, these equations already provide an approximation of the theoretical roughness depth. For the calculation of the theoretical roughness depth in a face circumferential milling processes, the secondary cutting edges need to be taken into account. Since the resulting machining grooves are influenced by the condition and orientation of the secondary cutting edge, it should be considered for a well-founded prediction of the theoretical roughness depth.
In order to gain a more detailed understanding of the generation of a workpiece surface, predictions of topographies for complete parts are preferable. A prediction for a ball-end milling process was presented in the approach of Layegh and Lazoglu [
6]. Their model considers the trochoidal motion path of the cutting edge in dependency of the feed per tooth
fz, the engagement conditions
ap and
ae, the tool orientation and the runout, which enables the calculation of a three-dimensional topography. In a face milling process using an end-milling cutter with corner radius, the geometric dependencies are much more complex. The surface topography is not defined by a single cut, but results from a superposition of a large number of cutting motions. Hadad and Ramezani [
7] showed that different surface topographies could be generated by changed tool inclinations in face milling processes. Freiburg and Biermann [
8] presented an analytical model for high feed milling that considers this relationship. Due to the special geometry of the tools, the transferability to conventional processes is limited [
9].
Further approaches can be found in the field of geometric simulations. Kundrák and Felho used a CAD system to determine the surface roughness when using face-milling tools with special cutting inserts [
10]. However, this approach does not take the microgeometric properties of the tool, i.e., the actual condition and deviation of the ideal shape of the cutting edge, or trochoidal motion paths of the cutting edges into account [
11]. Denkena and Böß were pursuing a similar approach applying a process simulation system, in which CAD data of the tool shape can be respected. When mapping the tool shape to the surface topography, only the tool shell is considered [
12]. Lavernhe et al. illustrated the influence of microscopic defects at the cutting edge on the generation of surface topographies [
13]. The validation was performed for a ball-end milling tool. Denkena et al. combined a material removal simulation with an empirical model to incorporate stochastic variations regarding the machined workpiece material and, thus, achieved a detailed prediction of the surface quality [
14].
In summary, promising approaches have been developed for predicting the surface roughness in face milling processes. This was achieved primarily through geometric simulation approaches. However, promising analytical approaches could be identified for special cases. In addition, the studies showed, that the level of detail is essential for a highly valid prediction. In particular, deviations from ideal cutting edges regarding its own macro- and microgeometric properties must be considered. This aspect is gaining importance to ensure predictions for functional surfaces with low roughness values.
In this paper, both an analytical and a geometric simulation-based method are presented for the prediction of the surface roughness resulting from face micromilling processes. The analytical model allows a fast but idealized determination of the roughness profile considering special aspects of the face milling process. The geometric simulation approach enables a realistic prediction of a three-dimensional surface topography considering complex engagement conditions and influencing variables like a detailed tool model considering microgeometric properties of the cutting edge, runout, axial offset and specific variations of the process parameter values. In addition, the simulation is used to investigate and visualize the observed effects resulting from the face milling process.
3. A New Analytical Approach for Surface Roughness Determination
In the following section, an analytical model for describing the theoretical roughness depth
Rth in a circumferential face milling process is presented. As described in Equations (1)–(3), the theoretical roughness depth can be calculated based on a two-dimensional cross-section of the geometric tool engagement and, thus, indicates the highest expected roughness depth along the feed direction. In addition to the process parameter values used in Equation (1), the angle
of the face-sided minor cutting edge (see
Figure 2c) is taken into account, which plays a decisive role for the resulting surface topography in a circumferential face milling process.
The macroscopic shape of the tool and the chosen process parameters determine the geometric cutter-workpiece-engagement and, thus, induce the resulting milling marks, as illustrated in
Figure 2. The depth of these marks depends on the feed per tooth
fz, the corner radius
rε and the angle of the minor cutting edge
ψ. While the feed per tooth defines the width of the milling marks, the interrelation of the corner radius and the angle of the minor cutting edge determine the vertical depth.
Based on the cross-section of the machining mark shown in
Figure 2, an approach for calculating the maximum depth of the mark was derived, using the combination of a linear and circular equation (see
Figure 3). By inserting Equation (4) into Equation (6), parameters can be substituted as
Since the maximum depth of the machining mark is reached at the point of intersection of both equations,
y is equivalent to the theoretical roughness depth
Rth. By solving for
Rth, the theoretical roughness can be calculated as
This simplified consideration of the process can be used to analyze the effects of the macroscopic shape for end milling tools without extensive experimental investigations (see
Section 5).
In addition to conventional characterization parameters of the tool such as the diameter
d, the corner radius
rε and the number of cutting edges
zn, the macroscopic shape also includes shape errors of the tool. These consist of the runout error and the axial offset of both minor cutting edges. While the former can either be caused by the clamping of the tool, the radial runout of the minor cutting edge on end-mills is attributable to production deviations. The microgeometric edge comprises of the edge rounding, which can be described by the average edge rounding
and further deviations, such as the roughness of the cutting edge. This also includes wear-related changes from the original tool shape, such as microscopic defects or larger breakouts. The geometric shape of cutter-workpiece-engagements is also influenced by vibrations during the milling process. Tool deflections have a direct effect on the engagement of the individual cutting edges, which influence the quality of the surface. The material behavior can have a substantial influence on the surface roughness and the surface integrity during cutting, due to the occurrence of smearing or the formation of burrs during cutting [
18]. Additional to the overall deformation behavior, the aforementioned cutting edge rounding can lead to the ploughing effect [
19], which describes the plastic deformation of the material to be cut in front of the cutting edge (
Section 5.4).
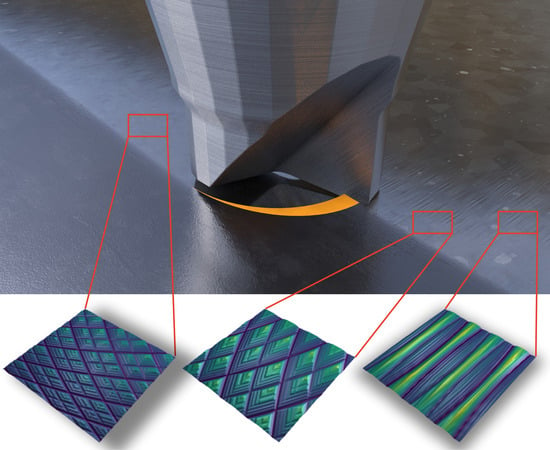
During machining processes without additional tool inclination and very low static tool deflections, a reduced influence of the back cut can be observed. Depending on the process parameter values used, the back cut of the tool influences the surface topography during traversal of the workpiece. Especially the lateral overlapping of the machining track increases this effect due to a large number of tool engagements, particularly for low values of the width of cut. This implies the need to take a large number of tooth engagements into account when investigating resulting surface topographies. The overall number of consecutive cuts of adjacent cutting paths leads to a significant decrease in surface roughness (see
Figure 1). Due to the complexity of influencing parameters, a high number of experiments is needed to establish an understanding of the prognosis of the surface quality for a defined machining process. To cope with these limitations, geometric simulations can be used to reduce the number of experiments. In this paper, a model for the prediction of surface topographies is presented, which can be used to reduce the experimental effort.
5. Results
The results of an application of the described approaches for predicting the surfaces roughness of a face micromilling process of hardened HSS are presented in the following section. After a brief evaluation of the analytical model, the results of the models are compared to the results of the geometric simulative approach.
5.1. Validation and Evaluation of the Analytical Model
The validation of the analytical model as well as its possibilities and limitations are presented. Following this, a discussion of the significant simplification of complex interrelationships associated with such models is carried out. In order to test the presented model, experiments were conducted with a variation of the feed per tooth
fz. Since the model was designed for a single machining path, single slots were milled and afterwards evaluated regarding
Rmax along a profile in the center of the slot in feed direction. The results of the experiments are compared to the predictions of the new analytical model (Equation (7)) and those introduced by Bauer as well as Martellotti (Equations (1) and (3), see
Figure 10).
The results show an increase of roughness in correlation to the feed per tooth in the experiment as well as the analytical model. Comparing the results of the analytical models to the experiments, the new contribution (Equation (7)) shows a better accordance than the model of Bauer or Martellotti. The offset of the higher roughness value of the experiments is due to the simplified view of the analytical model. Since the microgeometry of the cutting edge and the material behavior influence the resulting surface, neglecting such effects leads to an underestimation of the roughness values. Taking the chipping of the cutting edges of
Rs = 1.5 µm into account, the offset is within expectable deviation limits. It is also assumed that the influence of deviating effects decreases with increasing size of the machining grooves. The usage of analytical models allows to show characteristic dependencies regarding the resulting roughness in an efficient way. To analyze the effect of the corner radius
rε and the angle of the minor cutting edge
ψ on the height of the milling marks, a variation of parameter values was computed based on Equation (7). The calculated theoretical surface roughness value
Rth for varying feeds per tooth
fz is presented in
Figure 11 for variation of the tool corner radius
rε, and the angle of the minor cutting edge.
Based on these predicted roughness values, an increase of the theoretical roughness depth over an increasing feed per tooth can be assumed, which corresponds to general experience [
29,
30]. Taking
Figure 2 into account, this relationship can be explained by the increase of the width of milling marks, which can also be observed in real processes [
31]. Taking the variations of corner radius and angle of the minor cutting edge into account, the influence of macrogeometric parameters on the theoretical roughness depth can be inferred. It can also be seen in
Figure 11, that the theoretical roughness depth should decrease for increased corner radius
rε and increase for increased angle
ψ when multiple cuts are intersected. Based on these observations, a larger corner radius and a lower angle of the minor cutting edge are, in theory, beneficial for producing a high surface quality. It should be noted that the effective radius of the tool engagement decreases with increasing corner radius, which can have a negative impact on the process, e. g. on the productivity of the process. Furthermore, a decreasing cutting speed, which depends on the effective radius of the tool, could affect the cutting forces and wear progression. These effects are not considered in the analytical model.
5.2. Evaluation of the Geometric Simulation Approach Considering the Tools Microgeometry in the Main Cut
To evaluate the prediction capabilities of the geometric simulation approach, three milling experiments (E1–E3) were conducted and the resulting surface topographies were measured. For the simulation experiment, equal process parameters values were used as well as the modelled cutting edge representation. As can be seen in
Figure 12 exemplary, simulated surface topographies show a good accordance to the experimental results. Minor deviations regarding plastic deformation can be seen throughout the surface. However, the determined deviations of the surface roughness values are within a range of a few micrometers, which indicates a good prediction capability.
For a sufficient consideration of the process sequence of face milling, the individual tool engagements, main, back and lateral cut were considered step by step. In addition, the influence of the cutting edge micro- and macrogeometry were examined, e.g., the geometric deviations from an ideal tool shape. The decisive portion of the material is removed during the main cut of the tool in feed direction. For a detailed analysis, only slot milling operations were considered. Since tool engagements cannot be manipulated arbitrarily during an experiment in a real machining process, the discussion on the main cut was based on simulation results only. The following discussions in
Section 5.3 and
Section 5.4 were carried out in direct comparison to experimental results.
In the cross-section of the path in the feed direction, the tool engagement resulted in a mark pattern, which is characterized by the tool shape and the tooth feed
fz. A profile line was extracted in the center of the machining path (Profile I, see
Figure 13), which has high similarity to the engagement shown in
Figure 2. Comparing the resulting maximum roughness depth of Profile I of
Rmax
,I = 0.93 µm to the analytical roughness depth
Rth = 0.84 µm, a deviation of approximately 9.7% implies a good agreement of the analytical model to the simulated surface. Due to the limited significance of a single profile line, this acts as a proof-of-concept for the analytical model. Strong variations in profile depth occur orthogonal to the feed direction. As seen in
Figure 13, a profile located in the center of the machining track (Profile I) is compared with a profile located at the edge of the track (Profile II). Profile II had a roughness value
Rmax,
II = 0.19 µm, which is significantly lower than for Profile I. The varying engagement conditions leads to significantly lower depths of the machining marks. Therefore, for a sufficient description of the surface roughness, the entire surface area must be considered. For this reason, the simulation results and surface parameter values listed were determined over the entire machined surface considering multiple overlapping cuts. In this context, it can also be stated, that the significance of a simulated topography for an entire surface is considerably higher than that of a single profile.
Since the cutting edges of milling tools exhibit a large number of different micro defects and are not ideally sharp-edged, such defects should also be taken into account when predicting surface typographies and roughness characteristics on microgeometric scale. Based on the approach using a detailed geometric model of the rough cutting edge described in
Section 4.1, simulation experiments were conducted. A roughness along the cutting edges of
Rs = 1.5 µm and an axial offset between both minor cutting edges of
Δl = 0.2 µm were applied. The resulting topography is presented in
Figure 13. As seen in extracted Profile III with a value of
Rmax
,III = 1.64 µm, the surface roughness is strongly subjected to the deviation of the tool. A comparison between an experimental and a simulated roughness characteristic considering the deviation of the tool shape in various scales is presented in
Figure 14.
5.3. Evaluation of the Geometric Simulation Approach Considering the Back Cut
The influence of the back cut during face milling is discussed in this section. If the tool completely overruns the workpiece with small or no static/dynamic deflection of the tool, the cutting edges will engage on the rear side of the tool in the already machined surface after the main cut. Based on the superposition of the feed and cutting movements, a trochoidal-like mark pattern resulted on the surface, which was described in
Section 4.3. The influence of the back cuts on the resulting surface pattern is illustrated in
Figure 14, with a comparison of idealized and modeled cutting edges in relation to experimental measurements.
As depicted, the mark pattern on the surface changes significantly due to the back cut in comparison to
Figure 13. This change in roughness is also shown by the measured roughness values. An
Rz,
ideal = 0.68 ± 0.25 µm was determined for the idealized cutting edge without back cut and value of
Rz,
modeled = 1.29 ± 0.33 µm for the detailed model of the rough cutting edge. Taking the back cut into account, the values
Rz,
ideal = 0.46 ± 0.23 µm and
Rz,
modeled = 0.99 ± 0.29 µm were obtained. The additional engagements of the tool result in a significant reduction of the average roughness depth, which is attributed to a reduction of the depth of the marks. A strong similarity between the simulated and the real milled topography can be observed. This was also confirmed by the determined surface parameter values. A value of
Rz,
measured = 0.83 ± 0.21 µm was measured, which suggests an overestimation of the roughness by the simulation of approximately 19.3 %, see
Section 5.4. This is also indicated by the values determined for the arithmetic mean roughness
Ra values (see
Figure 14).
A detailed analysis showed, that the surface quality within a machining path differs greatly depending on the measuring position along the width of cut. Furthermore, the microgeometry of the cutting edge has an influence on the resulting surface topography and allows for better predictions regarding surface roughness values. Since the modeling of the cutting edge is based on a statistical distribution of unevenness and does not reflect the real shape of the cutting edge, a certain deviation between simulated and measured results is to be expected.
5.4. Evaluation of the Geometric Simulation Approach Considering the Lateral Overlap of Tool Paths
During face milling processes, lateral overlaps occur, if subsequent tool paths are offset parallel to previous machining paths by less than the effective tool diameter
deff. Usually, these lateral overlapping cuts occur in three-axis line milling processes with small or no static/dynamic deflection of the tool. In the investigated line milling processes, this offset is described by the width of cut
ae, which can be set to about 40% of the actual tool diameter
d for roughing processes, as shown in
Figure 15. The offset of the tool path to previous engagements leads to additional lateral engagements of the tool, influencing the previously generated surface topography. Therefore, the final machining pattern is influenced by a multitude of tool engagements, as mentioned in
Section 4.3. As seen in
Figure 15, the machining pattern of both cutting edges were significantly different. An analysis of the micro end mill revealed no damage or break-outs on the cutting edge, but an axial offset of both cutting edges, which clearly exceeded the modeled cutting edge offset of
Δl = 0.2 µm.
The lateral overlapping engagements can have a significant effect on the resulting machining pattern. Areas with different characteristics can be detected on the surface, depending on the width of cut of ae = 0.4 mm. The selected width of cut resulted in areas with double (Section I) and triple (Section II) tool engagements. The width of the triple-machined areas depends on the ratio of the effective tool diameter deff and the width of the radial engagement ae. In the considered scenario, this resulted in a track width of 160 µm. While the influence of the overlapping engagements on the milling marks can be seen from the topography measurements, it can also be identified from the related roughness values. While in Section I of the experimentally machined surface a roughness of Rz,real.sec.I = 1.08 ± 0.09 µm was detected, in Section II only Rz,real.sec.II = 0.68 ± 0.07 µm was determined.
The analysis of the simulation results showed a comparable surface topography with minor deviations. The determined surface characteristics also showed a difference in surface quality between Section I and Section II. The arithmetic mean roughness value
Ra of the simulation estimated the real surface characteristics with good correlation and confirmed the previously explained observations in the individual sections for an overall consideration of the surface area. A closer inspection of the topographies showed, that they differed in certain aspects. On the real surface, only two different tool engagement situations can be distinguished clearly. A third situation can be identified in the upper edge of Section I, which is, however, less significant compared to the other tool engagements. It is assumed that the cutting edge microgeometry was only partially applied to the surface due to the elastoplastic deformation of the workpiece material. This reduced transfer of the microgeometry onto the surface applied in particular to very filigree tool engagements. In addition, plastic deformations of the material and especially ploughing effects in front of the cutting edge led to smearing of workpiece material and filling of milling marks. This can be seen on the real surfaces shown in
Figure 15. While the last engagements can be distinguished, previous engagements could only be estimated in some areas. Such effects could not be reproduced by the presented simulation approach, since this constitutes a redistribution and not an ideal removal of material. Despite the detected deviation of the topography, a sufficient concordance of the calculated characteristic values could be determined, which confirms the potential of the approach.
5.5. Evaluation of the Geometric Simulation Approach Considering the Feed Per Tooth
The influence of the back cut on the maximum roughness depth
Rmax and the relevance of the presented approaches analyzed regarding the feed per tooth
fz, as seen in
Figure 16. The maximum roughness depth values
Rmax for the analytical model and for the central profile line of simulated topographies are depicted. Regarding their overall trend, both approaches showed an increasing roughness over the increasing tooth feed, which corresponds to general view [
29,
30]. The roughness depth is underestimated by the analytical model with a constant offset, which can be explained by the neglect of the cutting edge microgeometry in the analytical model. The trend of
Rmax for the simulation results was inferred by linear regression analysis using a least squares approach.
A cyclic character can be observed for the roughness values calculated from simulation experiments. Maximum and a minimum of Rmax values is reached periodically after an interval of about Δfz = 1.4 µm. This could be explained by the influence of the back cut on the surface topography. Depending on the selected feed per tooth, the position of the back cut could coincide within another milling mark peak, leading to a significant reduction of the roughness depth due to the decreased height of the milling marks. The varying influence of the respective cutting edge can be explained by the varying axial positions. It was assumed, that the different cutting edges led to varying influences on the surface topography depending on the respective deviations of the macro- and microgeometry. Furthermore, this general observation led to the assumption that even a minor change in the feed per tooth can have a significant influence on the resulting surface quality due to the different engagements of the back cut. The sensitivity of the roughness value d the back-cut alignment is highly significant in relation to the general trend. This interrelation could be shown by the simulation, but not by the analytical model, since the back cut was not taken into account.
6. Discussion and Outlook
The design of machining processes with regard to the resulting surface quality is a challenging optimization goal, especially for precision parts and functional surfaces with high requirements, which is usually accomplished by means of experimental preliminary investigations. In this paper, an analytical model and a geometric simulation approach for predicting the surface roughness resulting from a face micromilling process were presented. It could be shown that the use of an analytical model allows making initial predictions about the influence of certain factors on the resulting roughness with little effort. These include the corner radius of the tool
rε, the angle of the secondary cutting edge
ψ, and the feed per tooth
fz. The results showed a good correlation in comparison to the surface characteristics of a slot milled surface, considering only the main cut of the tool. While a roughness of
Rmax = 1.09 µm was determined in a real milling test in the center of the track, the analytical model estimated this selected parameter set with
Rmax = 0.84 µm. In this context, however, it was shown that the surface roughness could also deviate significantly within a machining path and that a multitude of influencing factors also had a strong impact on the final surface topography, for instance elastic recovery [
32]. Here, the microgeometry of the cutting edge, e.g., its actual roughness along a cutting edge, and deviations of the macrogeometry, such as an axial offset of the cutting edges, are to be mentioned. The usage of a developed analytical model can be used for quick prediction of surface roughness values.
In addition, a geometric simulation system was extended and utilized to gradually demonstrate the influence of certain additional factors on the surface topography as well as roughness parameter values. This was done with both, idealized and modeled tool shapes, to take the previously mentioned macro- and microgeometry of a tool into account. It was shown that the consideration of the actual microgeometry of the cutting edges has a significant effect on the determined surface topography, even with a stochastic consideration of the roughness of the cutting edge. In this context, a high consistency with the experimentally determined surface parameter values could be determined with the detailed cutting edge model, although certain deviations were still noticeable in the surface patterns. Furthermore, multiple main, back, and lateral overlapping cuts were examined in detail. The resulting surface topography depends not only on the main cut, but also on a large number of intersecting cuts.
In future investigations, it will be necessary to identify, to what extent filigree engagements of microgeometry are transmitted on the workpiece surface, especially regarding elastoplastic behavior of workpiece material. This would entail investigations of different materials in order to evaluate the influence of technical material properties, such as more ductility or ploughing effects. Mechanisms of material redistribution during cutting could be considered for the modeling of burr formation. By using the presented geometrical approach, changes of the cutting edge due to wear mechanisms can be considered to predict surface roughness values. This could be used to analyze whether possible surface roughness values are within given topography specifications in the context of expected tool life cycles.


