Abstract
Machining of brittle materials is common in the manufacturing industry, but few modeling techniques are available to predict materials’ behavior in response to the cutting tool. The paper presents a fracture-based finite element model, named embedded cohesive zone–finite element method (ECZ–FEM). In ECZ–FEM, a network of cohesive zone (CZ) elements are embedded in the material body with regular elements to capture multiple randomized cracks during a cutting process. The CZ element is defined by the fracture energy and a scaling factor to control material ductility and chip behavior. The model is validated by an experimental study in terms of chip formation and cutting force with two different brittle materials and depths of cut. The results show that ECZ–FEM can capture various chip forms, such as dusty debris, irregular chips, and unstable crack propagation seen in the experimental cases. For the cutting force, the model can predict the relative difference among the experimental cases, but the force value is higher by 30–50%. The ECZ–FEM has demonstrated the feasibility of brittle cutting simulation with some limitations applied.
1. Introduction
Machining of brittle materials such as ceramics, rocks, composites, and bones is common in aerospace/automotive industries and the medical field [1]. Although efforts [2,3,4,5,6] have been made to model machining of fiber-reinforced composite materials for predicting brittle failure, there is not a generalized method that can successfully and efficiently emulate the physics behind brittle cutting—the rapid and randomized crack initiation and propagation upon tool-workpiece contact. Unlike ductile material cutting, which is dominated by shear deformation across the shear plane, brittle material cutting is driven by fractures. Finite element method (FEM) has been widely used to simulate ductile material machining (e.g., metals) using the Johnson–Cook plasticity model for cutting forces and chip formation [7,8,9]. However, FEM has not yet been successfully applied to brittle materials because of the difficulty of capturing numerous and unpredictable cracks at the same time. Technically, FEM needs an extremely fine mesh to simulate stress concentration and consequent element failure at each time increment, which is not practical due to a high computational cost.
Researchers have tried to apply mesh-free methods such as smooth particle hydrodynamics (SPH) to cutting simulation because they do not require a gridded domain and can handle large deformation [10]. However, there are discrepancies among the published works, especially on damage definition. Takabi et al. [11] investigated SPH in orthogonal cutting and showed the uncertainty of damage due to particles losing connection to each other (i.e., the natural separation), which can drastically change the outcome. Also, particle separation is not determined by the fracture toughness but the material strength. Therefore, mesh-free methods are not considered an ideal approach for brittle materials cutting.
To deal with fracture problems, the cohesive element has been developed for FEM, which forms the cohesive zone (CZ) in the model. The cohesive zone concept links the microstructural failure mechanism to the continuum fields [12]. A CZ element can begin to separate based on the strain energy release rate, which is often defined by a traction–displacement relationship. The cohesive zone–finite element method (CZ–FEM) has been a useful tool for investigation of interfacial fracture problems, such as crack tip propagation, the adhesive strength between two materials, and modeling of composite delamination. CZ–FEM has been used to solve machining problems of composites and ceramics, though not many. Rao et al. [2] simulated the orthogonal cutting of unidirectional carbon fiber-reinforced polymer and glass fiber-reinforced polymer composites using CZ between the fibers and matrix. They used a 2D plane strain model and zero-thickness cohesive elements to enable fiber detachment when the interfacial energy exceeds the threshold defined by an exponential traction–displacement relationship. Umer et al. [3] used CZ–FEM to simulate metal matrix composite machining. They modeled the orthogonal machining of SiC particle-reinforced aluminum-based metal matrix composites by placing CZ elements between the particles and the matrix. A bilinear traction–displacement profile was used for CZ elements with zero thickness. Dong and Shin [13] developed a multi-scale model for simulating the machining of alumina ceramics in laser-assisted machining. Zero-thickness CZ was assigned around the ceramic grain boundaries, and the traction–displacement profile was determined based on a separate molecular dynamics (MD) simulation. Note that CZ is often modeled as zero thickness because it is an imaginary interface inside the material in these cases, unlike physical adhesives.
In the above-mentioned CZ–FEM works, the CZ elements are placed either at known interfaces or paths as a pre-determined condition where cracks will initiate and propagate [14]. Therefore, CZ–FEM does not seem possible for a homogenous, flaw-free brittle material in which potential cracking path cannot be defined. To address this issue, the current study proposes using a CZ mesh together with a regular element mesh to enable a network of potential cracks. A zero-thickness CZ element is embedded between regular elements. In other words, this CZ mesh will force the material to fail between elements instead of within an element. This modified CZ–FEM is named embedded cohesive zone–finite element method (ECZ–FEM). The ECZ–FEM for brittle machining is developed and validated in this paper using the commercial FEM software ABAQUS.
2. Finite Element Model Setup
This section presents the overall configuration of ECZ–FEM, step-by-step procedures to construct the model, and the required modification for material properties. The model introduced here is built based on the corresponding orthogonal cutting experiment.
2.1. Model Configuration
A two-dimensional orthogonal, plane strain cutting model is configured in ABAQUS (version 6.14-2), as illustrated in Figure 1. There are two main sections in this model. The top section (named the chip layer) is the ECZ domain where CZ elements are embedded all around the main elements. The bottom section is the regular finite element domain without CZ elements. This configuration saves computational time compared to a fully embedded CZ model since the bottom layer is not directly involved in the tool–workpiece interaction. Instead, the bottom layer provides compliance to the material during cutting. To ensure the stress continuity, the nodes on both sides of the interface must be merged or tied with all degrees of freedom. For this reason, the mesh sizes on both sections must match to have a perfect node-to-node alignment.
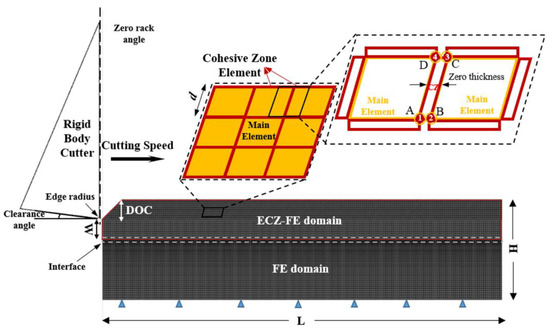
Figure 1.
Schematic of embedded cohesive zone–finite element method (ECZ–FEM) model configuration, boundary conditions, and element arrangements.
Table 1 shows the actual model dimensions used for two depths of cut (DOC), 0.1 mm and 0.3 mm. The boundary of the bottom layer is fixed in both translational directions (X and Y). The element size, d, is set at 0.01 mm. The bottom layer is meshed structurally with brick elements, while for the top layer, the elements are tilted by 45°. The inclined elements are necessary because the maximum shear stress to fracture the material is expected to be around 45° based on the Merchant’s Circle [15]. This configuration can avoid numerical instability when no CZ mesh aligns with the preferred fracture direction. The main elements are the four-node plane strain elements CPE4R, and the CZ elements are the four-node two-dimensional cohesive elements COH2D4. To embed zero-thickness CZ elements, all elements and nodes of the chip layer need to be assigned through the input file directly because each CZ element shares nodes with adjacent two main elements, as shown in Figure 1. The CZ element is defined by nodes ABCD, in which A and D belong to the element on the left side (identical to Nodes 1 and 4), while B and C belong to the right side (identical to Nodes 2 and 3). Since these two pairs of nodes are overlaid geometrically, they cannot be identified from the graphic user interface. The meshing process is automatized by a separate MATLAB code.

Table 1.
The model dimensions and depths of cut (DOC) used.
A complete mesh is imported to ABAQUS/EXPLICIT to set up other boundary conditions. The plane strain thickness of 3 mm is also applied to the model to be consistent with the thickness of the actual sample. The cutting tool is modeled as a rigid body with a constant speed at 10 m/min to match with the experiment. The tool has a rake angle of zero, a clearance angle of 7°, and an edge radius of 11 µm.
2.2. Damage Criteria
To apply the ECZ–FEM to a brittle cutting process, the material properties of the main and CZ elements and their damage criteria are defined separately despite being within the same entity. Assuming an isotropic, brittle material, the main element is defined by the modulus of elasticity (E), Poisson’s ratio (µ), the ultimate strength (σu), and damage criteria of the material. Although the model is meant to impart fracture-based failure on the CZ mesh, the main element should still allow failing to avoid excessive element distortion when no fracture occurs. For this reason, the damage to the main elements is defined by an initiation at the ultimate strength followed by a progressive damage evolution by the Hillerborg’s fracture energy theory. The total energy required to completely degrade the element after the damage initiation is Gf, which can be calculated from the material’s fracture toughness Kc by Equation (1):
The degradation is in a linear manner [16], such that
where is the equivalent element displacement after the damage initiation; represents the equivalent displacement at failure. The displacement at failure is calculated by
where σu represents the ultimate stress. These are standard steps to simulate material failure for metal cutting [16]. It should be emphasized that this damage definition for the main element is to ensure the model stability by avoiding excessive element distortion.
The properties associated with the CZ elements embedded in the chip layer are defined differently. The cohesive zone is a mathematical approach in which the work is done to overcome the energy needed to open a crack. This work can be described by a traction–displacement relationship, t-δ, as seen in Figure 2. Damage initiation is related to the interfacial strength (i.e., the maximum traction tc) on the traction–displacement relation, and the area under the relation represents the fracture energy, Gf, as defined in Equation (1).
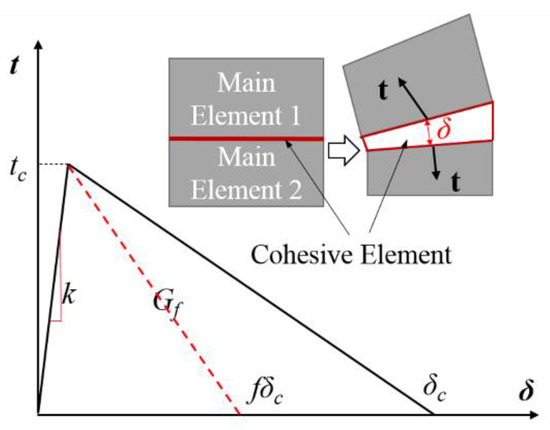
Figure 2.
Bilinear traction–displacement (t-δ) model for the cohesive element.
In this study, a bilinear traction–separation law is adopted along with the mixed-mode progressive damage. The maximum traction tc should be equal or less than the strength of the material to be able to fail, while a lower strength can improve the convergence rate of the solution. In general, the variations of the maximum strength do not have a strong influence on the results [12]. Hence, the 80% ultimate stress is selected here. The initial stiffness k should be large enough to ensure the continuum between the two adjacent bulk elements, but small enough to avoid numerical issues such as spurious oscillations of the tractions in an element. Studies suggest that the initial stiffness of CZ elements can be calculated from Equation (4), which balances accuracy and simulation stability [12,17,18].
where E is the bulk elasticity, d is the maximum element size, and α is taken as 1.
The maximum deflection of a CZ element δc is determined by given Gf and tc, as shown in Figure 2. Therefore, the deflection can become relatively large compared to the element size when a fine mesh is used. A large deflection is infeasible since it increases the material ductility when a CZ mesh is embedded in the material, as shown in Figure 3. When the material is subject to stresses to deform, the original element size (d) will increase to (d’ + δ), which adds additional elongation δ to the material. Because of this limitation, a scaling factor (denoted as f) is introduced here to limit the maximum deflection of CZ elements, as shown by fδc in Figure 2, and thus to control the chip behavior. Chip behavior is a critical indicator as the cutting force can be affected by the number of cracks during cutting (i.e., work done vs. total fracture energy).
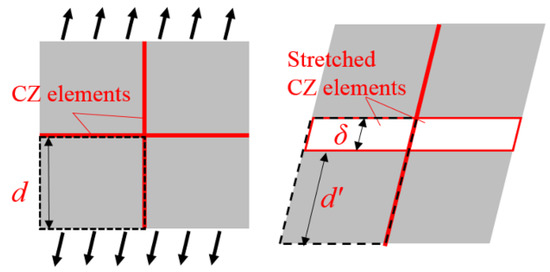
Figure 3.
A schematic drawing to show unrealistic deformation due to the deflection of cohesive zone (CZ) elements.
When the deflection is scaled to control chip behavior, the fracture energy and, therefore, the cutting force will be scaled accordingly. Thus, the cutting force must be inversely scaled to represent the actual force. To properly apply this model with the scaling factor, the following assumptions are made. First, beyond the elastic deformation, no plastic deformation occurs in the material and all the force contributes to material removal. Second, the specific cutting energy (energy required to remove a unit volume of material) is based solely on the fracture energy. Given constant cutting velocity vf and material removal rate (MRR), the cutting force (Fc) will be linearly proportional to the specific cutting energy (p), as described in Equation (5),
This implies that the cutting force is scaled linearly with the CZ element’s fracture energy. This concept will be validated in the experimental study.
2.3. Other Material Properties
The brittle materials used for the experiment are two types of solid bone-mimetic materials made of high-density polyurethane (PU) foam (Sawbones, Vashon, WA, USA). This material provides consistent and uniform material properties; it is isotropic and does not require a large force to cut. It is ideal for the modeling purpose and experimental validation without extraneous variables such as vibration, impact shock, and heat. These two foams are named based on their densities, 30 and 40 pcf (pound per cubic foot), which equates to 480 kg/m3 and 640 kg/m3, respectively. The 30 pcf has the ultimate strength of 12 MPa and the elasticity modulus of 592 MPa; the 40 pcf has the strength of 19 MPa, and the modulus of 1000 MPa, respectively, based on the manufacturer provided data [19]. The fracture toughness, Kc, of these foams is obtained from a separate three-point bending experiment following ASTM D5045–93. The averaged Kc for the 30 pcf is 0.46 MPa.m1/2 and that of 40 pcf is 1.13 MPa.m1/2. The 40 pcf is stiffer and also tougher than the 30 pcf. Based on these properties, the original CZ element properties are calculated in Table 2 below. As seen, the allowed cohesive element deformations are both larger than the element itself (0.01 mm).

Table 2.
The CZ element properties for the testing materials 30 pound per cubic foot (pcf) and 40 pcf.
2.4. Scaling Factor
The scaling factor is necessary to control the maximum deflection of CZ elements and thus the material ductility. In the case of 30 pcf, the original CZ deflection goes up to 0.064 mm. With the adjacent element size being 0.01 mm, this allowable deflection is equivalent to a 600% additional elongation (0.064/0.01), which is unrealistic. Figure 4 shows four different scenarios when using the original Gf and scaled Gf that limits the deflection to be 0.00512 mm (51.2% elongation), 0.00128 mm (12.8% elongation), and 0.00032 mm (3.2% elongation), respectively. As seen in Figure 4a with the original Gf, the workpiece and elements experience excessive deformation. Many stretched CZ elements remain alive though the chip has been distorted significantly. Figure 4b shows small but consistent chips generated from the shear plane, which is similar to cutting of brittle metals like high carbon steels. Figure 4c begins to generate fragmented, irregular debris accompanied by dusty pieces, which can be similar to ceramic materials. Figure 4d shows a more extreme case, where the workpiece shatters upon the tool contact. From these simple examples, it can be seen that a fairly small scaling factor is needed in order to force the material to behave as brittle. Note that in the simulation no self-contact is employed because the elements are supposed to support each other via CZ elements. Self-contact is possible but will exponentially increase the computational load due to the larger number of surfaces involved in the contact algorithm.
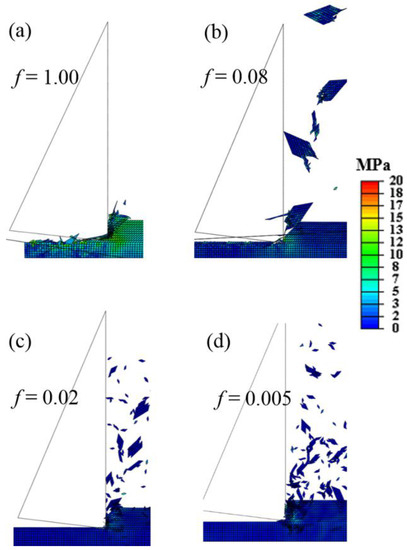
Figure 4.
Material responses to the cutting tool with different scaling factors: (a) f = 1, (b) f = 0.08, (c) f = 0.02, and (d) f = 0.005. The stress is based on the testing material 30 pcf.
2.5. Sensitivity Study
Simulation output depends on the mesh configuration, such as the element size and the tilt angle. The element size of 0.01 mm was selected to compromise between the computational load and convergence. A smaller mesh size of 0.005 mm was compared to the 0.01 mm mesh using the 30 pcf case and showed a similar force magnitude and chip formation, but the computation could hardly proceed after a few steps due to a large number of elements and surfaces.
For the tilt angle, although 45° is the theoretically preferred cracking path, different angles were also tested at 0° (square mesh), 30°, and 60° to study the mesh sensitivity using the 30 pcf case with a scaling factor of 0.02. In the case of square mesh, the chip layer was sheared off without any cutting phenomenon due to the lack of fracture path around the theoretical shear angle. Results of the other cases are shown in Figure 5. Compared to the 45° mesh, the chip size is larger at 30° and smaller at 60°. Consequently, the cutting force is a little smaller (about 2%) at the 30° mesh and larger (about 20%) at the 60° mesh because the work done of cutting force is proportional to the number of fractured surfaces. Therefore, although the 45° mesh is recommended based on the shear angle, other mesh angles may also work but would produce different results. In any case, the scaling factor needs to be adjusted to match the chip behavior to the experiment for the best outcome.
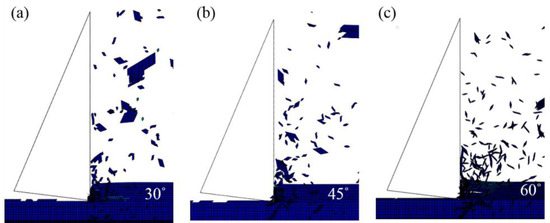
Figure 5.
Material responses to the cutting tool with different tile angles: (a) 30 degrees, (b) 45 degrees, and (c) 60 degrees.
3. Experiment Setup for Model Validation
Orthogonal cutting is the basic cutting configuration for all machining processes. The essential geometrical parameters include rake angle, clearance angle and the depth of cut. In this experiment, the solid foams, the 30 and 40 pcf, are sectioned to a 20 × 30 × 3 mm testing sample. Each sample is hand-polished with the same grit size to ensure a smooth surface and uniform depth of cut. Figure 6 illustrates the experimental setup for the orthogonal cutting setup which consists of two linear actuators and a dynamometer for force measurement. The cutting tool is attached to the vertical linear actuator through a customized tool holder. The linear actuator (L70, Moog Animatics, Milpitas, CA, USA) is driven by a high-torque servo-motor to maintain a constant feed rate during cutting. The force dynamometer (Model 9272, Kistler, Winterthur, Switzerland) is used to capture high-speed or high-frequency force data up to 5 kHz. Data collection is performed via an amplifier, a shielded connector block, and a data acquisition device (PCle-6321, National Instruments, Austin, TX, USA), along with a data recorder, LabVIEW, at 2 kHz sampling rate. The workpiece is fixed by a clamping system on the top of the dynamometer which is placed on the other linear slider to control the depth of cut for each test.
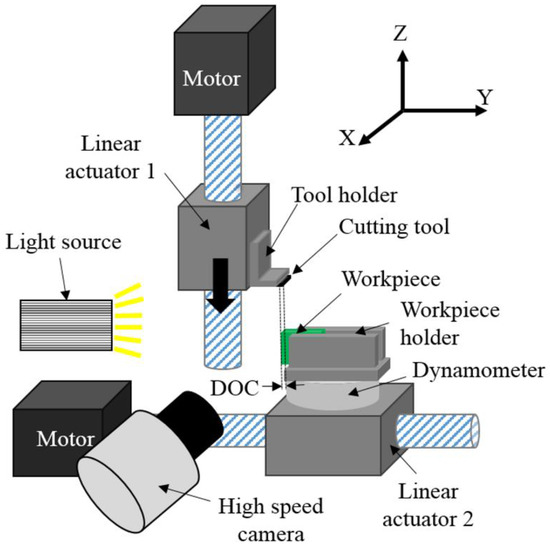
Figure 6.
Schematic of the orthogonal cutting setup for model validation.
The cutting tool has a tungsten carbide substrate and a polycrystalline diamond (PCD) insert as a cutting edge, provided by Sandvik (Model TCMW16T304FLP-CD10). This PCD insert is extremely hard and minimizes any possible deformation or wear at the cutting edge. This cutting tool has a zero-rake angle and a clearance angle of 7°. The cutting edge radius is 11 µm, measured by a high-definition surface profiler (Alicona InfiniteFocus G4, Graz, Austria).
In this experiment, two depths of cut, 0.1 mm and 0.3 mm, are used to present common chip loads for a machining process. The cutting tool is moved at a constant velocity of 10 m/min to represent a machining condition. These parameters are applied to two specimens and repeated for four times each.
4. Simulation and Experiment Results
The simulation results are compared to the experiments in different depths of cut and material properties (30 pcf and 40 pcf) in this section.
4.1. Chip Formation
To find an appropriate scaling factor, a qualitative comparison of chip formation behavior against the experiment is conducted. In brittle materials, the chip can be generated in various forms, including dusty debris, fragmented and irregular pieces, or equal-sized small chips. Different scaling factors are tested until a similar chip behavior to the experiment is achieved or no obvious behavior difference can be observed. For this purpose, the initial guess for the scaling factor is recommended to be half of the element size (i.e., δc/d = 0.5) to ensure the material brittleness. Then, a binary search method is used. If the current f does not show a good match, half of the value (f/2) will be investigated until the best fit is found or further improvement is not distinguishable.
Following the aforementioned procedure, the model calibration is performed for 30 pcf and DOC = 0.1 mm. Figure 7a shows the corresponding simulation results with a selected f = 0.02, which has a similar chip formation to that of the experiment. The simulation can capture the irregular chips of different sizes generated from the cutting zone. Then this scaling factor is also used to simulate the case of 0.3 mm DOC. The result is shown in Figure 7b. A larger DOC tends to generate bigger chips surrounded by small debris as compared to the case of 0.1 mm DOC. Consistently, the experiment also sees much bigger or clustered pieces when DOC increases to 0.3 mm. The results of 30 pcf with the selected scaling factor show qualitative agreement between the model and experiment in terms of chip behavior. Chip sizes of simulation and experiment do not match exactly due to the limited observation window and material uncertainty, but the difference is in the order of sub-mm.
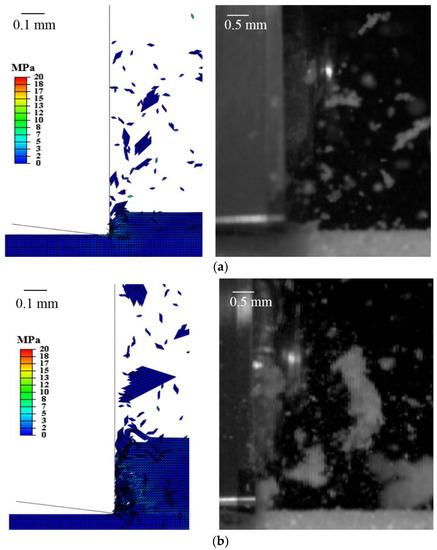
Figure 7.
Simulated and experimentally measured chip formation of the 30 pcf with (a) depth of cut (DOC) = 0.1 mm and (b) DOC = 0.3 mm.
For the 40 pcf, the same scaling factor of 0.02 is used, which corresponds to a maximum of 0.00294 mm deformation (29.4% elongation). This value also makes the workpiece more ductile than the 30 pcf (12.8% elongation). The simulation result of 40 pcf at 0.1 mm DOC and corresponding experimental observations are shown in Figure 8a. Different from 30 pcf at 0.1 mm DOC, bigger and similarly-sized chips are generated with dusty debris around. This phenomenon also indicates a more ductile behavior as tested in Figure 4.
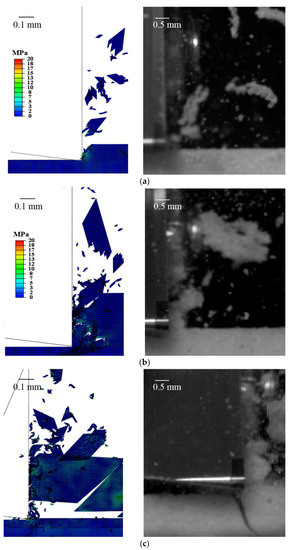
Figure 8.
Simulated and experimentally measured chip formation of the 40 pcf with (a) DOC = 0.1 mm, (b) DOC = 0.3 mm, and (c) DOC = 0.3 mm at a later time step with a sudden crack propagation.
When the same scaling factor is applied to the case of 0.3 mm DOC, the simulation of the cutting process starts to show unstable chip formation, as shown in Figure 8b,c at different time steps. Cracks can propagate ahead of the cutting tool motion to generate large chips and sudden fracture along the cutting direction to shear the chip layer. This phenomenon is also seen in the experiment, though the unstable cracks into the workpiece could not really be captured due to the material uncertainty and the randomness of cracks.
4.2. Cutting Force
Figure 9a shows the cutting forces measured from four repeated tests for 30 pcf at DOC = 0.1 mm. Force profiles are oscillating due to the brittle nature of the material. The system noise is assumed minimal considering the system rigidity. During a roughly 0.14 s cutting period, the cutting forces can reach and stay at a certain level, namely the steady cutting, and then drop toward the end. That said, the simulation length of about 0.01 s is enough to reach the steady cutting to extract the force. According to the scaling factor f = 0.02 used in these simulations, the simulated force is scaled by 50 times (1/f) and overlaid on Test 4, shown by the comparison in Figure 9b. Since the simulation ran at every 0.00006 s increment, the sampling frequency is equivalent to 16.7 kHz as opposed to 2 kHz of the experiment. The averaged force of simulation is 12.5 N, and the experimental average across the steady cutting is about 9 N. Although the forces are at a similar magnitude, the simulated force is oscillating much more significantly (0 to 35 N). These discrepancies may be attributed to the fact that embedded CZ elements have a different property from the main elements and less deformability. Such an oscillating profile is seen in all simulation cases of 30 and 40 pcf at 0.1 and 0.3 mm DOCs.
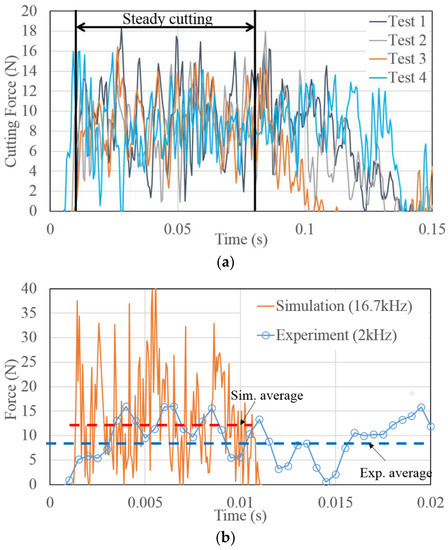
Figure 9.
(a) Experimentally measured cutting forces of 30 pcf at DOC = 0.01 mm and (b) the comparison between the experiment and the simulated, scaled cutting force.
Figure 10 compares all simulated cases with the corresponding experiments in terms of the average force of cutting, where the error bars stand for one standard deviation from the four replicated tests. The overall trend of model prediction agrees with the experiments in different materials and depths of cut. However, the simulated forces are always higher by 30% to 50%, likely due to an over-estimated fracture energy or non-linearity of the cutting force to the cutting energy. The causes of oscillating and overestimated force will be elaborated more in the discussion section. Nonetheless, based on the results, the concept of ECZ–FEM is considered viable to approximate the magnitude of cutting force and to predict the changes of cutting force and chip behavior in different brittle cutting scenarios.
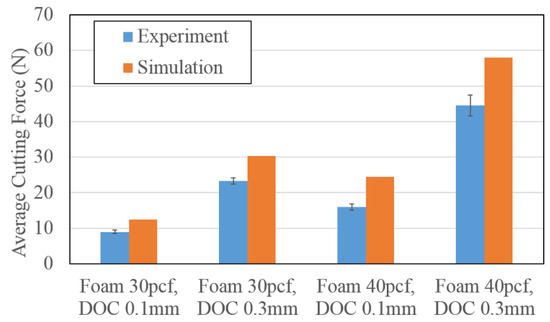
Figure 10.
Comparisons between all simulated cutting forces and experimentally measured cutting forces (averaged).
5. Discussion
In ECZ–FEM, the key to a successful simulation is choosing an appropriate scaling factor by calibrating the model behavior with an experiment. As mentioned, CZ elements are determined by a traction–displacement relationship. When CZ elements are embedded in the workpiece, their allowable deflection can change the material ductility, and thus it must be limited. Figure 3 has shown how different scaling factors can change the chip formation from very ductile to brittle. Although limiting CZ deflection inevitably changes the material property (Gf), the effect on cutting force can be assumed linearly scaled under the assumption of 100% cutting energy conversion. This is reasonable because most of the brittle materials do not plastically deform and do not produce significant friction and frictional heat due to discontinuous chip formation.
The model predicts the relative behavior well among different materials and depths of cut, but the calculated cutting forces are always higher. One explanation is that it is due to the oscillating force profile, but it can also be caused by an overestimated fracture energy. The over-estimation can be from the difference between the static and dynamic fracture toughness, Kc. The fracture energy Gf is determined by the material toughness Kc, which is measured from a quasi-static test. Thus, the obtained Kc is the static fracture toughness while the actual dynamic toughness may be much lower, as reported in the literature [20,21]. However, it is technically challenging to measure a dynamic toughness at a comparable speed of cutting (10 m/min or 167 mm/s).
Another issue is the significant oscillating force profile as shown in Figure 9. This is because the model consists of embedded CZ elements which have different material properties and fewer degrees of freedom than those of the main elements. Therefore, the force can change drastically when the cutter makes a pass and the workpiece experiences deformation and damage. Another reason could be a non-self-contact definition of the main elements. This may result in intermittent contact between the tool and material and thus significant force changes. A much finer mesh with full contact definition can mitigate the problem at the cost of computational time.
6. Conclusions
This paper presents a fracture-based model for brittle material cutting using cohesive zone concept, namely ECZ–FEM. In this model, cohesive zone elements are embedded in the material body to allow free development of cracks to emulate the undetermined fracture during a cutting process. The research results have shown a certain degree of agreement with the experiment in terms of chip formation and cutting forces while also revealed some limitations. First, controlling the maximum deflection of the cohesive zone element through a scaling factor is a critical step in this method, and for that, an experimental calibration is necessary. This factor is currently determined on a qualitative basis in terms of chip size and crack propagation, because it is a behavior indicator instead of a property. Also, the current model is limited to brittle materials in order to scale the force linearly with the fracture energy. The model should also not be used for flexible material because the CZ mesh does not have enough degrees of freedom to handle deformation. For future work, modifications in CZ element or a new type of CZ element that can address these issues can further improve the model.
Author Contributions
B.T. developed the proposed model, conducted and analyzed the experiment, and wrote the manuscript. B.L.T. conceived the model concept, provided general guidance to this research, wrote and edited the final manuscript.
Funding
This research was partially funded by the Office of Energy Efficiency and Renewable Energy, U.S. Department of Energy, grant number DE-EE0008605.
Acknowledgments
The authors acknowledge the support from Texas A&M University and Texas A&M Engineering Experiment Station (TEES).
Conflicts of Interest
The authors declare no conflict of interest.
References
- Liu, D.F.; Cong, W.L.; Pei, Z.J.; Tang, Y.J. A cutting force model for rotary ultrasonic machining of brittle materials. Int. J. Mach. Tools Manuf. 2012, 52, 77–84. [Google Scholar] [CrossRef]
- Rao, G.V.G.; Mahajan, P.; Bhatnagar, N. Micro-mechanical modeling of machining of FRP composites–Cutting force analysis. Compos. Sci. Technol. 2007, 67, 579–593. [Google Scholar] [CrossRef]
- Umer, U.; Ashfaq, M.; Qudeiri, J.; Hussein, H.; Danish, S.; Al-Ahmari, A. Modeling machining of particle-reinforced aluminum-based metal matrix composites using cohesive zone elements. Int. J. Adv. Manuf. Technol. 2015, 78, 1171–1179. [Google Scholar] [CrossRef]
- Santiuste, C.; Soldani, X.; Miguélez, M.H. Machining FEM model of long fiber composites for aeronautical components. Compos. Struct. 2010, 92, 691–698. [Google Scholar] [CrossRef]
- Usui, S.; Wadell, J.; Marusich, T. Finite element modeling of carbon fiber composite orthogonal cutting and drilling. Procedia CIRP 2014, 14, 211–216. [Google Scholar] [CrossRef]
- Yan, X.; Reiner, J.; Bacca, M.; Altintas, Y.; Vaziri, R. A study of energy dissipating mechanisms in orthogonal cutting of UD-CFRP composites. Compos. Struct. 2019, 220, 460–472. [Google Scholar] [CrossRef]
- Umbrello, D.; M’saoubi, R.; Outeiro, J. The influence of Johnson–Cook material constants on finite element simulation of machining of AISI 316L steel. Int. J. Mach. Tools Manuf. 2007, 47, 462–470. [Google Scholar] [CrossRef]
- Shrot, A.; Bäker, M. Determination of Johnson–Cook parameters from machining simulations. Comput. Mater. Sci. 2012, 52, 298–304. [Google Scholar] [CrossRef]
- Shi, J.; Liu, C.R. The influence of material models on finite element simulation of machining. J. Manuf. Sci. Eng. 2004, 126, 849–857. [Google Scholar] [CrossRef]
- Takabi, B.; Tai, B.L. A review of cutting mechanics and modeling techniques for biological materials. Med. Eng. Phys. 2017, 45, 1–14. [Google Scholar] [CrossRef] [PubMed]
- Takabi, B.; Tajdari, M.; Tai, B.L. Numerical study of smoothed particle hydrodynamics method in orthogonal cutting simulations–Effects of damage criteria and particle density. J. Manuf. Processes 2017, 30, 523–531. [Google Scholar] [CrossRef]
- Turon, A.; Davila, C.G.; Camanho, P.P.; Costa, J. An engineering solution for mesh size effects in the simulation of delamination using cohesive zone models. Eng. Fract. Mech. 2007, 74, 1665–1682. [Google Scholar] [CrossRef]
- Dong, X.; Shin, Y.C. Multi-scale genome modeling for predicting fracture strength of silicon carbide ceramics. Comput. Mater. Sci. 2018, 141, 10–18. [Google Scholar] [CrossRef]
- Paulino, G.; Zhang, Z. Cohesive modeling of propagating cracks in homogeneous and functionally graded composites. In Proceedings of the 5th GRACM International Congress on Computational Mechanics, Limassol, Cyprus, 29 June–1 July 2005. [Google Scholar]
- Liang, S.Y.; Shih, A.J. Analysis of Machining and Machine Tools; Springer: Boston, MA, USA, 2016. [Google Scholar]
- Liu, J.; Bai, Y.; Xu, C. Evaluation of ductile fracture models in finite element simulation of metal cutting processes. J. Manuf. Sci. Eng. 2014, 136, 011010. [Google Scholar] [CrossRef]
- Espinosa, H.D.; Zavattieri, P.D. A grain level model for the study of failure initiation and evolution in polycrystalline brittle materials. Part II: Numerical examples. Mech. Mater. 2003, 35, 365–394. [Google Scholar] [CrossRef]
- Feng, J.; Chen, P.; Ni, J. Prediction of surface generation in microgrinding of ceramic materials by coupled trajectory and finite element analysis. Finite Elem. Anal. Des. 2012, 57, 67–80. [Google Scholar] [CrossRef]
- Sawbones Inc., General Catalog. Available online: https://www.sawbones.com/wp/wp-content/uploads/2017/07/Gen-393 Catalog-ReVamp-V1.pdf (accessed on 13 March 2019).
- Kobayashi, A.; Mall, S. Dynamic fracture toughness of Homalite-100. Exp. Mech. 1978, 18, 11–18. [Google Scholar] [CrossRef]
- Kobayashi, T.; Yamamoto, I.; Niinomi, M. Introduction of a new dynamic fracture toughness evaluation system. J. Test. Eval. 1993, 21, 145–153. [Google Scholar]
© 2019 by the authors. Licensee MDPI, Basel, Switzerland. This article is an open access article distributed under the terms and conditions of the Creative Commons Attribution (CC BY) license (http://creativecommons.org/licenses/by/4.0/).