Article

Intra- and Inter-Repeatability of Profile Deviations of an AlSi10Mg Tooling Component Manufactured by Laser Powder Bed Fusion

Department of Mechanical Engineering, École de Technologie Supérieure (ÉTS), Montreal, QC H3C 1K3, Canada
*
Author to whom correspondence should be addressed.
J. Manuf. Mater. Process. 2018, 2(3), 56; https://doi.org/10.3390/jmmp2030056
Submission received: 13 July 2018 / Revised: 6 August 2018 / Accepted: 15 August 2018 / Published: 21 August 2018
(This article belongs to the Special Issue Selective Laser Melting: Materials and Applications)

Abstract

:
Laser powder bed fusion (LPBF) is one of the most potent additive manufacturing (AM) processes. Metallic LPBF is gaining popularity, but one of the obstacles facing its larger industrial use is the limited knowledge of its dimensional and geometrical performances. This paper presents a metrological investigation of the geometrical and dimensional deviations of a selected LPBF-manufactured component, according to the ASME Y14.5-2009 standard. This approach allows for an estimation of both the process capability, as per ISO 22514-4 standard, and the correlations between the part location in the manufacturing chamber and the profile deviations. Forty-nine parts, which are representative of a typical aerospace tooling component (30 mm in diameter and 27.2 mm in height) were manufactured from AlSi10Mg powder using an EOSINT M280 printer and subjected to a stress relief annealing at 300 °C for two hours. This manufacturing procedure was repeated three times. A complete statistical analysis was carried out and the results of the investigation show that LPBF performances for all geometrical variations of 147 identical parts fall within a range of 230 µm at a 99.73% level.

1. Introduction

Additive manufacturing (AM) technologies produce 3D engineered parts from nominal CAD files in an additive manner, generally layer by layer. The term “additive” is used to highlight the fact that these technologies do not require conventional tooling to build components and that the shape is created by adding, rather than removing or deforming, material. The material can be polymer, metal, composite, ceramic, concrete, or even human cells. Many AM processes have been developed and are commercially available, including stereolithography (SL), fused deposition modeling (FDM), three-dimensional printing (3DP), powder bed fusion (PBF), direct metal deposition (DED), and sheet lamination (SL). The PBF technologies include two variants depending on the nature of the heat source: the electron beam powder bed fusion (EBPBF) and the laser powder bed fusion (LPBF). Their general principles are described on ISO/ASTM52901-16 [1]. The processes terminologies used are from ISO/ASTM 52900:2015 [2] standard terminology for AM.
Wohler’s report stated that 13,058 AM machines were sold in 2016 [3]. The use of these processes is expanding and can be explained by the benefits they provide: free complexity and easy customization, as well as the reduced setup time, delivery time, and tooling cost. LPBF is one of the most potent metallic AM technologies. However, the laser power, temperature field heterogeneity, and other phenomena inherent to the process generate residual stresses responsible for distortions of the produced parts [4]. Geometrical and dimensional deviations (GD and T) in LPBF parts are among the main concerns as far as it concerns facing wider industrial application of this technology. There is a need to study the process and improve part precision, which has been criticized by many researchers.
Wang et al. [5] studied the correlations between shrinkage, laser beam offset, and the weight of LPBF parts. After statistical analysis, sampling theory and three calculation methods, the conclusion was that the shrinkage remains nearly unchanged irrespective of the weight of AM parts. However, the beam offset increases with part weight. One of the first shrinkage calibrators for metallic AM was also proposed. Zhu et al. [6] studied the shrinkage of direct laser sintered metallic powder parts. Two types of shrinkage, thermal and sintering shrinkage, were isolated and quantified. Thermal shrinkage results from cyclic heating, while sintering shrinkage is caused by densification and is a type of elastic compressive shortening. The conclusion was that the higher the laser power and the smaller the scan speed and spacing, the higher the thermal shrinkage. Additionally, the total shrinkage in the Z plane is significantly higher than in the X-Y planes.
Raghunath and Pandey [7] identified the sources of deviation for each build axis using the Analysis of Variance (ANOVA) technique. Laser power and scan length were identified as the primary sources of deviations in the X-axis, laser power and beam speed in the Y-axis, and part bed temperature, hatch spacing and beam speed in the Z-axis. Islam and Shacks [8] investigated the influence of build parameters on the dimensional errors of 60 selective laser sintered polyamide parts. Senthilkumaran et al. [9] developed a model for shrinkage compensation in LPBF which operates in each layer. Galovskyi et al. [10] tested some work pieces for LPBF.
Detailed investigations of AM part geometrical deviations have been carried out in [11,12,13,14,15,16,17,18,19,20,21,22,23]. Fahad and Hopkinson [24] proposed a benchmark to evaluate and compare the accuracy and repeatability of the AM processes. This benchmark has three repetitions of features with standard geometries. With the intention of testing the LPBF process, Teeter et al. [25] conducted a metrological study about deviations appearing according to part location in the manufacturing chamber. After printing five pattern repetitions on a plate (the inspection was performed using an Olympus microscope with a resolution of ±0.5 µm), there was no difference between the pattern profile deviations. Ferrar et al. [26] investigated the gas flow effect on SLS repeatability and performance. In their study, variations in gas flows have been shown to affect both the value, the density and the compression strength range of the samples tested. Aidibe et al. [27] investigated the repeatability of the LPBF technology with five Ti-6Al-4V parts. The conclusion was that the LPBF process can provide acceptable metrological performances in terms of repeatability, overall deviations and geometric/dimensional errors, comparable to turning. Rebaioli and Fassi [28] identified some benchmark artefacts designed to evaluate the geometrical performance of the AM processes and their design guidelines. Sing et al. [29] investigated the effect of LPBF processing parameters on the dimensional accuracy and mechanical properties of cellular lattice structure using a statistical modeling. The conclusion was that the strut dimensions of LPBF fabricated lattice structures are most sensitive to laser power, as compared to layer thickness and scanning speed. Calignano [30] investigated the accuracy and surface roughness of parts manufactured by LPBF in the AlSi10Mg powder. The conclusion was that the STL file, build orientation, and process parameters affects the accuracy.
Globally, researchers have focused more on feasibility rather than on capability studies, the former revealing process limitations in printing some specific geometric features, while the latter provides an estimation of the probabilistic behavior of some metrological characteristics of the part produced by this process. Since the latter aspect represents a main goal of this study, this paper quantifies the LPBF process intra and inter repeatability, and capability with AlSi10Mg powders. The paper is organized as follows: Section 2 describes the experimental procedure. The results are presented in Section 3 and discussed in Section 4. Finally, a summary is provided and future works are presented in Section 5.

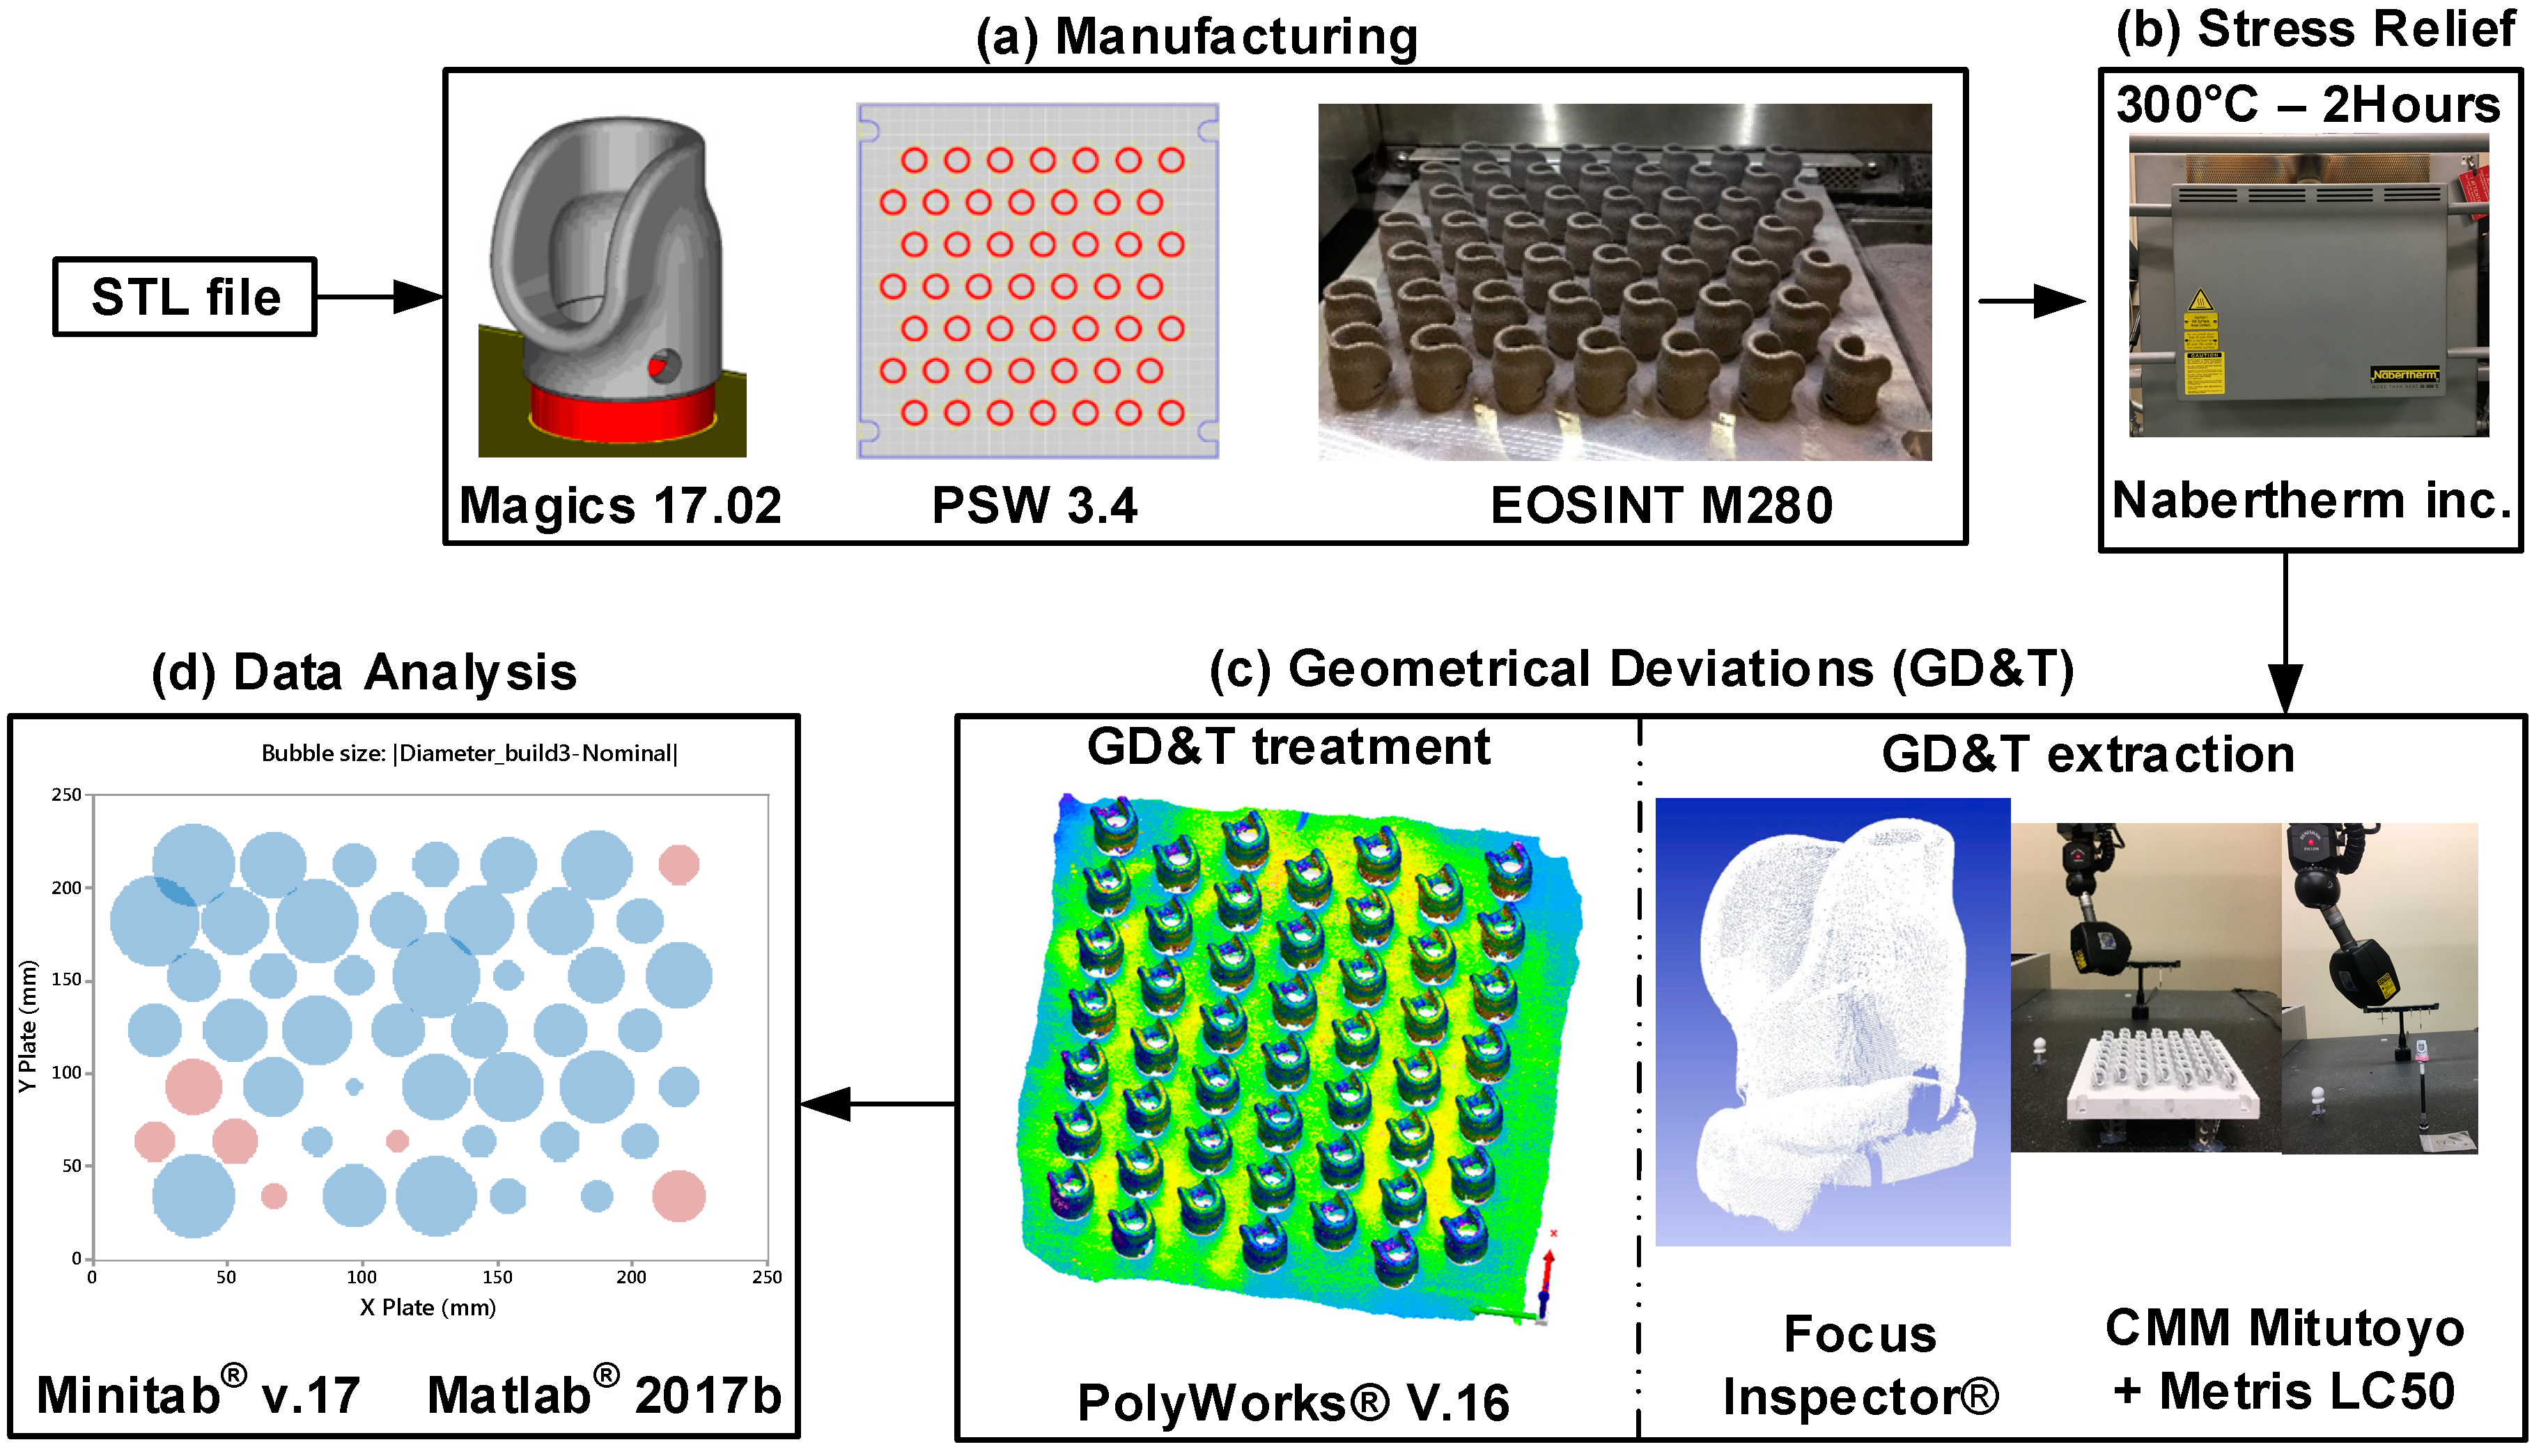
2. Experimental Protocol

The first goal of the experimental procedure is to identify and quantify the variations in the geometrical deviations of a selected part as a function of its location in the LPBF manufacturing chamber. Then, this experiment is intended to provide an answer to the hypothesis of a repeatable pattern of such deviations.
To this end, 49 identical AlSi10Mg parts equally distributed on a build plate (Figure 1) were printed three (3) times in the same LPBF system using the same process and post-process parameters, and analyzed by the same operator using the same equipment. The printed part is a typical aerospace tooling component, 30 mm in diameter and 27.2 mm in height. This part was chosen because it is an industrial tooling component used in jig construction, it is a kind of case study for industries interested in manufacturing by LPBF. Secondly, it is a topologically-optimized part. Finally, this part allows us to have an adequate sample size (49 parts/plate) for our study. Since we are concerned by GD and T variations as a function of part location in the fabrication chamber, an interesting element of this study is the number of repetitions which is 49 times three (49 × 3). This means that information from 49 different emplacements on the plate quantifies the variations occurring at the same place three times.
In most cases, to reduce the risk of distortions caused by thermal gradients, while firmly attaching the part to the build plate during printing, the part needs to be built with support structures. In this study, specialized software Magics v.17.02 (Materialise, Leuven, Belgium) was used to generate support structures. The assembly was then loaded in the process software (PSW.3.4), where it was duplicated 49 times. The process parameters set, called AlSi10Mg_Speed 1.0 and recommended by the manufacturer EOS (Krailling, Germany) for an AlSi10Mg alloy, was used, with 30 µm-thick layers (Figure 2a). After printing, the build plate was stress relieved at 300 °C for two hours with no visible effect on the outer surface of the parts (Figure 2b).
Next, the point cloud of printed parts was obtained by means of a Metris LC50 laser scan mounted on a Mitutoyo Coordinate Measuring Machine (CMM) (accuracy 7 µm at the 95% level), Figure 2c. Before each scan, the devices were calibrated using a master sphere and the data collection was performed on nine (9) angles to maximize the information collection on inner surfaces. A real-time visualization was possible with the Focus Inspector specialized software. A thin layer of talcum powder was used to reduce part surface reflection. In doing so, the potential point cloud density was increased to ensure the best measurement. The point clouds was then assembled (from the nine angles) and cleaned. The parts were scanned before and after being cut off the plate. The best-fit technique was then carried out using PolyWorks® v.16 (Innovmetric Metrological Software, Quebec, QC, Canada). The data were then loaded into a Matlab® 2017b (software of MathWorks, Natick, MA, USA), using a code to extract the deviation at each point. Minitab® v.17 (a statistical software of Minitab Inc., State College, PA, USA) was used for the graphics and statistical studies (Figure 2d).
Four types of analysis were performed based on ASME Y14.5 (2009): Intra-build variation study (Analysis 1), inter-build variation study (Analysis 2), and a capability study according to ISO 22514-4 (Analysis 3).

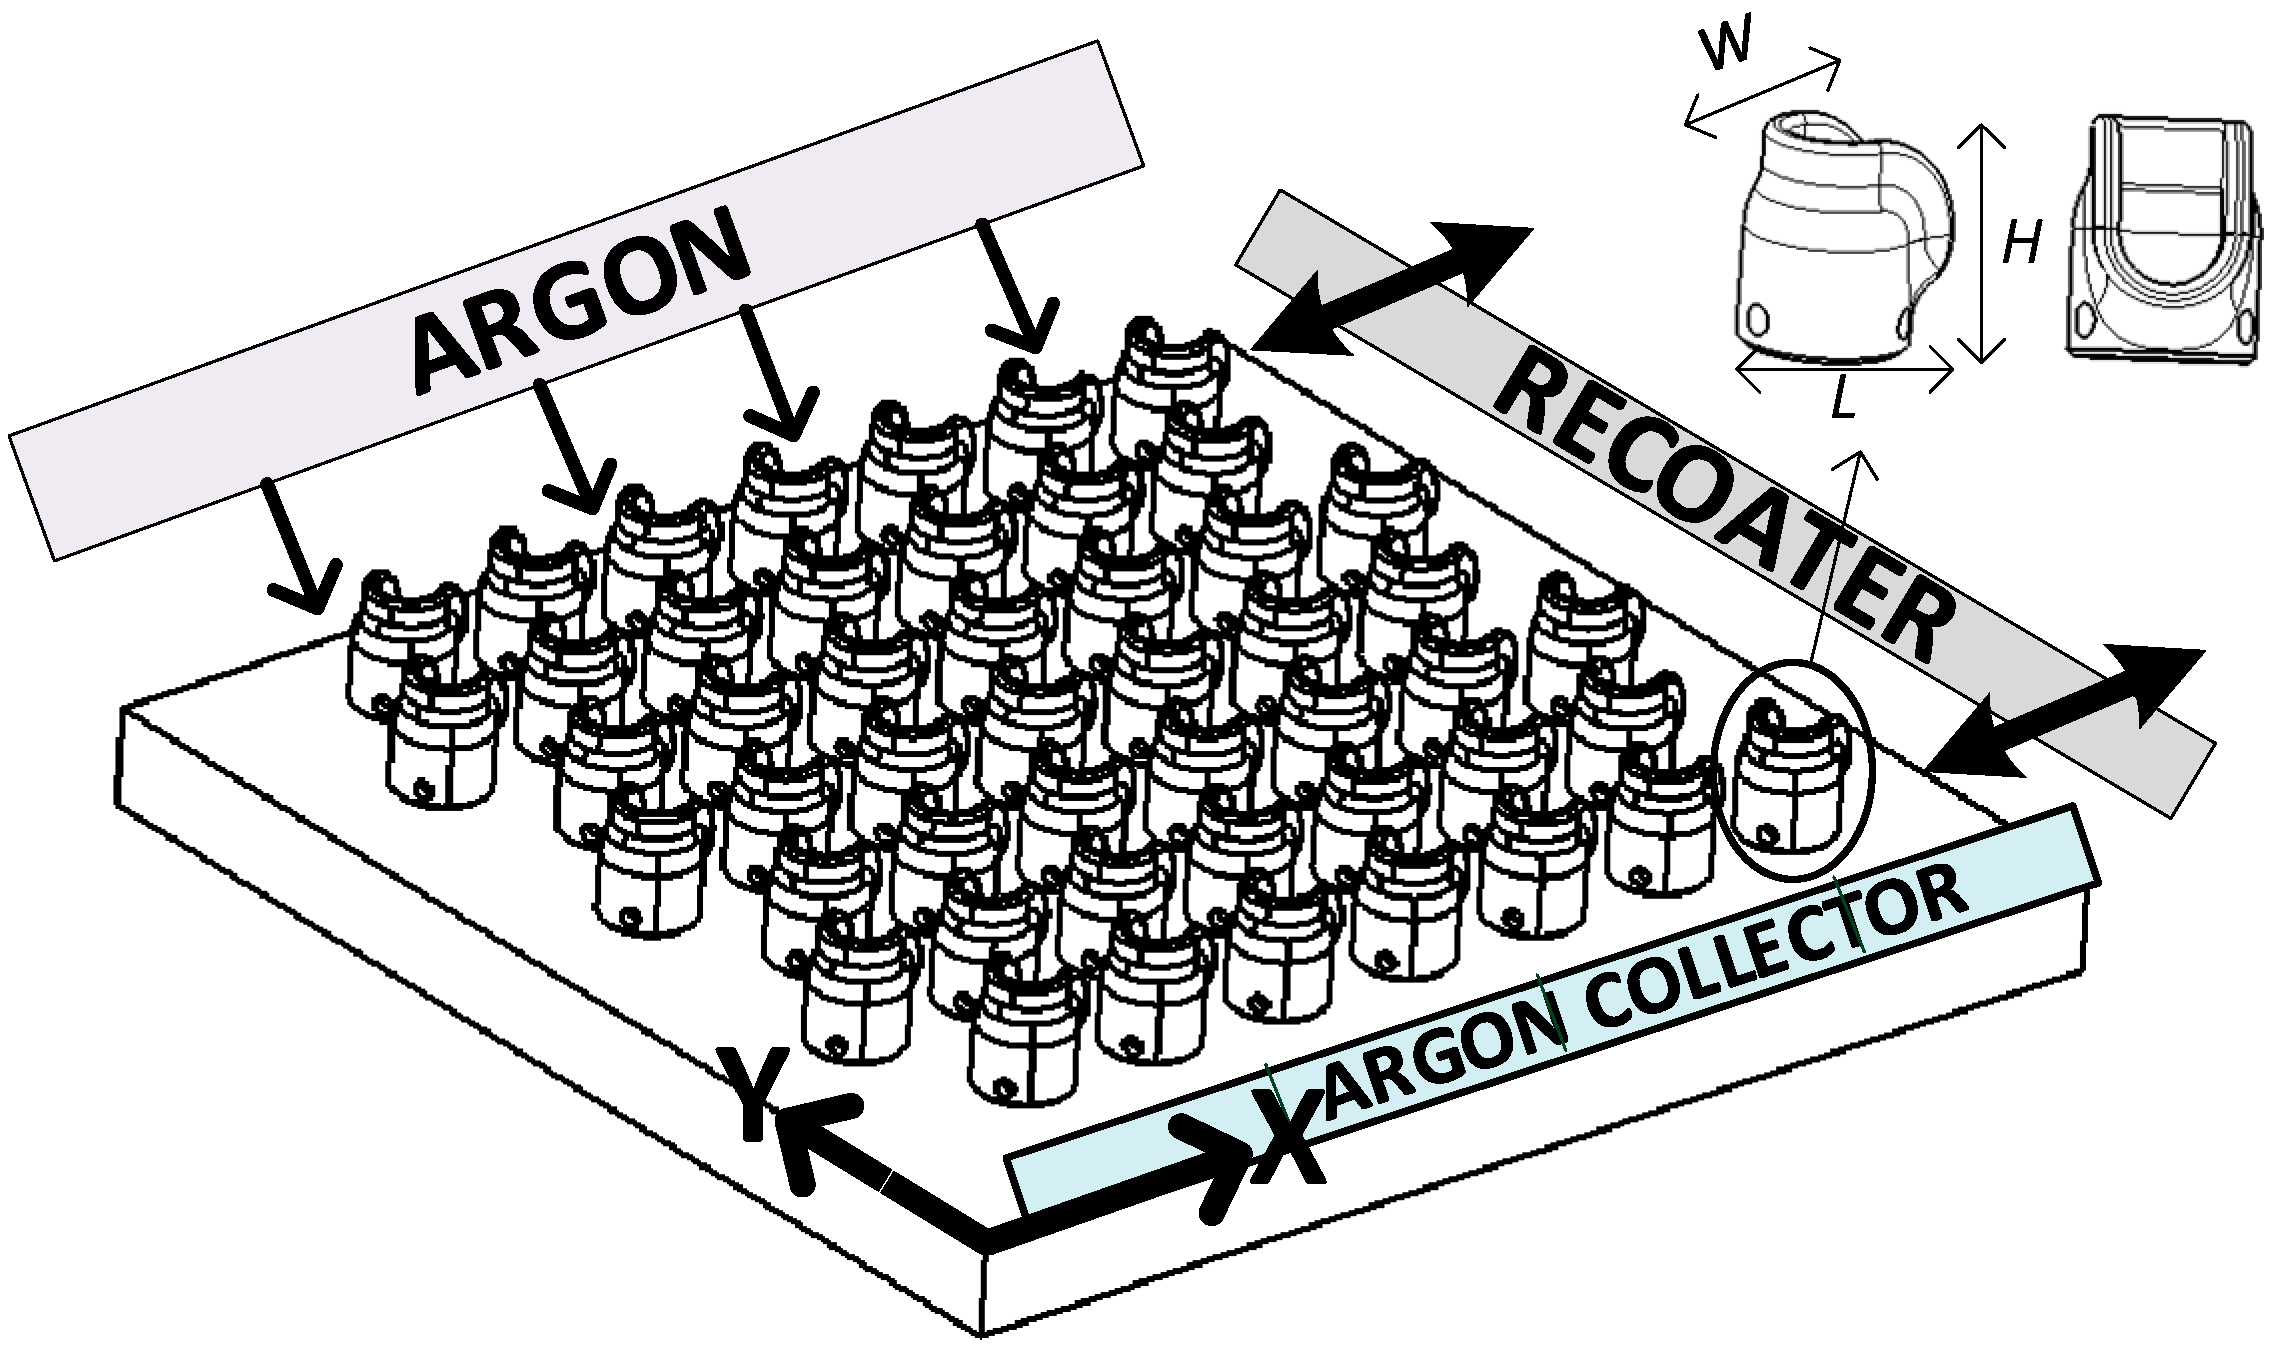
2.1. Intra-Build Variations Study

The intra-build variation study (Analysis 1) consisted of measuring the profile deviations (without a frame of reference) between the digitized parts (SCAN) and the nominal part (CAD). The digitization provided an average of 400,000 points for each part. The overall 3D profile deviations were extracted using the IMInspect module of PolyWorks® v.16 for each part, and represented by their nonparametric medians. In the first part of this intra-build variation study (Analysis 1a), visualizing the repartition of the profile deviations in the manufacturing chamber was the main interest. The second object of interest was the deviations of the external diameter of the parts at a height of z = 1.2 mm (Analysis 1b). This plan z = 1.2 mm has been chosen because it is the mid-value between the chamfer and the holes in the cylindrical feature of the part. For each of the 147 parts, the absolute difference between the measured diameter (using best fit criteria) and the nominal diameter (∅19.05 mm) was extracted using the IMInspect module of PolyWorks® v.16 and plotted using Minitab® v.17. The Analysis 1c consisted of a correlation study of the two previous variables, the overall 3D profile deviation and the external diameter at a height of z = 1.2 mm. This analysis was carried out using a regression equation, which is an algebraic representation of the regression line used to describe the relationship between the response and predictor variables. In our case, the measured diameter was used as a predictor variable, while the overall 3D profile deviation represented by its median was considered as a response variable. Minitab v.17 linear regression analysis was used to obtain the equations for the three builds. Finally, a basic statistical study was also conducted with the overall 3D profile deviations and the external diameter at a height of z = 1.2 mm (Analysis 1d).

2.2. Inter-Build Variations Study

In order to quantify the inter-build variations (Analysis 2), which is the variation behavior among three builds, two statistical analyses were performed: the Kolmogorov–Smirnov (KS) test (Analysis 2a) and the inter-repeatability quantification (Analysis 2b). A visual comparison was also carried out using the best-fit technique with PolyWorks® v.16. The KS test and visual comparison were performed using the data acquired before cutting the parts off the plate for Build #2 and Build #3 (Build #1 data before cutting the parts were not available). The KS test is a nonparametric goodness-of-fit test that compares cumulative distribution functions (CDF). It is explained below in Equations (1)–(3). In this case, the KS test was used to compare the CDF of the 3D profile deviation of Build #2 and Build #3 acquired before the part removal.
Given n data points x 1 , x 2 , …, x n of the build # j , the empirical CDF is defined as:
F j ,   n j ( t ) = 1 n j i = 1 n j 1 x i t
where 1 x i is the indicator of event x i , n j is the data size from build #j, and F j , n j ( t ) is its corresponding empirical CDF. The KS test between Build #2 and Build #3 is based on the maximum distance between two curves:
K S n 2 , n 3 = sup t | F 2 , n 2 ( t ) F 3 , n 3 ( t ) |
The null hypothesis H 0 is F 2 , n 2 and F 3 , n 3 have identical CDF behavior. H 0 is rejected at a significance level 1 α if:
K S n 2 , n 3 > c ( 1 α ) ( n 2 + n 3 ) / n 2 n 3
where c ( 1 α ) is the inverse of the KS distribution at level 1 α . The p-value is used as criteria for acceptance/rejection of the KS test. α is the type I error [31]. The significance level is this study is 95%. This significance level was chosen because he usually used in metrological analyses. If the p-value is lower than the significance level α = 0.05 , then the null hypothesis H 0 is rejected.
Analysis 2b is an inter-repeatability statistical study carried out using CDF of the 3D profile deviation of each part as shown in Equations (4)–(6). Nine (9) different locations were selected (to be specified below) to uniformly cover the build space. The inter-variation study was performed for each position at a 95% level:
P V = ± 1.96 σ P V
σ P V = K 3 R
R = m a x ( x i ) min ( x i )
With x i is the capabilities (as described in Equation (7)) of the profile deviation at location i for Build # j (1, 2, and 3), R is the range of the three parts, σ P V is the standard deviation, and PV is the part variation. For this case, K 3 = 0.5231 [27].

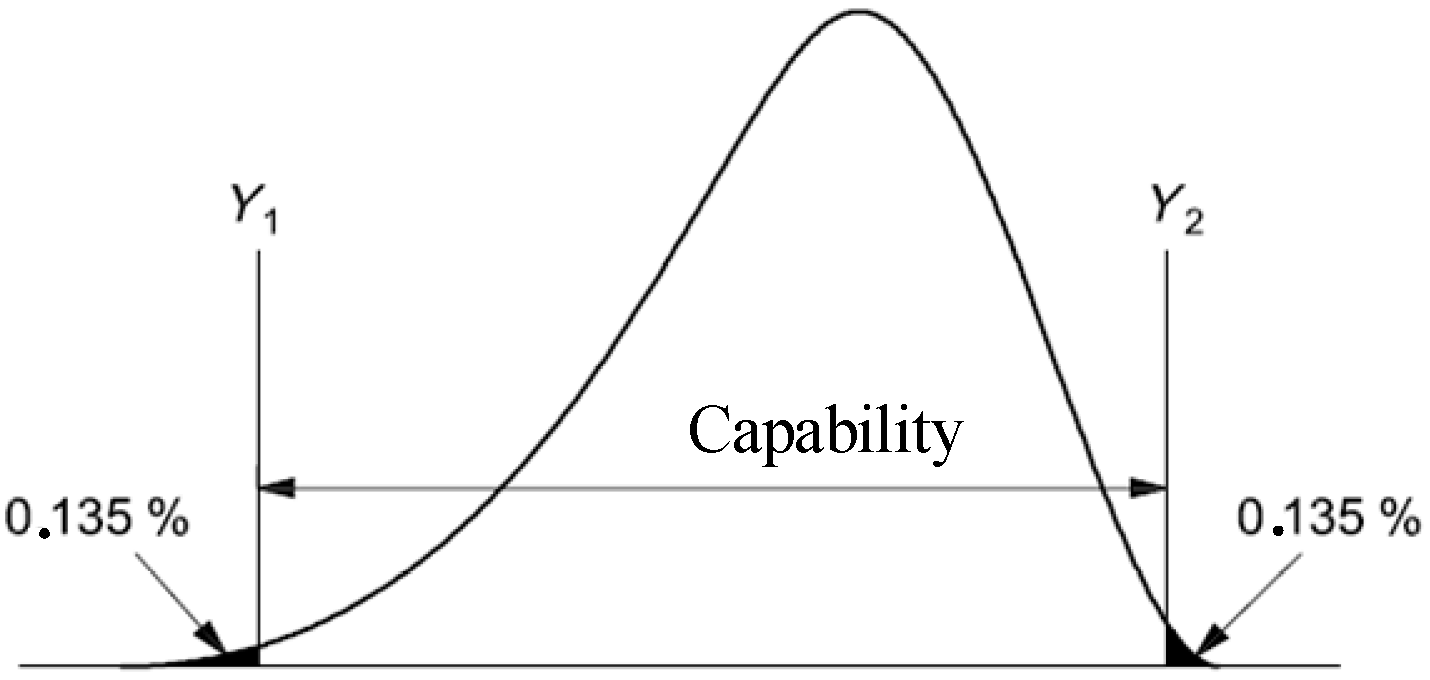
2.3. Capability Study

According to the ISO 22514-4, the process capability is a statistical estimate of the outcome of a characteristic of a process which has been demonstrated to be in a state of statistical control (stable) and which describes the process ability to fulfill the requirements of a given characteristic. By definition, process capability is the interval between L 1 = 0.135% and L 2 = 99.865% of the individual values’ distributions; in other words, the interval containing 99.73% of the data (Figure 3).
The capability study (Analysis 3) was performed using the non-parametric quantiles L x % of the parts’ profile deviations (Analysis 3a). The capability was obtained by:
Capability = L 99.865 % L 0.135 %
Monte Carlo Simulation (MCS) [32] of the 3D profile deviation behavior was also carried out using Matlab® 2017b. For each part, the overall deviations were fitted to a normal distribution at a 95% confidence level. The MCS was then performed on the 147 normal distribution parameters, and the overall capability was extracted (Analysis 3b).

3. Results

The GD and T analysis was based on ASME Y14.5 (2009) and provides the following information: (1) Nonparametric intra-build variations study; (2) inter-build variations study, including goodness-to-fit test and; (3) capability study according to ISO 22514-4.

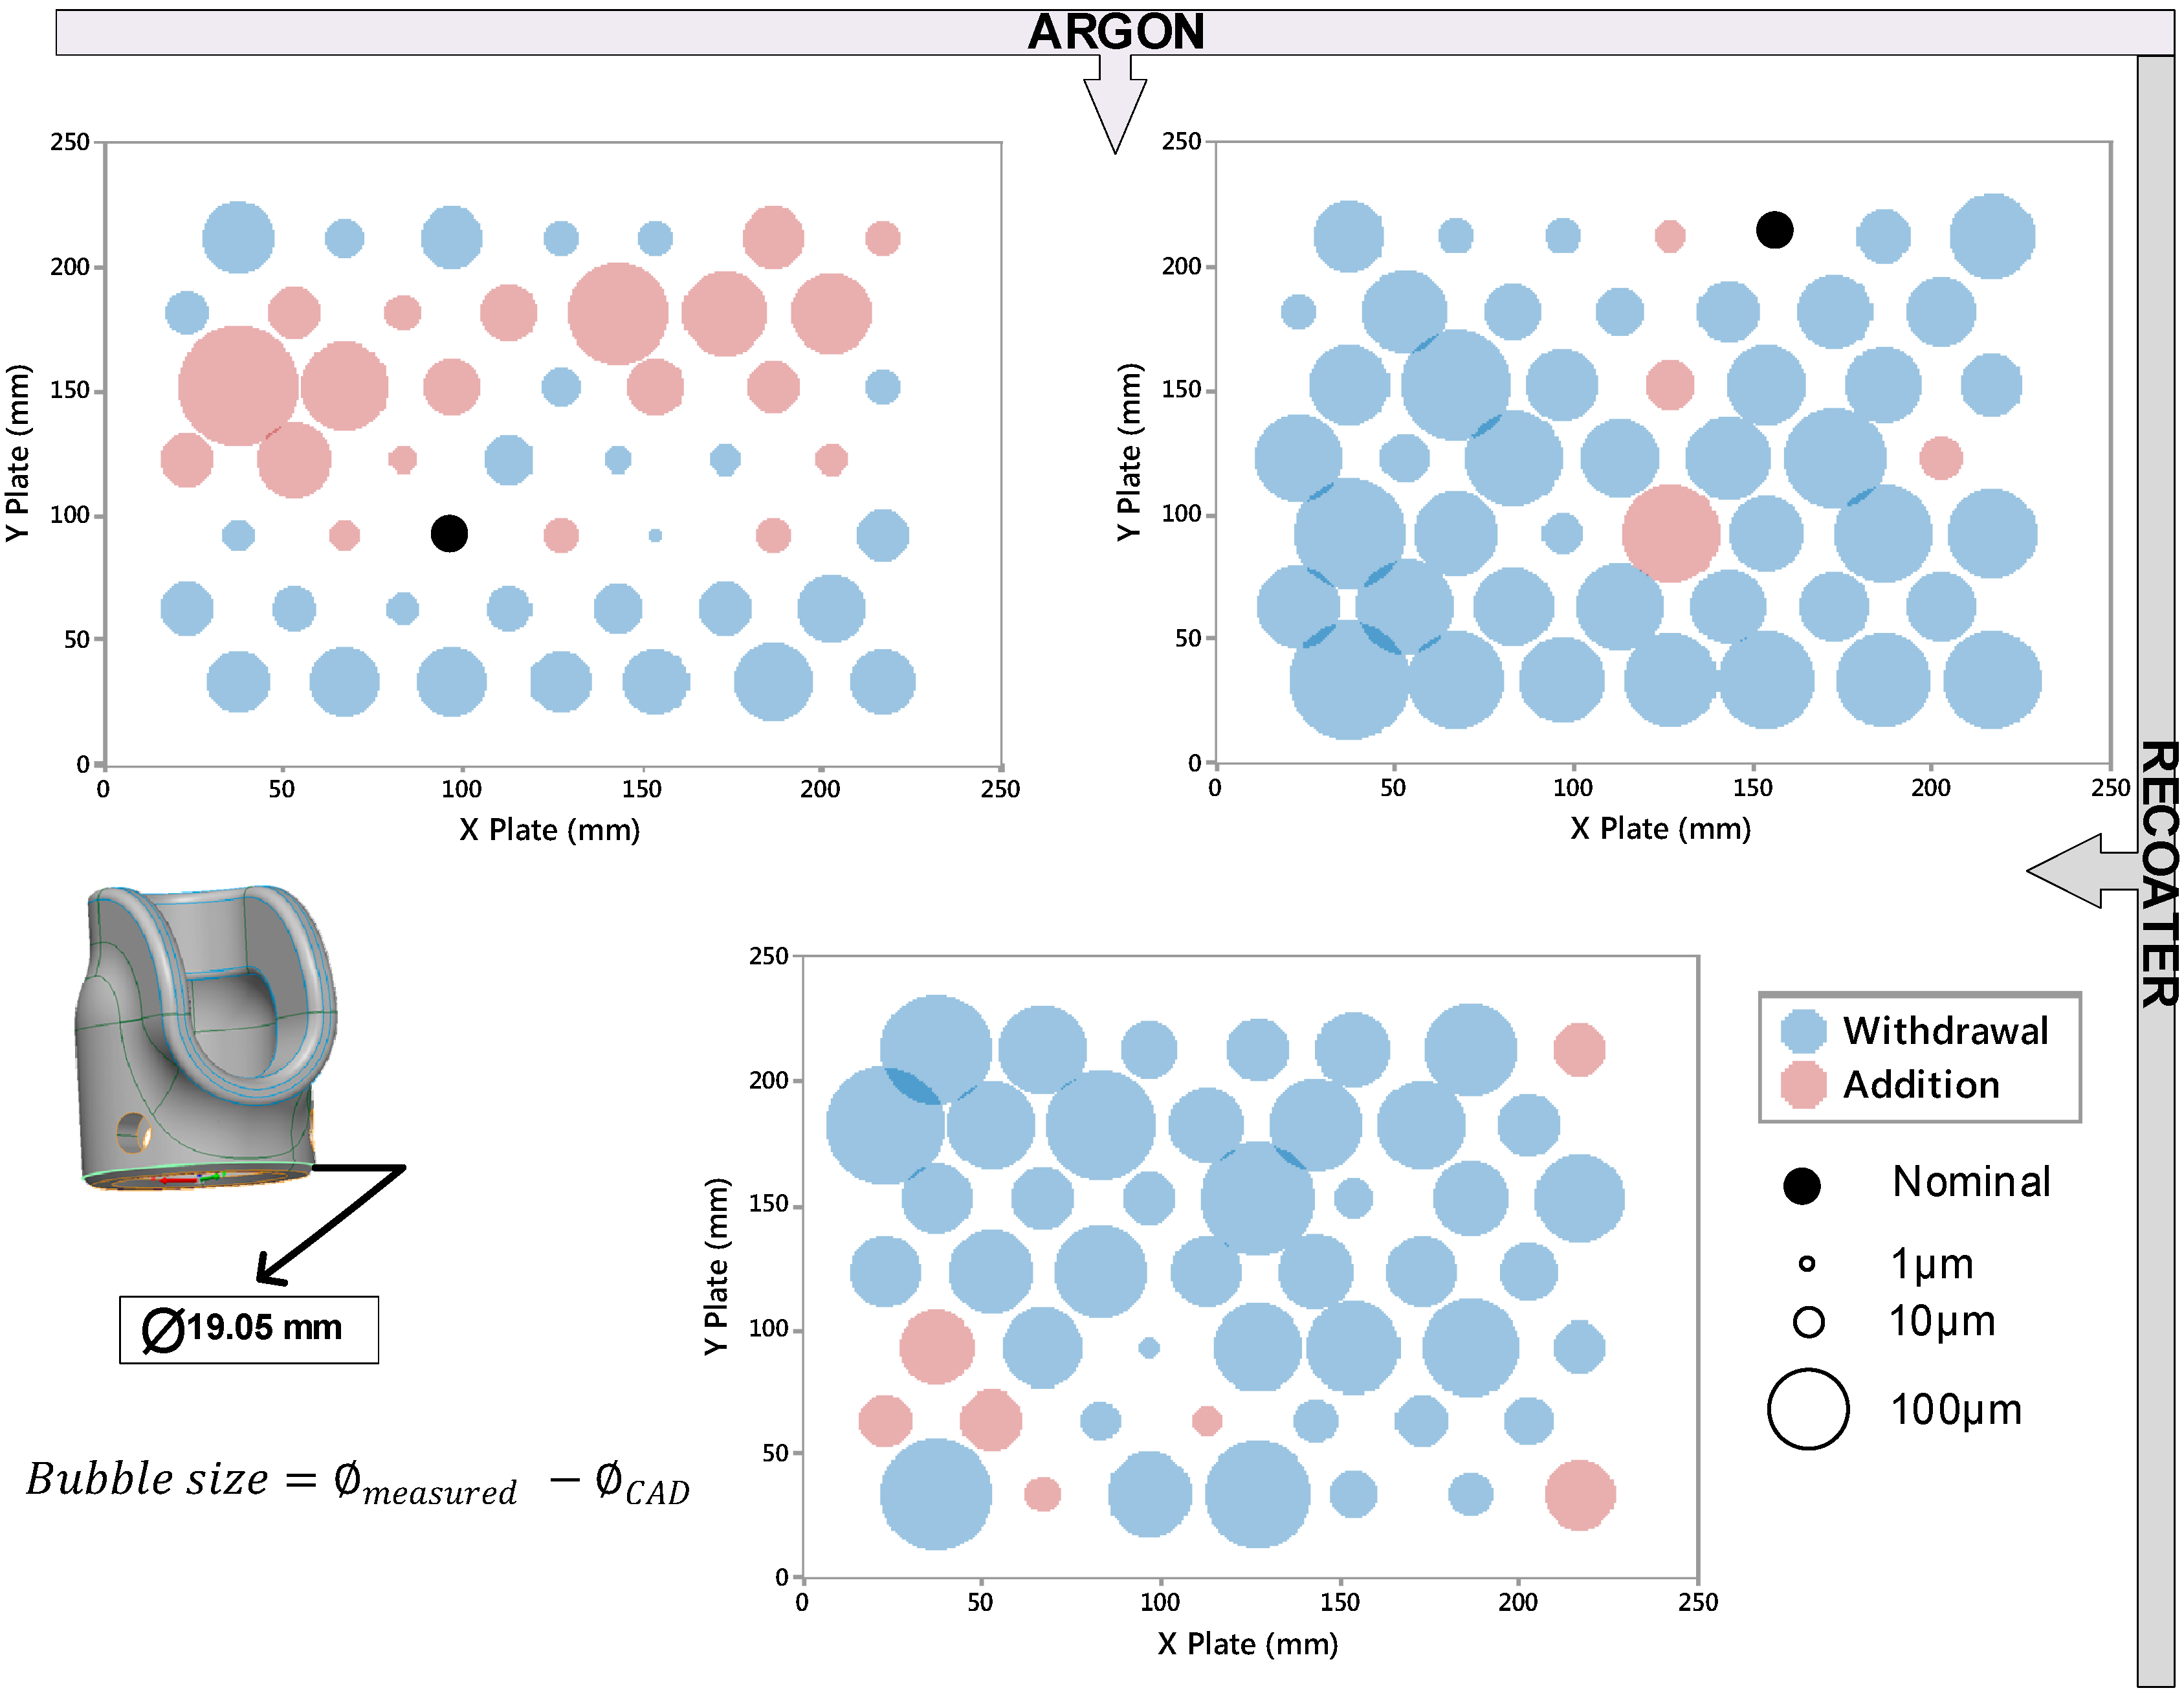
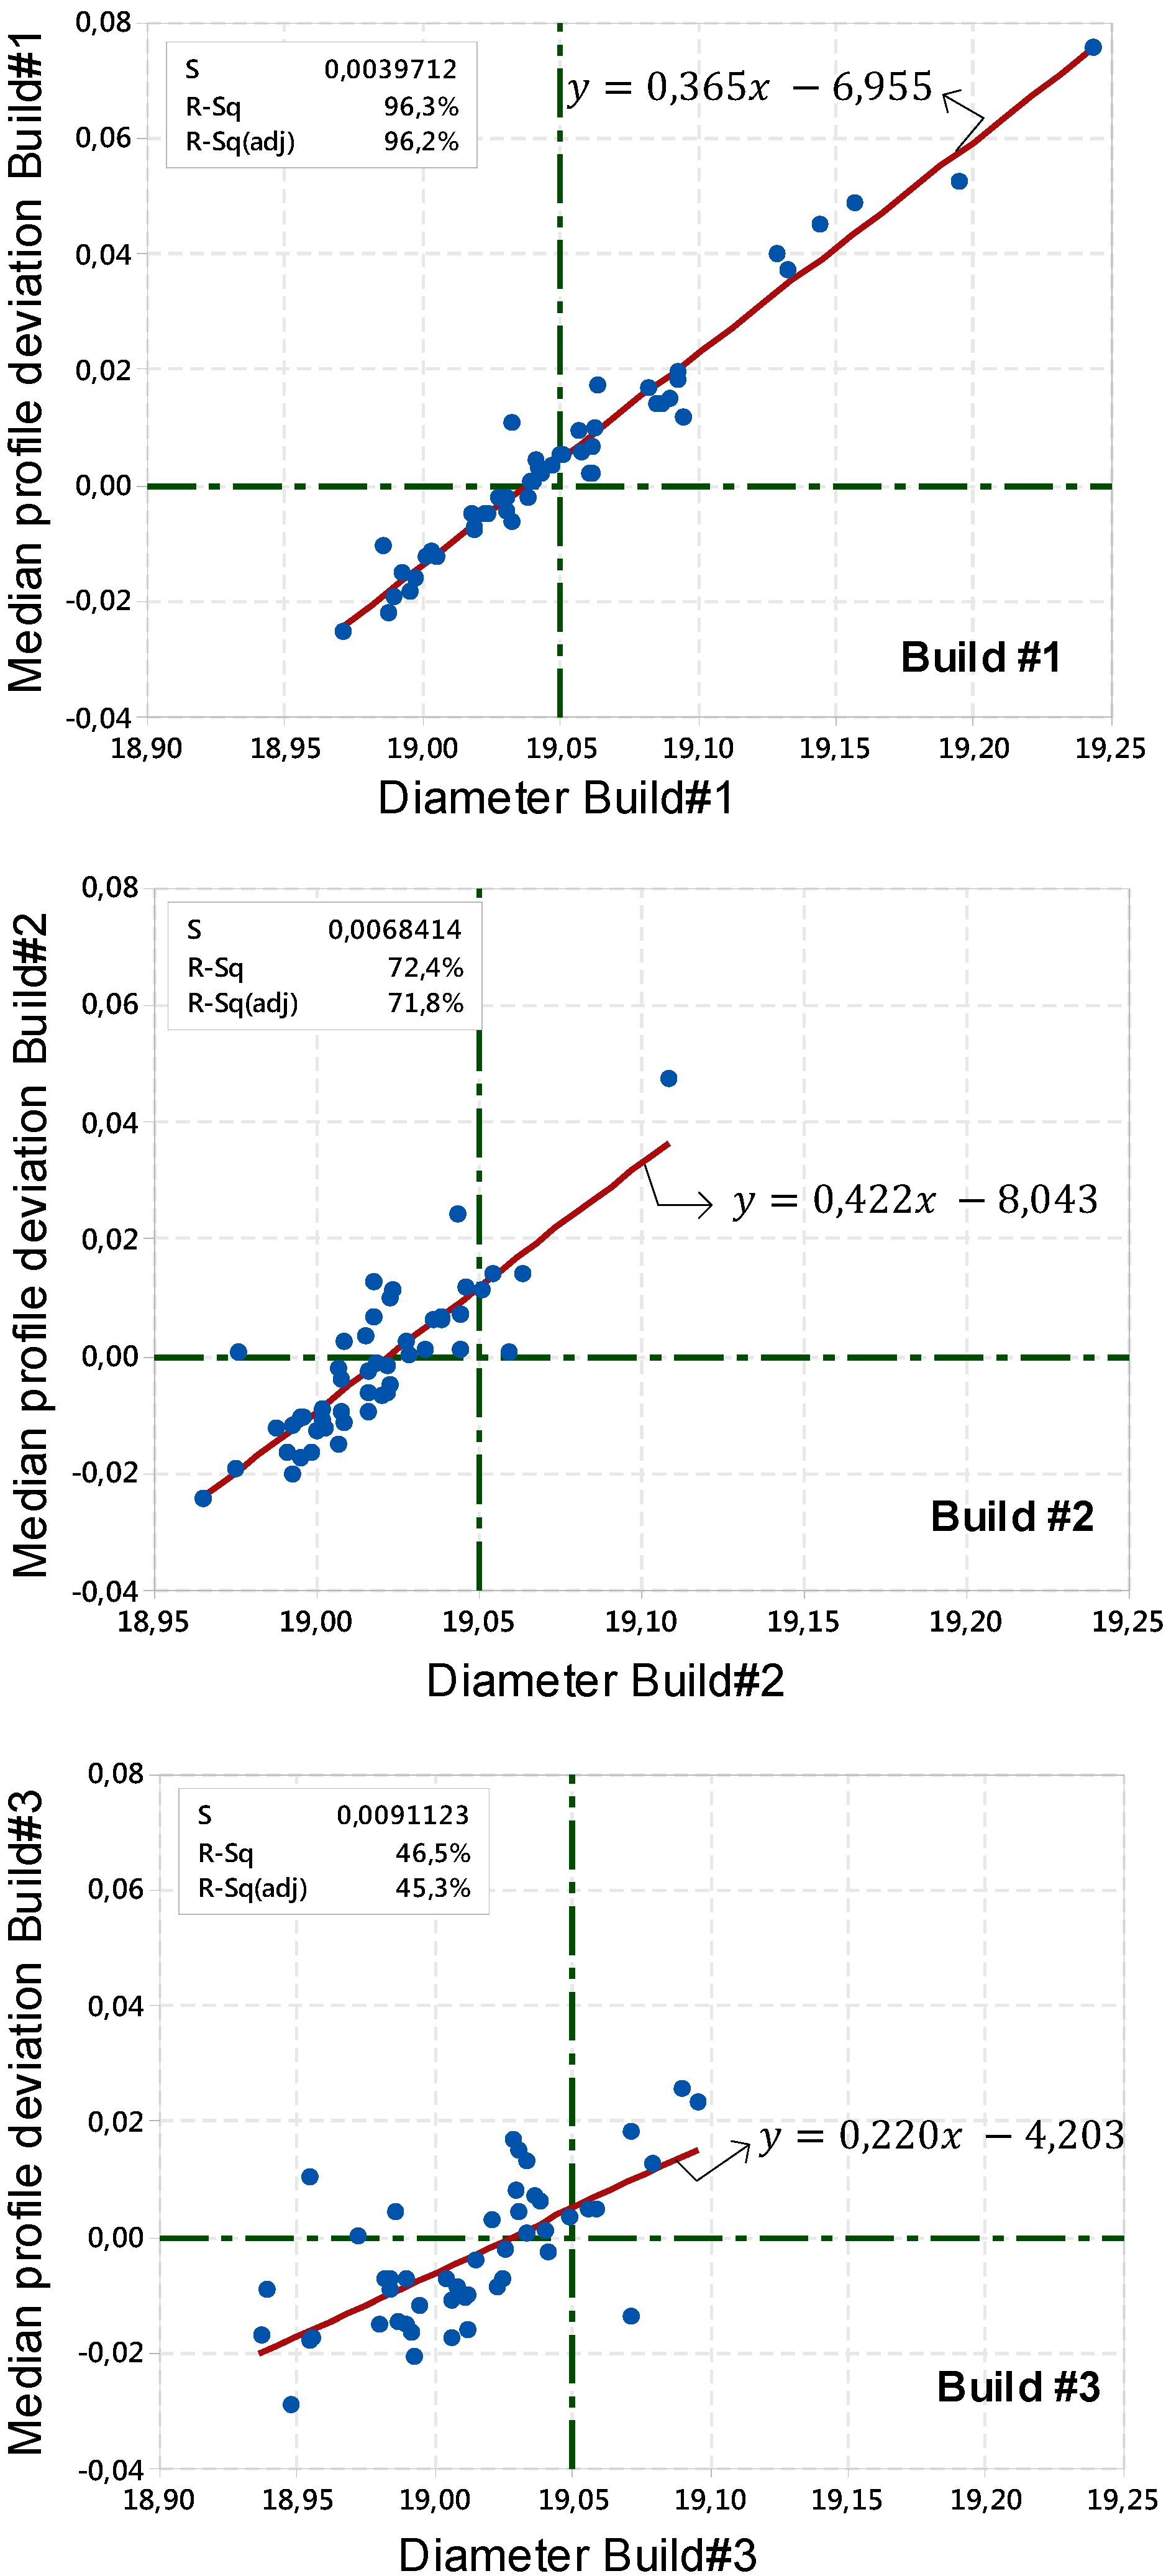
3.1. Intra-Build Variations

In the first study, each build is analyzed independently. This intra-build variation values are related to the location of each of the 49 parts uniformly distributed on the build plate and covering it entirely. In Analysis 1a, different colors are allocated to the deviation map shown in Figure 4 to represent the amplitude of the profile deviations (normal vector to the nominal surface).
The results of Analysis 1b are presented in Figure 5. Colors are brought about to distinguish the material withdrawal, when the feature is smaller than the nominal size in the least material condition (LMC) direction from the addition which is an increase from the nominal size in the maximum material condition (MMC) direction as in ASME Y14. 5.1 [33]. Black bubbles are placed where this difference was less than 1 μm.
The results of Analysis 1c correlating the measured diameter (predictor) and the median profile deviations (response) are plotted in Figure 6. In Figure 6, the value of S is measured in units of the response variable and represents the standard distance data values from the regression line. For a given study, the better the equation predicts the response, the lower the S value. R-Sq represents the proportion of variation in the observed response values that is explained by the predictor variable, which is the measured diameter. Adjusted R-Sq(adj) is a modified R that has been adjusted for the number of terms in the model.
A basic statistical study was also conducted to evaluate the intra-build variation (Analysis 1d). The first objective of this analysis was the external diameter at a height of z = 1.2 mm extraction and characterization. The results are presented in Table 1. The second objective is the overall 3D profile deviations of each part, represented by the gap between the non-parametric quantiles L 1 % and L 99 % (Table 2).

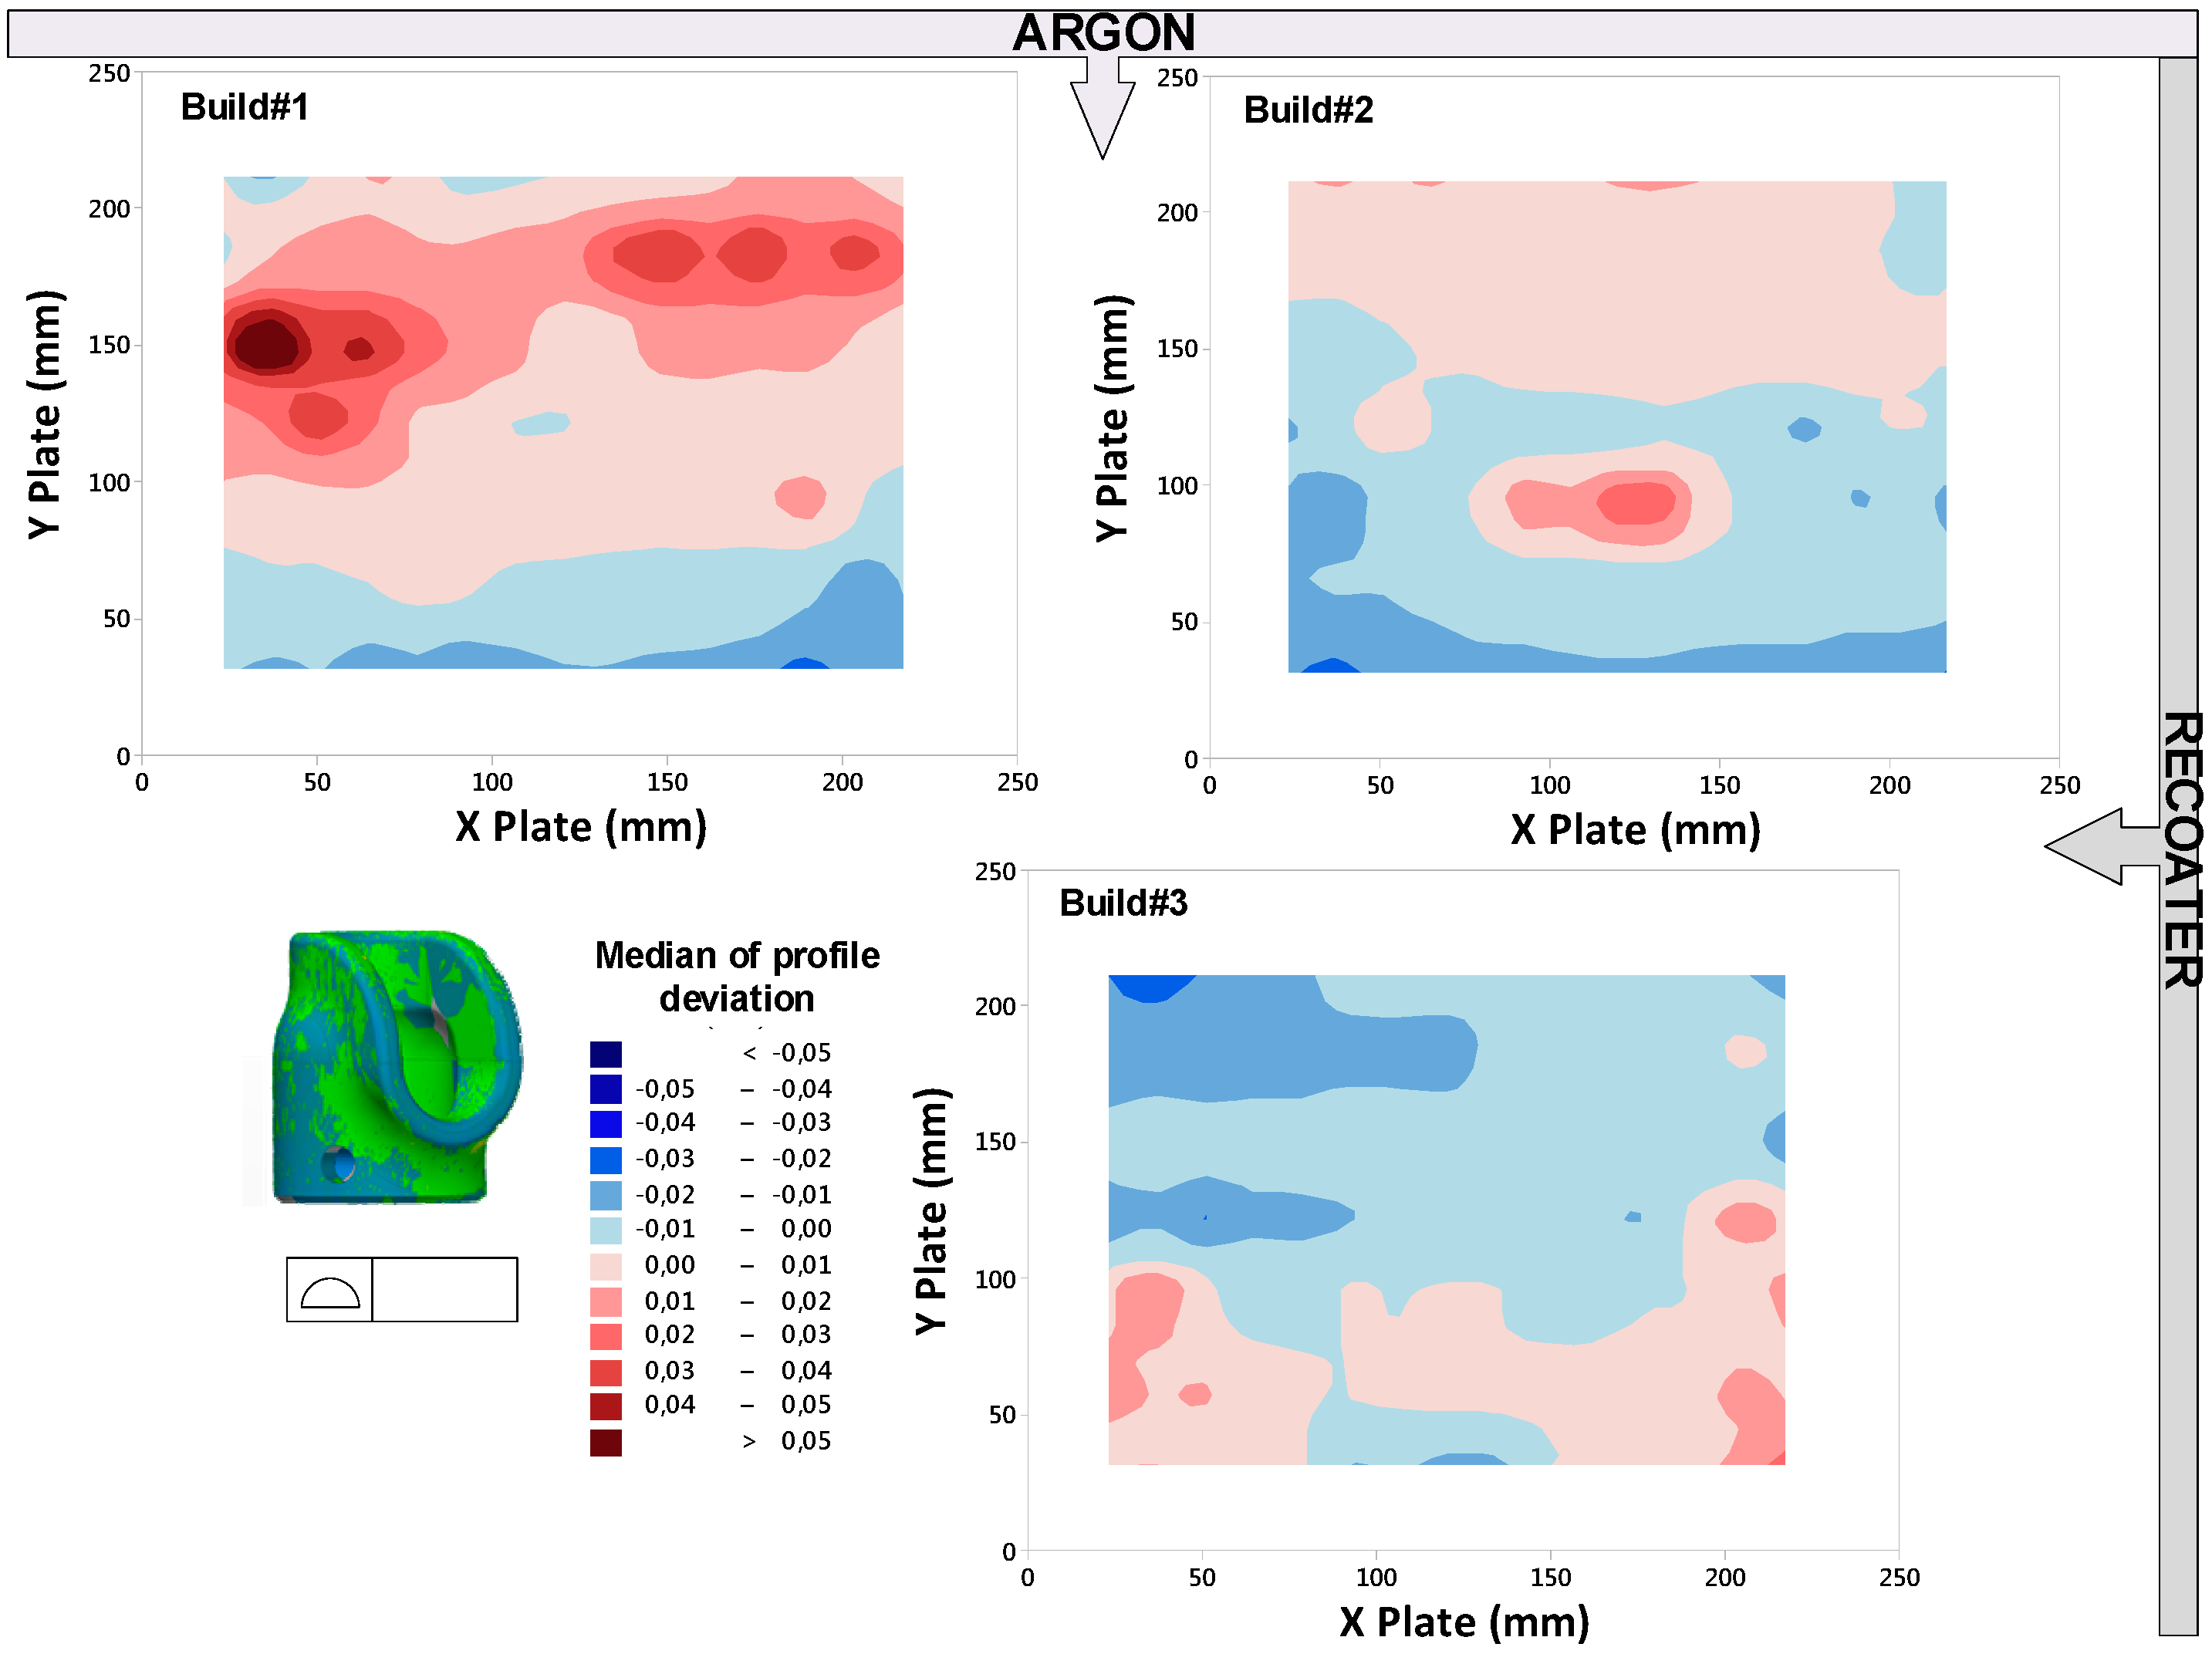
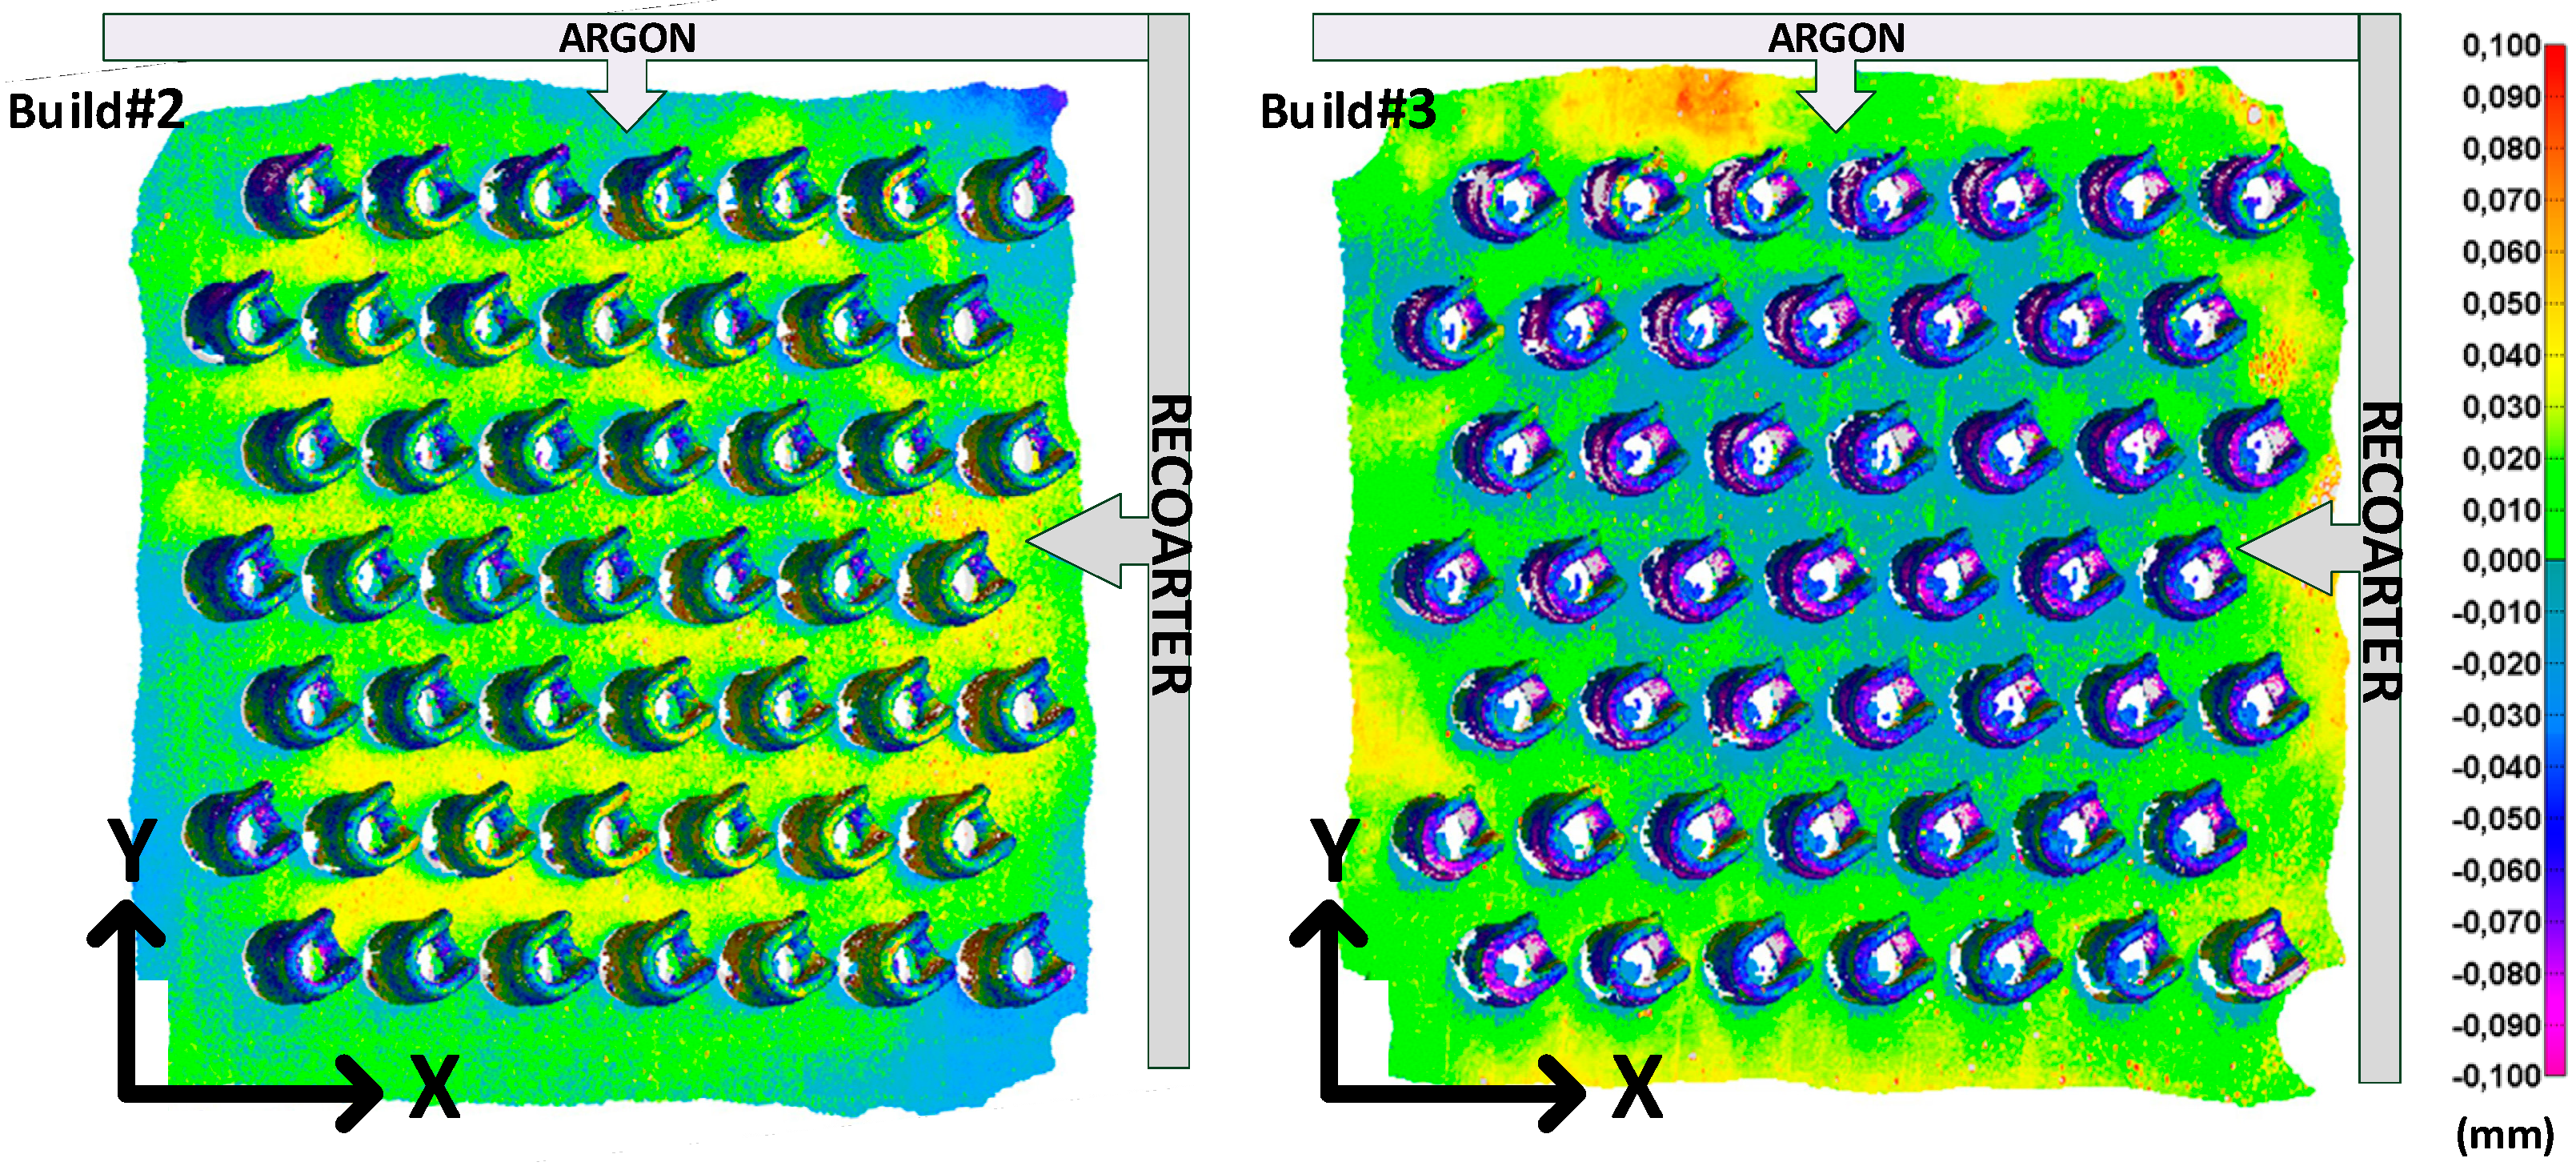
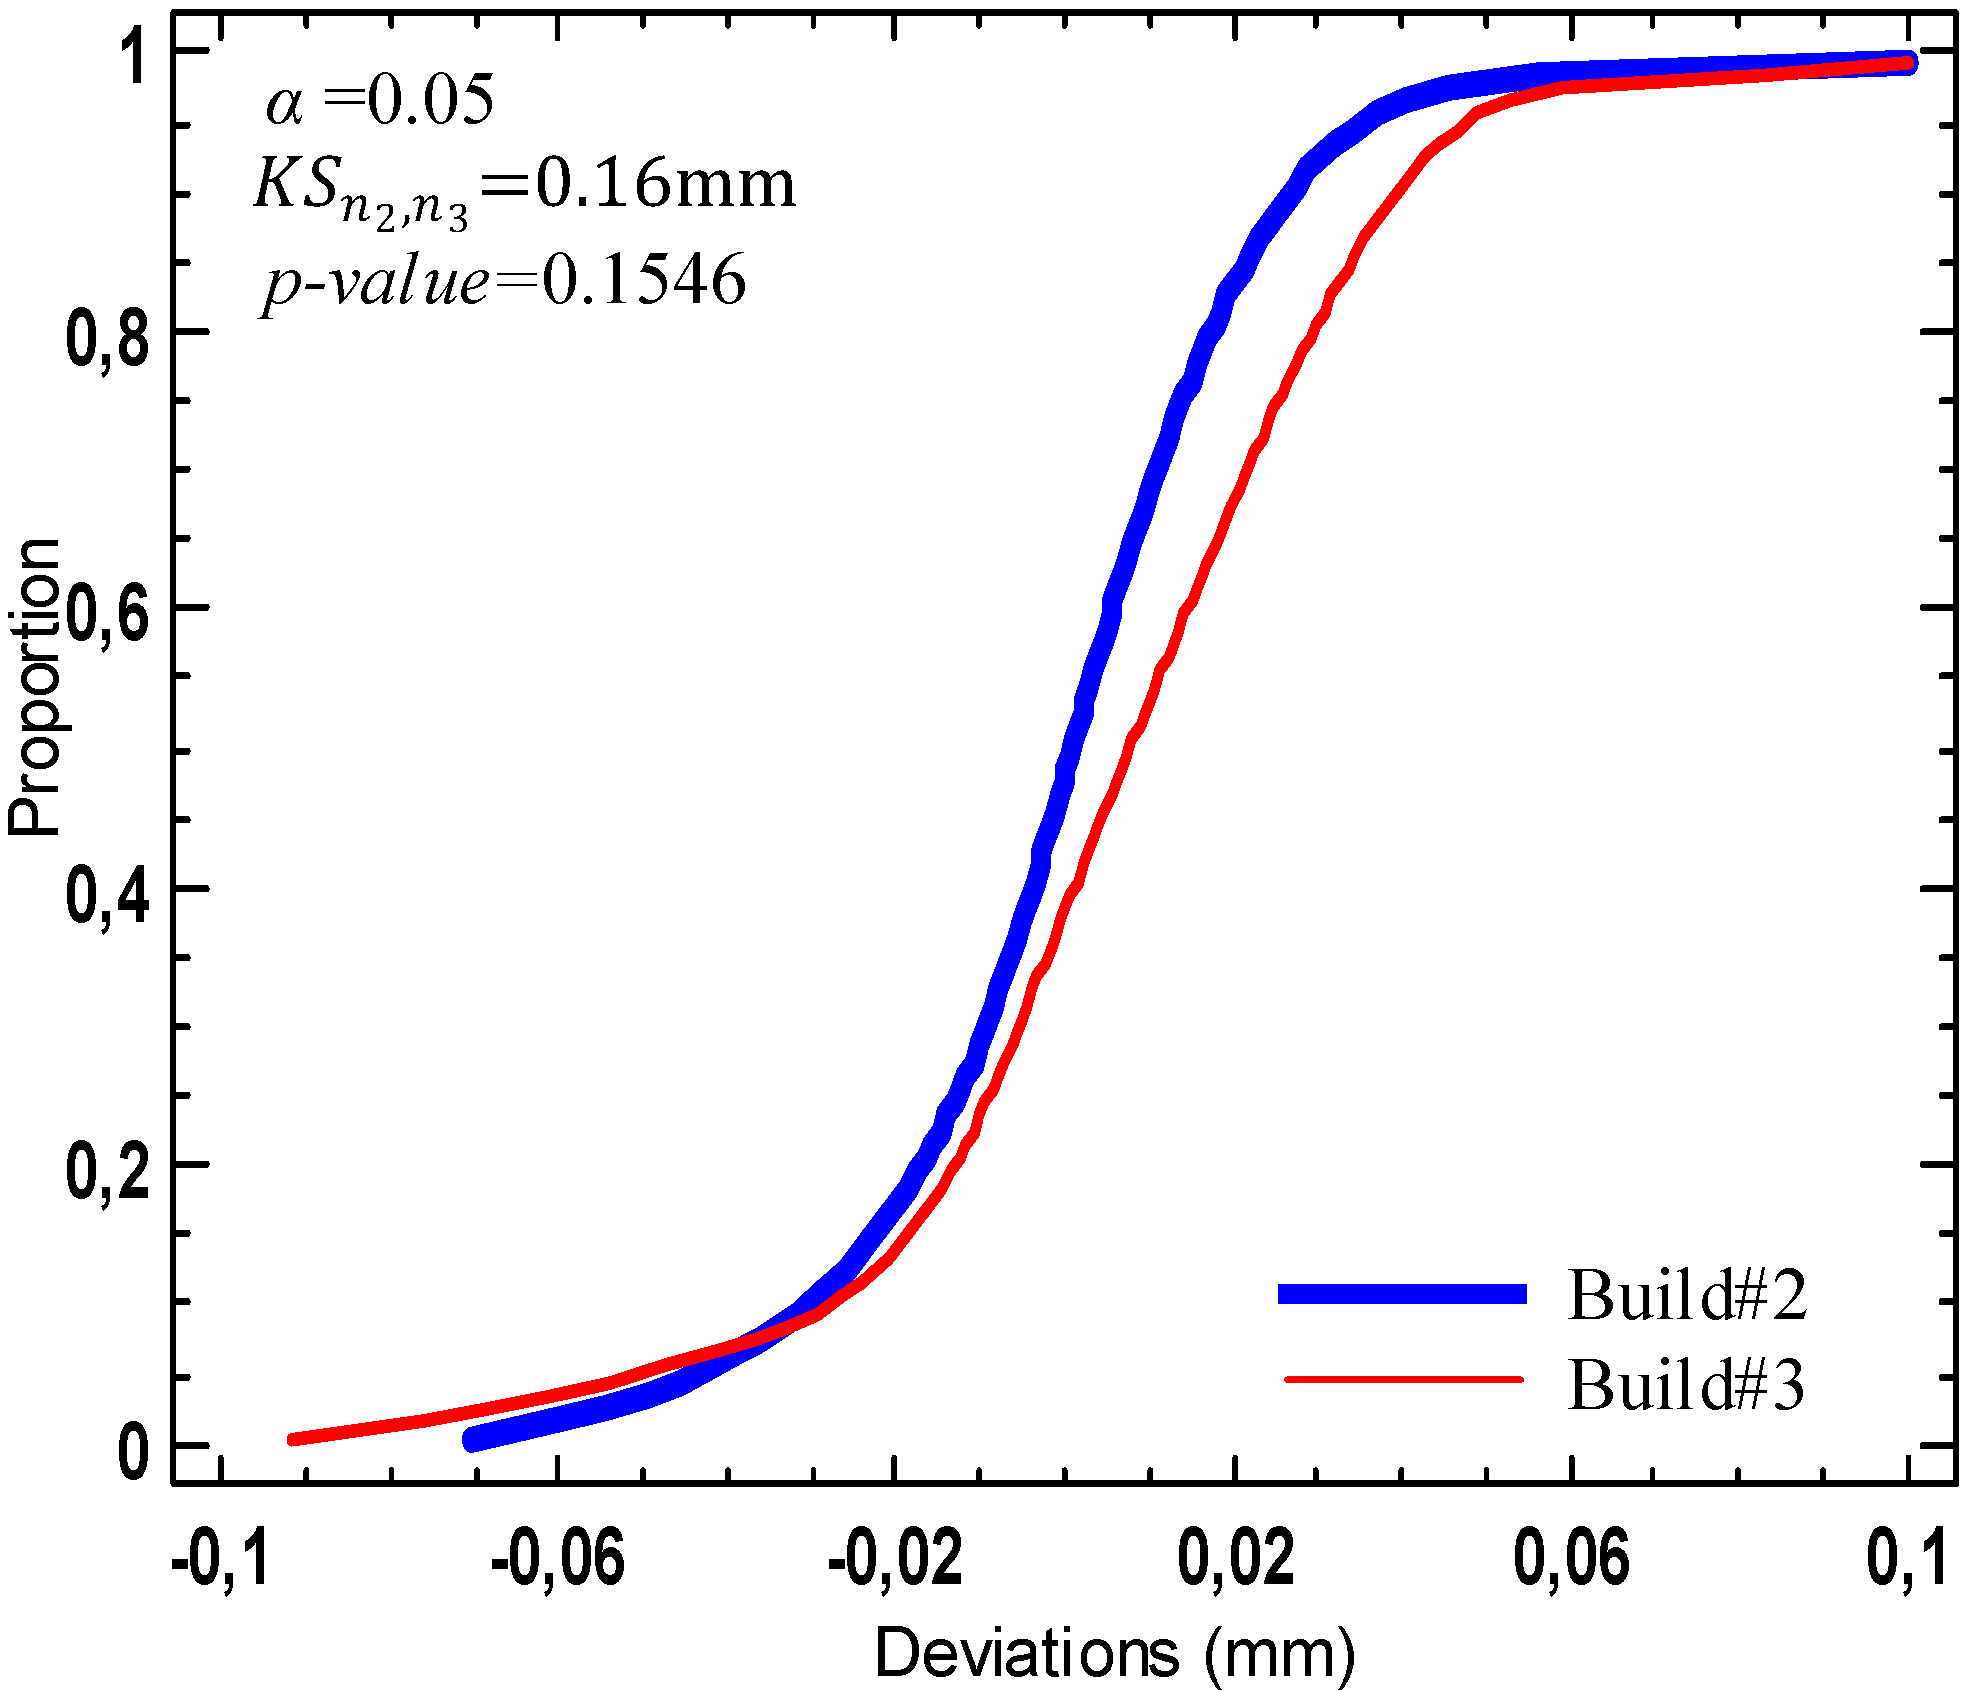
3.2. Inter-Build Variations

This study involves comparing the builds and quantifying and analyzing the differences. First of all, a visual comparison is carried out. For example, Figure 7 presents the overall 3D-profile deviations for Build #2 and Build #3, where the same color scale and parameters are used. This comparison reveals more material withdrawal in Build #3 than in Build #2 (more detailed discussion will be made in Section 4). Next, Figure 8 illustrates the results of Analysis 2a (KS test). Since the p-value is higher than 0.05 ( α ), no significant statistical differences between the CDFs of Build #2 and Build #3 can be reported (95% confidence level). The range of the inter-repeatability (Analysis 2b) for the 49 locations is 455 µm. The minimum part variation is 14 µm, and the maximum is 469 µm at a 95% confidence level, as will be shown in more detail in the next section.

3.3. Capability

The capability study (Analysis 3) was performed on all 174 parts, and the results of this study are presented in Figure 9. Figure 9a illustrates the external diameter extraction and quantification, Figure 9b presents its non-parametric distribution, Figure 9c the distribution of the profile deviation of one part, with the capability interval highlighted, and Figure 9d shows the distribution of the capability intervals of 49 parts.
The results of Analysis 3a are presented in Figure 10, giving an overview of the capabilities (as in Equation (7)) over three builds for nine locations selected to uniformly cover the build space. Thus, for each of the selected part location, the capability (99.73%) and the 95% ( L 97.5 % L 2.5 % ) intervals of profile deviations are provided for Build #1, Build #2, and Build #3. Table 3 presents the results of Analysis 3b for Builds #1, 2, 3 and for the overall 147 parts. It also reveals that the 3D profile deviation capability interval for the 147 parts falls within 228 µm at the 99.73% level.

4. Discussion

After the first build, neither the second nor the third build showed any similarity in terms of the distribution (pattern) of the 3D profile deviations in the manufacturing chamber. Globally, the deviation values are in the same range, but their distribution in the chamber is not repeating. We can then conclude there is no specific pattern of geometric deviations on the chamber for LPBF process with an EOS M280. The measured range of the intra-build means variations are 0.100 mm for the first build, 0.071 mm for the second, and 0.054 mm for the third build. The inter-build variation range is 0.104 mm. The intra-build variations are practically constant even if their distribution on the build plate is not similar. The observation of Figure 7 highlights more withdrawal in Build #3 than Build #2 (Figure 11a). However, since the magnitude of the differences between the two builds is lower than the measurement equipment uncertainty which is ±5 µm, we cannot really conclude on the absence of any significant difference between these builds. The range of the intra-build diameter (∅19.05 mm) variations at z = 1.2 mm is 0.273 mm for the first build, 0.144 mm for the second, and 0.159 mm for the third build. The overall diameter deviation variation range is 0.307 mm (Figure 11b) which corresponds to an equivalent IT Grade IT 13. The 3D profile deviation behavior of the 147 parts falls within 128 µm at a 95% level, which corresponds to an IT 11. The 3D profile capability interval (99.73%) for the process is 228 µm, which is an IT 12 equivalent, comparable to turning and milling process tolerance.

5. Conclusions

This paper presents a metrological investigation carried out on 147 typical aerospace tooling components built in three print jobs using an AlSi10Mg powder and an EOS M280 LPBF system. The investigations were limited to the overall 3D profile and diameter deviation studies, specifically to their repartition in the build chamber. No significant statistical differences were revealed between the 49 locations over the three builds, and the deviation distribution in the build chamber appeared to be non-repeatable. However, inspection of part external diameters reveals a correlation between this feature and the overall 3D profile deviation. In fact, it was shown that the magnitude of these deviations is in the same range as the measurement equipment uncertainty, which is ±5 µm. Further studies with different geometries, such as cylinders, holes, cubes, and cones, could be promising.
The results of this study, and of the upcoming ones, will have a positive impact on increasing the competitiveness of the LPBF process. The findings of the study can also be directly applied to high technology industries, such as aerospace and automotive sectors, planning to use the metallic AM technology in their production cycle.

Author Contributions

The project objectives and methodology were proposed by A.T. and V.B. The specimen fabrication, scanning and data treatment were carried out by F.Z. with the help of A.T., V.B. and A.A. The article was written by F.Z. and revised by A.T., V.B. and A.A.

Funding

This research received no external funding.

Acknowledgments

The authors would like to thank the Natural Sciences and Engineering Research Council of Canada (NSERC) and École de technologie supérieure (ETS) for their supports. The authors are thankful to Joel Grignon, Anatoli Timercam, Morgan Letteneur, and Jean-René Poulin who assisted in this research.

Conflicts of Interest

The authors declare no conflict of interest.

References

  1. ASTM-ISO. Standard Guide for Additive Manufacturing—General Principles—Requirements for Purchased AM Parts; ASTM52901-16; ASTM International: West Conshohocken, PA, USA, 2016. [Google Scholar]
  2. ASTM-ISO. ISO/ASTM 52900: 2015 Additive Manufacturing—General Principles—Terminology; ASTM F2792-10e1; ASTM International: West Conshohocken, PA, USA, 2012. [Google Scholar]
  3. Wohlers, T.; Caffrey, T. Wohlers Report 2014: Additive Manufacturing and 3D Printing State of the Industry; Annual Worldwide Progress Report; Wohlers Associates Inc.: Fort Collins, CO, USA, 2017. [Google Scholar]
  4. Shiomi, M.; Osakada, K.; Nakamura, K.; Yamashita, T.; Abe, F. Residual stress within metallic model made by selective laser melting process. CIRP Ann. Manuf. Technol. 2004, 53, 195–198. [Google Scholar] [CrossRef]
  5. Wang, X. Calibration of shrinkage and beam offset in SLS process. Rapid Prototyp. J. 1999, 5, 129–133. [Google Scholar] [CrossRef]
  6. Zhu, H.; Lu, L.; Fuh, J. Study on shrinkage behaviour of direct laser sintering metallic powder. Proc. Inst. Mech. Eng. Part B 2006, 220, 183–190. [Google Scholar] [CrossRef]
  7. Raghunath, N.; Pandey, P.M. Improving accuracy through shrinkage modelling by using Taguchi method in selective laser sintering. Int. J. Mach. Tools Manuf. 2007, 47, 985–995. [Google Scholar] [CrossRef]
  8. Islam, M.N.; Sacks, S. An experimental investigation into the dimensional error of powder-binder three-dimensional printing. Int. J. Adv. Manuf. Technol. 2016, 82, 1371–1380. [Google Scholar] [CrossRef]
  9. Senthilkumaran, K.; Pandey, P.M.; Rao, P. New model for shrinkage compensation in selective laser sintering. Virtual Phys. Prototyp. 2009, 4, 49–62. [Google Scholar] [CrossRef]
  10. Galovskyi, B.H.T. Testing Workpieces for Selective Laser Sintering. In Proceedings of the ASPE 2015 Spring Topical Meeting, Golden, CO, USA, 8–10 July 2015; pp. 89–94. [Google Scholar]
  11. Van Bael, S.; Kerckhofs, G.; Moesen, M.; Pyka, G.; Schrooten, J.; Kruth, J.-P. Micro-CT-based improvement of geometrical and mechanical controllability of selective laser melted Ti6Al4V porous structures. Mater. Sci. Eng. A 2011, 528, 7423–7431. [Google Scholar] [CrossRef] [Green Version]
  12. Silva, D.N.; De Oliveira, M.G.; Meurer, E.; Meurer, M.I.; da Silva, J.V.L.; Santa-Bárbara, A. Dimensional error in selective laser sintering and 3D-printing of models for craniomaxillary anatomy reconstruction. J. Cranio-Maxillo-Fac. Surg. 2008, 36, 443–449. [Google Scholar] [CrossRef] [PubMed]
  13. Vanderesse, N.; Ky, I.; González, F.Q.; Nuño, N.; Bocher, P. Image analysis characterization of periodic porous materials produced by additive manufacturing. Mater. Des. 2016, 92, 767–778. [Google Scholar] [CrossRef]
  14. Kruth, J.-P. Material incress manufacturing by rapid prototyping techniques. CIRP Ann. Manuf. Technol. 1991, 40, 603–614. [Google Scholar] [CrossRef]
  15. Lart, G. Comparison of rapid prototyping systems. In Proceedings of the First European Conference on Rapid Prototyping, University of Nottingham, Nottingham, UK, 6–7 July 1992; pp. 6–7. [Google Scholar]
  16. Grimm, T. Fused deposition modelling: A technology evaluation. Time Compress. Technol. 2003, 11, 1–6. [Google Scholar]
  17. Castillo, L. Study about the Rapid Manufacturing of Complex Parts of Stainless Steel and Titanium; TNO Report with the Collaboration of AIMME; TNO: Delft, The Netherlands, 2005. [Google Scholar]
  18. Abdel Ghany, K.; Moustafa, S. Comparison between the products of four RPM systems for metals. Rapid Prototyp. J. 2006, 12, 86–94. [Google Scholar] [CrossRef]
  19. Dimitrov, D.; Van Wijck, W.; Schreve, K.; De Beer, N. Investigating the achievable accuracy of three dimensional printing. Rapid Prototyp. J. 2006, 12, 42–52. [Google Scholar] [CrossRef]
  20. Hanumaiah, N.; Ravi, B. Rapid tooling form accuracy estimation using region elimination adaptive search based sampling technique. Rapid Prototyp. J. 2007, 13, 182–190. [Google Scholar] [CrossRef]
  21. Cooke, A.L.; Soons, J.A. Variability in the geometric accuracy of additively manufactured test parts. In Proceedings of the 21st Annual International Solid Freeform Fabrication Symposium, Austin, TX, USA, 9–11 August 2010; pp. 1–12. [Google Scholar]
  22. Moylan, S.; Slotwinski, J.; Cooke, A.; Jurrens, K.; Donmez, M.A. Proposal for a standardized test artifact for additive manufacturing machines and processes. In Proceedings of the 2012 Annual International Solid Freeform Fabrication Symposium, Austin, TX, USA, 6–8 August 2012; pp. 6–8. [Google Scholar]
  23. Minetola, P.; Iuliano, L.; Marchiandi, G. Benchmarking of FDM machines through part quality using IT grades. Procedia CIRP 2016, 41, 1027–1032. [Google Scholar] [CrossRef]
  24. Fahad, M.; Hopkinson, N. A new benchmarking part for evaluating the accuracy and repeatability of Additive Manufacturing (AM) processes. In Proceedings of the 2nd International Conference on Mechanical, Production and Automobile Engineering (ICMPAE 2012), Singapore, 28–29 April 2012; pp. 28–29. [Google Scholar]
  25. Teeter, M.G.; Kopacz, A.J.; Nikolov, H.N.; Holdsworth, D.W. Metrology test object for dimensional verification in additive manufacturing of metals for biomedical applications. Proc. Inst. Mech. Eng. Part H 2015, 229, 20–27. [Google Scholar] [CrossRef] [PubMed]
  26. Ferrar, B.; Mullen, L.; Jones, E.; Stamp, R.; Sutcliffe, C. Gas flow effects on selective laser melting (SLM) manufacturing performance. J. Mater. Process. Technol. 2012, 212, 355–364. [Google Scholar] [CrossRef]
  27. Aidibe, A.; Tahan, A.; Brailovski, V. Metrological investigation of a selective laser melting additive manufacturing system: A case study. IFAC-PapersOnLine 2016, 49, 25–29. [Google Scholar] [CrossRef]
  28. Rebaioli, L.; Fassi, I. A review on benchmark artifacts for evaluating the geometrical performance of additive manufacturing processes. Int. J. Adv. Manuf. Technol. 2017, 93, 2571–2598. [Google Scholar] [CrossRef]
  29. Sing, S.L.; Wiria, F.E.; Yeong, W.Y. Selective laser melting of lattice structures: A statistical approach to manufacturability and mechanical behavior. Robot. Comput. Integr. Manuf. 2018, 49, 170–180. [Google Scholar] [CrossRef]
  30. Calignano, F. Investigation of the accuracy and roughness in the laser powder bed fusion process. Virtual Phys. Prototyp. 2018, 13, 97–104. [Google Scholar] [CrossRef]
  31. Wilcox, R. Kolmogorov–Smirnov Test. In Encyclopedia of Biostatistics; John Wiley & Sons, Ltd.: New York, NY, USA, 2005. [Google Scholar]
  32. Mooney, C.Z. Monte Carlo Simulation; Sage Publications: Thousand Oaks, CA, USA, 1997; Volume 116. [Google Scholar]
  33. American Society of Mechanical Engineers. Mathematical Definition of Dimensioning and Tolerancing Principles: ASME Y14. 5.1 M-1994; American Society of Mechanical Engineers: New York, NY, USA, 1995. [Google Scholar]
Figure 1. Parts disposition in the chamber for each build (EOS M 280).
Jmmp 02 00056 g001
Figure 2. Experimental protocol: (a) manufacturing sequence, (b) stress relief heat treatment, (c) geometrical deviation measurements, and (d) data analysis.
Jmmp 02 00056 g002
Figure 3. Capability interval in conformity with ISO 22514-4.
Jmmp 02 00056 g003
Figure 4. Contour plot of the profile deviation distribution using a median deviation of each part for all three builds.
Jmmp 02 00056 g004
Figure 5. Bubble plot of the diameter deviation of each part of the three builds; the size of the bubble illustrates the absolute difference between the measured diameter and the nominal size of the part.
Jmmp 02 00056 g005
Figure 6. Correlation between the diameter deviation (predictor) and the profile deviation (response).
Jmmp 02 00056 g006
Figure 7. Overall 3D profile color deviation map for Build #2 and Build #3.
Jmmp 02 00056 g007
Figure 8. KS-test results for Build #2 and Build #3.
Jmmp 02 00056 g008
Figure 9. Capability and diameter deviation analyses: (a) Diameter quantification, (b) 49 parts’ (one build) diameter distribution, (c) 3D profile deviation capability, and (d) 49 parts’ (one build) 3D profile deviation capabilities distribution.
Jmmp 02 00056 g009
Figure 10. Intra and inter-variation of part profile deviation study (mm).
Jmmp 02 00056 g010
Figure 11. Box plot of the profile deviation (a) and diameter deviation (b).
Jmmp 02 00056 g011
Table 1. Descriptive statistics of the measured diameter for 49 parts (dimensions in mm).
Build μ S t D e v M i n M e d i a n M a x
#119.0530.05418.97019.04119.243
#219.0170.02518.96419.01519.108
#319.0120.03818.93619.01119.095
With μ = mean; S t D e v = Standard deviation.
Table 2. Descriptive statistics of the measured Profile Jmmp 02 00056 i001 ( L 99 % L 1 % ) for 49 parts (dimensions in mm).
Build Jmmp 02 00056 i002 Jmmp 02 00056 i003 Jmmp 02 00056 i004 Jmmp 02 00056 i005 Jmmp 02 00056 i006
#10.1480.0580.1080.1310.501
#20.1520.0230.1240.1490.276
#30.1470.0140.1160.1480.181
Table 3. 3D profile deviation (mm) and equivalent IT grade (International Tolerance Grade defined in ISO 286).
Build Jmmp 02 00056 i002 Jmmp 02 00056 i00395%97.73%
#10.0050.0340.1360.240
#20.0000.0320.1270.225
#3−0.0020.0300.1210.191
Overall0.0010.0320.128 (IT 11)0.228 (IT 12)

