3.1. Effect of Preheating Temperature and Joint Geometry on HAZ Development and Hardness
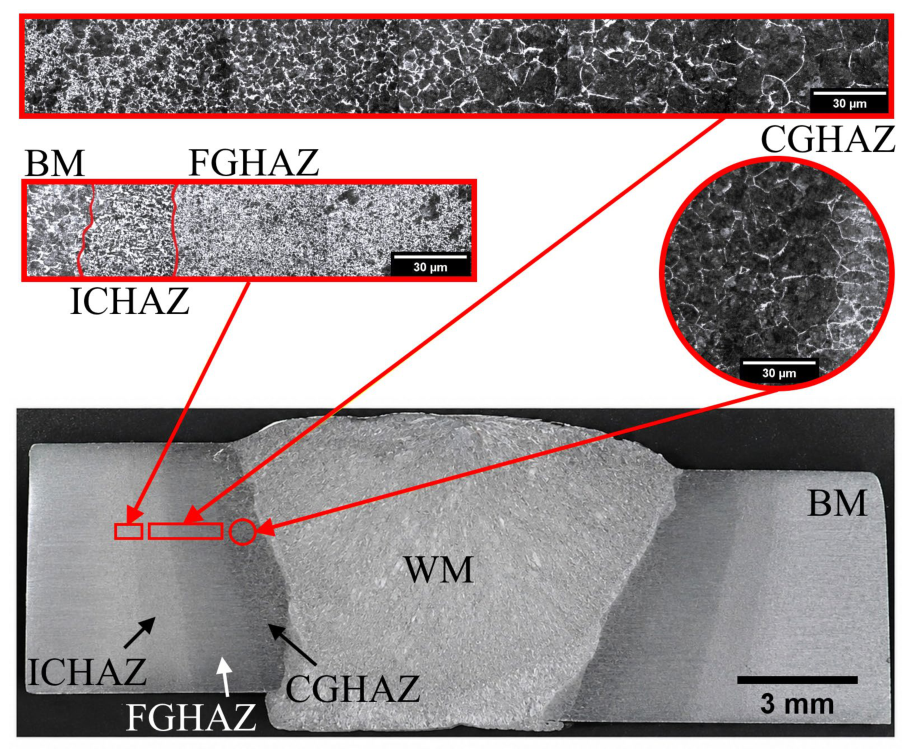
Figure 5 presents representative optical micrographs of a full-penetration butt joint welded at 50 °C, illustrating the WM, HAZ, BM, and characteristic HAZ subregions distinguishable after conventional Nital etching. The regions identified as coarse-grained (CGHAZ), fine-grained (FGHAZ), and intercritical (ICHAZ) are consistent with conventional metallographic classification of welded steel HAZs reported in previous studies [
23,
24].
The representative optical micrographs presented in
Figure 5 were intended to qualitatively identify the characteristic HAZ subregions observed after conventional Nital etching. Within the resolution of optical microscopy, CGHAZ, FGHAZ, and ICHAZ [
12,
13] could be distinguished; however, the present observations were not intended to provide detailed phase identification or quantitative microstructural characterization. Consequently, comparisons among the investigated preheating conditions were based primarily on the measured WM area, HAZ area, hardness, and mechanical properties rather than qualitative differences observed in the optical micrographs.
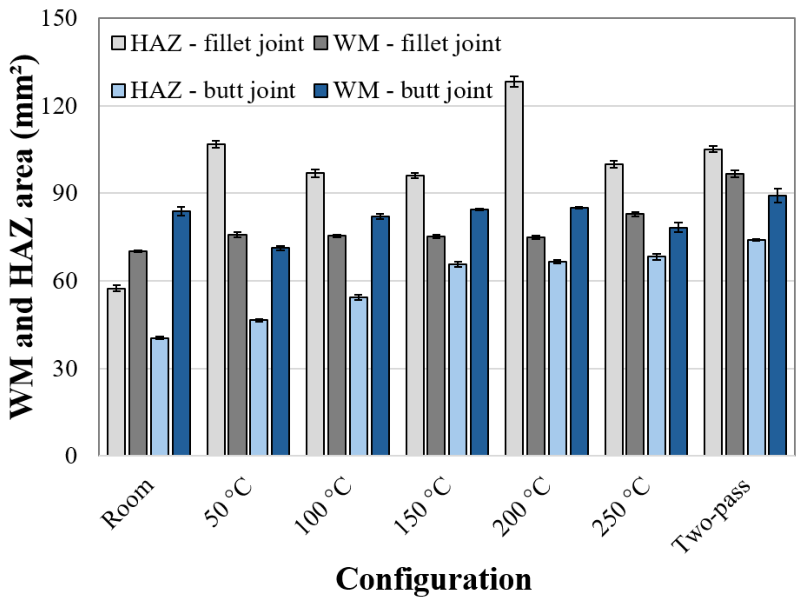
Figure 6 presents the average WM and HAZ areas measured for the butt and fillet joints under the investigated preheating conditions. Because the two joint configurations have different cross-sectional geometries and fusion-boundary lengths, their absolute area values should not be interpreted as geometrically equivalent. Accordingly, the effects of preheating condition were evaluated primarily within each joint geometry, while the factorial analysis was used to determine whether the response to preheating differed between geometries.
Within each geometry, the responses were not uniformly monotonic over the complete preheating range. For the butt joints, HAZ area generally increased with preheating temperature, whereas WM area fluctuated among the single-pass conditions. For the fillet joints, both WM and HAZ areas exhibited condition-dependent variations, with no continuous increase over the investigated temperature range. Therefore, differences among conditions were interpreted using the two-way ANOVA and Tukey HSD results presented in
Table 4 and
Table 5. The two-pass condition produced the largest WM area because of the additional deposited filler metal. Because this condition also changed the cumulative heat input, weld geometry, and potentially the dilution conditions, its WM area cannot be directly compared with the single-pass preheating trend as evidence of a secondary thermal cycle effect alone.
Considering only the conventional single-pass conditions, two-way ANOVA identified significant effects of joint geometry, preheating condition, and their interaction on WM area (
Table 4). The joint geometry × preheating condition interaction was significant, F(5,24) = 130.49,
p < 0.0001, with a large effect size (partial
= 0.965), indicating that the response to preheating condition differed between joint geometries. For the butt joints, the corrected Tukey HSD comparisons showed that the room temperature condition did not differ significantly from the 100, 150, and 200 °C conditions, whereas it differed from the 50 °C and 250 °C conditions. Although both the 100 and 150–200 °C conditions were statistically indistinguishable from room temperature, the 100 °C condition differed significantly from the 150 and 200 °C conditions. The 150 and 200 °C conditions exhibited the highest WM areas and belonged to the same Tukey group, whereas the 50 °C condition exhibited the lowest WM area. For the fillet joints, the 50, 100, 150, and 200 °C conditions were statistically indistinguishable, whereas the room temperature and 250 °C conditions formed separate groups. The two-pass procedure was not included in this factorial analysis and is reported separately as an additional welding procedure.
Considering only the conventional single-pass conditions, HAZ area was significantly affected by joint geometry, preheating condition, and their interaction (
Table 5). The joint geometry × preheating condition interaction was significant, F(5,24) = 430.71,
p < 0.0001, with a large effect size (partial
= 0.989). For the butt joints, HAZ area tended to increase with preheating temperature. The 150 and 200 °C conditions were statistically indistinguishable, as were the 200 and 250 °C conditions, whereas the 150 and 250 °C conditions differed significantly. For the fillet joints, the response remained non-monotonic, with the largest HAZ area observed at 200 °C. The two-pass procedure was evaluated separately and was not included in the factorial ANOVA or Tukey comparisons.
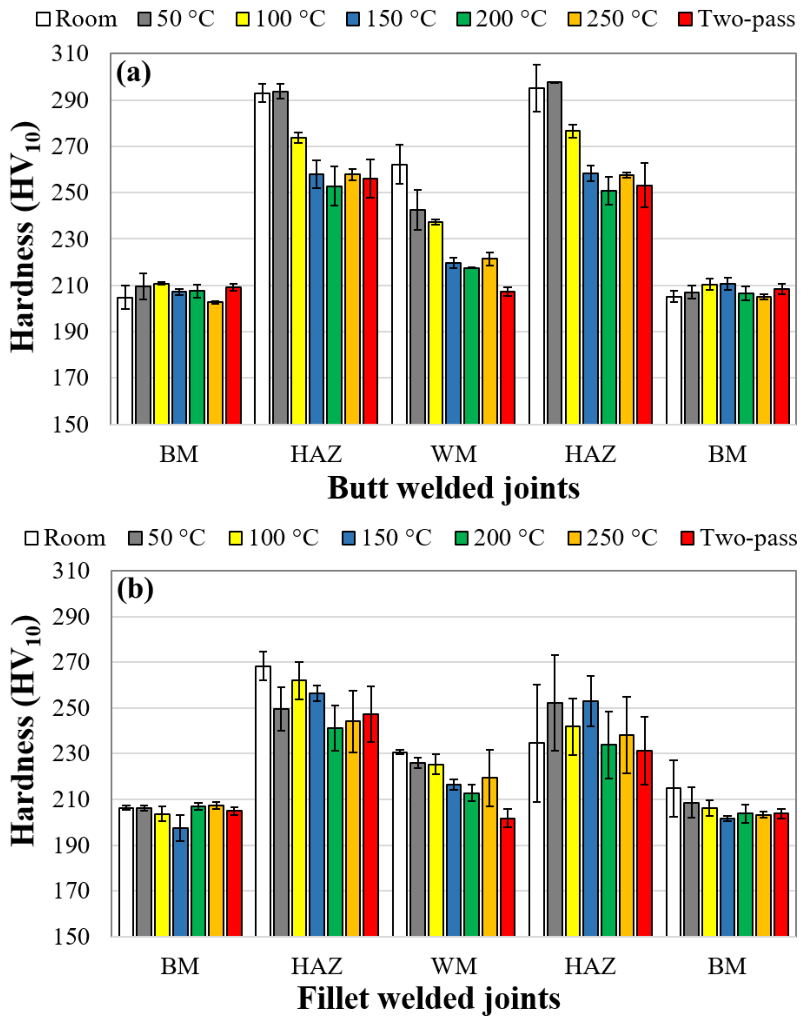
Figure 7 presents the average hardness values measured in the BM, HAZ, and WM. BM hardness showed limited numerical variation among the investigated conditions. For the butt joints, average HAZ and WM hardness generally decreased with increasing preheating temperature, although the response was not strictly monotonic at every temperature. In contrast, the fillet joints exhibited condition-dependent variations in HAZ and WM hardness, with no monotonic relationship with preheating temperature. Consequently, the results were interpreted using the statistical comparisons presented in
Table 6 and
Table 7 rather than from the apparent trends in the mean values alone.
For the butt joints (
Figure 7a), average HAZ hardness ranged from approximately 294 HV
10 at room temperature to approximately 252 HV
10 at 200 °C among the conventional single-pass conditions, whereas average WM hardness ranged from approximately 262 HV
10 at room temperature to approximately 218 HV
10 at 200 °C. The additional two-pass procedure exhibited a lower numerical WM hardness of approximately 207 HV
10 and is reported separately. For the fillet joints (
Figure 7b), numerical variations were observed in both HAZ and WM hardness; however, the statistical significance of these differences depended on the response considered and was therefore evaluated using the Tukey-adjusted comparisons presented in
Table 6 and
Table 7.
All average HAZ hardness values measured at the standardized locations remained below 300 HV
10 for the investigated single-pass conditions. For contextual comparison, these values were also below the 410 HV
10 engineering reference considered in this study [
25]. However, this comparison is provided only as an engineering reference and should not be interpreted as demonstrating compliance with a maximum hardness requirement. Because the experimental procedure was not designed to determine the maximum local hardness immediately adjacent to the fusion boundary, no conclusion regarding maximum HAZ hardness or formal hardness qualification can be drawn from these measurements.
Considering only the conventional single-pass conditions, WM hardness was significantly affected by joint geometry, preheating condition, and their interaction (
Table 6). The joint geometry × preheating condition interaction was significant, F(5,24) = 12.87,
p < 0.0001, with a large effect size (partial
= 0.728). Because residual normality was not satisfied, an HC3 robust sensitivity analysis was performed; the interaction remained significant, robust F(5,24) = 10.04,
p < 0.0001. For the butt joints, room temperature exhibited the highest average WM hardness, the 50 and 100 °C conditions were statistically indistinguishable, and the 150–250 °C conditions formed a common Tukey group. The two-pass results are reported descriptively and were not included in these inferential comparisons.
Considering only the conventional single-pass conditions, HAZ hardness was significantly affected by joint geometry, preheating condition, and their interaction (
Table 7). The joint geometry × preheating condition interaction was significant, F(5,24) = 11.53,
p < 0.0001, with a large effect size (partial
= 0.706). Because residual normality and variance homogeneity assumptions were not satisfied, an HC3 robust sensitivity analysis was performed. The interaction remained significant, robust F(5,24) = 83.23,
p < 0.0001. For the butt joints, Tukey-adjusted comparisons identified significant differences in HAZ hardness among several conventional single-pass preheating conditions. In contrast, none of the pairwise comparisons among the six conventional single-pass conditions was statistically significant for the fillet joints (Tukey-adjusted
p > 0.05 for all comparisons). The two-pass procedure was excluded from these inferential comparisons and is reported descriptively.
Residual diagnostics indicated that the ANOVA assumptions were adequately satisfied for WM and HAZ areas considering the conventional single-pass conditions. For WM area, the Shapiro–Wilk and Levene tests yielded W = 0.971, p = 0.441, and F(11,24) = 1.008, p = 0.469, respectively. For HAZ area, the corresponding results were W = 0.969, p = 0.410, and F(11,24) = 0.444, p = 0.919. For WM hardness, variance homogeneity was not rejected, F(11,24) = 1.867, p = 0.097, although residual normality was rejected, W = 0.902, p = 0.0038. For HAZ hardness, both residual normality, W = 0.728, p < 0.0001, and variance homogeneity, F(11,24) = 2.812, p = 0.0165, were rejected. HC3 robust sensitivity analyses were therefore performed for the hardness responses and confirmed the statistical significance of the joint geometry × preheating condition interactions.
3.2. Effect of Preheating Temperature on the Mechanical Performance of Butt Welded Joints
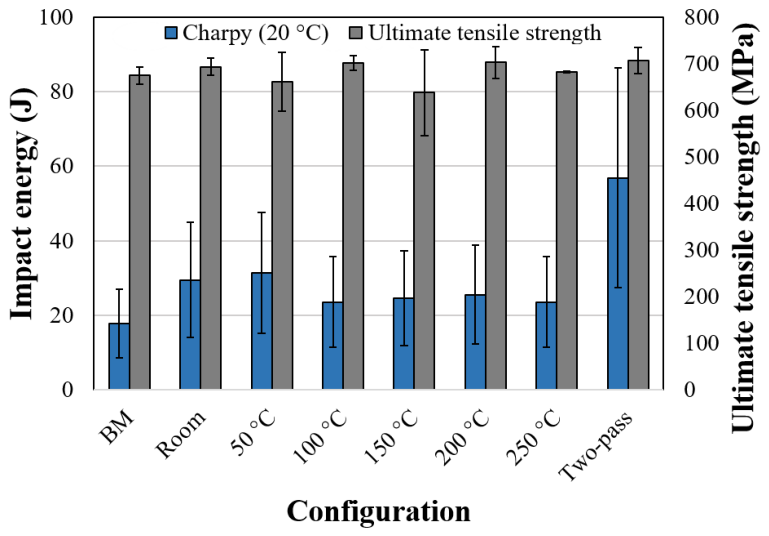
Ultimate tensile strength ranged from 638 to 703 MPa among the conventional single-pass butt welded joints (
Figure 8). The two-pass procedure yielded 706.76 ± 20.13 MPa and is reported separately as an additional welding procedure. No statistically significant effect of preheating condition on UTS was detected among the conventional single-pass conditions, F(5,12) = 1.66,
p = 0.218, partial
= 0.409 (
Table 8). Consistent with the ANOVA result, Tukey HSD pairwise comparisons identified no significant differences among the six conventional single-pass conditions, which therefore shared the same statistical group. All tensile specimens (
Figure 9), including those produced using the additional two-pass procedure, fractured in the BM.
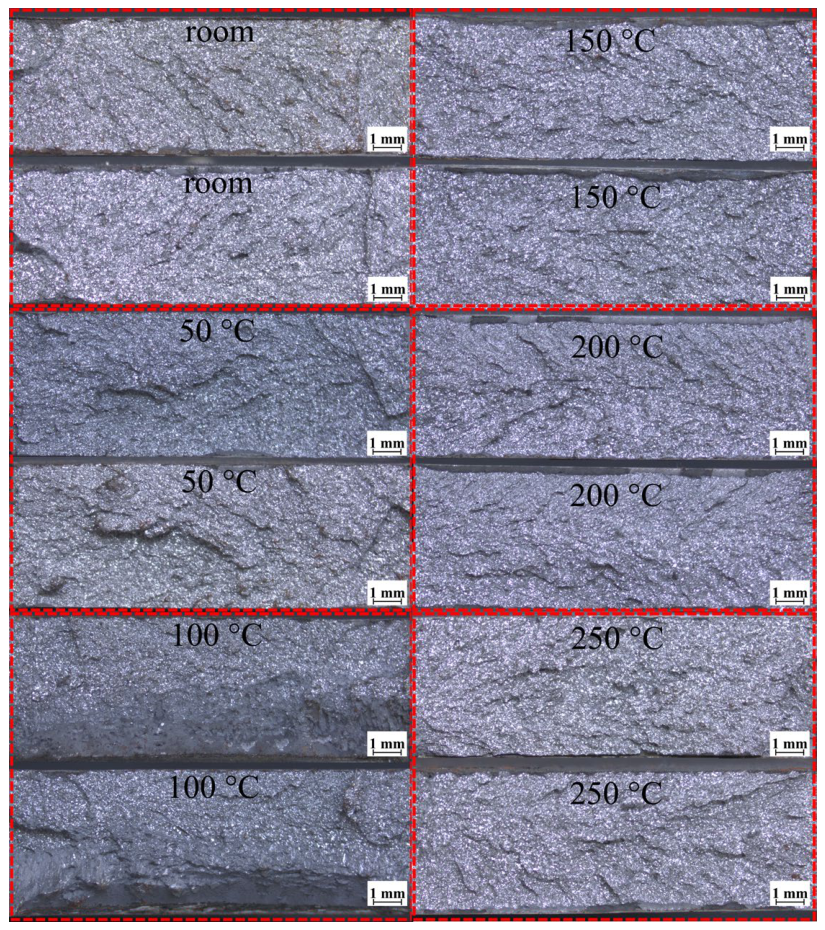
Figure 9 documents the macroscopic fracture location of the tensile specimens after testing. The images are intended only to document fracture location and the overall macroscopic appearance of the failed specimens and are not presented as fracture-surface characterization. Qualitative observations indicated extensive plastic deformation, consistent with failure occurring in the BM. However, no detailed fractographic characterization was performed.
For the conventional single-pass conditions, Charpy V-notch absorbed energy did not exhibit a systematic relationship with preheating temperature (
Figure 8). Because ASTM E23 subsize specimens (5 mm thickness) were employed, the reported absorbed energies correspond to the measured subsize specimens and should not be interpreted as equivalent to full-size Charpy energies. One-way ANOVA restricted to the conventional single-pass conditions showed no statistically significant effect of preheating condition on Charpy absorbed energy, F(5,12) = 2.35,
p = 0.105, partial
= 0.494 (
Table 9). Consistent with the non-significant ANOVA result, Tukey HSD pairwise comparisons identified no significant differences among the six conventional single-pass conditions, which therefore belonged to the same statistical group.
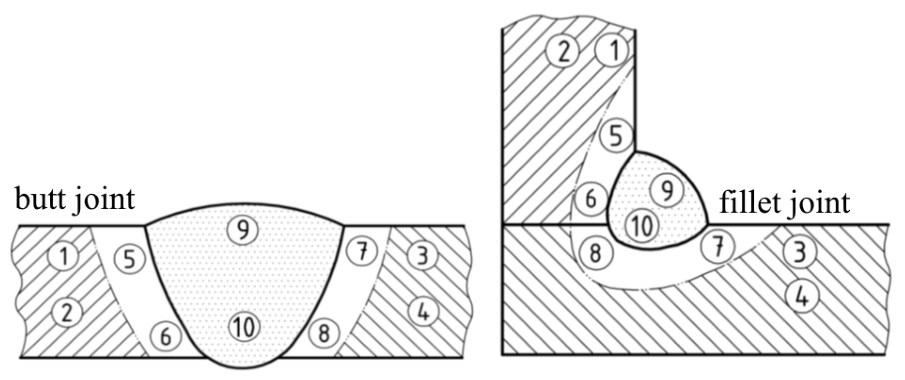
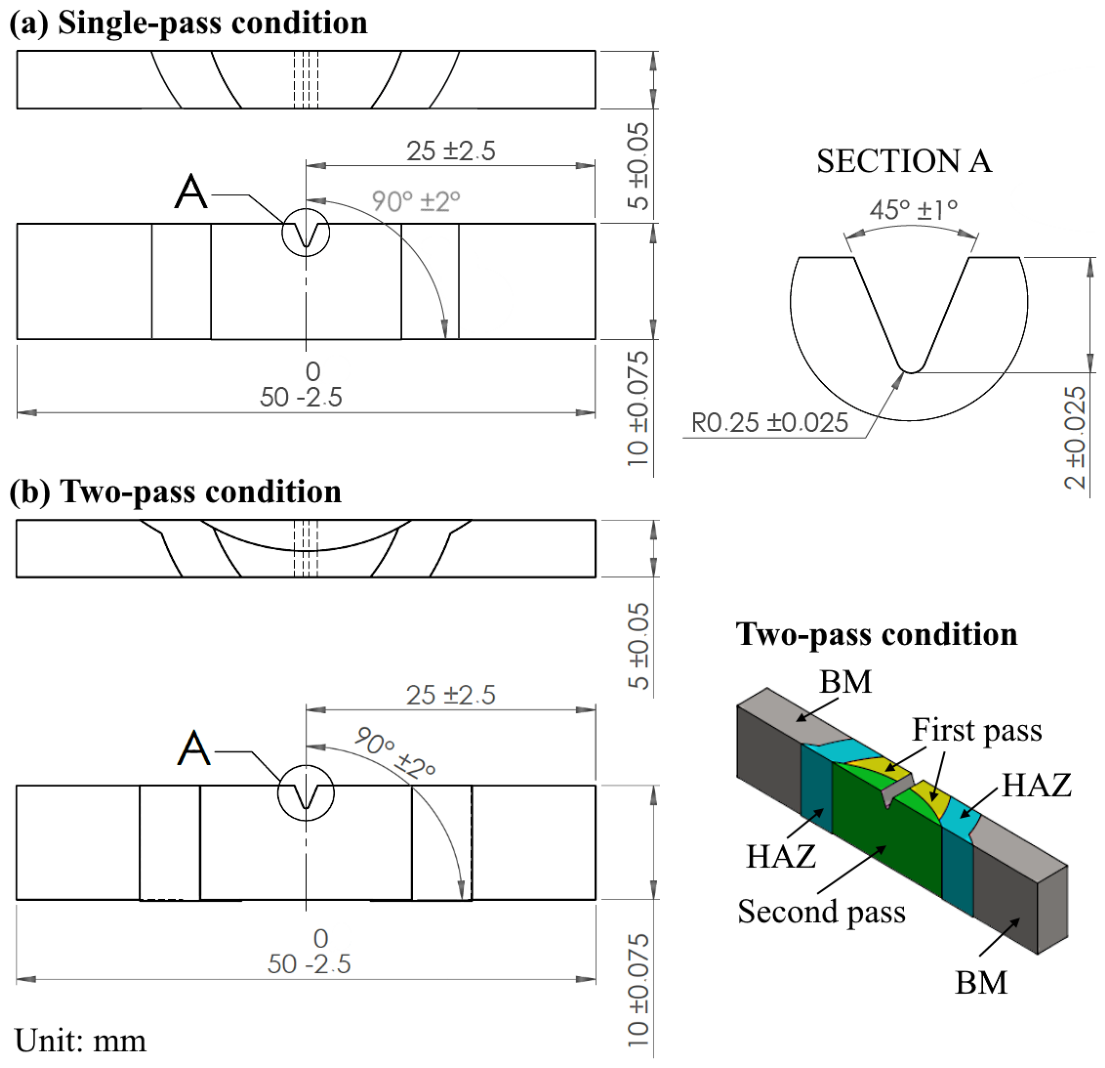
The additional two-pass procedure produced an absorbed energy of 58.86 ± 4.28 J, which was numerically higher than those measured for the conventional single-pass conditions. However, the two-pass procedure was not included in the preheating-condition ANOVA because deposition of the second bead simultaneously changed the number of passes, deposited filler-metal volume, cumulative heat input, weld geometry, and potentially dilution. As illustrated schematically in
Figure 4b, the reported notch location refers to the evaluated WM region of the completed two-pass configuration and should be regarded as approximate rather than as documentation of its exact position relative to each individual bead. The higher absorbed energy therefore represents the response of the complete two-pass welding procedure and should not be interpreted as an effect of preheating temperature or of an isolated secondary thermal cycle.
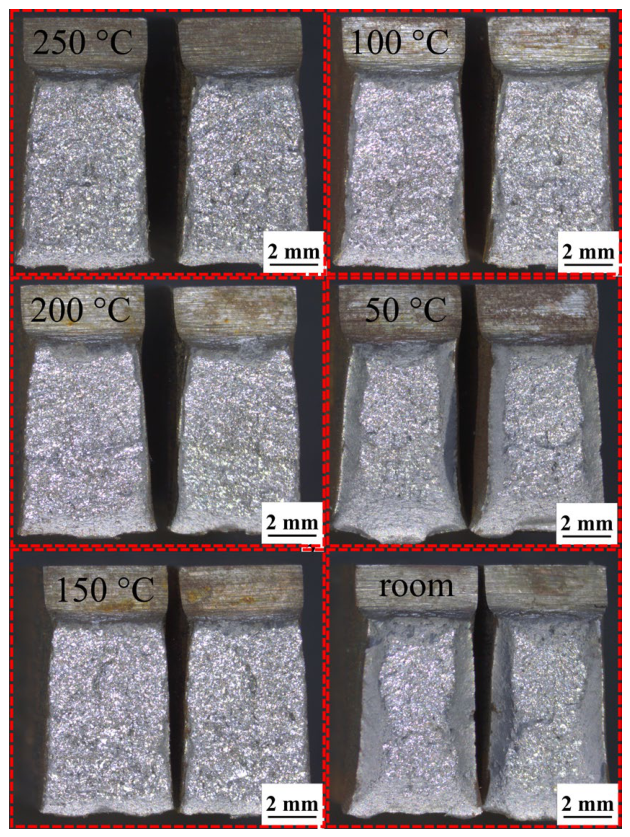
Figure 10 presents qualitative macroscopic observations of the fractured Charpy specimens after impact testing. Because no quantitative fractographic analysis or higher-resolution examination was performed, these images are intended only for qualitative comparison among the investigated conditions and not for definitive identification of fracture mechanisms [
5,
26].
For the mechanical properties, the inferential analyses were restricted to the conventional single-pass conditions. No statistically significant effect of preheating condition was detected for either UTS (F(5,12) = 1.66, p = 0.218) or Charpy absorbed energy (F(5,12) = 2.35, p = 0.105). Residual normality and variance homogeneity were not rejected for UTS (Shapiro–Wilk W = 0.915, p = 0.103; Levene F(5,12) = 1.955, p = 0.158) or Charpy absorbed energy (Shapiro–Wilk W = 0.943, p = 0.328; Levene F(5,12) = 1.068, p = 0.425). The two-pass procedure was evaluated separately and produced the highest numerical Charpy absorbed energy, but this result represents the combined response of the additional welding procedure and was not included in the preheating-condition ANOVA.




 ,
,