Article

Influence of Heat Input and Strength Matching on the Microstructure and Mechanical Properties of GMAW Butt-Welded S700MC High-Strength Low-Alloy Steel

by
João Ricardo Boff Preichardt
1,
Rafael Luciano Dalcin
2,*,
Richard Thomas Lermen
3 and
Ivan Guerra Machado
4
1
SSAB EMEA AB, 11164 Stockholm, Sweden
2
Mechanical Engineering Department, Horizontina College (FAHOR), Horizontina 98920-000, RS, Brazil
3
Postgraduate Program of Architecture and Urbanism, School of Engineering and Applied Sciences, Atitus Education, Passo Fundo 99070-220, RS, Brazil
4
Welding Technology Consultant, Porto Alegre 90430-080, RS, Brazil
*
Author to whom correspondence should be addressed.
J. Manuf. Mater. Process. 2026, 10(7), 230; https://doi.org/10.3390/jmmp10070230
Submission received: 11 June 2026 / Revised: 27 June 2026 / Accepted: 29 June 2026 / Published: 30 June 2026
(This article belongs to the Special Issue Advances in Dissimilar Metal Joining and Welding, 2nd Edition)

Abstract

High-strength low-alloy (HSLA) steels produced by thermomechanical controlled processing (TMCP) are widely used in structural applications because of their high strength and weldability. However, the performance of welded joints is strongly affected by welding thermal cycles. This study investigated the effects of heat input (0.6, 1.4, and 1.8 kJ/mm) and filler metal strength (matching and undermatching) on the microstructure and mechanical properties of S700MC steel joints produced by metal-cored arc welding (MCAW). Microstructural characterization, hardness measurements, tensile testing, Charpy impact testing, and analysis of variance (ANOVA) were performed. Heat input was identified as the dominant factor controlling heat-affected zone (HAZ) development and mechanical performance. Increasing heat input enlarged the HAZ and reduced hardness through enhanced microstructural recovery. Filler metal strength mainly influenced failure location and joint strength. The lowest heat input (0.6 kJ/mm) provided the highest strength retention, particularly with the matching consumable, but also produced localized hardness peaks approaching 400 HV0.01 at the weld metal (WM)/HAZ interface, reducing ductility and impact toughness. An intermediate heat input (1.4 kJ/mm) produced the best balance between strength and toughness by promoting a more homogeneous microstructure and smoother hardness distribution. These results provide practical guidance for optimizing welding procedures for TMCP HSLA steels.

1. Introduction

Structural steels remain essential for load-bearing applications due to their favorable combination of mechanical strength, manufacturability, and cost-effectiveness [1,2,3]. Although conventional C–Mn steels have historically dominated these applications [4,5,6], increasing demands for weight reduction, energy efficiency, and improved structural performance have driven the widespread adoption of HSLA steels in advanced engineering applications [7,8,9].
Among these materials, HSLA steels produced by TMCP exhibit an excellent combination of high yield strength, ductility, and weldability [10,11,12,13]. Their mechanical performance is achieved through grain refinement, increased dislocation density, and precipitation strengthening induced by microalloying elements such as Nb, Ti, and V [14,15]. As a result, TMCP steels can reach yield strengths exceeding 700 MPa while maintaining adequate formability and toughness [16,17,18], making them particularly suitable for heavy-duty transport and structural applications [7,19].
Despite these advantages, the mechanical performance of welded joints in TMCP steels remains highly sensitive to welding thermal cycles [20,21,22]. During welding, rapid heating and cooling alter the stability of strengthening mechanisms and significantly modify the microstructure of the HAZ [14,23,24]. In particular, HAZ softening is commonly associated with precipitate dissolution and coarsening [25,26], as well as recovery of the strain-hardened ferritic matrix [21,27]. Conversely, high cooling rates may promote the formation of martensitic or bainitic constituents, especially in the coarse-grained HAZ (CGHAZ) or near the WM/HAZ interface, leading to increased hardness and reduced fracture toughness [17,28].
Heat input is one of the most critical welding parameters controlling peak temperature, cooling rate, and HAZ extension [29,30]. Higher heat inputs generally result in wider softened regions and enhanced microstructural recovery, whereas lower heat inputs restrict HAZ growth but may promote the formation of hard and brittle microconstituents due to accelerated cooling [31,32,33]. In parallel, the selection of filler metal strength—whether matching or undermatching relative to the base metal—plays a key role in stress redistribution across the joint and in determining the location of the mechanically critical region [34,35].
Although previous studies have demonstrated that heat input strongly influences HAZ softening, microstructural evolution, and mechanical performance of S700MC welded joints, most investigations have been conducted using a single filler metal condition [29,36]. Consequently, the combined effects of heat input and strength matching on the process–microstructure–property relationship remain insufficiently understood. In particular, systematic comparisons involving matching and undermatching consumables combined with comprehensive evaluations of hardness, tensile behavior, impact toughness, fracture mechanisms, and statistical significance are still scarce.
In the welding of HSLA steels, filler metal selection is commonly based on the desired strength-matching strategy relative to the base metal. Matching consumables are frequently selected to maximize joint strength and load-carrying capacity, whereas undermatching consumables may be employed to improve toughness, reduce stress concentrations, and promote plastic deformation within the weld metal rather than in the heat-affected zone [34]. Overmatching consumables are also used in demanding structural applications where maximum strength is required [35]. Consequently, filler metal selection involves balancing strength, toughness, ductility, and service requirements. Despite the widespread industrial use of these different matching strategies, limited information is available regarding their interaction with heat input during welding of S700MC steel [37].
Therefore, the present study aims to investigate the coupled effects of heat input (0.6, 1.4, and 1.8 kJ/mm) and filler metal strength (matching and undermatching conditions) on the microstructural evolution, hardness distribution, tensile behavior, and impact toughness of S700MC butt-welded joints produced by robotic MCAW. By combining experimental characterization with statistical analysis (ANOVA), this work establishes a direct process–microstructure–property relationship and provides a practical framework for optimizing welding parameters in TMCP HSLA steels, aiming to achieve an improved balance between strength and toughness under demanding service conditions.

2. Materials and Methods

2.1. Materials

The base metal (BM) used in this study was a 10 mm thick TMCP S700MC HSLA steel plate. This steel is microalloyed with Nb, Ti, and Mo [17], promoting grain refinement through precipitation strengthening and controlled phase transformation. The chemical composition, determined by optical emission spectroscopy, is presented in Table 1 and is in accordance with EN 10149-2 [38].
The base metal was supplied in the as-received TMCP condition without any additional heat treatment prior to welding. This condition was maintained throughout the experimental program to ensure that the observed microstructural and mechanical changes were exclusively associated with the welding thermal cycle.
The mechanical properties of the base metal were obtained by tensile testing following ASTM E8/E8M [39], including yield strength (0.2% offset), ultimate tensile strength, and total elongation. Vickers hardness (HV3) was measured according to ASTM E384 [40]. The results are summarized in Table 2.

2.2. Welding Procedure

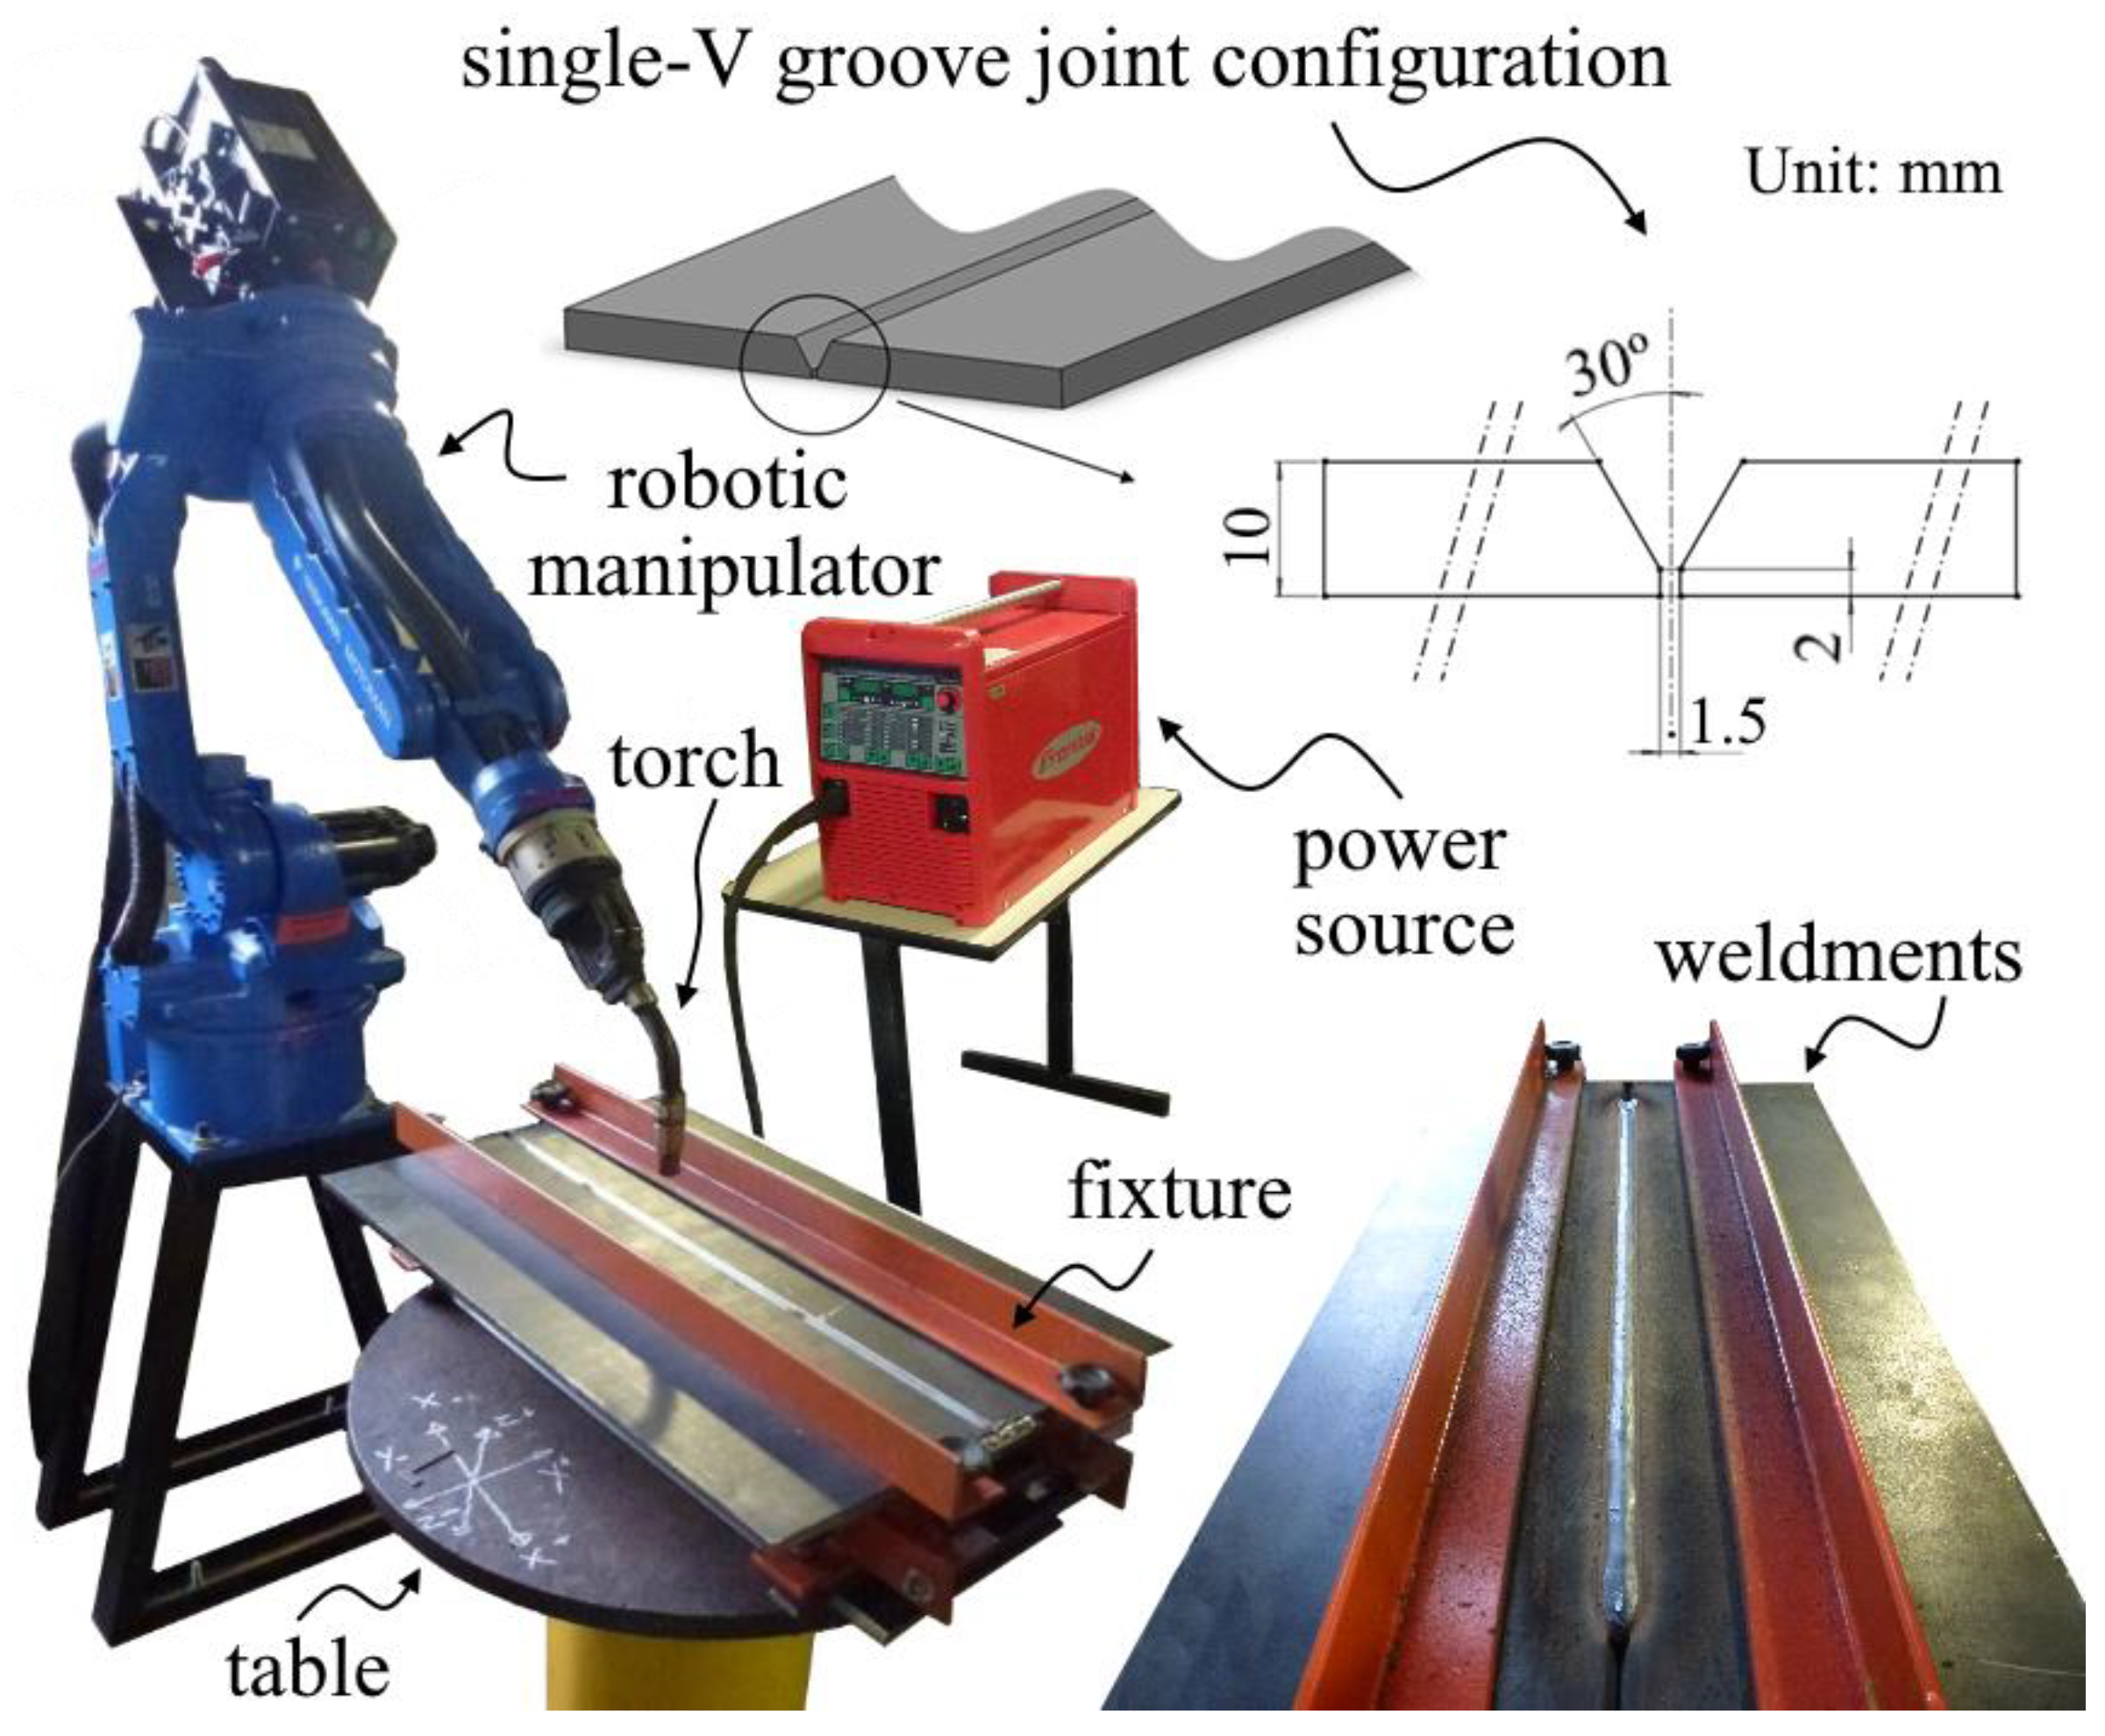
Rectangular plates (200 × 650 mm) were machined transverse to the rolling direction and assembled using a single-V groove configuration with a root opening of 1.5 mm (Figure 1). Welding was performed by robotic metal-cored arc welding (MCAW) using a Yaskawa Motoman MA1400 robotic manipulator (Yaskawa Electric Corporation, Kitakyushu, Japan) coupled with a Trans Plus Synergic 4000 power source (Fronius International GmbH, Pettenbach, Austria). A shielding gas mixture of 75% Ar and 25% CO2 was used at a constant flow rate of 15 L/min.
Two filler wires with a diameter of 1.2 mm were selected to represent different strength-matching conditions: undermatching (E70C-6M) and matching (E110C-G). Their nominal chemical compositions and mechanical properties are provided in Table 3 and Table 4. The E70C-6M filler metal was selected to represent an undermatching condition, whereas the E110C-G consumable was selected to provide a matching condition relative to the nominal yield strength of the S700MC steel. To quantify the degree of strength matching, a mismatch ratio (M) was calculated using Equation (1) as the ratio between the nominal WM yield strength and the BM yield strength. Based on the values reported in Table 2 and Table 4, the E70C-6M consumable exhibited a mismatch ratio of 0.6, while the E110C-G consumable exhibited a mismatch ratio of 1.0, which was considered representative of a matching condition for the purposes of this study.
M = σ W M σ B M ,
where σ W M and σ B M are the WM and BM yield strengths, respectively.
No preheating was applied. According to the steel manufacturer’s recommendations [7], preheating is not required for 10-mm-thick S700MC steel under the selected welding conditions. Welding was performed under controlled laboratory conditions (25 ± 2 °C and 55 ± 5% relative humidity). Prior to welding, the groove surfaces and adjacent regions were mechanically cleaned and degreased with acetone to remove oxides, moisture, grease, and other contaminants.
Three nominal heat input levels were defined: 0.6 kJ/mm (low), 1.4 kJ/mm (intermediate), and 1.8 kJ/mm (high), based on steel manufacturer recommendations [7]. These heat input levels represent welding thermal cycles commonly used for industrial fabrication of TMCP HSLA steels. The selected heat inputs were intended to represent low, intermediate, and high thermal severity, allowing systematic evaluation of their effects on microstructure and mechanical performance. The nominal heat input (HI) was calculated according to Equation (2):
H I = U . I v ,
where U is the arc voltage (V), I is the welding current (A), and ν is the welding speed (mm/s).
Arc efficiency was intentionally not included in the heat input calculation because all weldments were produced using the same MCAW process, equipment, shielding gas, and welding configuration. Under these conditions, arc efficiency was assumed to remain constant; therefore, nominal heat input provided a consistent basis for comparing the relative thermal severity of the investigated welding conditions rather than the absolute heat transferred to the workpiece.
Six weldments were produced: U06, U14, and U18 (undermatching) and M06, M14, and M18 (matching). The root pass was fixed at 0.6 kJ/mm for all conditions to ensure consistent penetration. Low heat input conditions (U06 and M06) were produced using four passes, whereas intermediate and higher heat input conditions were produced using two passes. The detailed welding parameters are listed in Table 5. All welds were performed without preheating under controlled laboratory conditions.

2.3. Microstructural Characterization

All welds were initially inspected by visual examination, and samples containing macroscopic defects (e.g., porosity, lack of fusion, or undercut) were discarded. Specimens were sectioned transverse to the welding direction, mounted, ground using SiC papers up to 2000-grit, and polished with diamond suspension. Etching was performed using 2% Nital for 5–6 s.
Microstructural characterization was carried out by optical microscopy to identify BM, intercritical HAZ (ICHAZ), fine-grained HAZ (FGHAZ), coarse-grained HAZ (CGHAZ), and WM. Grain size measurements were performed according to ASTM E112 [41] using the linear intercept method.
The areas of CGHAZ and FGHAZ were quantified from macrographs using ImageJ software, version 1.4.3.67. The total HAZ area was calculated as the sum of these regions.

2.4. Hardness Measurements

Vickers hardness profiles (HV3) were measured 2 mm below the plate surface across the BM, HAZ, and WM to characterize the overall hardness distribution, following ASTM E384 [40]. Complementary microhardness measurements (HV0.01) were carried out at the WM/CGHAZ interface to identify localized hardness peaks associated with rapid cooling and phase transformation.

2.5. Tensile Testing

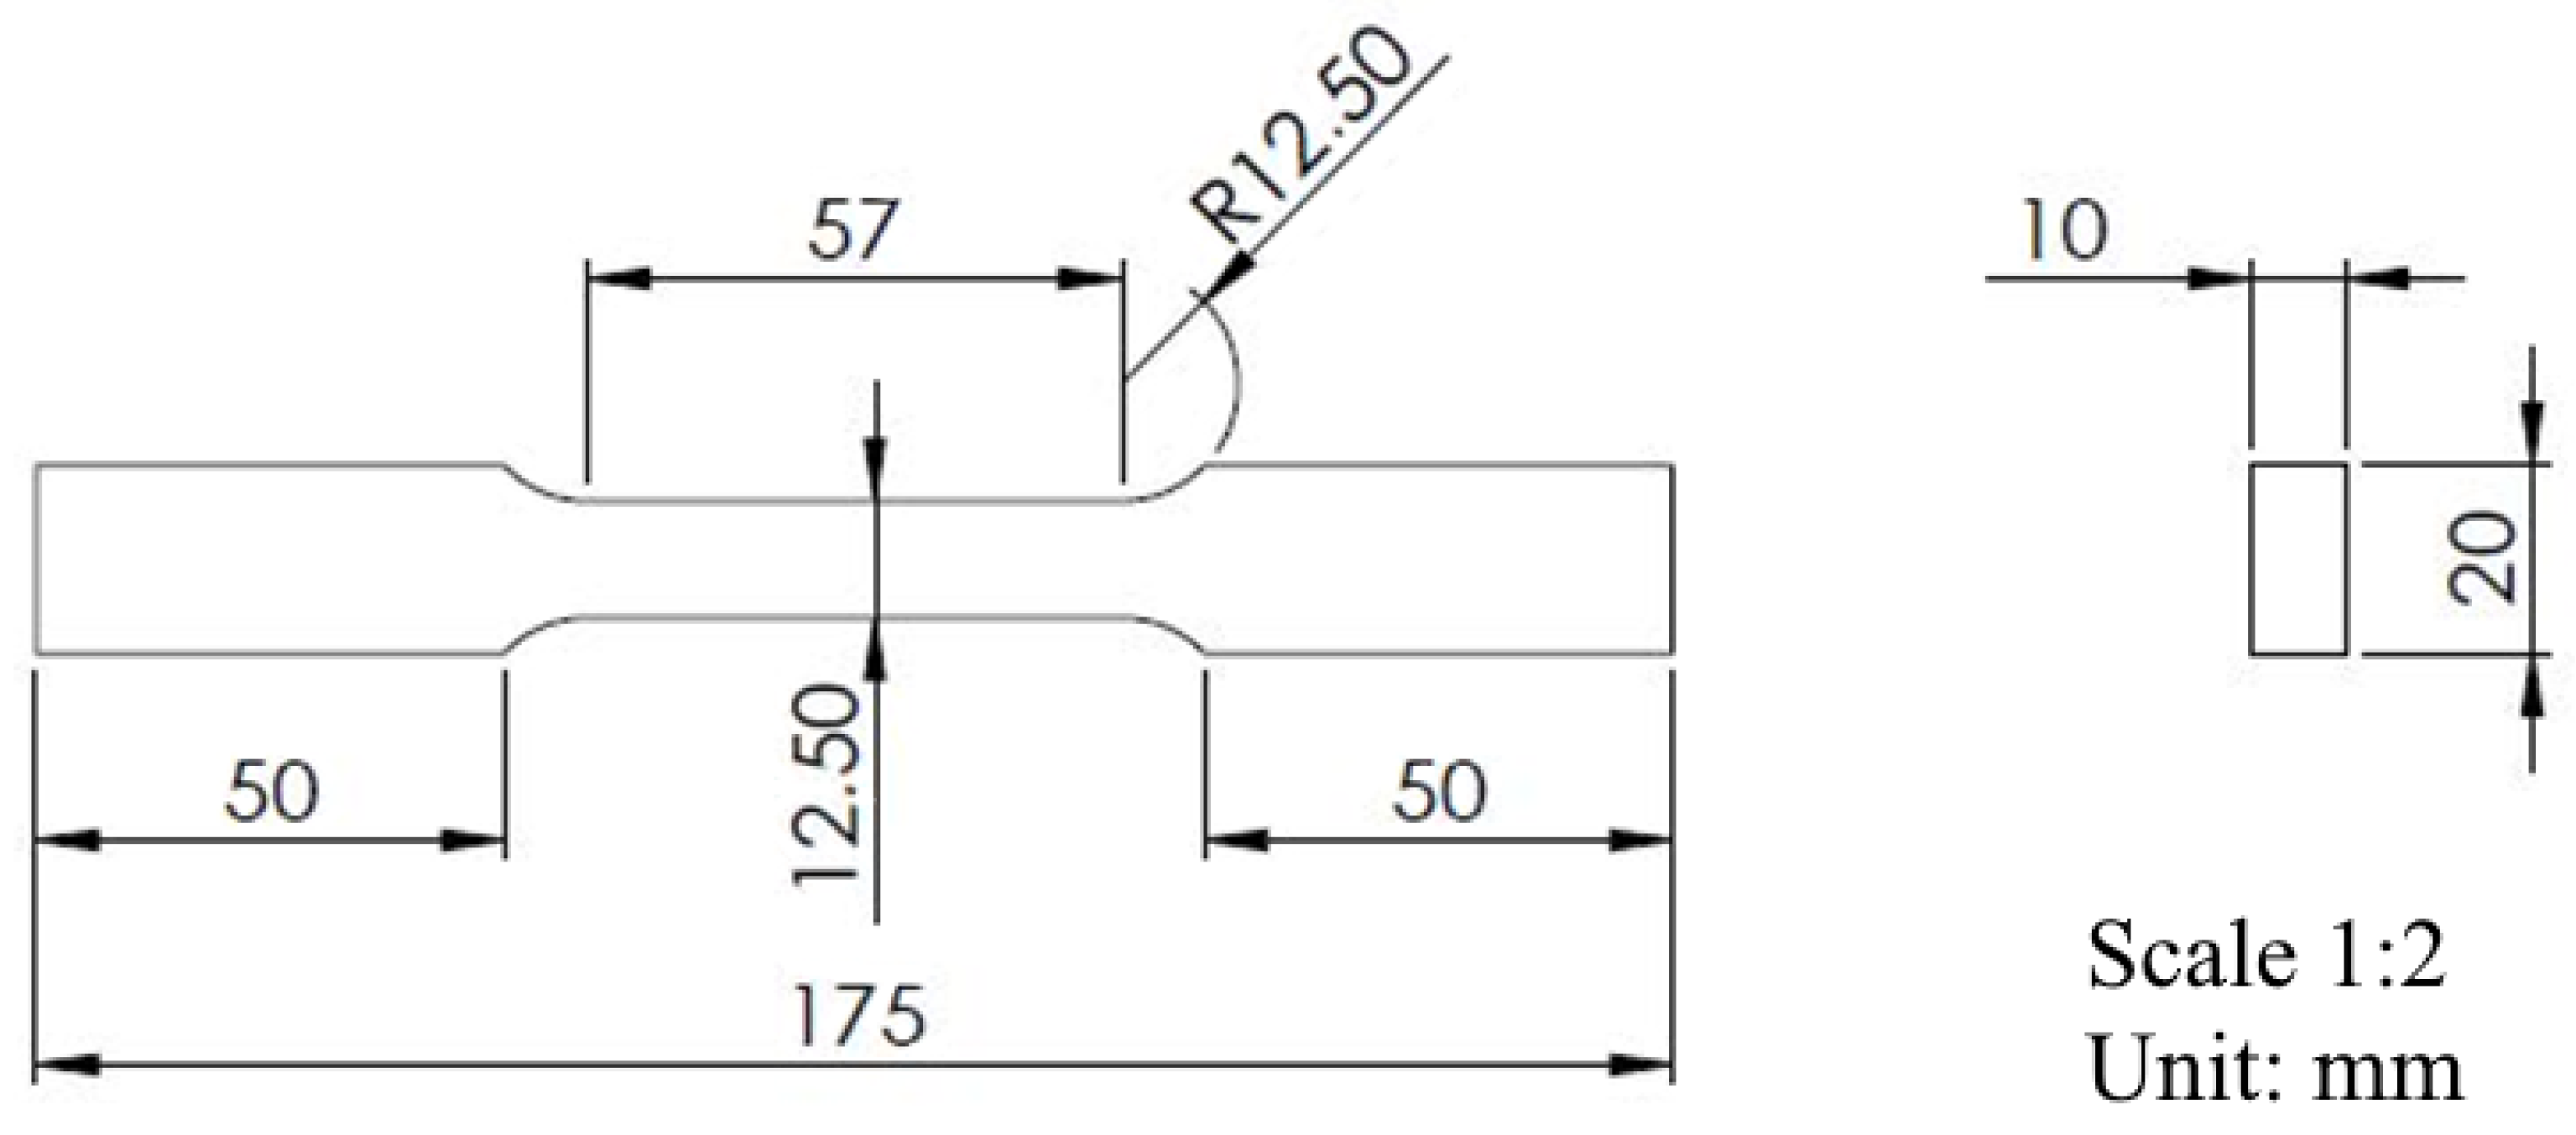
Transverse tensile specimens were machined according to ASTM E8/E8M [39], with the weld centerline located at the midpoint of the reduced section (Figure 2). Tensile tests were conducted at room temperature under displacement control using a constant crosshead speed of 0.75 mm/min.
Yield strength (0.2% offset), ultimate tensile strength, and total elongation were determined. At least three specimens were tested for each welding condition. The fracture location (BM, HAZ, or WM) was identified after testing.

2.6. Impact Testing

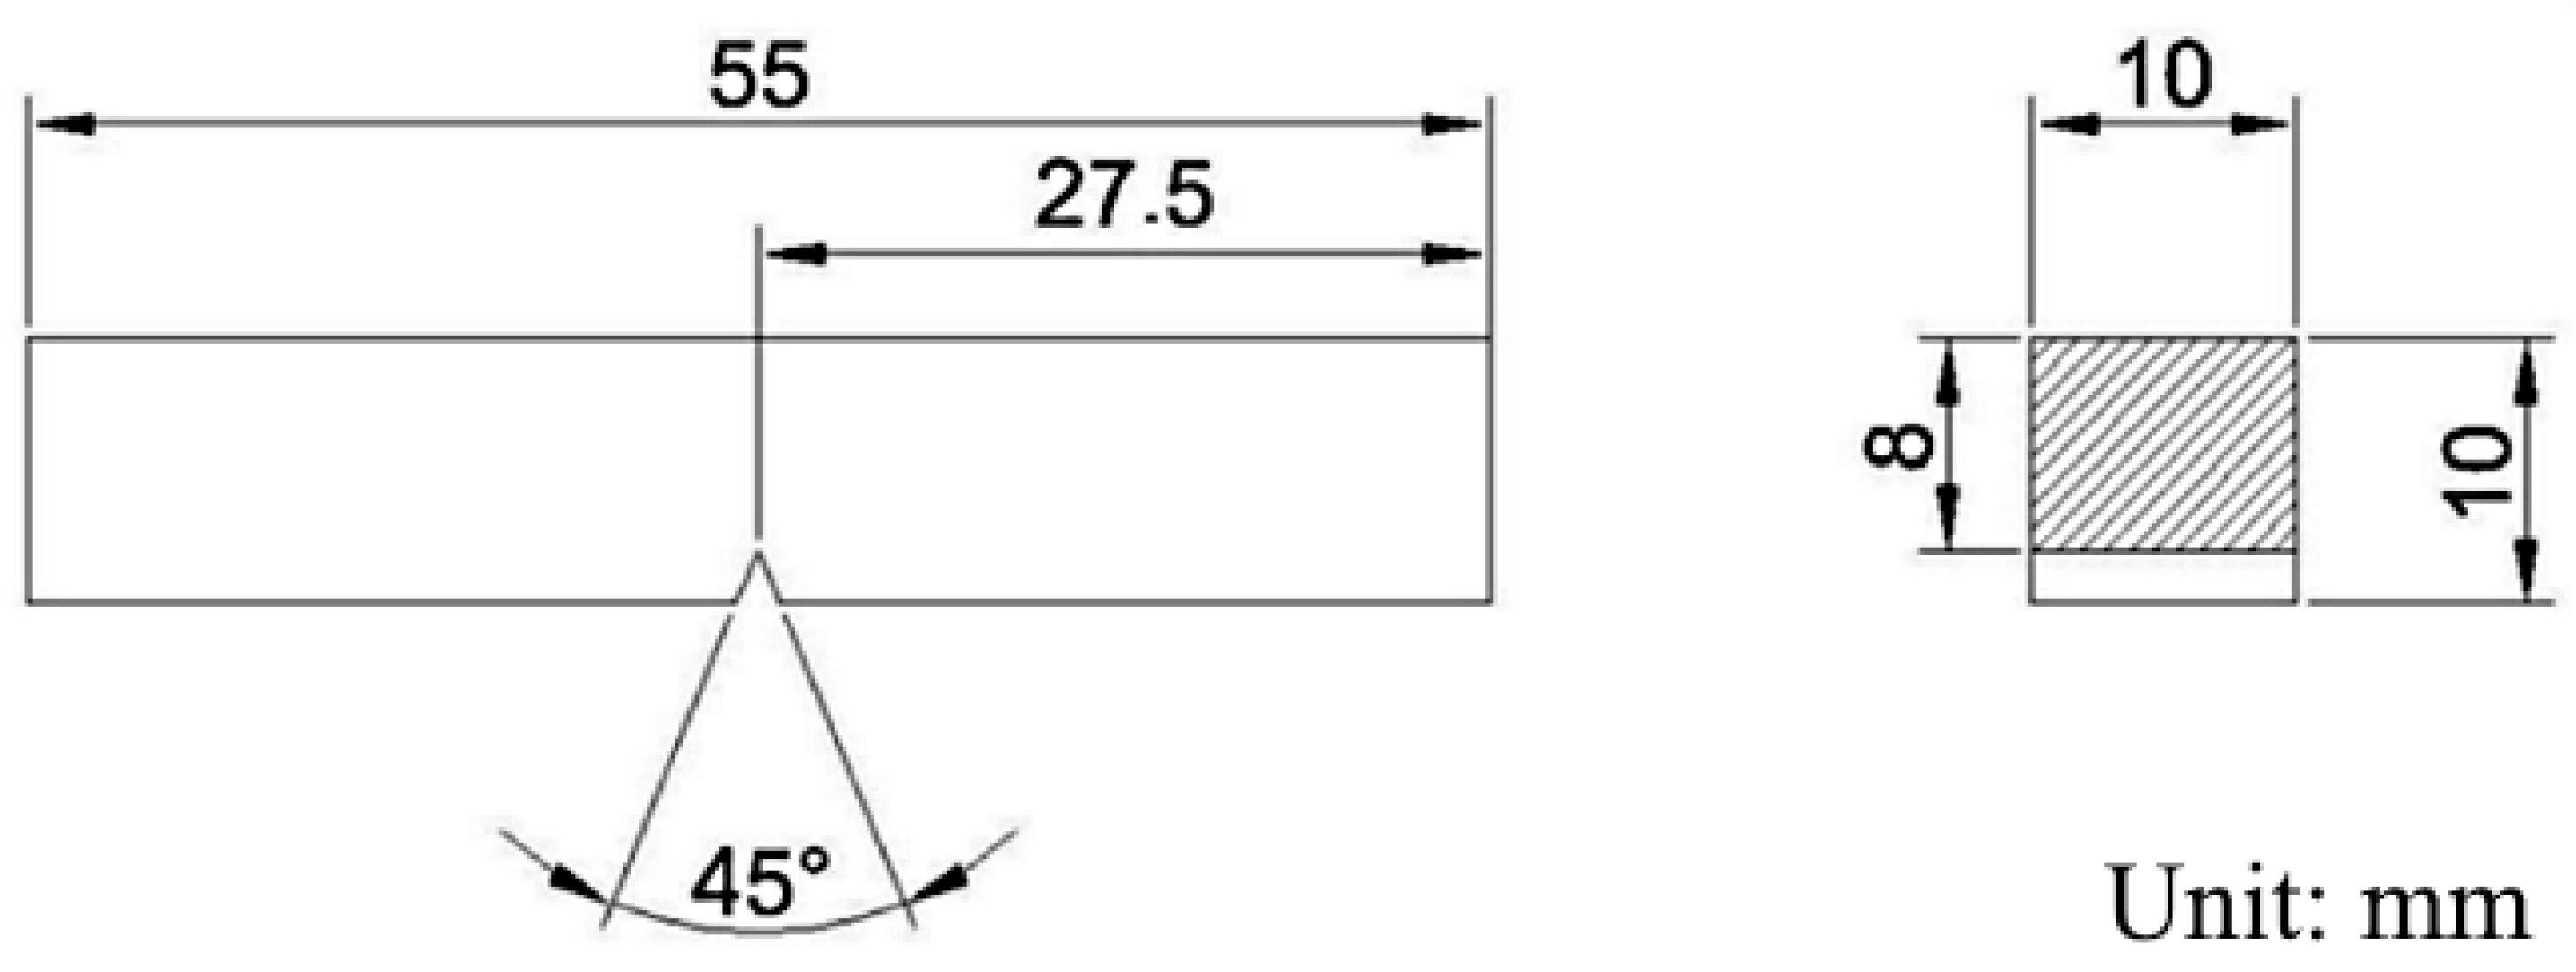
Charpy V-notch impact specimens were machined and tested in accordance with ASTM E23 [42]. The specimens had standard dimensions of 10 mm × 10 mm × 55 mm and contained a V-notch with a depth of 2 mm, a 45° opening angle, and a root radius of 0.25 mm. The notch was positioned at the WM centerline, as illustrated in Figure 3. Impact tests were performed at 20 °C, −20 °C, and −40 °C. For each welding condition and test temperature, four specimens were evaluated, and the absorbed energy was recorded. Following testing, the fracture surfaces were examined by scanning electron microscopy (SEM) to characterize the fracture mechanisms and correlate them with the observed impact toughness behavior.

2.7. Statistical Analysis

The effects of heat input and joint configuration on the microstructural and mechanical properties were evaluated using analysis of variance (ANOVA) at a 95% confidence level (α = 0.05).
For responses independent of the base metal (i.e., CGHAZ area, FGHAZ area, and WM hardness), a two-way ANOVA was performed to assess the main effects of heat input and filler metal strength, as well as their interaction.
For responses including the BM as a reference (i.e., HAZ hardness, tensile properties, and impact resistance), a one-way ANOVA was conducted considering the welding condition as a single factor, combining heat input and filler metal strength levels.
When statistically significant differences were identified (p-value < α = 0.05), Tukey’s honestly significant difference (HSD) post hoc test was applied to identify statistically distinct groups among welding conditions. Graphical analysis was also used to support the interpretation of differences between conditions.

3. Results

3.1. Effect of Heat Input on Weld Geometry and Microstructural Evolution

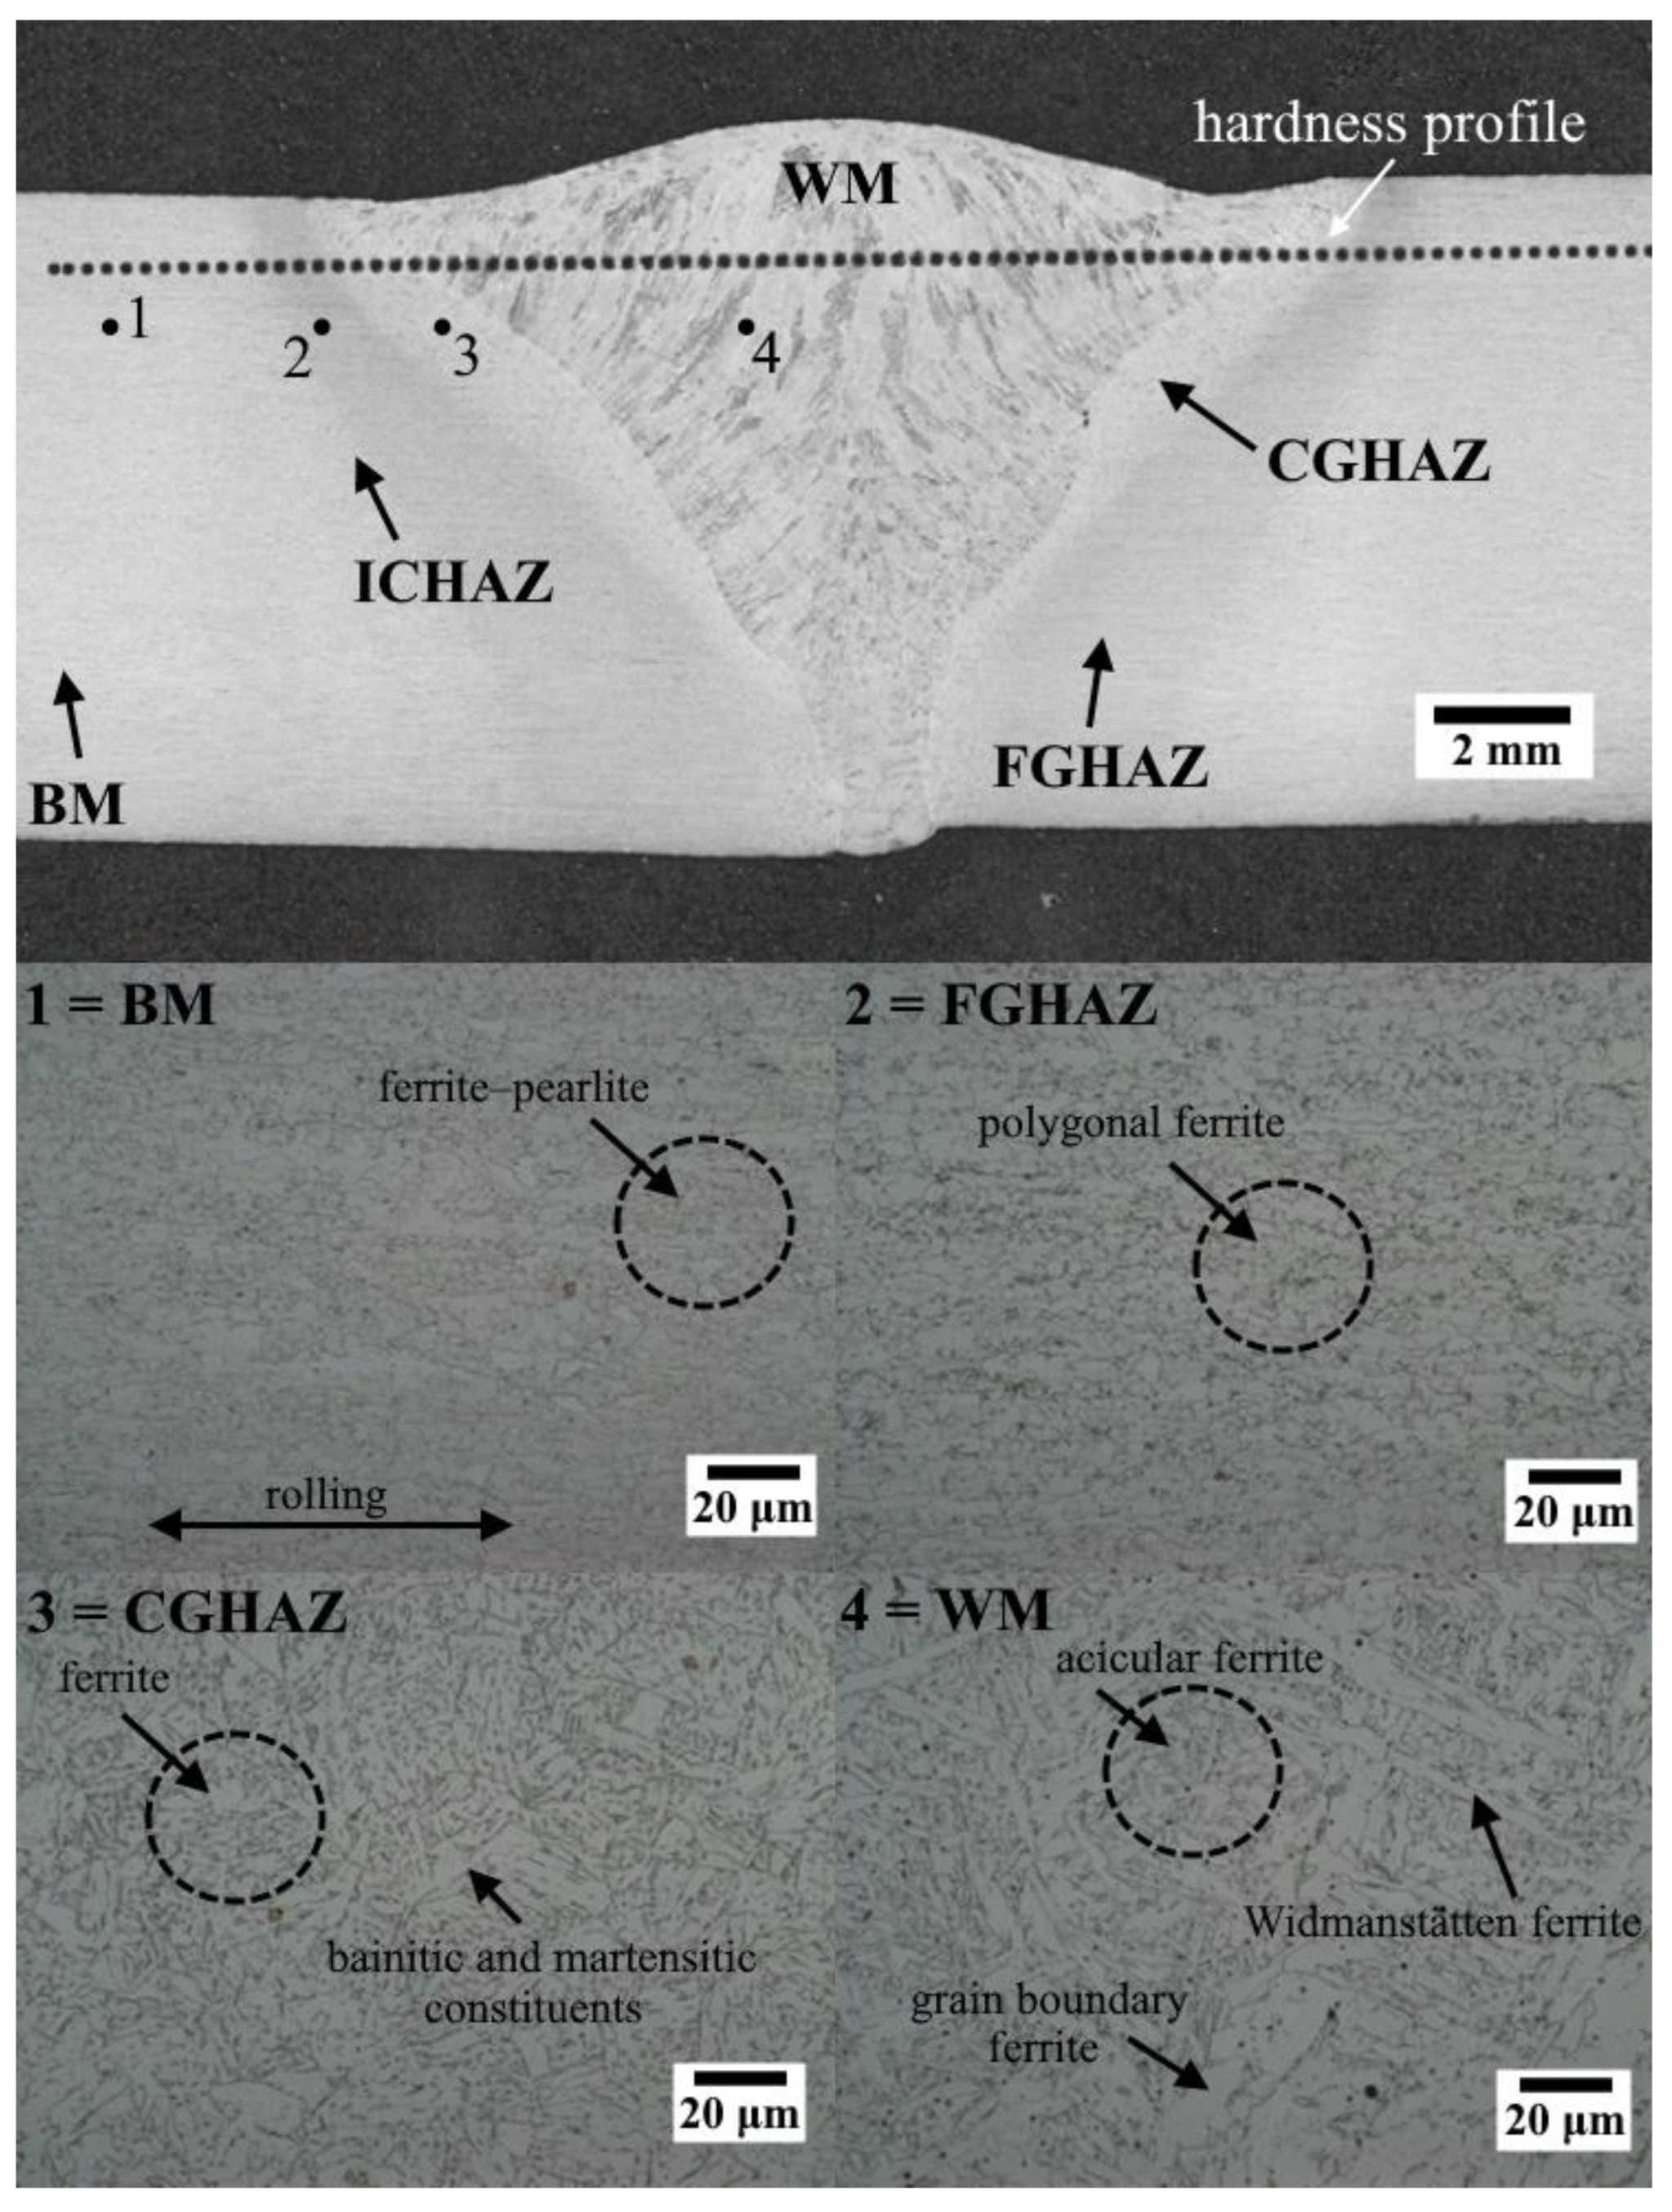
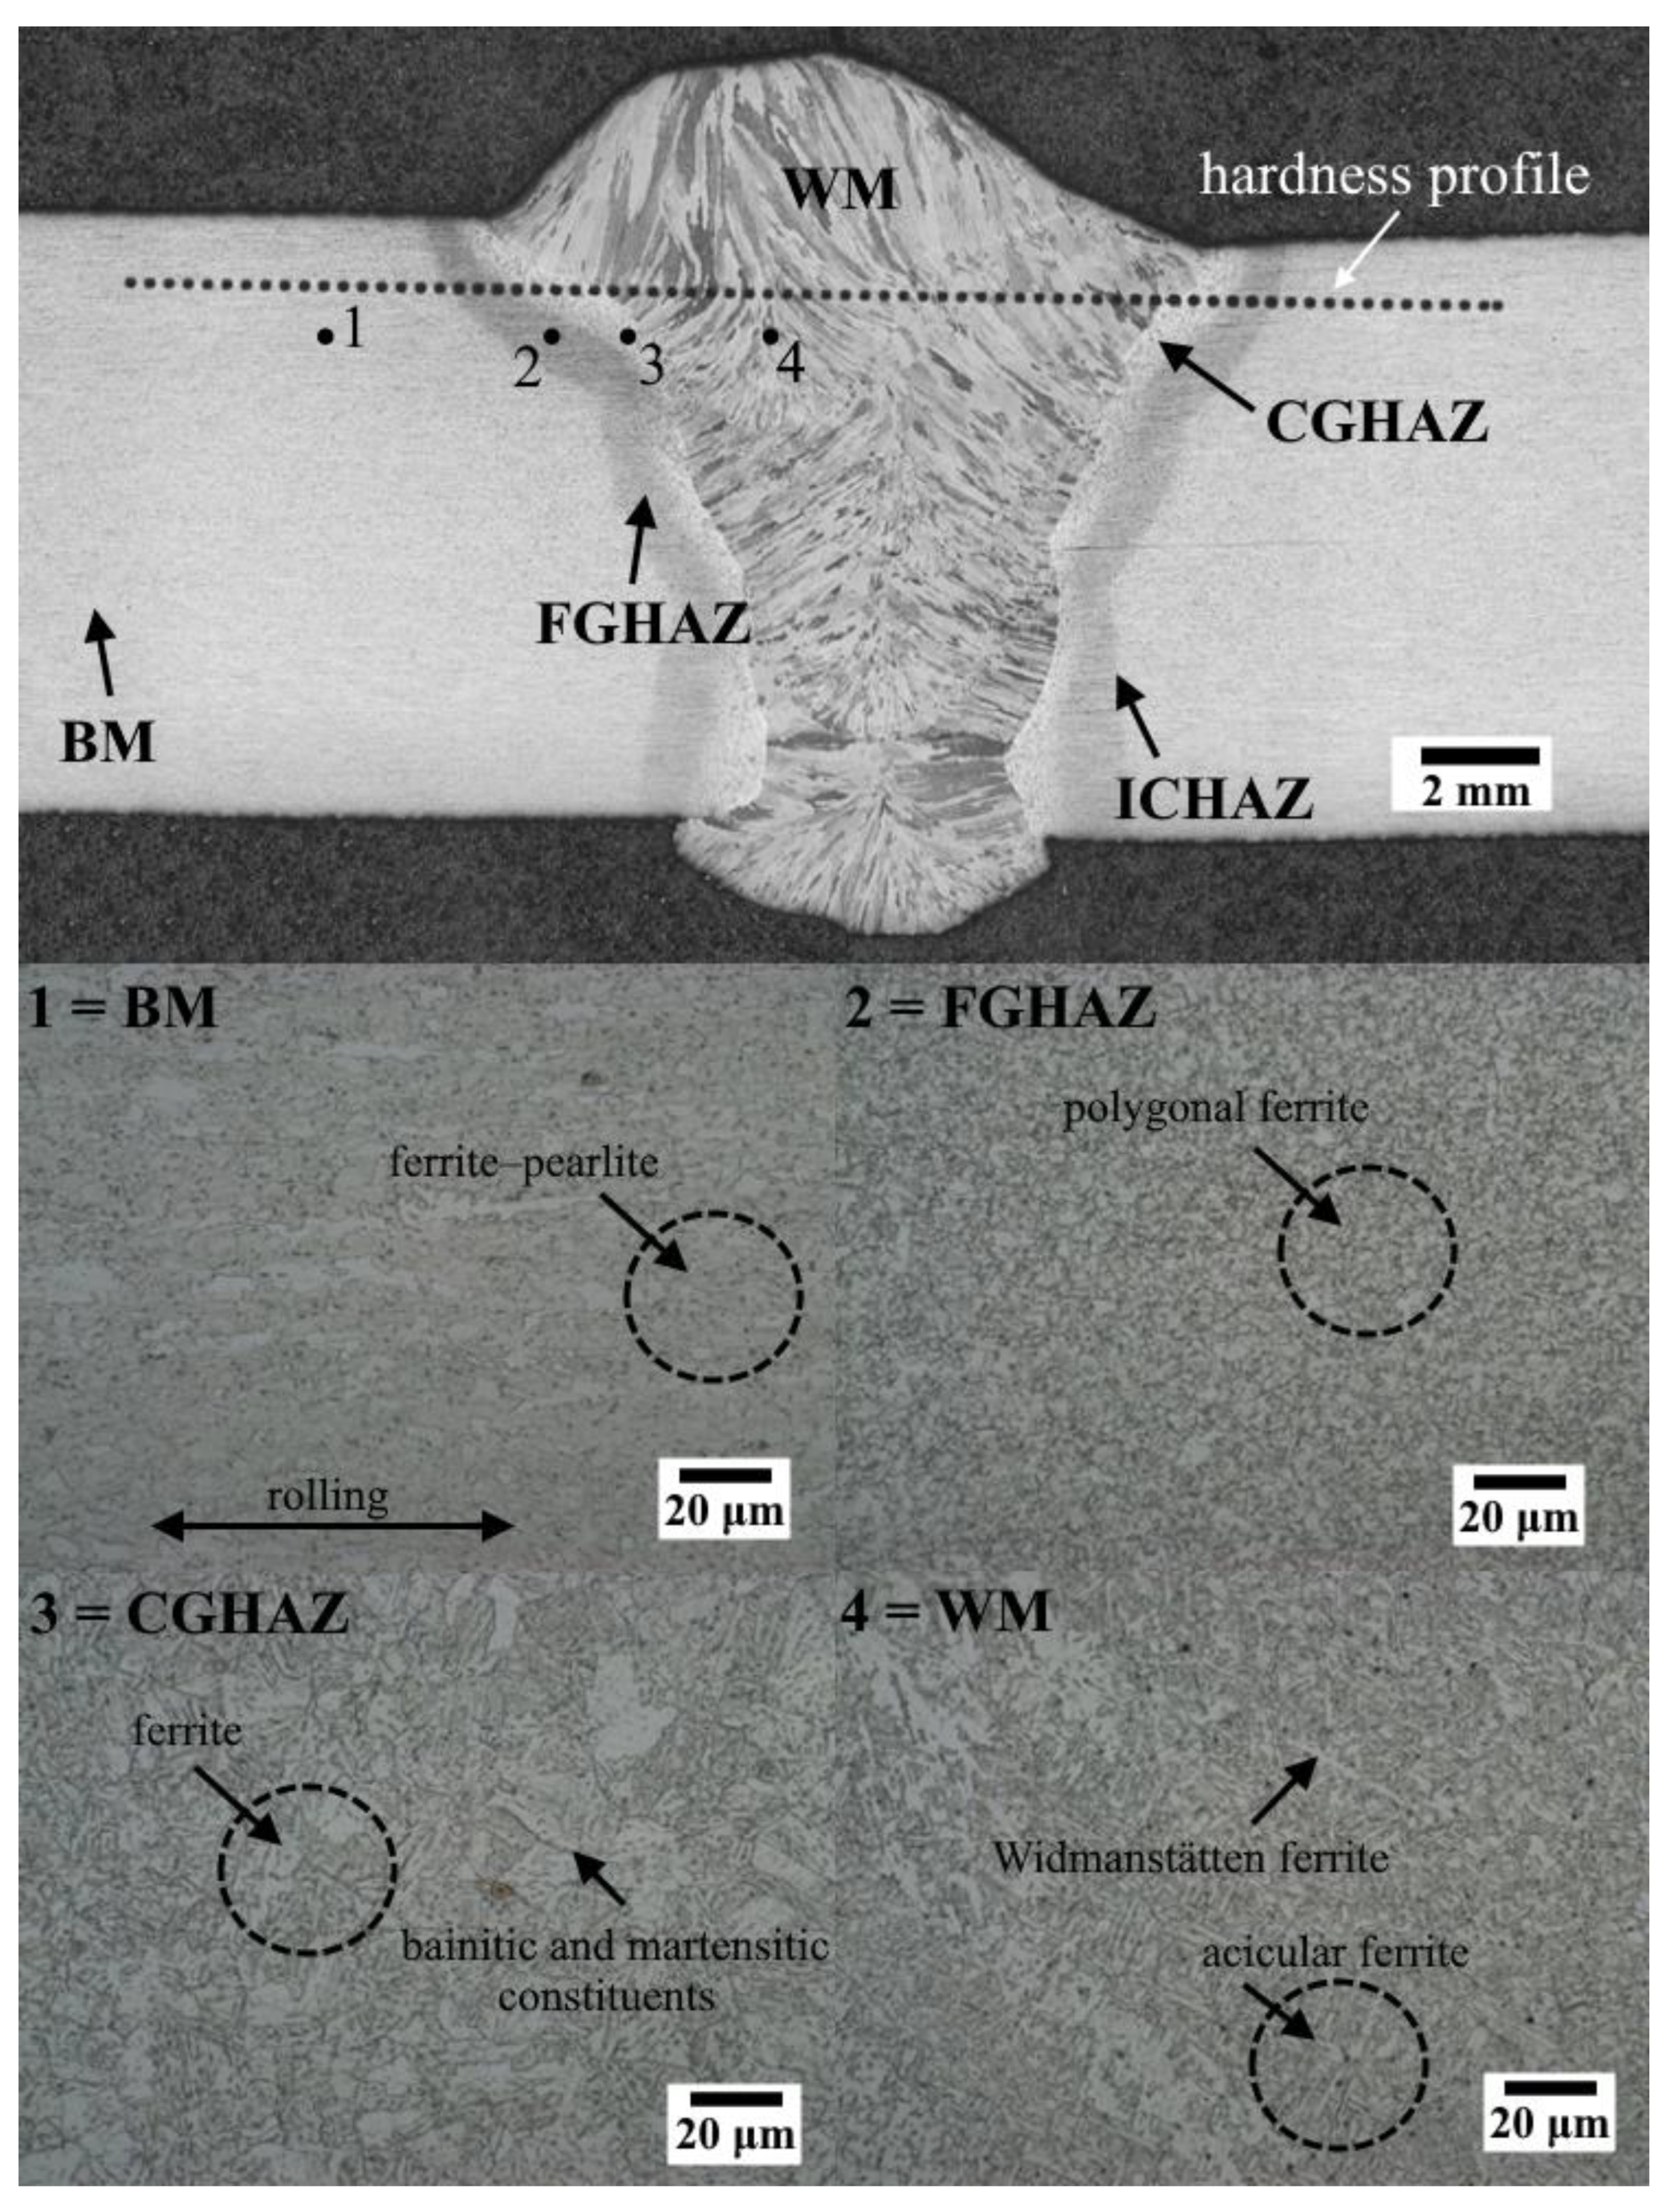
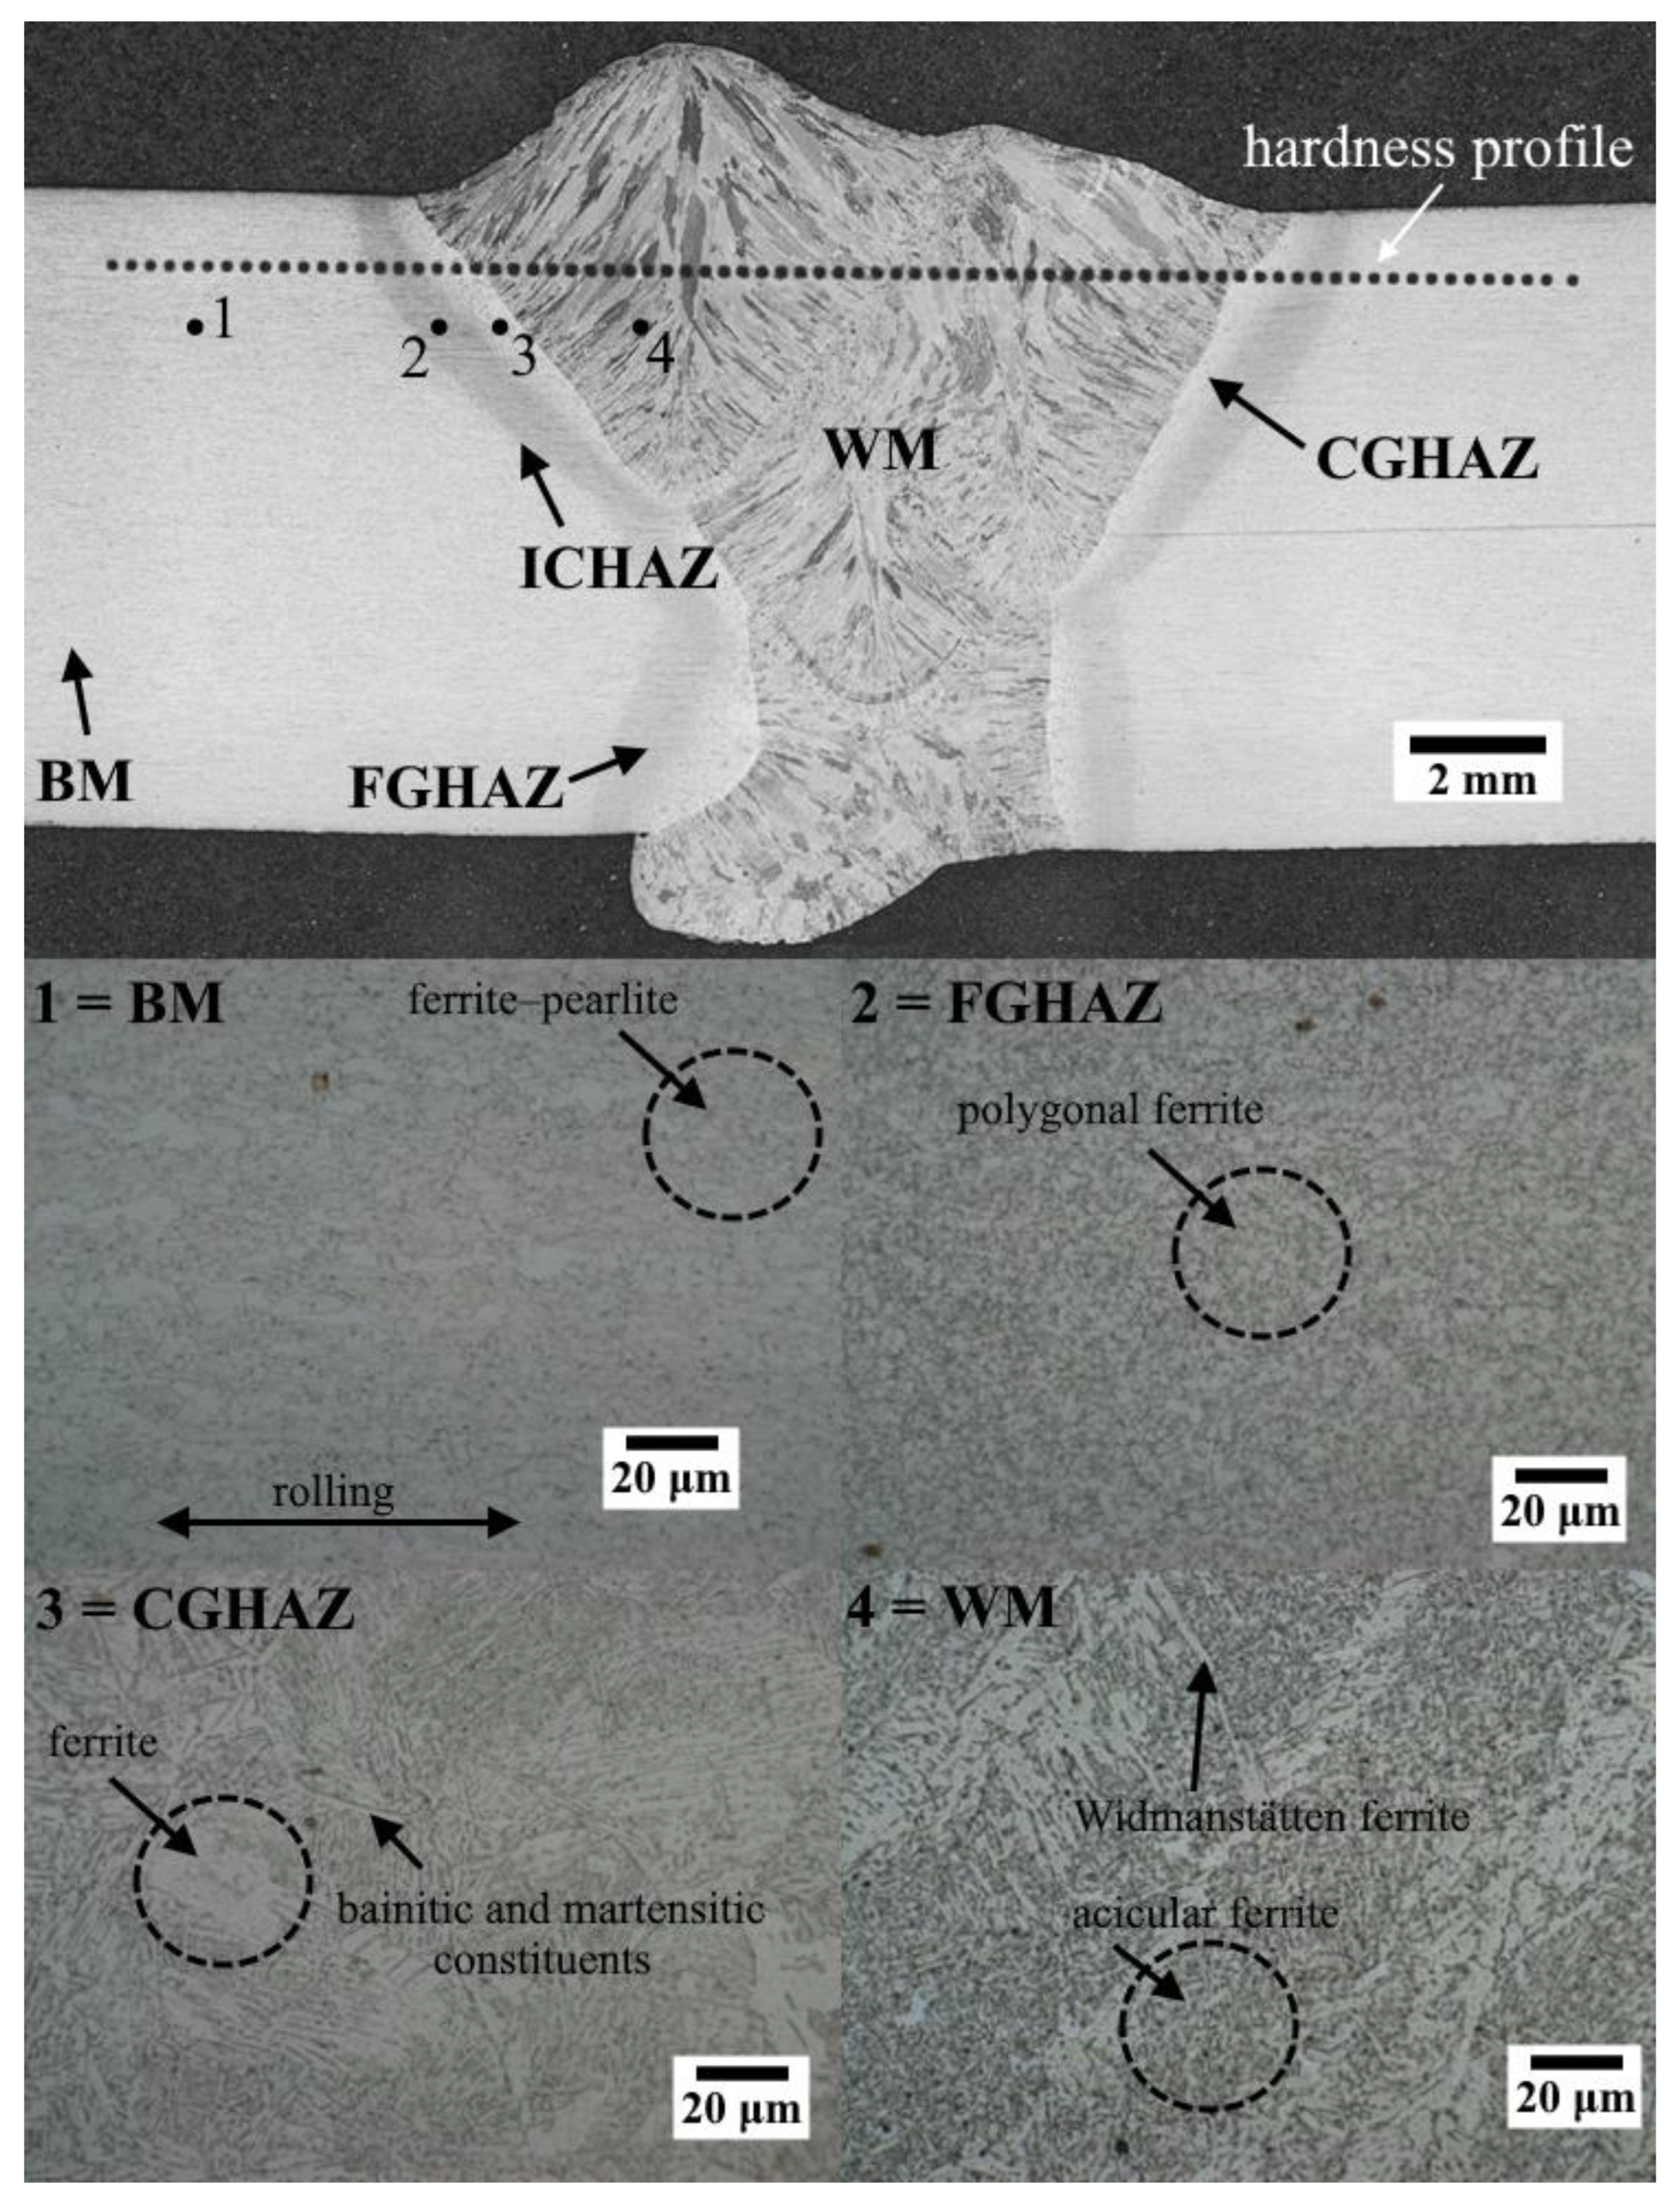
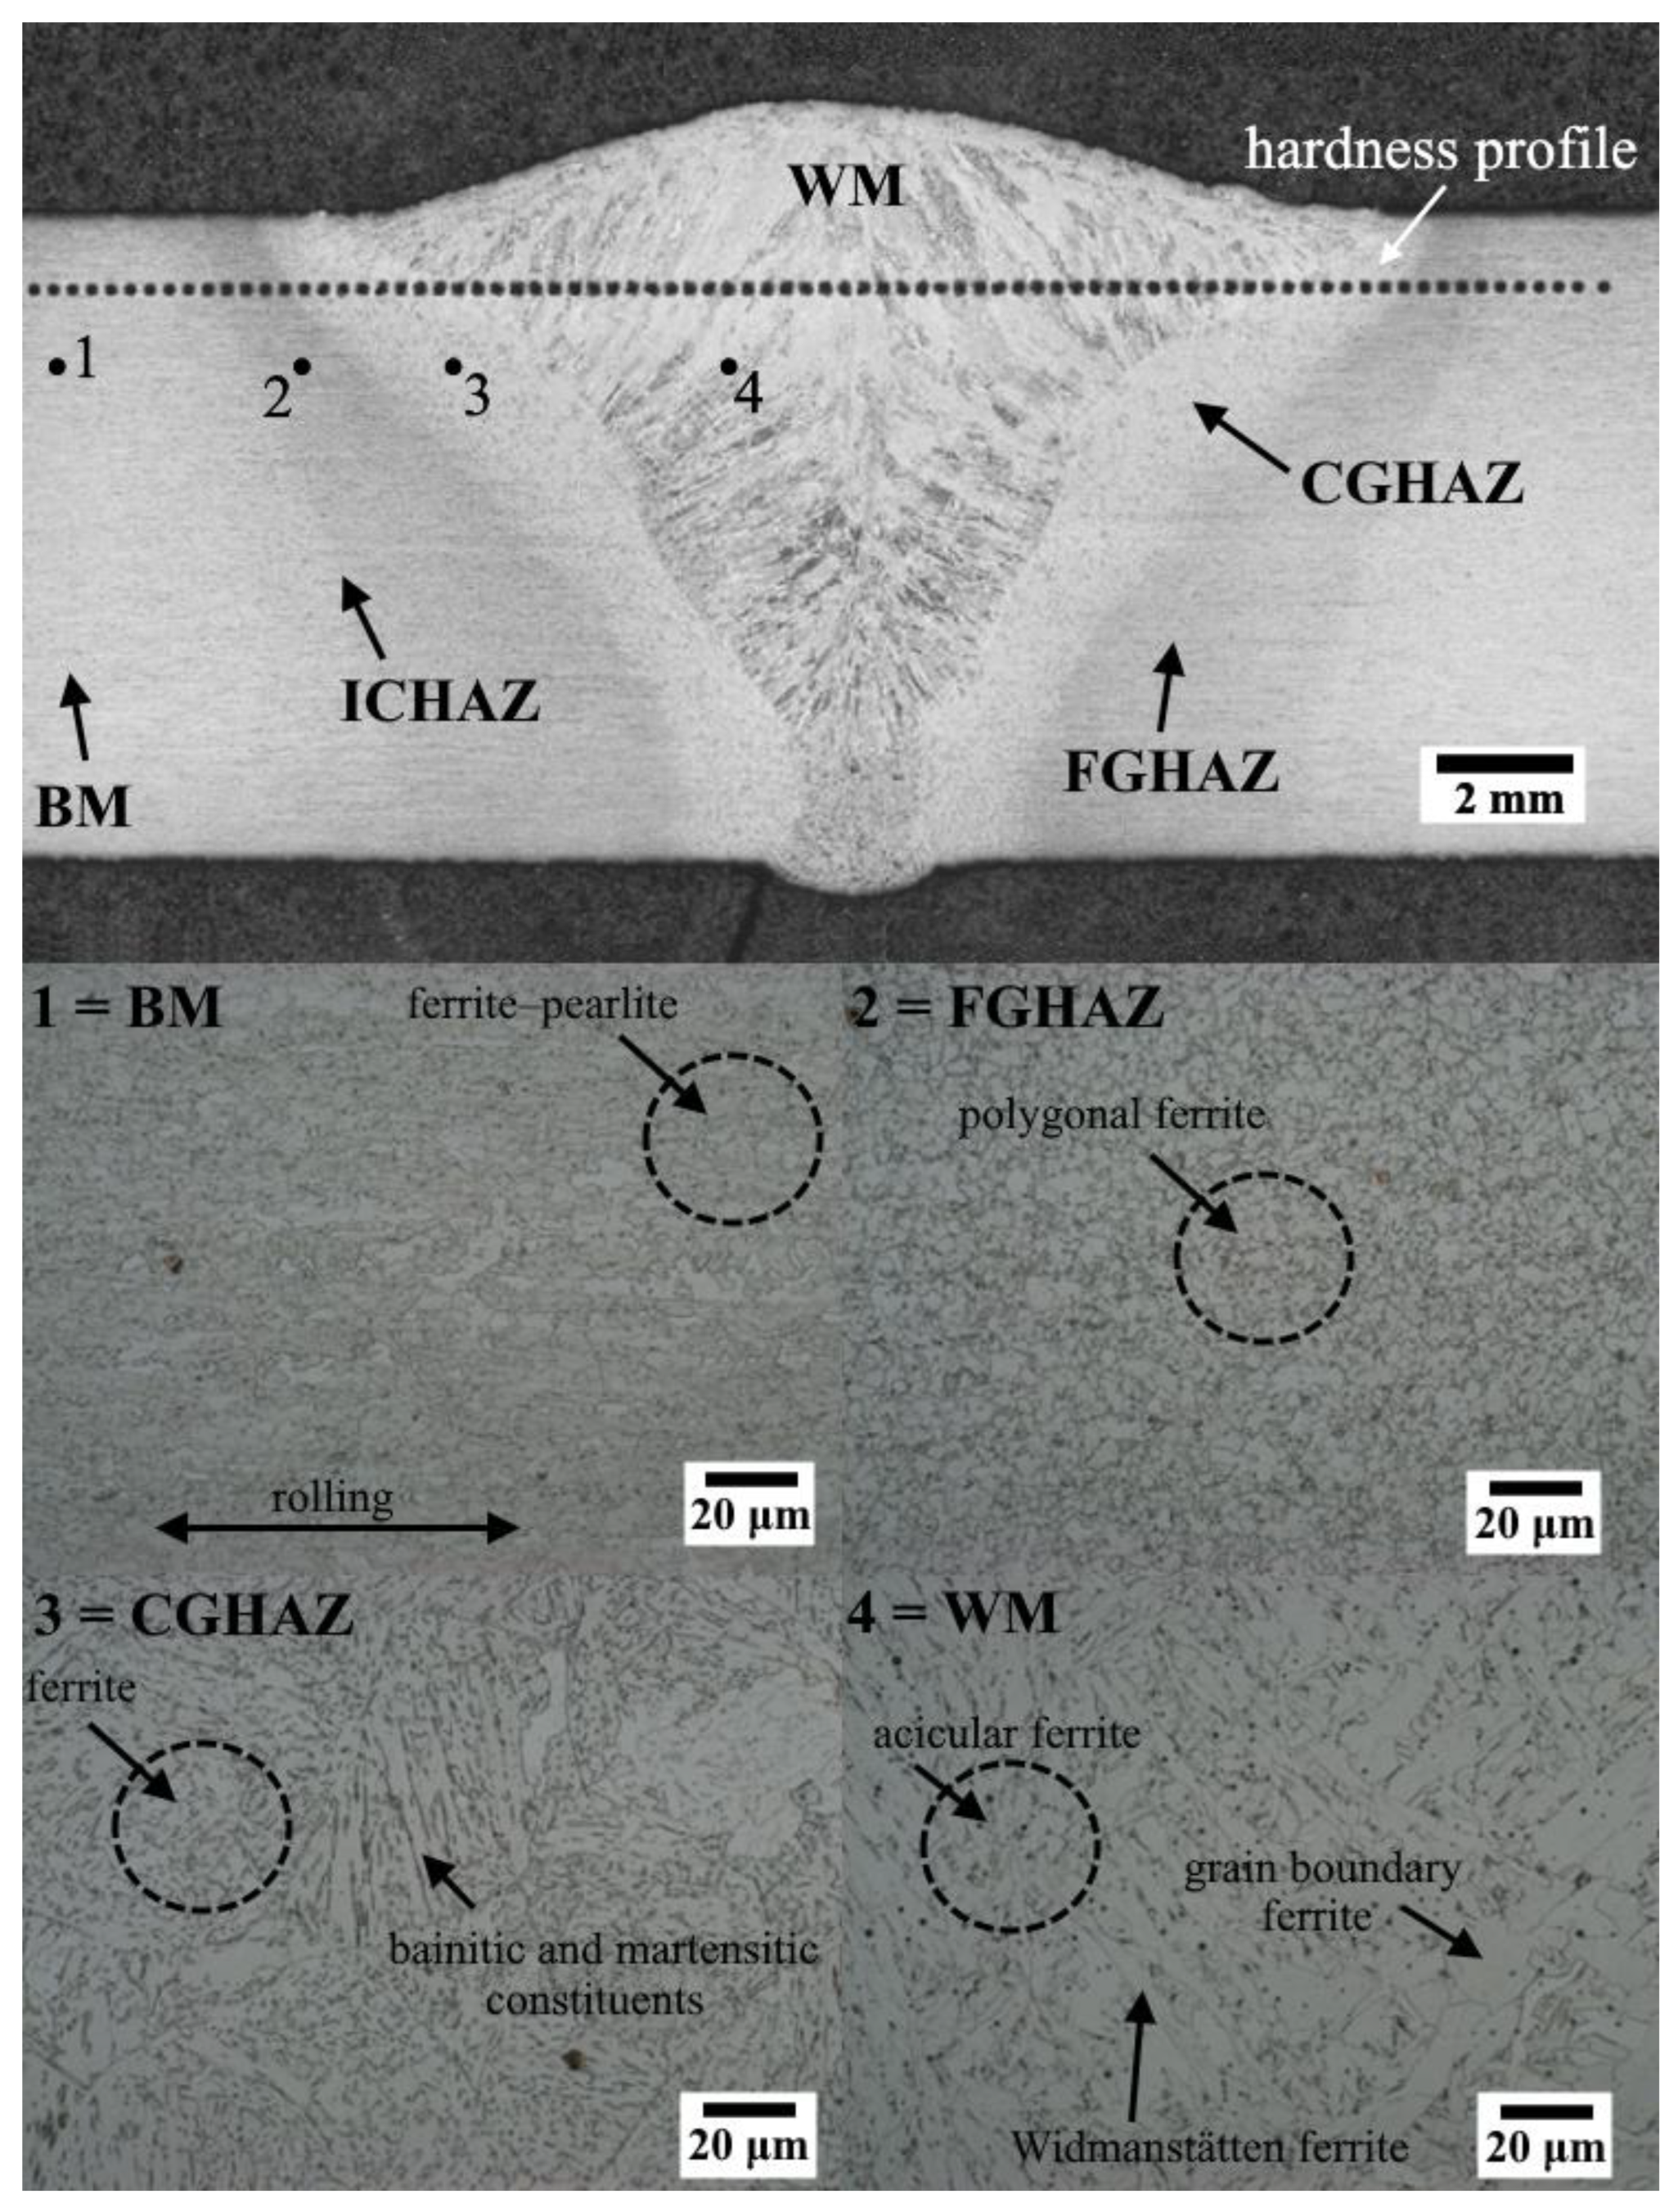
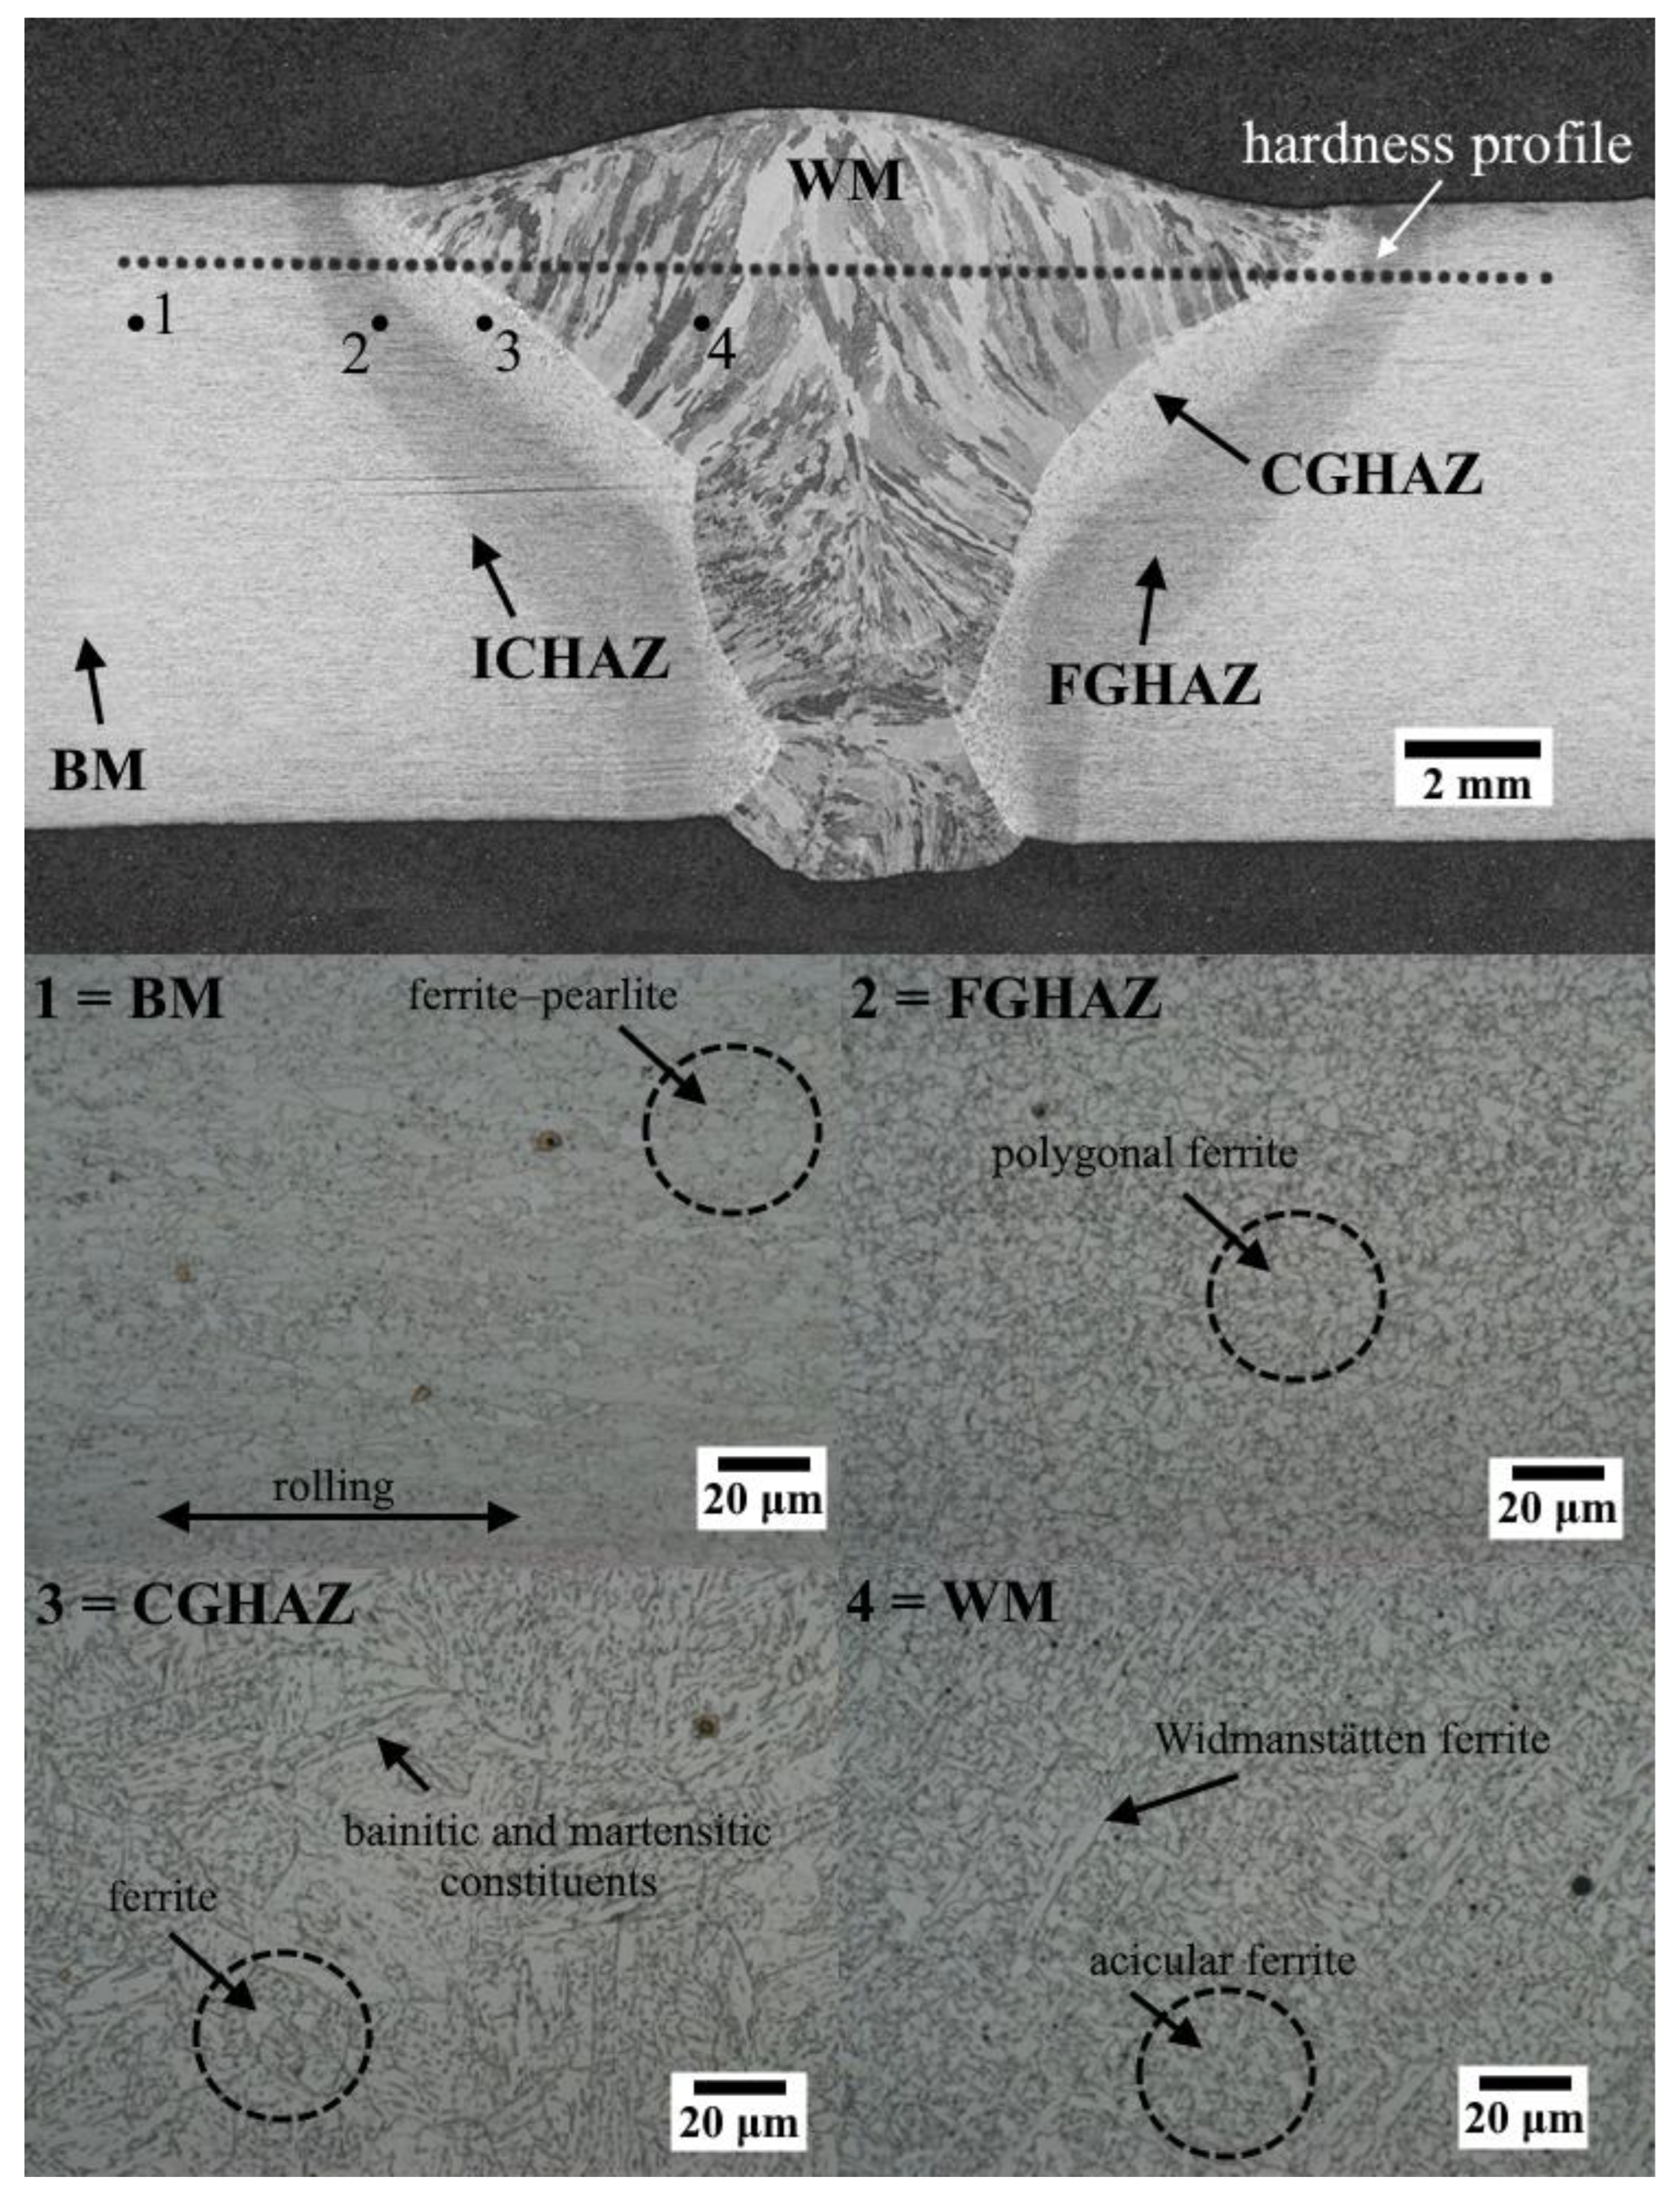
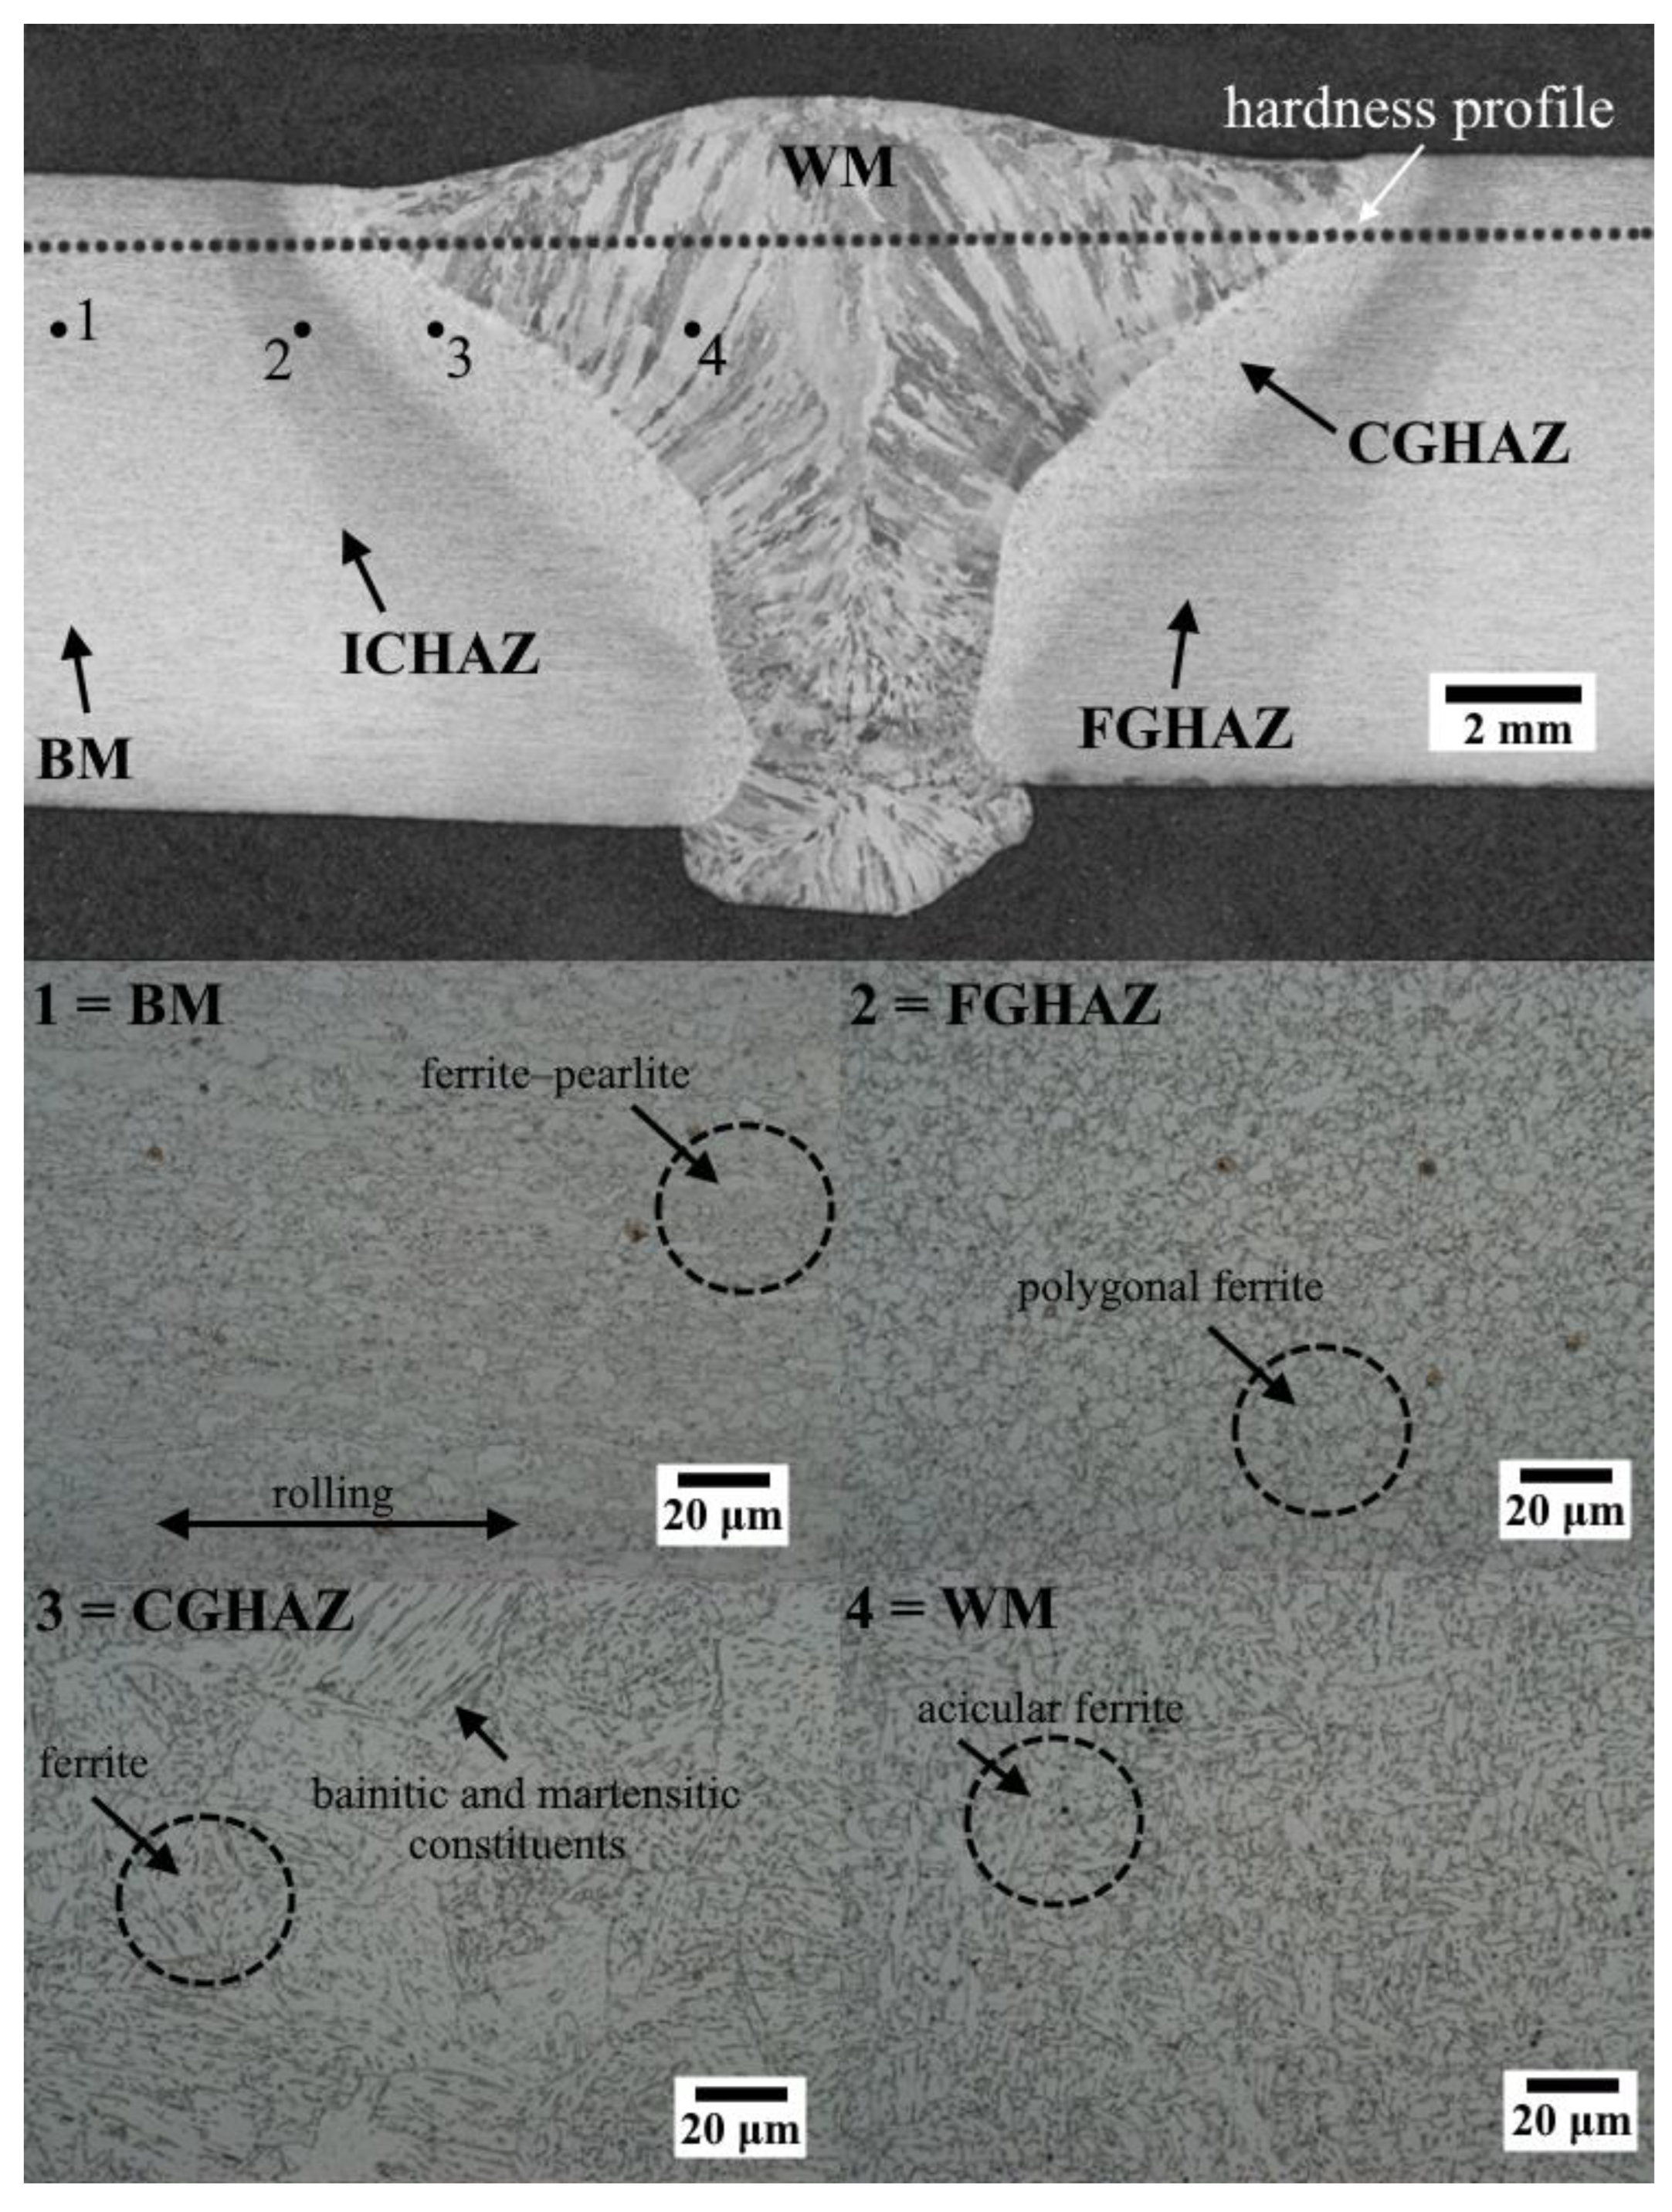
Macrographic examination confirmed that all weldments were free from macroscopic defects, such as porosity, lack of fusion, or undercut. Representative transverse cross-sections (Figure 4, Figure 5, Figure 6, Figure 7, Figure 8 and Figure 9) reveal a clear systematic increase in total HAZ width with increasing heat input (0.6–1.8 kJ/mm), regardless of filler metal strength.
All weldments exhibited the characteristic microstructural regions: BM, intercritical HAZ (ICHAZ), fine-grained HAZ (FGHAZ), coarse-grained HAZ (CGHAZ), and weld metal (WM) [43]. Quantitative analysis (Table 6) indicates that the HAZ area increases significantly with heat input, showing an approximately twofold expansion from 0.6 to 1.8 kJ/mm. In contrast, filler metal strength does not significantly affect HAZ geometry, confirming that HAZ development is governed by the heat input [29]. Furthermore, dilution increased substantially with heat input, from approximately 11–15% at 0.6 kJ/mm to 37–45% at 1.4–1.8 kJ/mm, indicating a greater participation of the S700MC base metal in the weld pool composition at higher heat inputs.
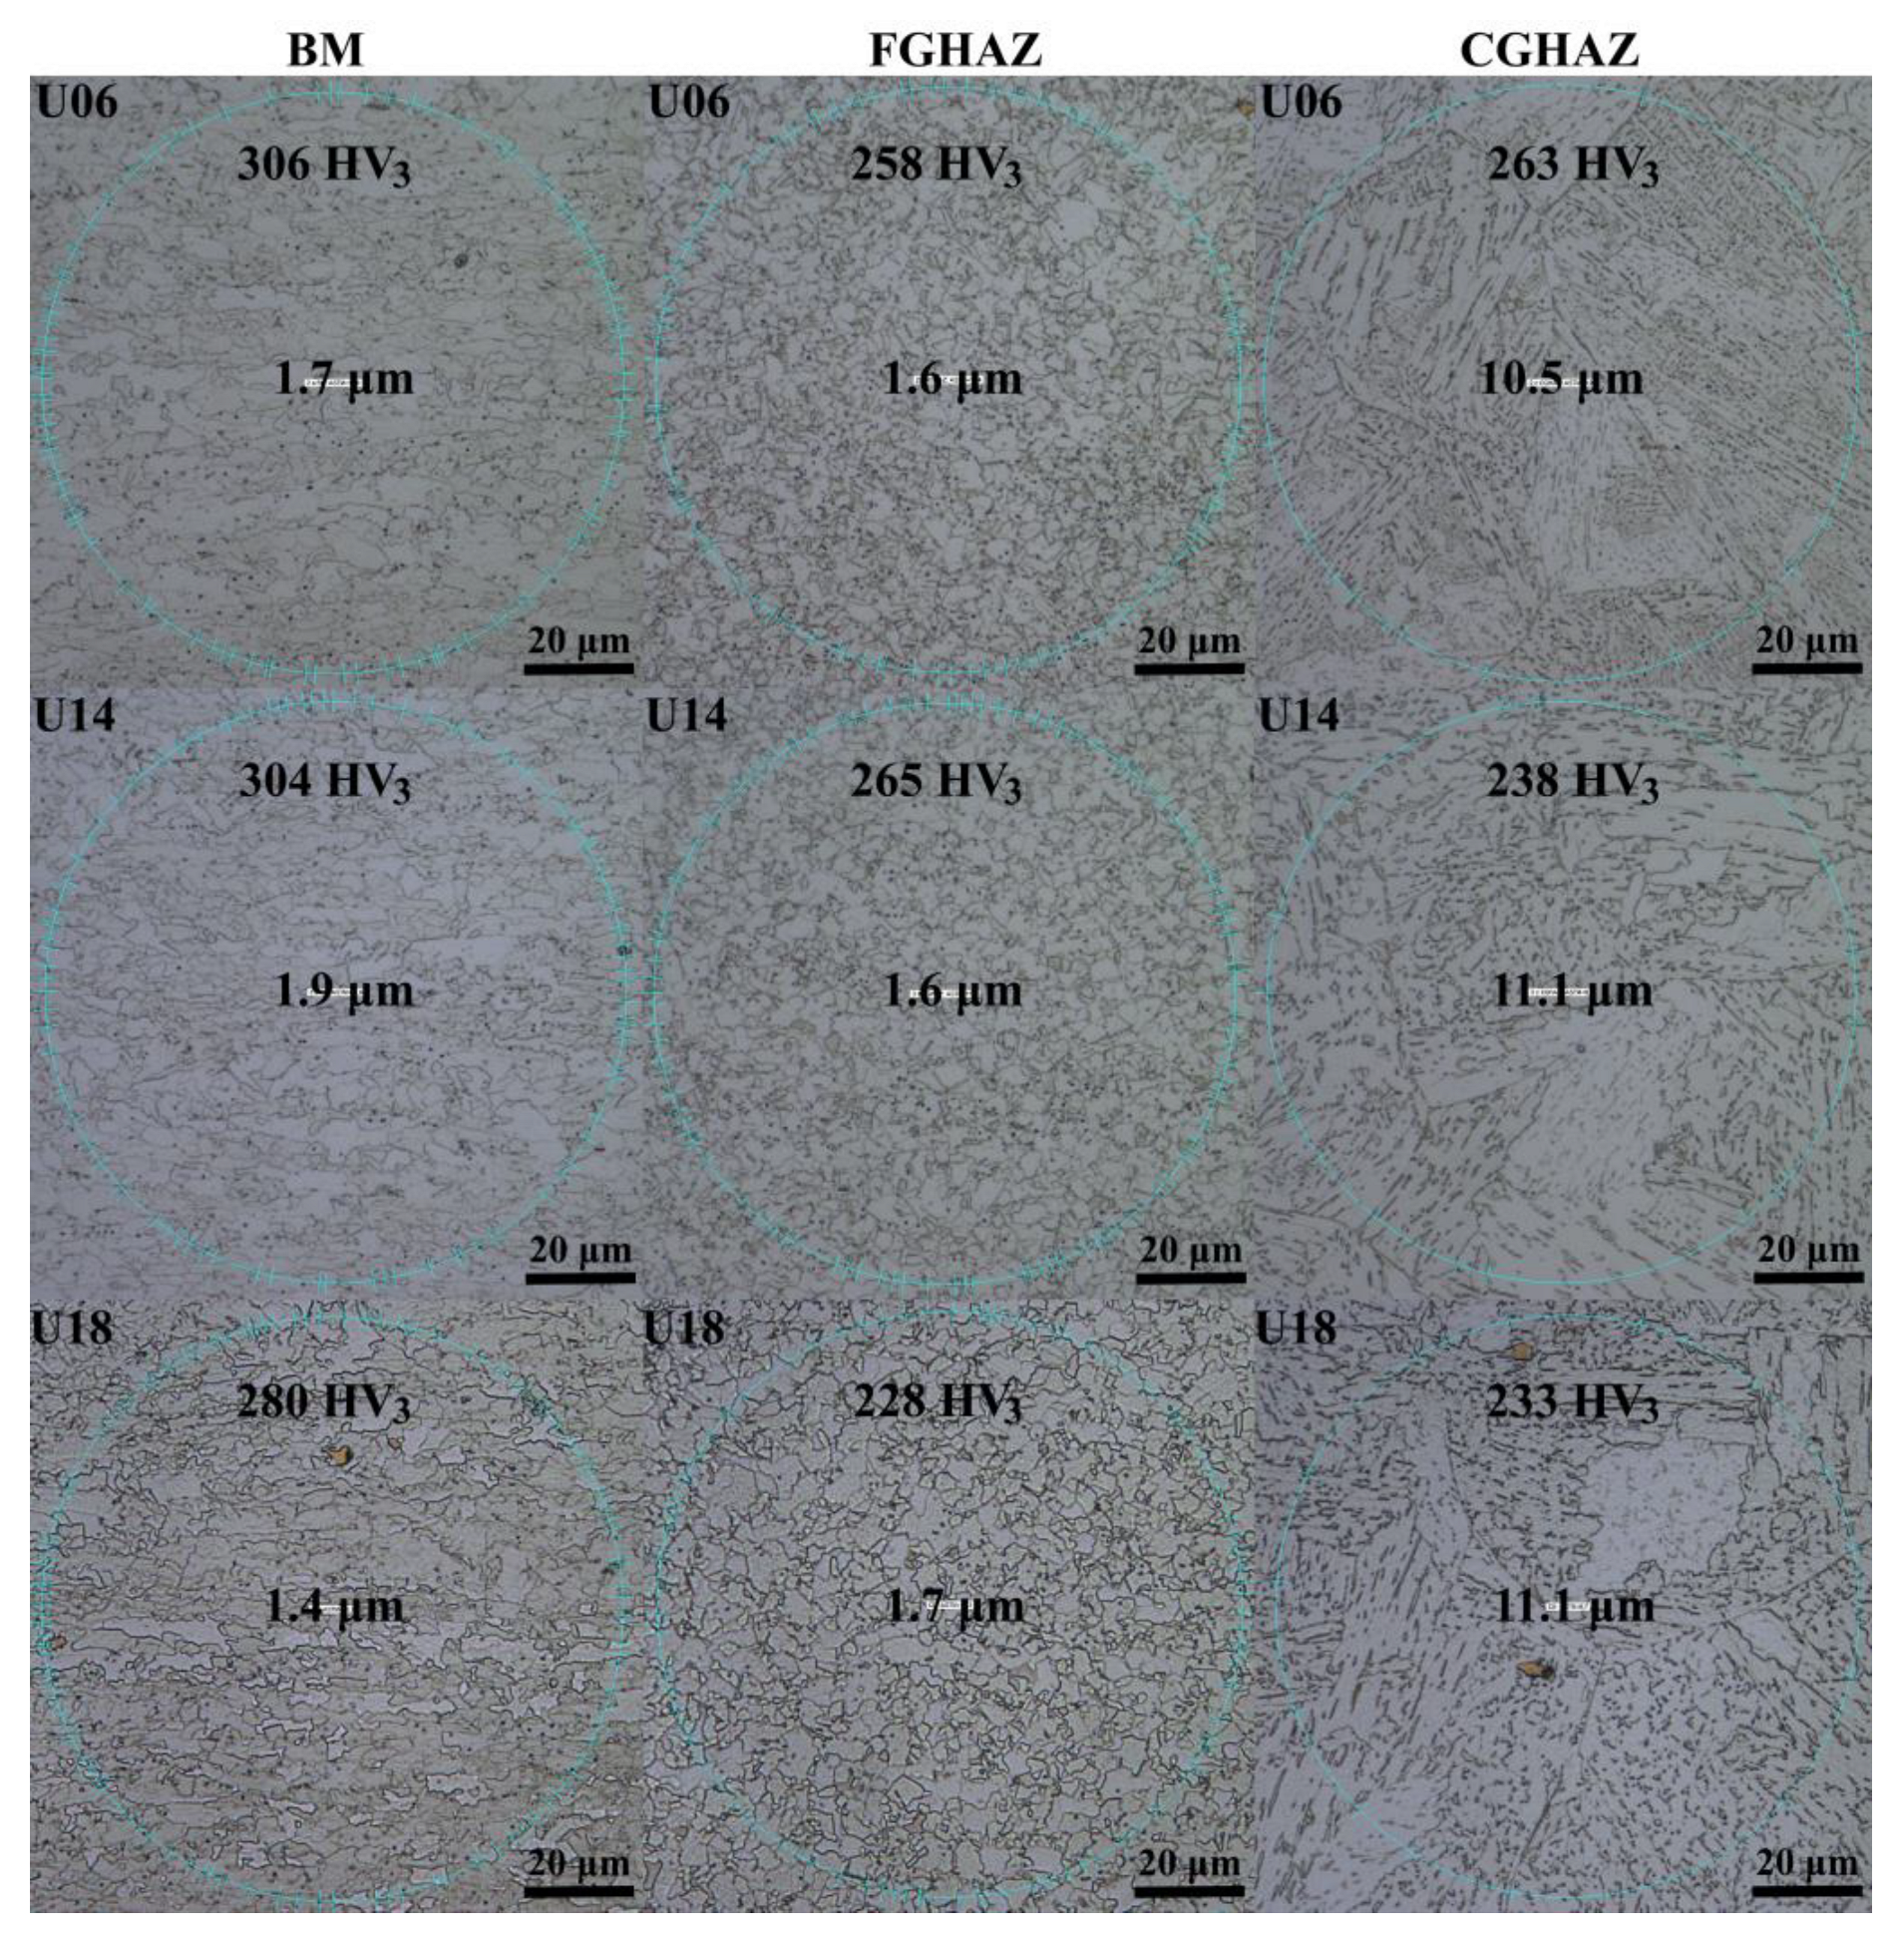
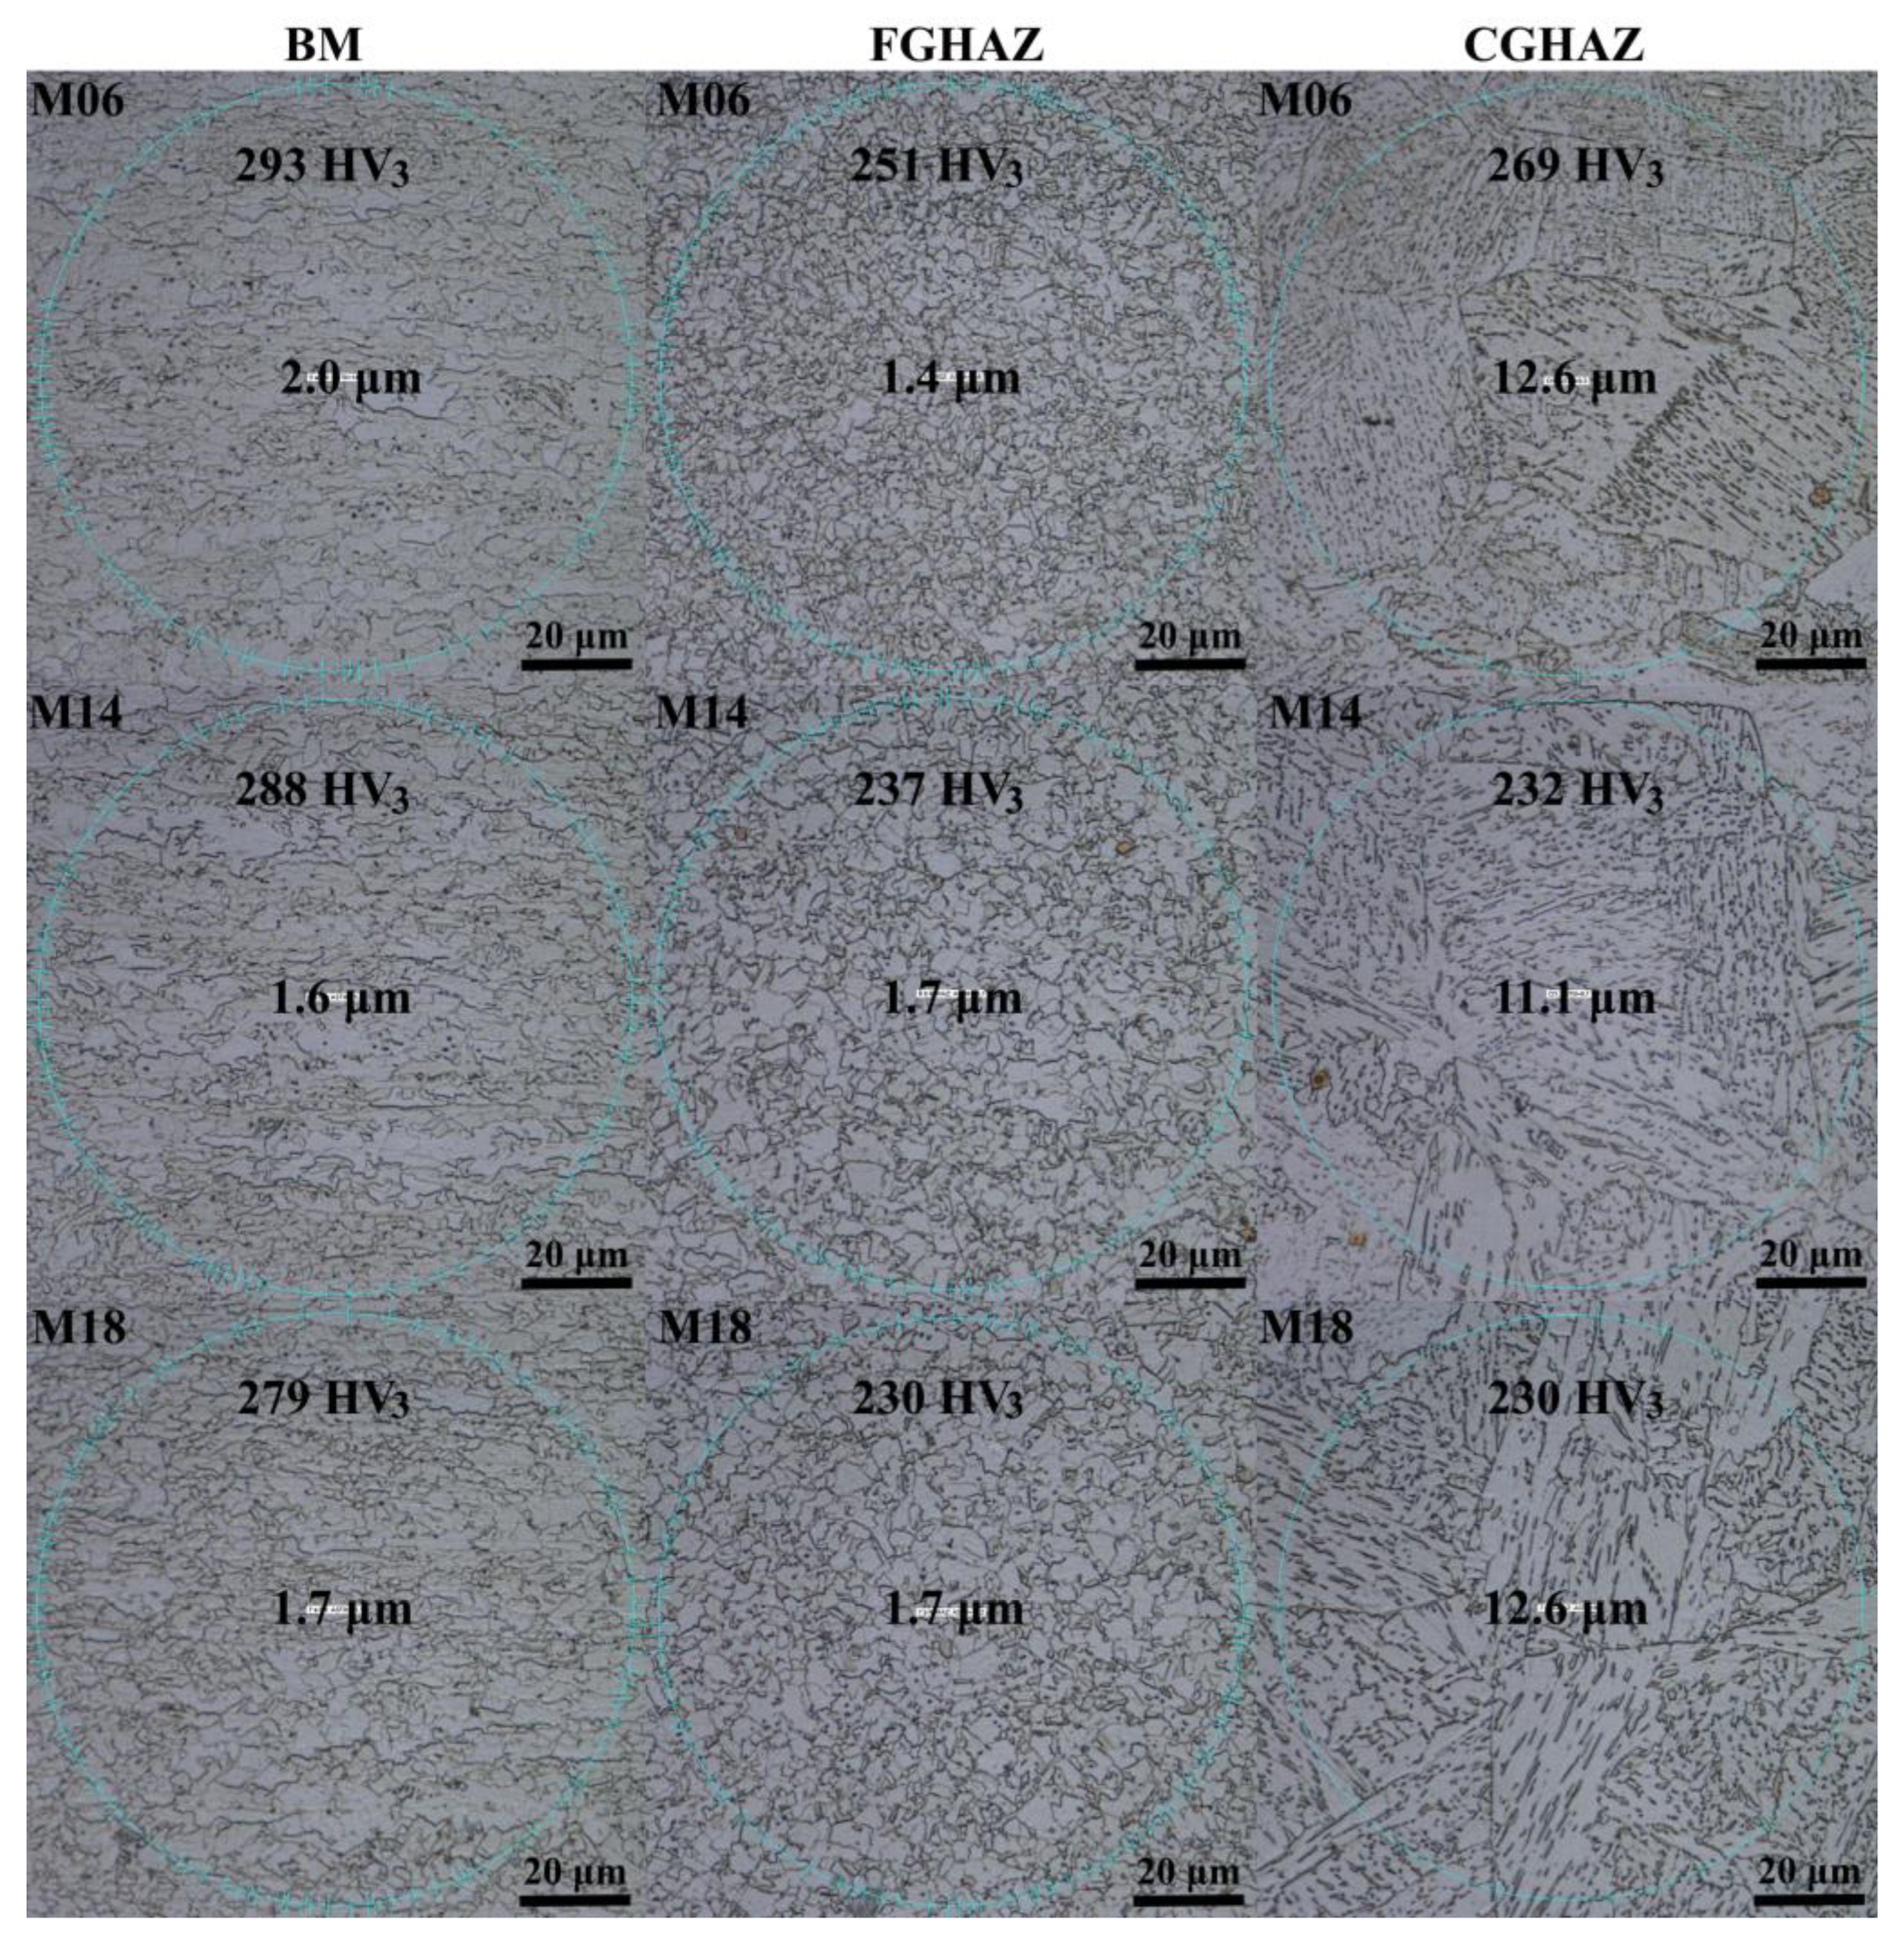
The BM exhibited a refined ferritic–pearlitic microstructure typical of TMCP steels [44]. The FGHAZ was characterized by partial reaustenitization followed by rapid cooling, resulting in fine polygonal ferrite with grain size comparable to the BM [44,45]. In contrast, the CGHAZ underwent complete austenitization and pronounced grain coarsening (10.5–12.6 μm), corresponding to a six- to eightfold increase relative to the BM (~1.7 μm), with predominantly bainitic-martensitic constituents [46].
The WM exhibited a multiphase ferritic microstructure composed of grain boundary ferrite (GBF), Widmanstätten ferrite (WF), and acicular ferrite (AF) [47]. Qualitative observations indicate a higher apparent fraction of acicular ferrite in the intermediate heat input condition (1.4 kJ/mm), consistent with the superior impact toughness obtained under this condition.
The two-way ANOVA results (Table 7) demonstrate that heat input has a statistically significant effect on CGHAZ (p-value = 0.00 < α = 0.05), confirming its dominant role in HAZ expansion (F-value = 300.94). In contrast, filler metal strength does not exhibit a significant isolated effect (p-value = 0.56 > α = 0.05), indicating that it does not directly influence CGHAZ development. However, the interaction between heat input and filler metal strength is statistically significant (p-value = 0.00 < α = 0.05). This result indicates that the influence of heat input on CGHAZ area is dependent on joint configuration, highlighting the need for a combined analysis of process parameters when predicting thermal cycle effects and microstructural evolution.
Grain size measurements (Figure 10 and Figure 11) confirm that grain refinement is preserved in the FGHAZ, whereas significant coarsening occurs in the CGHAZ across all welding conditions. Although grain refinement contributed to the higher hardness measured in the FGHAZ, hardness evolution cannot be attributed exclusively to grain size. Variations in precipitation strengthening, dislocation density, and transformation products generated during the welding thermal cycle also contributed to the local hardness response. Therefore, hardness evolution resulted from the combined effects of grain size, phase transformation, precipitation strengthening, and dislocation density.
For the FGHAZ area, both heat input and filler metal strength significantly affect the response (p-value = 0.00 < α = 0.05), with heat input showing the highest contribution (F-value = 1903.04). The interaction term is also significant (p-value = 0.00 < α = 0.05). These findings demonstrate that FGHAZ development is governed not only by individual welding parameters but also by their interaction, reinforcing the importance of considering both thermal input and geometric configuration in microstructural control.
Tukey’s HSD post hoc comparisons further confirmed that most welding conditions differed significantly regarding both CGHAZ and FGHAZ areas (p-value < 0.05), reinforcing the strong sensitivity of HAZ development to variations in heat input and strength matching. For the CGHAZ area, only specific comparisons, particularly between U06 and M06, as well as between U18 and M18, did not show statistically significant differences, indicating that, under identical heat input levels, the filler metal strength exerted a limited influence on coarse-grained HAZ development. A similar trend was observed for the FGHAZ area, in which most conditions exhibited statistically distinct responses, while U06 and M06 showed comparable behavior. These results demonstrate that heat input is the dominant factor governing HAZ expansion, whereas filler metal strength mainly modulates the thermal response under specific conditions.

3.2. Effect of Heat Input on Hardness Distribution

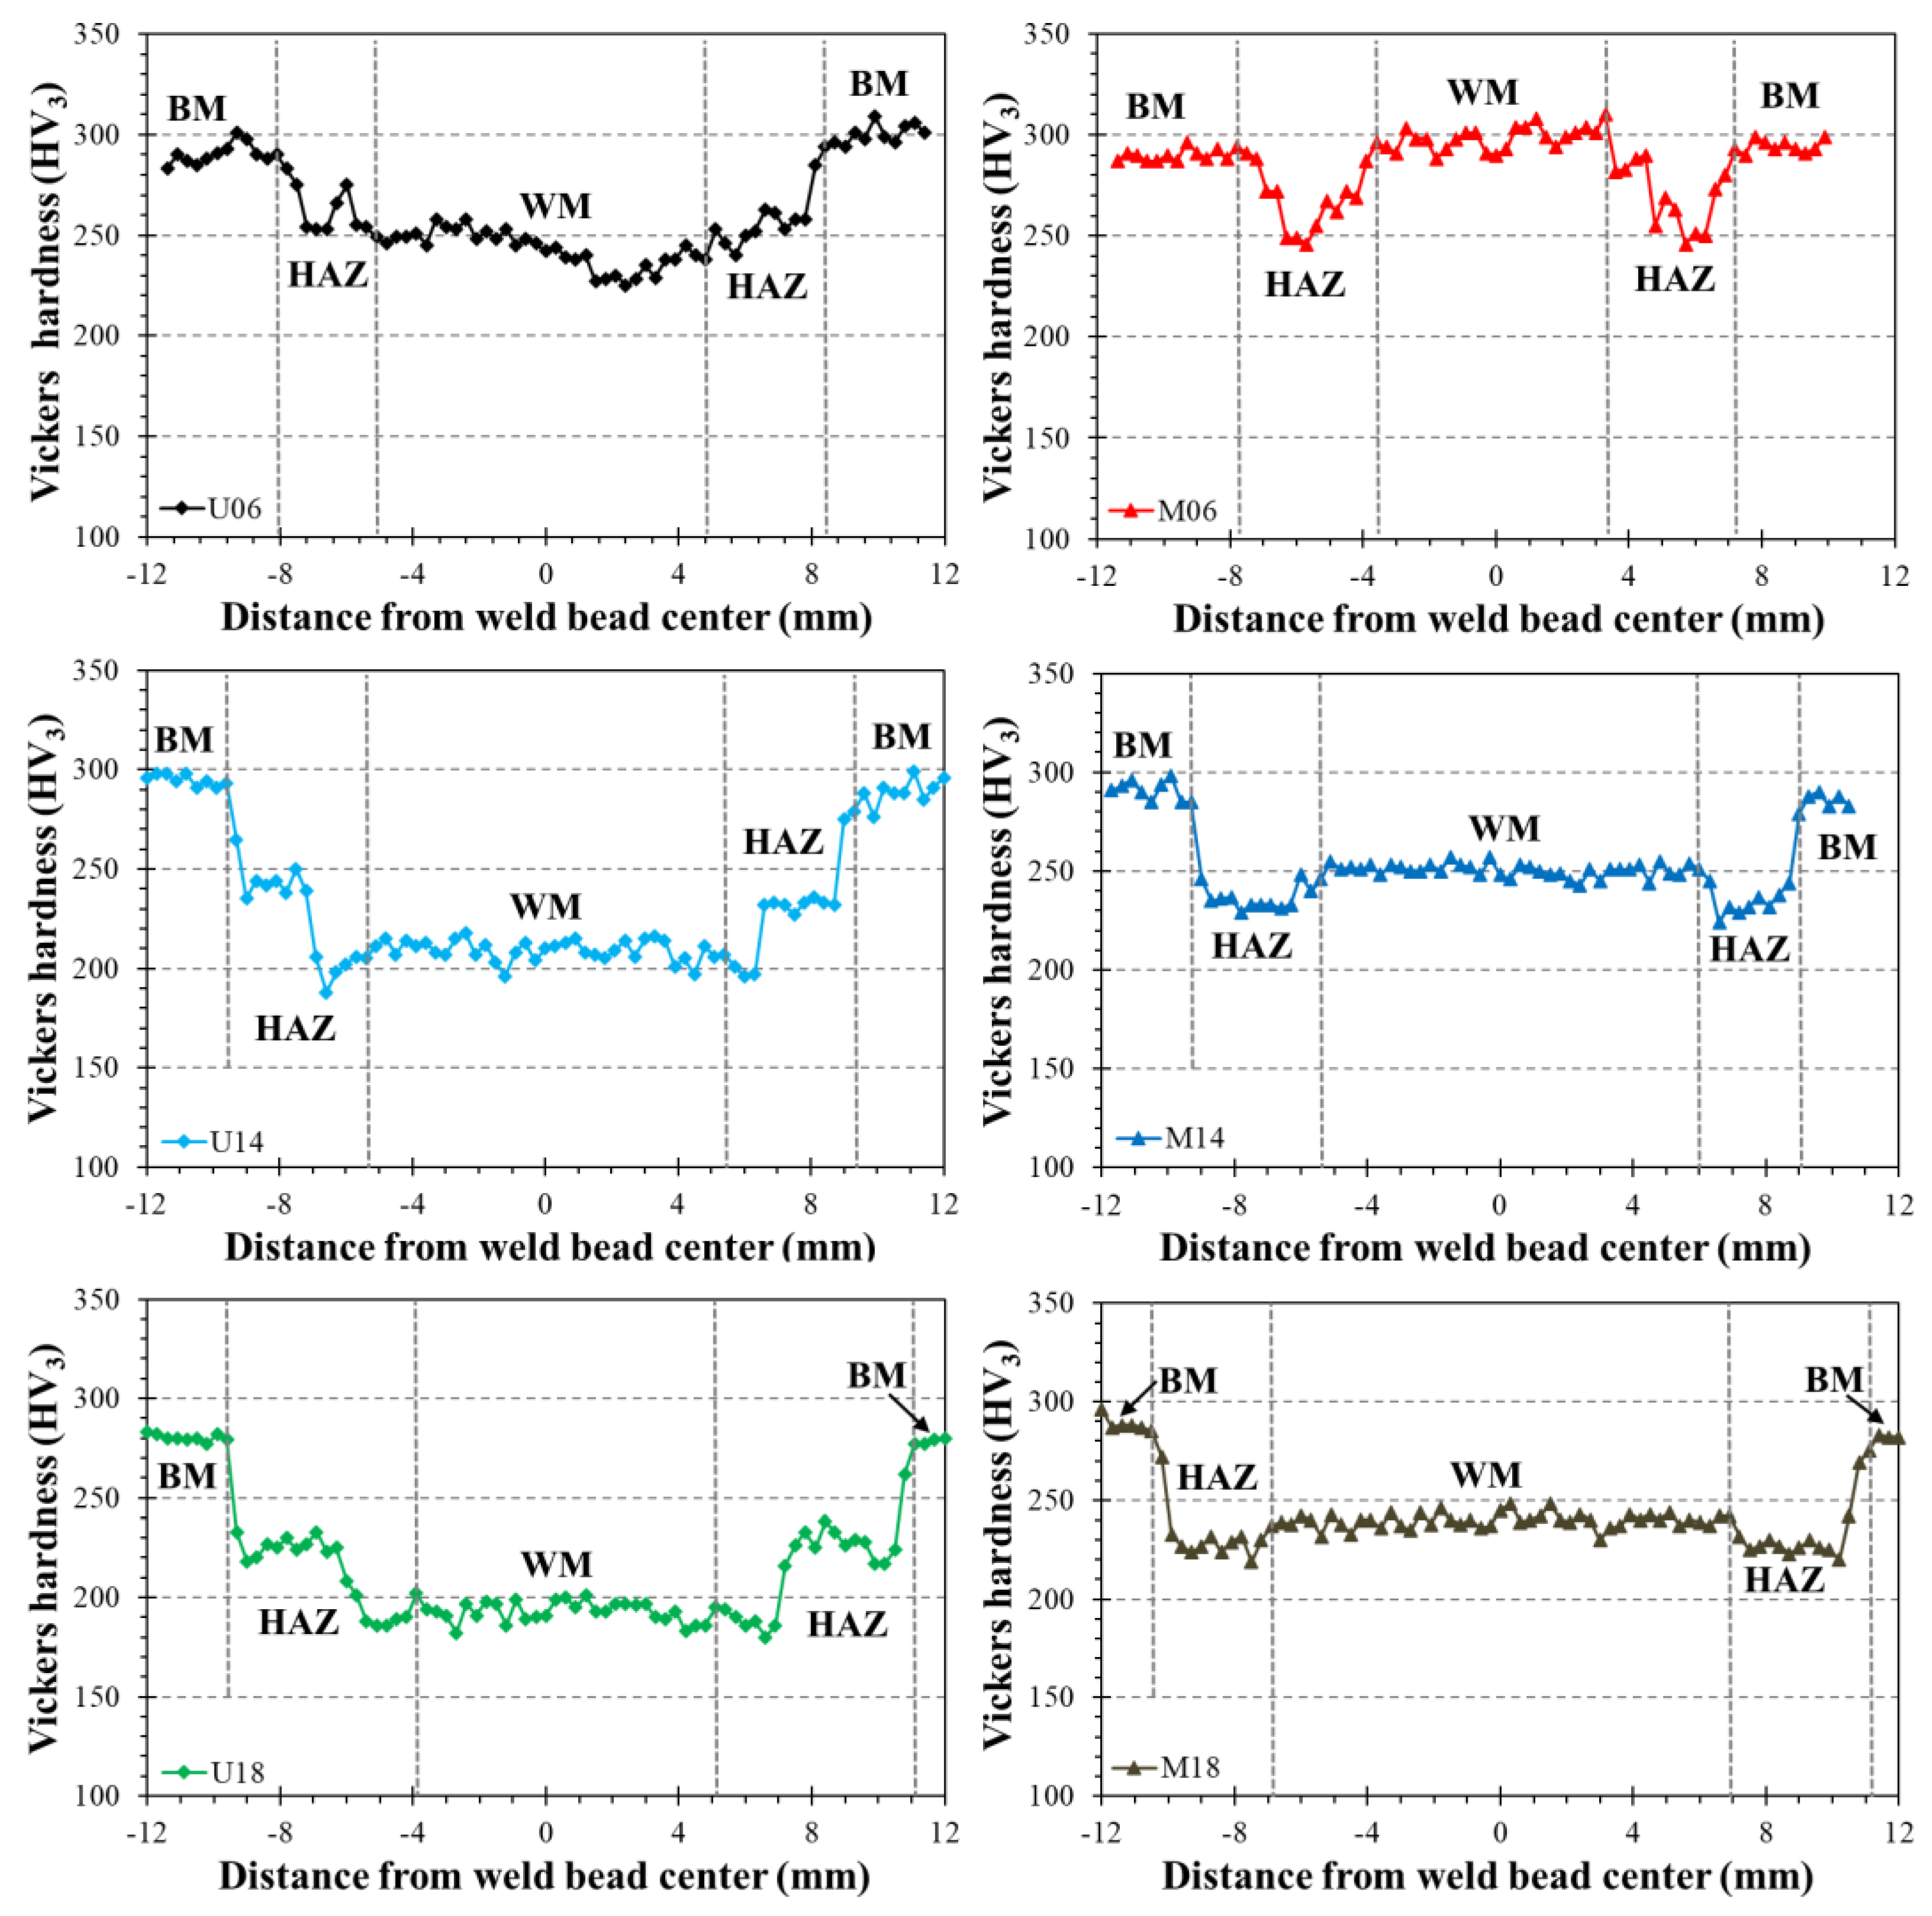
Hardness profiles (Figure 12) revealed systematic variations as a function of heat input and filler metal strength. Three main features can be identified: (i) the extent of the softened HAZ region, (ii) the magnitude of hardness reduction, and (iii) the weld metal hardness level.
Lower heat input (0.6 kJ/mm) resulted in narrower HAZ regions and higher hardness values in both WM and CGHAZ [20,22]. Increasing heat input progressively widened the softened region and reduced hardness, particularly within the ICHAZ and FGHAZ. This behavior is consistent with enhanced microstructural recovery and possible coarsening or dissolution of strengthening precipitates associated with slower cooling rates [29,48].
Under undermatching conditions, WM hardness remains consistently lower than that of the HAZ [34,35], indicating that the weld metal is the mechanically weakest region. In contrast, under matching conditions, WM hardness was comparable to or higher than that of the HAZ [35], shifting the mechanically critical region toward the softened HAZ at higher heat inputs.
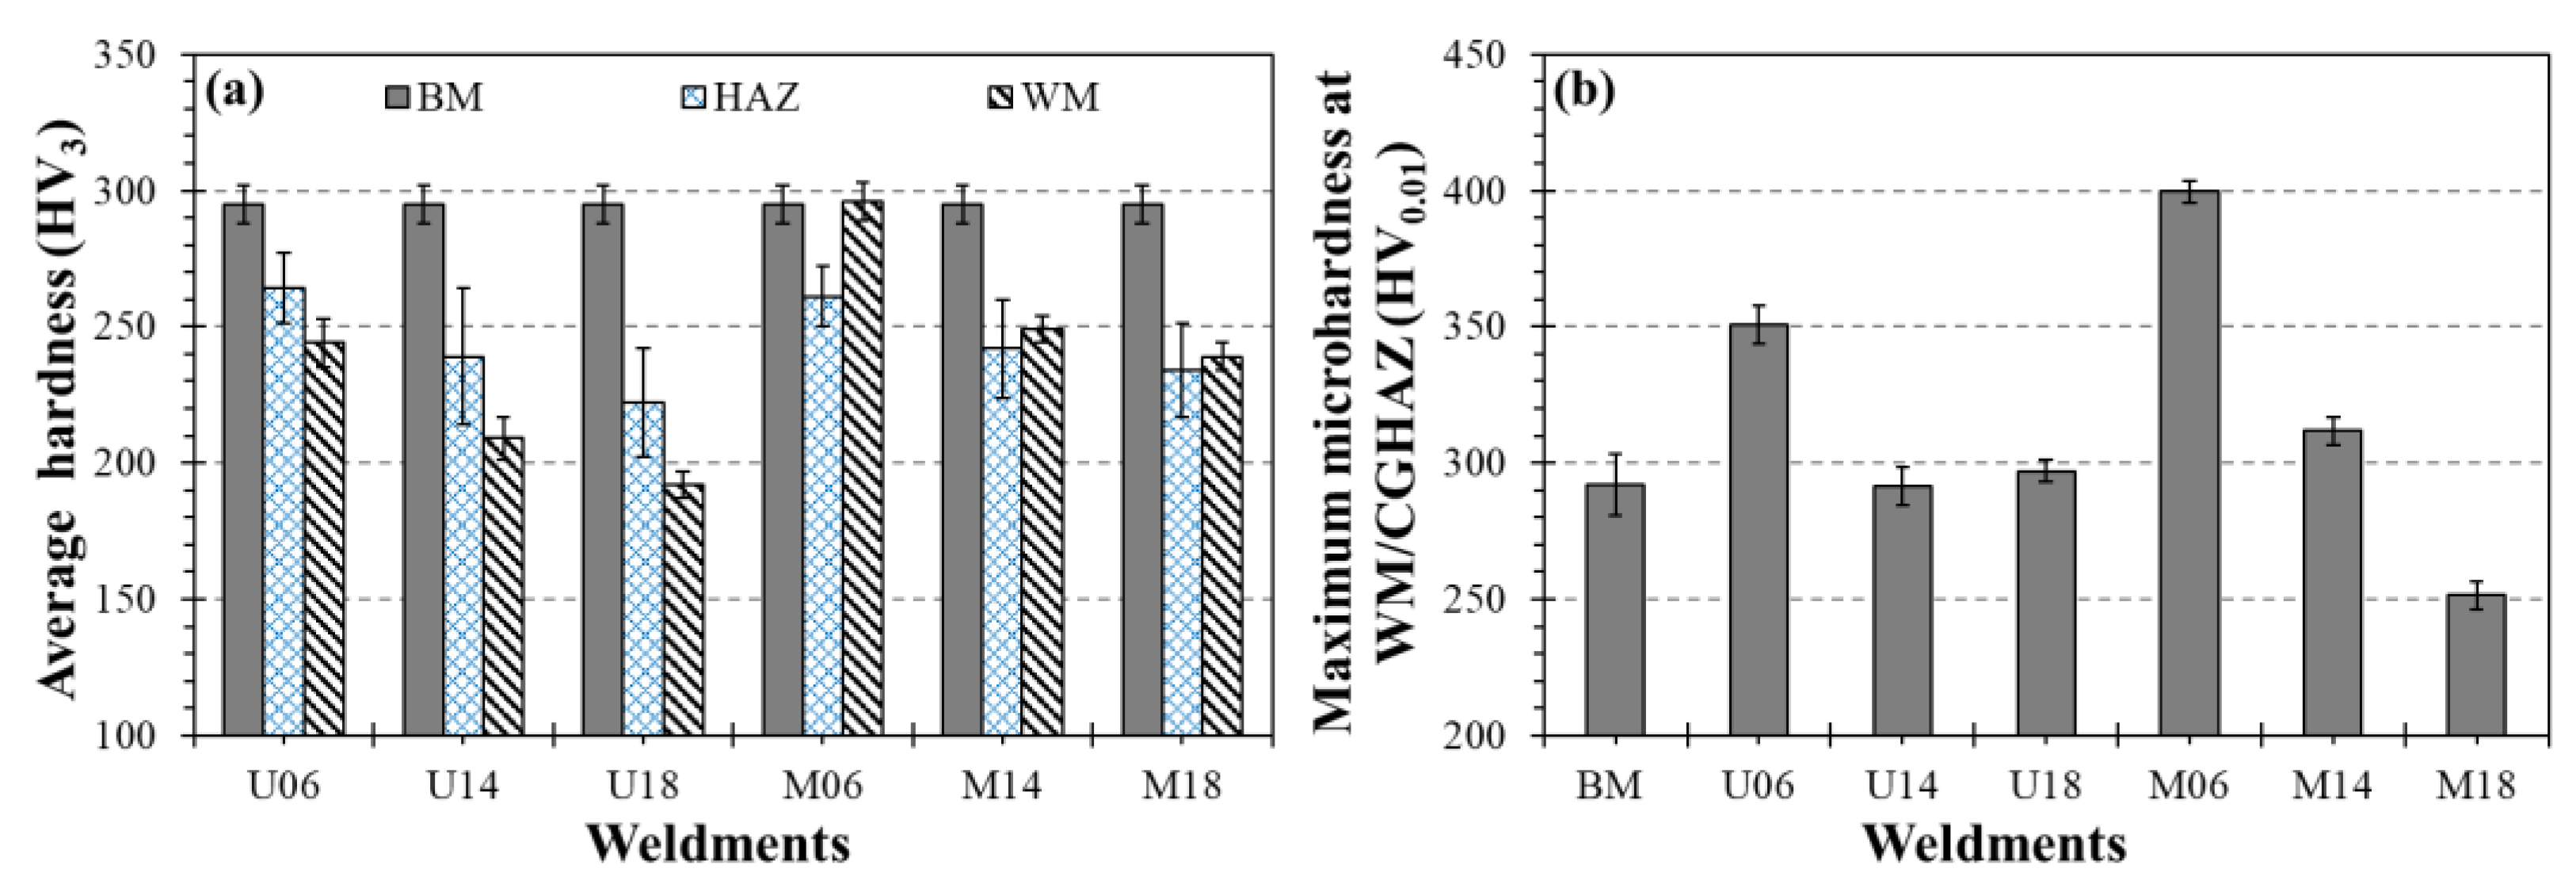
Average hardness and microhardness results Figure 13a,b confirmed that increasing heat input reduced hardness in both WM and HAZ while localizing hardness peaks at the WM/CGHAZ interface, resulting in a more homogeneous hardness distribution. These hardness peaks decreased with increasing heat input, indicating reduced martensitic transformation and a more homogeneous microstructure [22,29]. The abrupt hardness transition between the WM/CGHAZ interface and the softened HAZ may have increased local stress concentration. Therefore, local hardness gradients, rather than peak hardness alone, probably contributed to the reduced impact toughness.
The ANOVA results for WM hardness (Table 8) indicate that both heat input and filler metal strength significantly affect the response (p-value = 0.00 < α = 0.05), confirming that both parameters influence the mechanical behavior of the deposited metal. Heat input shows the highest contribution (F-value = 107.81), reflecting its strong effect on cooling rate and phase transformation kinetics. Joint configuration also shows statistical significance, which may be associated with variations in heat dissipation and solidification conditions. However, the interaction between factors is not statistically significant (p-value = 0.33 > α = 0.05), indicating that their effects on weld metal hardness are predominantly additive. The results indicate that heat input and filler metal strength affect WM hardness independently, with no significant interaction between the factors.
For HAZ hardness (Table 8), the one-way ANOVA indicates a statistically significant effect of joint configuration (p-value = 0.00 < α = 0.05). This demonstrates that different filler metal strength led to measurable variations in HAZ hardness, likely associated with changes in thermal cycles and cooling rates, which directly influence phase transformations and softening mechanisms in this region. The statistical significance also suggests that the combined joint configuration, rather than isolated parameters, governs hardness evolution in the HAZ.
Tukey’s HSD comparisons for HAZ hardness revealed that several welding conditions exhibited statistically equivalent hardness levels (p-value > 0.05), particularly among intermediate and high heat input conditions. In contrast, low heat input conditions, especially M06, differed significantly from most other weldments, confirming the strong influence of rapid cooling and localized martensitic transformation on hardness evolution. The progressive reduction in HAZ hardness with increasing heat input indicates that thermal softening progressively became the dominant mechanism controlling the local mechanical response of the welded joint.

3.3. Effect of Heat Input on Tensile Properties

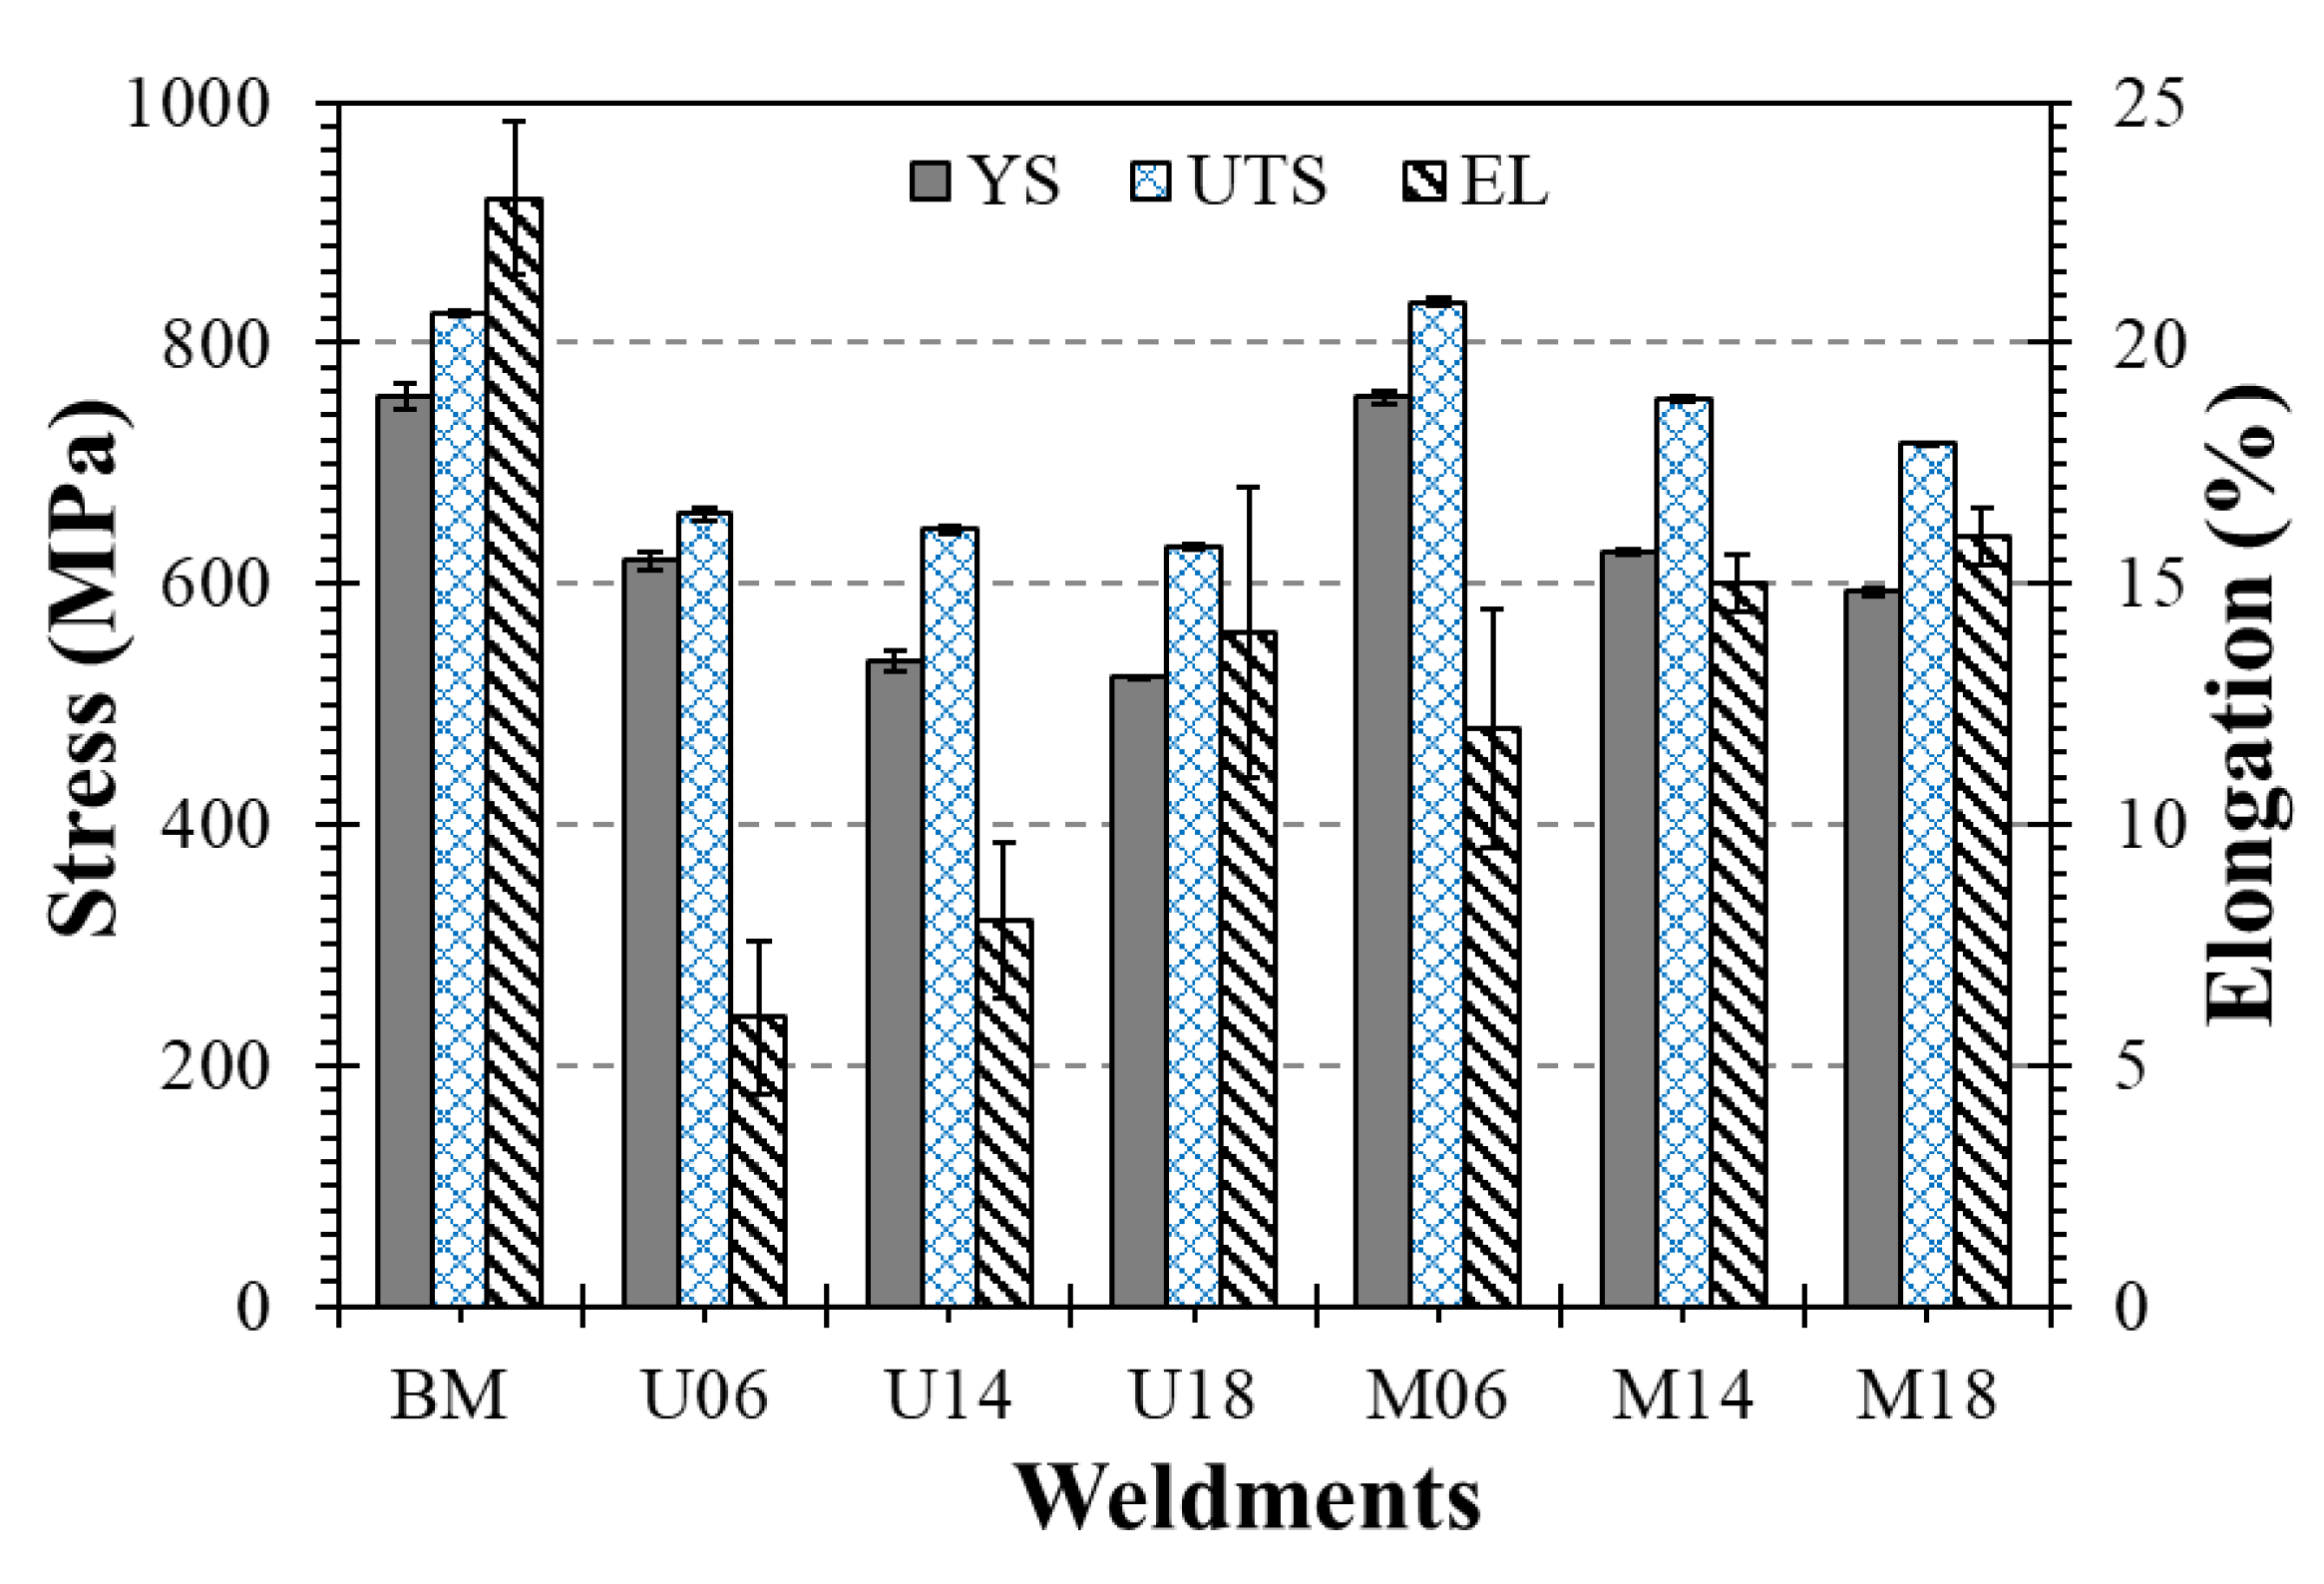
The tensile results (Figure 14) show a clear inverse relationship between heat input and joint strength for both filler metal conditions. In undermatching weldments, yield strength decreased from 619 MPa (U06) to 522 MPa (U18), reflecting the combined effects of HAZ softening and lower WM strength. In matching weldments, the M06 condition achieved yield strength values comparable to those of the BM (~755 MPa), albeit with reduced elongation, indicating limited ductility.
At low heat input (0.6 kJ/mm), fracture preferentially initiated near the WM/CGHAZ interface, where localized hardness peaks approaching 400 HV0.01 and abrupt hardness transitions promoted local stress concentration. As heat input increased, progressive HAZ softening reduced the local hardness to values below approximately 280 HV0.01, shifting the mechanically weakest region toward the softened HAZ. Consequently, fracture progressively moved from the fusion boundary to the softened HAZ, indicating that thermal softening rather than localized interface brittleness became the dominant failure mechanism.
The one-way ANOVA results (Table 9) indicate that joint configuration has a statistically significant effect on yield strength (p-value = 0.00 < α = 0.05), ultimate tensile strength (p-value = 0.00 < α = 0.05), and elongation (p-value = 0.00 < α = 0.05). These results confirm the strong influence of welding conditions on tensile properties [17]. The statistical results are fully consistent with the hardness measurements and fracture observations, demonstrating that the deterioration of tensile performance is primarily associated with progressive HAZ softening rather than with changes in weld metal strength alone.
The ANOVA results for yield strength (Table 9) reveal a highly significant effect of the joint configuration factor (F-value = 627.1), indicating strong sensitivity of this property to joint configuration. This behavior suggests that the thermal and metallurgical conditions imposed by the joint configuration directly influence the mechanisms governing the yielding resistance of the welded material.
For ultimate tensile strength (Table 9), the ANOVA also indicates a highly significant effect of joint configuration, with an even more pronounced F-value = 2486. This result confirms that the ultimate strength is strongly dependent on joint configuration, reflecting the combined influence of factors such as penetration, dilution, and the resulting weld microstructure.
The elongation analysis (Table 9) shows that joint configuration has a statistically significant effect (F-value = 15.289), indicating that the material ductility is also affected by joint geometry. This behavior can be attributed to microstructural variations and the presence of heterogeneities introduced during welding, which influence the material’s plastic deformation capacity.
Tukey’s HSD post hoc analysis demonstrated that most weldments exhibited statistically significant differences in yield strength and ultimate tensile strength (p-value < 0.05), confirming the high sensitivity of joint mechanical resistance to heat input and strength-matching conditions. Nevertheless, specific comparisons, such as between U06 and M14, U14 and M18, and U18 and M06, did not show significant differences in yield strength, suggesting that distinct combinations of thermal cycle severity and weld metal strength may produce comparable yielding behavior. For ultimate tensile strength, only limited equivalence between conditions was observed, particularly between U18 and M06, indicating similar global load-bearing capacity despite distinct microstructural configurations.
Regarding elongation, a larger number of statistically equivalent groups was identified compared with strength-related properties, indicating lower sensitivity of ductility to welding parameter variations. This behavior suggests that plastic deformation capacity is governed not only by local hardness gradients but also by the overall distribution of softened and strain-compatible regions throughout the welded joint.

3.4. Effect of Heat Input and Testing Temperature on Charpy Impact Resistance

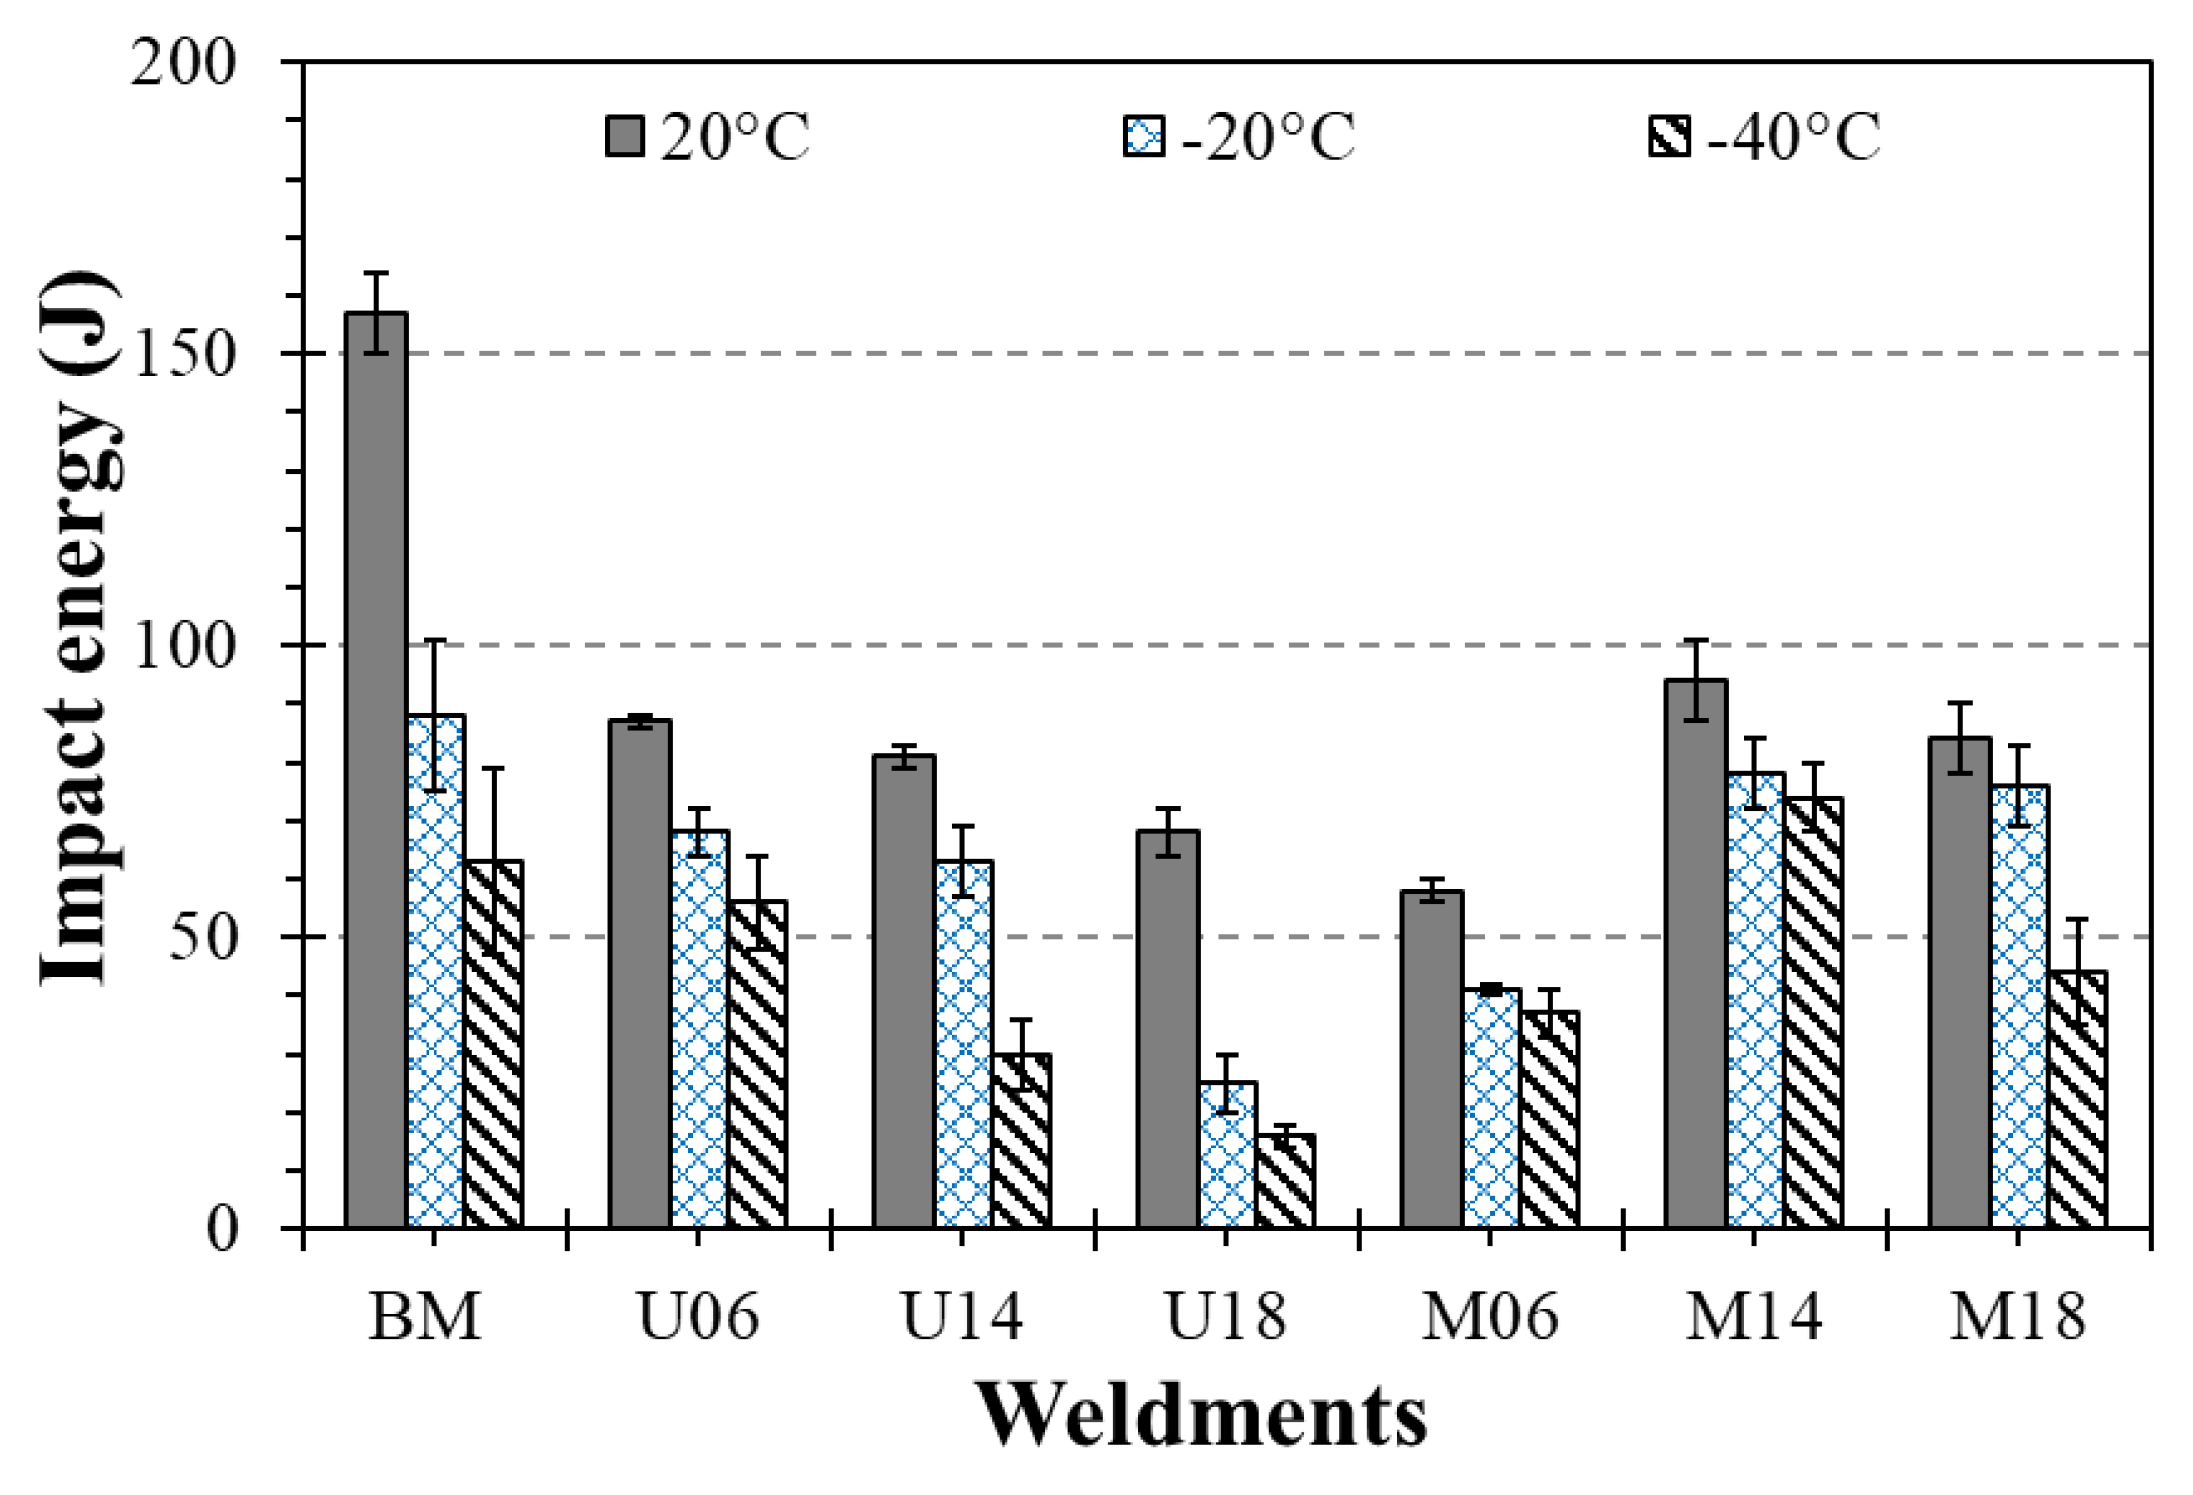
The Charpy V-notch impact test results obtained from the WM centerline specimens (Figure 15) reveal a strong dependence of impact resistance on both heat input and testing temperature for the two filler metal conditions evaluated. In undermatching weldments, the absorbed energy progressively decreases with increasing heat input and decreasing testing temperature (20 °C, −20 °C, and −40 °C), reflecting the combined effects of WM softening and microstructural change induced by the welding thermal cycle. In matching weldments, the intermediate heat input condition (M14) exhibited the highest absorbed energy values, particularly under subzero temperatures (−20 °C and −40 °C), indicating that a more favorable balance between strength, toughness, and microstructural homogeneity.
Low heat input (0.6 kJ/mm) promoted strength retention but reduced Charpy impact resistance, especially under matching conditions. This behavior is associated with increased microstructural heterogeneity and the formation of localized hard regions at the WM/CGHAZ interface, as evidenced by microhardness peaks approaching 400 HV. Although the Charpy notch was located at the weld metal centerline, local hardness gradients near the fusion boundary may also have influenced crack initiation and propagation. Therefore, the measured absorbed energy primarily reflects the toughness of the WM and adjacent fusion boundary rather than the minimum toughness of individual HAZ subzones.
As expected for HSLA steels, all welding conditions exhibited a progressive reduction in absorbed energy with decreasing testing temperature, consistent with the reduced plastic deformation capability and the increased tendency toward brittle fracture under subzero conditions.
Increasing heat input to intermediate levels (1.4 kJ/mm) reduced microstructural heterogeneity by promoting a more homogeneous WM microstructure and more homogeneous hardness distribution. As a result, crack propagation became more stable, requiring higher absorbed energy, particularly for the M14 condition. At higher heat input (1.8 kJ/mm), however, the absorbed energy did not increase further, despite the improved microstructural uniformity, because excessive softening reduced the load-bearing capacity of the welded joint. The superior impact performance of the M14 condition resulted from the combined effects of a higher qualitative fraction of acicular ferrite, improved weld metal microstructural homogeneity, smoother hardness transitions across the fusion boundary, and controlled HAZ softening. Together, these characteristics delayed crack initiation and promoted more stable crack propagation, particularly under subzero testing conditions.
The one-way ANOVA results (Table 10) for impact toughness at 20 °C indicate a highly significant effect of joint configuration (p-value = 0.00 < α = 0.05). This finding demonstrates that impact resistance at room temperature is strongly influenced by joint configuration (F-value = 215.48), likely due to changes in microstructure and in the distribution of brittle and ductile phases.
At −20 °C (Table 10), joint configuration also exhibits a statistically significant effect (p-value = 0.00 < α = 0.05), indicating that the influence of joint configuration persists under low-temperature conditions (F-value = 31.48). This result is particularly relevant, as it highlights the role of joint configuration in the ductile-to-brittle transition and in the material’s performance under more severe service conditions.
The ANOVA for Charpy impact toughness at −40 °C further confirms the significance of the joint configuration (p-value = 0.00 < α = 0.05), demonstrating that even at lower temperatures, joint configuration remains a key parameter governing impact resistance (F-value = 17.13). This behavior reinforces the importance of controlling joint configuration in applications subjected to low-temperature environments, where resistance to brittle fracture is critical.
Tukey’s HSD comparisons confirmed that Charpy impact resistance was significantly influenced by welding condition and testing temperature. At 20 °C, most weldments exhibited statistically significant differences (p-value < 0.05), although some conditions with similar heat input levels presented equivalent absorbed energy values.
At −20 °C and −40 °C, the number of statistically equivalent groups increased for specific welding conditions. In particular, the matching conditions M06 and M14 did not exhibit statistically significant differences in absorbed energy at subzero temperatures, suggesting that distinct combinations of WM strength, thermal cycle severity, and microstructural heterogeneity may lead to comparable crack propagation resistance under service conditions. This behavior indicates that the beneficial effect of reduced HAZ softening at low heat input may partially compensate for the increased local heterogeneity observed in the M06 condition.
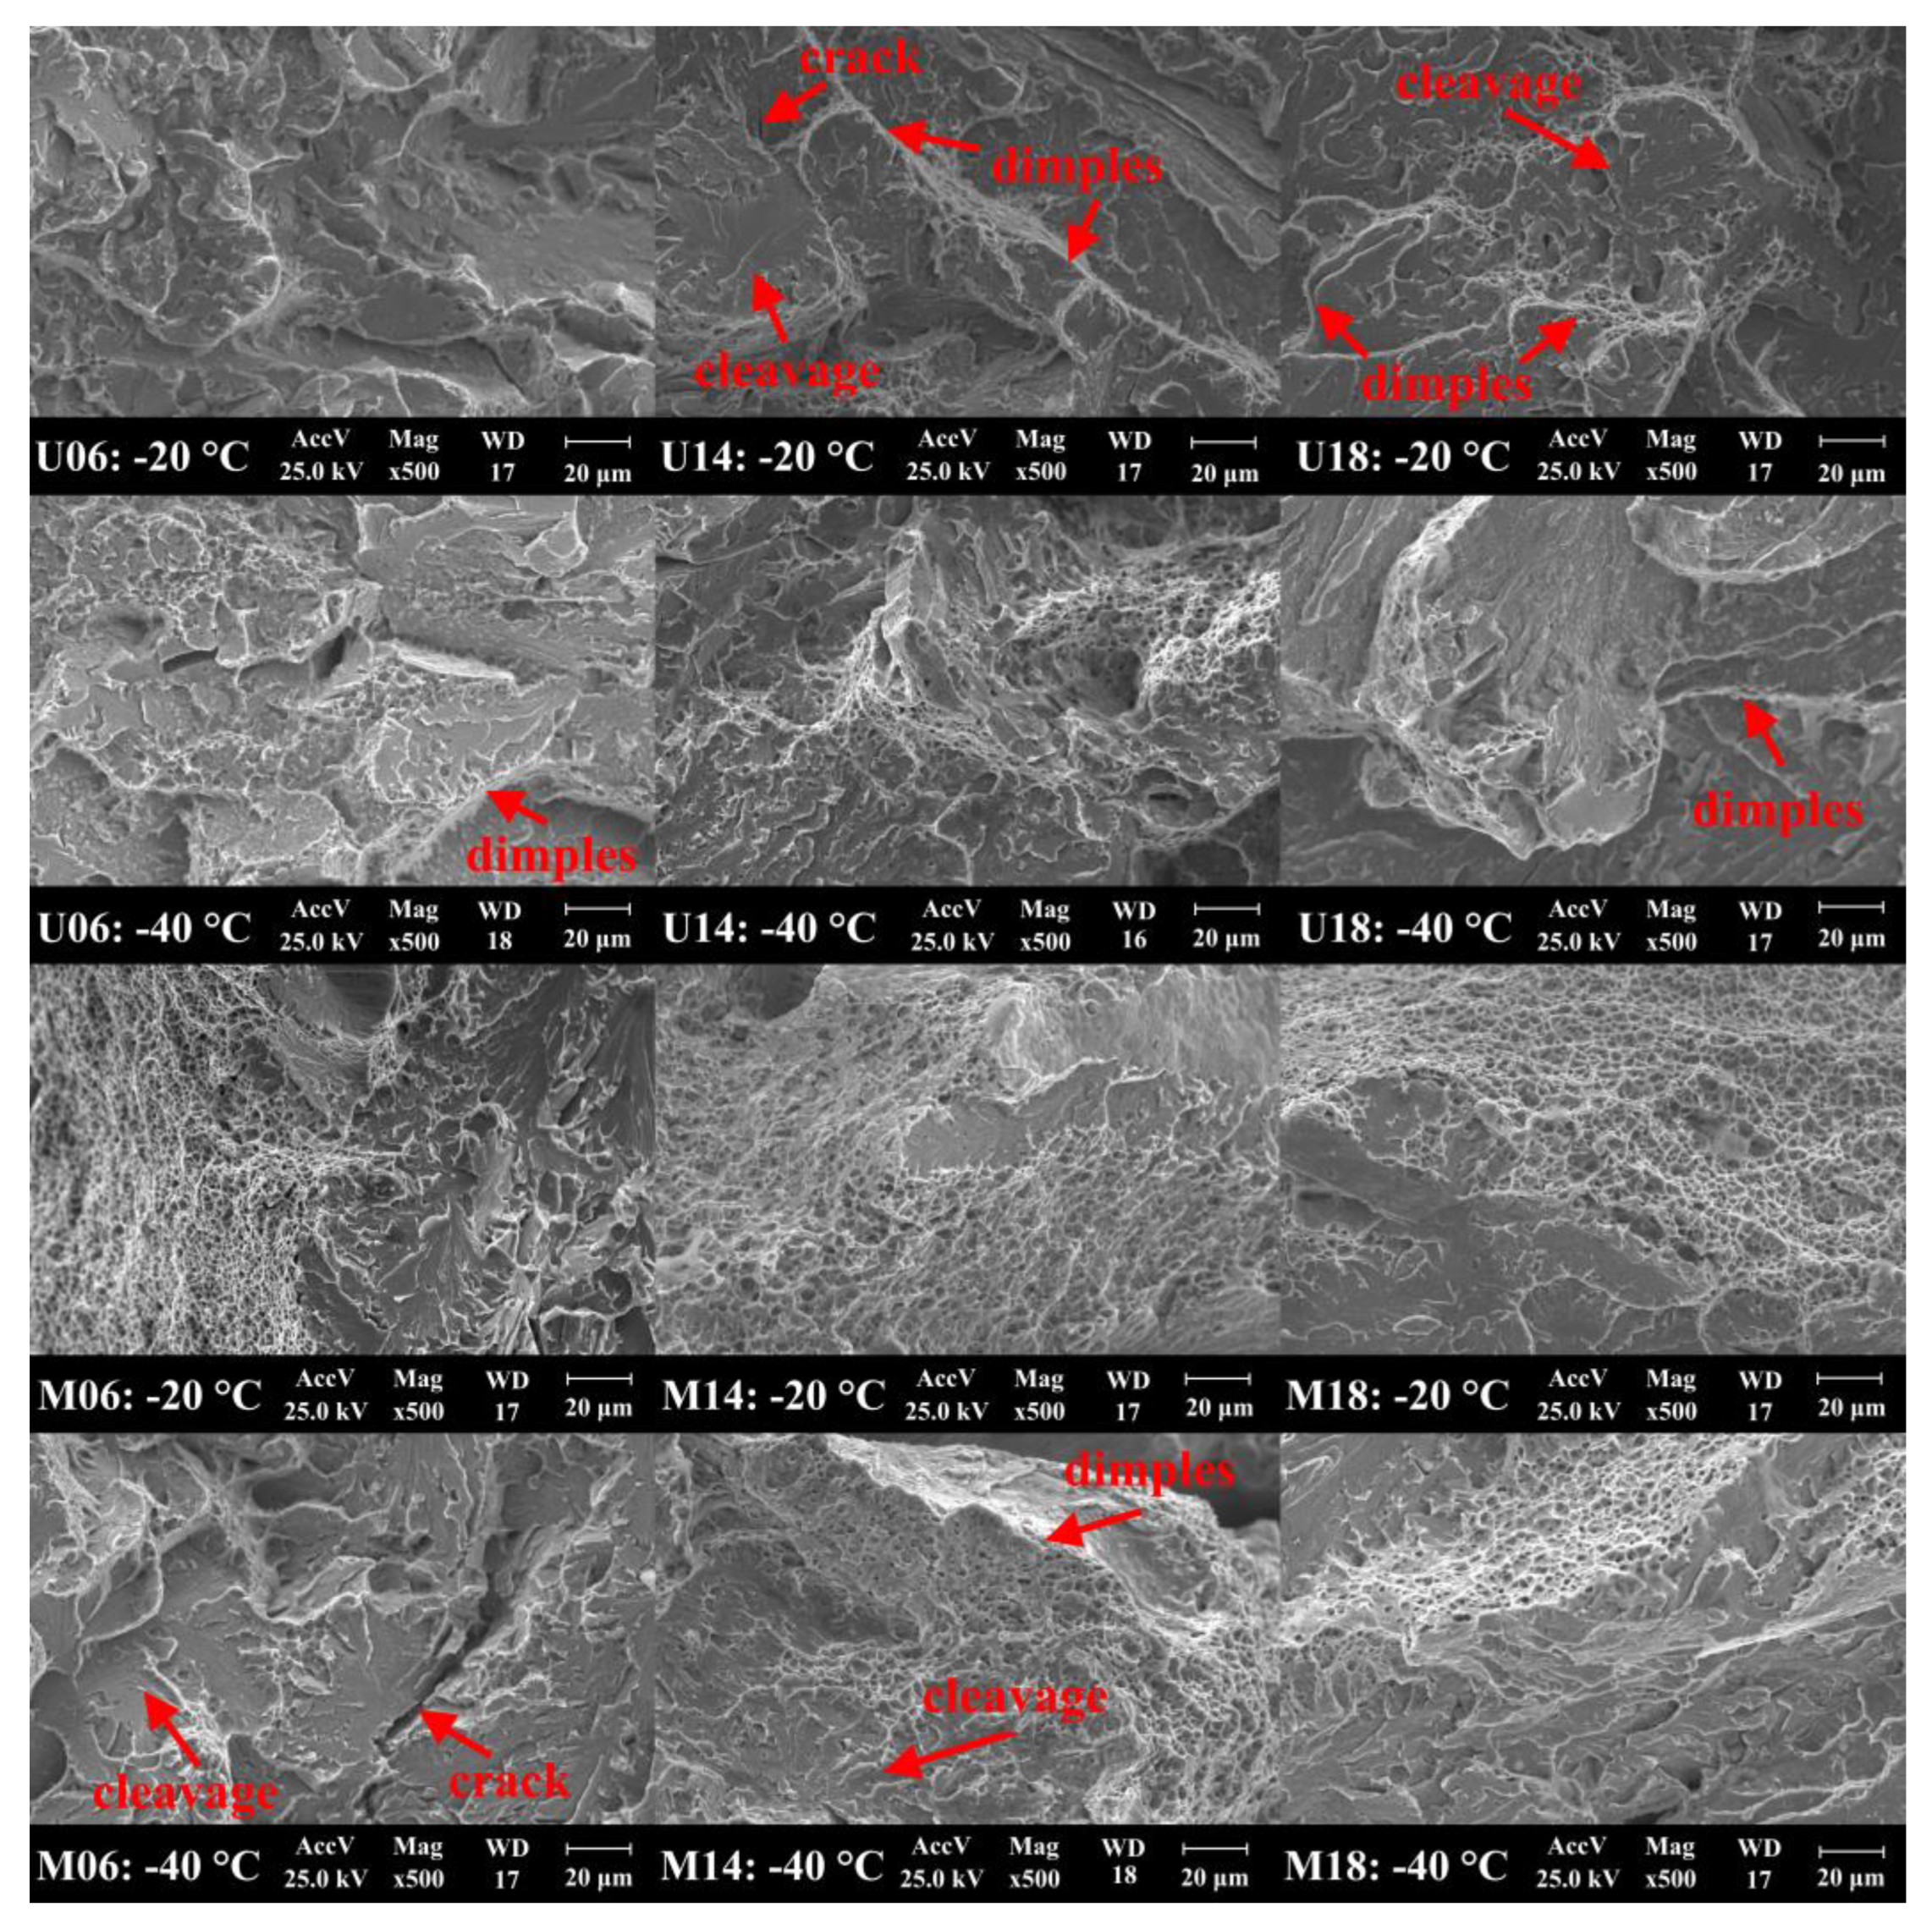
SEM fractographic observations (Figure 16) support the mechanical results. Low heat input conditions (U06 and M06) exhibited predominantly cleavage and quasi-cleavage features [44], reflecting the higher local hardness and increased microstructural heterogeneity near the fusion boundary. Intermediate heat input (U14 and M14) produced a mixed fracture mode characterized by cleavage facets and ductile dimples [31,49], consistent with the highest absorbed impact energy. At high heat input (U18 and M18), fracture became predominantly ductile; however, excessive HAZ softening reduced the load-bearing capacity of the welded joint, limiting the improvement in absorbed energy despite the more ductile fracture morphology.

4. Discussion

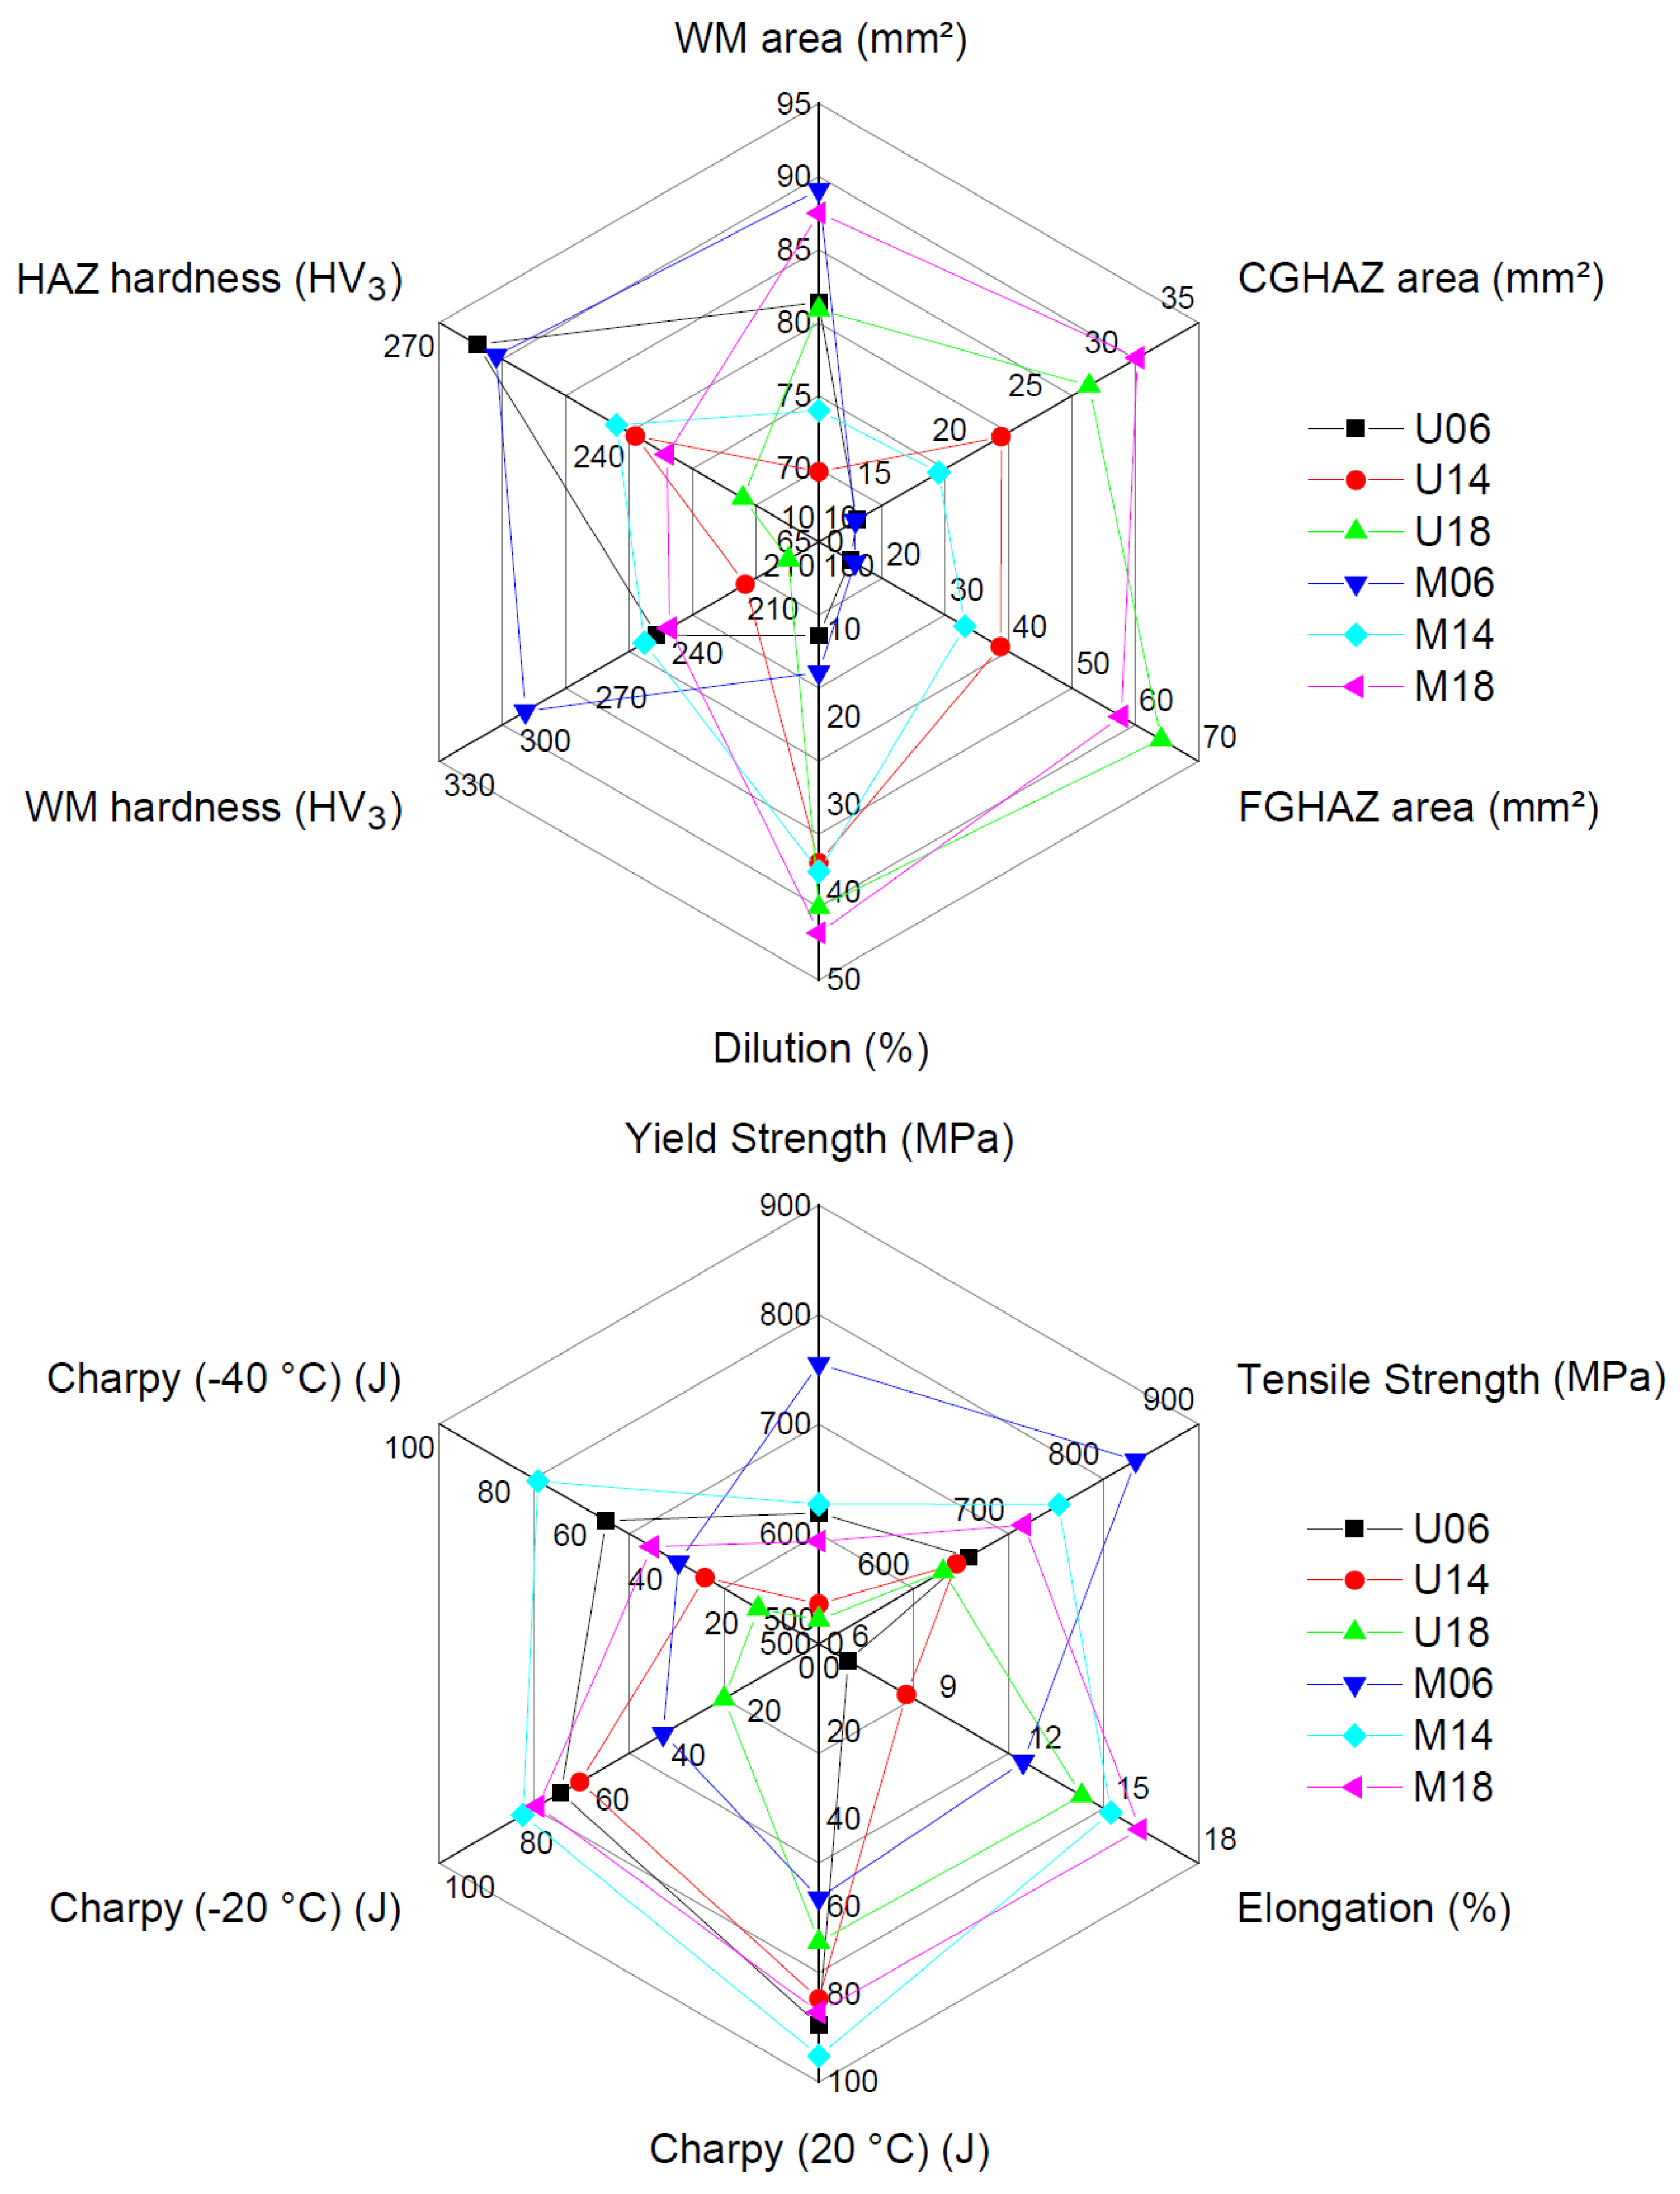
The present results demonstrate that the mechanical performance of GMAW-welded S700MC steel is governed by heat input through its influence on thermal-cycle severity, whereas filler metal strength plays a secondary but important role in stress redistribution and failure location. Figure 17 summarizes the integrated process–microstructure–property relationship established in this study, illustrating how heat input influences HAZ development, hardness distribution, tensile behavior, and impact resistance. The figure also highlights the role of filler metal strength matching in determining the critical region of the welded joints.
The systematic increase in HAZ dimensions with increasing heat input indicates that thermal-cycle severity increased progressively across the investigated welding conditions. Although direct thermal-cycle measurements were not performed, the observed microstructural evolution suggests a corresponding increase in cooling time (Δt8/5), resulting in wider transformed regions and greater thermal exposure of the TMCP microstructure. This behavior is consistent with previous studies on HSLA and TMCP steels, in which increasing heat input promotes HAZ expansion and modifies phase transformation behavior [26].
The observed softening is consistent with the degradation of the strengthening mechanisms responsible for the high strength of S700MC steel [21]. The strength of TMCP steels is derived from the combined effects of grain refinement, precipitation strengthening, and elevated dislocation density introduced during thermomechanical processing [29,46,50]. Increasing thermal exposure promotes recovery of the ferritic matrix and reduces the effectiveness of precipitation strengthening through precipitate coarsening and partial dissolution. Although direct precipitate characterization was not performed, the progressive reduction in hardness and tensile strength, together with the widening of the softened HAZ, is fully consistent with the softening mechanisms commonly reported for welded TMCP steels [43,51].
In addition to thermal effects, dilution may also have contributed to weld metal evolution. The higher dilution levels observed at intermediate and high heat inputs increased the participation of the S700MC base metal in the weld pool. Although weld metal composition was not measured, the higher dilution at intermediate and high heat inputs may have influenced phase balance. Nevertheless, the experimental results indicate that these dilution effects were secondary to the influence of heat input on thermal-cycle severity.
The hardness distribution provides further insight into the relationship between thermal cycle and mechanical performance. Increasing heat input progressively widened the softened HAZ and reduced hardness in both the HAZ and weld metal. In contrast, low heat input promoted localized hard zones near the WM/CGHAZ interface, where microhardness values approached 400 HV0.01. These localized hardness peaks indicate the formation of harder transformation products under rapid cooling conditions [52]. However, embrittlement cannot be attributed solely to peak hardness [53]. The abrupt transition between these localized hard regions and adjacent softened areas may generate local stress concentrations that facilitate crack initiation [54,55]. Because the hardness mapping strategy was not designed to quantify hardness gradients, a detailed gradient analysis was beyond the scope of the present work.
The transition in tensile fracture location provides additional evidence supporting this interpretation. Under low heat input, localized hard regions and microstructural heterogeneity near the WM/CGHAZ interface promoted stress concentration, making this region the preferential site for crack initiation and fracture. As heat input increased, progressive HAZ softening shifted the mechanically weakest region toward the softened HAZ, indicating a transition from localized interface embrittlement to global HAZ softening as the dominant failure mechanism, demonstrating that thermal degradation of the TMCP microstructure became the dominant factor controlling joint strength [54,55].
The tensile behavior also reflects the interaction between HAZ softening and strength matching [35,36]. Under undermatching conditions, the lower WM strength promoted strain localization within the WM and limited the overall joint strength. In contrast, matching consumables increased the load-carrying capacity and shifted the mechanically critical region depending on heat input [34]. Although microhardness peaks approaching 400 HV0.01 were detected near the fusion boundary, embrittlement cannot be attributed solely to peak hardness; rather, the combined effect of localized hard regions and microstructural heterogeneity likely facilitated crack initiation.
The impact resistance results further emphasize the importance of microstructural homogeneity. Low heat input favored strength retention but also increased microstructural heterogeneity, reducing resistance to crack propagation. Excessively high heat input promoted more homogeneous microstructures but resulted in severe HAZ softening and reduced load-bearing capacity. Consequently, neither extreme provided the most favorable overall performance. Instead, the intermediate heat input condition (1.4 kJ/mm), particularly when combined with matching filler metal, produced the most balanced response. This condition combined controlled HAZ softening with improved weld metal microstructural uniformity, smoother hardness transitions, and superior impact resistance, especially at subzero temperatures [56].
Fractographic observations support this interpretation. Low heat input conditions exhibited predominantly cleavage and quasi-cleavage features, indicating a greater tendency toward brittle fracture. Intermediate heat input promoted mixed fracture mechanisms characterized by the coexistence of cleavage facets and ductile dimples, consistent with improved toughness. At high heat input, fracture surfaces became predominantly ductile [31]; however, the associated HAZ softening limited the total absorbed energy despite the more ductile fracture morphology. These observations demonstrate that fracture behavior is governed not only by fracture mode but also by the load-bearing capacity of the surrounding microstructure.
For the investigated 10-mm-thick plates, an intermediate heat input (1.4 kJ/mm) provided the best balance between strength and toughness. While low heat input maximized strength retention, it also increased susceptibility to localized brittle behavior associated with microstructural heterogeneity. Conversely, excessive heat input promoted pronounced HAZ softening and reduced the load-bearing capacity of the welded joint. The intermediate heat input, particularly when combined with matching filler metal, minimized these adverse effects by providing a favorable combination of strength retention, impact resistance, and controlled HAZ softening.
The applicability of these findings is limited to 10-mm-thick S700MC plates welded under the investigated conditions. Thermal-cycle measurements (peak temperature and Δt8/5), weld metal phase quantification, and TEM characterization of precipitates were not performed, and Charpy specimens were extracted only from the weld metal centerline. Future studies including thermal-cycle monitoring, quantitative phase analysis, precipitate characterization, and toughness assessment of individual HAZ subzones would provide a more comprehensive understanding of the welding behavior of S700MC steel.

5. Conclusions

The combined effects of heat input and filler metal strength on the microstructural evolution and mechanical performance of MCAW butt-welded S700MC steel were systematically evaluated. Based on the experimental results and statistical analysis, the following conclusions can be drawn:
(1)
Heat input was the dominant parameter controlling HAZ evolution. Increasing heat input from 0.6 to 1.8 kJ/mm significantly enlarged the HAZ area, promoted progressive softening, reduced local hardness, and decreased joint strength. The ANOVA results confirmed the statistical significance of this effect.
(2)
Low heat input (0.6 kJ/mm) maximized strength retention but generated localized hardness peaks approaching 400 HV0.01 at the WM/CGHAZ interface, producing greater microstructural heterogeneity and increasing susceptibility to localized crack initiation.
(3)
Increasing heat input progressively reduced these localized hardness peaks and produced a more homogeneous hardness distribution. However, excessive thermal exposure promoted pronounced HAZ softening, shifting the fracture location from the fusion boundary toward the softened HAZ and reducing the overall load-bearing capacity of the welded joints.
(4)
Filler metal strength mainly affected stress redistribution and tensile performance. Matching consumables provided higher joint strength, whereas the undermatching condition promoted earlier strain localization within the weld metal.
(5)
The intermediate heat input (1.4 kJ/mm), particularly when combined with the matching filler metal, produced the most favorable process–microstructure–property relationship by providing the best compromise between tensile strength, impact toughness, hardness homogeneity, and controlled HAZ softening.
These findings demonstrate that optimizing heat input is more critical than filler metal strength for controlling the mechanical performance of welded S700MC steel, while appropriate strength matching further enhances the balance between strength and toughness required for demanding structural applications.

Author Contributions

Conceptualization, J.R.B.P. and R.L.D.; methodology, J.R.B.P. and I.G.M.; investigation, J.R.B.P.; formal analysis, J.R.B.P. and R.T.L.; data curation, J.R.B.P.; writing—original draft preparation, J.R.B.P.; writing—review and editing, R.L.D. and I.G.M.; supervision, I.G.M.; project administration, J.R.B.P. and I.G.M. All authors have read and agreed to the published version of the manuscript.

Funding

The authors received no financial support for the research, authorship, and/or publication of this article.

Institutional Review Board Statement

Not applicable.

Informed Consent Statement

Not applicable.

Data Availability Statement

The data supporting the findings of this study are available from the corresponding author upon reasonable request.

Acknowledgments

The authors acknowledge SSAB Special Steels for providing the S700MC steel and the Federal University of Rio Grande do Sul (UFRGS), through its Welding & Related Techniques Laboratory, for lending its equipment and infrastructure.

Conflicts of Interest

Author João Ricardo Boff Preichardt is employed by SSAB. The authors declare that this affiliation did not influence the study design, data collection, data analysis, interpretation of the results, manuscript preparation, or the decision to publish the findings. Prof. Ivan Guerra Machado was affiliated with the UFRGS during the development of this work. The remaining authors declare that the research was conducted in the absence of any commercial or financial relationships that could be construed as a potential conflict of interest.

Abbreviations

The following abbreviations are used in this manuscript:
ANOVAAnalysis of Variance
ASTMAmerican Society for Testing and Materials
BMBase Metal
CGHAZCoarse-Grained Heat-Affected Zone
ENEuropean Standard
FGHAZFine-Grained Heat-Affected Zone
GMAWGas Metal Arc Welding
HAZHeat-Affected Zone
HIHeat Input
HSLAHigh-Strength Low-Alloy
HSDHonestly Significant Difference
HVVickers Hardness
HV3Vickers Hardness (3 kgf load)
HV0.01Vickers Hardness (0.01 kgf load)
ICHAZIntercritical Heat-Affected Zone
MCAWMetal-Cored Arc Welding
SEMScanning Electron Microscopy
TMCPThermomechanical Controlled Processing
UTSUltimate Tensile Strength
WMWeld Metal
YSYield Strength

References

  1. Barsoum, Z.; Khurshid, M. Ultimate Strength Capacity of Welded Joints in High Strength Steels. Procedia Struct. Integr. 2017, 5, 1401–1408. [Google Scholar] [CrossRef]
  2. Tiwari, R.; Singh, I.V.; Manglik, A. Failure Analysis of GMAW Welded Weldox-700 Steel under High Cycle Fatigue. Eng. Fail. Anal. 2025, 171, 109360. [Google Scholar] [CrossRef]
  3. Schauenberg, A.S.; Rodríguez, R.Q.; Almeida, D.T.; Zanon, J.E.; Cunha, E.; Lopes, A.P.O.; Tonatto, M.L.P. Evaluating Thermal Gradient in GMAW Welding Process with a Novel Heat Source Model: Numerical and Experimental Approach. Eng. Struct. 2024, 318, 118724. [Google Scholar] [CrossRef]
  4. Tiwari, S.; Heo, S.; Park, N.; Reddy, N.G.S. Modeling Mechanical Properties of Industrial C-Mn Cast Steels Using Artificial Neural Networks. Metals 2025, 15, 790. [Google Scholar] [CrossRef]
  5. Azizi-Alizamini, H.; Militzer, M.; Poole, W.J. Austenite Formation in Plain Low-Carbon Steels. Metall. Mater. Trans. A 2011, 42, 1544–1557. [Google Scholar] [CrossRef]
  6. Zhu, B.; Chen, H.; Militzer, M. Phase-Field Modeling of Cyclic Phase Transformations in Low-Carbon Steels. Comput. Mater. Sci. 2015, 108, 333–341. [Google Scholar] [CrossRef]
  7. SSAB. Welding Handbook: A Guide to Better Welding of Hardox and Strenx, 2nd ed.; SSAB Oxelösund AB: Stockholm, Sweden, 2019. [Google Scholar]
  8. Alshawwa, O.; Mela, K.; Ahola, A.; Björk, T.; Koskimäki, M.; Tulonen, J.; Hyvärinen, A. High-Strength Steel S700 K-Joints: Experimental Investigation on Ultimate Resistance and Deformation Capacity. J. Constr. Steel Res. 2025, 227, 109317. [Google Scholar] [CrossRef]
  9. Horváth, A.; Kollár, D.; Kövesdi, B. Distortions and Residual Stresses of NSS, HSS and Hybrid Box Sections with Single-Bevel Butt Welds: An Experimental Study. Thin-Walled Struct. 2025, 208, 112834. [Google Scholar] [CrossRef]
  10. Yi, H.; Du, L.; Wang, G.; Liu, X. Strengthening Mechanism of a New 700 MPa Hot Rolled High Strength Steel. J. Iron Steel Res. Int. 2008, 15, 76–80. [Google Scholar] [CrossRef]
  11. Gong, P.; Palmiere, E.J.; Rainforth, W.M. Thermomechanical Processing Route to Achieve Ultrafine Grains in Low Carbon Microalloyed Steels. Acta Mater. 2016, 119, 43–54. [Google Scholar] [CrossRef]
  12. Zhao, J.; Jiang, Z. Thermomechanical Processing of Advanced High Strength Steels. Prog. Mater. Sci. 2018, 94, 174–242. [Google Scholar] [CrossRef]
  13. Azizi-Alizamini, H.; Militzer, M.; Poole, W.J. Formation of Ultrafine Grained Dual Phase Steels through Rapid Heating. ISIJ Int. 2011, 51, 958–964. [Google Scholar] [CrossRef]
  14. Poorhaydari, K.; Ivey, D.G. Precipitate Alterations in the Heat-Affected Zone of a Grade 100 Microalloyed Steel. J. Mater. Sci. 2011, 46, 4953–4963. [Google Scholar] [CrossRef]
  15. Schroeder, N.; Rhode, M.; Kannengiesser, T. Influence of Microalloying on Precipitation Behavior and Notch Impact Toughness of Welded High-Strength Structural Steels. Weld. World 2024, 68, 2647–2659. [Google Scholar] [CrossRef]
  16. Lu, J.; Omotoso, O.; Wiskel, J.B.; Ivey, D.G.; Henein, H. Strengthening Mechanisms and Their Relative Contributions to the Yield Strength of Microalloyed Steels. Metall. Mater. Trans. A 2012, 43, 3043–3061. [Google Scholar] [CrossRef]
  17. Wang, P.; Gomes, F.M.; Warchomicka, F.G.; Ernst, W.; Vallant, R.; Poletti, M.C.; Enzinger, N. The Effect of Thermomechanical Welding on the Microstructure and Mechanical Properties of S700MC Steel Welds. Weld. World 2024, 68, 1053–1069. [Google Scholar] [CrossRef] [PubMed]
  18. Laitila, J.; Keränen, L.; Larkiola, J. Effect of Enhanced Weld Cooling on the Mechanical Properties of a Structural Steel with a Yield Strength of 700 MPa. SN Appl. Sci. 2020, 2, 1888. [Google Scholar] [CrossRef]
  19. Wold, E. High Strength Low Alloy (HSLA) Cold Forming Steels. Mater. Des. 1990, 11, 243–246. [Google Scholar] [CrossRef]
  20. Dalcin, R.L.; Machado, I.G.; Gonzalez, A.R.; Mazzaferro, C.C.P. Bending Strength of Welded Joints in TMCP Steel Square Tubular Profiles “T” Connexions. Int. J. Eng. Technol. 2016, 5, 70–75. [Google Scholar] [CrossRef]
  21. Górka, J. Influence of the Maximum Temperature of the Thermal Cycle on the Properties and Structure of the HAZ of Steel S700MC. IOSR J. Eng. 2013, 3, 22–28. [Google Scholar] [CrossRef]
  22. Dalcin, R.L.; Machado, I.G.; Gonzalez, A.R.; Mazzaferro, J.A.E. Efeitos da energia de soldagem e consumível sobre a resistência à flexão simples de juntas soldadas em perfis tubulares de aço TMCP (Effects of Heat Input and Consumable on Simple Bending Strength of Welded Joints in TMCP Steel Tubular Profiles). Soldag. Insp. 2016, 21, 92–102. (In Portuguese) [Google Scholar] [CrossRef]
  23. Denisa, M.; Michal, J.; Tibor, V.; Lýdia, F.D.; František, N. Examination of Fatigue Life of HSLA Domex 700 MC Welded Joints. Transp. Res. Procedia 2021, 55, 533–537. [Google Scholar] [CrossRef]
  24. Górka, J.; Stano, S. Microstructure and Properties of Hybrid Laser Arc Welded Joints (Laser Beam-MAG) in Thermo-Mechanical Control Processed S700MC Steel. Metals 2018, 8, 132. [Google Scholar] [CrossRef]
  25. Gandhi, D.; Ghosh, P. Precipitation Behavior in Gas Metal Arc Welded Ferrite-Bainite Steels. Mater. Chem. Phys. 2025, 333, 130384. [Google Scholar] [CrossRef]
  26. Zhao, S.; Chen, J.; Chan, T.-M. Effect of Welding on Behaviours of High Strength Steel Welded Joints: A State-of-the Art Review. Structures 2026, 84, 111002. [Google Scholar] [CrossRef]
  27. Górka, J. Assessment of Steel Subjected to the Thermomechanical Control Process with Respect to Weldability. Metals 2018, 8, 169. [Google Scholar] [CrossRef]
  28. Chen, C.; Chiew, S.-P.; Zhao, M.-S.; Lee, C.-K.; Fung, T.-C. Influence of Cooling Rate on Tensile Behaviour of S690Q High Strength Steel Butt Joint. J. Constr. Steel Res. 2020, 173, 106258. [Google Scholar] [CrossRef]
  29. Dalcin, R.L.; Nicolini, L.F.; Preichardt, J.R.B.; Scheuer, C.J.; Lermen, R.T.; Machado, I.G. Static Bending Behavior of Welded Connections between Columns-to-Beam Square Hollow Sections in Strenx®700MC High-Strength Steel. J. Mater. Eng. Perform. 2026, 35, 10267–10283. [Google Scholar] [CrossRef]
  30. Neumann, M.; Hälsig, A.; Hensel, J. Influence of Welding Thermal Cycles on Properties of TMCP and Q&T Steels Evaluated by Thermo-Physical Simulation. Weld. World 2024, 68, 183–197. [Google Scholar] [CrossRef]
  31. Yang, F.; Zhang, S.; Niu, Z.; Gao, F.; Chen, C.; Gao, F.; Zhang, Z. Effect of Heat Input on Microstructure and Impact Toughness of X80 FCAW-S Weld Joint. J. Mater. Res. Technol. 2026, 41, 1727–1739. [Google Scholar] [CrossRef]
  32. Du, J.; Liu, H.; Wang, F.; Bao, W.; Li, H.; Liu, T. Effects of Heat Input on Microstructure Evolution, Mechanical and Corrosion Properties of TC4 Alloy by Keyhole TIG Welding. J. Mater. Res. Technol. 2023, 27, 5266–5277. [Google Scholar] [CrossRef]
  33. Mičian, M.; Frátrik, M.; Brůna, M. Softening Effect in the Heat-Affected Zone of Laser-Welded Joints of High-Strength Low-Alloyed Steels. Weld. World 2024, 68, 1497–1514. [Google Scholar] [CrossRef]
  34. Schneider, C.; Ernst, W.; Schnitzer, R.; Staufer, H.; Vallant, R.; Enzinger, N. Welding of S960MC with Undermatching Filler Material. Weld. World 2018, 62, 801–809. [Google Scholar] [CrossRef]
  35. John, M.; Kumar, P.A.; Bhat, K.U. Effect of Filler Wire Strength on High Strength Low Alloy Steels. Mater. Today Proc. 2022, 49, 1286–1293. [Google Scholar] [CrossRef]
  36. Da Silva Machado, T.; Machado, I.G. Structural Impact on High-Strength Low-Alloy Steel Structures Welded by Gas Metal Arc Welding with Nickel and Steel Filler Metals. J. Mater. Eng. Perform. 2025, 34, 27056–27069. [Google Scholar] [CrossRef]
  37. Njock Bayock, F.; Kah, P.; Mvola, B.; Layus, P. Effect of Heat Input and Undermatched Filler Wire on the Microstructure and Mechanical Properties of Dissimilar S700MC/S960QC High-Strength Steels. Metals 2019, 9, 883. [Google Scholar] [CrossRef]
  38. EN 10149-2; Hot-Rolled Flat Products Made High Yield Strengh Steels for Cold Forming—Part 2: Delivery Conditions for Thermomechanically Rolled Steels. BSI: London, UK, 1995.
  39. ASTM E8/E8M; Test Methods for Tension Testing of Metallic Materials. ASTM International: West Conshohocken, PA, USA, 2016.
  40. ASTM E384; Test Method for Knoop and Vickers Hardness of Materials. ASTM International: West Conshohocken, PA, USA, 2016.
  41. ASTM E112; Standard Test Methods for Determining Average Grain Size. ASTM International: West Conshohocken, PA, USA, 2012. [CrossRef]
  42. ASTM E23; Standard Test Methods for Notched Bar Impact Testing of Metallic Materials. ASTM International: West Conshohocken, PA, USA, 2024. [CrossRef]
  43. Strakova, D.; Jambor, M.; Novy, F.; Trsko, L. Microstructure Evolution in the Heat Affected Zone of the S960MC Weld Joint. Int. J. Adv. Manuf. Technol. 2025, 139, 3015–3025. [Google Scholar] [CrossRef]
  44. Hu, J.; Du, L.-X.; Xie, H.; Gao, X.-H.; Misra, R.D.K. Microstructure and Mechanical Properties of TMCP Heavy Plate Microalloyed Steel. Mater. Sci. Eng. A 2014, 607, 122–131. [Google Scholar] [CrossRef]
  45. Shen, Y.; Leng, J.; Wang, C. On the Heterogeneous Microstructure Development in the Welded Joint of 12MnNiVR Pressure Vessel Steel Subjected to High Heat Input Electrogas Welding. J. Mater. Sci. Technol. 2019, 35, 1747–1752. [Google Scholar] [CrossRef]
  46. Havula, J.; Rahman, M.; Oksanen, V.; Mela, K.; Uusitalo, J.; Kömi, J. Strength Model for Softened Heat-Affected Zone of S700 Butt-Welded Connections. J. Constr. Steel Res. 2025, 232, 109621. [Google Scholar] [CrossRef]
  47. Bose-Filho, W.W.; Carvalho, A.L.M.; Strangwood, M. Effects of Alloying Elements on the Microstructure and Inclusion Formation in HSLA Multipass Welds. Mater. Charact. 2007, 58, 29–39. [Google Scholar] [CrossRef]
  48. Mičian, M.; Frátrik, M.; Kajánek, D. Influence of Welding Parameters and Filler Material on the Mechanical Properties of HSLA Steel S960MC Welded Joints. Metals 2021, 11, 305. [Google Scholar] [CrossRef]
  49. Wang, X.; Xie, Z.; Su, W.; Shang, C. Role of Carbon Content on Microstructure Evolution and Impact Toughness in Coarse-Grained Heat-Affected Zone of High-Strength Steel. Metals 2023, 13, 106. [Google Scholar] [CrossRef]
  50. Wu, X.; Lin, H.; Luo, W.; Jiang, H. Microstructure and Microhardness Evolution of Thermal Simulated HAZ of Q&P980 Steel. J. Mater. Res. Technol. 2021, 15, 6067–6078. [Google Scholar] [CrossRef]
  51. Yan, R.; Xie, H.; Yang, F.; Veljkovic, M.; Zhao, X. A Macro Prediction Model for Butt-Welded (U)HSS Connections with Softened HAZ. J. Constr. Steel Res. 2023, 211, 108153. [Google Scholar] [CrossRef]
  52. Kumar, S.; Nath, S.K.; Kumar, V. Continuous Cooling Transformation Behavior in the Weld Coarse Grained Heat Affected Zone and Mechanical Properties of Nb-Microalloyed and HY85 Steels. Mater. Des. 2016, 90, 177–184. [Google Scholar] [CrossRef]
  53. Khan, A.R.; Yu, S.; Wang, H.; Jiang, Y. Effect of Cooling Rate on Microstructure and Mechanical Properties in the CGHAZ of Electroslag Welded Pearlitic Rail Steel. Metals 2019, 9, 742. [Google Scholar] [CrossRef]
  54. Qin, Z.; Ma, X.; Li, J.; Zhao, Y.; Zhang, Z.; Shan, C.; Liu, H.; Qi, Y.; Xie, Y.; Meng, X.; et al. High-Efficient Hybrid Arc and Friction Stir Additive Manufacturing of High-Performance Al-Cu-Mg-Ag-Zr Alloy: Microstructural Evolution and Precipitation Behaviors with Ω/L12 Co-Precipitates. J. Manuf. Process. 2024, 124, 1459–1470. [Google Scholar] [CrossRef]
  55. Wang, B.; Yang, W.; Li, P.; Qin, Z.; Dong, H. Influence of Different Welding Wires on the MIG Corner Joint Between TC4 Alloy and 616 High-Strength Steel. J. Mater. Eng. Perform. 2025, 34, 27190–27201. [Google Scholar] [CrossRef]
  56. Gomes Moojen, R.; Machado, I.G.; Antonio Esmério Mazzaferro, J.; Ruben Gonzalez, A. Cooling Rate Effects in the Welding of API 5L-X80 Steel. Weld. Int. 2017, 31, 100–110. [Google Scholar] [CrossRef]
Figure 1. Schematic representation of the single-V groove butt joint geometry for 10 mm thick S700MC steel plates, including groove angle and root opening, and the robotic MCAW setup with welding torch, clamping system, manipulator, and power source.
Jmmp 10 00230 g001
Figure 2. Geometry and dimensions of transverse tensile specimens with the weld centerline located at the midpoint of the gauge length.
Jmmp 10 00230 g002
Figure 3. Geometry and dimensions of Charpy V-notch specimens with the notch positioned at the weld metal centerline.
Jmmp 10 00230 g003
Figure 4. Transverse cross-section macro- and microstructures of the undermatching weldment U06 (0.6 kJ/mm), showing weld bead geometry and HAZ extension. 1 = base metal (BM); 2 = fine-grained heat-affected zone (FGHAZ); 3 = coarse-grained heat-affected zone (CGHAZ); 4 = weld metal (WM).
Jmmp 10 00230 g004
Figure 5. Transverse cross-section macro- and microstructures of the undermatching weldment U14 (1.4 kJ/mm), showing weld bead geometry and HAZ extension. 1 = base metal (BM); 2 = fine-grained heat-affected zone (FGHAZ); 3 = coarse-grained heat-affected zone (CGHAZ); 4 = weld metal (WM).
Jmmp 10 00230 g005
Figure 6. Transverse cross-section macro- and microstructures of the undermatching weldment U18 (1.8 kJ/mm), showing weld bead geometry and HAZ extension. 1 = base metal (BM); 2 = fine-grained heat-affected zone (FGHAZ); 3 = coarse-grained heat-affected zone (CGHAZ); 4 = weld metal (WM).
Jmmp 10 00230 g006
Figure 7. Transverse cross-section macro- and microstructures of the matching weldment M06 (0.6 kJ/mm), showing weld bead geometry and HAZ extension. 1 = base metal (BM); 2 = fine-grained heat-affected zone (FGHAZ); 3 = coarse-grained heat-affected zone (CGHAZ); 4 = weld metal (WM).
Jmmp 10 00230 g007
Figure 8. Transverse cross-section macro- and microstructures of the matching weldments M14 (1.4 kJ/mm), showing weld bead geometry and HAZ extension. 1 = base metal (BM); 2 = fine-grained heat-affected zone (FGHAZ); 3 = coarse-grained heat-affected zone (CGHAZ); 4 = weld metal (WM).
Jmmp 10 00230 g008
Figure 9. Transverse cross-section macro- and microstructures of the matching weldment M18 (1.8 kJ/mm), showing weld bead geometry and HAZ extension. 1 = base metal (BM); 2 = fine-grained heat-affected zone (FGHAZ); 3 = coarse-grained heat-affected zone (CGHAZ); 4 = weld metal (WM).
Jmmp 10 00230 g009
Figure 10. Representative optical micrographs and corresponding average grain size and hardness values measured in the base metal (BM), fine-grained heat-affected zone (FGHAZ), and coarse-grained heat-affected zone (CGHAZ) for the undermatching weldments (U06, U14, and U18). The figure highlights the influence of heat input on grain coarsening and hardness evolution in the HAZ regions. The schematic illustration presents the linear intercept method used for grain size determination according to ASTM E112.
Jmmp 10 00230 g010
Figure 11. Representative optical micrographs and corresponding average grain size and hardness values measured in the base metal (BM), fine-grained heat-affected zone (FGHAZ), and coarse-grained heat-affected zone (CGHAZ) for the matching weldments (M06, M14, and M18). The figure illustrates the effect of heat input on microstructural refinement/coarsening behavior and local hardness variations across the welded joint.
Jmmp 10 00230 g011
Figure 12. Vickers hardness (HV3) profiles measured 2 mm below the plate surface across the base metal (BM), heat-affected zone (HAZ), and weld metal (WM) for undermatching and matching weldments at different heat inputs (0.6, 1.4, and 1.8 kJ/mm).
Jmmp 10 00230 g012
Figure 13. (a) Average hardness values (HV3) for base metal (BM), heat-affected zone (HAZ), and weld metal (WM); (b) maximum microhardness values (HV0.01) at the WM/CGHAZ interface as a function of heat input and filler metal condition.
Jmmp 10 00230 g013
Figure 14. Average values of yield strength (YS), ultimate tensile strength (UTS), and elongation (EL) for all weldments as a function of heat input and filler metal strength condition.
Jmmp 10 00230 g014
Figure 15. Charpy V-notch impact energy as a function of temperature (20 °C, −20 °C, and −40 °C) for all weldments.
Jmmp 10 00230 g015
Figure 16. SEM fractographs of the weld metal (WM) in the crack propagation region of Charpy specimens tested at −20 °C and −40 °C for undermatching (U06, U14, U18) and matching (M06, M14, M18) conditions.
Jmmp 10 00230 g016
Figure 17. Correlation between hardness (WM and HAZ), tensile properties (yield strength, ultimate tensile strength, and elongation), impact resistance at 20 °C, −20 °C, and −40 °C, and CGHAZ/FGHAZ areas for all weldments, highlighting the strength–impact resistance balance as a function of heat input and filler metal condition.
Jmmp 10 00230 g017
Table 1. Chemical composition of S700MC high-strength low-alloy steel (wt.%).
CMnSiMoCrNiCoAlNbTiV
0.0481.730.0480.0980.1280.0290.0190.0260.0560.0790.001
Table 2. Mechanical properties of the S700MC base metal.
Yield Stress (MPa)Tensile Strength (MPa)Elongation (%)Hardness (HV3)
756 ± 11.0825 ± 2.523 ± 0.6292 ± 11.0
Table 3. Chemical composition of the filler metals used in this study (wt.%).
Filler MetalConditionCMnNiCrMoSiPS
E70C-6MUndermatching0.041.30.010.020.0030.550.0070.003
E110C-GMatching0.031.62.250.190.60.50.0070.003
Table 4. Mechanical properties of the filler metals, as provided by the manufacturer specifications.
Filler MetalConditionYield Stress (MPa)Tensile Strength (MPa)Elongation (%)Charpy-V (J)
E70C-6MUndermatching5005752850 (@ −30 °C)
E110C-GMatching8008501850 (@ −29 °C)
Charpy-V values correspond to absorbed energy at the indicated test temperature.
Table 5. Welding parameters and corresponding nominal heat input for each weldment condition.
WeldmentConditionCurrent (A)Voltage (V)Welding Speed (mm/s)Heat Input (kJ/mm)Passes
U06Undermatching3002610.40.64
3002610.43 × 0.6
U14Undermatching27029.510.60.62
300325.51 × 1.4
U18Undermatching27029.510.60.62
300324.31 × 1.8
M06Matching3002610.40.64
3002610.43 × 0.6
M14Matching3002610.40.62
300325.51 × 1.4
M18Matching3002610.40.62
300324.31 × 1.8
The root pass was performed at 0.6 kJ/mm for all weldments.
Table 6. Geometric characteristics of the weldments as a function of heat input and strength-matching condition.
WeldmentConditionWM Area (mm2)Reinforcement Area (mm2)Dilution (%)CGHAZ Area (mm2)FGHAZ Area (mm2)
U06Undermatching81.4 ± 1.5 20.7 ± 1.210.7 ± 0.712.5 ± 0.315.0 ± 0.7
U14Undermatching69.8 ± 0.4 4.5 ± 0.536.6 ± 2.622.0 ± 1.038.7 ± 1.3
U18Undermatching80.9 ± 1.8 12.8 ± 1.841.7 ± 3.727.8 ± 0.764.1 ± 2.1
M06Matching89.1 ± 1.2 13.1 ± 2.314.9 ± 3.112.4 ± 0.515.7 ± 0.8
M14Matching74.0 ± 0.9 8.9 ± 0.937.6 ± 3.017.9 ± 1.433.1 ± 0.5
M18Matching87.5 ± 2.4 6.1 ± 1.044.6 ± 4.931.0 ± 2.257.8 ± 1.5
The root pass was performed at 0.6 kJ/mm for all weldments. Low heat input conditions (U06 and M06) were produced using four passes, whereas intermediate (U14 and M14) and higher (U18 and M18) heat input conditions were produced using two passes.
Table 7. Results of two-way ANOVA for CGHAZ and FGHAZ areas, including main and interaction effects of heat input and joint configuration.
ANOVA for CGHAZ Area (mm2)
EffectSum of SquaresDegree of FreedomMean SquareF-Valuep-Value
Joint configuration0.5010.500.350.56
Heat input865.712432.85300.940.00 *
Joint configuration × heat input40.09220.0413.930.00 *
Error17.26121.44
ANOVA for FGHAZ Area (mm2)
EffectSum of SquaresDegree of FreedomMean SquareF-Valuep-Value
Joint configuration56.18156.1833.710.00 *
Heat input6343.4723171.741903.040.00 *
Joint configuration × heat input40.33220.1712.100.00 *
Error20.00121.67
* p-value = 0 when results tend to zero.
Table 8. Results of two-way ANOVA for weld metal (WM) and one-way ANOVA for heat-affected zone (HAZ) hardness.
ANOVA for WM Hardness (HV3)
EffectSum of SquaresDegree of FreedomMean SquareF-Valuep-Value
Joint configuration966119661215.480.00 *
Heat input966724834107.810.00 *
Joint configuration × heat input1092541.220.33
Error5381245
ANOVA for HAZ hardness (HV3)
EffectSum of SquaresDegree of FreedomMean SquareF-Valuep-Value
Joint configuration9911616525.6430.00 *
Error409814293
* p-value = 0 when results tend to zero.
Table 9. Results of one-way ANOVA for tensile properties, including yield strength, ultimate tensile strength, and elongation.
ANOVA for Yield Strength (MPa)
EffectSum of SquaresDegree of FreedomMean SquareF-Valuep-Value
Joint configuration160,477626,746627.10.00 *
Error5971443
ANOVA for Tensile Strength (MPa)
EffectSum of SquaresDegree of FreedomMean SquareF-Valuep-Value
Joint configuration127,341621,22324860.00 *
Error120149
ANOVA for Elongation (%)
EffectSum of SquaresDegree of FreedomMean SquareF-Valuep-Value
Joint configuration563.143693.85715.2890.00 *
Error85.940146.139
* p-value = 0 when results tend to zero.
Table 10. Results of one-way ANOVA for Charpy impact resistance at 20 °C, −20 °C, and −40 °C.
ANOVA for Impact Resistance (20 °C)
EffectSum of SquaresDegree of FreedomMean SquareF-Valuep-Value
Joint configuration966119661215.480.00 *
Error5381245
ANOVA for Impact Resistance (−20 °C)
EffectSum of SquaresDegree of FreedomMean SquareF-Valuep-Value
Joint configuration9102.0061517.0031.480.00 *
Error674.671448.19
ANOVA for Impact Resistance (−40 °C)
EffectSum of SquaresDegree of FreedomMean SquareF-Valuep-Value
Joint configuration7240.2961206.7117.130.00 *
Error986.001470.43
* p-value = 0 when results tend to zero.
Disclaimer/Publisher’s Note: The statements, opinions and data contained in all publications are solely those of the individual author(s) and contributor(s) and not of MDPI and/or the editor(s). MDPI and/or the editor(s) disclaim responsibility for any injury to people or property resulting from any ideas, methods, instructions or products referred to in the content.