Article

Addressing Data Scarcity in Additive Manufacturing Monitoring via Synthetic Data Generation and Meta Pseudo-Labeling for Foundational Layer-Wise Segmentation

by
Yie Sheng Chen
1,*,
Petro Mushidi Tshakwanda
1,
Henok Berhanu Tsegaye
1,*,
Jin Zhang
1,
Harsh Kumar
2 and
Michael Devetsikiotis
1
1
Department of Electrical and Computer Engineering, University of New Mexico, Albuquerque, NM 87131, USA
2
R.B. Annis School of Engineering, University of Indianapolis, Indianapolis, IN 46227, USA
*
Authors to whom correspondence should be addressed.
J. Manuf. Mater. Process. 2026, 10(6), 183; https://doi.org/10.3390/jmmp10060183
Submission received: 18 April 2026 / Revised: 19 May 2026 / Accepted: 25 May 2026 / Published: 27 May 2026
(This article belongs to the Special Issue AI in Additive Manufacturing)

Abstract

Additive manufacturing (AM) monitoring is fundamentally constrained by the severe scarcity of annotated data for layer-wise segmentation. This paper addresses this bottleneck by introducing a scalable, high-fidelity synthetic data generation pipeline built on the Slice-100K dataset, capable of producing large volumes of layer-wise semantic segmentation masks. Through analysis of this large-scale synthetic data, we identify a systemic foreground–background class imbalance (1:24 ratio) inherent to AM monitoring, which causes standard Dice loss formulations to diverge catastrophically into a phenomenon we formalize as the “Dice Crash.” To effectively leverage large amounts of unlabeled data, we adapt the Meta Pseudo-Labeling (MPL) framework for industrial segmentation. We evaluate MPL’s true marginal utility by integrating it with both a standard U-Net and a robust state-of-the-art nnU-Net architecture. Experimental outputs show that while MPL yields substantial performance gains (+15.2%) on weak baselines, integrating it with an optimally configured strong baseline consistently improves segmentation accuracy and suppresses false foreground detections, thereby mitigating confirmation bias. These findings demonstrate that semi-supervised learning via continuous bilevel optimization offers a practical and robust enhancement to data-scarce additive manufacturing monitoring. Because any hidden defects in the topmost layer will be permanently buried by subsequent extrusion, this foundational layer-wise segmentation step is the most critical primitive of the monitoring pipeline.

1. Introduction

Among the seven ISO/ASTM additive manufacturing process categories, Material Extrusion (MEX) is one of the most common and accessible [1]. In desktop polymer printing, MEX is commonly implemented as Fused Filament Fabrication (FFF), while construction-scale systems may use analogous paste-extrusion approaches such as concrete or regolith-based extrusion. While historically relegated to versatile prototyping, FFF is increasingly scaling up to mission-critical applications where direct human intervention is impossible. A prime example is autonomous, in situ habitat construction for off-world exploration (e.g., lunar or Martian outposts), where full manufacturing autonomy is not merely a convenience but a necessity. To support this wave of autonomous Industry 5.0 applications, deploying machine learning to monitor the 3D printing process is critical for achieving high precision and enabling early-abort mechanisms when a defect occurs. However, monitoring a live print poses a fundamental computer vision challenge due to visual ambiguity. As characterized by Tran et al. [2], newly deposited material fuses with the underlying structure of the exact same color and texture. This creates the “Top Layer/Previous Layer” (TL/PL) problem, where the lack of visual contrast makes it exceedingly difficult for vision systems to isolate the newly extruded filament from the rest of the print.
Compounding this inherent visual ambiguity, 3D printing is also susceptible to various physical failures [3]. A foundational step toward detecting such anomalies is layer-wise segmentation, which provides the AI with the visual perception capability needed to isolate the printed region from a visually cluttered scene and to support downstream defect analysis. Once an accurate segmentation mask of the topmost layer is generated, it serves as a clean, binarized record of what the printer actually deposited. By spatially registering this mask with the rendered digital blueprint (G-code), defect detection is transformed into a direct pixel-wise comparison, effectively proofreading the printer’s work in real time using standard spatial overlap metrics like Intersection-over-Union (IoU) or residual difference mapping. Because any hidden defects in the topmost layer will be permanently buried by subsequent extrusion, this upstream segmentation step is the most critical foundation of the monitoring pipeline.
Despite this recognized need, developing reliable AI models is bottlenecked by the severe scarcity of annotated data. According to [4], large-scale layer-wise segmentation datasets simply do not exist because manual pixel-level annotation is prohibitively slow and expensive. This labeling bottleneck led us to investigate two complementary solutions to address the dataset problem: first, a scalable method to generate synthetic layer-wise segmentation datasets, as in [5], to bootstrap foundation models; and second, Meta-Pseudo-Labeling (MPL) to harness the vast amounts of raw, unlabeled monitoring footage. By transforming the training process into a continuous teacher–student feedback loop, MPL acts as a “universal learner,” capable of adapting to unannotated data streams without continuous manual human intervention.
To address the dataset bottleneck that hinders AM defect segmentation research, this paper makes the following three core contributions:
  • High-fidelity synthetic data generation pipeline: we introduce a scalable, automated framework capable of rendering vast repositories of 3D assets into millions of dense, layer-wise semantic segmentation masks, overcoming the critical bottleneck of data scarcity.
  • Semi-supervised defect segmentation (MPL): we introduce Meta-Pseudo-Labeling to the additive manufacturing domain, integrating it on top of both a standard U-Net baseline and a robust nnU-Net architecture to effectively leverage unlabeled synthetic data.
  • Analysis of extreme class imbalance: we rigorously document the severe foreground–background sparsity (1:24 ratio) inherent to layer-wise 3D printing tasks, providing both empirical validation and a theoretical formulation of how this sparsity destabilizes standard loss functions (“Dice Crash”).
The rest of this paper is organized as follows: Section 2 reviews the related work. Section 3 details the methodology, explicitly separating our engineering contributions (the scalable synthetic data pipeline) from our algorithmic contributions (MPL integration). Section 4 presents the empirical findings, validating the class-imbalance phenomena and the effectiveness of MPL on an isolated holdout set. Finally, Section 5 discusses limitations and concludes this paper.

2. Background and Related Work

To provide context for our proposed framework, this section reviews the foundational concepts and existing literature relevant to our study. We first introduce the principles of Meta-Pseudo-Labeling (Section 2.1) and the architectures of U-Net and nnU-Net (Section 2.2). We then discuss the taxonomy of defects in Fused Filament Fabrication (Section 2.3). Finally, we survey recent advancements in vision-based additive manufacturing monitoring, highlighting the persistent challenge of dataset scarcity (Section 2.4).

2.1. The Fundamentals of Meta-Pseudo-Labeling

Meta-Pseudo-Labeling (MPL) formulates pseudo-label generation as a bilevel optimization problem rather than a fixed self-training heuristic. Instead of passively imitating teacher predictions, the student is trained on pseudo-labels that are explicitly optimized to improve supervised performance on labeled data. This perspective connects MPL to gradient-based meta-learning and hyperparameter optimization frameworks [6,7,8,9].
Let θ T and θ S denote the parameters of the teacher and student networks, respectively. Given labeled data D L and unlabeled data D U , MPL can be written as the bilevel problem:
min θ T L s u p θ S ( θ T ) s . t . θ S ( θ T ) = arg min θ S L P L ( θ T , θ S ) ,
where L s u p is the supervised loss on D L and L P L is the pseudo-label loss on D U . The outer gradient
θ T L s u p ( θ S ( θ T ) )
is the outer (bilevel) gradient, since it differentiates through the solution of the inner optimization problem [7]. Exact computation would require backpropagation through the entire student training trajectory, which is infeasible for large-scale deep networks.
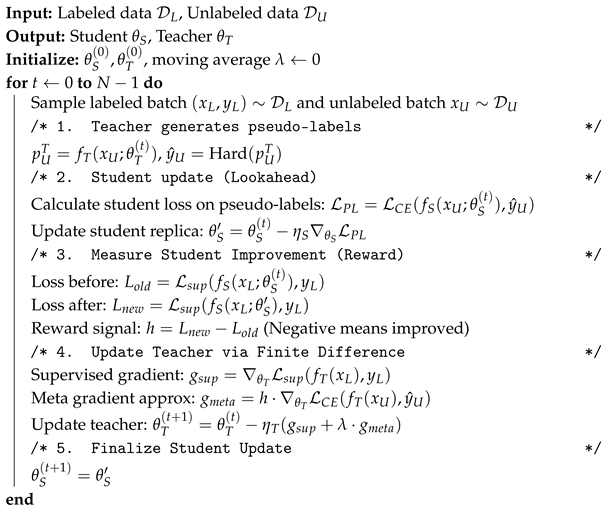
MPL therefore adopts a one-step approximation. A student update is computed as follows:
θ S = θ S η S θ S L P L ( θ T , θ S ) ,
and the resulting supervised improvement
h = L s u p ( θ S ) L s u p ( θ S )
serves as a finite-difference estimate of the bilevel update signal. Multiplying this scalar signal with the gradient of the teacher pseudo-label objective yields a scalable first-order approximation of the true bilevel gradient.
The choice of pseudo-label representation further shapes the nature of this gradient signal. If pseudo-labels are sampled as discrete one-hot variables, the teacher update formally involves the gradient of an expectation over sampled labels, which leads to a score-function estimator analogous to REINFORCE [10]. In contrast, soft pseudo-label probabilities render the teacher–student interaction fully differentiable, eliminating the need for stochastic gradient estimators and enabling standard backpropagation [6]. In our segmentation adaptation, we adopt hard pseudo-labels (sigmoid-thresholded at 0.5, with low-confidence regions suppressed) and leverage the finite-difference dot-product signal h as the teacher reward, which retains the bilevel structure without requiring explicit stochastic gradient estimation.
Conceptually, MPL forms a closed feedback loop: the teacher proposes pseudo-labels, the student learns from them, and the teacher is rewarded only when the student improves on labeled data. This mechanism mitigates confirmation bias in semi-supervised learning and explains the strong empirical performance of MPL across vision tasks [6].

2.2. Fundamentals of U-Net and nnU-Net

The U-Net architecture, introduced by Ronneberger et al. [11], revolutionized biomedical image segmentation by combining a contracting encoder path with an expanding decoder path. The key innovation lies in its skip connections, which concatenate high-resolution feature maps from the encoder with the decoder’s upsampled features. This mechanism allows the network to recover fine-grained spatial details lost during pooling, enabling precise localization essential for medical and industrial inspection tasks.
However, U-Net’s performance is highly sensitive to hyperparameters such as patch size, preprocessing, and topology, which are often manually tuned for specific datasets. To address this, Isensee et al. introduced nnU-Net (no-new-Net) [12,13], a framework that automates the configuration of the entire segmentation pipeline. Unlike architectural variants that introduce complex modules (e.g., attention mechanisms or dense connections), nnU-Net retains a vanilla U-Net structure while rigorously optimizing the end-to-end training pipeline configuration.
nnU-Net dynamically adapts to the “fingerprint” of a new dataset by automatically setting:
  • Preprocessing: resampling strategies and intensity normalization (e.g., z-scoring vs. clipping) based on modality and voxel spacing.
  • Network topology: configuring the number of pooling operations, kernel sizes, and feature map depths, ensuring the receptive field covers the input patch while fitting within GPU memory constraints.
  • Training schedule: utilizing a robust combination of Dice and Cross-Entropy loss with a large smoothing constant (smooth = 1) and batch-level loss aggregation (batch_dice=True), along with extensive on-the-fly data augmentation (rotation, scaling, elastic deformation) to prevent overfitting on small datasets.
By systematizing these design choices, nnU-Net serves as a robust, self-adapting baseline that frequently outperforms manually designed architectures, making it an ideal foundation for evaluating our semi-supervised MPL approach.

2.3. Fundamentals of Defects in Additive Manufacturing

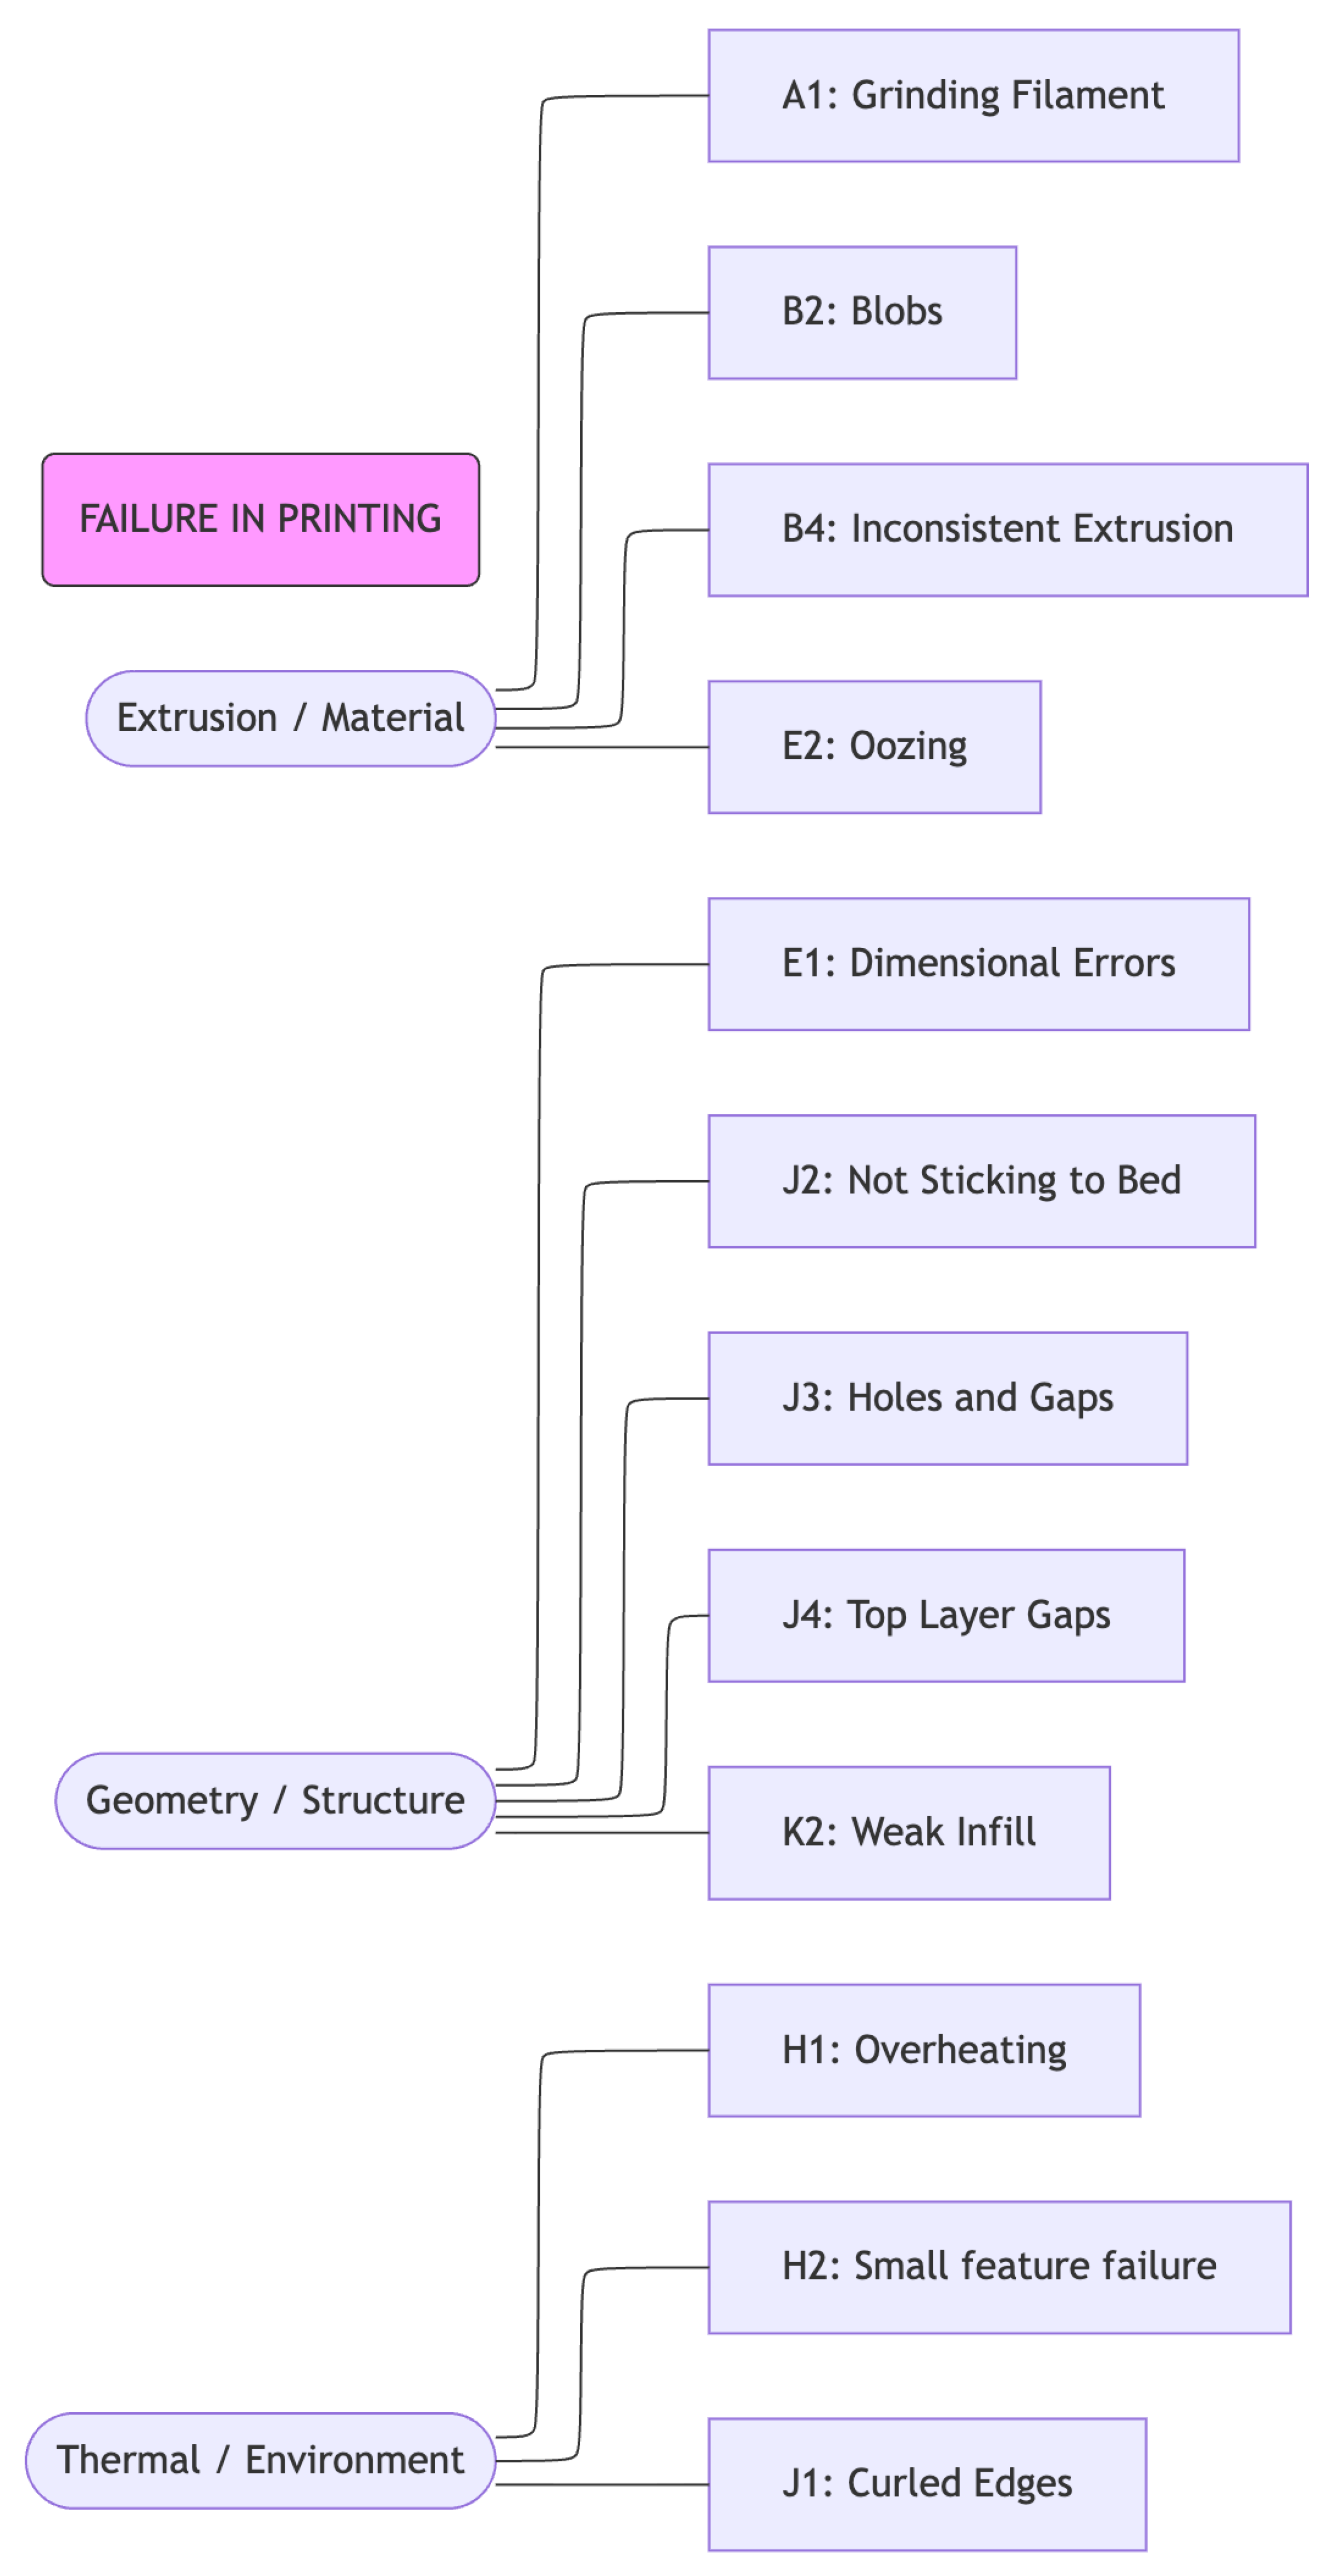
As detailed in [3], Fused Filament Fabrication (FFF) is susceptible to a wide array of physical defects that compromise structural integrity and geometric fidelity. These defects can be broadly categorized into extrusion anomalies, dimensional inaccuracies, and thermal-induced deformities. Extrusion anomalies include interruption due to clogged nozzles or material grinding, as well as inconsistent flow leading to blobs or wavy surface patterns. Dimensional errors arise from under- or over-extrusion, often exacerbated by first-layer adhesion issues like “elephant foot.” Thermal defects such as warping, curling, and overheating occur when cooling rates are mismatched with the material’s melting properties, particularly in high-temperature polymers like ABS. Furthermore, layer-specific failures, including layer separation (delamination), shifting, and missing layers, directly undermine the layer-wise construction principle of AM. Understanding this taxonomy of failures motivates using top-layer segmentation as the foundational monitoring primitive, as illustrated by the fault tree subset in Figure 1.
Table 1 enumerates all intermediate and undeveloped fault events derived from this tree, annotated by whether each fault manifests as a top-layer-visible symptom.
The occurrence of these faults is rooted in the fundamental mechanics of FFF. Fused Filament Fabrication constructs 3D geometries by extruding semi-molten thermoplastic material through a heated nozzle along a computer-controlled trajectory. This trajectory is defined by G-code, a numerical control programming language that specifies the spatial coordinates ( x , y , z ) , extrusion rates (E), and travel speeds (F) for each layer. In an ideal process, the physical deposition matches this digital instruction perfectly. However, stochastic environmental factors and hardware limitations often introduce discrepancies between the G-code “ideal” and the physical “actual”, necessitating real-time visual verification.
Rabbaa et al. [14] provided a comprehensive foundation for understanding FFF hardware, covering physical construction, mathematical modeling, processor integration, and stepper motor programming. Complementing this, Jadhav et al. [15] demonstrated a practical deployment of real-time LLM-assisted monitoring, detailing their specific printer setup, firmware configuration, and image acquisition pipeline, which serve as a concrete blueprint for future IoT integration of learned segmentation models.

2.4. Related Work

Xiao et al. [16] of the FLARE2022 challenge [17] explored the use of Meta-Pseudo Labeling (MPL) [6] for medical image segmentation. While MPL demonstrates potential, its implementation remains closed-source and specific to volumetric data. Our work bridges this gap by providing an open-source, reproducible adaptation of MPL for additive manufacturing, specifically addressing the extreme foreground–background imbalance (1:24) inherent in industrial defect detection.
The scarcity of annotated segmentation datasets in additive manufacturing is well-documented. Liu et al. [4] conducted a systematic review across 9 major dataset repositories and the top-ranked AM journal, identifying only 10 open image datasets suitable for AM applications, of which only 1–2 provided annotations for microstructure defect segmentation in melt pools. This scarcity is further corroborated by Zhang et al. [18], whose review of 144 ML-assisted AM studies found that the majority of datasets contain fewer than 1000 instances, with only 13 studies reporting datasets with more than 10,000 samples. Both reviews emphasize the need for robust methodologies that can operate effectively with limited labeled data, a key motivation for our MPL-based approach. This data scarcity is severe enough that some comparative studies, such as that of Werkle et al. [19], explicitly eschew data-driven approaches entirely in favor of classical computer vision (e.g., Canny Edge detection), citing dataset acquisition difficulty as the primary barrier, further reinforcing the need for our synthetic data generation pipeline.
Other approaches, such as those proposed in [20], have demonstrated effective real-time control by using image classification to predict discrete process-parameter states (e.g., flow rate, Z-offset) and issuing corrective G-code commands. However, such classification-centric approaches are fundamentally constrained to the discrete error states observed during training and may miss non-systematic, local geometric defects, such as material blobs or partial delamination, that can occur even under nominally correct parameter settings. This work complements this direction by providing a trained segmentation model capable of performing dense, pixel-wise geometric comparison, a model whose learned representations could be directly applied to such control loops in future work.
The scale of publicly available benchmarks further underscores this scarcity. While large image-level classification datasets exist (e.g., over 1.2 M images in [21]) and object detection datasets for coarse bounding-box tracking have been developed (e.g., [22,23]), pixel-wise segmentation data remains critically limited. To identify subtle extrusion anomalies without dense masks, recent works have focused on classification-based approaches: Li et al. [24] apply a Weakly Supervised Data Augmentation Network (WSDAN) to classify four extrusion state patterns from only 1000 images at the nozzle; Wu [25] uses an AR overlay framework combined with classical ML classifiers to detect deviations, bypassing learned pixel-wise segmentation entirely. Even when true layer-wise segmentation is attempted, the datasets are severely constrained. For example, Mehta and Shao [26] employed U-Net within a Federated Learning framework to enable collaborative model training; however, their evaluation relied on the open-source Peregrine (v2021-03) dataset [27], which contains only 60 explicitly annotated layers. These limitations collectively highlight why robust methods that can learn from limited, unlabeled data, such as our MPL-based approach, are essential for practical FFF monitoring.
Furthermore, architectural advancements in AM monitoring have sought to directly integrate digital fabrication instructions into the inference pipeline. For instance, Tran et al. [2] proposed GG-Net, a specialized U-Net architecture that uses Spatial Transformer Networks (STNs) and cross-attention mechanisms to jointly perform G-code alignment and layer segmentation within a single end-to-end model. Note that geometric alignment with the G-code blueprint is a general requirement of any complete defect detection pipeline, and the distinction of GG-Net is that it internalizes this alignment within the learned model. In contrast, our work focuses on the upstream problem of training robust segmenters: rather than designing a custom end-to-end architecture, we leverage G-code offline to synthesize massive annotated training datasets, allowing standard, highly optimized architectures (like nnU-Net) to learn strong pixel-wise representations, with MPL further exploiting unlabeled data. G-code alignment for final defect comparison remains a natural next step and is explicitly identified as future work. Table 2 consolidates these prior approaches by methodology category and corresponding dataset scale.
The gaps identified across this body of work are that scarce pixel-level annotations, evaluations against weak baselines, and the absence of semi-supervised approaches tailored to AM segmentation directly motivate the synthetic data pipeline and MPL framework described in the following section.

3. Materials and Methods

This section details the design and implementation of our proposed approach for layer-wise defect segmentation. We begin by describing our scalable pipeline for generating synthetic training data from G-code instructions (Section 3.1). Next, we specify the model architectures employed, including both a weak baseline and a state-of-the-art nnU-Net framework (Section 3.3). Finally, we define the objective functions for optimizing both the standard supervised and semi-supervised Meta-Pseudo-Labeling networks under extreme class imbalance (Section 3.4).
Central to this study is a rigorous contrast between two distinct optimization paradigms. The proposed MPL integration enables a true bilevel optimization framework, in which the teacher’s update serves as a learned outer loop that actively adapts during training. In contrast, the nnU-Net baseline represents a single-level optimization operating within a pre-configured, heuristic-based framework: its hyperparameters are statically determined by dataset fingerprinting prior to training rather than through active meta-learning.

3.1. Synthetic Data Generation Pipeline

We developed a scalable, client–server data-generation framework to produce high-fidelity, ray-traced, layer-wise monitoring images and corresponding pixel-accurate segmentation masks from the Slice-100K dataset [5]. As described in [5], Slice-100K provides a massive repository of 3D printable assets, including STL files, G-code instructions, and associated metadata mapped to LVIS categories [30].
To efficiently process this large-scale data (over 100k objects), the framework operates as follows:
  • Metadata server: A dedicated metadata server indexes the compressed G-code archives and filters objects based on their primary LVIS semantic categories (e.g., “Chair”, “Vase”). This allows for semantically balanced sampling rather than random selection.
  • Rendering client: A rendering client queries the server for target objects, retrieves the binary G-code (.bgcode), and utilizes a modified G-code visualization engine [31] to generate top–down synthetic monitoring images for each print layer.
Each generated sample consists of a “Target” image (a ray-traced rendering of the print up to the n-th layer) and a corresponding “Source” mask derived directly from that n-th layer’s G-code toolpath geometry. On average, this pipeline yields approximately 137 labeled slices per object; extrapolated to the full Slice-100K corpus, this would exceed 13 million image–mask pairs. To strictly manage this scale and prioritize geometric diversity, we adopted a category-wise sampling strategy by drawing one representative object per LVIS semantic category (--pick first). While the automated semantic mapping used by Slice-100K contains inherent classification noise, this approach effectively maximizes structural variety while keeping the computational cost of data generation within reasonable bounds. Extracting all layers from these selected objects provided a robust, tractable corpus of 512 unique objects and 70,074 image–mask pairs for this study (Table 3).
To ensure exact reproducibility of our “high-fidelity” ray-traced rendering, we detail the core geometric and camera configurations utilized by the modified Nautilus G-code visualization engine in Table 4. These specific rendering rules dictate the layer thickness, path width handling, and anti-aliasing constraints that define the visual properties of our dataset.
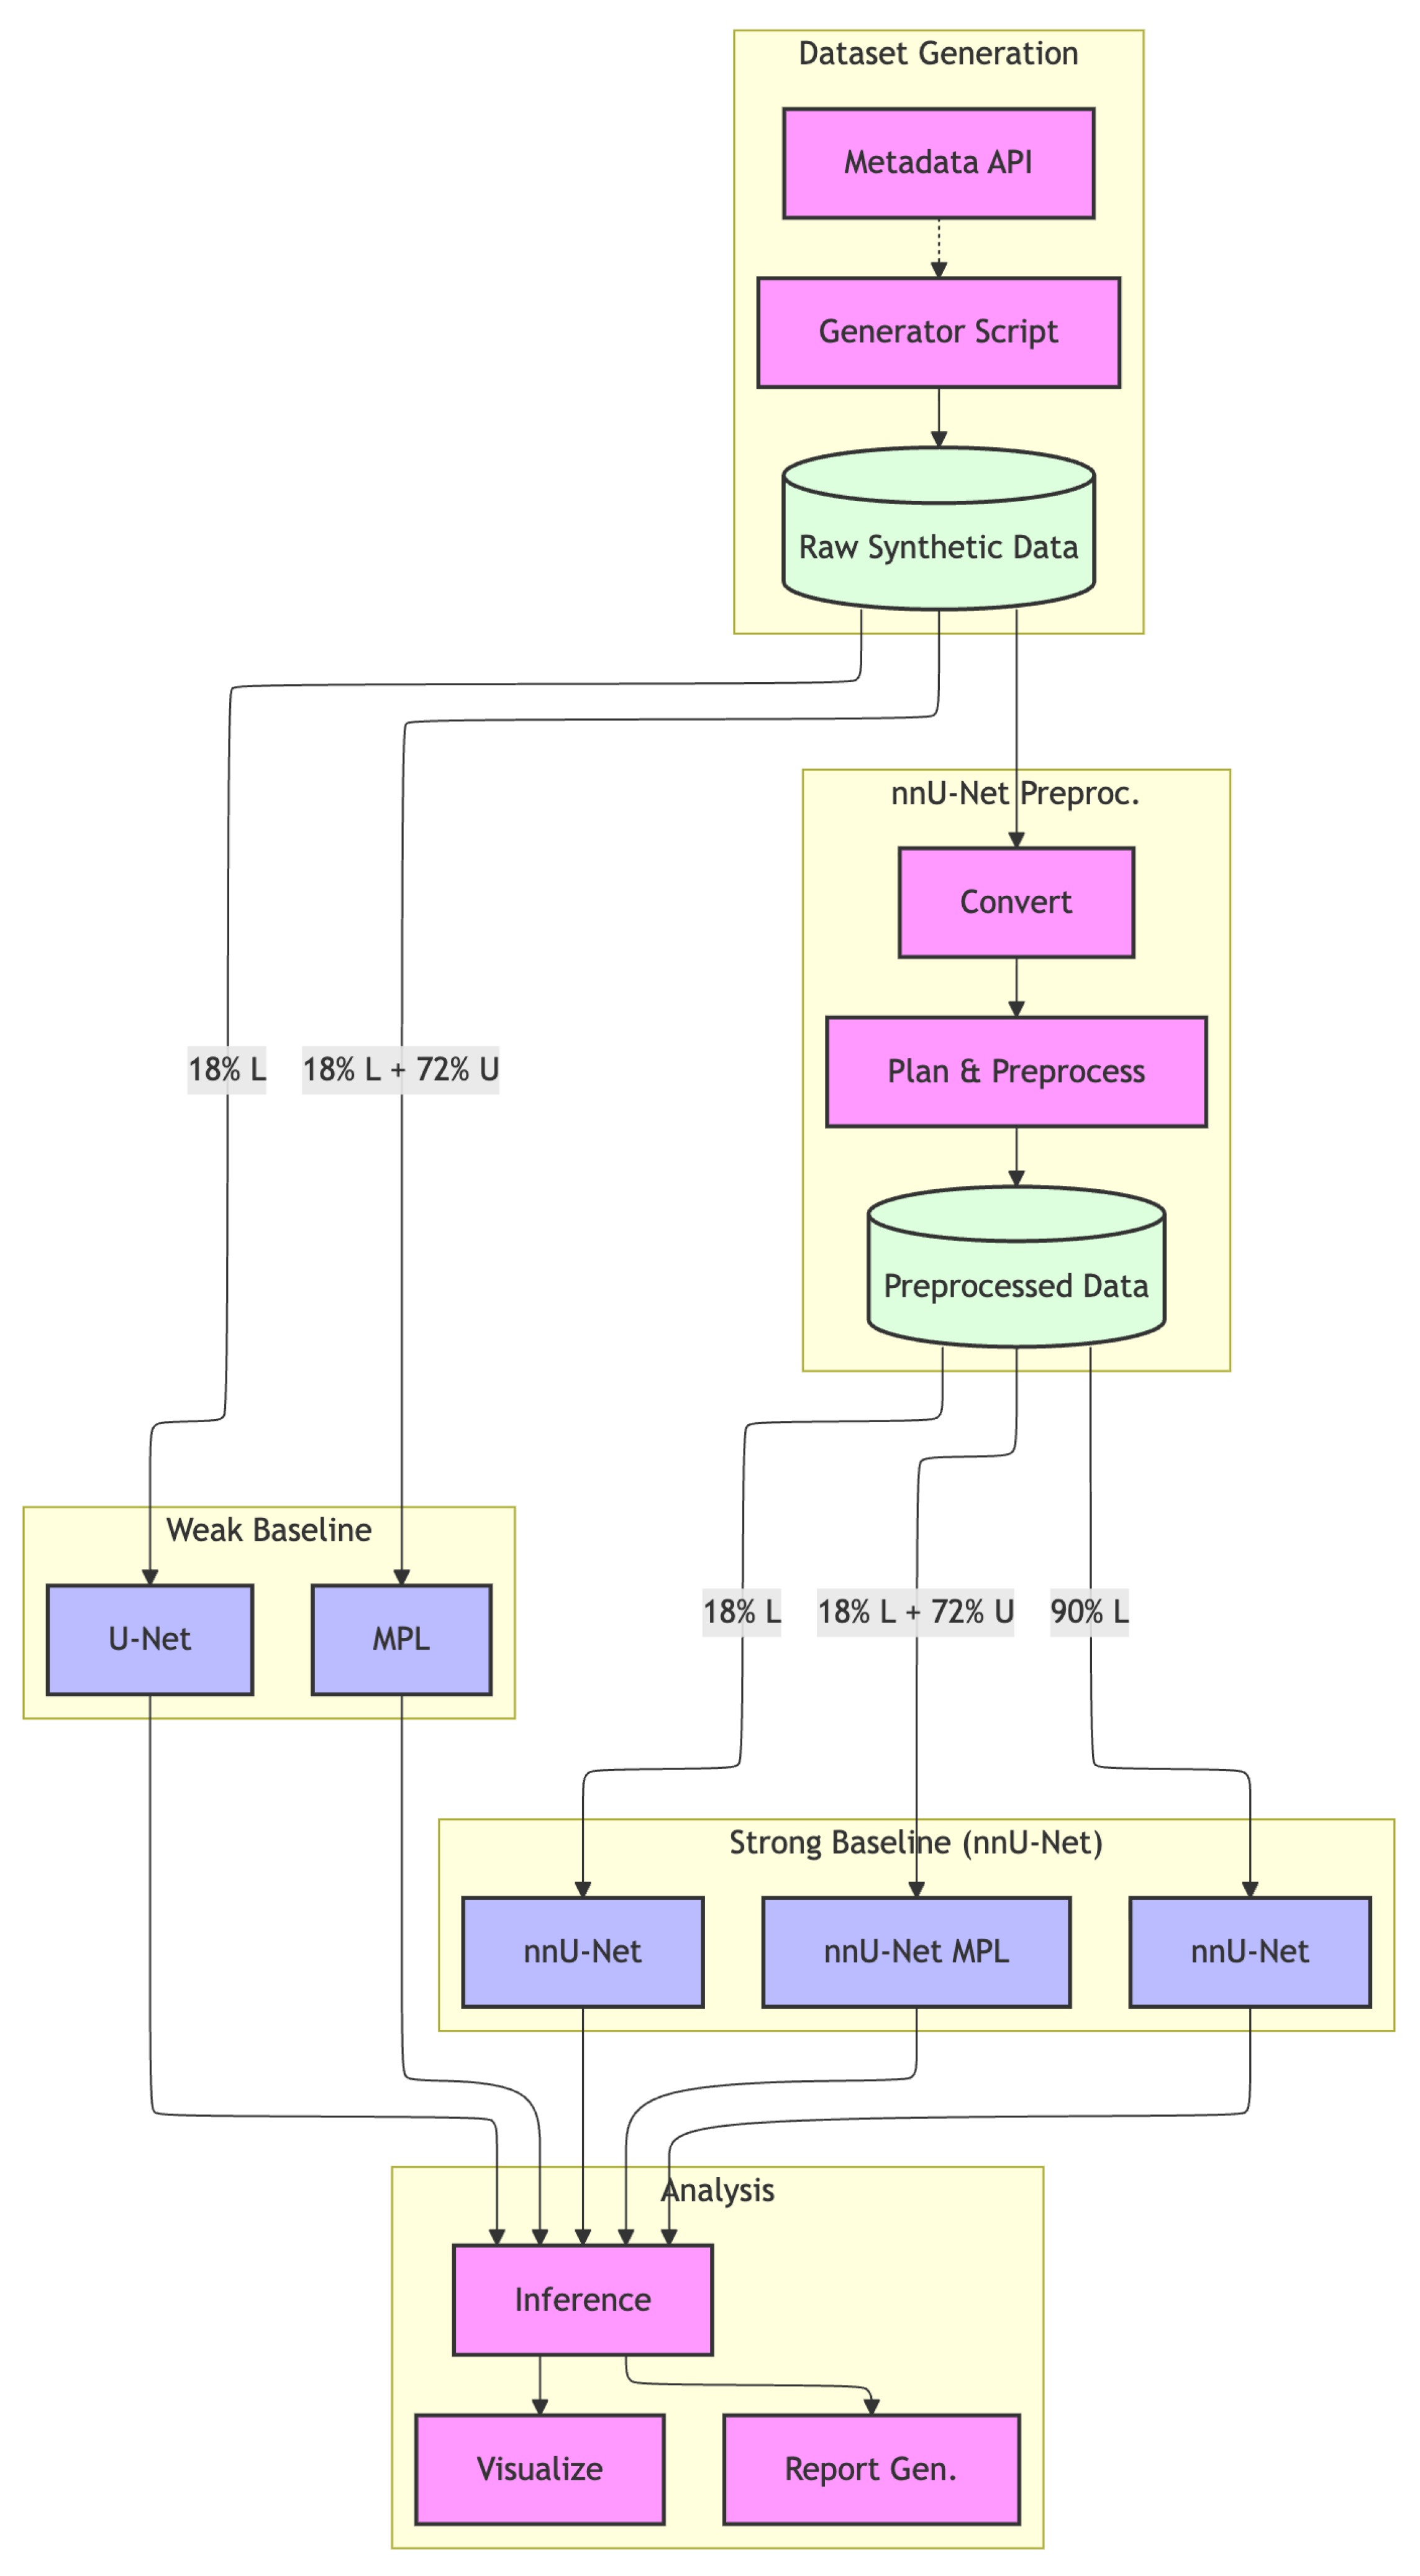
The resulting corpus serves as the shared data source for all experimental setups described in the following sections; the complete pipeline from generation through model evaluation is illustrated in Figure 2.

3.2. Datasets and Experimental Splits

To rigorously evaluate the efficacy of the proposed semi-supervised MPL framework, we established two distinct data domains: a training pool derived from our large-scale synthetic generation, and a strictly out-of-distribution holdout set for final evaluation.
The primary generated dataset (N = 70,074 slices from 512 distinct objects) was randomly shuffled at the slice level to form the training and model-selection pools. Specifically, 10% of N was reserved as an in-distribution validation set used solely for early stopping and hyperparameter monitoring during training. (Note: While the internal validation split used for early stopping was performed at the slice level, which may introduce minor adjacent-layer leakage during hyperparameter monitoring, all final performance metrics are evaluated exclusively on the strictly separated OOD Holdout Set to ensure an unbiased assessment of generalization.) The remaining 90% pool was partitioned into two distinct training subsets:
  • Labeled set (teacher/supervised): 20% of the remaining pool (approx. 18% of total N). This small subset simulates the severe scarcity of annotated data in real-world manufacturing environments.
  • Unlabeled set (student): The remaining 80% of the pool (approx. 72% of total N). These images were provided to the MPL framework without ground-truth masks to serve as the target distribution for pseudo-labeling.
Crucially, a random slice-level split risks overestimating model generalization because adjacent slices from the same 3D object share structural similarities. To guarantee that our final metrics reflect true geometric generalization rather than adjacent-layer memorization, we generated an entirely separate, strictly Out-Of-Distribution (OOD) Holdout Set. This set consists of a novel, highly complex 3D object comprising 641 layer slices that were completely excluded from the 512-object training pool.
In our comparative analysis, the standard “nnU-Net (Supervised)” baseline was restricted to the exact same 18% Labeled Set as the MPL model to ensure fairness, while the “Upper Bound” experiment utilized the full 90% available training data to establish the theoretical maximum performance. All models were trained on the primary dataset, but all final segmentation metrics (Table 5) are reported exclusively on the completely unseen 641-layer OOD Holdout Set.

3.3. Model Architectures

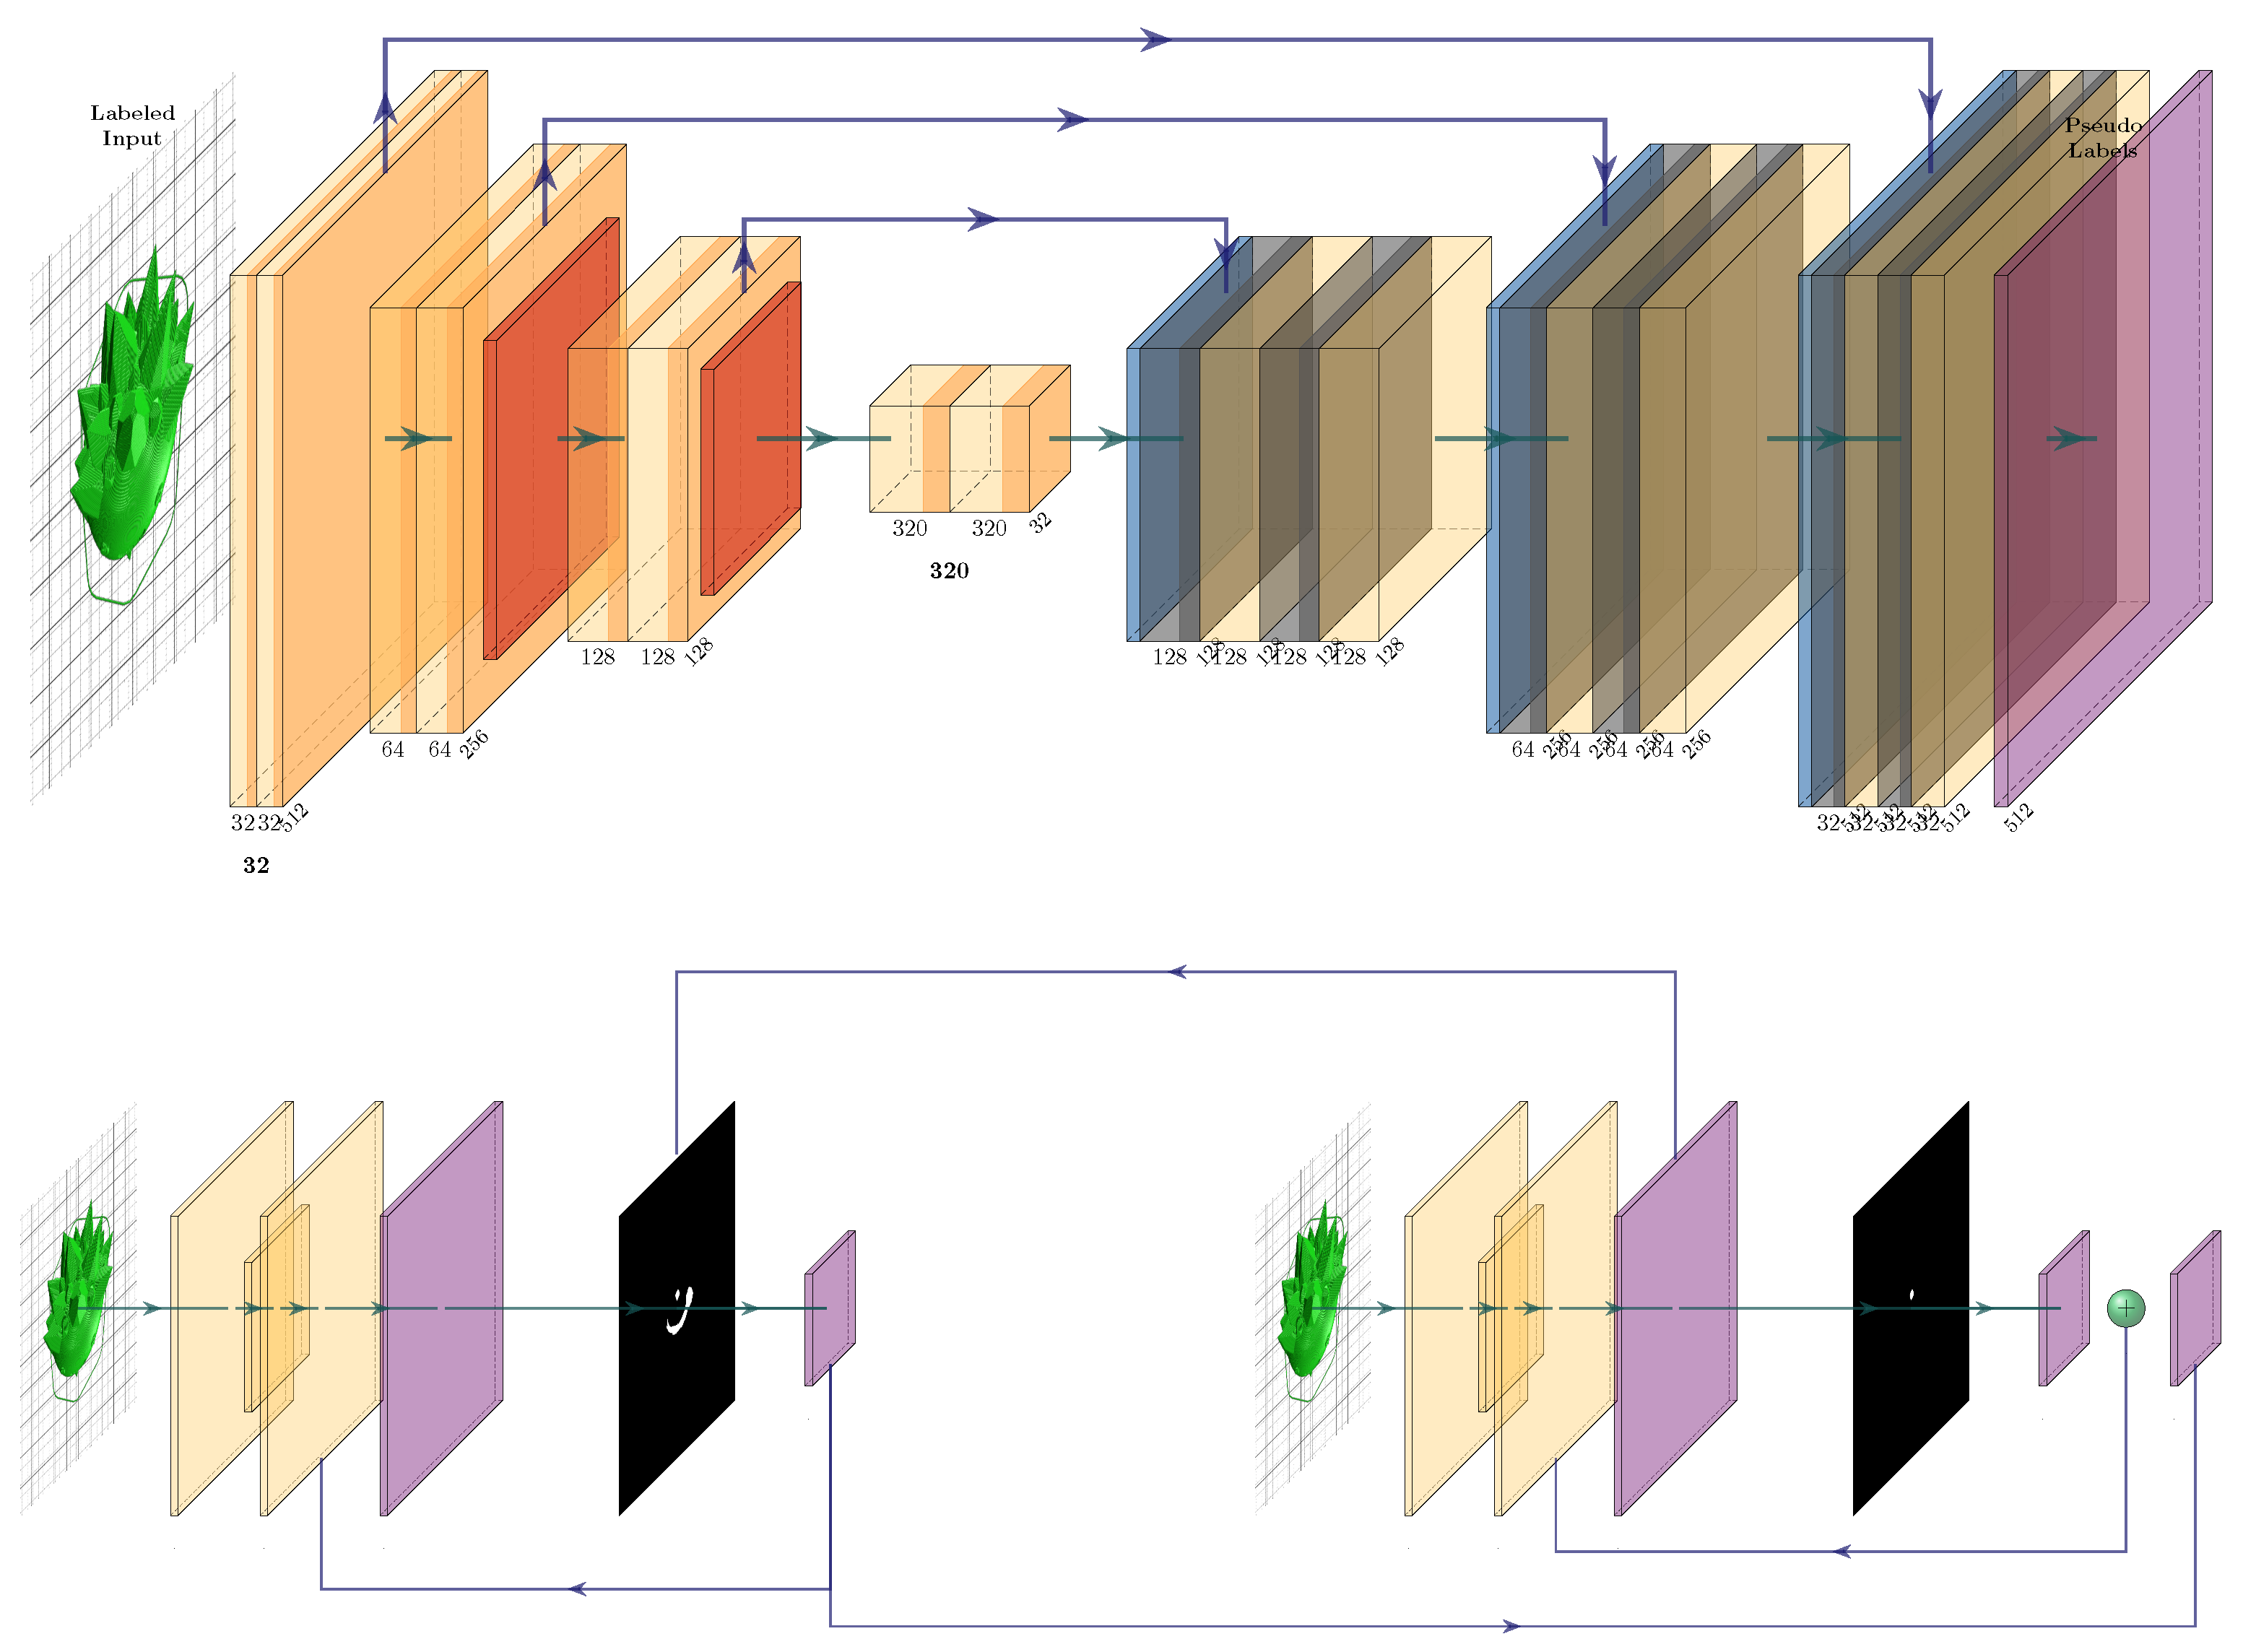
To rigorously evaluate the efficacy of the proposed method, we conducted experiments across two distinct regimes, representing both a “naive” baseline and a state-of-the-art medical segmentation framework. The complete architecture and bilevel training interaction are illustrated in Figure 3.

3.3.1. Weak Baseline (Vanilla U-Net)

We implemented a standard U-Net architecture [11]. This model assumes a fixed input resolution of 256 × 256 and uses standard bilinear interpolation for resizing. Training was performed using the Adam optimizer with a cosine learning-rate schedule. This setup represents a typical ad hoc implementation often found in initial exploratory studies, lacking the self-configuring heuristics of advanced frameworks. When integrated with MPL (Setup 2), the framework implements the full meta-learning loop, computing a finite-difference approximation of the bilevel meta-gradient signal h to dynamically scale the teacher’s loss based on the student’s performance on labeled data. To accommodate the significant GPU memory overhead of running dual U-Net instances simultaneously, we employed gradient accumulation [32] to maintain a reasonable logical batch size during training.

3.3.2. Strong Baseline (nnU-Net)

We employed the nnU-Net framework [13], which automatically configures the network topology, patch size (512 × 512), and resampling strategies based on dataset fingerprinting. By using nnU-Net as our strong baseline, we ensure that any performance gains observed with Meta-Pseudo-Labeling are attributable to the method itself rather than to suboptimal hyperparameter tuning or architectural choices. Just like the Vanilla setup, the nnU-Net MPL integration (Setup 4) implements the full bilevel meta-gradient: the change in the student’s supervised loss before and after each pseudo-label update, h = L s u p ( θ S ) L s u p ( θ S ) , serves as the reward signal that scales the teacher’s update [6]. However, the nnU-Net implementation computes this across its dynamically scaled deep-supervision layer hierarchy with patch-based sampling, heavily stabilizing the meta-gradient.

3.4. Objective Functions

For the supervised learning components (teacher training and student feedback), we utilized a compound loss function L s u p designed to handle class imbalance:
L s u p = L C E + L D i c e
where L C E represents the Binary Cross-Entropy loss and L D i c e is the soft Dice loss. The Cross-Entropy loss penalizes pixel-wise classification errors and is defined as follows:
L C E = 1 N i = 1 N y i log ( p i ) + ( 1 y i ) log ( 1 p i )
where N is the total number of pixels, y i { 0 , 1 } is the ground-truth label, and  p i [ 0 , 1 ] is the predicted probability for the i-th pixel.
The Dice loss directly addresses class imbalance by maximizing the spatial overlap between the prediction and the ground truth. It is formulated as follows:
L D i c e = 1 2 i = 1 N p i y i + ϵ i = 1 N p i + i = 1 N y i + ϵ
where the term i = 1 N p i y i in the numerator represents the continuous approximation of true positives (TPs), ensuring that the model is explicitly rewarded for correctly identifying the defect regions. A smoothing factor ϵ is added to prevent division by zero.
In our Vanilla U-Net implementation, we weighted both loss components equally. In the Strong Baseline, the nnU-Net framework employs this same compound loss within a deep supervision paradigm, computing and summing the loss at multiple expansive decoder scales with exponentially decaying weights.
Crucially for the Meta-Pseudo-Labeling integration, the semi-supervised formulation applies this exact same compound loss L s u p to evaluate the student’s predictions against the teacher’s hard pseudo-labels. Specifically, the meta-gradient signal h is computed as the finite-difference change in the student’s supervised loss before and after training on the pseudo-labels: h = L s u p ( θ S ) L s u p ( θ S ) . This scalar reward then scales the teacher’s gradient on unlabeled data, effectively sidestepping the need for explicit second-order stochastic gradient estimators such as REINFORCE while retaining the theoretical bilevel structure [6]. The complete sequential procedure utilized in our setup is detailed in Algorithm 1.
With the data generation pipeline, model architectures, and objective functions established, the following section presents the empirical evaluation of all five experimental setups.
Algorithm 1: Finite-Difference MPL Training
   Jmmp 10 00183 i001

4. Results

In this section, we present the evaluation and comparison of our Meta-Pseudo-Labeling (MPL) framework against both standard and state-of-the-art baselines. We first analyze the impact of extreme class imbalance on training stability, including a theoretical derivation of the failure modes of the Dice loss (Section 4.1 and Section 4.2). Finally, we provide a comprehensive quantitative and qualitative evaluation of MPL’s effectiveness (Section 4.3).

4.1. Impact of Class Imbalance and Training Stability

The statistical breadth provided by our large-scale synthetic generation pipeline allowed us to identify a critical failure mode in standard segmentation approaches. With over 70,000 diverse slices, we confirmed that the intrinsic foreground–background ratio stabilizes at approximately 1:24 (a 4% foreground fraction). This extreme sparsity mimics realistic monitoring scenarios but poses severe optimization challenges.
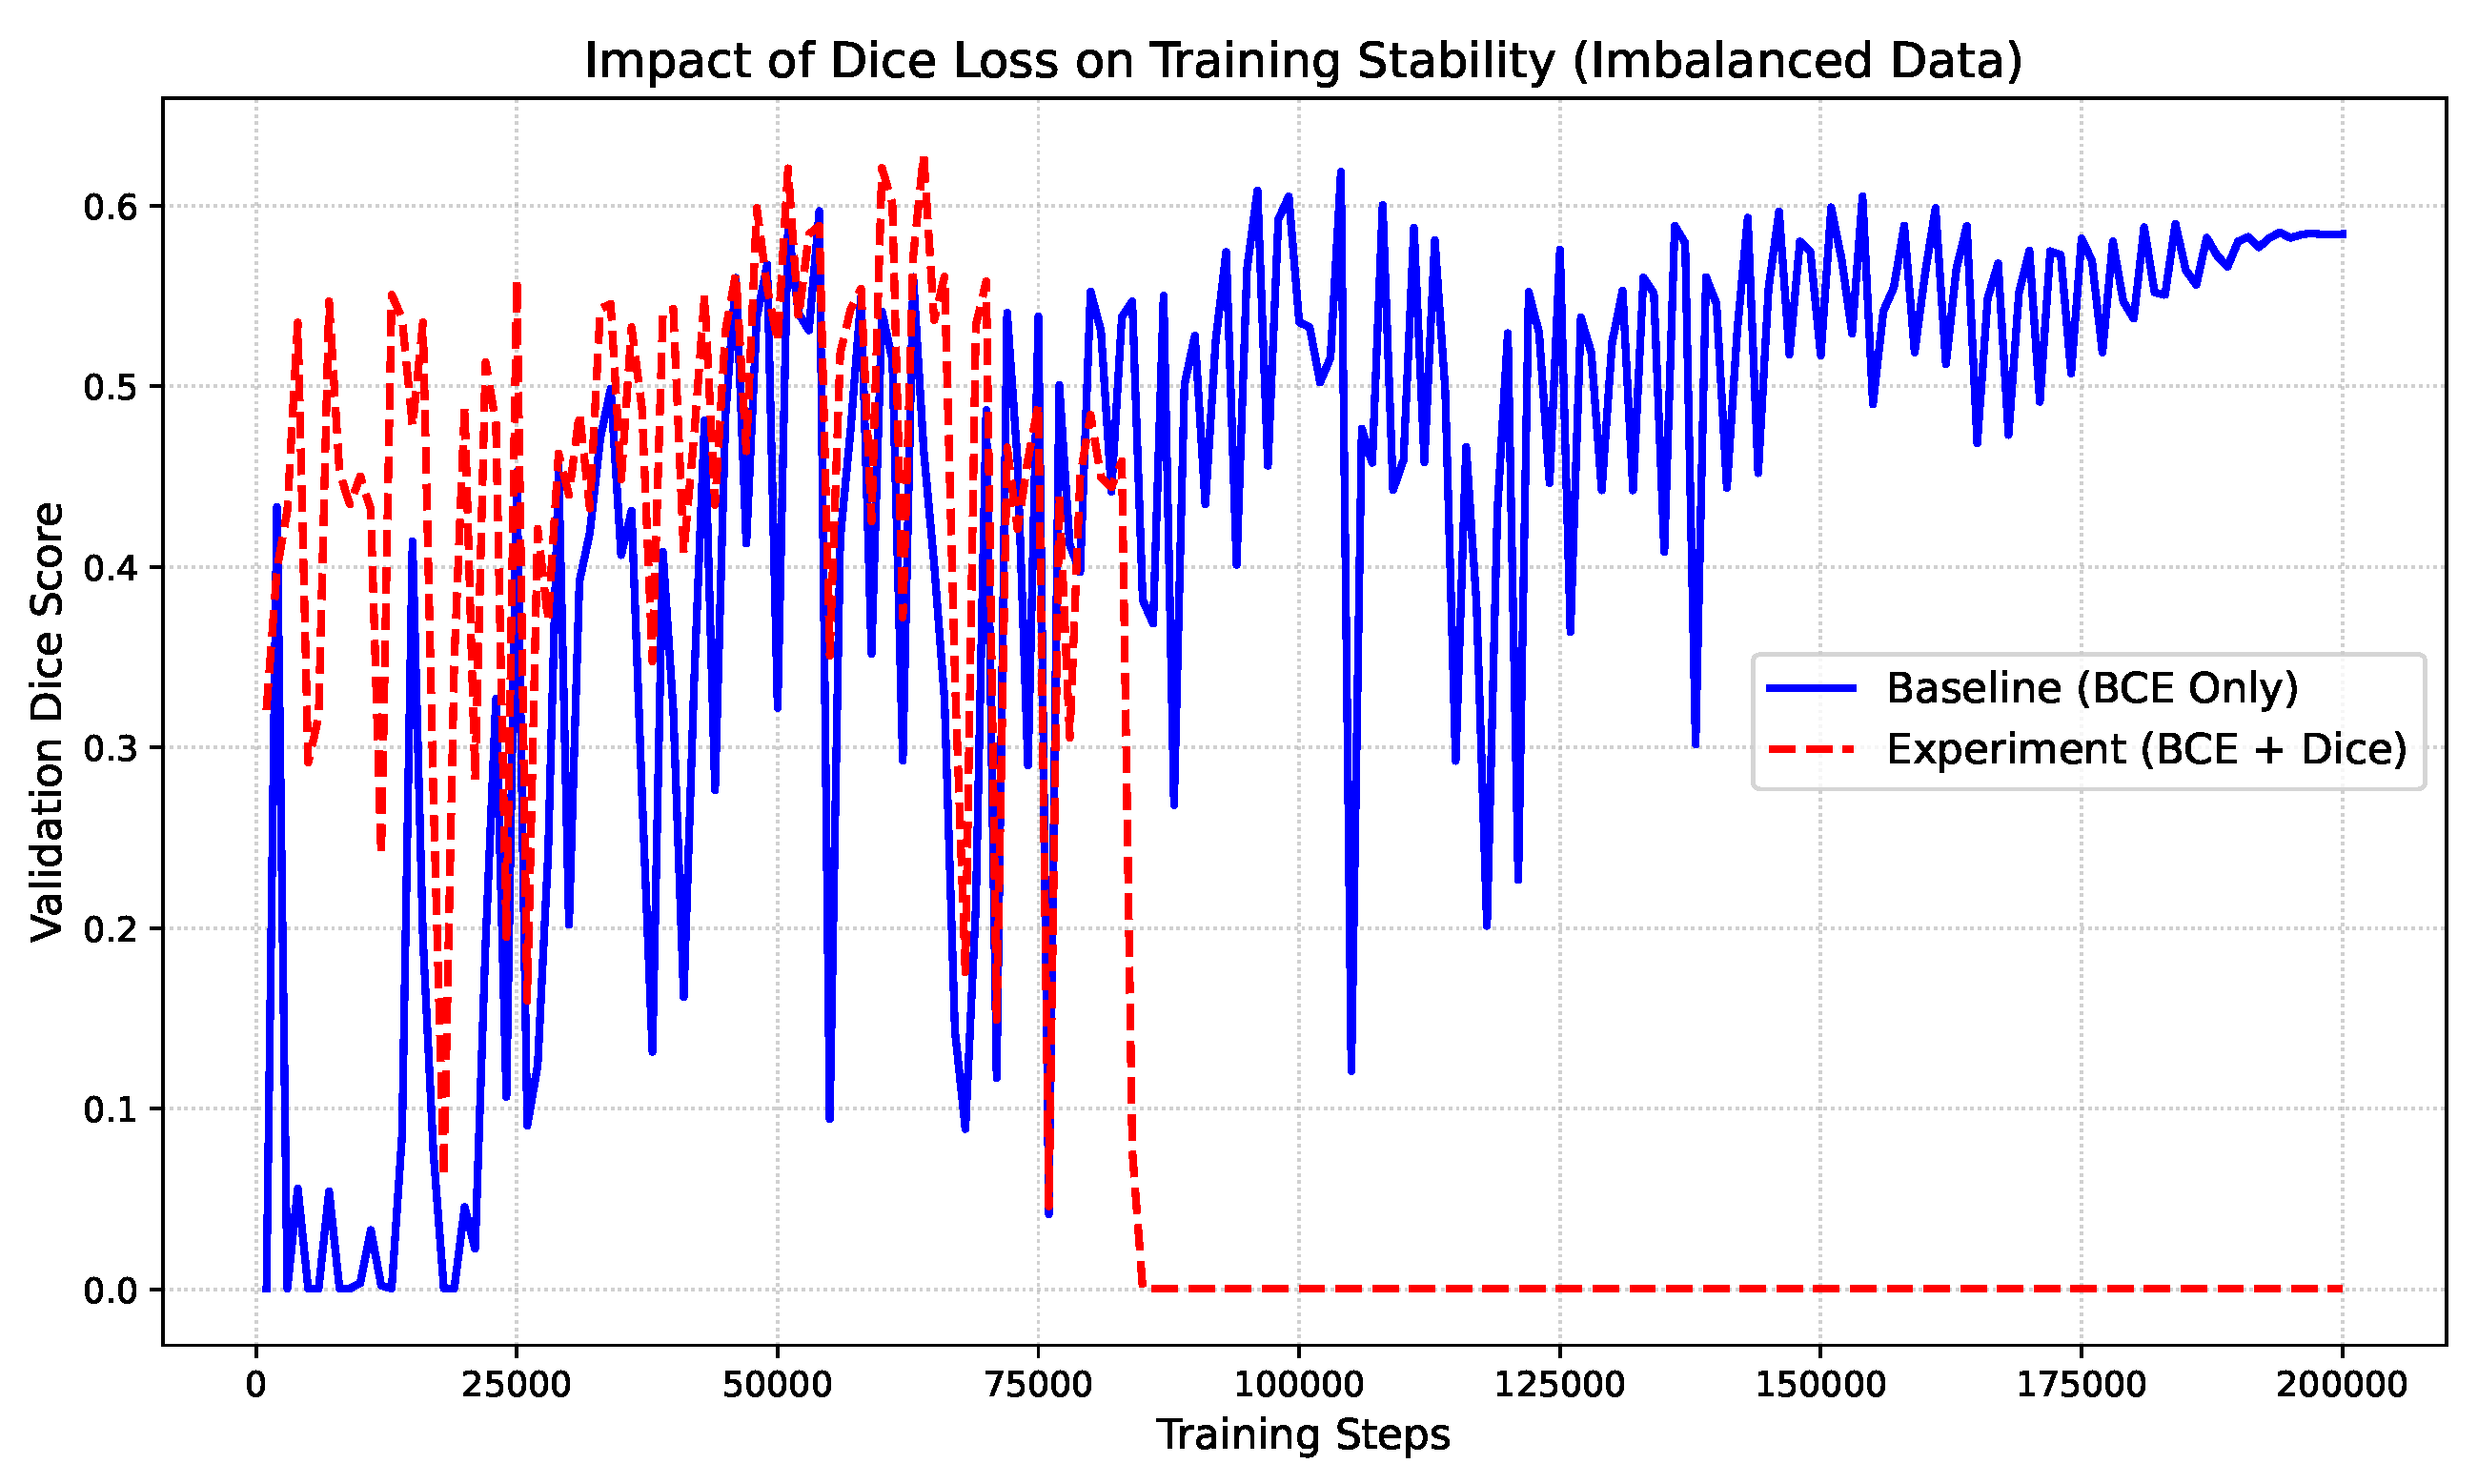
In our preliminary experiments with the Vanilla U-Net baseline, adding a standard Dice term to the Cross-Entropy loss led to rapid divergence during training, which we term a “Dice Crash” (Figure 4). To empirically quantify the trigger for this instability, we analyzed the exact distribution of foreground pixels across the training splits. We observed that 0.48% of randomly sampled mini-batches (with a standard batch size of 8) contained zero foreground pixels across all images in the batch. While seemingly small, this constant injection of empty batches guarantees that the Dice loss gradient will inevitably diverge. It was only through the scale of this data that we could distinguish between local batch artifacts and this systematic domain characteristic.

4.2. Theoretical Analysis of Dice Instability

To rigorously understand the observed divergence, we analyzed the gradient properties of the Dice loss function in the context of our specific data distribution (1:24 foreground ratio and frequent background-only slices).
The Dice loss L D i c e for a prediction p and ground truth y is defined as follows:
L D i c e = 1 2 i p i y i + ϵ i p i + i y i + ϵ
where ϵ is a small smoothing term (typically 10−5) included to prevent division by zero [33].
In our baseline experiments, training was performed on whole images rather than oversampled patches. Given the high sparsity of the defect class, a significant proportion of training batches contained exclusively background pixels ( y i = 0 ). In this scenario, the intersection term vanishes, and the loss simplifies to:
L D i c e 1 ϵ i p i + ϵ
The gradient of this loss with respect to a prediction p k is:
L p k ϵ ( i p i + ϵ ) 2
If the model is performing well (i.e., correctly predicting background, p i 0 ), the denominator approaches ϵ 2 , causing the gradient magnitude to explode:
L p k ϵ ϵ 2 = 1 ϵ
With ϵ = 10 5 , this results in a gradient magnitude on the order of 105. For every “empty” batch, the model receives a catastrophic gradient signal penalizing even negligible prediction noise. This theoretical instability, noted in unbalanced segmentation literature [34], motivated our adoption of nnU-Net.
The nnU-Net framework [13] inherently mitigates this instability through three source-verified mechanisms: (1) foreground-biased case selection, which ensures a fixed fraction of each mini-batch is drawn from images known to contain foreground pixels; (2) a robustly formulated Soft Dice loss with a large smoothing constant (smooth = 1) to prevent gradient explosion on background-only samples; and (3) batch-level loss aggregation (batch_dice=True), which dilutes the gradient spike from any single empty-foreground image across the full mini-batch.

4.3. Effectiveness of Meta-Pseudo-Labels

Having established the theoretical basis for our architectural choices and empirically confirmed the instability of naive Dice formulations, we now present a quantitative evaluation of all five experimental setups. To rigorously assess the model’s structural robustness and ensure that our results generalize beyond the specific randomness of the initial training data split, we evaluate all setups on a strict Out-Of-Distribution (OOD) holdout dataset (as defined in Section 3.2). Furthermore, to comprehensively assess segmentation quality beyond simple volumetric overlap, we report an expanded set of boundary-aware metrics, including Intersection over Union (IoU), Precision, Recall, the 95th-Percentile Hausdorff Distance (HD95), and Boundary F1 score.
Table 5 summarizes the segmentation performance across our five experimental setups. HD95 denotes the symmetric 95th-percentile Hausdorff distance between the predicted and ground-truth mask boundaries. For boundary point sets A and B, we compute:
H D 95 ( A , B ) = max { d 95 ( A , B ) , d 95 ( B , A ) }
where d 95 ( A , B ) is the 95th percentile of the nearest-neighbor distances from points in A to B. Unlike the maximum Hausdorff distance, HD95 reduces sensitivity to isolated extreme boundary outliers while still penalizing large spatial deviations. Because evaluation was performed directly in image space without extrinsic physical scaling, HD95 is reported in pixels (px). Slices with empty prediction or reference masks were naturally excluded from HD95 aggregation. Our results suggest that SSL can provide meaningful benefits for industrial segmentation, particularly in reducing boundary errors and false-positive hallucinations, but they also echo the central warning of Isensee et al. [35]: methodological gains must be interpreted relative to strong, well-configured baselines such as nnU-Net.

4.3.1. The Illusion of Success in Weak Baselines

When applied to a standard, non-optimized “Vanilla” U-Net (Rows 1–2), the MPL algorithm delivers a massive performance boost, increasing the Dice score from 0.6521 to 0.8215 (+16.94%). In isolation, this result would suggest that MPL is a transformative method for detecting defects in additive manufacturing. However, this large gain is primarily due to the baseline’s poor initial performance, which was unstable and used suboptimal hyperparameters (see Section 4.1). MPL acts as a strong regularizer here, preventing the model from collapsing.

4.3.2. Reality Check with Strong Baselines

When we move to the rigorous nnU-Net framework (Rows 3–4), which includes optimal preprocessing, resampling, and dynamic adaptation, the baseline performance improves significantly. In this regime, the added value of MPL is more nuanced. The difference between the weak- and strong-baseline regimes highlights the importance of evaluating semi-supervised methods against properly optimized baselines. In the Vanilla U-Net setting, MPL yields a large Dice improvement, but this gain partly reflects the instability and under-optimization of the baseline. When the same semi-supervised principle is applied to nnU-Net, the overall Dice improvement becomes more modest (+4.63%, reaching 0.8592), yet the massive reduction in HD95 from 53.70 px to 24.71 px indicates a meaningful improvement in boundary localization and spatial reliability. This suggests that MPL’s main benefit under a strong baseline is not simply increasing average overlap, but reducing large boundary deviations and spatially distant false-positive filament hallucinations. For industrial AM monitoring, this distinction is important because rare but spatially large false positives could trigger unnecessary print aborts, while missed or fragmented top-layer regions could allow defects to be buried by subsequent layers.

4.3.3. Qualitative Analysis

As shown in Figure 5, we present a visual comparison of the segmentation quality across all five experimental setups for a representative validation sample.
The standard supervised nnU-Net (Setup 3) tends to produce fragmented predictions with significant false positives (hallucinations) in complex regions. In contrast, the MPL-enhanced nnU-Net (Setup 4) effectively suppresses these artifacts, yielding a cleaner and more continuous filament segmentation that closely resembles the Upper Bound (Setup 5). This qualitative improvement explains the substantial +0.76 Dice gain observed in specific challenging cases, where the supervised model fails to distinguish between similar-looking background noise and valid extrusion paths.

5. Discussion and Limitations

Our quantitative results (Table 5) demonstrate that MPL’s apparent performance gains are strongly dependent on the quality of the underlying baseline: substantial when applied to a weak architecture, marginal when applied to an optimally configured one. This finding aligns perfectly with the critique in [35]: many novel architectures or SSL methods appear superior only because they are compared against weak baselines. By using nnU-Net as a standard, we reveal the true marginal utility of MPL.
Crucially, it is well-documented [6] that semi-supervised methods can often degrade performance when applied to strong baselines due to the injection of noisy pseudo-labels (confirmation bias). The fact that MPL does not degrade performance but consistently improves it strongly validates its robustness. The meta-objective effectively prevents the student from overfitting to incorrect teacher predictions, a common failure mode in standard self-training. Thus, within our fully synthetic evaluation environment, MPL serves as a reliable means of leveraging unlabeled data, demonstrating its potential utility for future real-world AM monitoring deployments.
The scalability of our synthetic data generation pipeline is also noteworthy. With 70,074 image-mask pairs across 512 objects and a projected capacity of ∼13.7 M images from the full 100K Slice-100K corpus, the pipeline provides a practical path toward large-scale, labeled training data for AM segmentation without manual annotation. The discovered class imbalance (1:24 foreground ratio) is a systematic property of the AM domain that any future research in this space will need to address, either through architectural choices (foreground-biased sampling strategies, loss re-weighting) or data-centric strategies.
The convergence of these findings, robust semi-supervised performance under a strong baseline, a scalable synthetic data pipeline, and the identification of domain-specific loss instabilities inform the conclusions and future directions described in the following section.

5.1. Comparison with Existing AM Monitoring Strategies

Compared with prior AM monitoring approaches based on image-level classification or object detection, the proposed framework addresses a more fine-grained perception problem. Classification-based systems, such as those using CNNs or weakly supervised fine-grained recognition, can identify global process states or coarse defect categories, but they do not directly produce pixel-level geometric evidence of where the deposited material deviates from the intended toolpath. Similarly, object-detection approaches provide bounding-box localization, which is useful for coarse print monitoring but insufficient for layer-wise verification where small extrusion gaps, local blobs, or partial missing paths may occupy only a small fraction of the image. In contrast, the segmentation formulation used in this work produces dense masks of the deposited layer, enabling future pixel-wise comparison against the G-code-derived blueprint.
Our findings also clarify why classical computer-vision baselines remain attractive in AM monitoring despite their limited adaptability. Methods based on edge detection or hand-crafted image processing avoid the annotation burden, but they are sensitive to lighting, texture, surface reflectance, and camera alignment. The synthetic data pipeline proposed here addresses the opposite side of this trade-off: it provides dense supervision at scale, allowing data-driven models to learn robust geometric representations without requiring exhaustive manual annotation. This is particularly relevant given that prior segmentation-oriented AM studies have relied on comparatively small labeled datasets, such as the Peregrine-based evaluation with only tens of annotated layers or other private datasets with limited public availability. The large-scale synthetic corpus therefore serves not only as a training resource but also as a controlled testbed for studying optimization pathologies such as the Dice Crash under realistic foreground sparsity.
The proposed method is complementary to recent G-code-guided architectures such as GG-Net. While such approaches internalize G-code alignment within the learned segmentation model, our framework uses G-code offline to synthesize large quantities of pixel-accurate masks and focuses on improving the robustness of the upstream segmenter. This distinction is important: accurate G-code registration remains essential for final defect detection, but the present results show that a strong segmentation backbone, especially when enhanced with MPL, can reduce false-positive hallucinations and boundary errors before any explicit visual–digital comparison is performed. Thus, future systems could combine both directions by using synthetic pretraining and MPL-based adaptation to obtain robust layer masks, followed by G-code-guided registration for real-time defect localization.

5.2. Sim-to-Real Limitations and Future Work

While our fully synthetic framework validates the algorithmic efficacy of MPL in leveraging vast amounts of unannotated data, deploying this model to an active factory floor introduces fundamental hardware and domain-shift challenges, commonly referred to as the “Sim-to-Real” gap.
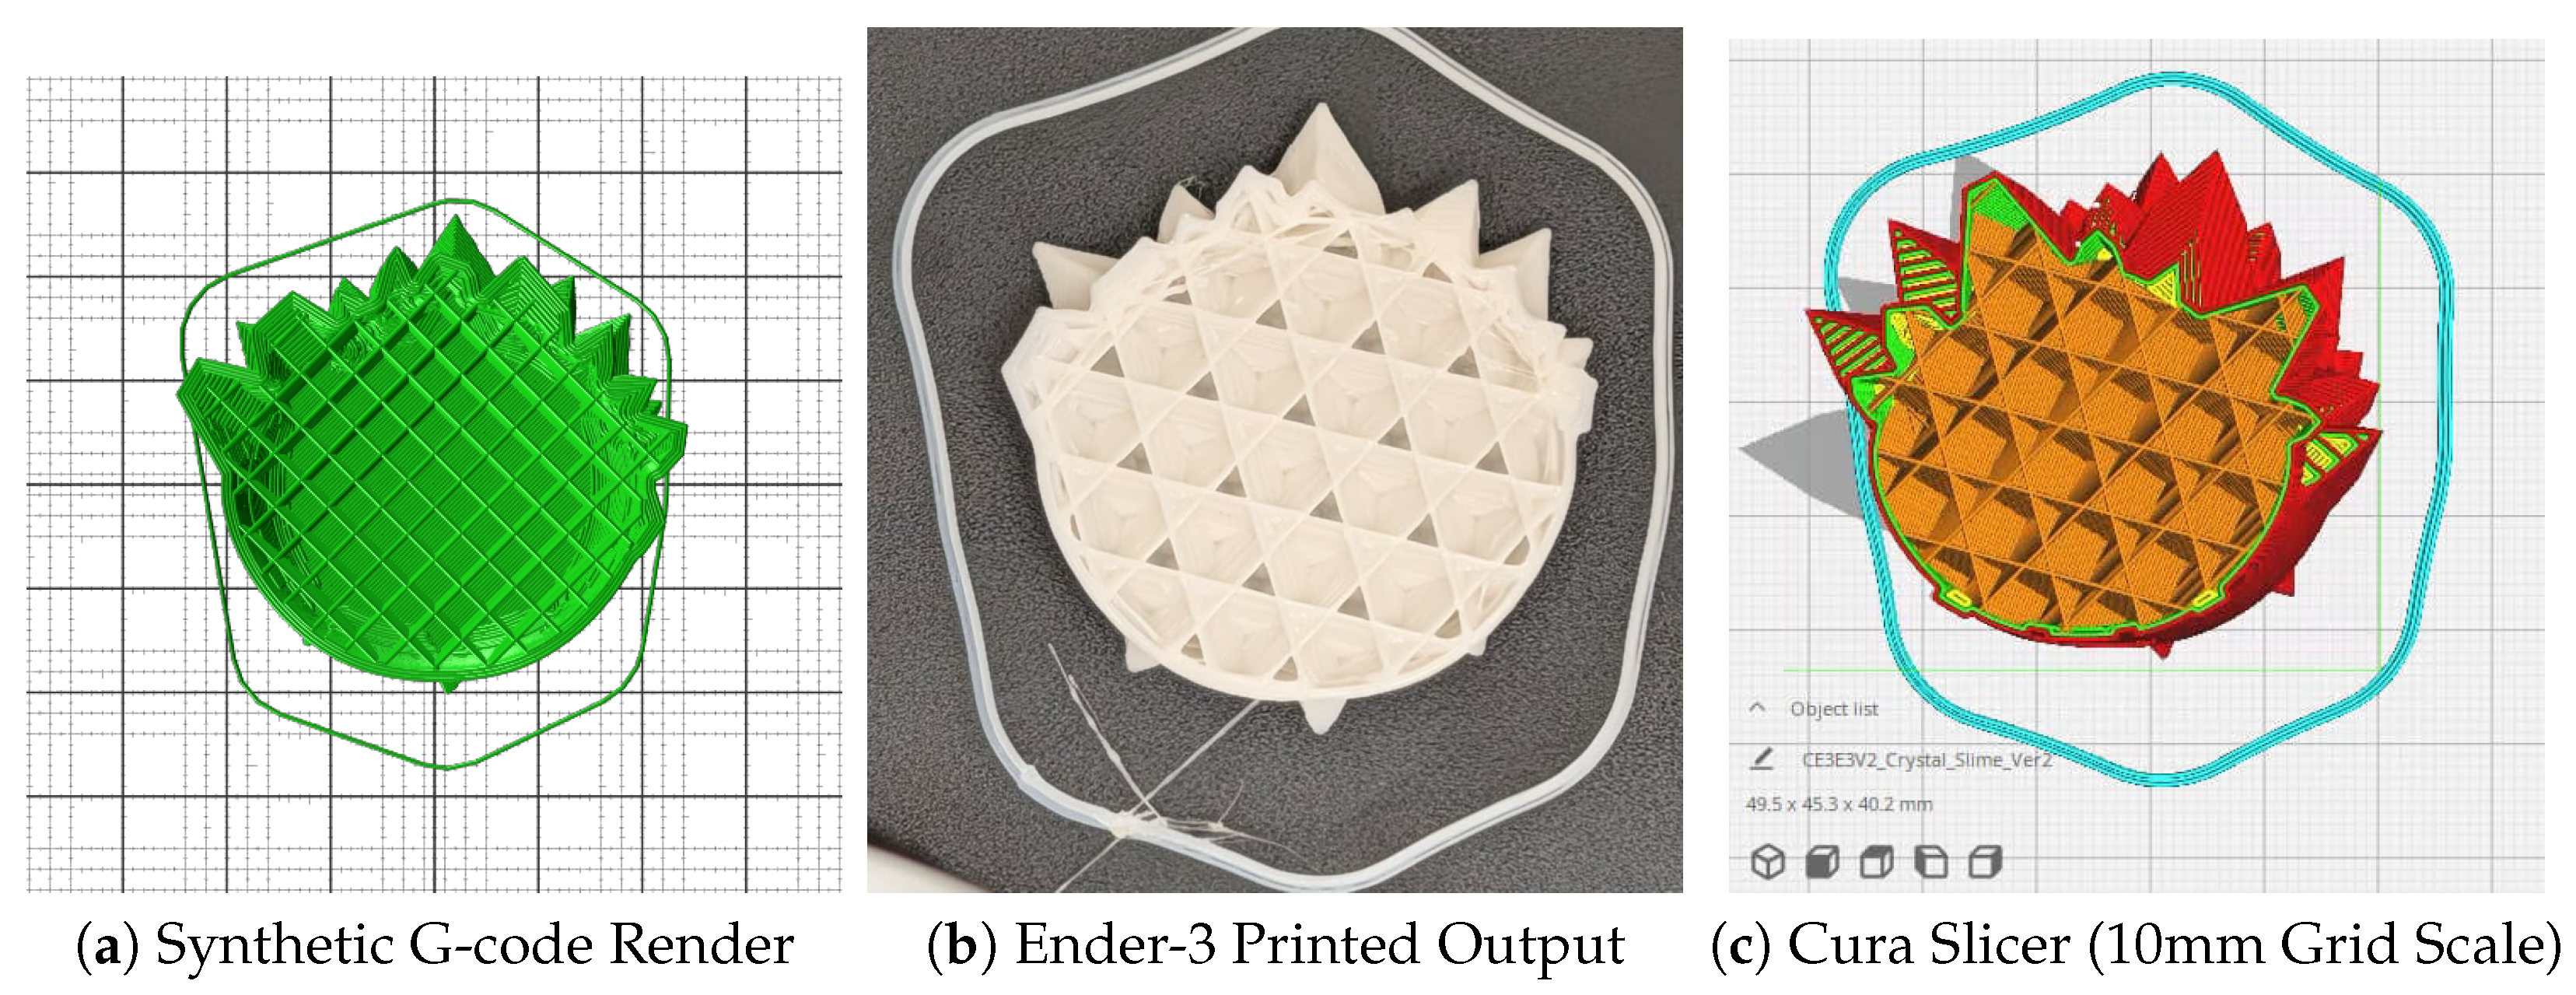
Although the synthetic experiments validate the algorithmic behavior of the proposed framework, real-world deployment introduces a substantial sim-to-real gap in imaging conditions, geometric registration, and acquisition hardware. Figure 6 provides an illustrative comparison between a ray-traced synthetic render and a representative physical print produced on our Ender-3 printer (Shenzhen Creality 3D Technology Co., Ltd., Shenzhen, Guangdong, China) in the IoT lab. Real-world monitoring introduces unstructured noise such as ambient lighting, glare, and un-smoothed nozzle smears. Furthermore, while the layer-wise segmentation primitive developed in this work operates directly on the captured 2D image without assuming extrinsic spatial calibration, the ultimate downstream task of geometric defect detection will require perfect spatial registration between the camera sensor and the printing workspace. In a physical deployment, aligning a 2D camera pixel grid dynamically to a moving three-axis G-code coordinate system remains a massive, ongoing calibration challenge.
Hardware acquisition poses an equally stringent limitation. Designing a vibration-dampened camera perch mounted directly on the print head requires highly specific tuning of macro-focal lengths. Critically, to capture high-resolution images without motion blur, one might consider introducing periodic G-code pauses at the end of each layer. However, in thermoplastic extrusion, such pauses can disrupt the steady-state deposition process. Depending on the pause strategy, a stationary or parked hotend may introduce pause-induced deposition artifacts, including oozing, stringing, restart blobs, or transient under-/over-extrusion when printing resumes, thereby altering the observed surface geometry and local print quality [3].
Consequently, the scope of this paper is explicitly constrained to establishing the foundational layer-wise segmentation architecture in a controlled, fully synthetic environment. Addressing the sim-to-real gap—specifically, evaluating quantitative transfer metrics on real-world datasets such as our Ender-3 physical captures—is deferred to future work. We plan to utilize our synthetic MPL models as the pre-trained foundation for Domain Adaptation architectures, fine-tuning them on sparse, real-world factory footage while developing non-intrusive, continuous video-stream registration techniques that bypass the need for physical printer pauses.

6. Conclusions

In this work, we addressed the critical bottleneck of data scarcity in vision-based monitoring of additive manufacturing (AM) by establishing a foundational layer-wise segmentation architecture. Our core findings are:
  • Synthetic data pipeline: we developed a scalable pipeline leveraging the Slice-100K dataset to generate high-fidelity synthetic datasets for layer-wise defect segmentation, overcoming the manual annotation bottleneck.
  • Identification of the “Dice Crash”: our analysis revealed a severe, systemic foreground–background class imbalance (1:24) inherent to layer-wise segmentation that causes standard optimization objectives (like naive Dice loss) to diverge catastrophically when empty batches are encountered.
  • MPL Effectiveness & baseline illusions: We adapted the Meta-Pseudo-Labeling (MPL) framework for industrial segmentation. Our evaluations demonstrated that while MPL provides the illusion of substantial performance gains on weak baselines (+16.94% on Vanilla U-Net), its true utility emerges when integrated with a state-of-the-art architecture such as nnU-Net, where it effectively suppresses false-positive hallucinations and significantly reduces boundary errors (HD95) without succumbing to confirmation bias.
These findings validate that semi-supervised learning via continuous bilevel optimization can serve as a robust, safe enhancer for establishing the foundational “eyes” of autonomous AM systems. Future work will focus on sim-to-real domain adaptation, evaluating quantitative transfer metrics on physical printers, and integrating G-code spatial alignment for real-time “visual diff” defect detection.

Author Contributions

Conceptualization, Y.S.C.; methodology, Y.S.C.; software, Y.S.C.; validation, Y.S.C., P.M.T., H.B.T., H.K.; formal analysis, Y.S.C., P.M.T., H.B.T., H.K., J.Z., M.D.; investigation, Y.S.C., P.M.T., H.B.T.; data curation, Y.S.C.; writing—original draft preparation, Y.S.C.; writing—review and editing, Y.S.C., P.M.T., H.B.T., H.K., M.D.; visualization, Y.S.C.; supervision, H.B.T.; funding acquisition, M.D. All authors have read and agreed to the published version of the manuscript.

Funding

This research is supported by the National Science Foundation (NSF) under Award OIA-2417062 to the DREAM Research Center and the UNM IoT and Intelligent Systems Innovation Lab (I2 Lab).

Data Availability Statement

Code and generated datasets used in this study are available via the Distributed Resilient and Emergent Intelligence-based Additive Manufacturing (DREAM) project GitHub repository. Direct repository access is restricted; all data and code are available from the corresponding authors upon reasonable request.

Acknowledgments

The authors gratefully acknowledge the support of the DREAM Research Center and the UNM IoT and Intelligent Systems Innovation Lab (I2 Lab) at the University of New Mexico, and the National Science Foundation.

Conflicts of Interest

The authors declare no conflicts of interest. The funders had no role in the design of this study; in the collection, analyses, or interpretation of data; in the writing of this manuscript; or in the decision to publish the results.

Abbreviations

The following abbreviations are used in this manuscript:
AMAdditive Manufacturing
FFFFused Filament Fabrication
MPLMeta-Pseudo-Labeling
SSLSemi-Supervised Learning
nnU-NetNo-New-Net U-Net
BCEBinary Cross-Entropy
STNSpatial Transformer Network
GANGenerative Adversarial Network
DDIMDenoising Diffusion Implicit Model
WSDANWeakly Supervised Data Augmentation Network
LVISLarge Vocabulary Instance Segmentation
IoUIntersection over Union

References

  1. Krishnanand; Taufik, M. Fused filament fabrication (FFF) based 3D printer and its design: A review. In Advanced Manufacturing Systems and Innovative Product Design: Select Proceedings of IPDIMS 2020; Springer: Berlin/Heidelberg, Germany, 2021; pp. 497–505. [Google Scholar]
  2. Tran, C.W. A Framework for Distributed Additive Manufacturing. Ph.D. Thesis, New Mexico State University, Las Cruces, NM, USA, 2025. Section 3.3. [Google Scholar]
  3. Baş, H.; Elevli, S.; Yapıcı, F. Fault tree analysis for fused filament fabrication type three-dimensional printers. J. Fail. Anal. Prev. 2019, 19, 1389–1400. [Google Scholar] [CrossRef]
  4. Liu, X.; Mileo, A.; Smeaton, A.F. A Systematic Review of Available Datasets in Additive Manufacturing. arXiv 2024, arXiv:2401.15448. [Google Scholar] [CrossRef]
  5. Jignasu, A.N.; Marshall, K.; Mishra, A.K.; Nerone Rillo, L.; Ganapathysubramanian, B.; Balu, A.; Hegde, C.; Krishnamurthy, A. Slice-100K: A Multimodal Dataset for Extrusion-based 3D Printing. Adv. Neural Inf. Process. Syst. 2024, 37, 128556–128573. [Google Scholar]
  6. Pham, H.; Dai, Z.; Xie, Q.; Le, Q.V. Meta pseudo labels. In Proceedings of the IEEE/CVF Conference on Computer Vision and Pattern Recognition, Nashville, TN, USA, 20–25 June 2021; pp. 11557–11568. [Google Scholar]
  7. Franceschi, L.; Frasconi, P.; Salzo, S.; Pontil, M.; Berti-Equille, G. Bilevel programming for hyperparameter optimization and meta-learning. arXiv 2018, arXiv:1806.04910. [Google Scholar]
  8. Finn, C.; Abbeel, P.; Levine, S. Model-agnostic meta-learning for fast adaptation of deep networks. In Proceedings of the International Conference on Machine Learning (PMLR), Sydney, NSW, Australia, 6–11 August 2017; pp. 1126–1135. [Google Scholar]
  9. Liu, H.; Simonyan, K.; Yang, Y. Darts: Differentiable architecture search. In Proceedings of the International Conference on Learning Representations, New Orleans, LA, USA, 6–9 May 2019. [Google Scholar]
  10. Mohamed, S.; Rosca, M.; Figurnov, M.; Mnih, A. Monte Carlo Gradient Estimation in Machine Learning. J. Mach. Learn. Res. 2020, 21, 1–62. [Google Scholar]
  11. Ronneberger, O.; Fischer, P.; Brox, T. U-net: Convolutional networks for biomedical image segmentation. In Proceedings of the International Conference on Medical Image Computing and Computer-Assisted Intervention; Springer: Berlin/Heidelberg, Germany, 2015; pp. 234–241. [Google Scholar]
  12. Isensee, F.; Petersen, J.; Klein, A.; Zimmerer, D.; Jaeger, P.F.; Kohl, S.; Wasserthal, J.; Koehler, G.; Norajitra, T.; Wirkert, S.; et al. nnu-net: Self-adapting framework for u-net-based medical image segmentation. arXiv 2018, arXiv:1809.10486. [Google Scholar]
  13. Isensee, F.; Jaeger, P.F.; Kohl, S.A.; Petersen, J.; Maier-Hein, K.H. nnU-Net: A self-configuring method for deep learning-based biomedical image segmentation. Nat. Methods 2021, 18, 203–211. [Google Scholar] [CrossRef] [PubMed]
  14. Rabbaa, I.; Natsheh, Z. Fused-Deposition-Modeling 3D Printer; Technical Report; Palestine Polytechnic University: Hebron, West Bank, Palestine, 2015; Available online: https://scholar.ppu.edu/items/28d7bfde-c344-4830-ab14-9f04478fe645 (accessed on 6 August 2025).
  15. Jadhav, Y.; Pak, P.; Farimani, A.B. Llm-3D print: Large language models to monitor and control 3D printing. arXiv 2024, arXiv:2408.14307. [Google Scholar] [CrossRef]
  16. Xiao, C.; Chen, Z.; Li, H.; Li, D.; Khan, R.; Tian, J.; Xie, W.; Su, L. Semi-supervised 3D U-Net Learning Based on Meta Pseudo Labels. In MICCAI Challenge on Fast and Low-Resource Semi-supervised Abdominal Organ Segmentation; Springer: Berlin/Heidelberg, Germany, 2022; pp. 214–222. [Google Scholar]
  17. Ma, J.; Wang, B. Fast and Low-Resource Semi-Supervised Abdominal Organ Segmentation: MICCAI 2022 Challenge, FLARE 2022, Held in Conjunction with MICCAI 2022, Singapore, September 22, 2022, Proceedings; Springer Nature: Cham, Switzerland, 2023; p. 13816. [Google Scholar]
  18. Zhang, Y.; Safdar, M.; Xie, J.; Li, J.; Sage, M.; Zhao, Y.F. A systematic review on data of additive manufacturing for machine learning applications: The data quality, type, preprocessing, and management. J. Intell. Manuf. 2023, 34, 3305–3340. [Google Scholar] [CrossRef]
  19. Werkle, K.T.; Trage, C.; Wolf, J.; Möhring, H.C. Generalizable process monitoring for FFF 3D printing with machine vision. Prod. Eng. 2024, 18, 593–601. [Google Scholar] [CrossRef]
  20. Fu, T.H.; Li, D.R. Real-time process monitoring and error correction in material extrusion-based additive manufacturing via multi-output machine learning. J. Manuf. Process. 2025, 152, 638–656. [Google Scholar] [CrossRef]
  21. Brion, D.A.; Pattinson, S.W. Generalisable 3D printing error detection and correction via multi-head neural networks. Nat. Commun. 2022, 13, 4654. [Google Scholar] [CrossRef] [PubMed]
  22. Bakas, G.; Bei, K.; Skaltsas, I.; Gkartzou, E.; Tsiokou, V.; Papatheodorou, A.; Karatza, A.; Koumoulos, E.P. Object detection: Custom trained models for quality monitoring of fused filament fabrication process. Processes 2022, 10, 2147. [Google Scholar] [CrossRef]
  23. Karna, N.B.A.; Putra, M.A.P.; Rachmawati, S.M.; Abisado, M.; Sampedro, G.A. Toward accurate fused deposition modeling 3d printer fault detection using improved YOLOv8 with hyperparameter optimization. IEEE Access 2023, 11, 74251–74262. [Google Scholar] [CrossRef]
  24. Li, H.; Yu, Z.; Li, F.; Yang, Z.; Tang, J.; Kong, Q. Monitoring the extrusion state of fused filament fabrication using fine-grain recognition method. J. Manuf. Process. 2024, 125, 306–320. [Google Scholar] [CrossRef]
  25. Wu, G. Defect Detection in Fused Filament Fabrication with Artificial Intelligence. Ph.D. Thesis, RMIT University, Melbourne, VIC, Australia, 2025. [Google Scholar]
  26. Mehta, M.; Shao, C. Federated learning-based semantic segmentation for pixel-wise defect detection in additive manufacturing. J. Manuf. Syst. 2022, 64, 197–210. [Google Scholar] [CrossRef]
  27. Scime, L.; Paquit, V.; Joslin, C.; Richardson, D.; Goldsby, D.; Lowe, L. Layer-wise imaging dataset from powder bed additive manufacturing processes for machine learning applications (Peregrine v2021-03). ORNL Dataset. 2021. Available online: https://doi.ccs.ornl.gov/dataset/e2decf63-021c-563c-8729-ffe02769176c (accessed on 18 May 2026). [CrossRef]
  28. Krishnamurthy, R.J.; Crawford, B.; Milani, A.S. A Preliminary Step Towards Intelligent, Layer-by-Layer Self-Correction of Stringing Defect in Fused Filament Fabrication Using Limited Data. Int. J. Precis. Eng. Manuf. 2025, 27, 47–62. [Google Scholar] [CrossRef]
  29. Jin, Z.; Zhang, Z.; Ott, J.; Gu, G.X. Precise localization and semantic segmentation detection of printing conditions in fused filament fabrication technologies using machine learning. Addit. Manuf. 2021, 37, 101696. [Google Scholar] [CrossRef]
  30. Gupta, A.; Dollár, P.; Girshick, R. LVIS: A Dataset for Large Vocabulary Instance Segmentation. In Proceedings of the IEEE/CVF Conference on Computer Vision and Pattern Recognition (CVPR), Long Beach, CA, USA, 15–20 June 2019; pp. 5356–5364. [Google Scholar] [CrossRef]
  31. Spiritdude. Nautilus Thumbnailer for GCode Files. GitHub Repository. 2025. Available online: https://github.com/Spiritdude/Nautilus_Thumbnailer_GCode (accessed on 18 May 2026).
  32. Huang, Z.; Jiang, B.; Guo, T.; Liu, Y. Measuring the impact of gradient accumulation on cloud-based distributed training. In Proceedings of the 2023 IEEE/ACM 23rd International Symposium on Cluster, Cloud and Internet Computing (CCGrid), Bangalore, India, 1–4 May 2023; pp. 344–354. [Google Scholar]
  33. Milletari, F.; Navab, N.; Ahmadi, S.A. V-net: Fully convolutional neural networks for volumetric medical image segmentation. In Proceedings of the 2016 Fourth International Conference on 3D Vision (3DV), Stanford, CA, USA, 25–28 October 2016; pp. 565–571. [Google Scholar]
  34. Wong, K.C.; Moradi, M.; Tang, H.; Syeda-Mahmood, T. 3D segmentation with exponential logarithmic loss for highly unbalanced object sizes. In Medical Image Computing and Computer Assisted Intervention–MICCAI 2018; Springer: Cham, Switzerland, 2018; pp. 612–619. [Google Scholar]
  35. Isensee, F.; Wald, T.; Ulrich, C.; Baumgartner, M.; Roy, S.; Maier-Hein, K.; Jaeger, P.F. nnu-net revisited: A call for rigorous validation in 3d medical image segmentation. In Proceedings of the International Conference on Medical Image Computing and Computer-Assisted Intervention; Springer: Cham, Switzerland, 2024; pp. 488–498. [Google Scholar]
Figure 1. A filtered subset of the FFF Fault Tree [3]. The leaf nodes highlighted in this structure represent the types of top-layer-visible defects that a trained segmentation model would need to detect, linking visual symptoms to upstream root causes.
Jmmp 10 00183 g001
Figure 2. Overview of the experimental workflow. The pipeline begins with large-scale synthetic data generation from Slice-100K [5], followed by nnU-Net preprocessing. The data is then split to facilitate two parallel evaluation tracks: a Weak Baseline (Vanilla U-Net) and a Strong Baseline (nnU-Net). All setups are evaluated on the same held-out validation set to ensure fair comparison.
Jmmp 10 00183 g002
Figure 3. Overview of the Meta-Pseudo-Labeling (MPL) bilevel optimization flow adapted for additive manufacturing monitoring. The top figure details the foundational U-Net architecture, illustrating the contracting encoder and expansive decoder pathways with skip connections. Due to space constraints in the lower MPL flow diagram, this detailed architecture is represented by an abbreviated three-slice schematic block (Tall-Short-Tall), which operates as either the student or teacher network. It should be noted that while the detailed schematic illustrates the general U-Net topology, the actual structural heuristics employed by the Strong Baseline are dynamically determined by the nnU-Net fingerprinting process. These specific configurations, which are not fully captured by the standard schematic, consist of a 512 × 512 patch size, 8 topological stages (pooling layers), an initial feature width of 32, and a batch size of 12. Diagram architecture adapted from the open-source PlotNeuralNet framework (MIT License).
Jmmp 10 00183 g003
Figure 4. Impact of class imbalance on training stability. While standard Binary Cross Entropy (BCE) remained stable (blue), introducing a naive Dice loss without patch-based sampling led to divergence and instability (red) due to the 1:24 foreground-to-background ratio.
Jmmp 10 00183 g004
Figure 5. Qualitative comparison of segmentation results across all five experimental setups. Setup 4 (MPL) significantly reduces false positive noise seen in Setup 3, closely matching the upper bound (Setup 5).
Jmmp 10 00183 g005
Figure 6. Illustrative example of the sim-to-real gap and physical scale for a representative object (Thingiverse ID: 2293856). (a) Synthetic render used in the training/evaluation pipeline. (b) Representative physical print produced on an Ender-3 printer in the IoT lab. The real-world image exhibits lighting glare, motion blur, nozzle-related artifacts, and infill variability not present in the synthetic render. (c) The same object viewed in the Ultimaker Cura slicer; the standard 10 mm bed grid provides a dimensional scale reference for the printed object.
Jmmp 10 00183 g006
Table 1. Intermediate and undeveloped fault events in fused filament fabrication printers, adapted from [3].
IDIntermediate/Undeveloped EventTop-Layer Detectable?
AExtrusion interruptionYes
A1Grinding filamentYes
BClogged extruderYes
B1Deformities on the side surfacesNo
B2BlobsYes
B3Lines on the side of printNo
B4Inconsistent extrusionYes
CWavy patternYes
DMechanical issuesIndirect
EExtruder issuesIndirect
E1Dimensional errorsYes
E2OozingYes
E3Layer issuesYes
E4Layer shifting or misalignmentYes
FMissing layersYes
GLayer separation and splittingYes
HElectrical issuesNo
H1OverheatingYes
H2Not printing the very small sectionsYes
ISupport problemsYes
I1Poor bridgingYes
JPoor surface above supportsYes
J1Curled edgesYes
J2Print not sticking to the bedYes
J3Holes and gaps issuesYes
J4Holes and gaps in the top layersYes
J5Gaps in the edges of the perimetersYes
KHoles and gaps in floor cornersYes
K1Gaps in thin wallsYes
K2Weak infillYes
LInitiating problemsYes
MNot extruding at the start of printYes
NExceedance of axis distanceYes
OElephant footNo
PVisible infillYes
QScratches on the top surfaceYes
Table 2. Summary of related work focusing on vision-based monitoring and dataset scale.
PaperMethodDataset
Classification & Fine-Grained Analysis
[21]Multihead CNN1.2 M Images
[24]WSDAN (Fine-grained)Private, 1000 Images
[25]AR + ML ClassificationPrivate FFF Prints
[28]CNN + XGB5940 Stringing Samples
Object Detection
[22]YOLOv5 Detection714 Images (on request)
[23]YOLOv8 DetectionPrivate, 5000 Images
Semantic Segmentation
[2]GG-Net (G-code Guided)Real FFF, Single Webcam
[26]FL U-Net60 Seg. Masks (Peregrine)
[29]DeepLabV31400 Seg. Masks
Classical Computer Vision & Baselines
[19]Canny EdgeN/A
Reviews
[4]Systematic Review10 Open AM Datasets
Table 3. Dataset generation statistics (initial sample).
MetricValue
Objects Included512
Total Image–Mask Pairs70,074
Avg. Images per Object136.9
Projected Images (100k Objects)∼13.7 Million
Table 4. Synthetic rendering parameters and G-code rasterization rules.
ParameterConfiguration Value/Rule
Camera ViewpointTop-down orthogonal projection (XY plane), centered dynamically on the object’s bounding box center X c = ( X max + X min ) / 2 , Y c = ( Y max + Y min ) / 2 .
Camera Distance (Z)Dynamically scaled to 1.25× the maximum object dimension ( max ( w i d t h , d e p t h ) ) to ensure full layer visibility without edge clipping.
Lighting ModelSingle overhead directional light source, ambient lighting coefficient set to 0.3, diffuse coefficient set to 0.7.
Material TextureDistinct green thermoplastic approximation (RGB: 25, 204, 25), no specular highlights to minimize non-geometric artifacts.
Nozzle ModelingNot modeled; the print is rendered purely from the deposited trajectory without physical nozzle occlusion.
BackgroundUniform solid black (RGB: 0, 0, 0), with no randomization or texture.
Anti-aliasingMSAA 4× applied during ray-tracing to smooth rasterized filament edges.
Layer Thickness (Z)Fixed at 0.2 mm corresponding to standard FFF slicing profiles.
Path Width (W)Fixed at 0.4 mm, rendered as cylindrical segments connected by spherical joints at G-code waypoints.
Image ResolutionTarget images rendered at 1024 × 1024 pixels and subsequently downsampled based on model architecture requirements.
Table 5. Comparison of segmentation performance on OOD Holdout Dataset. Results are reported as Mean ± Standard Deviation across all holdout slices.
MethodDice ScoreIoUPrecisionRecallHD95 (px)Boundary F1
Weak Baseline Regime
Setup 1: Vanilla U-Net (Sup, 18%)0.6521 ± 0.11880.4950 ± 0.12720.7567 ± 0.12680.5813 ± 0.121856.65 ± 51.560.8202 ± 0.1152
Setup 2: Vanilla MPL (18% L + 72% U)0.8215 ± 0.08280.7038 ± 0.09790.8194 ± 0.10960.8291 ± 0.078948.96 ± 47.830.9105 ± 0.0832
Improvement+0.1694+0.2088+0.0627+0.2478−7.69+0.0903
Strong Baseline Regime (State-of-the-Art)
Setup 3: nnU-Net (Sup, 18%)0.8129 ± 0.09510.6950 ± 0.12900.7238 ± 0.13630.9469 ± 0.052053.70 ± 53.320.9100 ± 0.0762
Setup 4: nnU-Net MPL (18% L + 72% U)0.8592 ± 0.10060.7633 ± 0.11720.8870 ± 0.06600.8573 ± 0.152324.71 ± 24.380.9134 ± 0.1247
Improvement+0.0463+0.0683+0.1632−0.0896−28.99+0.0034
Upper Bound Reference
Setup 5: nnU-Net (Sup, 90%)0.8950 ± 0.05790.8132 ± 0.06590.8694 ± 0.08330.9276 ± 0.063847.45 ± 46.790.9396 ± 0.0615
Disclaimer/Publisher’s Note: The statements, opinions and data contained in all publications are solely those of the individual author(s) and contributor(s) and not of MDPI and/or the editor(s). MDPI and/or the editor(s) disclaim responsibility for any injury to people or property resulting from any ideas, methods, instructions or products referred to in the content.