Article

Effect of WAAM Process Parameters on Structure and Mechanical Properties of Low-Carbon Steel Thin Walls


Institute of Laser and Welding Technologies, State Marine Technical University, Saint Petersburg 198095, Russia
*
Author to whom correspondence should be addressed.
J. Manuf. Mater. Process. 2026, 10(4), 144; https://doi.org/10.3390/jmmp10040144
Submission received: 19 March 2026 / Revised: 17 April 2026 / Accepted: 20 April 2026 / Published: 21 April 2026

Abstract

Wire Arc Additive Manufacturing (WAAM) has emerged as a promising additive manufacturing technique due to its high deposition rate and low material cost. WAAM is increasingly adopted in various industries for the production of large-scale metal components, yet optimizing productivity without sacrificing mechanical integrity remains a critical challenge, particularly for low-carbon steels. This study systematically investigates the influence of key WAAM parameters—welding current (100–350 A) and travel speed (5–30 mm/s) on the deposition stability, microstructure, and mechanical properties of thin walls made of low-carbon Fe–0.09 C–1.10 Cr–1.47 Mn–0.59 Si–0.56 Mo–0.11 Ni–0.23 V steel. A stable processing window for defect-free wall fabrication was established for currents of 100–250 A, while higher currents of 300–350 A resulted in melt pool instability and geometrical distortions due to excessive heat input. Microstructural characterization revealed a dual-phase structure consisting of allotriomorphic ferrite (ALF) and acicular ferrite (AF) in all samples. The microstructural evolution was critically governed by variations in the cooling time in the critical temperature range of 800 °C to 500 °C (t8/5) within the thermal cycles, a direct consequence of the heat input quantified through volumetric energy density. Low heat input at 100 A, 5 mm/s promoted a microstructure with minimal ALF fraction of ~10%, whereas high heat input at 350 A, 30 mm/s induced significant ferrite recrystallization and coarsening, increasing ALF fraction to ~55%. These microstructural changes directly affected mechanical properties: YS/UTS decreased from 512 MPa/668 MPa to 401 MPa/602 MPa, respectively. Concurrently, the deposition rate increased substantially from ~1.6 kg/h to ~6.3 kg/h. The results demonstrate a critical trade-off between productivity and mechanical performance, providing a practical framework for parameter selection in WAAM-fabricated low-carbon steel components.

1. Introduction

The increasing demand for flexible and cost-effective manufacturing solutions has driven significant interest in alternative approaches to producing metal components, particularly in the context of rapid prototyping and small-batch production [1,2]. Additive Manufacturing (AM) offers a transformative solution to the limitations of conventional techniques [3]. Unlike conventional approaches, AM enables the layer-by-layer fabrication of components directly from a three-dimensional CAD model, with material being deposited exclusively in regions corresponding to the part geometry [4,5]. This near-net-shape capability significantly reduces material consumption, minimizes the need for subsequent machining, and shortens production times, making AM particularly attractive for customized and small-series manufacturing [6,7]. Among the various AM technologies, Wire Arc Additive Manufacturing (WAAM) is a subset of Directed Energy Deposition technology that combines the high deposition efficiency of conventional arc welding with the geometrical freedom inherent to additive processes [8,9]. This technology offers several compelling advantages, including high material efficiency, relatively low capital investment compared to powder-bed systems, and the capacity to produce large-scale components for various industries [10,11,12,13,14] from a wide range of engineering alloys [15,16,17,18].
The demand for large-scale components necessitates enhanced productivity to ensure economically viable manufacturing [19]. Process productivity can be improved by employing larger diameter wire, utilizing the simultaneous feeding of multiple wires through several devices, or implementing controlled short-circuiting metal transfer [20,21,22,23]. On the other hand, increasing the wire feed rate along with the corresponding process power offers a more direct and simpler means of increasing the volume of melted metal. The influence of process parameters on stability, bead geometry, structure, and properties has been comprehensively studied [24,25,26,27,28,29]; optimal (i.e., allowing production of defect-free samples) processing conditions often belong to medium-energy regimes. However, this approach increases heat input [30], resulting in overheating, an expanded heat-affected zone, and a consequent loss of geometrical accuracy. This inevitably necessitates forced cooling or modifications to the deposition strategy [31,32,33,34].
Post-machining of thin-walled WAAM components poses substantial industrial challenges, particularly in high-value sectors such as aerospace, naval shipbuilding, and large-scale structural applications [35]. Due to their low structural rigidity, thin walls are highly susceptible to distortion, vibration, and deflection under clamping forces and cutting loads, often leading to loss of dimensional accuracy, chatter, and poor surface finish upon fixture release [36,37]. These issues are exacerbated by residual stresses inherent to the WAAM process, which cause significant deformation when the part is unclamped. Custom or limited-constraint fixturing strategies are frequently required to mitigate these problems, yet they increase production complexity, cost, and lead-time [38,39]. Consequently, optimizing WAAM parameters to achieve superior as-deposited geometrical accuracy is essential to minimize extensive post-processing and enhance economic viability in demanding industrial applications.
For steel components fabricated by WAAM, the relationship between process parameters, microstructure, and mechanical properties is of paramount importance. The layer-by-layer nature of the process exposes the deposited material to complex thermal cycles involving repeated rapid heating and cooling. Complex thermal histories dictate the solid-state phase transformations, resulting in heterogeneous microstructures and anisotropic mechanical properties [40,41,42]. The heat input, interlayer temperature, and cooling rate directly influence the kinetics of microstructure formation, with the cooling time between 800 °C and 500 °C (Δt8/5) being the primary parameter governing the mechanisms of austenite decomposition [43,44]. For example, longer Δt8/5 times promoted the diffusional transformations of austenite into pearlite, polygonal ferrite or grain boundary (allotriomorphic and Widmanstätten) ferrite, leading to a decrease in strength [45]. For example, the formation of equiaxed ferrite in the mid-section of the samples due to heat accumulation was observed in [41,43,46], and was supported by a decrease in microhardness. In contrast, an increase in cooling rate with shorter Δt8/5, favored the nucleation of acicular ferrite, bainitic ferrite or martensite [44,47]. Moreover, such conditions can lead to the formation of martensite–austenite (MA) constituent, forming localized brittle zones which, as demonstrated in [48], significantly deteriorate plasticity along the building direction. Consequently, understanding and controlling the microstructural evolution through careful selection of process parameters is essential for achieving the desired balance of mechanical properties in WAAM-fabricated steel parts.
Despite extensive research on WAAM of steels, systematic studies covering a wide range of welding currents and travel speeds remain limited. Most investigations have focused on narrow processing windows, leaving the full spectrum of achievable microstructures and properties unexplored [25,28]. The objective of this study is to systematically investigate the effects of WAAM parameters on the deposition stability, resulting microstructure, and mechanical properties of a low-carbon Fe–0.09 C–1.10 Cr–1.47 Mn–0.59 Si–0.56 Mo–0.11 Ni–0.23 V steel. This work aims to (1) map the stable process window for thin-wall deposition, (2) characterize the microstructural features arising from different thermal cycles, and (3) correlate these features with the corresponding mechanical properties.

2. Materials and Methods

The samples were produced by the gas metal arc welding (GMAW) WAAM process using commercially produced metal wire ESAB OK Autrod 13.14 (ESAB AB, Gothenburg, Sweden) with a diameter of 1.2 mm. The filler material was a low-carbon steel with a chemical composition of Fe–0.09 C–1.10 Cr–1.47 Mn–0.59 Si–0.56 Mo–0.11 Ni–0.23 V (wt.%).
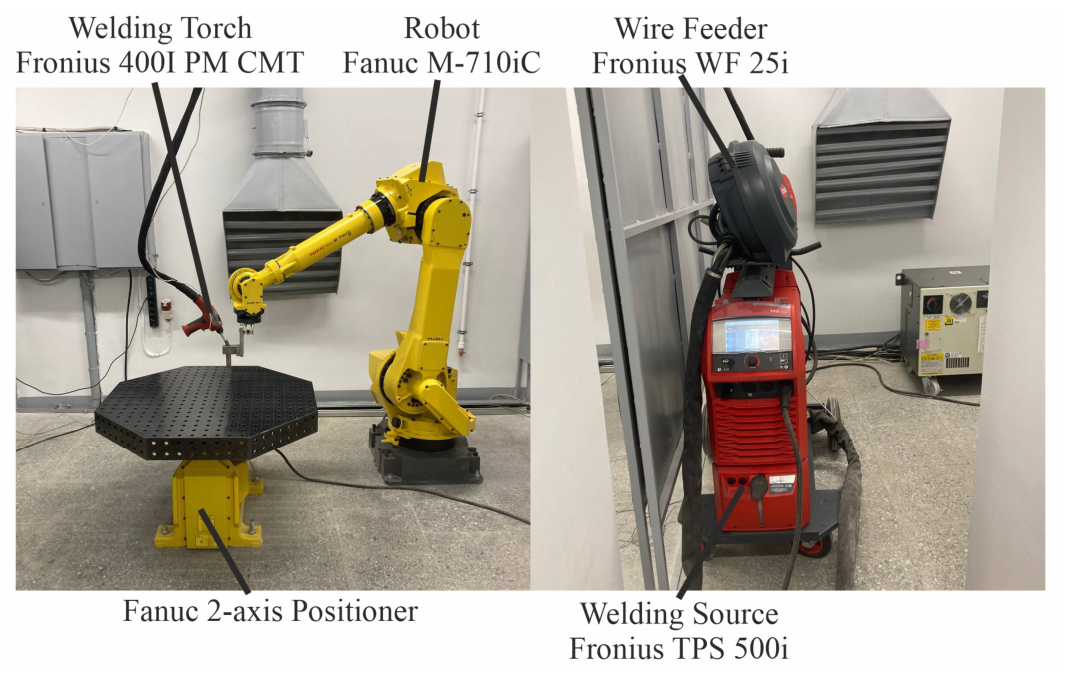
The WAAM setup (Figure 1) equipped with a FRONIUS TPS 500i (Fronius International GmbH, Pettenbach, Austria) welding arc source and 6-axis FANUC M-710iC robot with 2-Axis Positioner (both FANUC CORPORATION, Oshino-mura, Japan). A FRONIUS WF 25i drive feeder and FRONIUS 400I PM CMT torch (Fronius International GmbH, Pettenbach, Austria) were used to feed and melt the wire, respectively. A protective gas (20% of CO2/80% of Ar) was supplied with a flow rate of 20 L/min.
Single-pass walls with a height of 40 mm were produced by WAAM. The welding parameters were selected based on preliminary single-bead trials and the capabilities of the welding equipment. The current varied within the range of 100–350 A with a step of 50 A, and the travel speed of the working tool was varied within the range of 5–30 mm/s with a step of 5 mm/s (Table 1). The upper current limit of 350 A was dictated by equipment specifications (“Welding Current at 10 min/40 °C”). The travel speed ranges for each current value were determined experimentally based on process stability. The voltage was automatically adjusted by the welding arc source depending on current. The linear energy (E), depending on currents and travel speeds, was determined by the formula:
E = P/V,
where P is the power of process (as a product of current and voltage), and V is the travel speed.
At currents of 300–350 A, ~30 s interlayer dwell time was applied to provide a decrease in interpass temperatures, allowing partial cooling of each deposited layer before subsequent deposition. Optris CTlaser pyrometer (Optris GmbH, Berlin, Germany) was used to control the interpass temperature for samples deposited using pauses. The pyrometer was rigidly attached to the welding torch, ensuring identical measurement areas and consistent interpass temperature control. Thermocouples (type K) were used for model validation during deposition at 100 A and 350 A. The thermocouple was attached to a side surface of the specimens during deposition.
Computer simulation was used to analyze the distribution of temperature fields and obtain the thermal history during deposition of the samples. The numerical solution of the non-stationary thermal problem was carried out using the finite element method in the COMSOL Multiphysics software package (version 6.1). The heating of the sample during the production process is described as the effect of a surface normally distributed heat source with a power on surface:
Q = nIU,
where I—current, U—voltage, and n—thermal efficiency of the arc (0.76). On the other surfaces (except the bottom surface of the substrate), the condition of convective and radiative heat exchange with the environment was set according to the following formula:
qn = h(T − Tinf) + εσ (T4 + T4inf),
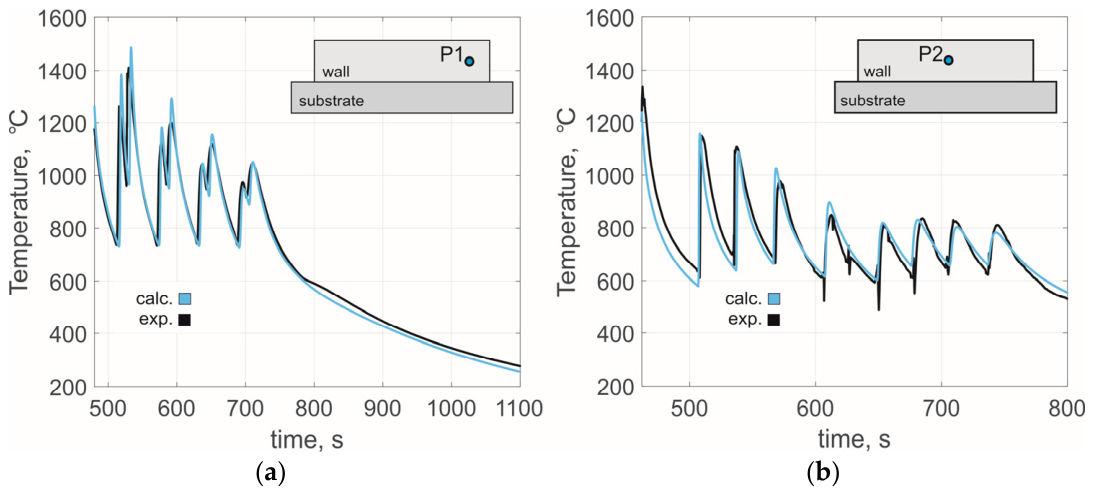
where h is the convection coefficient (30 W K−1 m−2), ε is the emissivity (0.65), σ the Stefan-Boltzmann constant and the Tinf is ambient temperature. It is worth mentioning that the substrate with dimensions of 130 × 30 × 10 mm3 was in contact with a massive welding table during the deposition process. Therefore, during numerical simulation, a boundary condition in the form of heat exchange according to Newton’s law with an effective coefficient h = 100 W K−1 m−2 at Tinf = 50 °C is set on the bottom surface of the substrate, simulating the condition of contact heat exchange with the welding table. The values of the thermal efficiency coefficient and the convective heat transfer coefficient were estimated by comparing the calculated and experimental temperature values obtained using type K thermocouples. The temperature dependence of the thermophysical properties was adopted according to the work [49]. Figure 2 shows a comparison of the experimental and calculated thermal cycles during deposition of thin walls at two regimes. The calculated thermal cycles show a good agreement with the experimental curves over the entire measurement time.
The wall height was determined based on at least 10 measurements. The average layer height was defined as the ratio of the average wall height to the total number of deposited layers. The wall width was determined by taking at least 40 measurements in the transverse cross-section. The surface waviness was defined as the difference between the total and effective wall thickness, as described in [50].
The samples for microstructural characterization were cut in the center of the walls, polished using a Model 200 Dimpling Grinder (Thermo Fisher Scientific Inc., Waltham, MA, USA) and etched with a solution of 97% H2O + 2% HNO3 + 1% HF. Optical metallography was carried out using an optical microscope Leica DMi8 (Leica Microsystems, Wetzlar, Germany). The size and volume fractions of phases were determined through areal analysis of at least five optical images utilizing Digimizer Image Analysis Software version 6. EBSD-analysis was performed by scanning electron microscope Tescan Mira3 LMH (Tescan, Brno, Czech Republic) with a C-Nano EBSD detector (Oxford Instruments NanoAnalysis, Abingdon, UK). For EBSD, areas measured 300 × 300 μm2 were collected with a step size of 0.5 μm using AZtecAdvanced 6.0 software. The density of dislocations can be calculated based on the following equation [51].
ρ = 2 θ/b l
where θ is the average Kernel misorientation angle, b is the Burgers vector (2.48 × 10⁻¹⁰ m), and l is the OIM step size.
For mechanical properties evaluation, tensile tests were performed along the building (vertical) directions of the walls. Flat samples with a cross-section of 3 mm × 1.5 mm and a 16 mm gauge length were tested using the SHIMADZU universal testing machine AGS-100kNX (Shimadzu Corp., Kyoto, Japan) at an initial strain rate of 1 × 10⁻³ s−1 following ASTM E8/E8M standard [52]. At least two specimens were tested for each condition. Microhardness was evaluated using a Future-Tech FM-310 micro-Vickers hardness tester (Future-Tech Corp., Kawasaki, Japan). For microhardness profiling, the cross-section of the samples was cut from the central part of the wall. At least 30 measurements from the substrate to the sample top with step of 1.5 mm were made with a 300 g load and a dwell time of 15 s.

3. Results

3.1. Process Stability

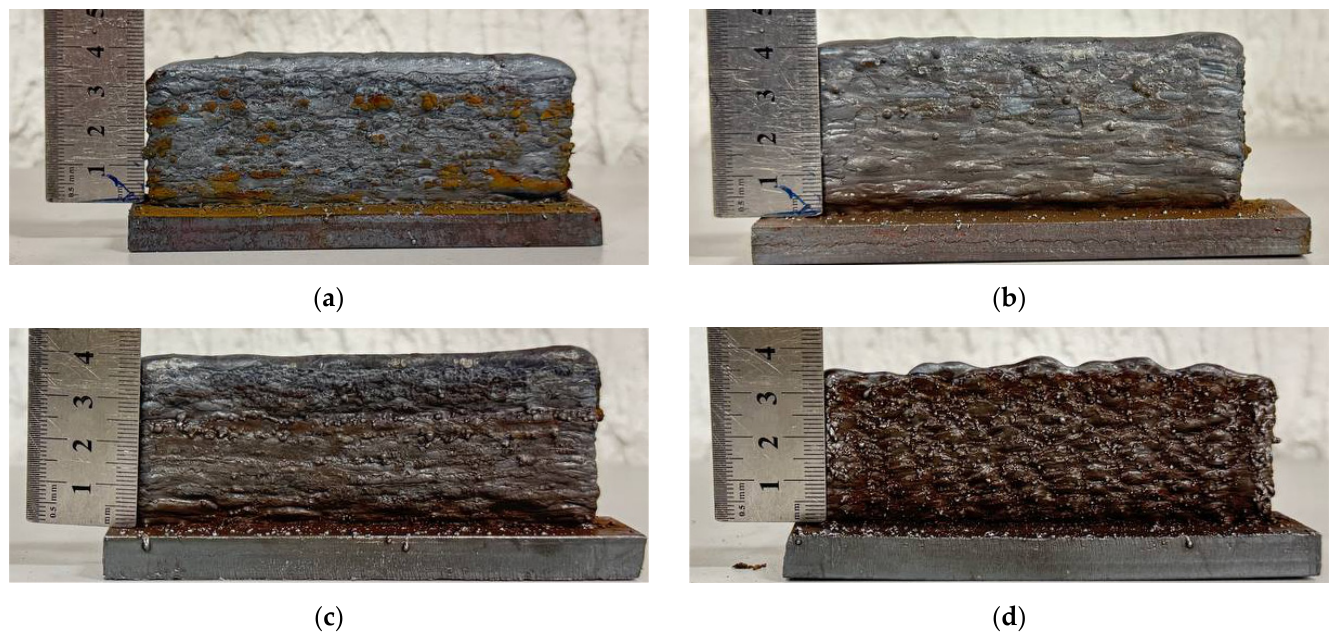
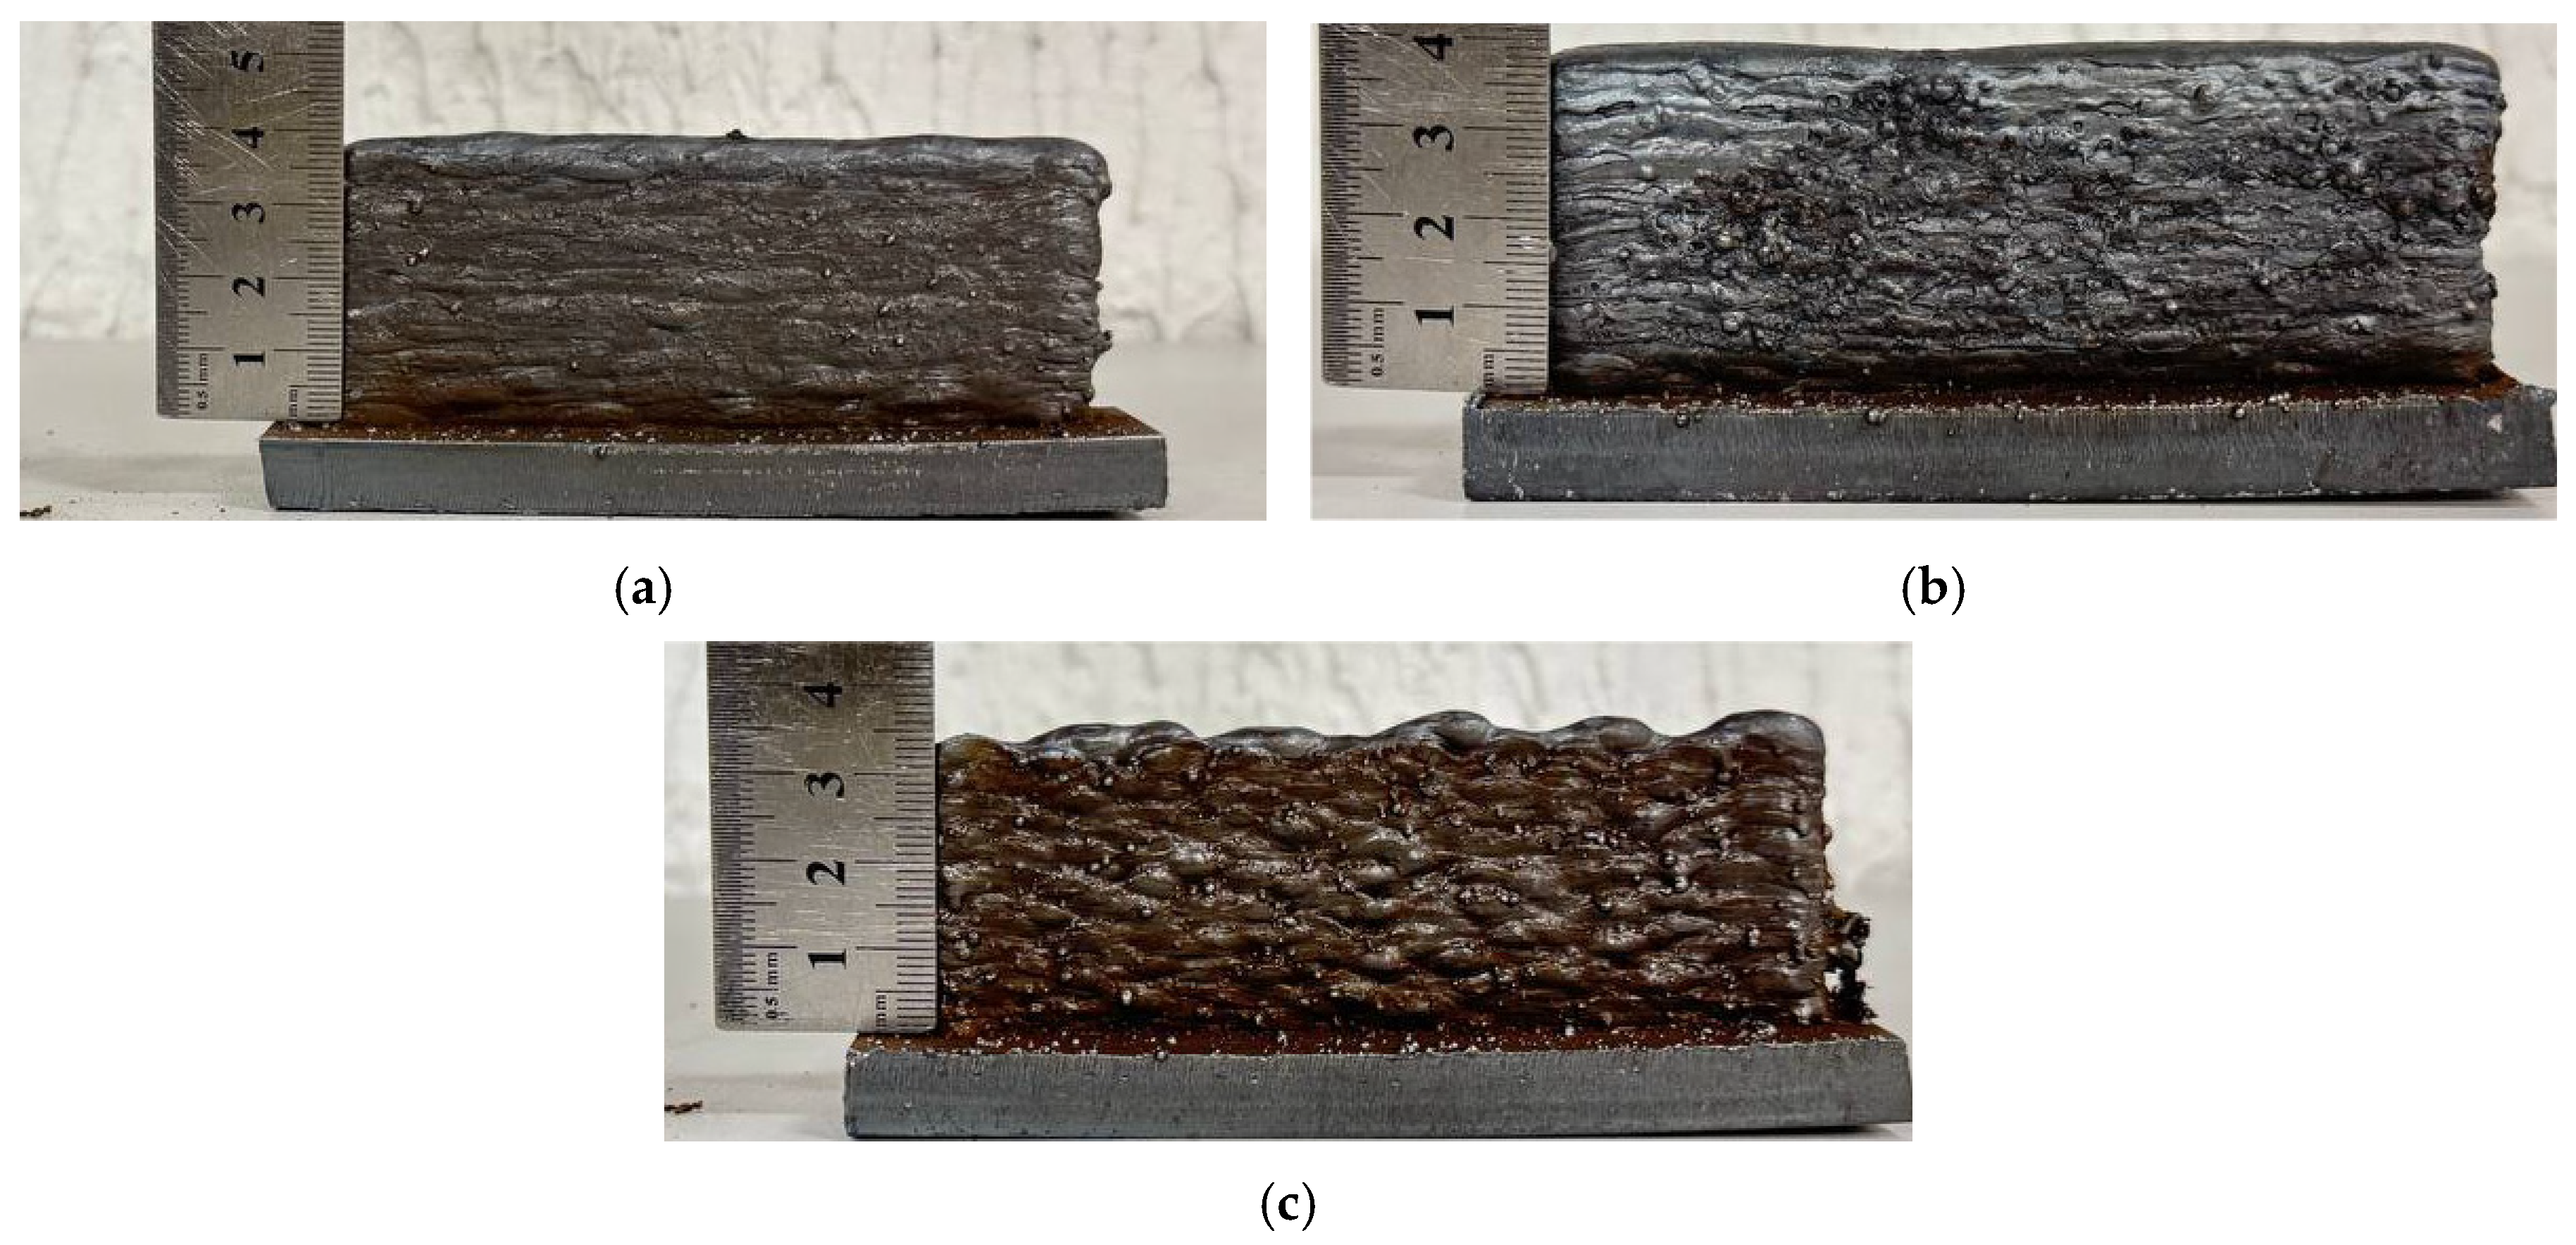
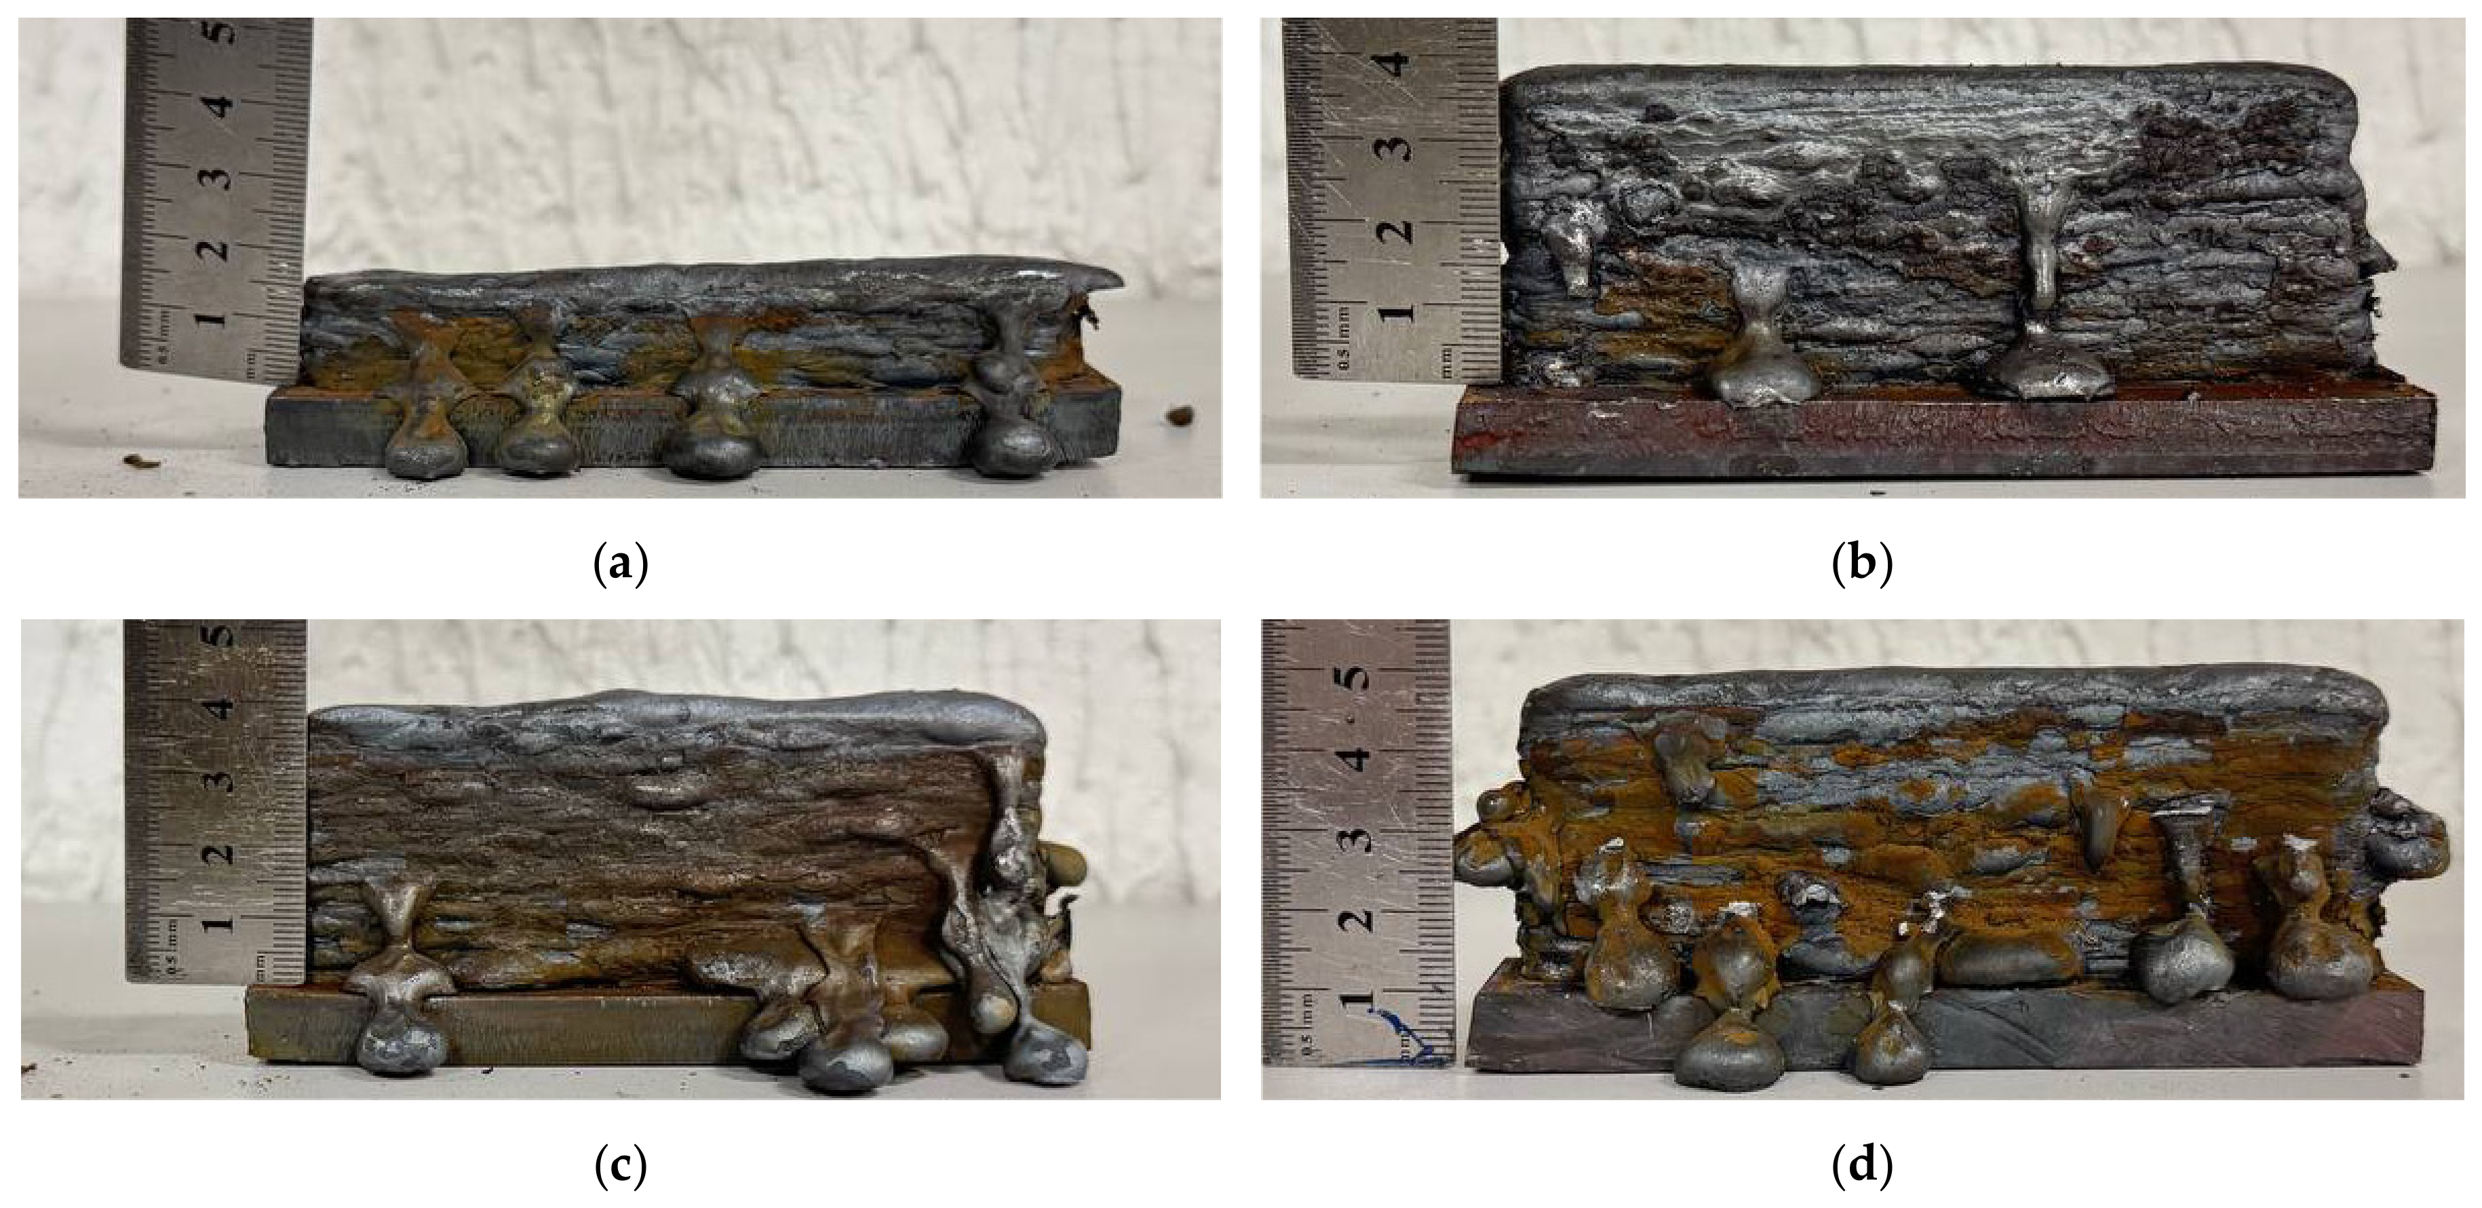
The appearance of the walls obtained with the different process parameters is shown in Figure 3, Figure 4, Figure 5, Figure 6 and Figure 7. Visual inspection of the fabricated samples allowed for the identification of a stable process window for wall formation. For example, stable deposition with a current of 100 A (Figure 3a–c) was achieved at travel speeds ranging from 5 up to 15 mm/s. Increasing the travel speed above 10 mm/s led to a lack of material per unit length and a decrease in bead width due to changes in the melt-through depth and the wetting angle [26]. These resulted in a significant reduction in wall thickness and deterioration of side surface quality (Figure 3d).
As the current increased to 150 A (Figure 4), no significant changes in formation stability were observed at the equivalent travel speeds. However, the stable speed range expanded slightly to 20 mm/s. A noticeable reduction in bead width across layers occurred only at 25 mm/s, a pattern similar to the one observed at 100 A (Figure 3d). Moreover, at low currents and high travel speeds the hump formation was observed on the upper surface of the samples (Figure 3d and Figure 4c). The humping effect occurs when the travel speed exceeds a certain critical value [53], causing the molten pool to become elongated and break into alternating depressions and humps. This effect, widely discussed in [54], is attributed to the hydrodynamic Kelvin–Helmholtz instability of the molten pool during welding.
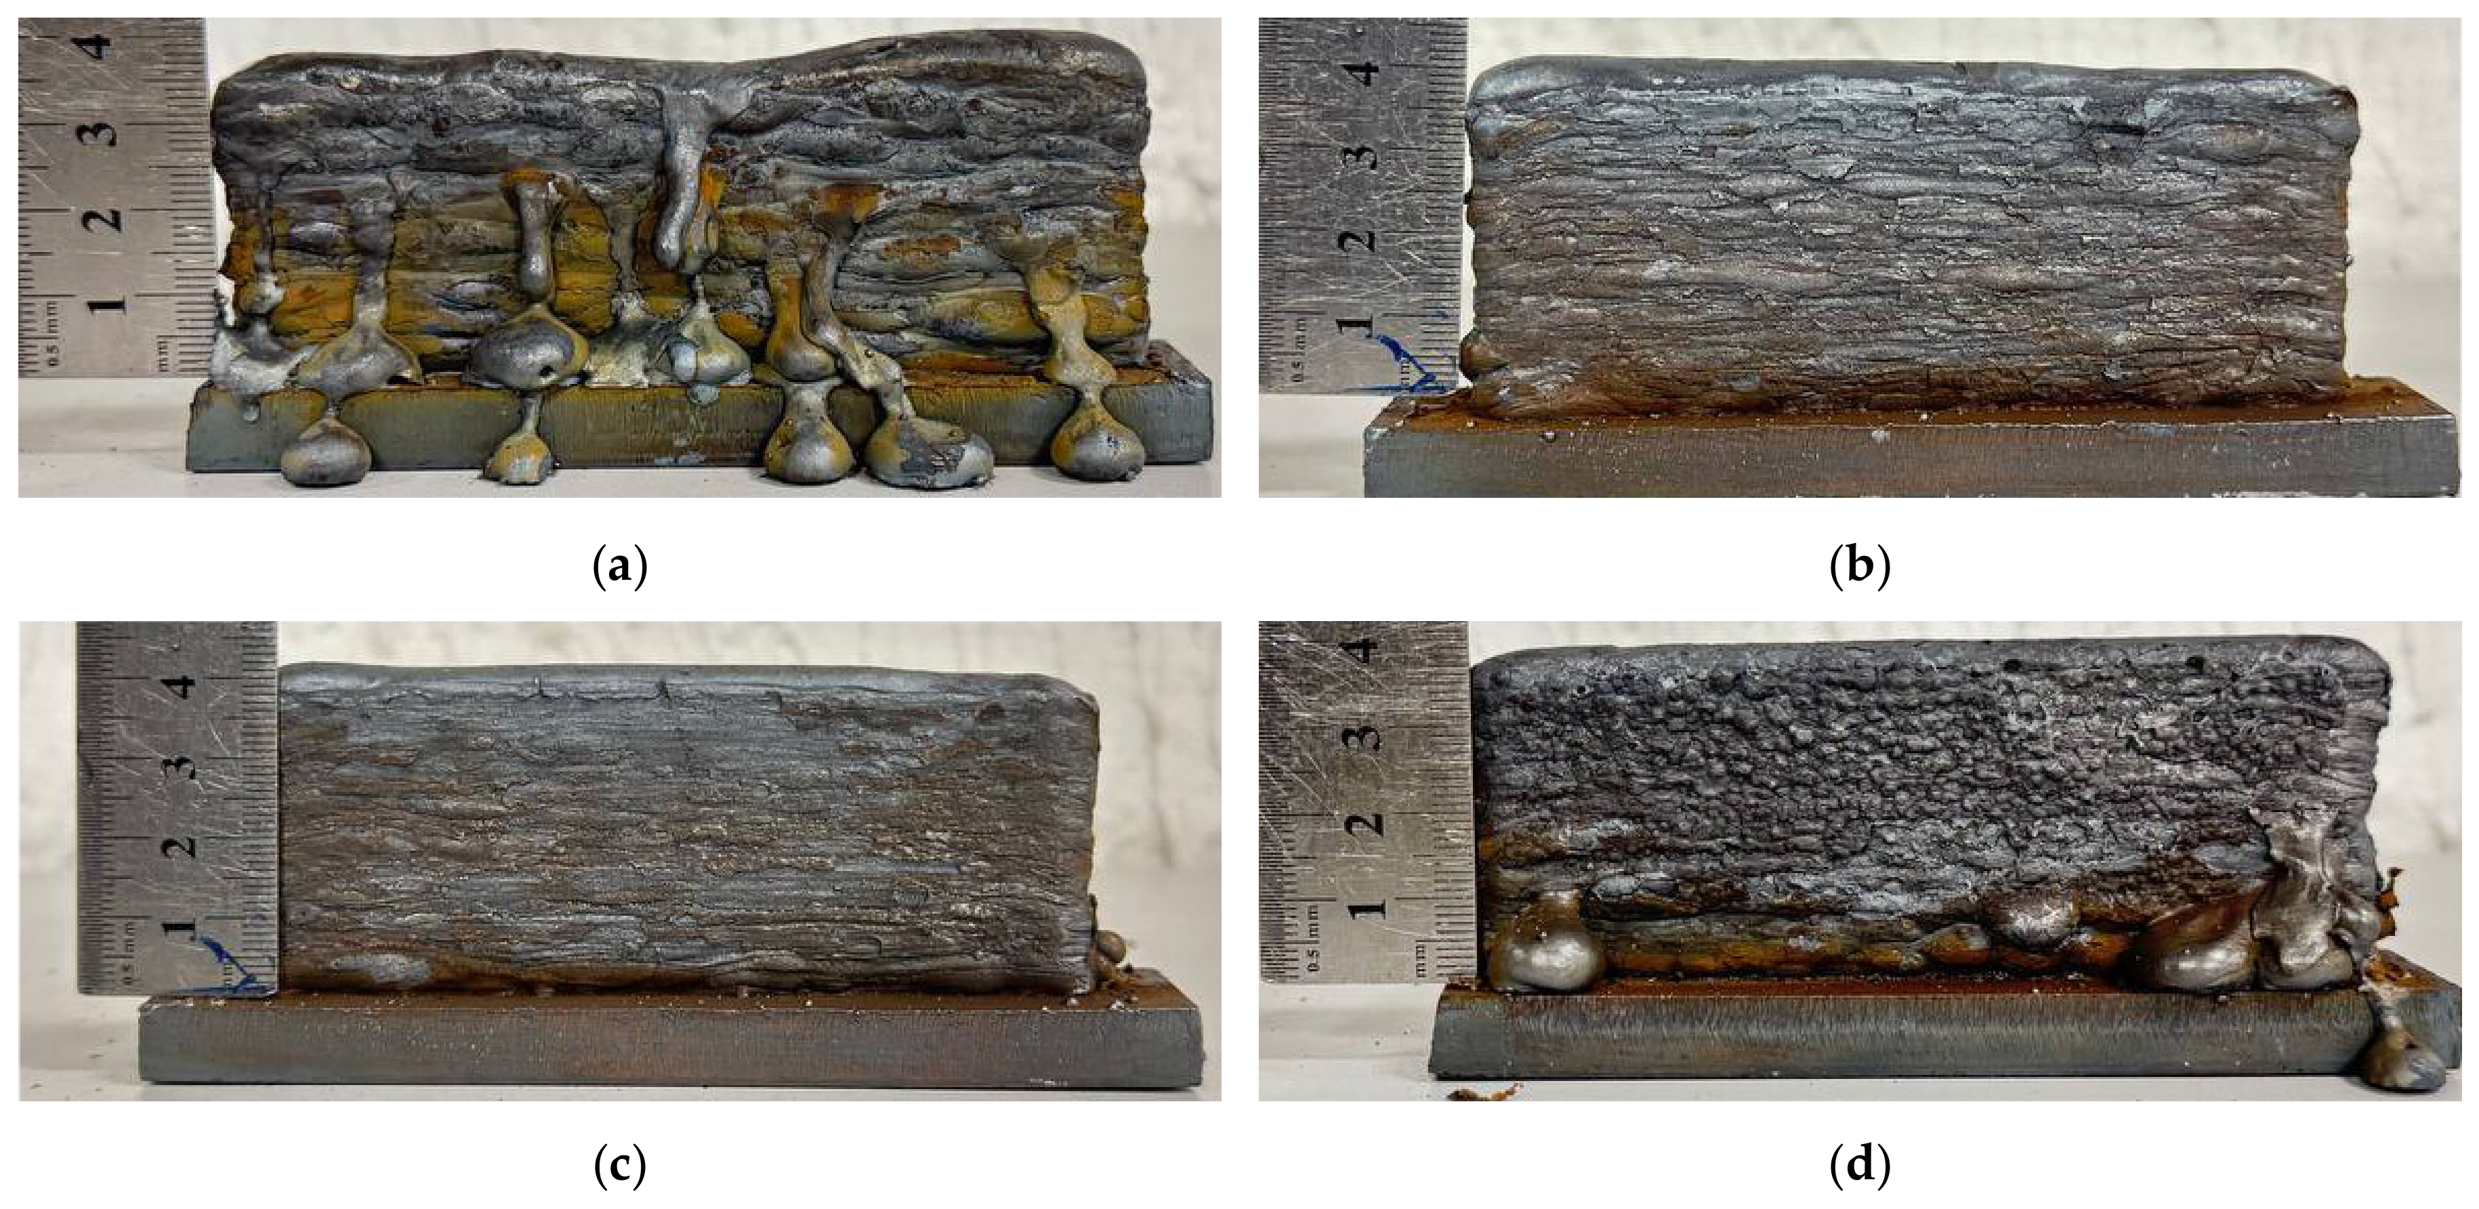
With a further increase in the welding current, the range of optimal bead formation shifts towards higher speeds. For instance, at currents of 200–250 A (Figure 5 and Figure 6), stable formation was achieved at travel speeds of 15–25 mm/s (Figure 5b,c and Figure 6b,c). Since an increase in welding current significantly raises the heat input (Table 1), a higher travel speed is required to compensate for the resulting excessive heating of the metal. For example, at low speeds (Figure 5a and Figure 6a), the overheating led to spreading of the melt pool on the side surfaces of the walls. While this effect is also evident at higher speeds (Figure 5d), spreading was only observed in the initial several layers. Moreover, an increase in the welding current, which is accompanied by faster wire feed rate, reduced the surface tension coefficient [55]. Consequently, the surface tension force becomes insufficient to hold the increased volume of liquid metal transitioning into the trailing part of the pool, leading to spatter of the molten material. The phenomenon manifests as sagging on the side surface of the wall (Figure 6a,d).
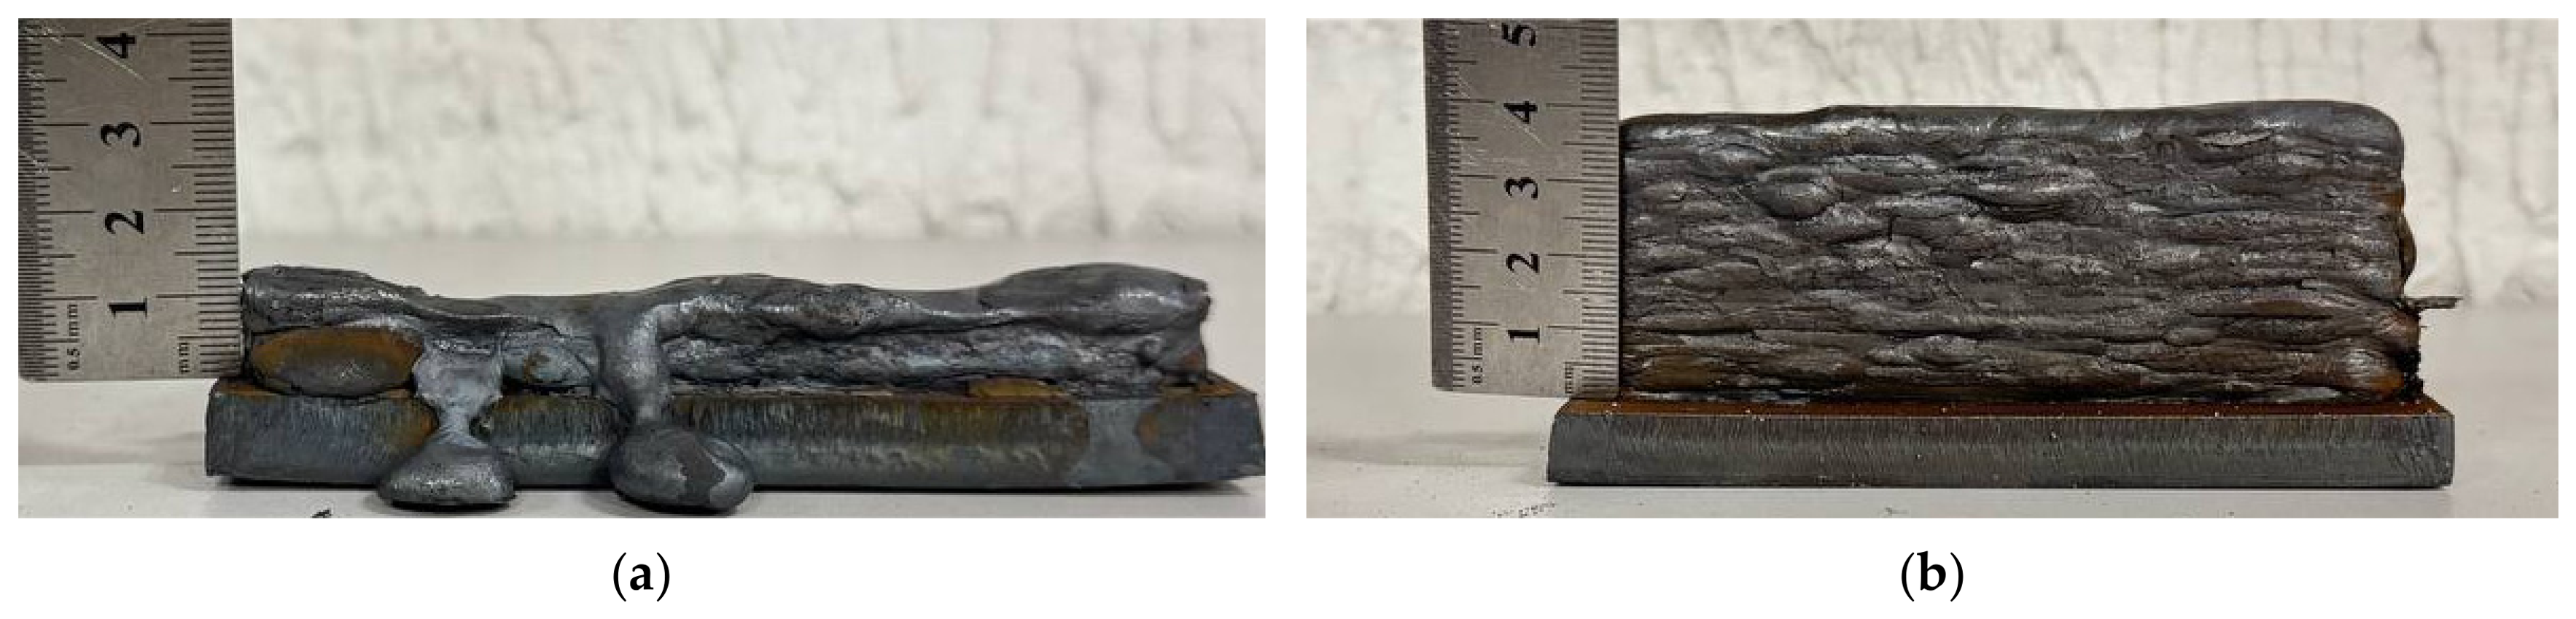
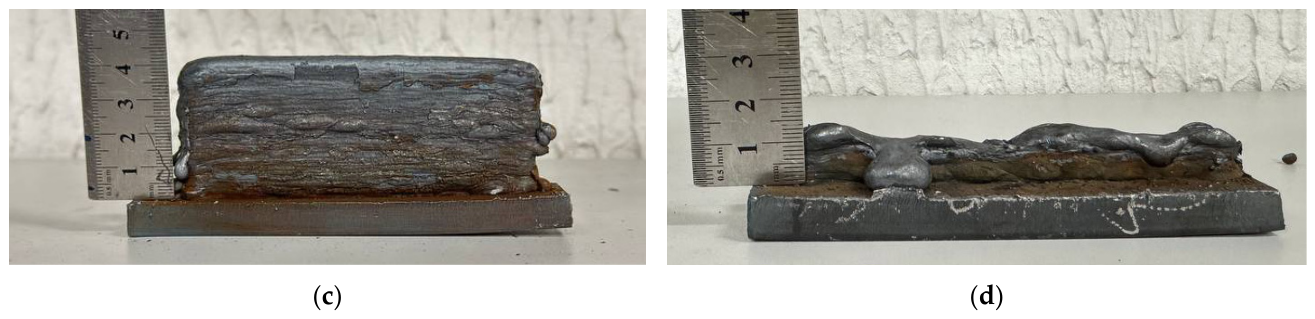
When the welding current is increased to 300–350 A (Figure 7), adding pauses between passes becomes necessary to provide the time required for the weld pool to solidify. Otherwise, arc ignition occurs on still-molten metal, leading to severe spatter and metal run-off. Surface waviness is intensified by the presence of spatter which in turn leads to irregularities in the cross-sectional profile, thereby requiring further excessive machining. However, at these currents, regardless of the working tool travel speed and the presence/absence of pauses, stable formation could not be achieved.
For further studies, the modes inside the operating window that ensure stable formation (for currents of 100–250 A) were selected. Although deposition of walls becomes unstable at higher currents of 300–350 A, these modes were also examined to evaluate the potential trade-off between a process performance and the resulting structural characteristics and mechanical properties.
The average thickness and layer height of walls, deposited at selected regimes, are presented in Table 2. The general trend of decreasing bead sizes at higher currents resulted from the increased travel speed, which reduced the amount of deposited material per unit length. For the same travel speed, bead dimensions correlated positively with increasing current due to the higher wire feed rate. Surface waviness (Table 2), exhibited a clear upward trend with increasing current. At the lowest current of 100 A, waviness was minimal, reflecting stable melt pool dynamics and consistent layer formation. The maximum values corresponded to the unstable deposition regimes, where high power promotes melt pool spreading and edge irregularities, directly deteriorating the surface quality and geometrical accuracy of the wall.

3.2. Structure

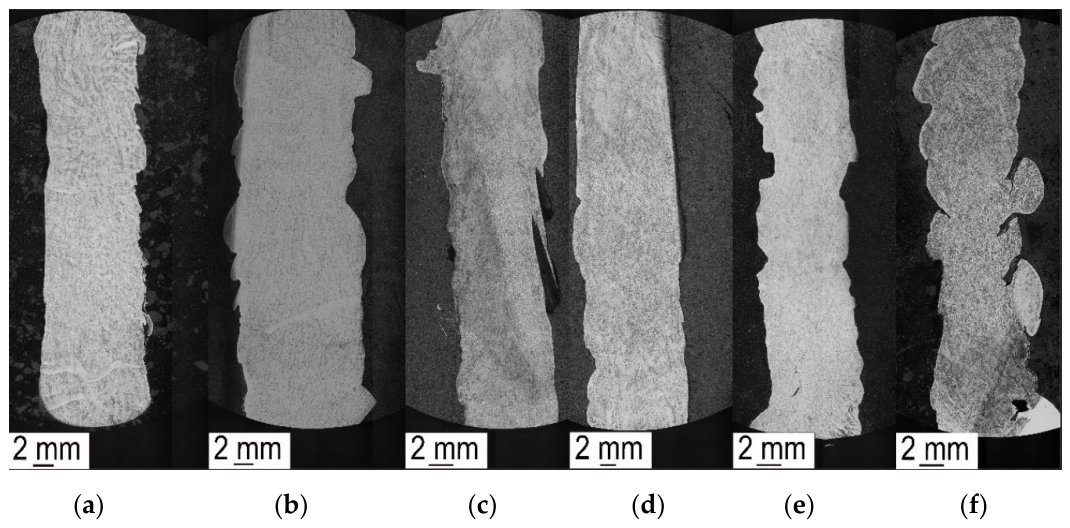
Optical microscopy was used to investigate the macrostructure of the wall cross-sections for structural defects (Figure 8). No defects such as lack of fusion, cracks, etc., were revealed by careful examinations. In addition, low porosity (less than 1%) was observed in all steel walls. For example, porosity in the wall, deposited at 100 A, was ∼0.4%, while increasing the current to maximum values of 350 A increased the fraction of pores to only ∼0.8%.
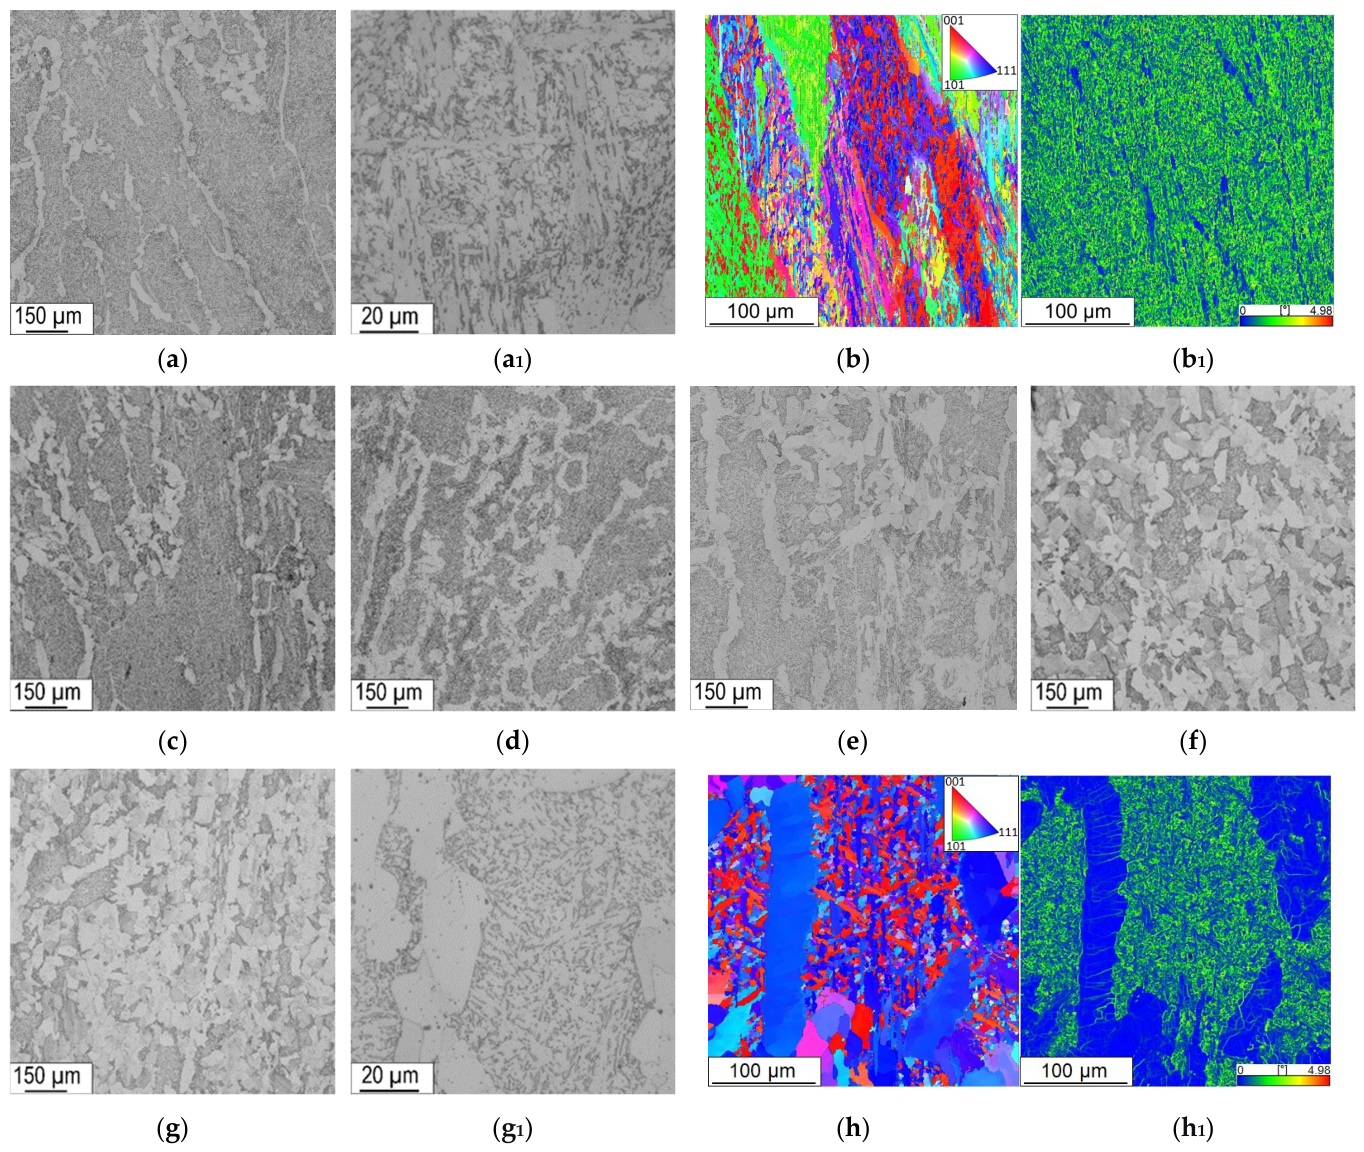
Microstructure investigations (Figure 9) showed that WAAM of thin walls resulted in the formation of a dual-phase ferrite–bainite microstructure, elongated along the building direction. This was attributed to the epitaxial growth of fcc austenite grains, driven by the high thermal gradient present during deposition [56,57]. For instance, in the sample deposited at 100 A, the austenite grains extend in length through several deposited layers and have an average transverse size of 160 µm (Figure 9a). The formation of thin rims of allotriomorphic ferrite (ALF) occurred along the prior austenite grain (PAG) boundaries. The volume fraction of ALF grains was estimated to be 11%, with an average size of 16 μm. Prior ferrite formation promoted austenite decomposition into acicular ferrite (AF) on further cooling (Figure 9(a1)). Formed by a shear transformation similar to bainite, acicular ferrite is highly desirable in weld metals for improving impact toughness due to its chaotic grain structure [47,58,59]. The electron backscattered diffraction (EBSD) analysis (Figure 9b) with the corresponding distribution of Kernel average misorientation (KAM) maps (Figure 9(b1)) showed a high density of geometrically necessary dislocations with an average KAM value of 1.27, which corresponded to 3.5 × 10¹⁴ m−2. The volume fraction of constituent phases and the ALF grain size were found to be strongly dependent on the process parameters, in contrast to the AF width, which remained relatively constant at approximately 2.5 μm (Figure 9(a1,g1)). As the current increased to intermediate values (up to 250 A), a gradual increase in both the ALF fraction and grain size was observed, reaching 35% and ~28 μm, respectively (Figure 9c–e). A further increase in currents to 300–350 A resulted in pronounced microstructural changes. These regimes led to ferrite recrystallization and coarsening, resulting in the formation of equiaxed ferrite grains with sizes expanding markedly to 40–45 μm. Concurrently, the coarsening was accompanied by a substantial rise in the ALF volume fraction, which increased sharply to 50–55% (Figure 9f,g). KAM maps showed a decrease in dislocations density to KAM value of 0.61 (1.7 × 10¹⁴ m−2) due to an increase in the fraction of ALF grains that were almost free of dislocations (Figure 9(h1)). It should be noted that the prior austenite grains, in contrast, decrease in size with increasing current, transitioning from an elongated to an equiaxed morphology and measuring 53 µm at 350 A (Table 3).

3.3. Mechanical Properties

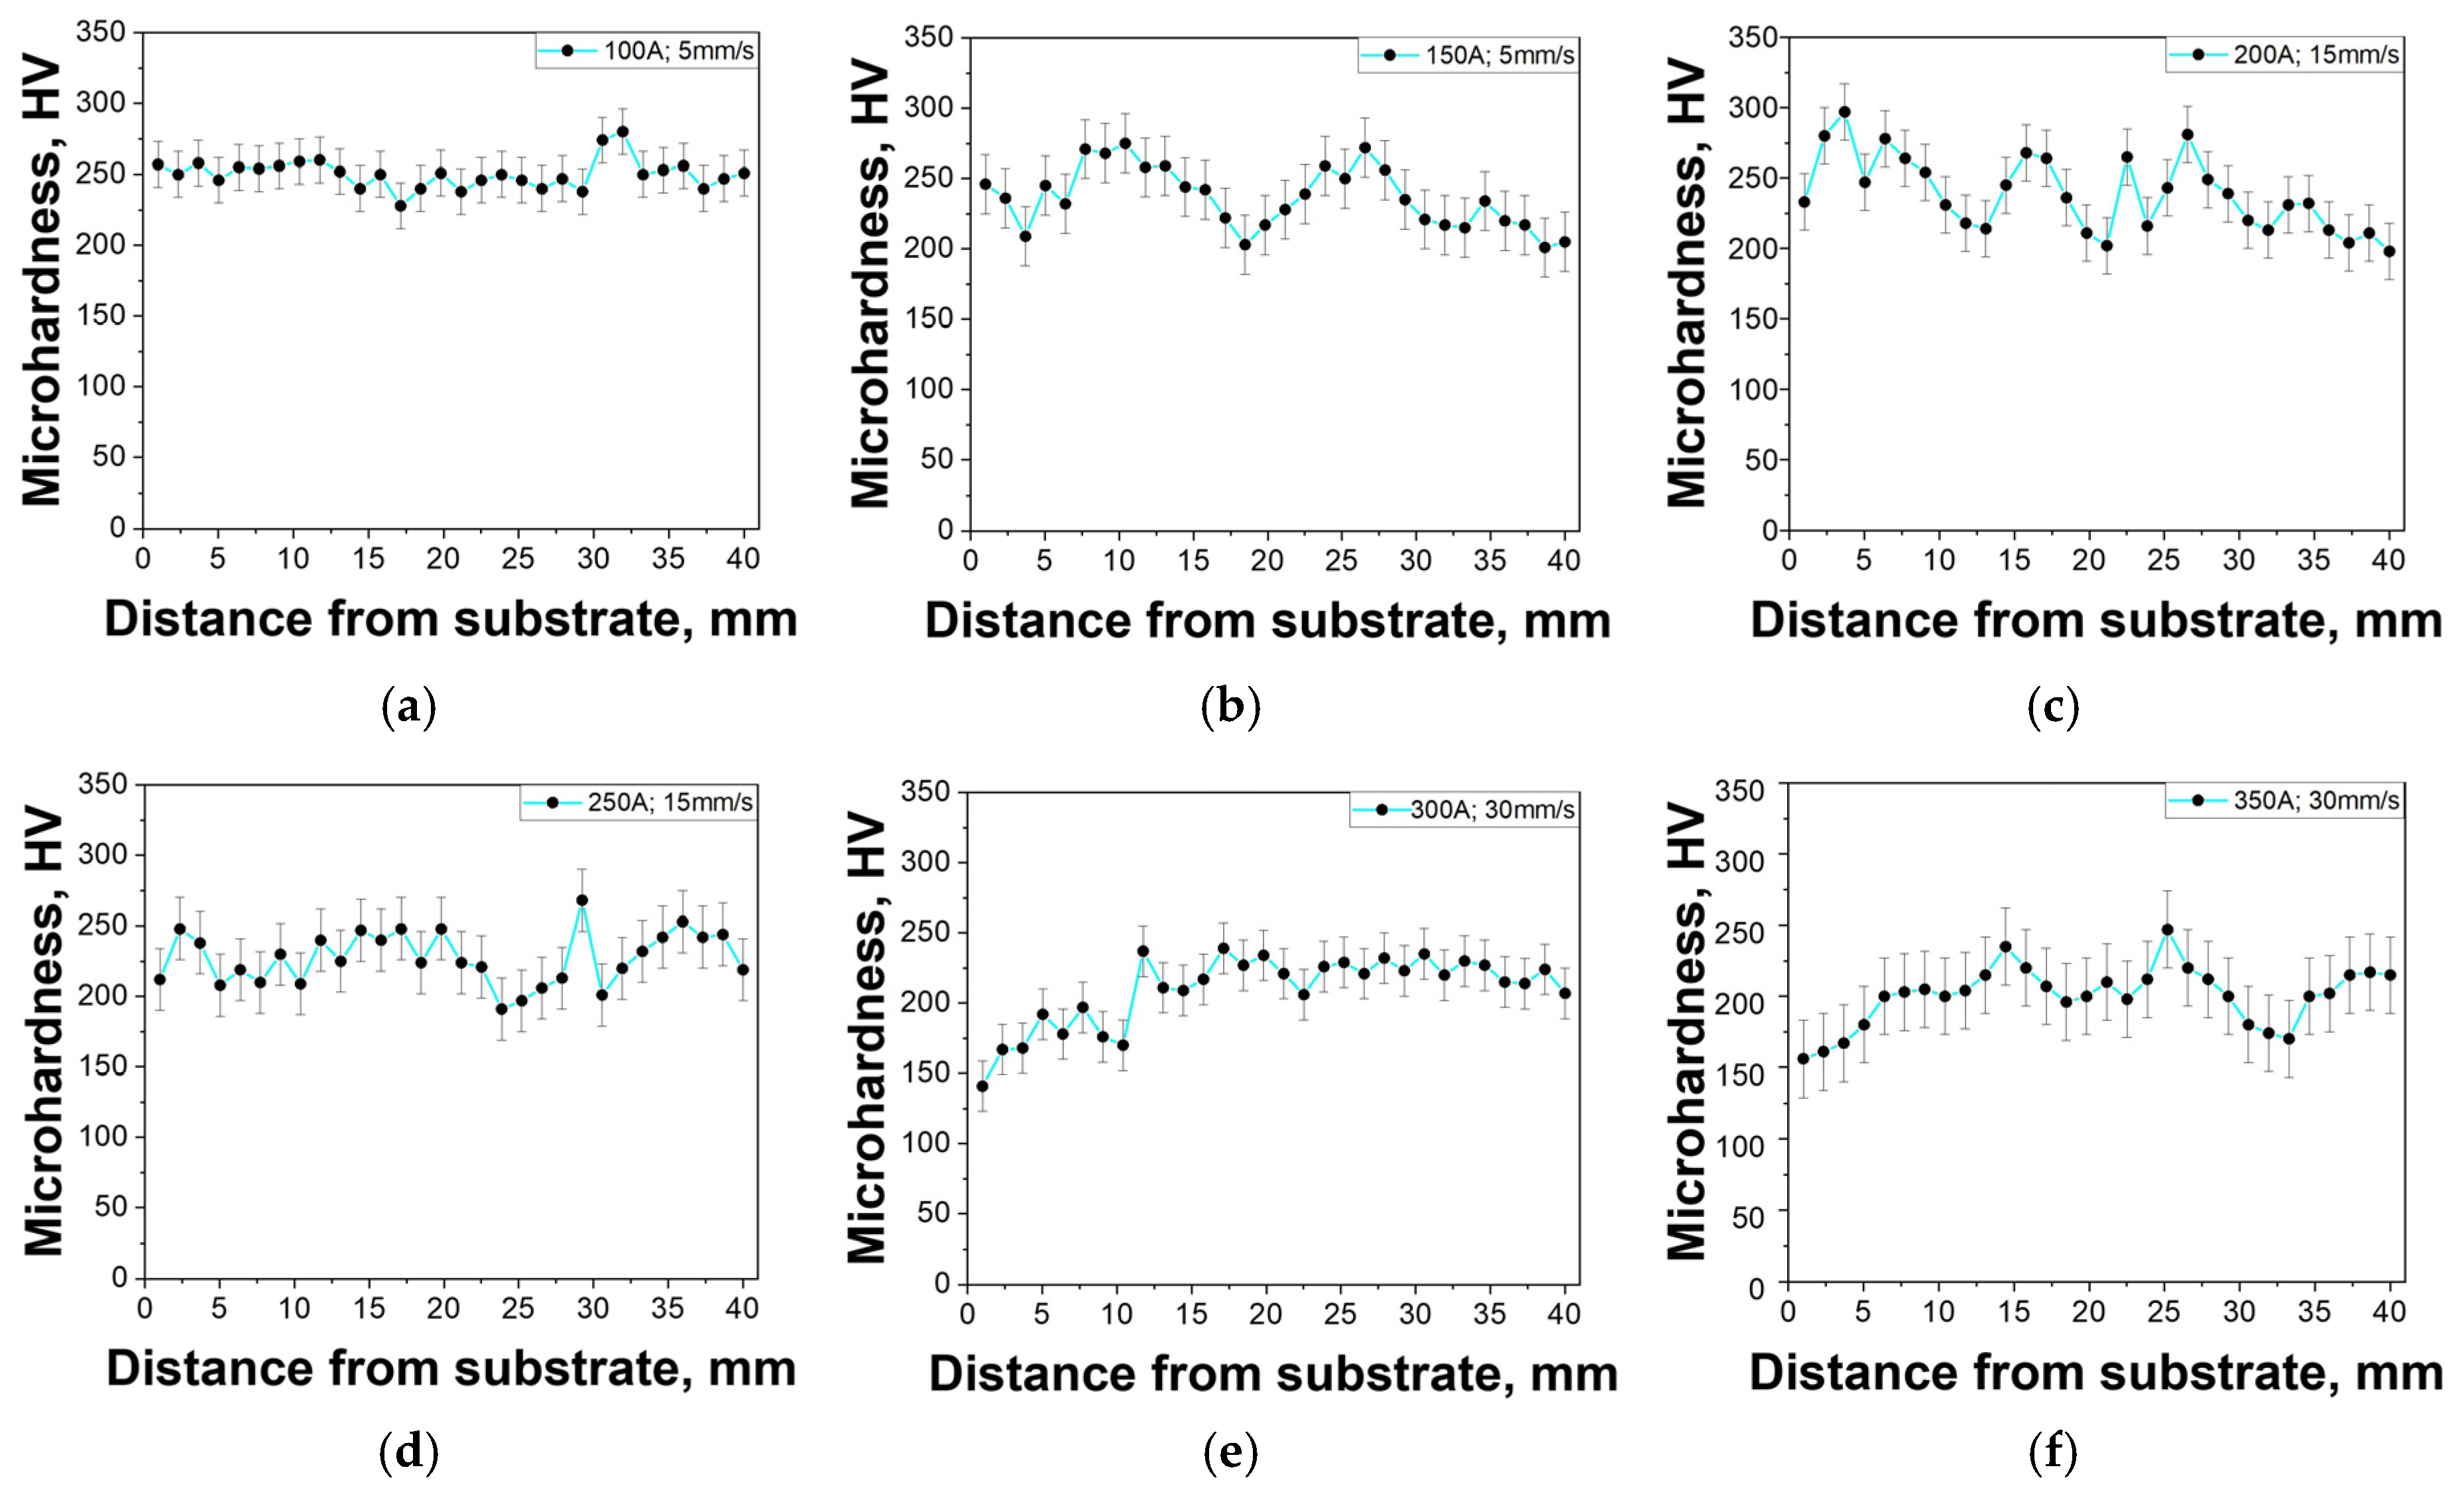
Microhardness profiles measured along the height of the wall’s cross-section are presented in Figure 10. The profiles exhibited a relatively wide range of microhardness values, which is typical for two-phase steels [44,60]. The considerable variation was attributed to the underlying microstructure: the lower values (~150–200 HV, depending on the process parameters) corresponded to regions of allotriomorphic ferrite, while the peak values (up to ~300 HV) were associated with acicular ferrite areas [61]. The most uniform distribution, with the highest average value of ~250 HV, was observed in the wall produced at 100 A (Figure 10a, Table 3). Increasing the current led to a gradual decrease in the average microhardness—for example, to ~230 HV at 250 A and further to ~200 HV at 350 A (Table 4). Additionally, for the walls, produced at 300 A and 350 A, a reduction in microhardness values was observed in the region near the substrate (Figure 10e,f).
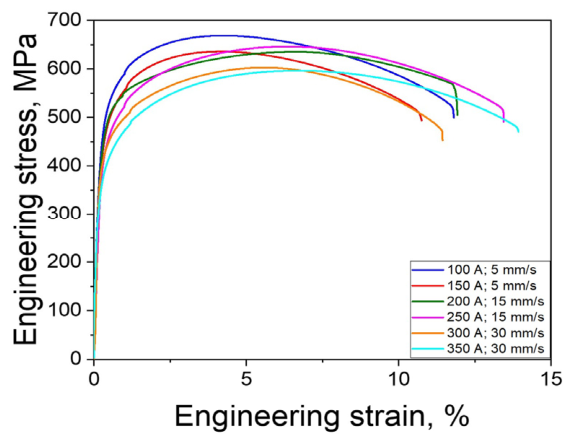
To evaluate the mechanical properties of the deposited walls, tensile tests at room temperature were performed along the vertical direction of the samples. The stress–strain curves obtained are presented in Figure 11; the average values of the yield strength (YS), ultimate tensile strength (UTS), and elongation at fracture (EF) are summarized in Table 4. The highest strength characteristics were observed in the sample produced at 100 A and 5 mm/s, with YS of 512 MPa, UTS of 668 MPa, and EF of 11.6%. Increasing the current to 150 A at the same travel speed led to a moderate decrease in strength: YS and UTS dropped to 486 MPa and 635 MPa, respectively, along with comparable elongation. However, further increases in current and travel speed, up to 250 A and 15 mm/s, had only a marginal effect on the mechanical properties of the thin walls. Contrariwise, the samples processed at the most extreme parameters of 300 A and 350 A at 30 mm/s demonstrated the lowest strength characteristics. For example, YS/UTS dropped to 426/596 MPa and 391/602 MPa for the 300 A and 350 A samples, respectively. Notably, elongation peaked at 13.8% for sample 350 A 30 mm/s, suggesting increased ductility at the expense of strength.

4. Discussion

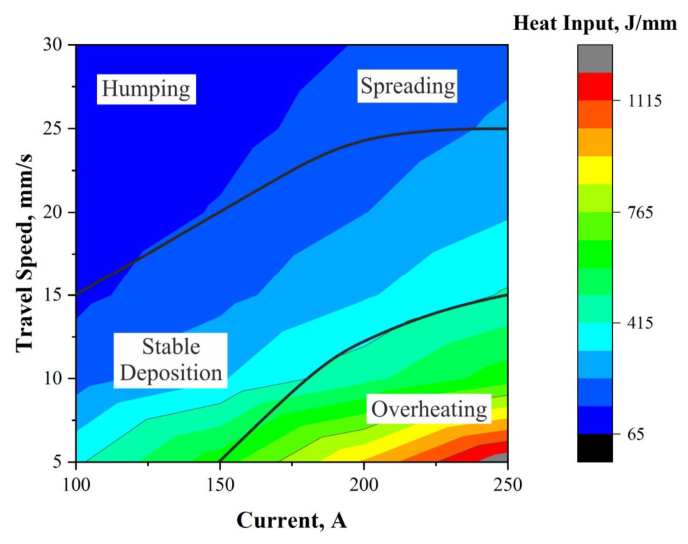
Our findings established an optimal processing window for the WAAM of thin-walled components and demonstrated the potential for enhancing process productivity by increasing the power input. Specifically, the optimal parameters for fabricating defect-free thin-walled structures were identified within the following ranges (Figure 12): at a welding current of 100 A, the optimal travel speeds varied between 5 and 15 mm/s. Increasing the current to 150 A permitted higher travel speeds, extending the range to 20 mm/s. At currents between 200 and 250 A, the feasible travel speed range shifted upward to 15–25 mm/s. Deposition at 300–350 A was found to be unsuitable for the fabrication of thin walls; however, the application of such parameters for producing large-scale parts will be discussed below.
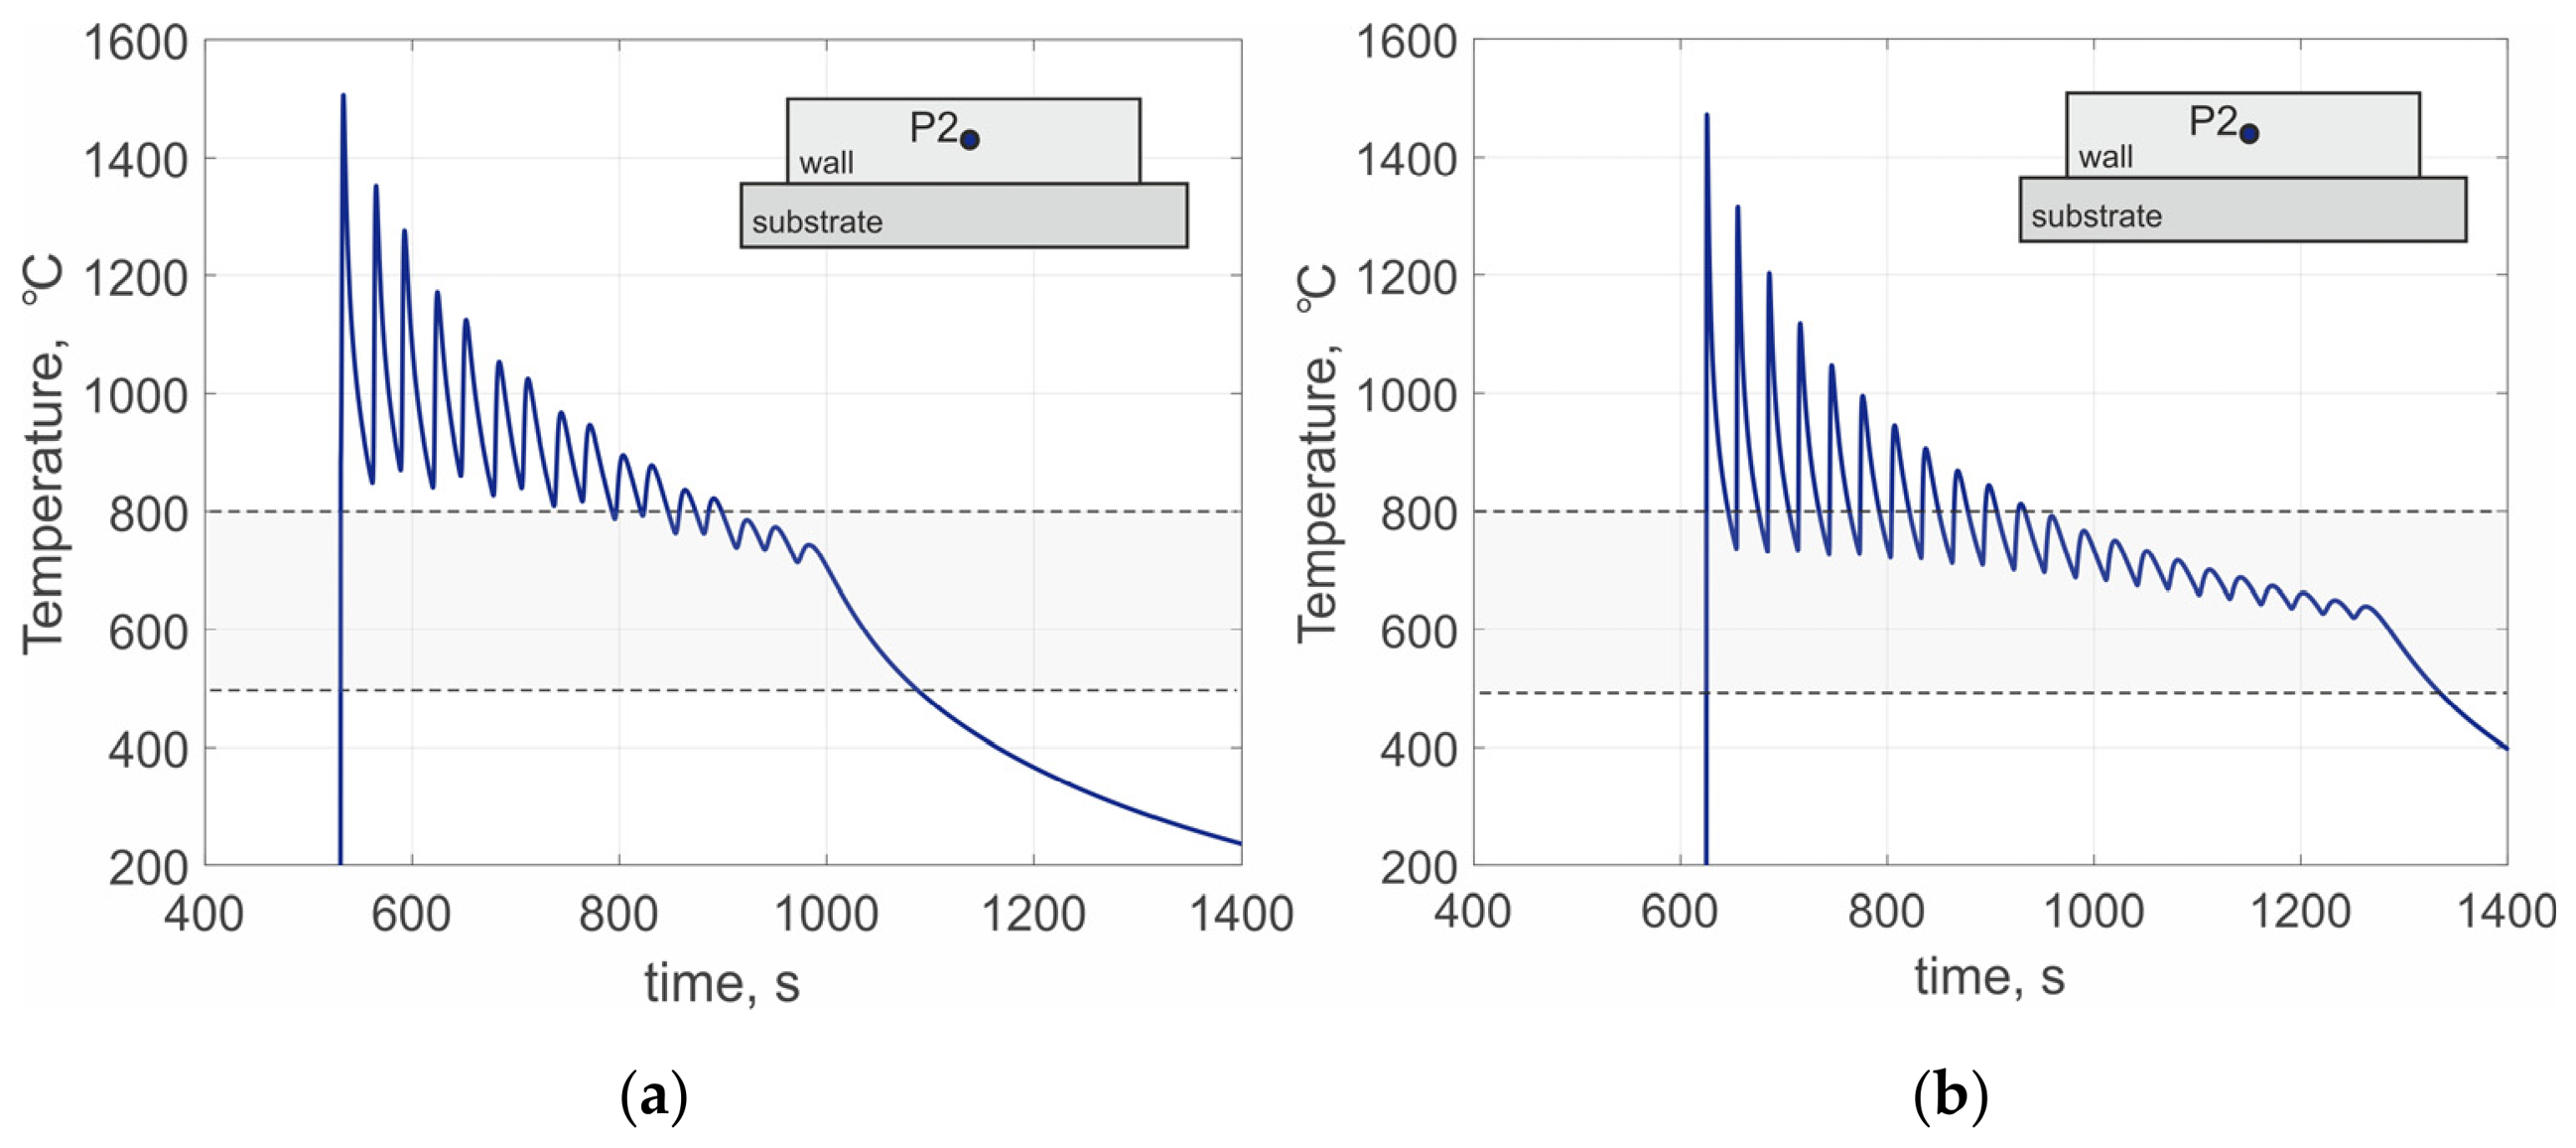
The results of this study demonstrate that the WAAM process parameters have a significant influence on the microstructure and mechanical properties of the low-carbon steel. This influence is particularly pronounced under high-power deposition regimes. The repetitive thermal cycles in AM, which depend on the process parameters, lead to a complex phase transformation history, resulting in distinct microstructural features. The factors that need to be accounted for include the peak temperature, the cooling rate, and the cooling time through the critical temperature range of 800 °C to 500 °C (often denoted as t8/5) [44,62,63]. Through the numerical calculations, thermal cycles were obtained during the deposition process at 100 A and 350 A in the central region of the samples (Figure 13). The temperature at the monitored point in the wall, deposited at 100 A (Figure 13a), remained above 800 °C throughout the deposition of approximately 10 subsequent layers, thereby maintaining an interpass temperature of 850 °C. Thereafter, upon entering the intercritical range, the temperature no longer rose above 800 °C and underwent continuous cooling within this region until the end of the deposition process. A completely different behavior is observed in the wall fabricated at 350 A. Here, the interpass temperature decreases to 730 °C due to the introduction of pauses between layers (Figure 13b). This results in multiple crossings of the austenitization temperature threshold, evidently undergoing repeated phase transformations. To evaluate the influence of the different thermal conditions, two temperature ranges were considered: 1400–800 °C and 800–500 °C.
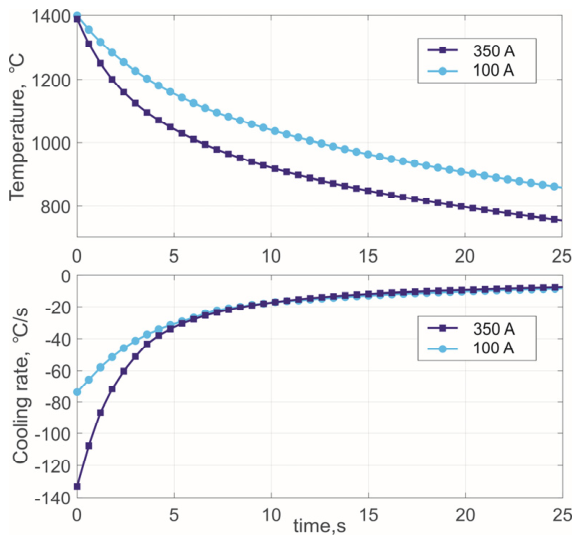
In low-carbon steel, the austenite formation and grain growth occurs in the high-temperature region (1400–800 °C) [47]. Figure 14 shows a comparison of the temperatures and corresponding cooling rates for the two deposited walls after solidification. Analysis of the cooling curves reveals that in the initial stage, within the temperature range of 1400–1100 °C, the cooling rate depends significantly on the deposition regime, which may lead to the formation of different initial austenite structures prior to the onset of phase transformations. The cooling rate for the sample produced at 350 A was approximately 120 K/s, whereas at 100 A, it was roughly half that value, at about 60 K/s. This substantial difference is attributed to the higher travel speed of 30 mm/s, which promotes rapid heat dissipation and reduces the residence time at elevated temperatures [29,44]. Conversely, the slower travel speed of 5 mm/s at 100 A exposes the material to high temperatures for a longer duration, thereby facilitating diffusion-controlled processes and promoting austenitic grain growth [62]. As a result, the sample produced at 100 A exhibited the coarser prior austenite grain size among all investigated regimes (Figure 9, Table 3).
Following cooling through the 800–500 °C intercritical range, austenite transforms into various ferrite morphologies, bainite, or martensite, depending critically on the cooling rate—specifically, on the transformation time within this interval (t8/5) [63]. In this work, a dual-phase structure, consisting of allotriomorphic ferrite and acicular ferrite, was formed in the steel under all deposition conditions; however, the phase fractions and their sizes varied. The nucleation of allotriomorphic ferrite begins at the boundaries of austenite and continues to grow into the austenite matrix. This led to the formation of separate austenite regions supersaturated with carbon, which then at the intermediate cooling rate transformed into bainitic ferrite or acicular ferrite [59,64]. The transformation times t8/5 were estimated to be 216 s for the wall fabricated at 100 A and 522 s for the wall fabricated at 350 A, respectively (Figure 13). This difference in t8/5 times correlates well with the observed microstructural changes. The shorter t8/5 cooling time at 100 A resulted in a microstructure composed primarily of AF, with only a minimal fraction of ALF presenting as thin rims on grain boundaries (Figure 9a). In contrast, repeated excursions through the ferrite–austenite phase transformation temperature at 350 A promoted sufficient time for the development of recrystallization, resulting in a coarsening and increased ALF volume fraction (Figure 9f). Accordingly, the corresponding average cooling rates in this temperature interval of 800–500 °C were 1.50 °C/s and 0.75 °C/s for 100 A and 350 A, respectively. Such slow values of cooling rate generally correspond to the two-phase (ferrite + bainite/acicular ferrite) region on continuous cooling transformation diagrams [44,45,58,65]. The relatively uniform acicular ferrite dimensions in both regimes indicate that the transformation occurred within a similar temperature range, despite some difference in cooling rates.
Microstructural changes affect the mechanical properties, resulting in a decrease in strength characteristics with an increase in process power. In dual-phase steels, the ferritic phase provides ductility and toughness, while bainite/acicular ferrite increases the strength due to finer grain size and the higher dislocation density [66,67]. Accordingly, the reduction in the acicular ferrite fraction leads to a gradual decrease in strength, while having little effect on ductility, as has been demonstrated in the literature [60,68,69]. However, the heat input values, calculated as the relative measure of the transferred energy per unit length (Equation (1), proved insufficient for reliably correlating with the observed changes in microstructure and mechanical properties. For example, according to Table 1, the heat inputs for the 100/5 and 350/30 deposition regimes were comparable, calculated at 400 J/mm and 345 J/mm, respectively, whereas the strength properties were distinctively different (Figure 11). Since different current/speed sets provide various thicknesses and heights of the deposited layers (Table 2), the volumetric energy density, defined as the average energy applied per unit volume of material [70,71], was adopted to normalize the process parameters and enable a quantitative comparison between mechanical properties. The volumetric energy density Ev (Table 5) was calculated as [72]:
Ev = P/V h t,
where P is the power of process, V is the travel speed, h is the layer height, and t is the layer width (taken from Table 1 and Table 2).
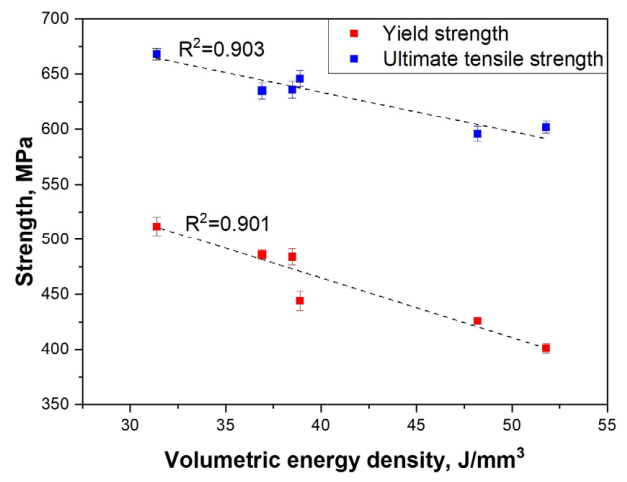
Thus, at low Ev values of 31.4–38.9 J/mm3, corresponding to currents of 100–250 A, the material exhibits high strength (YS = 444–512 MPa, UTS = 635–668 MPa). In contrast, at high Ev of 48.2–51.8 J/mm3, associated with currents of 300–350 A, both YS and UTS decrease markedly (YS to 401–426 MPa, UTS to 596–602 MPa), thereby suggesting higher heat input during the high-power processes. This strength reduction is directly linked to the observed microstructural evolution—a substantial rise in the allotriomorphic ferrite volume fraction with a decrease in dislocation density due to longer transformation time t8/5. To quantitatively assess the relationship between process parameters and mechanical performance, the volumetric energy density was correlated with the yield and ultimate tensile strengths of the deposited walls (Figure 15). These linear relationships with a determination coefficient of R2 > 0.9 confirm that Ev is an effective consolidated parameter for predicting mechanical performance in WAAM of this low-carbon steel.
The reduction in mechanical properties can be offset by the enhanced manufacturing efficiency. During WAAM, the current and wire feed rate control the deposition rate (DR), which is defined as the mass of metal deposited per unit time [73,74]:
DR = π ρ R2 WF,
where ρ is the density of the material, R is the radius of the welding wire, and WF is the wire feed speed.
The WAAM deposition rate increased significantly with the current, rising from ~1.6 kg/h at 100 A to ~6.3 kg/h at 350 A (Table 6). Consequently, high-power WAAM offers a significantly higher material deposition rate, making it substantially more efficient for manufacturing large-scale components, provided the resultant mechanical properties meet the design requirements. For applications requiring deposition rates, such regimes can serve as filling passes in contour path patterns [32,75], if the lateral contouring beads are deposited at lower power to ensure geometrical accuracy, as demonstrated in [61]. Moreover, the change in volumetric energy, accompanied by an increase in cooling time t8/5, directly controls the allotriomorphic ferrite fraction and thus the strength–ductility balance. Active interlayer cooling (e.g., forced air or water-cooled substrates) [34,76] could potentially reduce t8/5 at high Ev, suppressing ferrite coarsening and extending the stable processing window while maintaining high mechanical properties.

5. Conclusions

This work establishes a critical link between WAAM process parameters, thermal history, microstructural evolution, and resultant mechanical properties of low-carbon Fe–0.09 C–1.10 Cr–1.47 Mn–0.59 Si–0.56 Mo–0.11 Ni–0.23 V steel. The results obtained quantitatively substantiate the critical trade-off between productivity and mechanical performance: while increasing heat input enables a significant rise in deposition rate, it simultaneously causes a predictable reduction in strength. These models can therefore be used for rapid parameter selection and process optimization in industrial WAAM applications of low-carbon steels. The following conclusions can be drawn:
(1)
A stable processing window for defect-free thin-wall deposition was experimentally established for currents up to 250 A. Regimes with currents of 300–350 A were found unsuitable for thin walls due to melt pool instability and geometrical deterioration, although they offer high deposition rates potentially applicable for bulk structural components in construction, energy and shipbuilding sectors.
(2)
The microstructure of the steel consisted of a dual-phase structure, namely, a mixture of allotriomorphic ferrite and acicular ferrite. The heat input was found to critically govern microstructural evolution, correlating directly with the transformation time t8/5. A short cooling time t8/5 promoted the formation of a minor fraction of allotriomorphic ferrite, whereas a longer t8/5 induced significant ferrite recrystallization and coarsening.
(3)
The increase in deposition rate from ~1.6 kg/h to ~6.3 kg/h was accompanied by an increase in heat input, which linearly correlates with the change in strength from YS~500 MPa to YS~400 MPa, clearly demonstrating the productivity–strength trade-off.
Future developments. Further research will focus on hybrid WAAM technologies combining arc deposition with interlayer cooling and plastic deformation to achieve grain refinement and enhanced mechanical properties at high deposition rates. Additionally, advanced statistical and machine-learning approaches, including ANOVA, Response Surface Methodology and Gaussian Process Regression, will be applied for multi-objective optimization of process parameters and final material properties.

Author Contributions

Conceptualization, N.S. and A.V.; methodology, R.K. and A.S.; software, D.M. and A.E.; validation, R.K. and A.V.; formal analysis, K.N. and A.S.; investigation, K.N., I.A., A.E. and A.S.; resources, R.K.; data curation, M.K. and A.V.; writing—original draft preparation, M.K.; writing—review and editing, D.M. and N.S.; visualization, I.A., K.N. and D.M.; supervision, N.S.; project administration, R.K.; funding acquisition, M.K. All authors have read and agreed to the published version of the manuscript.

Funding

This research was funded by the Russian Science Foundation, grant no. 24-79-10224 (https://rscf.ru/en/project/24-79-10224/) (accessed on 18 March 2025).

Data Availability Statement

Data is contained within the article.

Conflicts of Interest

The authors declare no conflicts of interest.

References

  1. Salvi, D.; Almonti, D.; Baiocco, G.; Millia, M.D.; Mingione, E.; Rubino, G.; Ucciardello, N. Evaluating Environmental Sustainability, Economic Impact and Mechanical Properties of 3D-Printed Topologically Optimized Components. Procedia CIRP 2026, 138, 897–902. [Google Scholar] [CrossRef]
  2. Shah, H.H.; Tregambi, C.; Bareschino, P.; Pepe, F. Environmental and Economic Sustainability of Additive Manufacturing: A Systematic Literature Review. Sustain. Prod. Consum. 2024, 51, 628–643. [Google Scholar] [CrossRef]
  3. Attaran, M. The Rise of 3-D Printing: The Advantages of Additive Manufacturing over Traditional Manufacturing. Bus. Horiz. 2017, 60, 677–688. [Google Scholar] [CrossRef]
  4. Cooke, S.; Ahmadi, K.; Willerth, S.; Herring, R. Metal Additive Manufacturing: Technology, Metallurgy and Modelling. J. Manuf. Process. 2020, 57, 978–1003. [Google Scholar] [CrossRef]
  5. Rasiya, G.; Shukla, A.; Saran, K. Additive Manufacturing-A Review. Mater. Today Proc. 2021, 47, 6896–6901. [Google Scholar] [CrossRef]
  6. Seifi, M.; Gorelik, M.; Waller, J.; Hrabe, N.; Shamsaei, N.; Daniewicz, S.; Lewandowski, J.J. Progress Towards Metal Additive Manufacturing Standardization to Support Qualification and Certification. JOM 2017, 69, 439–455. [Google Scholar] [CrossRef]
  7. Said, L.B.; Ayadi, B.; Alharbi, S.; Dammak, F. Recent Advances in Additive Manufacturing: A Review of Current Developments and Future Directions. Machines 2025, 13, 813. [Google Scholar] [CrossRef]
  8. Wu, B.; Pan, Z.; Ding, D.; Cuiuri, D.; Li, H.; Xu, J.; Norrish, J. A Review of the Wire Arc Additive Manufacturing of Metals: Properties, Defects and Quality Improvement. J. Manuf. Process. 2018, 35, 127–139. [Google Scholar] [CrossRef]
  9. Wire Arc Additive Manufacturing—An Overview|ScienceDirect Topics. Available online: https://www.sciencedirect.com/topics/materials-science/wire-arc-additive-manufacturing (accessed on 29 April 2025).
  10. Mohan, D.G.; Saiyathibrahim, A.; Gopi, S.; Vijaykumar, S.J.; Kumar, S.; Murali Krishnan, R. Additive Manufacturing for Space Applications: A Review of Materials, Methods, and Future Frontiers. China Weld. 2025, 35, 100010. [Google Scholar] [CrossRef]
  11. Omiyale, B.O.; Olugbade, T.O.; Abioye, T.E.; Farayibi, P.K. Wire Arc Additive Manufacturing of Aluminium Alloys for Aerospace and Automotive Applications: A Review. Mater. Sci. Technol. 2022, 38, 391–408. [Google Scholar] [CrossRef]
  12. Taşdemir, A.; Nohut, S. An Overview of Wire Arc Additive Manufacturing (WAAM) in Shipbuilding Industry. Ships Offshore Struct. 2021, 16, 797–814. [Google Scholar] [CrossRef]
  13. Ukoba, K.; Yoro, K.O.; Adeoye, A.E.; Ampah, J.D.; Yusuf, A.A.; Samuel, F.O.; Eterigho-Ikelegbe, O.; Jen, T.-C. Additive Manufacturing in the Energy Sector and the Fourth Industrial Revolution. Prog. Addit. Manuf. 2025, 10, 4625–4645. [Google Scholar] [CrossRef]
  14. Singamneni, S.; Lv, Y.; Hewitt, A.; Chalk, R.; Thomas, W.; Jordison, D. Additive Manufacturing for the Aircraft Industry: A Review. J. Aeronaut. Aerosp. Eng. 2019, 8, 351–371. [Google Scholar] [CrossRef]
  15. Chen, J.; Chen, B. Progress in Additive Manufacturing of Magnesium Alloys: A Review. Materials 2024, 17, 3851. [Google Scholar] [CrossRef]
  16. Dhinakaran, V.; Ajith, J.; Fathima Yasin Fahmidha, A.; Jagadeesha, T.; Sathish, T.; Stalin, B. Wire Arc Additive Manufacturing (WAAM) Process of Nickel Based Superalloys—A Review. Mater. Today Proc. 2020, 21, 920–925. [Google Scholar] [CrossRef]
  17. Evans, S.I.; Wang, J.; Qin, J.; He, Y.; Shepherd, P.; Ding, J. A Review of WAAM for Steel Construction—Manufacturing, Material and Geometric Properties, Design, and Future Directions. Structures 2022, 44, 1506–1522. [Google Scholar] [CrossRef]
  18. Singh Tanwar, R.; Jhavar, S. Ti Based Alloys for Aerospace and Biomedical Applications Fabricated through Wire + Arc Additive Manufacturing (WAAM). Mater. Today Proc. 2024, 98, 226–232. [Google Scholar] [CrossRef]
  19. Queguineur, A.; Rückert, G.; Cortial, F.; Hascoët, J.Y. Evaluation of Wire Arc Additive Manufacturing for Large-Sized Components in Naval Applications. Weld. World 2018, 62, 259–266. [Google Scholar] [CrossRef]
  20. Panchenko, O.; Kurushkin, D.; Mushnikov, I.; Khismatullin, A.; Popovich, A. A High-Performance WAAM Process for Al–Mg–Mn Using Controlled Short-Circuiting Metal Transfer at Increased Wire Feed Rate and Increased Travel Speed. Mater. Des. 2020, 195, 109040. [Google Scholar] [CrossRef]
  21. Liang, Z.; Han, J.; Zhu, H.; Meng, M.; Wang, S.; Ma, H.; Tian, Y. Microstructure and Mechanical Properties of a Novel Ti-Fe Alloy Fabricated in Situ by Double-Wire Arc Additive Manufacturing. J. Alloys Compd. 2025, 1039, 182996. [Google Scholar] [CrossRef]
  22. Théodore, J.; Couturier, L.; Girault, B.; Cabeza, S.; Pirling, T.; Frapier, R.; Bazin, G.; Courant, B. Relationship between Microstructure, and Residual Strain and Stress in Stainless Steels in-Situ Alloyed by Double-Wire Arc Additive Manufacturing (D-WAAM) Process. Materialia 2023, 30, 101850. [Google Scholar] [CrossRef]
  23. Wang, C.; Suder, W.; Ding, J.; Williams, S. The Effect of Wire Size on High Deposition Rate Wire and Plasma Arc Additive Manufacture of Ti-6Al-4V. J. Mater. Process. Technol. 2021, 288, 116842. [Google Scholar] [CrossRef]
  24. Vora, J.; Parikh, N.; Chaudhari, R.; Patel, V.K.; Paramar, H.; Pimenov, D.Y.; Giasin, K. Optimization of Bead Morphology for GMAW-Based Wire-Arc Additive Manufacturing of 2.25 Cr-1.0 Mo Steel Using Metal-Cored Wires. Appl. Sci. 2022, 12, 5060. [Google Scholar] [CrossRef]
  25. Ahsan, M.R.U.; Seo, G.-J.; Fan, X.; Liaw, P.K.; Motaman, S.; Haase, C.; Kim, D.B. Effects of Process Parameters on Bead Shape, Microstructure, and Mechanical Properties in Wire + Arc Additive Manufacturing of Al0.1CoCrFeNi High-Entropy Alloy. J. Manuf. Process. 2021, 68, 1314–1327. [Google Scholar] [CrossRef]
  26. Dinovitzer, M.; Chen, X.; Laliberte, J.; Huang, X.; Frei, H. Effect of Wire and Arc Additive Manufacturing (WAAM) Process Parameters on Bead Geometry and Microstructure. Addit. Manuf. 2019, 26, 138–146. [Google Scholar] [CrossRef]
  27. HM, V.; Rao, R.N.; Maiya, M.; Kumar, P.; Gupta, N.; Saxena, K.K.; Vijayan, V. Effects of Arc Current and Travel Speed on the Processing of Stainless Steel via Wire Arc Additive Manufacturing (WAAM) Process. J. Adhes. Sci. Technol. 2024, 38, 2222–2239. [Google Scholar]
  28. Xiong, J.; Zhang, G.; Zhang, W. Forming Appearance Analysis in Multi-Layer Single-Pass GMAW-Based Additive Manufacturing. Int. J. Adv. Manuf. Technol. 2015, 80, 1767–1776. [Google Scholar] [CrossRef]
  29. Dekis, M.; Tawfik, M.; Egiza, M.; Dewidar, M. Unveiling the Characteristics of ER70S-6 Low Carbon Steel Alloy Produced by Wire Arc Additive Manufacturing at Different Travel Speeds. Met. Mater. Int. 2025, 31, 325–338. [Google Scholar] [CrossRef]
  30. Yildiz, A.S.; Davut, K.; Koc, B.; Yilmaz, O. Wire Arc Additive Manufacturing of High-Strength Low Alloy Steels: Study of Process Parameters and Their Influence on the Bead Geometry and Mechanical Characteristics. Int. J. Adv. Manuf. Technol. 2020, 108, 3391–3404. [Google Scholar] [CrossRef]
  31. Shi, J.; Li, F.; Chen, S.; Zhao, Y.; Tian, H. Effect of In-Process Active Cooling on Forming Quality and Efficiency of Tandem GMAW–Based Additive Manufacturing. Int. J. Adv. Manuf. Technol. 2019, 101, 1349–1356. [Google Scholar] [CrossRef]
  32. Müller, J.; Hensel, J. WAAM of Structural Components—Building Strategies for Varying Wall Thicknesses. Weld. World 2023, 67, 833–844. [Google Scholar] [CrossRef]
  33. Li, Z.; Sui, S.; Ma, X.; Tan, H.; Zhong, C.; Bi, G.; Clare, A.T.; Gasser, A.; Chen, J. High Deposition Rate Powder- and Wire-Based Laser Directed Energy Deposition of Metallic Materials: A Review. Int. J. Mach. Tools Manuf. 2022, 181, 103942. [Google Scholar] [CrossRef]
  34. Increasing the Manufacturing Efficiency of WAAM by Advanced Cooling Strategies|Welding in the World. Available online: https://link.springer.com/article/10.1007/s40194-020-00930-2 (accessed on 10 May 2025).
  35. Flynn, J.M.; Shokrani, A.; Newman, S.T.; Dhokia, V. Hybrid Additive and Subtractive Machine Tools—Research and Industrial Developments. Int. J. Mach. Tools Manuf. 2016, 101, 79–101. [Google Scholar] [CrossRef]
  36. Jafari, D.; Vaneker, T.H.J.; Gibson, I. Wire and Arc Additive Manufacturing: Opportunities and Challenges to Control the Quality and Accuracy of Manufactured Parts. Mater. Des. 2021, 202, 109471. [Google Scholar] [CrossRef]
  37. Yehorov, Y.; Silva, L.J.; da Scotti, A. Balancing WAAM Production Costs and Wall Surface Quality through Parameter Selection: A Case Study of an Al-Mg5 Alloy Multilayer-Non-Oscillated Single Pass Wall. J. Manuf. Mater. Process. 2019, 3, 32. [Google Scholar] [CrossRef]
  38. Grossi, N.; Scippa, A.; Venturini, G.; Campatelli, G. Process Parameters Optimization of Thin-Wall Machining for Wire Arc Additive Manufactured Parts. Appl. Sci. 2020, 10, 7575. [Google Scholar] [CrossRef]
  39. Puma-Araujo, S.D.; Olvera-Trejo, D.; Martínez-Romero, O.; Urbikain, G.; Elías-Zúñiga, A.; Lacalle, L.N.L. de Semi-Active Magnetorheological Damper Device for Chatter Mitigation during Milling of Thin-Floor Components. Appl. Sci. 2020, 10, 5313. [Google Scholar] [CrossRef]
  40. Sun, L.; Jiang, F.; Huang, R.; Yuan, D.; Guo, C.; Wang, J. Anisotropic Mechanical Properties and Deformation Behavior of Low-Carbon High-Strength Steel Component Fabricated by Wire and Arc Additive Manufacturing. Mater. Sci. Eng. A 2020, 787, 139514. [Google Scholar] [CrossRef]
  41. Liberini, M.; Astarita, A.; Campatelli, G.; Scippa, A.; Montevecchi, F.; Venturini, G.; Durante, M.; Boccarusso, L.; Minutolo, F.M.C.; Squillace, A. Selection of Optimal Process Parameters for Wire Arc Additive Manufacturing. Procedia CIRP 2017, 62, 470–474. [Google Scholar] [CrossRef]
  42. Aldalur, E.; Veiga, F.; Suárez, A.; Bilbao, J.; Lamikiz, A. High Deposition Wire Arc Additive Manufacturing of Mild Steel: Strategies and Heat Input Effect on Microstructure and Mechanical Properties. J. Manuf. Process. 2020, 58, 615–626. [Google Scholar] [CrossRef]
  43. Gil Plazas, A.F.; Amaya Villabón, T.A.; Ramírez Vargas, D.A.; Rubiano Buitrago, J.D.; Herrera Quintero, L.K. Influence of Interlayer Thermal Cycling on Microstructural Evolution in WAAM Processed Carbon Steel. Weld. World 2026, 70, 471–489. [Google Scholar] [CrossRef]
  44. Rodrigues, T.A.; Duarte, V.; Avila, J.A.; Santos, T.G.; Miranda, R.M.; Oliveira, J.P. Wire and Arc Additive Manufacturing of HSLA Steel: Effect of Thermal Cycles on Microstructure and Mechanical Properties. Addit. Manuf. 2019, 27, 440–450. [Google Scholar] [CrossRef]
  45. Thompson, S.W.; Vin Col, D.J.; Krauss, G. Continuous Cooling Transformations and Microstructures in a Low-Carbon, High-Strength Low-Alloy Plate Steel. Metall. Trans. A 1990, 21, 1493–1507. [Google Scholar] [CrossRef]
  46. Mohammadi, J.; Dashtgerd, I.; Reza Riahi, A.; Mostafaei, A. Pulsed Gas Metal Arc Additive Manufacturing of Low-Carbon Steel: Microstructure Observations and Mechanical Properties. Mater. Today Commun. 2024, 38, 107637. [Google Scholar] [CrossRef]
  47. Babu, S.S. The Mechanism of Acicular Ferrite in Weld Deposits. Curr. Opin. Solid State Mater. Sci. 2004, 8, 267–278. [Google Scholar] [CrossRef]
  48. Rafieazad, M.; Ghaffari, M.; Vahedi Nemani, A.; Nasiri, A. Microstructural Evolution and Mechanical Properties of a Low-Carbon Low-Alloy Steel Produced by Wire Arc Additive Manufacturing. Int. J. Adv. Manuf. Technol. 2019, 105, 2121–2134. [Google Scholar] [CrossRef]
  49. Hwang, J.-K. Comparison of Thermal Behaviors of Carbon and Stainless Steel Billets during the Heating Process. Materials 2023, 17, 183. [Google Scholar] [CrossRef] [PubMed]
  50. Dirisu, P.; Supriyo, G.; Martina, F.; Xu, X.; Williams, S. Wire plus Arc Additive Manufactured Functional Steel Surfaces Enhanced by Rolling. Int. J. Fatigue 2020, 130, 105237. [Google Scholar] [CrossRef]
  51. Calcagnotto, M.; Ponge, D.; Demir, E.; Raabe, D. Orientation Gradients and Geometrically Necessary Dislocations in Ultrafine Grained Dual-Phase Steels Studied by 2D and 3D EBSD. Mater. Sci. Eng. A 2010, 527, 2738–2746. [Google Scholar] [CrossRef]
  52. ASTM E8/E8M-24; Standard Test Methods for Tension Testing of Metallic Materials. ASTM International: West Conshohocken, PA, USA, 2024.
  53. Yuan, L.; Pan, Z.; Ding, D.; He, F.; van Duin, S.; Li, H.; Li, W. Investigation of Humping Phenomenon for the Multi-Directional Robotic Wire and Arc Additive Manufacturing. Robot. Comput.-Integr. Manuf. 2020, 63, 101916. [Google Scholar] [CrossRef]
  54. Soderstrom, E.; Mendez, P. Humping Mechanisms Present in High Speed Welding. Sci. Technol. Weld. Join. 2006, 11, 572–579. [Google Scholar] [CrossRef]
  55. Kannan, P.R.; Muthupandi, V.; Devakumaran, K. On the Effect of Temperature Coefficient of Surface Tension on Shape and Geometry of Weld Beads in Hot Wire Gas Tungsten Arc Welding Process. Mater. Today Proc. 2018, 5, 7845–7852. [Google Scholar] [CrossRef]
  56. The Development of Grain Structure During Additive Manufacturing—ScienceDirect. Available online: https://www.sciencedirect.com/science/article/pii/S1359645421002421 (accessed on 18 February 2026).
  57. Vecchiato, F.L.; de Winton, H.; Hooper, P.A.; Wenman, M.R. Melt Pool Microstructure and Morphology from Single Exposures in Laser Powder Bed Fusion of 316L Stainless Steel. Addit. Manuf. 2020, 36, 101401. [Google Scholar] [CrossRef]
  58. Grong, O.; Matlock, D.K. Microstructural Development in Mild and Low-Alloy Steel Weld Metals. Int. Met. Rev. 1986, 31, 27–48. [Google Scholar] [CrossRef]
  59. Bhadeshia, H.K.D.H.; Edmonds, D.V. The Mechanism of Bainite Formation in Steels. Acta Metall. 1980, 28, 1265–1273. [Google Scholar] [CrossRef]
  60. Kumar, A.; Singh, S.B.; Ray, K.K. Influence of Bainite/Martensite-Content on the Tensile Properties of Low Carbon Dual-Phase Steels. Mater. Sci. Eng. A 2008, 474, 270–282. [Google Scholar] [CrossRef]
  61. Klimova, M.; Nasonovskiy, K.; Astakhov, I.; Fedoseeva, A.; Korsmik, R.; Mukin, D.; Zherebtsov, S.; Stepanov, N. Microstructure and Mechanical Properties of Low-Carbon Steel Produced by WAAM with High Deposition Rate. Mater. Sci. Eng. A 2025, 947, 149185. [Google Scholar] [CrossRef]
  62. Lazic, V.; Sedmak, A.; Zivkovic, M.; Aleksandrovic, S.; Cukic, R.; Jovicic, R.; Ivanovic, I. Theoretical-Experimental Determining of Cooling Time (T8/5) in Hard Facing of Steels for Forging Dies. Therm. Sci. 2010, 14, 235–246. [Google Scholar] [CrossRef]
  63. Shi, Y.; Han, Z. Effect of Weld Thermal Cycle on Microstructure and Fracture Toughness of Simulated Heat-Affected Zone for a 800 MPa Grade High Strength Low Alloy Steel. J. Mater. Process. Technol. 2008, 207, 30–39. [Google Scholar] [CrossRef]
  64. Bhadeshia, H.K.D.H. Bainite in Steels: Transformations, Microstructure and Properties; Institute of Materials: London, UK, 1992. [Google Scholar]
  65. Li, Z.; Zhao, Y.; Li, B.; Qi, H.; Yang, W. Effect of Applied Stress on Bainite Transformation, Microstructure, and Properties of 15CrMo Steel. Mater. Today Commun. 2024, 39, 109076. [Google Scholar] [CrossRef]
  66. Young, C.H.; Bhadeshia, H.K.D.H. Strength of Mixtures of Bainite and Martensite. Mater. Sci. Technol. 1994, 10, 209–214. [Google Scholar] [CrossRef]
  67. Liu, S.; Li, X.; Guo, H.; Shang, C.; Misra, R.D.K. Isolating Contribution of Individual Phases during Deformation of High Strength–High Toughness Multi-Phase Pipeline Steel. Mater. Sci. Eng. A 2015, 639, 131–135. [Google Scholar] [CrossRef]
  68. Sudo, M.; Iwai, T. Deformation Behavior and Mechanical Properties of Ferrite-Bainite-Martensite (Triphase) Steel. Trans. Iron Steel Inst. Jpn. 1983, 23, 294–302. [Google Scholar] [CrossRef]
  69. Banis, A.; Bouzouni, M.; Gavalas, E.; Papaefthymiou, S. The Formation of a Mixed Martensitic/Bainitic Microstructure and the Retainment of Austenite in a Medium-Carbon Steel during Ultra-Fast Heating. Mater. Today Commun. 2021, 26, 101994. [Google Scholar] [CrossRef]
  70. Zhao, R.; Chen, C.; Wang, W.; Cao, T.; Shuai, S.; Xu, S.; Hu, T.; Liao, H.; Wang, J.; Ren, Z. On the Role of Volumetric Energy Density in the Microstructure and Mechanical Properties of Laser Powder Bed Fusion Ti-6Al-4V Alloy. Addit. Manuf. 2022, 51, 102605. [Google Scholar] [CrossRef]
  71. Koli, Y.; Aravindan, S.; Rao, P.V. Influence of Heat Input on the Evolution of δ-Ferrite Grain Morphology of SS308L Fabricated Using WAAM-CMT. Mater. Charact. 2022, 194, 112363. [Google Scholar] [CrossRef]
  72. Scipioni Bertoli, U.; Wolfer, A.J.; Matthews, M.J.; Delplanque, J.-P.R.; Schoenung, J.M. On the Limitations of Volumetric Energy Density as a Design Parameter for Selective Laser Melting. Mater. Des. 2017, 113, 331–340. [Google Scholar] [CrossRef]
  73. Ding, D.; Pan, Z.; Cuiuri, D.; Li, H. Wire-Feed Additive Manufacturing of Metal Components: Technologies, Developments and Future Interests. Int. J. Adv. Manuf. Technol. 2015, 81, 465–481. [Google Scholar] [CrossRef]
  74. Tabernero, I.; Paskual, A.; Álvarez, P.; Suárez, A. Study on Arc Welding Processes for High Deposition Rate Additive Manufacturing. Procedia CIRP 2018, 68, 358–362. [Google Scholar] [CrossRef]
  75. Liu, J.; Xu, Y.; Ge, Y.; Hou, Z.; Chen, S. Wire and Arc Additive Manufacturing of Metal Components: A Review of Recent Research Developments. Int. J. Adv. Manuf. Technol. 2020, 111, 149–198. [Google Scholar] [CrossRef]
  76. Reindl, T.; Rotzsche, S.; Hempel, N.; Mayr, P. Development and Evaluation of an Advanced Wire-Arc Directed Energy Deposition Process with Integrated Temperature Control and in-Situ Heat Treatment. Prog. Addit. Manuf. 2026, 11, 2315–2329. [Google Scholar] [CrossRef]
Figure 1. WAAM-setup.
Jmmp 10 00144 g001
Figure 2. Comparison between experimental and calculated results of thermal cycles for the single walls, deposited at currents/travel speed: (a) 100/5 and (b) 350/30.
Jmmp 10 00144 g002
Figure 3. Appearance of thin walls deposited at 100 A with different travel speeds: (a) 5 mm/s; (b) 10 mm/s; (c) 15 mm/s; (d) 20 mm/s.
Jmmp 10 00144 g003
Figure 4. Appearance of thin walls deposited at 150 A with different travel speeds: (a) 5 mm/s; (b) 20 mm/s; (c) 25 mm/s.
Jmmp 10 00144 g004
Figure 5. Appearance of thin walls deposited at 200 A with different travel speeds: (a) 10 mm/s; (b) 15 mm/s; (c) 25 mm/s; (d) 30 mm/s.
Jmmp 10 00144 g005
Figure 6. Appearance of thin walls deposited at 250 A with different travel speeds: (a) 10 mm/s; (b) 15 mm/s; (c) 25 mm/s; (d) 30 mm/s.
Jmmp 10 00144 g006aJmmp 10 00144 g006b
Figure 7. Appearance of thin walls deposited at different currents/travel speeds: (a) 300/20; (b) 300/30; (c) 350/20; (d) 350/30.
Jmmp 10 00144 g007
Figure 8. Cross-sections of wall deposited at different WAAM currents/travel speeds: (a) 100/5; (b) 150/5; (c) 200/15; (d) 250/15; (e) 300/30; (f) 350/30.
Jmmp 10 00144 g008
Figure 9. Microstructure of the wall deposited at currents/travel speeds: (a,b) 100/5; (c) 150/5; (d) 200/15; (e) 250/15; (f) 300/30; (g,h) 350/30; (a,cg) optical microscopy at low and (a1,g1) high magnification; (b,h) EBSD-analysis with corresponding (b1,h1) KAM maps.
Jmmp 10 00144 g009
Figure 10. Microhardness profile of walls, deposited at different WAAM currents/travel speeds: (a) 100/5; (b) 150/5; (c) 200/15; (d) 250/15; (e) 300/30; (f) 350/30.
Jmmp 10 00144 g010
Figure 11. Tensile engineering stress–strain curves of low-carbon steel walls.
Jmmp 10 00144 g011
Figure 12. Processing window of thin walls deposition depending on WAAM parameters.
Jmmp 10 00144 g012
Figure 13. Calculated thermal cycles in the center of walls, deposited at: (a) 100/5 and (b) 350/30.
Jmmp 10 00144 g013
Figure 14. Comparison of corresponding cooling rates in the temperature range of 1400–800 °C.
Jmmp 10 00144 g014
Figure 15. Relationship between volumetric energy density and YS/UTS.
Jmmp 10 00144 g015
Table 1. Process parameters with linear energy input (J/mm) during deposition.
Current, A/Voltage, V
100/20.0150/21.3200/23.8250/25.5300/27.4350/29.6
Travel speed, mm/s5400639952127516442070
102003194766378221036
15133213317425548690
20100159238318411518
2580127190255328414
3066106158212274345
Table 2. Dimensional parameters of deposited walls, mm.
Current (A)/Travel Speed (mm/s)
100/5150/5200/15250/15300/30350/30
Layer width, mm10.12 ± 0.6412.22 ± 0.988.32 ± 0.589.1 ± 0.757.28 ± 0.57.73 ± 1.12
Layer height, mm1.26 ± 0.031.42 ± 0.020.99 ± 0.021.20 ± 0.040.78 ± 0.030.86 ± 0.03
Surface waviness, mm1.031.511.671.642.173.48
Table 3. Structural parameters of the low-carbon steel walls produced at different WAAM currents/travel speeds.
Current (A)/Travel Speed (mm/s)PAG Size, μmALF Grain Size, μmALF Volume Fraction, %
100/5165 ± 7516.3 ± 6.811.3 ± 4
150/5120 ± 7422.1 ± 11.320.9 ± 3
200/15115 ± 6528.0 ± 10.128.2 ± 4
250/1586 ± 3526.6 ± 13.435.8 ± 5
300/3084 ± 4638.0 ± 17.150.1 ± 4
350/3053 ± 2846.8 ± 21.254.6 ± 6
Table 4. Mechanical properties of low-carbon steel walls.
Current (A)/Travel Speed (mm/s)Yield Strength, MPaUltimate Tensile Strength, MPaElongation, %Microhardness, Hv
100/5512 ± 16.4668 ± 10.611.6 ± 0.8251 ± 16
150/5486 ± 9.5635 ± 14.810.5 ± 1.4236 ± 21
200/15484 ± 15.1636 ± 15.011.7 ± 2.2238 ± 20
250/15444 ± 17.2646 ± 14.113.2 ± 1.8227 ± 22
300/30426 ± 7.8596 ± 13.411.3 ± 1.6209 ± 18
350/30401 ± 8.4602 ± 10.613.8 ± 2.0201 ± 27
Table 5. Volumetric energy density, J/mm3.
Current (A)/Travel Speed (mm/s)
100/5150/5200/15250/15300/30350/30
Volumetric energy density31.436.938.538.948.251.8
Table 6. Deposition rate depending on the wire feed rate during WAAM.
Current (A)
100150200250300350
Wire feed rate, m/min3.14.77.08.29.611.9
Deposition rate, kg/h1.62.53.74.35.16.3
Disclaimer/Publisher’s Note: The statements, opinions and data contained in all publications are solely those of the individual author(s) and contributor(s) and not of MDPI and/or the editor(s). MDPI and/or the editor(s) disclaim responsibility for any injury to people or property resulting from any ideas, methods, instructions or products referred to in the content.