
Article

Effect of Torch Power and Thickness on APS Al2O3 Coatings on 100Cr6 Bearing Steel: Microstructure, Adhesion and Flexural Response

1
Department of Mechanical and Aerospac e Engineering, Politecnico di Torino, Corso Duca degli Abruzzi 24, 10129 Torino, Italy
2
TN ITALY, Central Laboratory, Corso Torino 378, Pinerolo, 10064 Torino, Italy
3
Tsubaki Nakashima Japan, Global Engineering, 19 Shakudo, Katsuragi 639-2162, Japan
4
TOCALO Co., Ltd., Sales Div. 6-4-4, Minatojimaminami-Machi, Chuo-Ku, Kobe 650-0047, Japan
*
Author to whom correspondence should be addressed.
J. Manuf. Mater. Process. 2026, 10(2), 68; https://doi.org/10.3390/jmmp10020068
Submission received: 9 January 2026 / Revised: 10 February 2026 / Accepted: 13 February 2026 / Published: 17 February 2026

Abstract

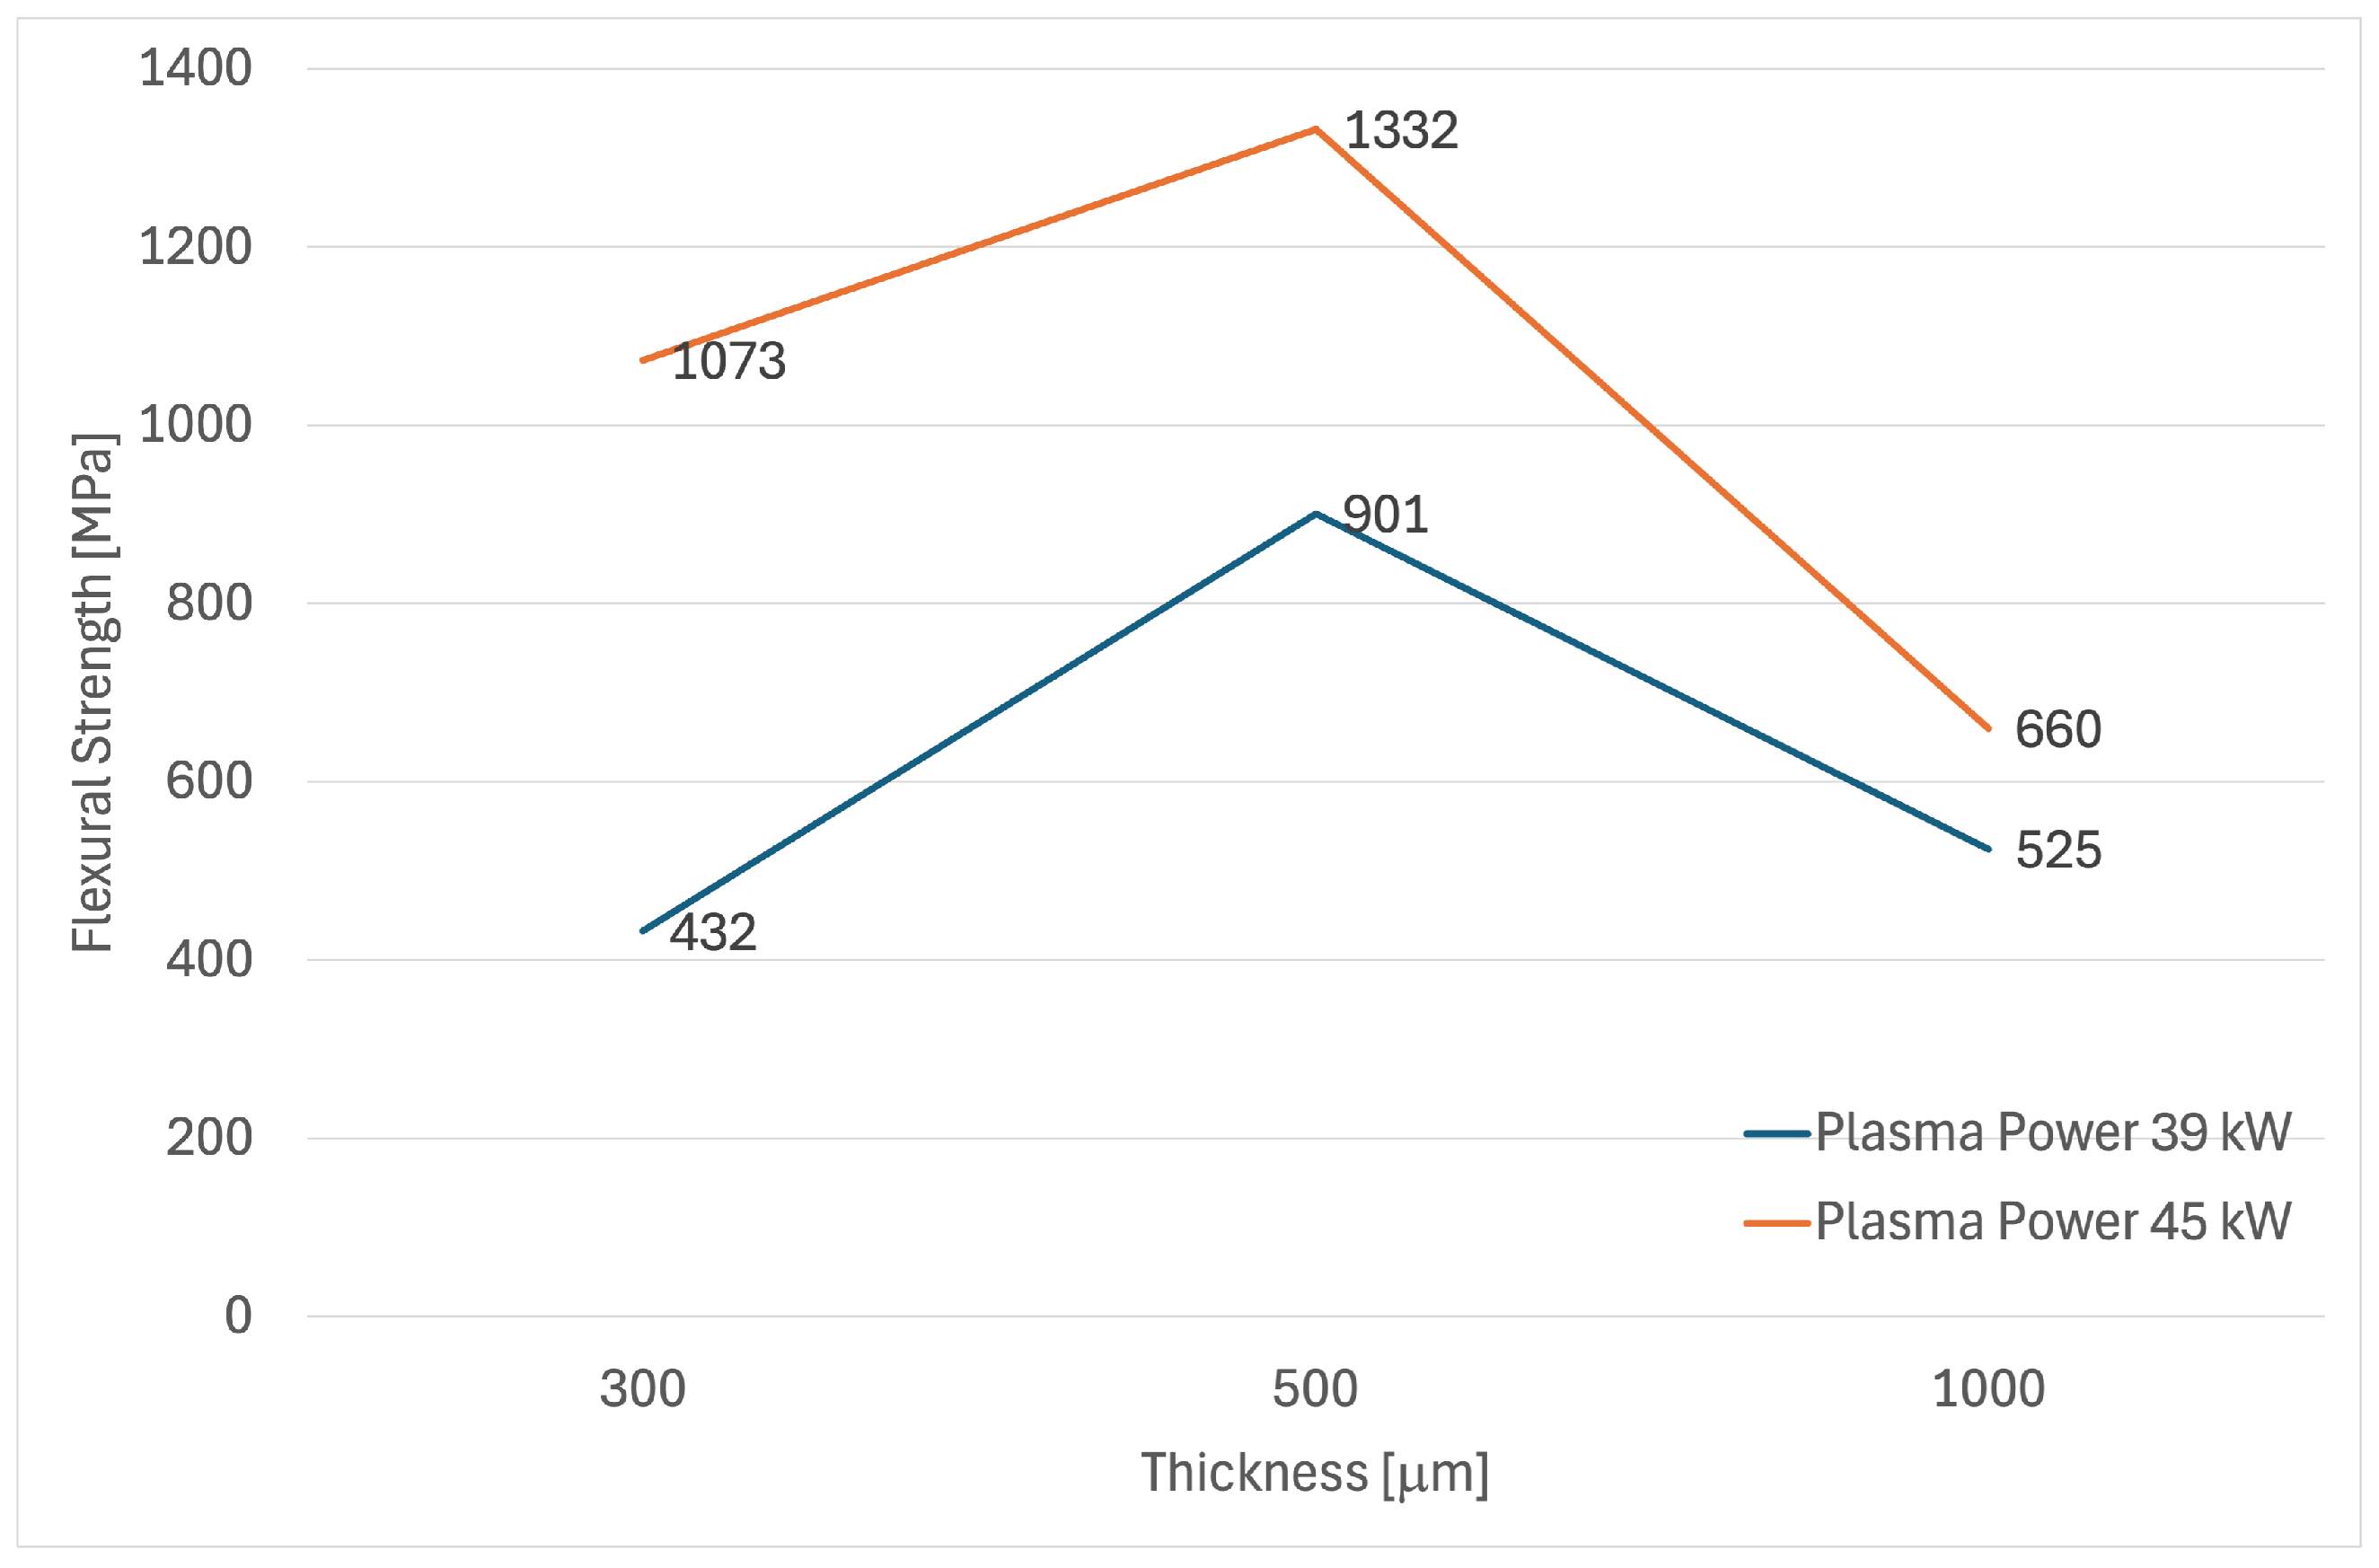
This research examines how atmospheric plasma spraying torch power and coating thickness jointly affect the adhesion strength, microstructure, porosity, and flexural behavior of A l 2 O 3 coatings on 100Cr6 steel substrates. Optical microscopy, SEM and EDS mapping, 3D surface-roughness analysis, Vickers hardness testing (HV2) on polished cross-sections, and three-point bending of extracted beams were employed to develop a processing–structure–property map. This multi-technique approach enables the cross-validation of processing–structure–property relationships and supports a robust identification of the optimal power–thickness condition by jointly considering porosity (densification), adhesion strength, flexural response and failure mode. All conditions resulted in an average surface roughness Ra of approximately 1.0 µm. Increasing torch power to 45 kW generally reduced cross-sectional porosity, except at 500 µm, where globular pores appeared. Hardness (HV2) increased with power and peaked at the intermediate thickness (500 µm); adhesion up to 63 MPa was recorded for the 300 µm/45 kW coating. Flexural strength was highest at 500 µm and was consistently greater at 45 kW than at 39 kW. Fractography showed a shift in failure mode from interface-driven delamination at 39 kW to more cohesive, tortuous intra-coating cracks at 45 kW, aligned with improved splat bonding and crack-path deflection. An intermediate thickness of 500 µm deposited at 45 kW is thus identified as an optimal condition to balance densification and crack-path tortuosity, leading to enhanced hardness and flexural performance.

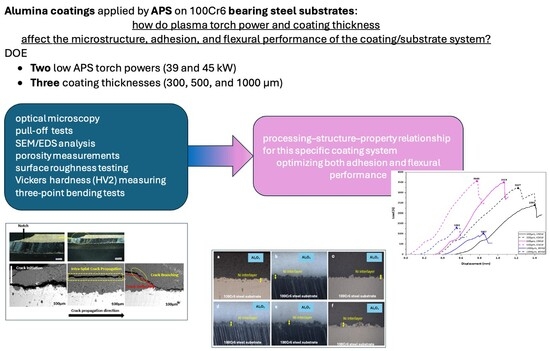
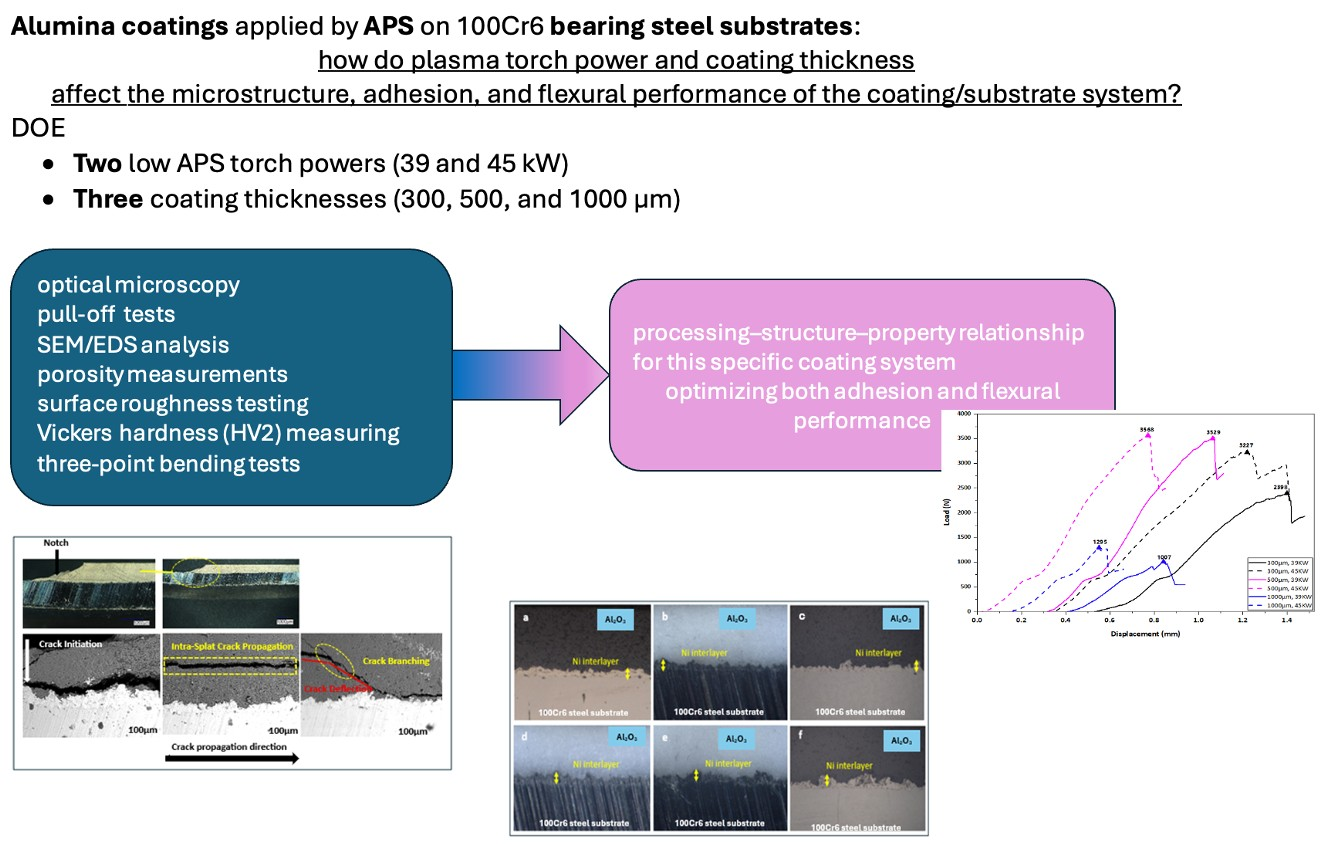
Graphical Abstract

1. Introduction

100Cr6 (AISI 52100) is a high-carbon chromium bearing steel widely used for rolling-element bearings. In the through-hardened condition, it combines high hardness, contact fatigue strength, and wear resistance, which makes it suitable for demanding applications in the automotive, aerospace, and industrial sectors [1]. However, the martensitic microstructure and high carbon content reduce ductility and fracture toughness so that untempered 100Cr6 is more susceptible to brittle or premature failure under severe impact or stress concentrations. To obtain a suitable balance between hardness and toughness, bearing components are typically produced by austenitizing, quenching, and tempering, which refine the microstructure, relieve internal stresses, and reduce brittleness while preserving the high hardness required for wear and rolling-contact fatigue resistance [1]. Nevertheless, even with optimized heat treatment, the performance and lifetime of 100Cr6 bearing components are often governed by surface-initiated damage mechanisms, which motivates the use of surface engineering and protective coating technologies to further enhance wear and rolling-contact fatigue resistance. Coating technologies are widely used to enhance the service life of bearing components by forming protective layers that reduce substrate wear and, consequently, replacement costs [2]. The selection of a suitable coating system and deposition process depends on several factors, including the required layer thickness, bonding mechanism, mechanical performance, component geometry and substrate material, process temperature, and coating service environment [3]. Among the available methods, thermal spraying stands out for its versatility and reliability in coating and restoring parts, and it is well established in the power generation, automotive, aerospace, marine, and petrochemical industries [4,5]. Within thermal spraying, atmospheric plasma spraying (APS) is particularly suitable for depositing ceramic coatings because the very high plasma temperatures enable melting of refractory oxides and their subsequent deposition as a coating [6,7]. Plasma-sprayed A l 2 O 3 and alumina composite coatings are widely used as standard industrial materials due to their high hardness, appropriate strength and toughness, and excellent tribological and insulating properties [8,9,10,11,12]. Their properties can be tailored by adding secondary phases, applying post-treatment processes, and selecting suitable feedstock powders; however, an essential factor is also the adjustment of plasma spraying parameters such as torch power, gas flow rate, and stand-off (deposition) distance [13,14,15,16,17]. These process parameters directly affect the mechanical and tribological properties of the coatings, especially given the intrinsically high hardness of ceramic alumina [1,18,19]. A characteristic feature of thermal-sprayed (TS) coatings is their lamellar grain structure, which is formed by the flattening of molten and semi-molten in-flight particles upon striking the relatively cold substrate surface, followed by rapid solidification. The flattened particles are known as splats and can exhibit different morphologies [20]. Several studies have investigated the effect of APS process parameters on the microstructure and properties of alumina coatings. C. Wang et al. [15] prepared A l 2 O 3 coatings with plasma powers ranging from 52 to 60 kW and observed that increasing power from 52 to 58 kW led to higher compactness, Vickers hardness, and flexural strength, whereas a further increase to 60 kW caused the formation of cracks and a deterioration of properties. D. Zhao et al. [21] reported that increasing torch power from 98 to 145 kW at a short spraying distance increased coating hardness and reduced porosity due to the improved melting of the feedstock powders. Conversely, decreasing torch power while increasing the spraying distance promoted particle re-solidification in flight and the presence of unmelted particles in the deposit. G. Sivakumar et al. [22] showed that continuous exposure of in-flight particles to the plasma plume at torch powers of 35 and 46 kW produced a heat-treatment-like effect, favouring the formation of phase-pure α -alumina coatings. To obtain comprehensive insight into the behaviour of coating/substrate systems, an increasing number of studies have employed bending tests. Compared with scratch and indentation techniques, bending tests can provide a more global and reproducible characterization of the mechanical response of coated components, including coating stiffness, strength, and failure mechanisms [23]. Through controlled bending, previous works have not only determined coating mechanical properties but also examined coating failure behaviour and coating–substrate interface integrity; in some cases, cyclic bending has been used to assess the fatigue behaviour of coatings [24,25]. Bending tests are often preferred over tensile tests for thin and thick coatings because specimen preparation is simpler and potential coating damage caused by gripping is avoided. Such tests are essential for evaluating the performance of coating/substrate systems across different industrial applications, where the main objectives include assessing flexural properties, adhesion behaviour, interfacial cracking, and fatigue performance [26]. This research examines alumina coatings applied by APS on 100Cr6 bearing steel substrates, focusing on how plasma torch power and coating thickness affect the microstructure, adhesion, and flexural performance of the coating/substrate system. Unlike previous studies that often used higher torch powers, different substrate materials, or generic bending setups, this work targets an industrially relevant bearing steel with a Ni interlayer, exploring relatively low APS torch powers (39 and 45 kW) and three coating thicknesses (300, 500, and 1000 µm). By employing optical microscopy, SEM/EDS analysis, porosity measurements, surface roughness testing, Vickers hardness (HV2), and three-point bending tests on extracted beams, this study establishes a processing–structure–property relationship for this specific coating system. It identifies parameter combinations that optimize both adhesion and flexural performance.

2. Materials and Methods

This research comprised two sets of experiments designed to characterise the bending behaviour and adhesion of thermally sprayed alumina coatings on 100Cr6 bearing steel substrates. As specified by the supplier, the nominal chemical composition of 100Cr6 (wt.%) is C 0.93–1.05, Si 0.15–0.35, Mn 0.25–0.45, P ≤ 0.025, S ≤ 0.015, Cr 1.35-1.60, Cu ≤ 0.30, Al ≤ 0.05, and Fe. In the first set of experiments, six cylindrical disk specimens were coated with alumina and then characterized. These disk specimens were used to assess the as-sprayed surface condition of the coatings. For the second set of experiments, rectangular beam specimens were used for three-point bending tests to quantify coating adhesion properties.

2.1. Materials

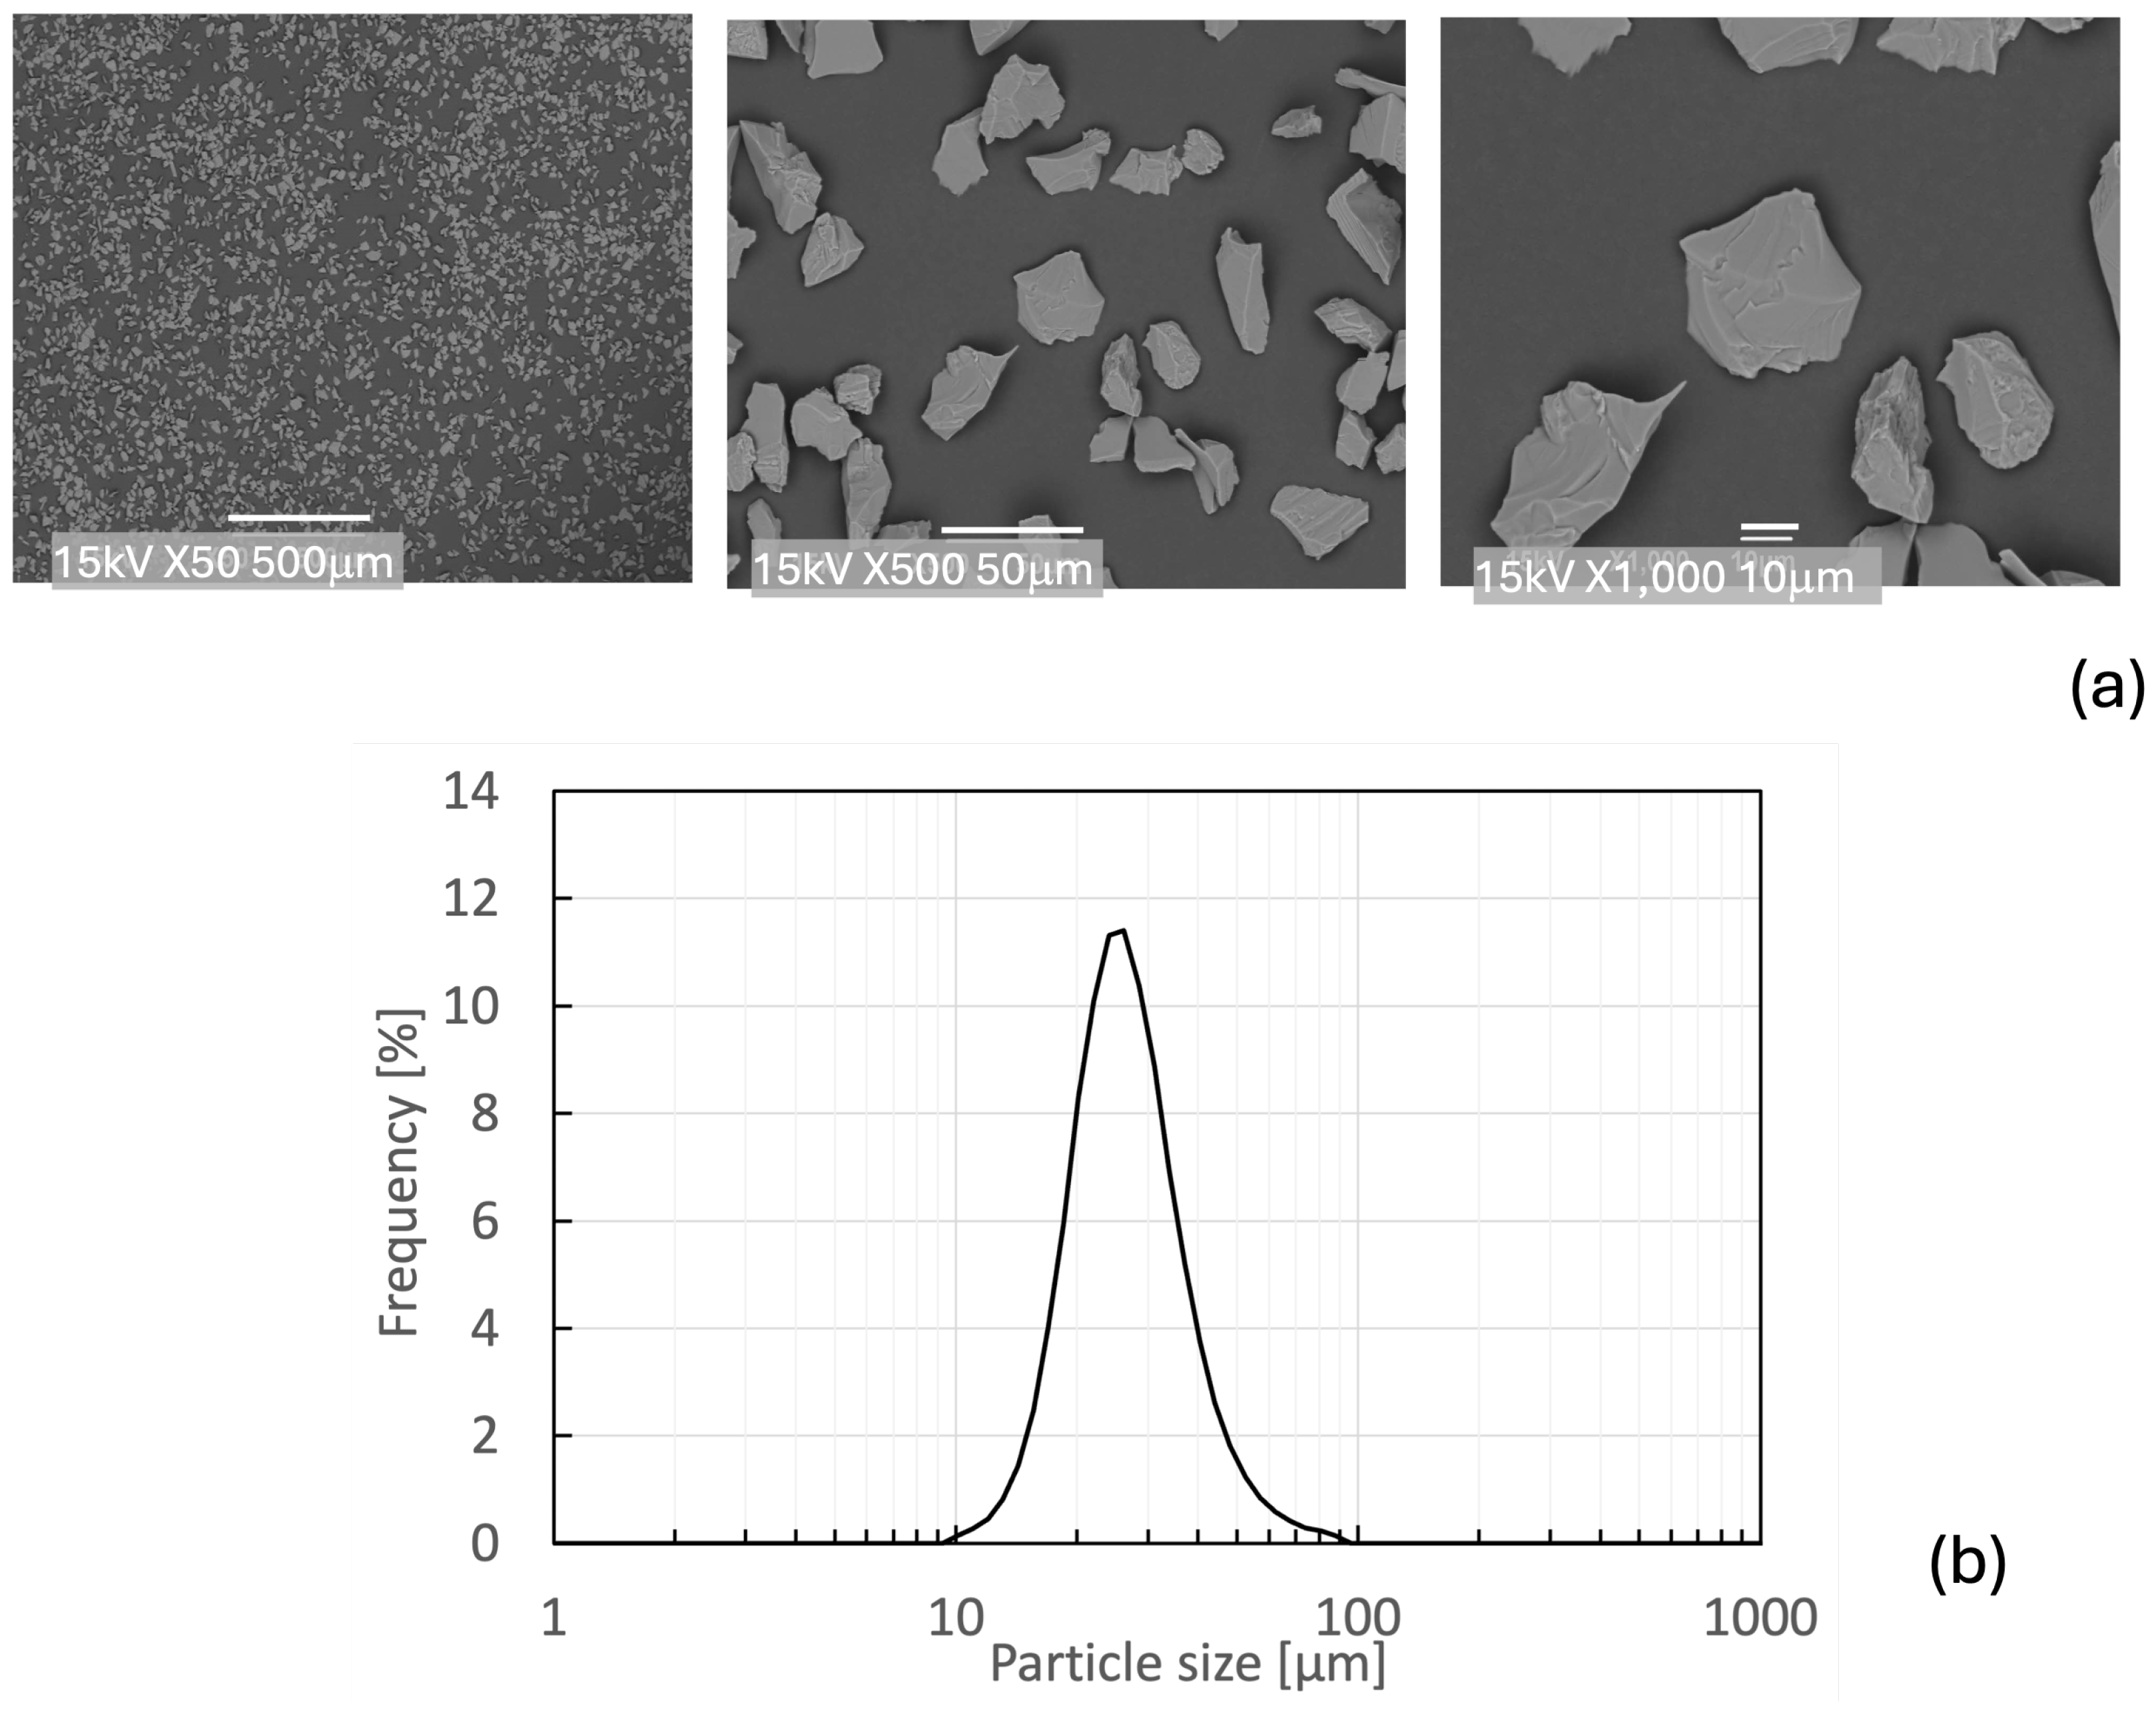
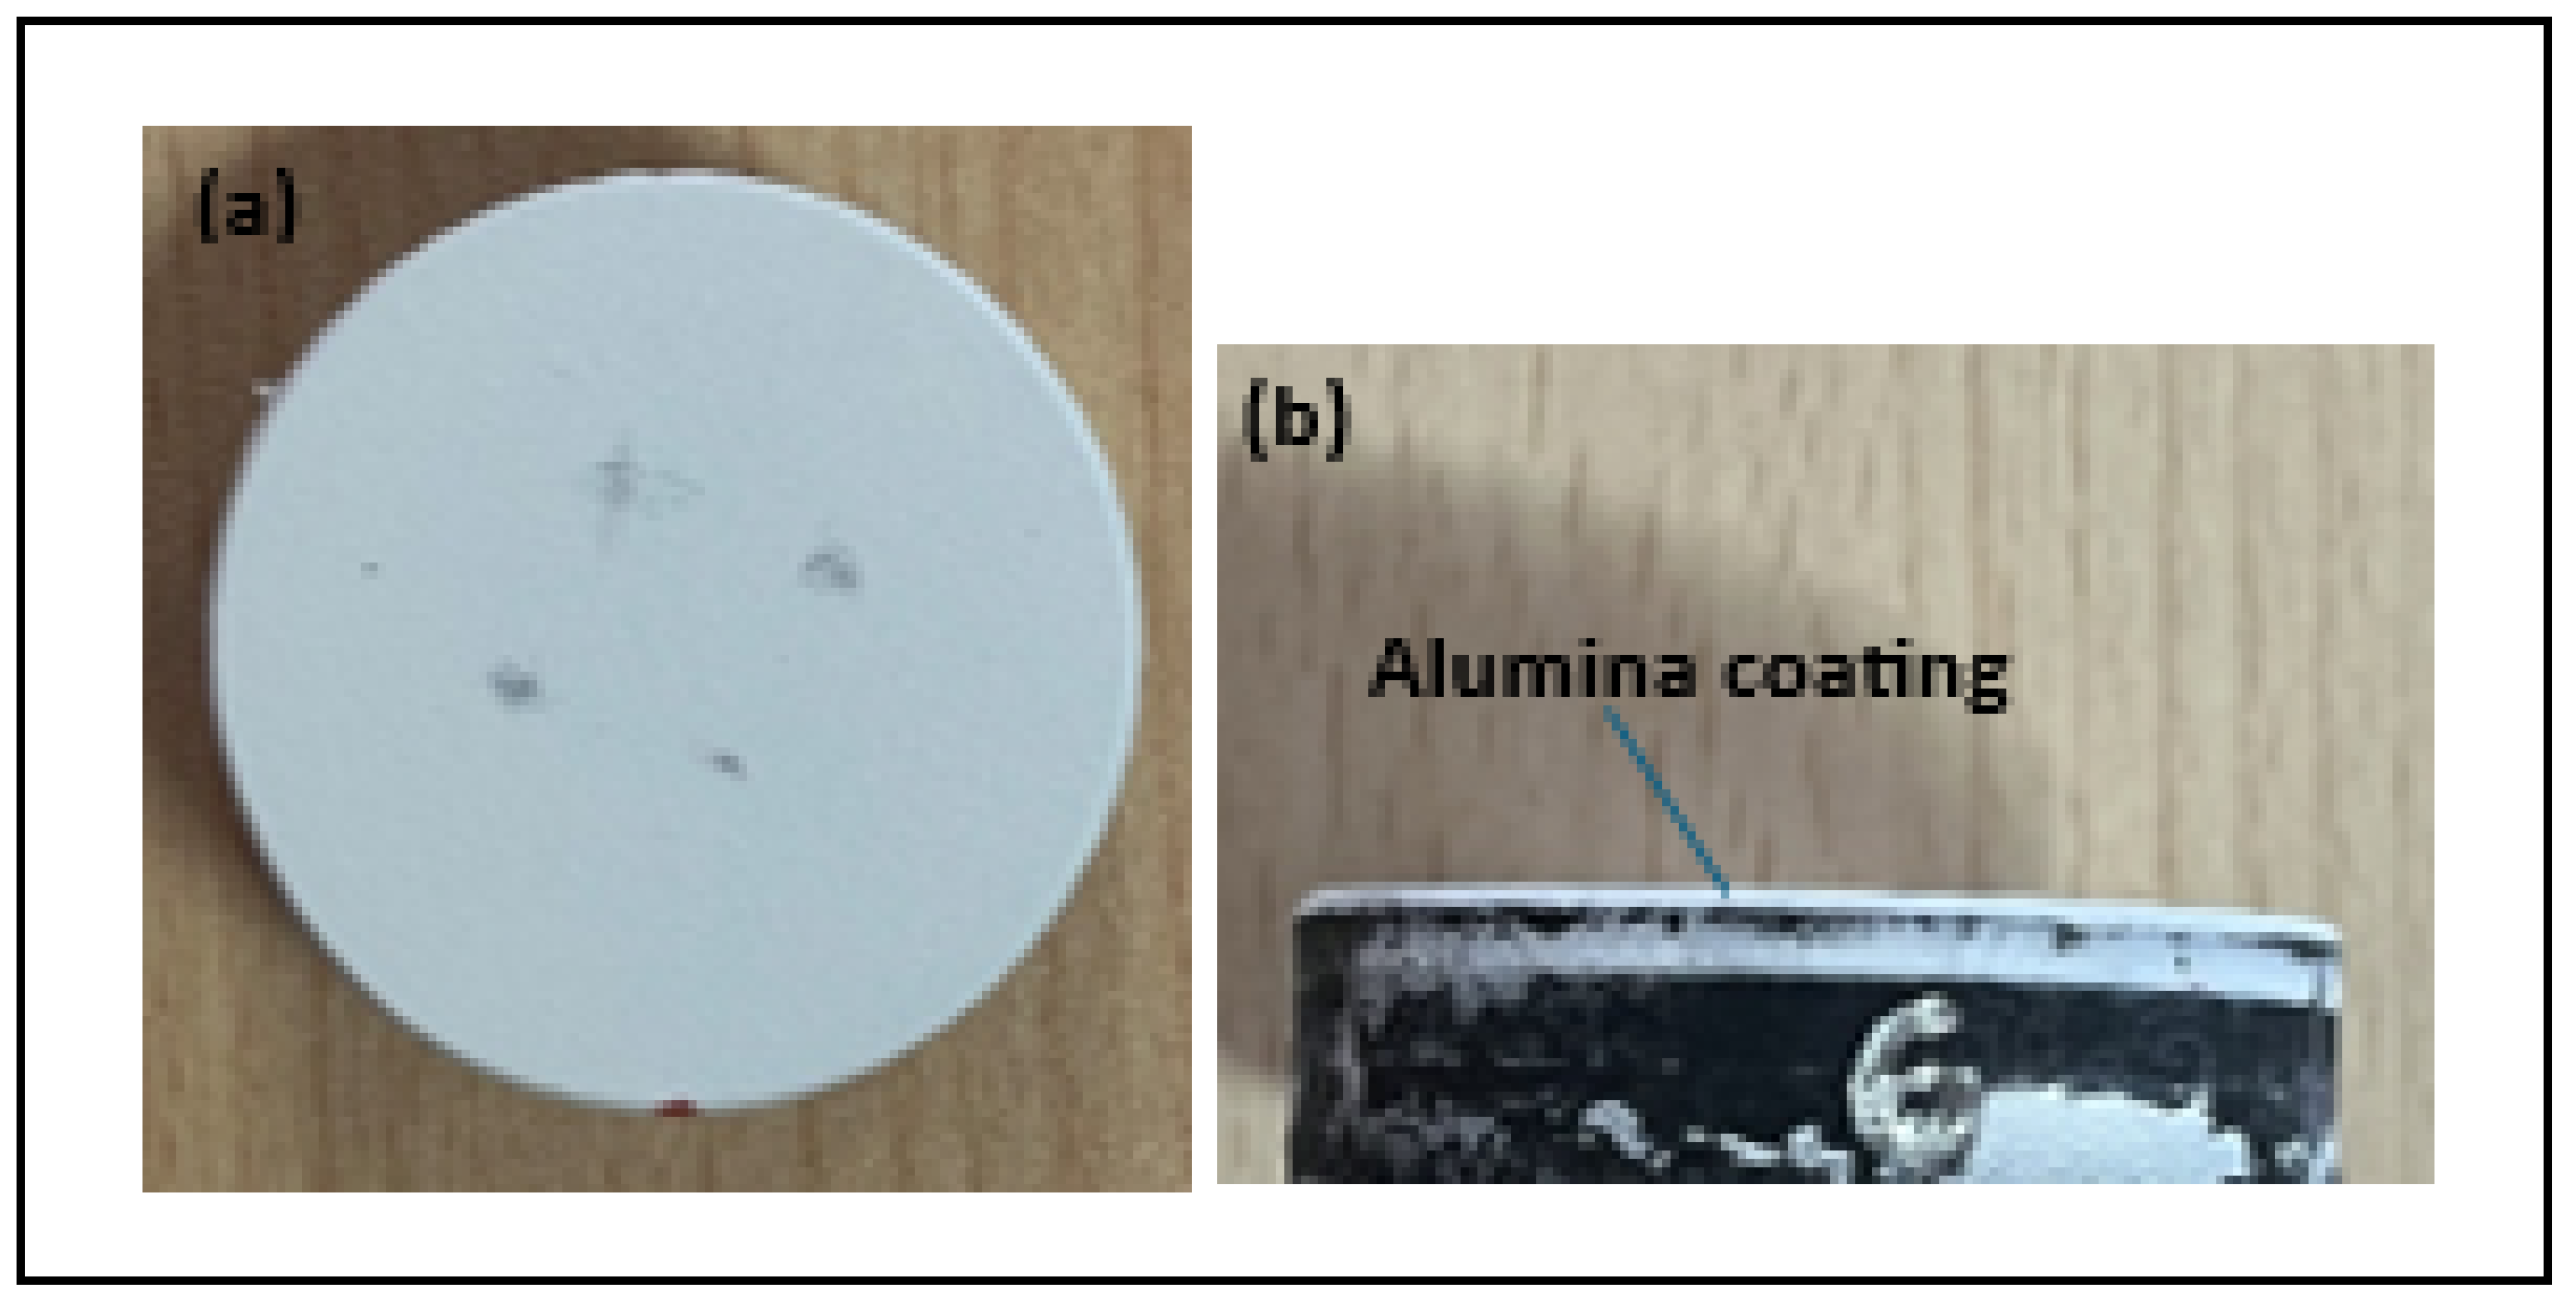
In both experimental setups, the substrates were coated with high-purity (99.5%) α - A l 2 O 3 powder supplied in a fused and crushed form, a morphology known for its excellent flowability and thermal performance during thermal spray applications. Before deposition, the powder’s characteristics were evaluated. The particle size distribution was measured using a particle size analyser, and the microstructural features of the powder were analysed through scanning electron microscopy (SEM). Images were taken with backscattered electron (BSE) detectors at magnifications ranging from 200× to 1000×. The SEM micrographs are shown in Figure 1. In Figure 1a, non-spherical particles display a uniform size distribution. This morphology supports the formation of dense coatings because of favourable splat behavior and particle-mitigation properties. The alumina powder’s particle size distribution (PSD) was also examined and is shown in Figure 1b. The curve reveals a narrow distribution centered around a D 50 value of 24.86 µm, which is ideal for stable powder feeding and effective melting during the plasma spray process. In the first set of experiments, six cylindrical disk specimens were coated with alumina and then characterized. These disk specimens were used to assess the as-sprayed surface condition of the coatings through optical microscopy and 3D optical profilometry. Figure 2 shows the disk specimens. For the second set of experiments, rectangular specimens (beam shape) were obtained by cutting disk specimens. Rectangular beam specimens were used in three-point bending tests to quantify coating adhesion properties. Table 1 lists the coating process parameters for each disk, including coating thickness, APS plasma power, axial length of the substrate, and diameter. In the second set, six coated rectangular beam specimens were used for microstructural and porosity analysis, Vickers hardness measurements, and three-point bending tests. Table 2 presents the coating process parameters for these beam specimens along with their dimensions.

2.2. Coating Deposition

Alumina ceramic coatings were applied to cylindrical 100Cr6 steel substrates by means of the Atmospheric Plasma Spraying (APS) technique. Before deposition, the surfaces of the substrates were sandblasted with alumina to enhance mechanical interlocking. A Ni-based interlayer, approximately 100 µm thick, was initially deposited under optimized conditions to improve adhesion between the ceramic topcoat and the steel substrate. Coating thicknesses of approximately 300 µm, 500 µm, and 1000 µm were obtained by controlling the number of spray passes (≈12.4 µm/pass) under otherwise fixed deposition settings. For all alumina topcoats, the powder feed rate was 31 g min−1, and for the Ni interlayer, it was 21 g min−1 (Table 3). Coatings of each thickness were deposited at both 39 and 45 kW power levels. An epoxy-based sealant was applied to the coated surfaces and was also present during three-point bending tests to reduce open porosity and improve environmental durability. All coatings were applied under stationary spray geometry, meaning that the substrate was kept fixed and that the spray angle and stand-off distance were kept constant throughout each deposition run (90° relative to the surface and 120 mm, respectively). A complete summary of the process parameters for both the nickel-based interlayer and the alumina coating can be found in Table 3.

2.3. Surface and Microstructure Analysis

Surface morphology and integrity of the plasma-sprayed A l 2 O 3 coatings on disk specimens were assessed by digital optical microscopy (VHX-7000, Keyence, Itasca, IL 60143, USA) to examine coating continuity and screen for surface-connected defects (e.g., open pits, pull-outs, cracks). Complementary surface topography was quantified using a Zygo NewViewTM 3D optical profilometer. For each processing condition (six disks), five non-overlapping regions per disk were scanned to ensure adequate spatial coverage and statistical representativeness of the roughness data.
Pre-Bending Observations: Cross-sections of the coated beams were examined by a Keyence microscope to document layer architecture, thickness uniformity, and coating integrity and to screen for defects such as cracks, delamination, or other interfacial discontinuities between the alumina coating and the steel substrate. Following bending tests, the specimens were re-examined both in the cross-section and on the top surface to identify damage and failure modes (e.g., crack initiation, propagation, interfacial debonding, chipping, and spallation) attributable to mechanical loading. Cross-sectional features of the coated beam samples were examined using a Jeol SEM instrument. The SEM analysis of the coated beam specimens’ cross-sections aimed to assess the integrity and uniformity of the coating at the interfaces between the alumina topcoat, the Ni bond coat and the steel substrate and to identify cracks or other imperfections. SEM observations were then performed using a JEOL scanning electron microscope equipped with an EDS system under high-vacuum conditions using backscattered-electron imaging (BSE; BED-C detector). Overview SEM micrographs were acquired at 100× magnification to document coating morphology and layer structure, and the A l 2 O 3 /Ni and Ni/steel interfaces were systematically inspected along the cross-section by acquiring multiple adjacent fields of view. Cross-section positions were selected from the mid-region of the coated beam specimens. At low magnification (100×), the A l 2 O 3 /Ni and Ni/steel interfaces were systematically inspected along the cross-section by acquiring multiple adjacent fields of view to assess coating continuity, interfacial integrity, and the presence of cracks or other imperfections. Higher-magnification SEM images were acquired at 1000× to inspect interface continuity, and SEM–EDS elemental maps were collected on representative interfacial regions to document material distribution across the coating system. For surface microstructural features, SEM micrographs were acquired at 2000×. SEM was operated at an accelerating voltage of 20 kV with a working distance in the range of 7.7–12.7 mm.
Post-Bending Observations: Cross-sectional SEM (BSE) and SEM–EDS analyses were performed on selected damaged regions to identify crack initiation/propagation paths, characterize failure modes, and assess potential interfacial degradation. The surface and cross-sectional porosity of the APS A l 2 O 3 coatings on beam specimens was quantified by SEM-based image analysis. For cross-sections, the region of interest was restricted to the A l 2 O 3 topcoat (excluding the Ni interlayer and steel). Images were calibrated in ImageJ 1.54p. Images were normalized and binarized with a global threshold (Otsu); masks were denoised and edge-touching features were excluded before calculating areal porosity (%).

2.4. Vickers Hardness (HV2) and Adhesion Tests

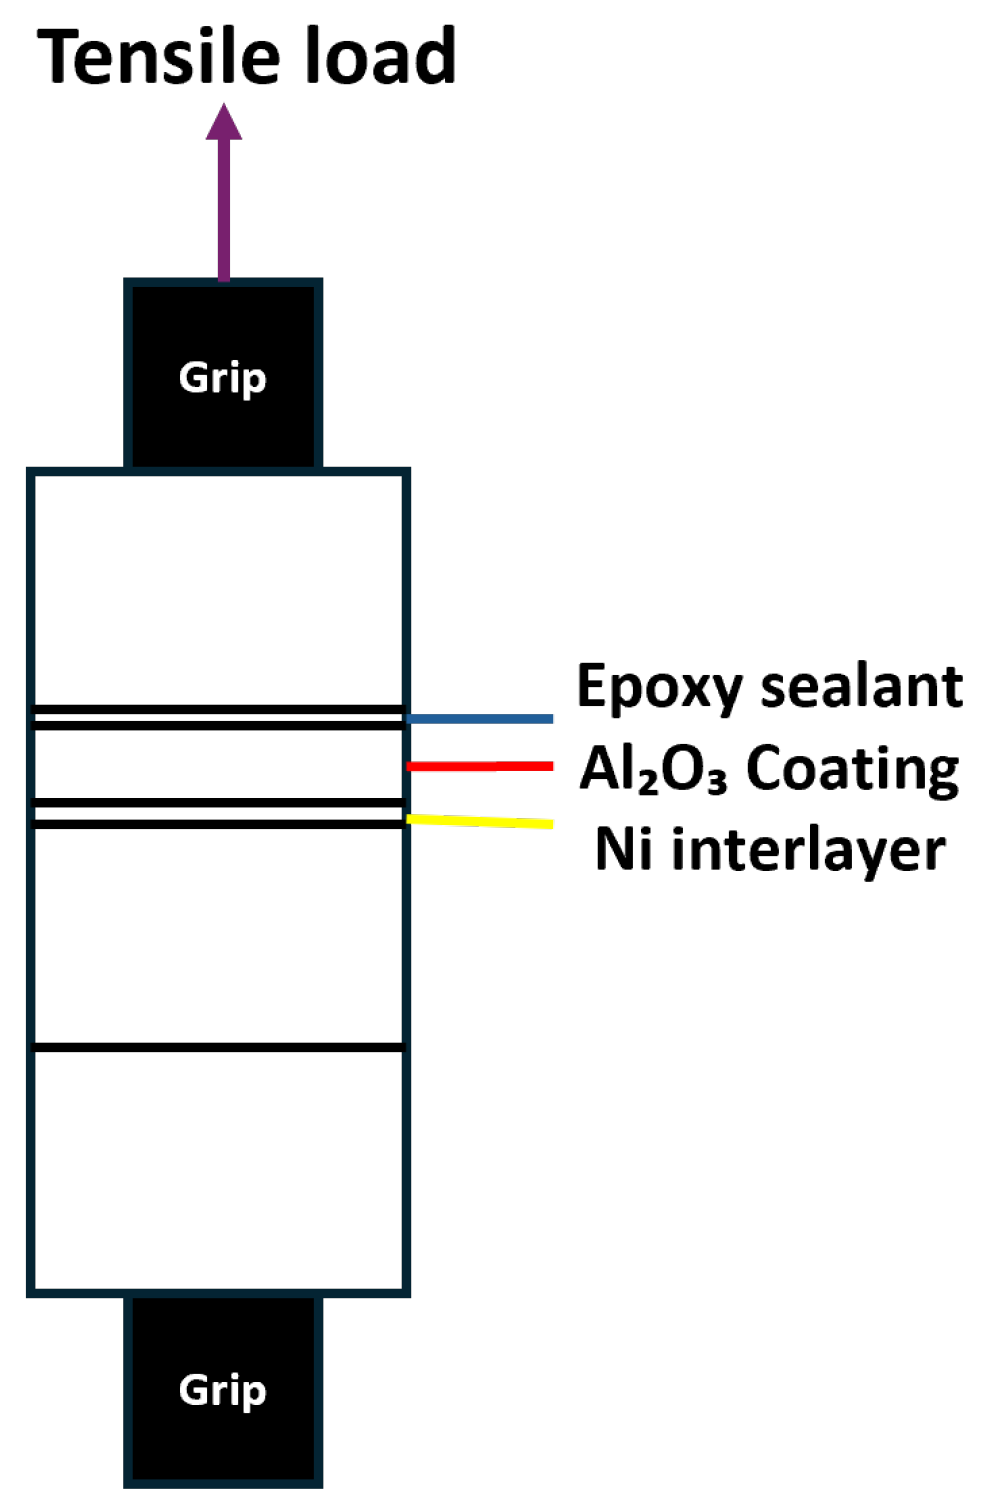
The cross-sectional Vickers hardness (HV2) of the coated beams was measured using an Innovatest Vickers hardness tester following the ISO 6507-1 Standard [27]. A test force of 2 kgf with a dwell time of 6 s was applied. For each sample, five indents were made within the coating near the coating–substrate interface, positioned at a distance of at least 2.5 times the diagonal length (d) from the interface and at least 3d apart from each other. The results are reported as the average of five measurements. The adhesion strength of plasma-sprayed alumina coatings was assessed using a pull-off tensile test, according to the ASTM C633 Standard [28]. In this method, two cylindrical specimens (coated and uncoated) were bonded together with a high-strength epoxy adhesive, as shown in Figure 3. The bonded assembly was mounted in a tensile testing machine, and a load was applied perpendicular to the coating–substrate interface until failure occurred. For a 300 µm coating applied with a 45 kW APS gun, an adhesion strength of 63 MPa was measured. Data are available only for the 300 µm/45 kW coating, while the remaining pull-off results cannot be disclosed due to industrial confidentiality.

2.5. Bending Test

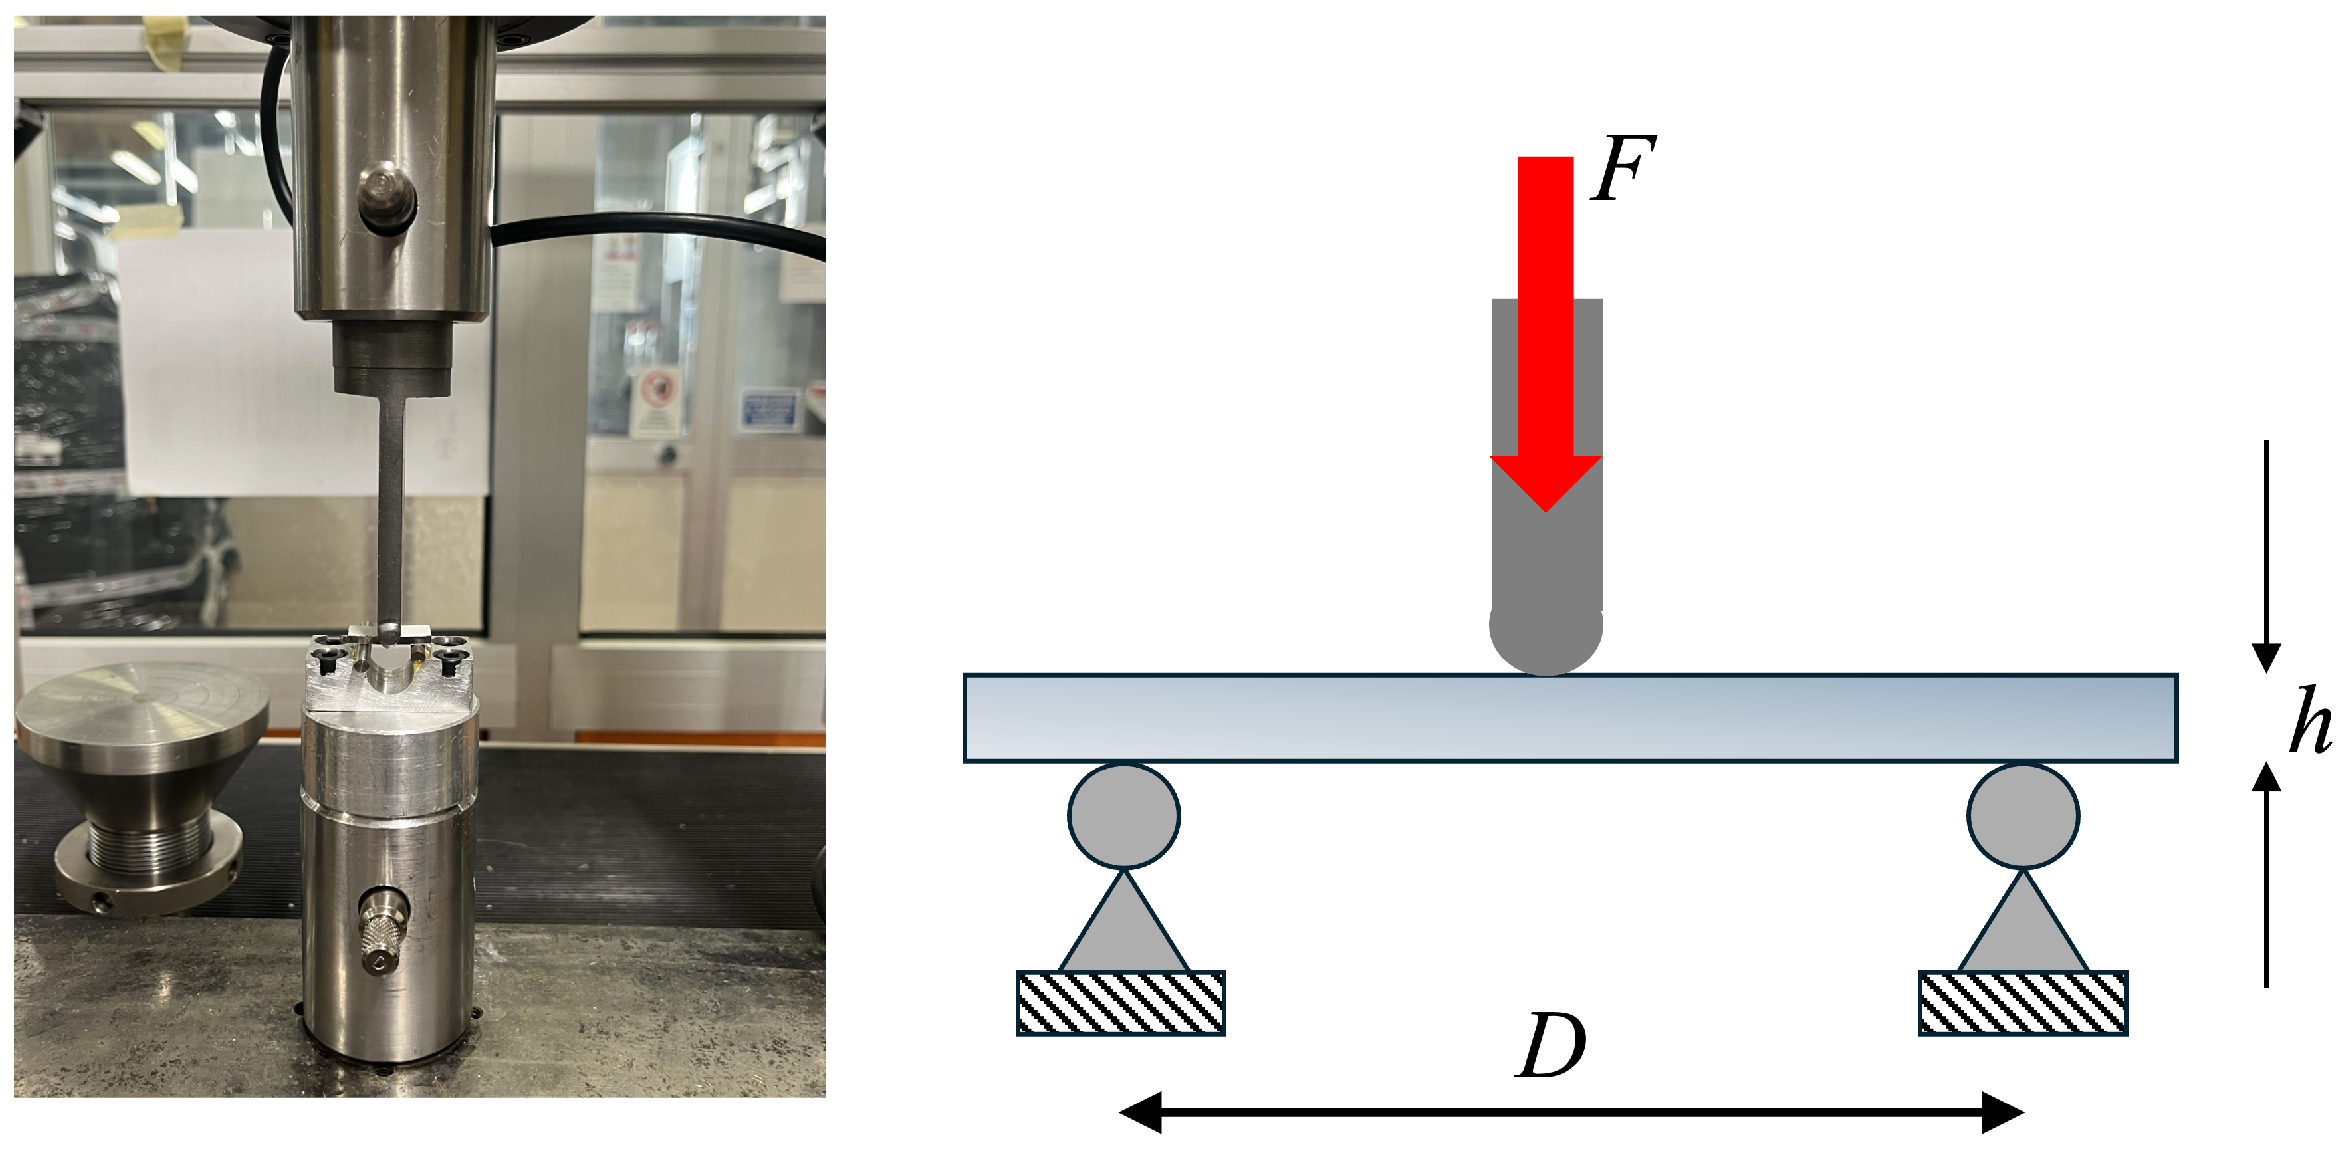
Three-point bending tests were performed at room temperature on six coated beam specimens using a MTS Qtest10 universal testing machine with a three-point fixture. The coated surface was positioned to undergo tensile stress. Figure 4 shows the test setup. Tests were conducted in displacement control at a crosshead rate of 0.02 mm min −1 with a support span of L = 16 mm. Mid-span deflection δ was recorded by the machine software and used for strain calculations. Force-deflection curves were acquired, and then, data were processed to obtain the stress that detaches the coating from the substrate or the stress that breaks the coating in a bending condition. Nominal equivalent maximum flexural stress ( σ f ) and maximum flexural strain ( ε f ) were evaluated from classical beam theory (Equations (1) and (2)), where F is the maximum load at fracture, b is the specimen width, h is the specimen thickness, δ is the displacement of the crosshead and D is the distance between the supports during testing. By means of a bi-layer composite model, the stress distribution was calculated in the two layers as a function of applied force and specimen bending and central displacement. These results allowed the estimation of the interface’s shear stress. The model was parametrized in specimen dimensions and layer thicknesses. The experimental bending test data allowed us to correctly calibrate the elastic modulus of the coating layer.
σ f = 3 F D 2 b h 2
ε f = 6 δ h D 2

3. Results

3.1. Surface Morphology and Microstructural Characterization

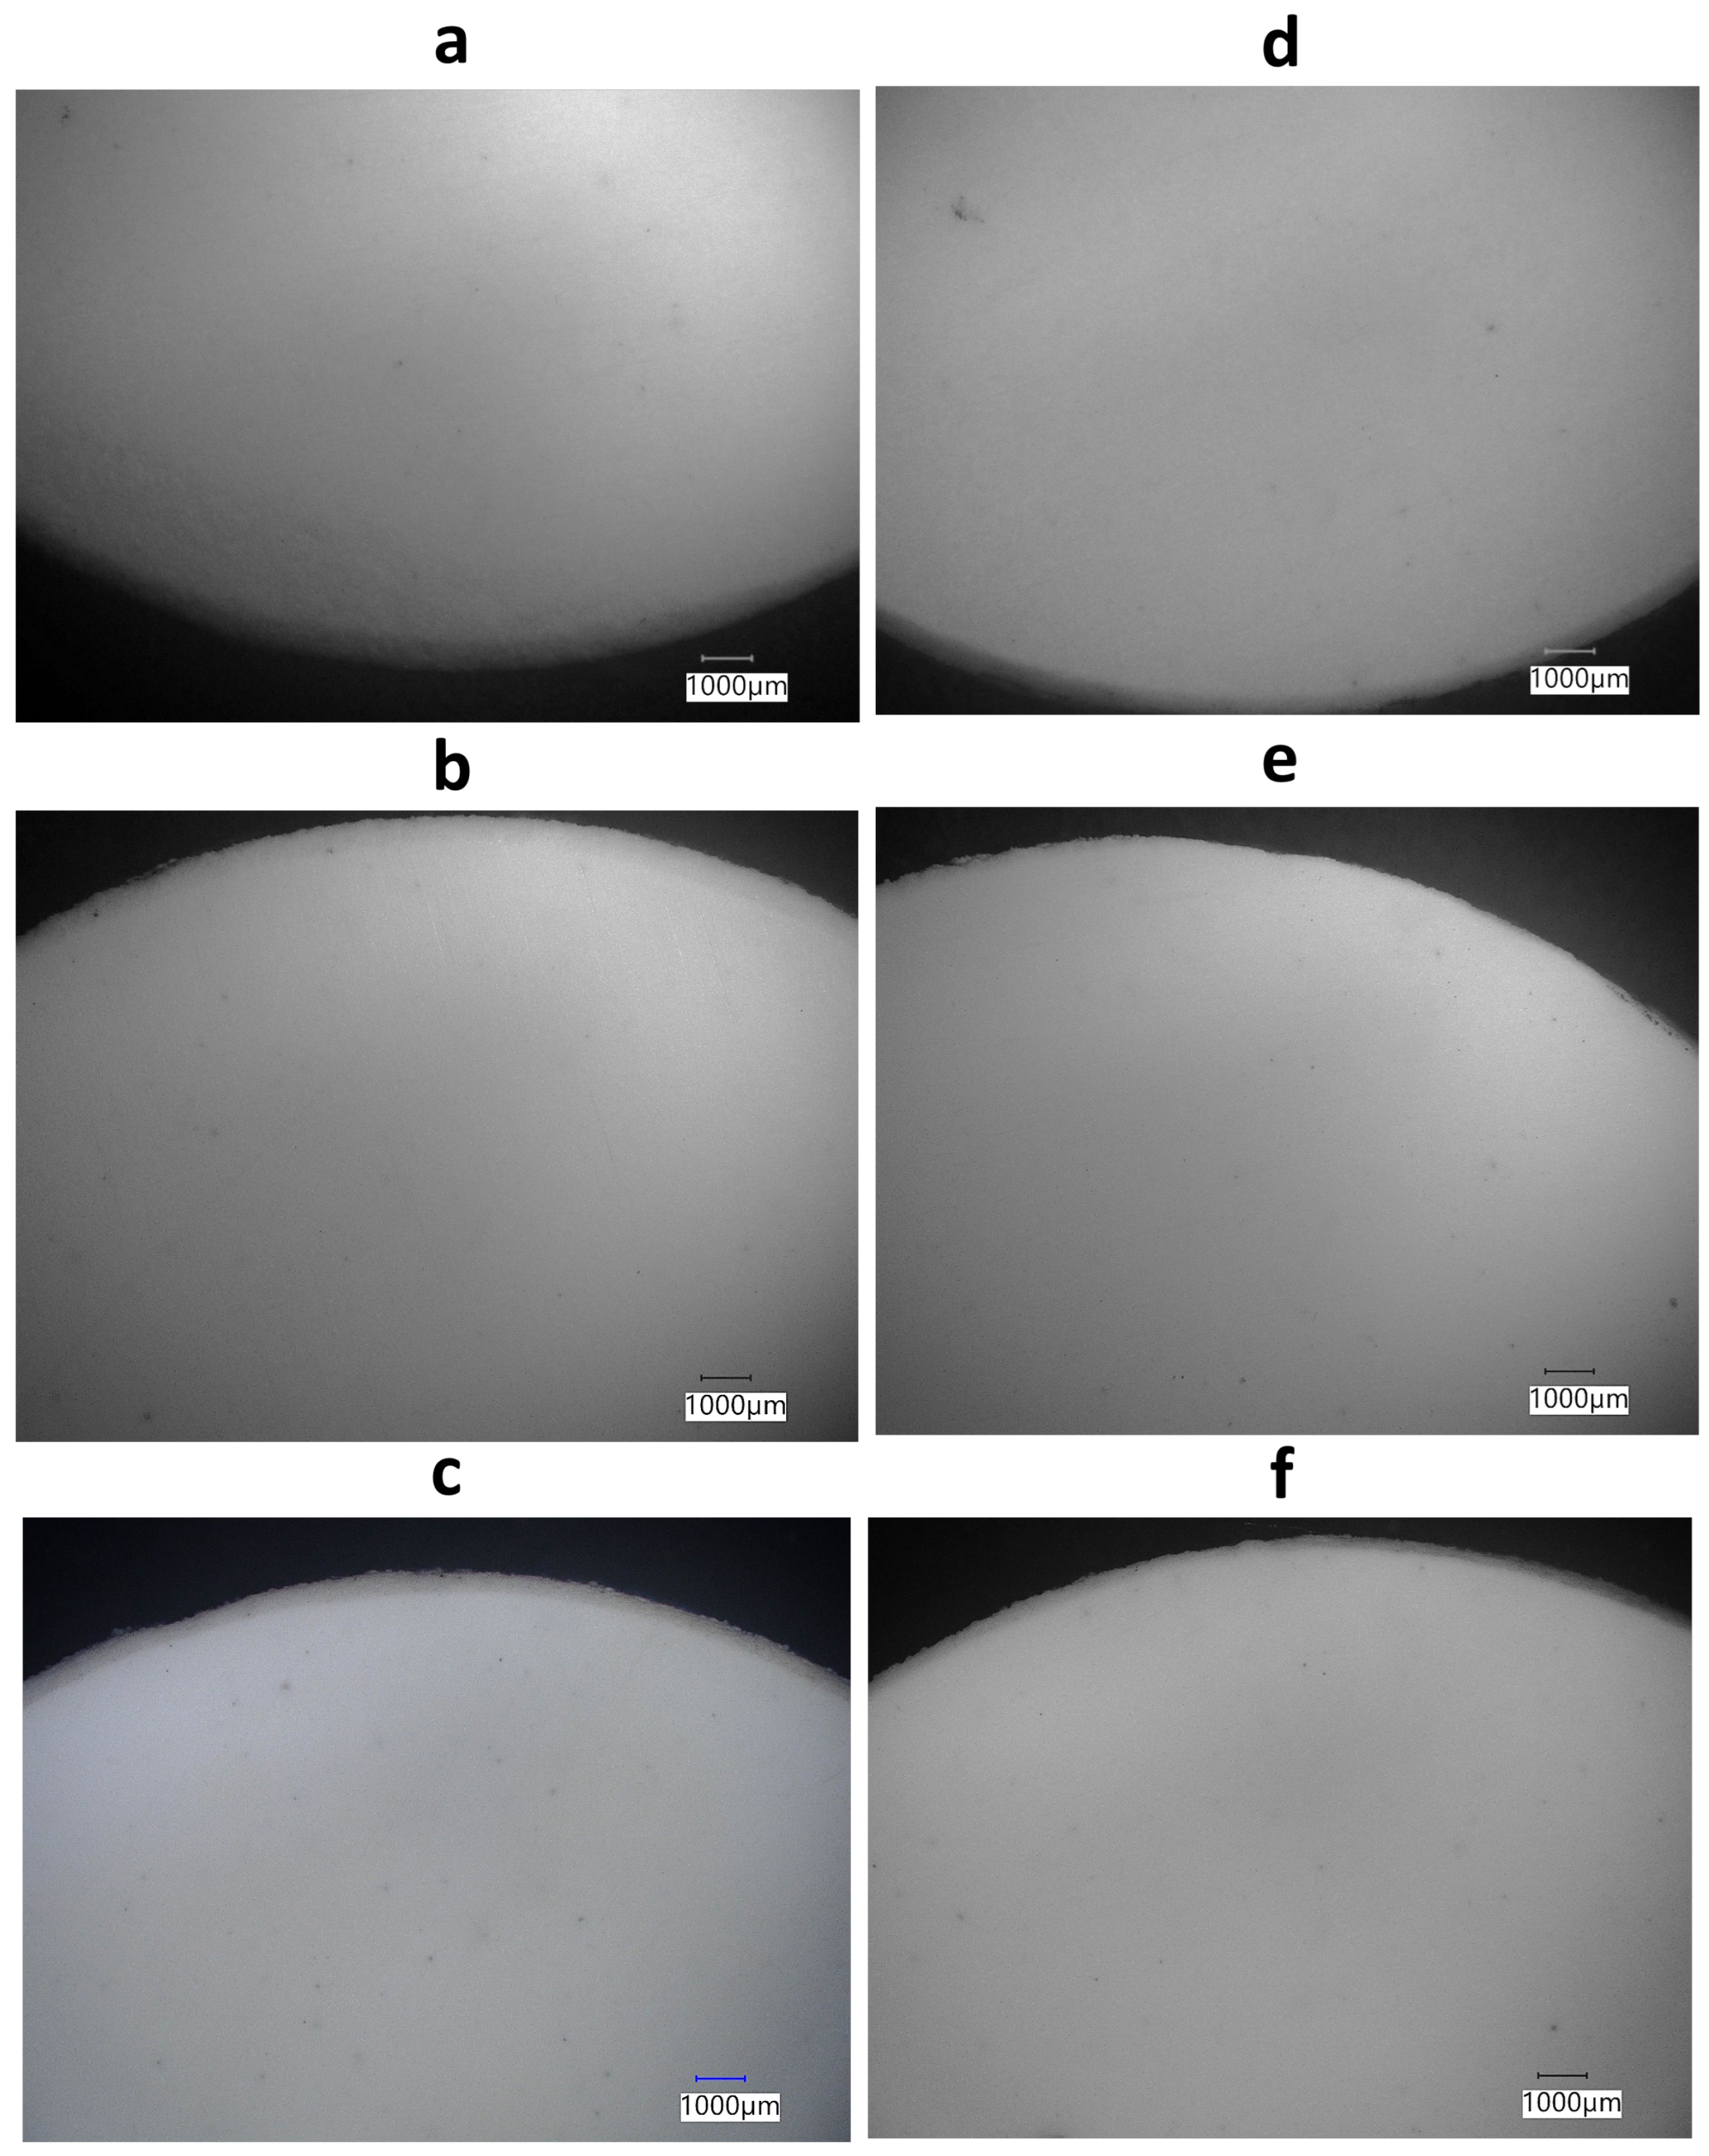
Figure 5 shows representative 10× optical micrographs of the as-sprayed A l 2 O 3 -coated disk surfaces for the six processing conditions (a–c: 39 kW; d–f: 45 kW; increasing thickness from 300 to 1000 µm). Within the inspected fields of view at this magnification, no macroscopic surface cracks, bare-substrate exposures, or large delaminated/spalled regions were observed. Isolated dark specks/open pits are visible on all surfaces. Since the disks (and the derived beams) were in the sealed condition, the epoxy sealant may partially fill some surface-connected pores; therefore, the ’open-pit’ features visible at 10× and the SEM/ImageJ surface-porosity values should be interpreted as representative of the sealed surface state. Upon zooming, faint linear marks attributable to surface preparation/handling are also visible and are not interpreted as coating cracks. Because 10× imaging cannot resolve sub-micrometre defects, differences among conditions at this scale are reported qualitatively; micro-defects below the optical resolution are assessed via SEM/ImageJ surface-porosity quantification together with roughness measurements (Table 4).
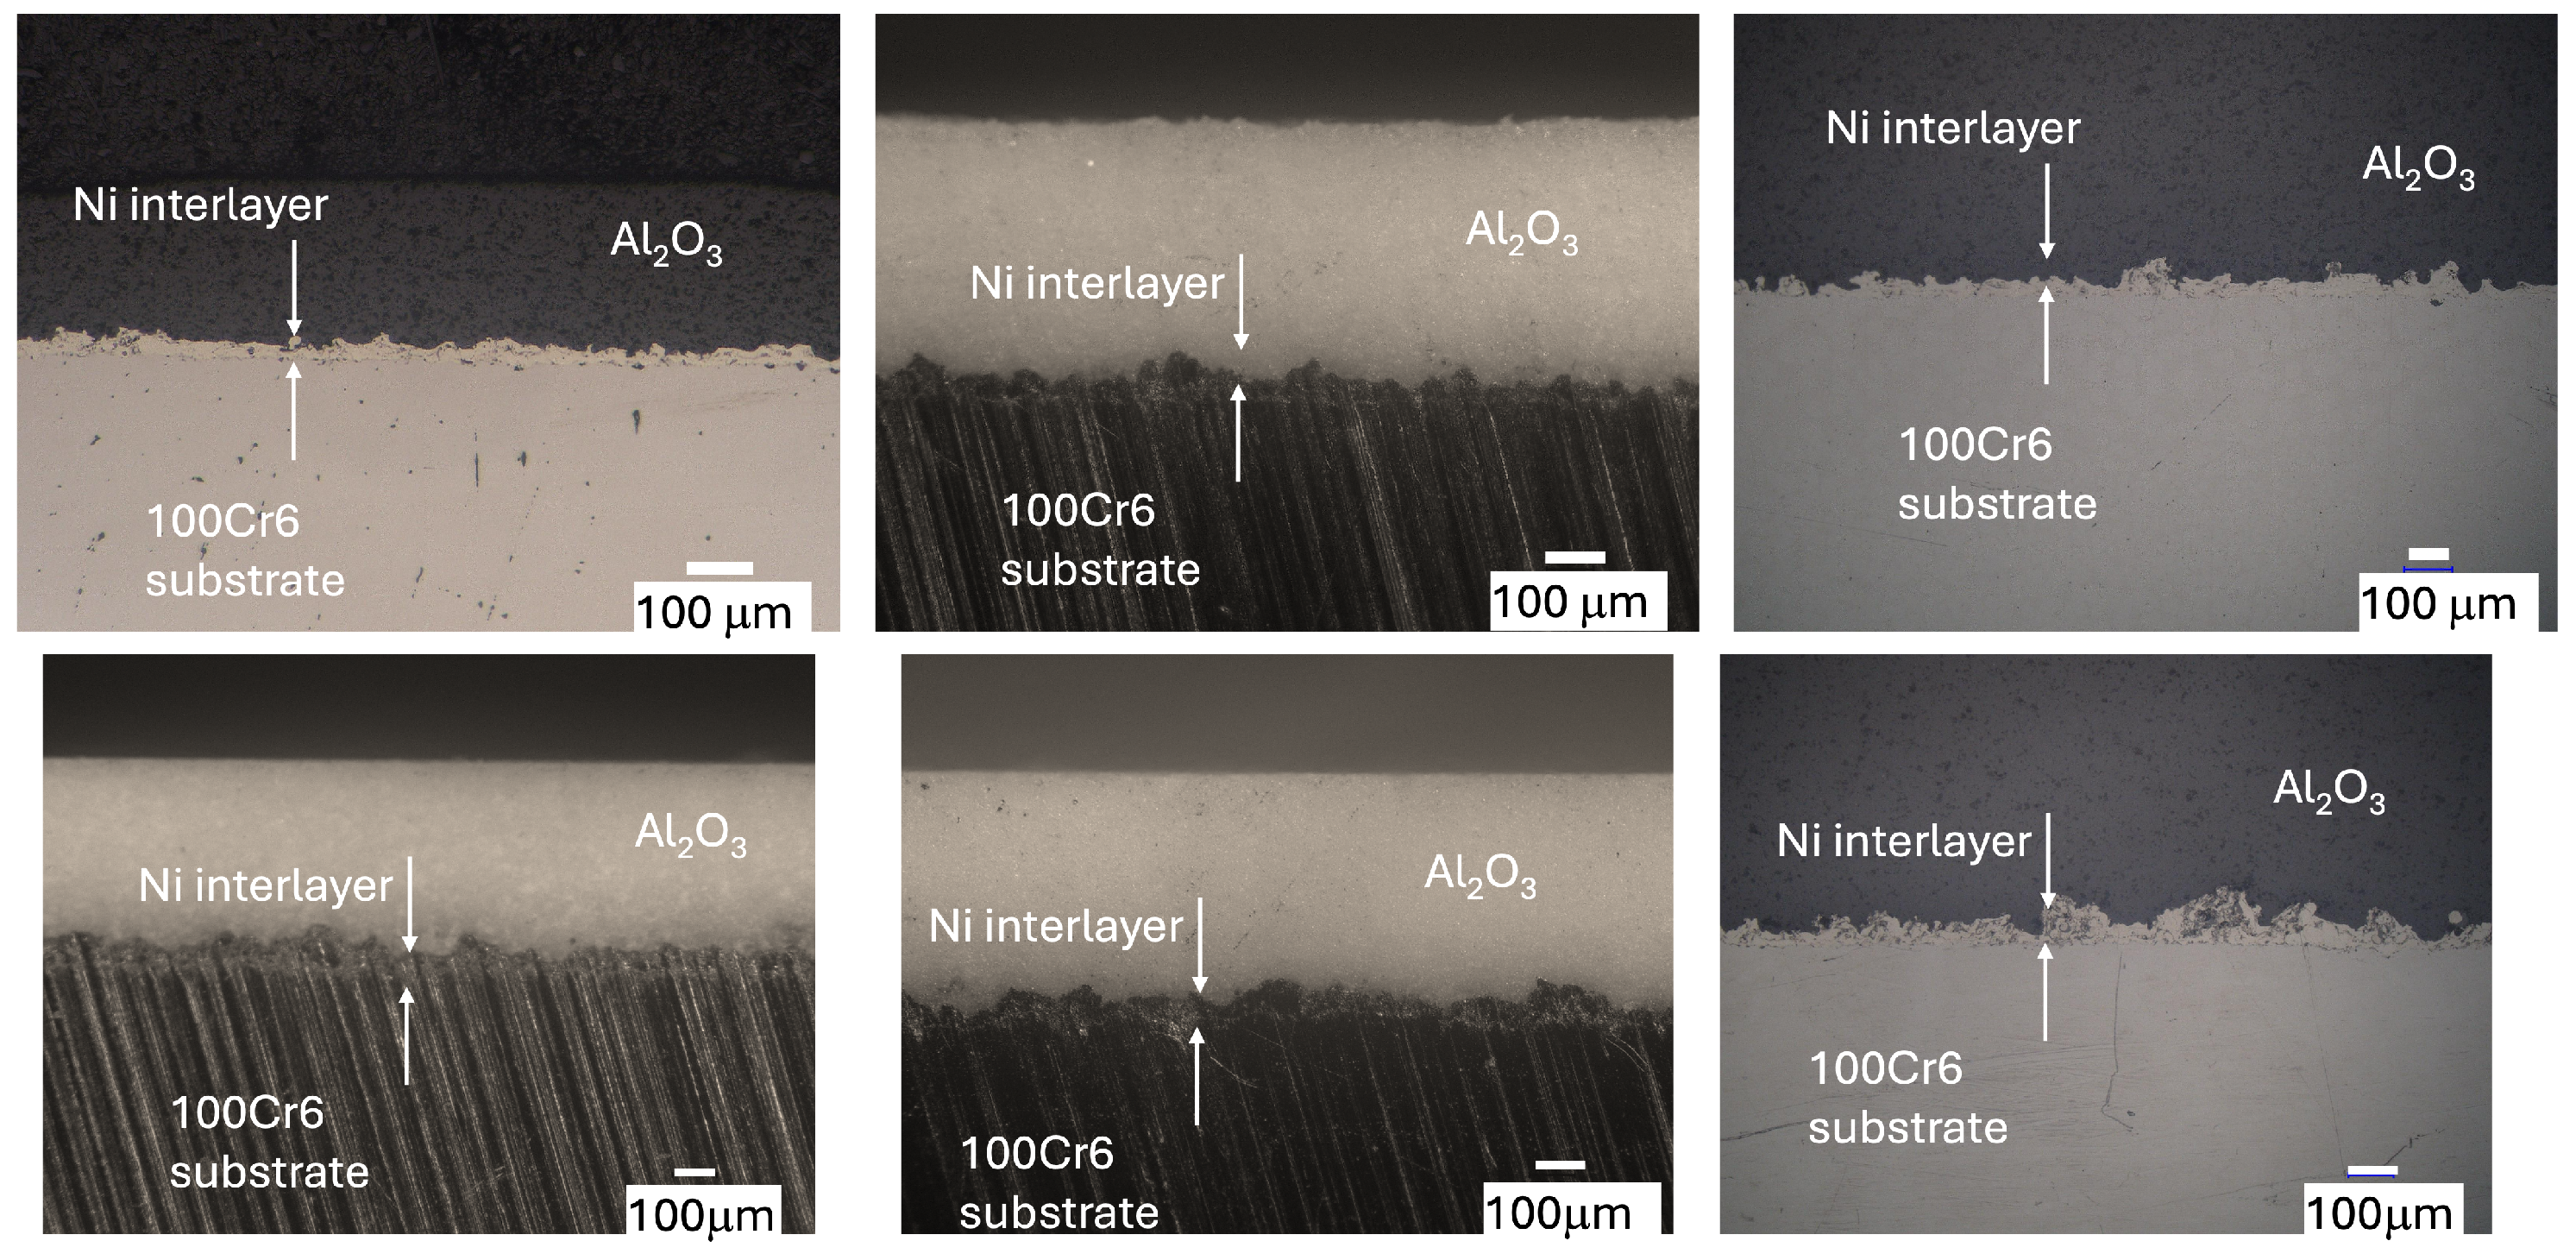
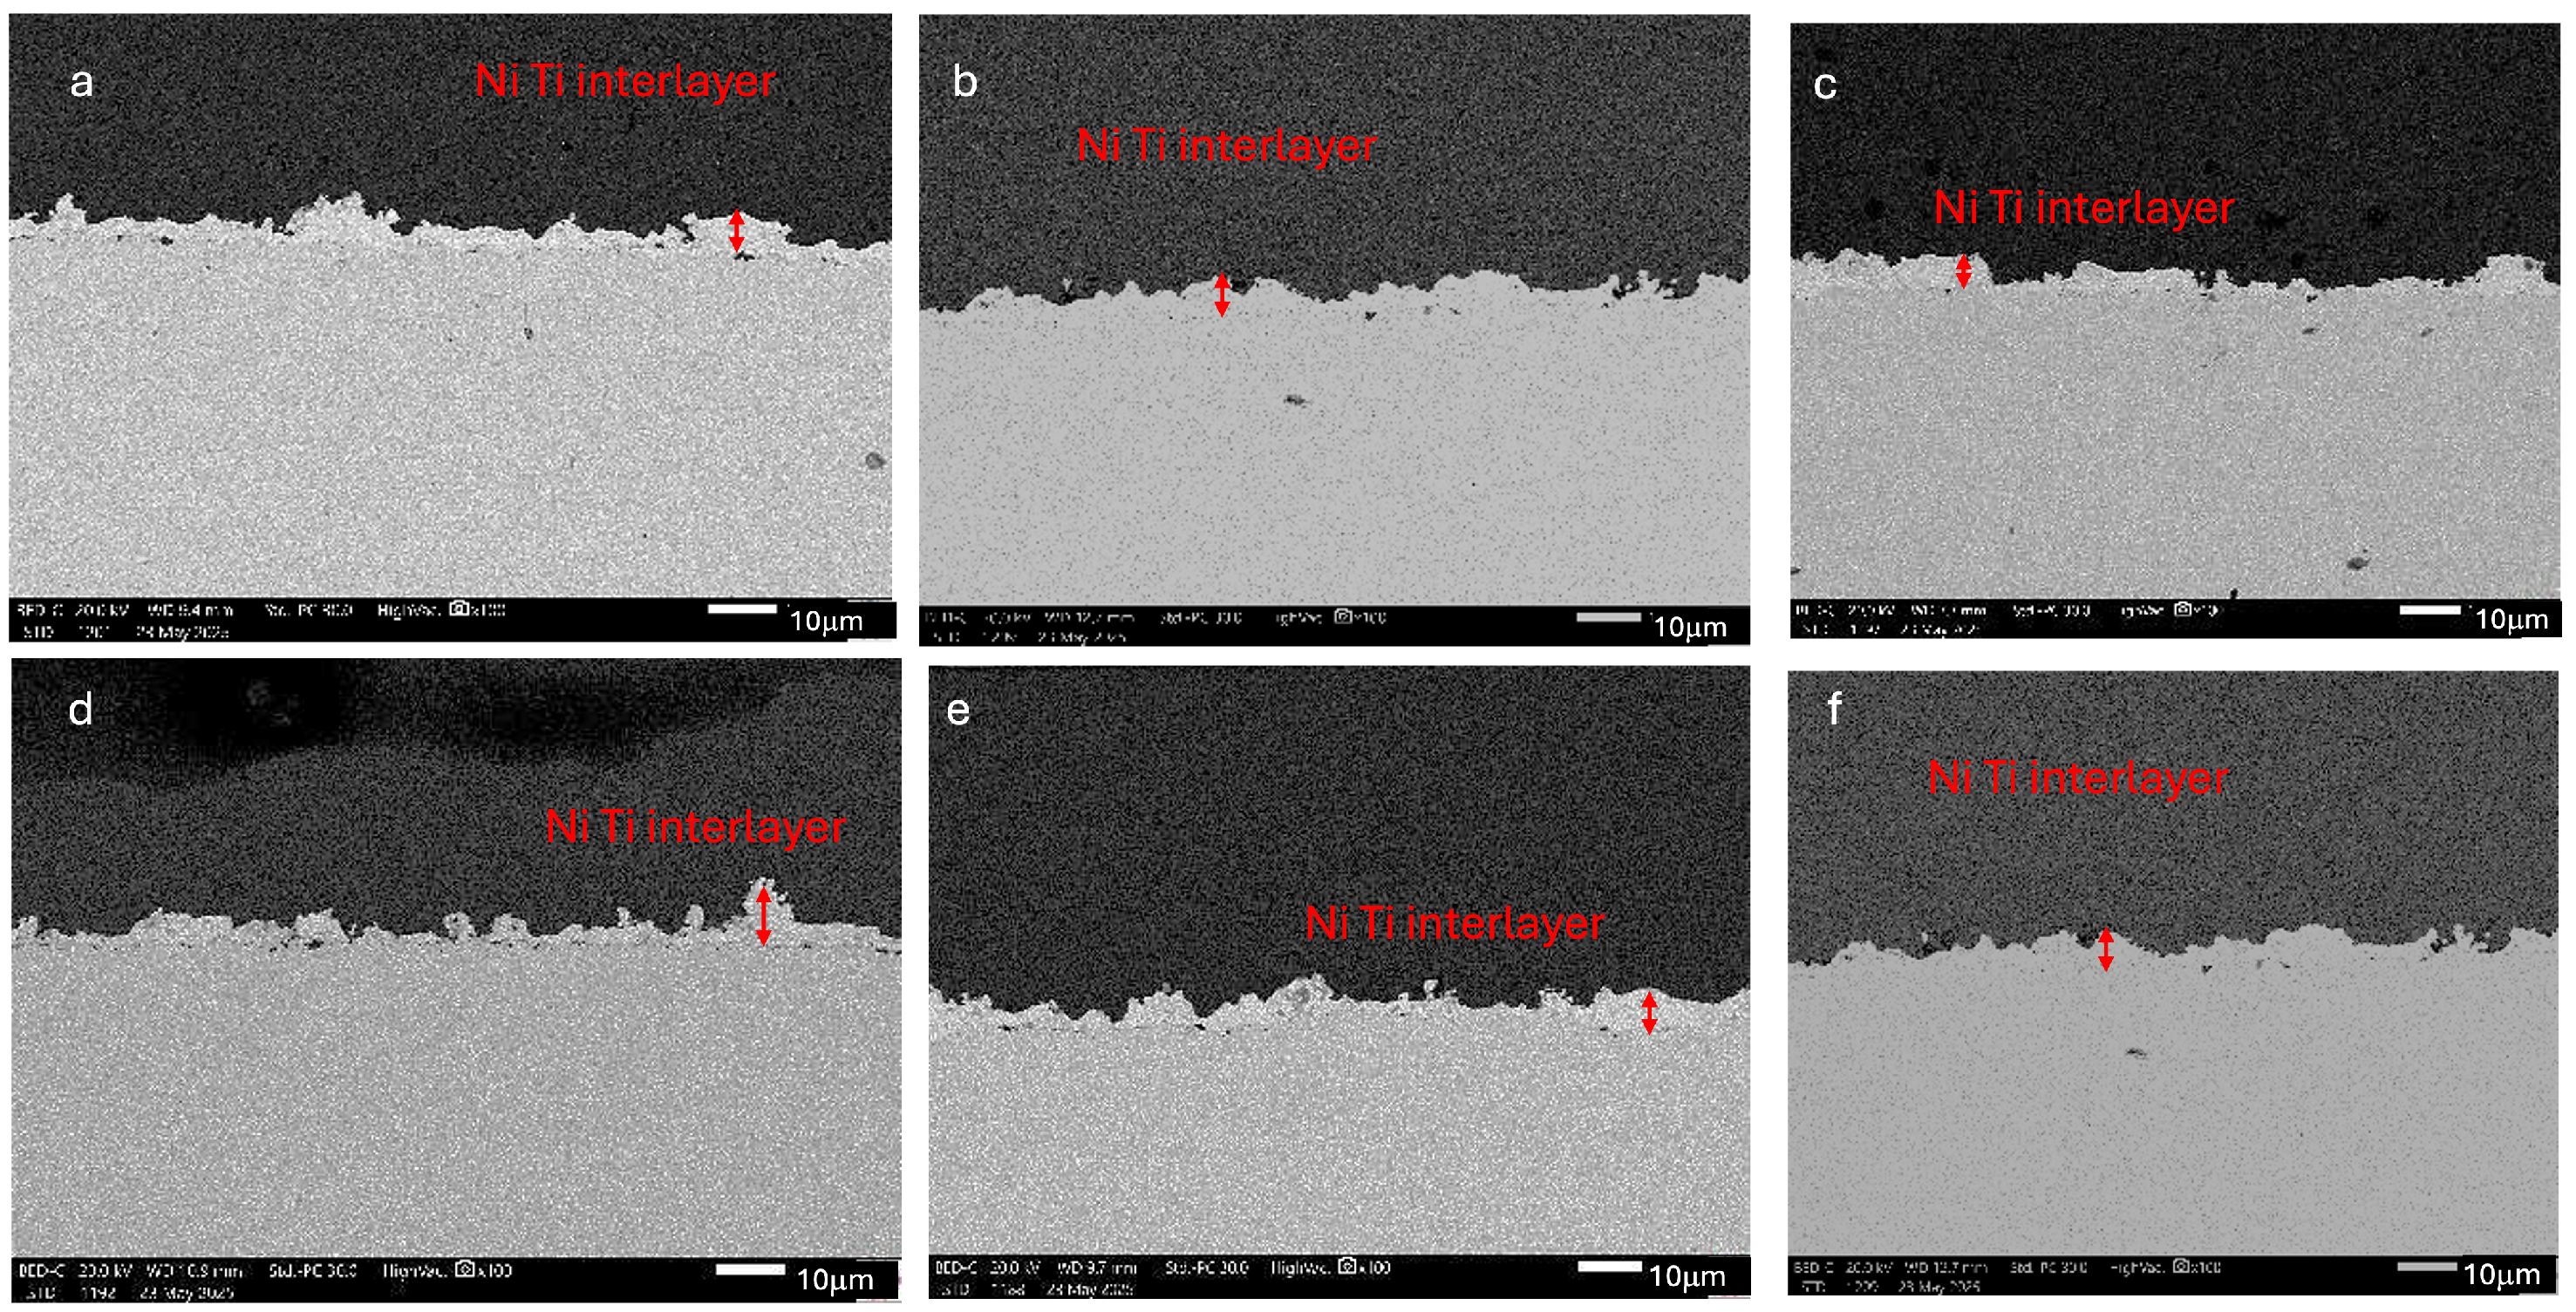
Figure 6 shows cross-sectional images of the six beams (1–6) taken with the Keyence microscope. A continuous, well-bonded interface is visible from the top ceramic layer through the Ni-based interlayer to the steel substrate. The steel–interlayer interface appears uniform and straight, indicating consistent adhesion. The interface between the ceramic and interlayer exhibits a more uneven, interlocking pattern, likely due to the increased surface roughness and porosity of the ceramic layer, which helps mechanically anchor the interlayer [29]. No observable cracks, delamination, or significant defects suggest that the overall coating remains intact. These six beam samples were then embedded in resin and gradually ground and polished to create a flat cross-sectional surface for SEM and EDS analysis. The SEM images captured at 100× magnification in Figure 7 provide an overview of the coating’s morphology and layer structure. The alumina coating appears continuous and well-adhered, with no significant delamination or macroscopic defects visible at this scale. The lamellar structure of the plasma-sprayed coating is evident and consistent with the rapid solidification of molten ceramic splats during deposition. The coating thickness varies across the observed cross-section.
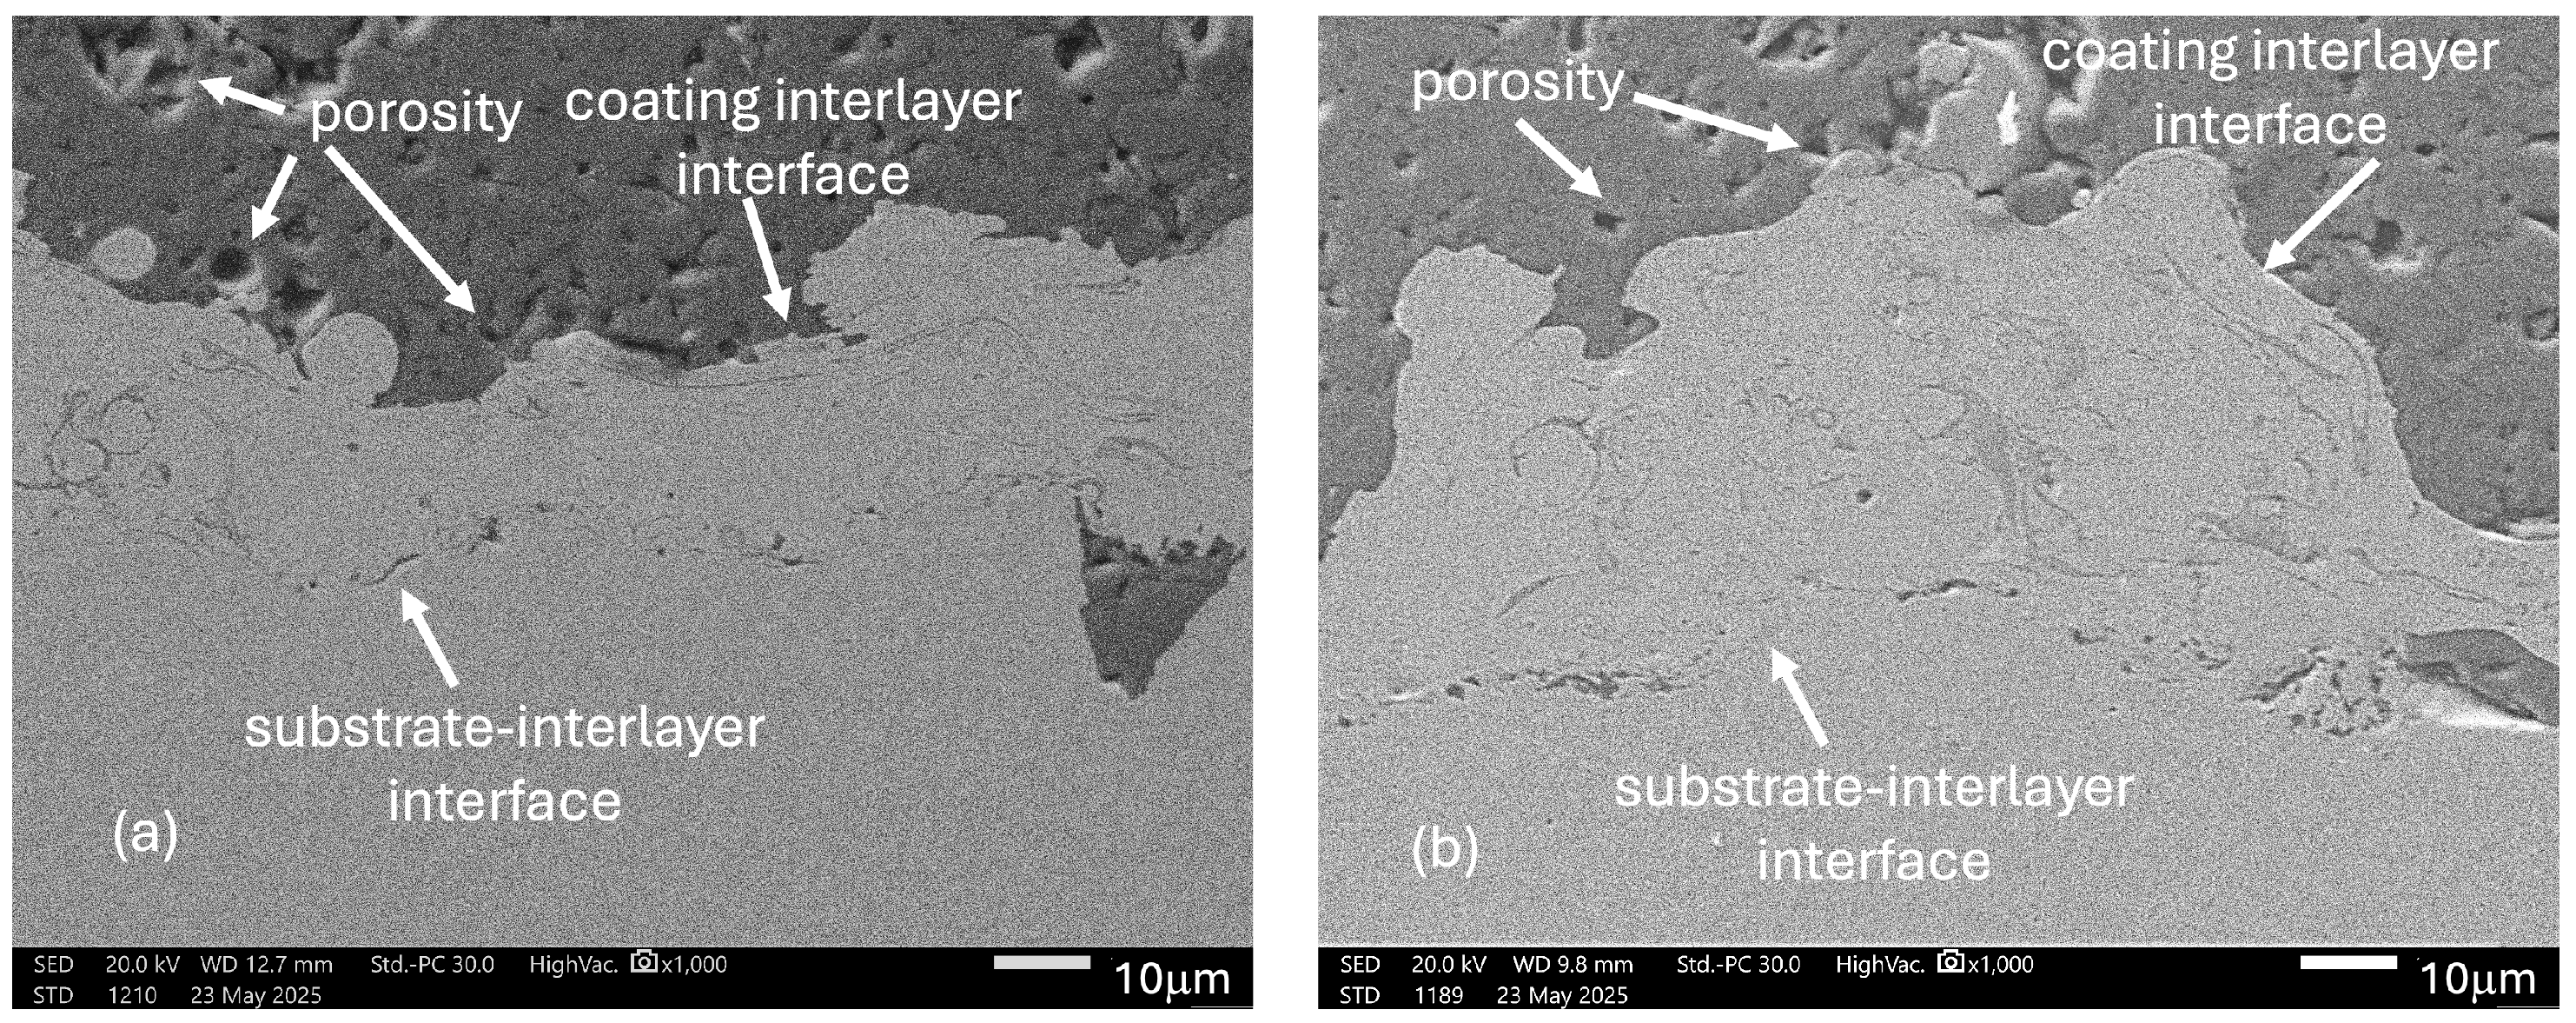
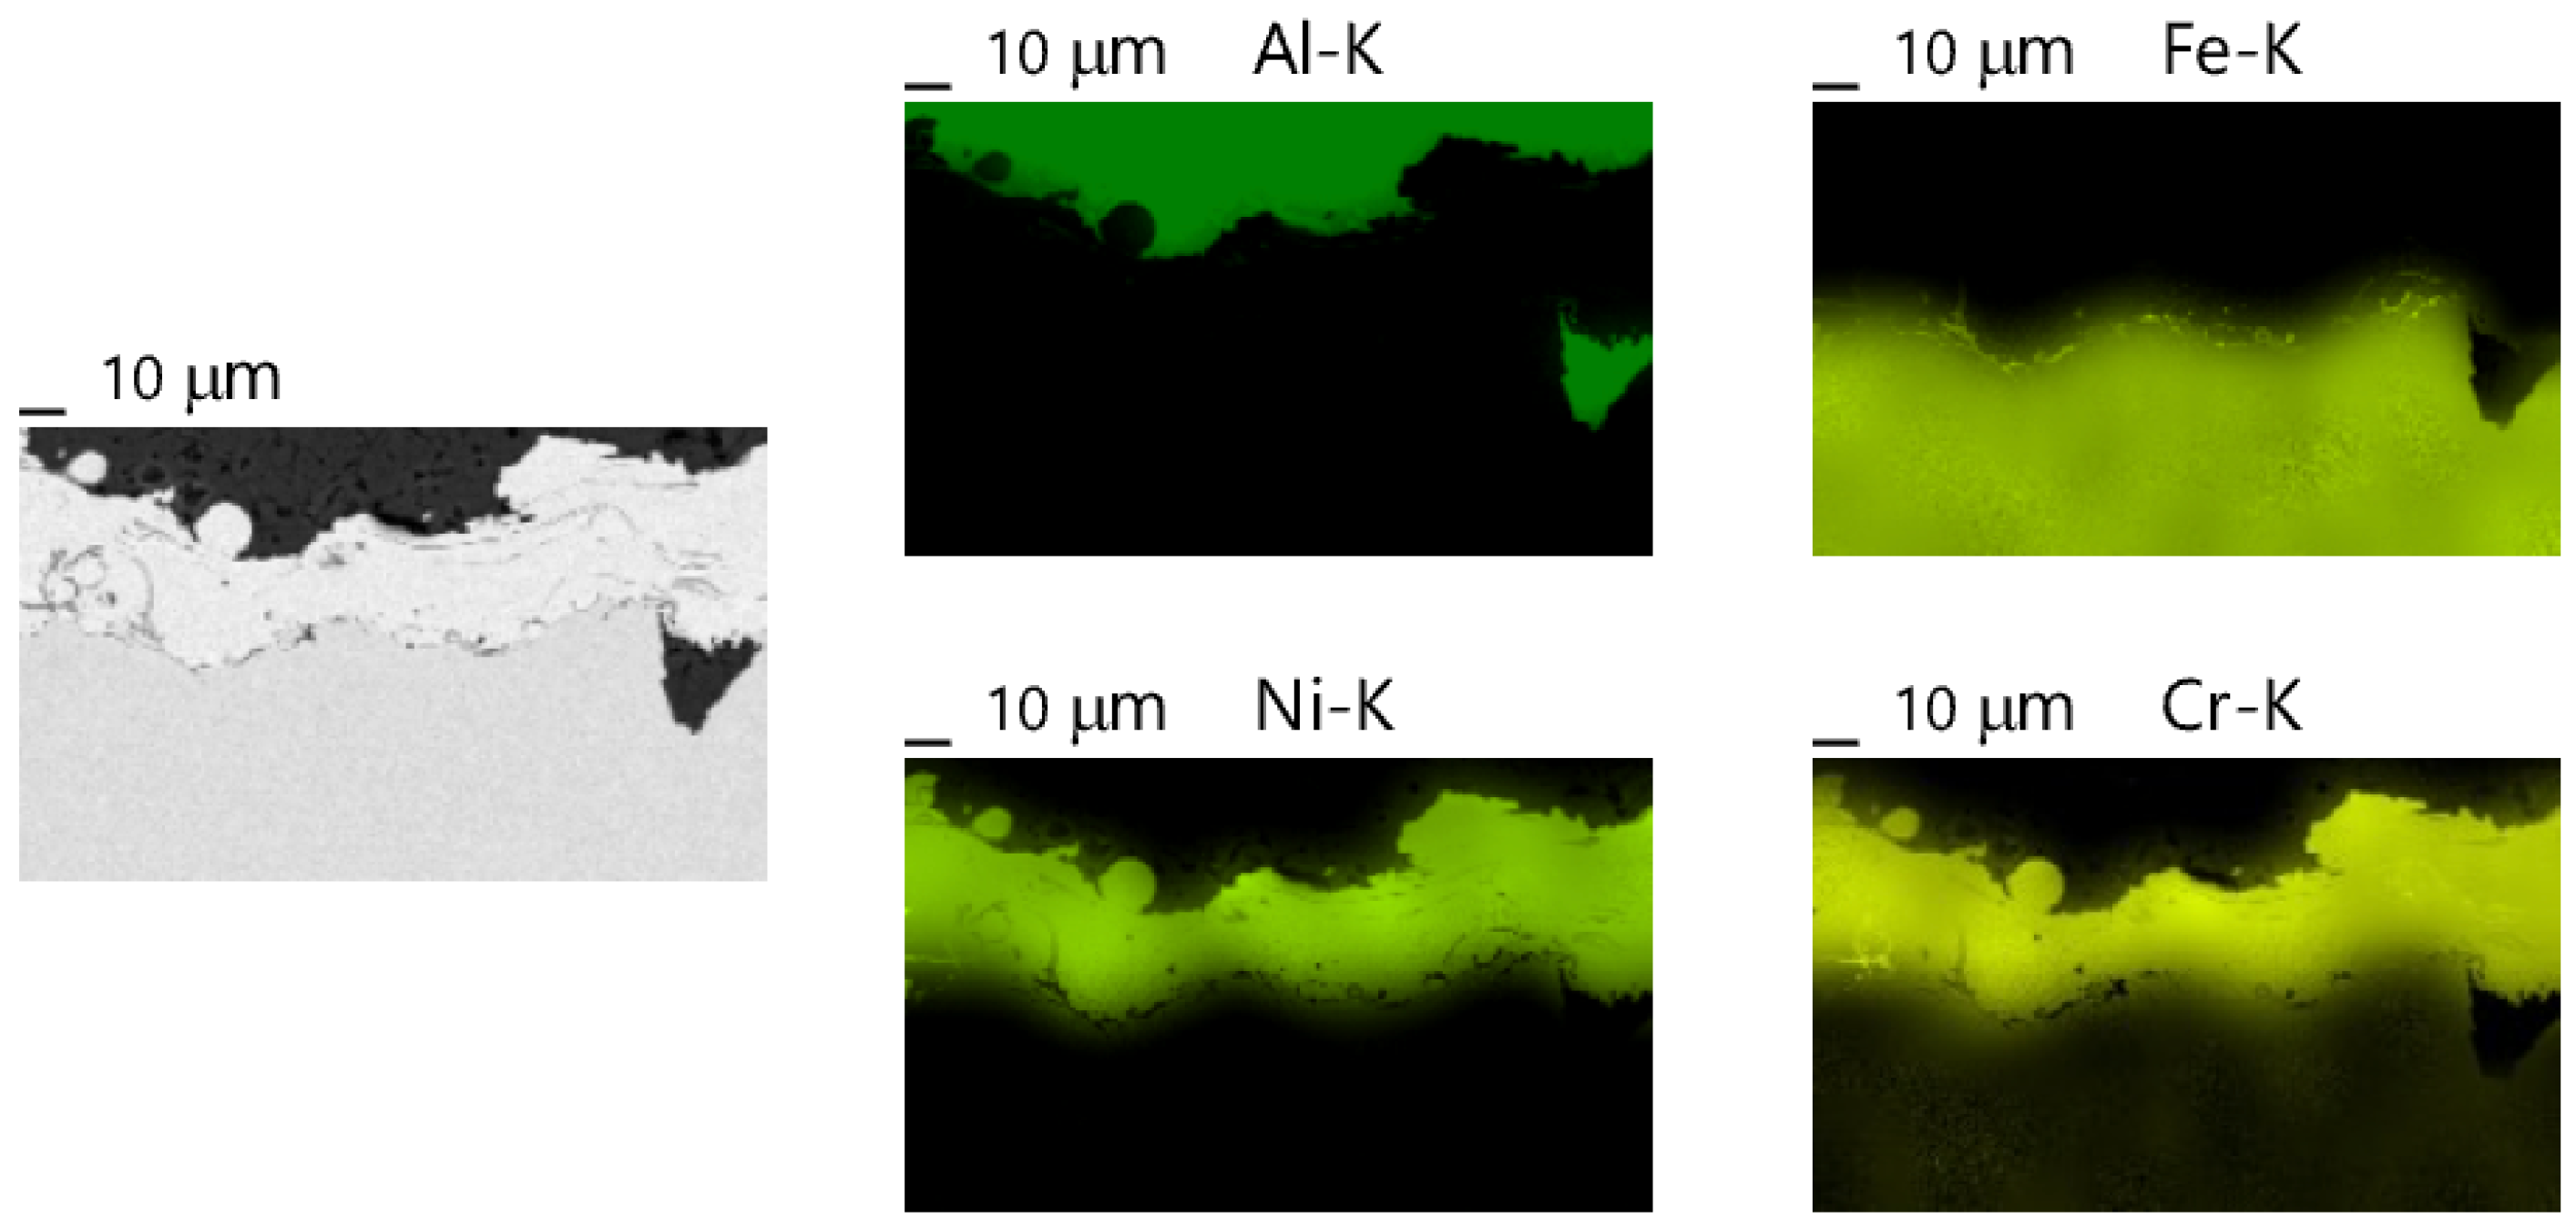
Figure 8 shows cross-sectional SEM images at 1000× magnification for Beam 3 (a) and Beam 4 (b). The images reveal that both the coating–interlayer and interlayer–substrate interfaces are continuous and display excellent adhesion [29], with no visible gaps or signs of delamination. A mechanical interlock forms between the A l 2 O 3 topcoat and the Ni interlayer when molten splats adhere to the roughened metal surface and engage its asperities [30,31]. Adding a Ni interlayer helps balance CTE mismatch strains at the coating–substrate interface and reduces interfacial cracking during cooling and operation [32]. EDS maps of the Beam 3 cross-sections at 1000×, shown in Figure 9, confirm the compositional separation between the alumina topcoat, Ni interlayer, and 100Cr6 steel substrate. The Al-K map not only exhibits a strong aluminium signal in the ceramic layer but also detects traces of alumina beneath the Ni-rich region, suggesting local infiltration or splat penetration into surface imperfections of the interlayer. The Ni-K signal clearly delineates the metallic interlayer, while Fe-K and Cr-K signals are limited to the steel substrate. The partial presence of alumina below the Ni interlayer supports the role of mechanical interlocking at the ceramic–metal interface. It may also indicate areas of incomplete interlayer coverage during spraying.
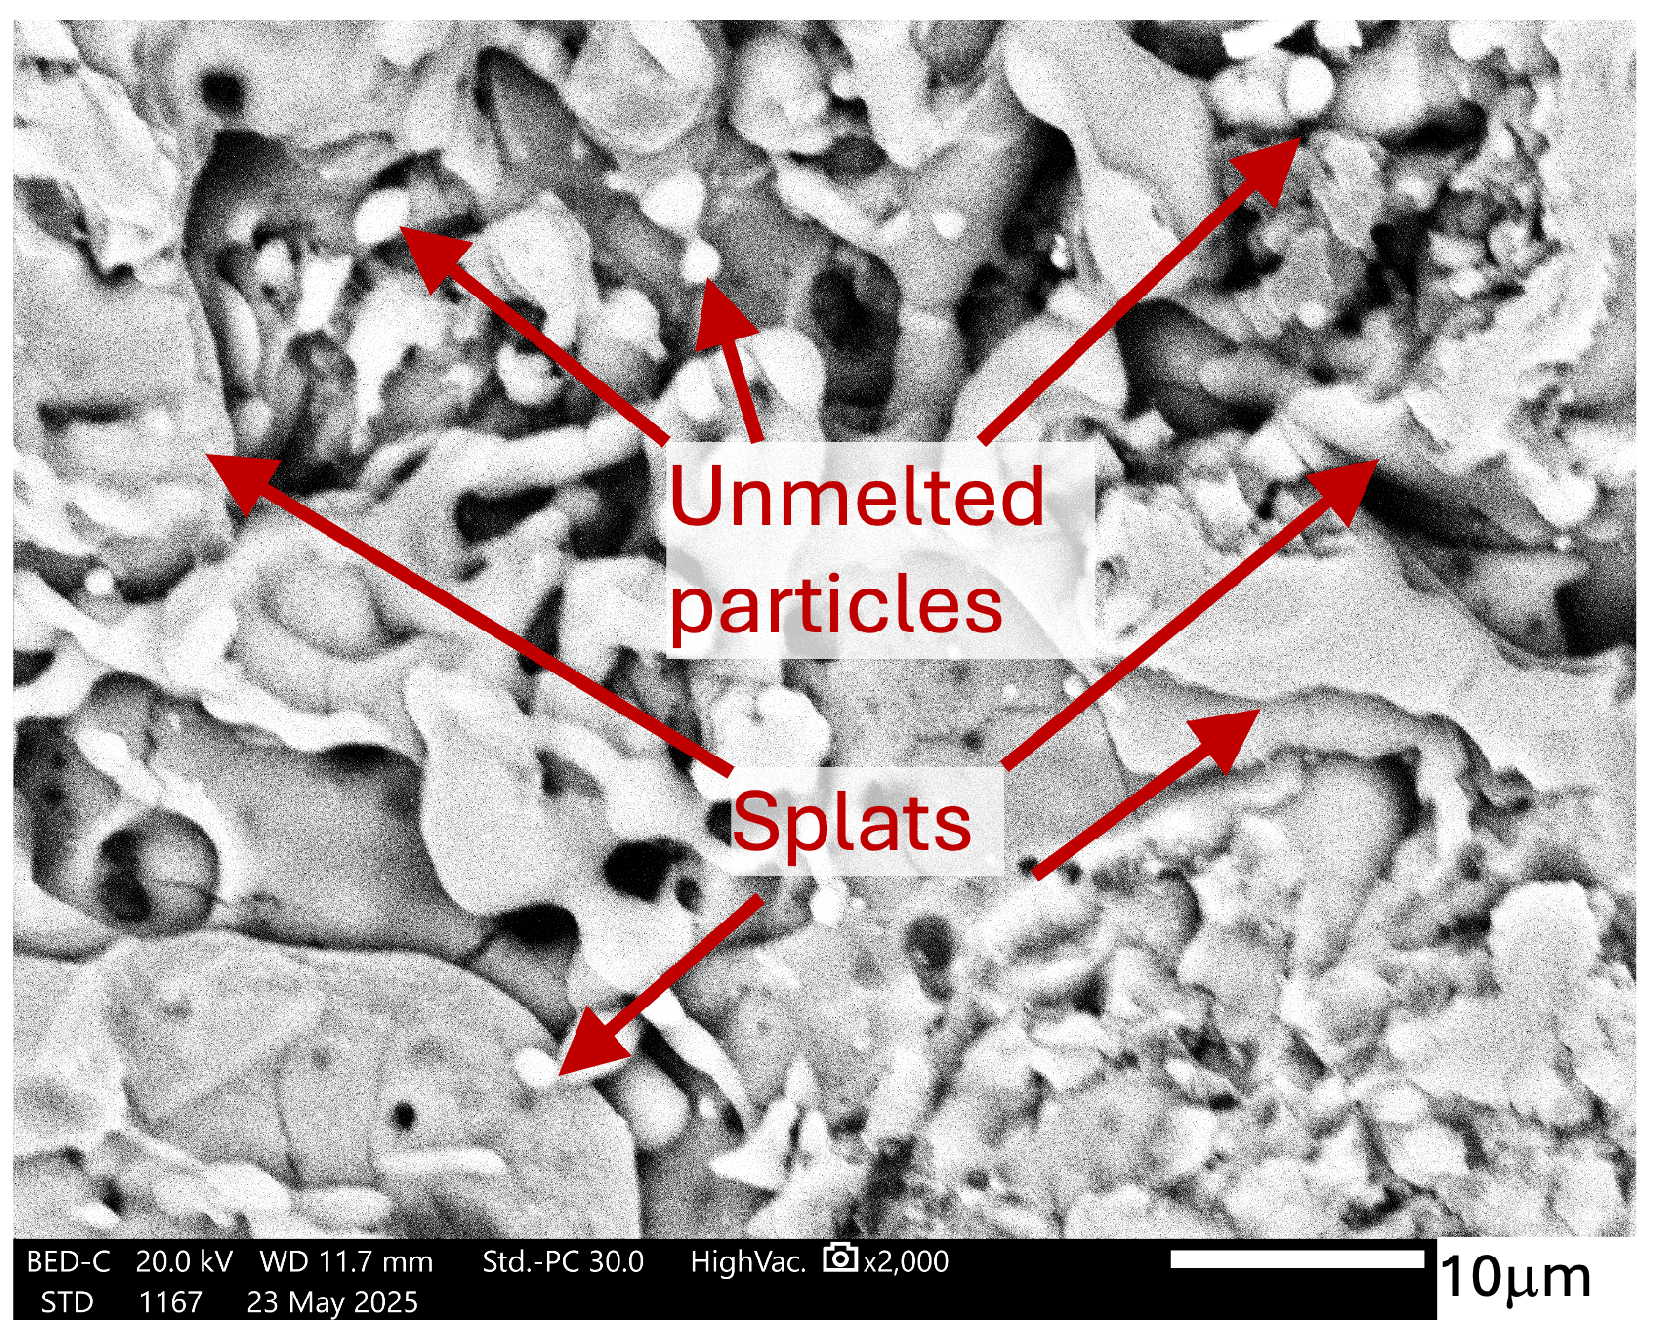
Figure 10 presents a 2000× SEM image of the surface of Beam 3 (500 µm, 45 kW). The surface shows larger splats with a typical cauliflower-like structure. This morphology was compared with earlier studies and found to be very similar [33,34].
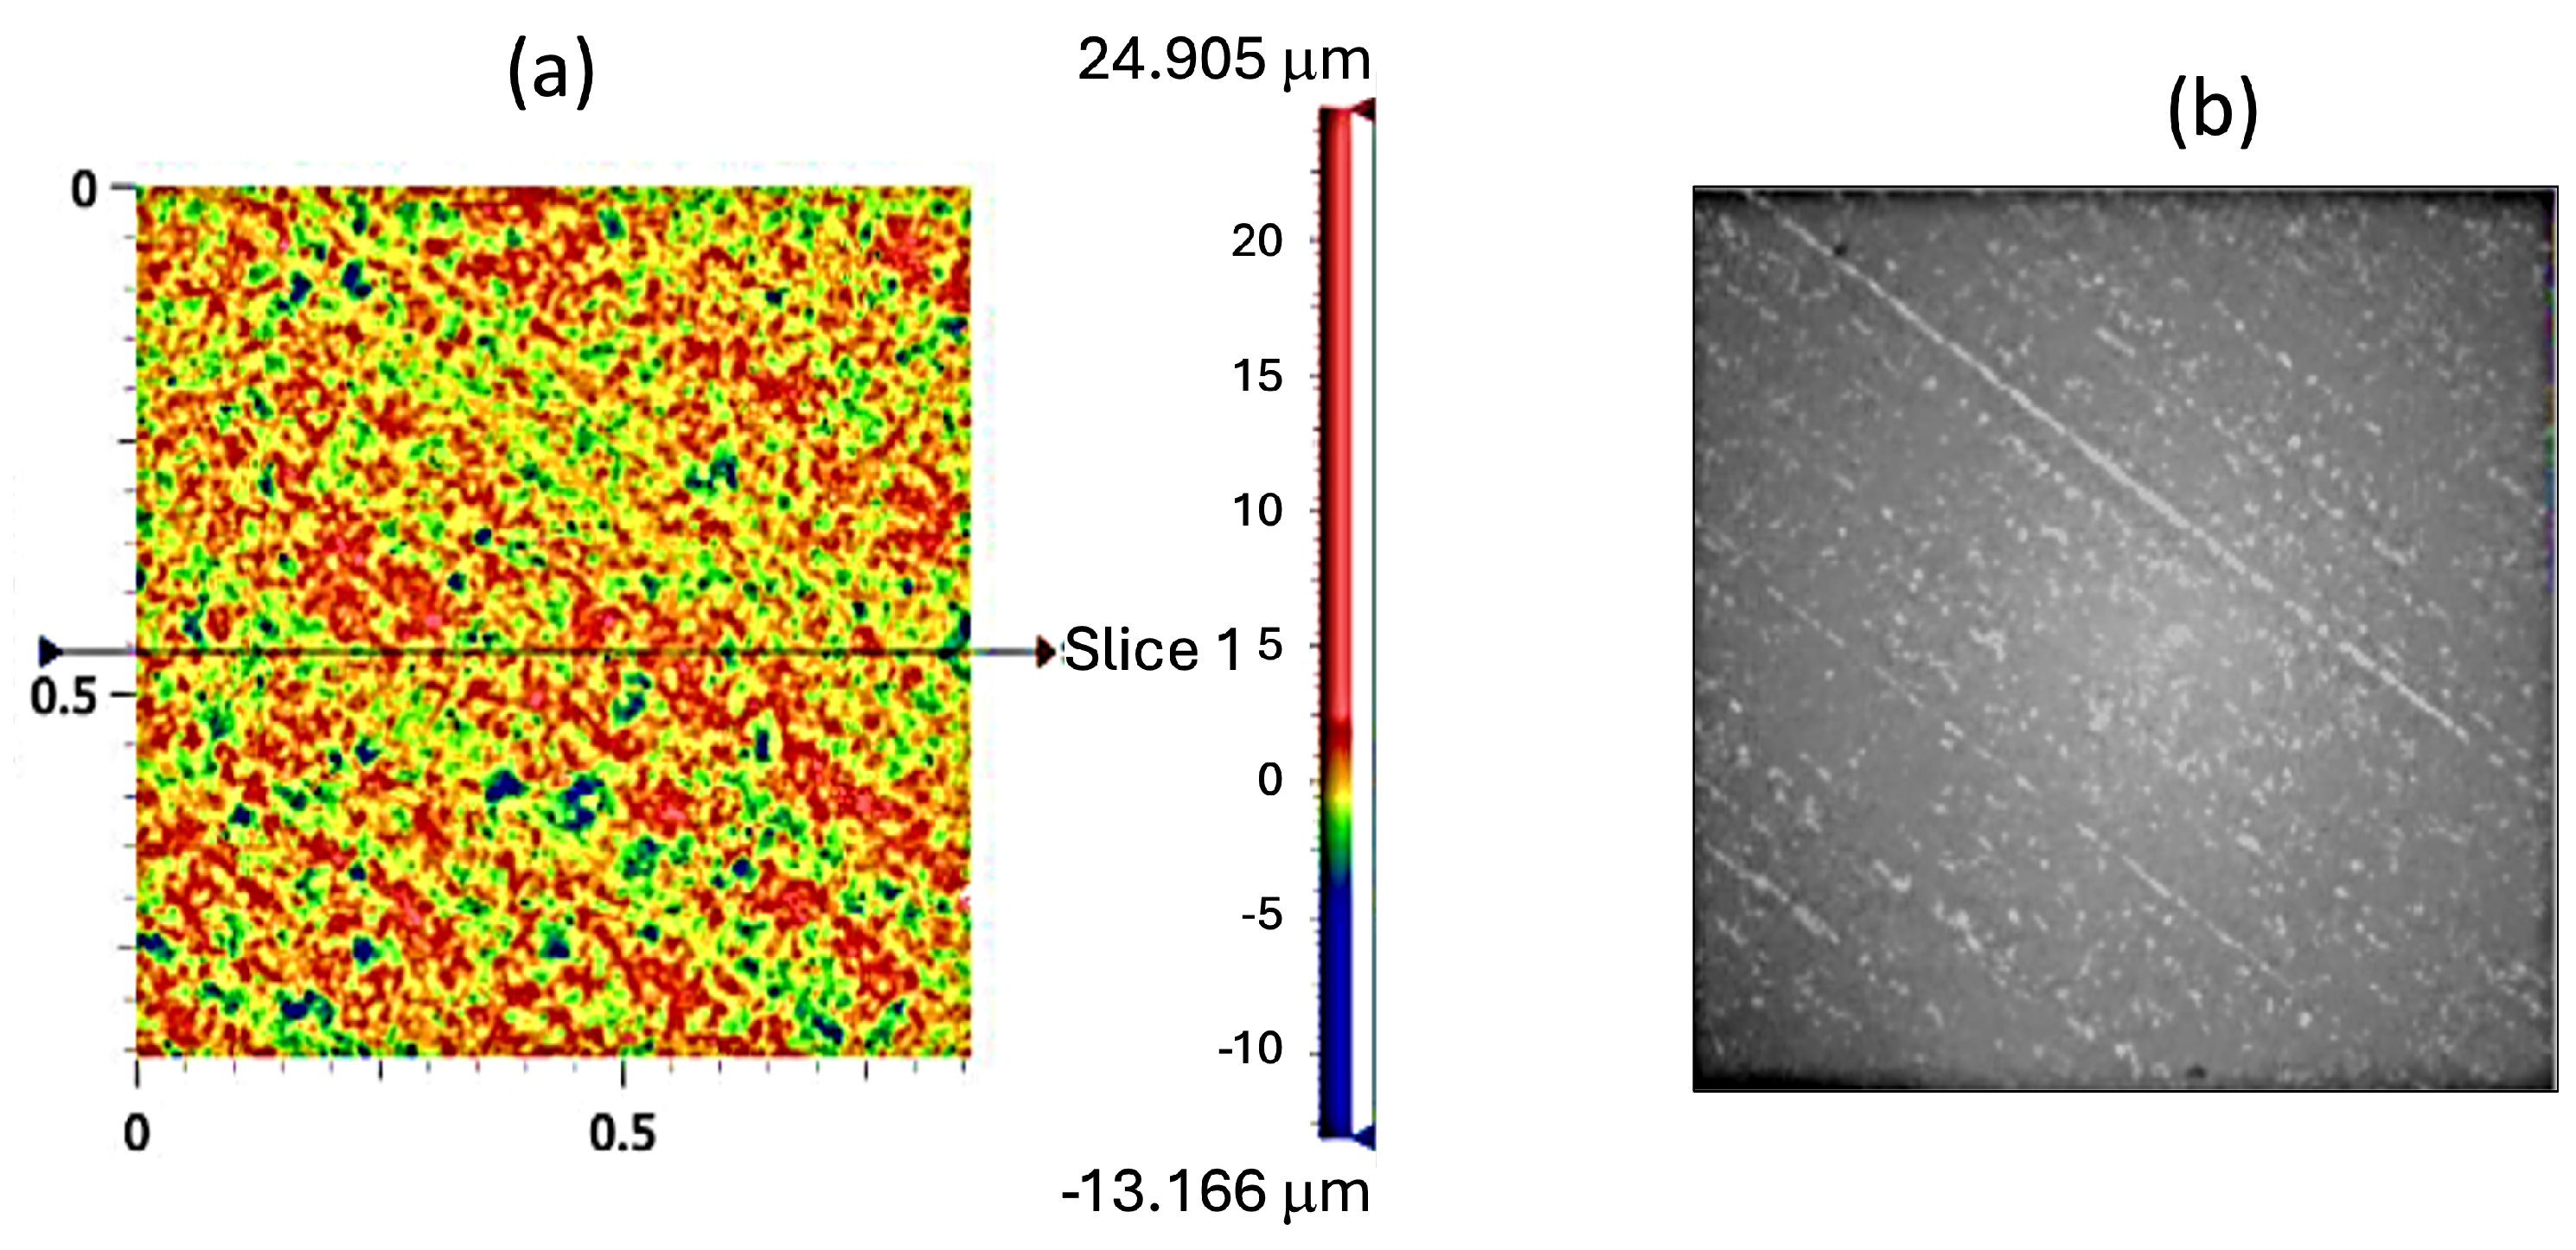
Table 4 and Figure 11 relate to roughness measurements. Each scanned area measured 0.861 mm by 0.861 mm on the disk samples, and the arithmetical mean surface roughness (Ra) was recorded. The average values from these five scans were calculated and are shown in Table 4 for all samples. Additionally, 3D topographic maps and surface profiles were created for each sample to visually assess the surface morphology, as shown in a representative image of disc 1 in Figure 11.
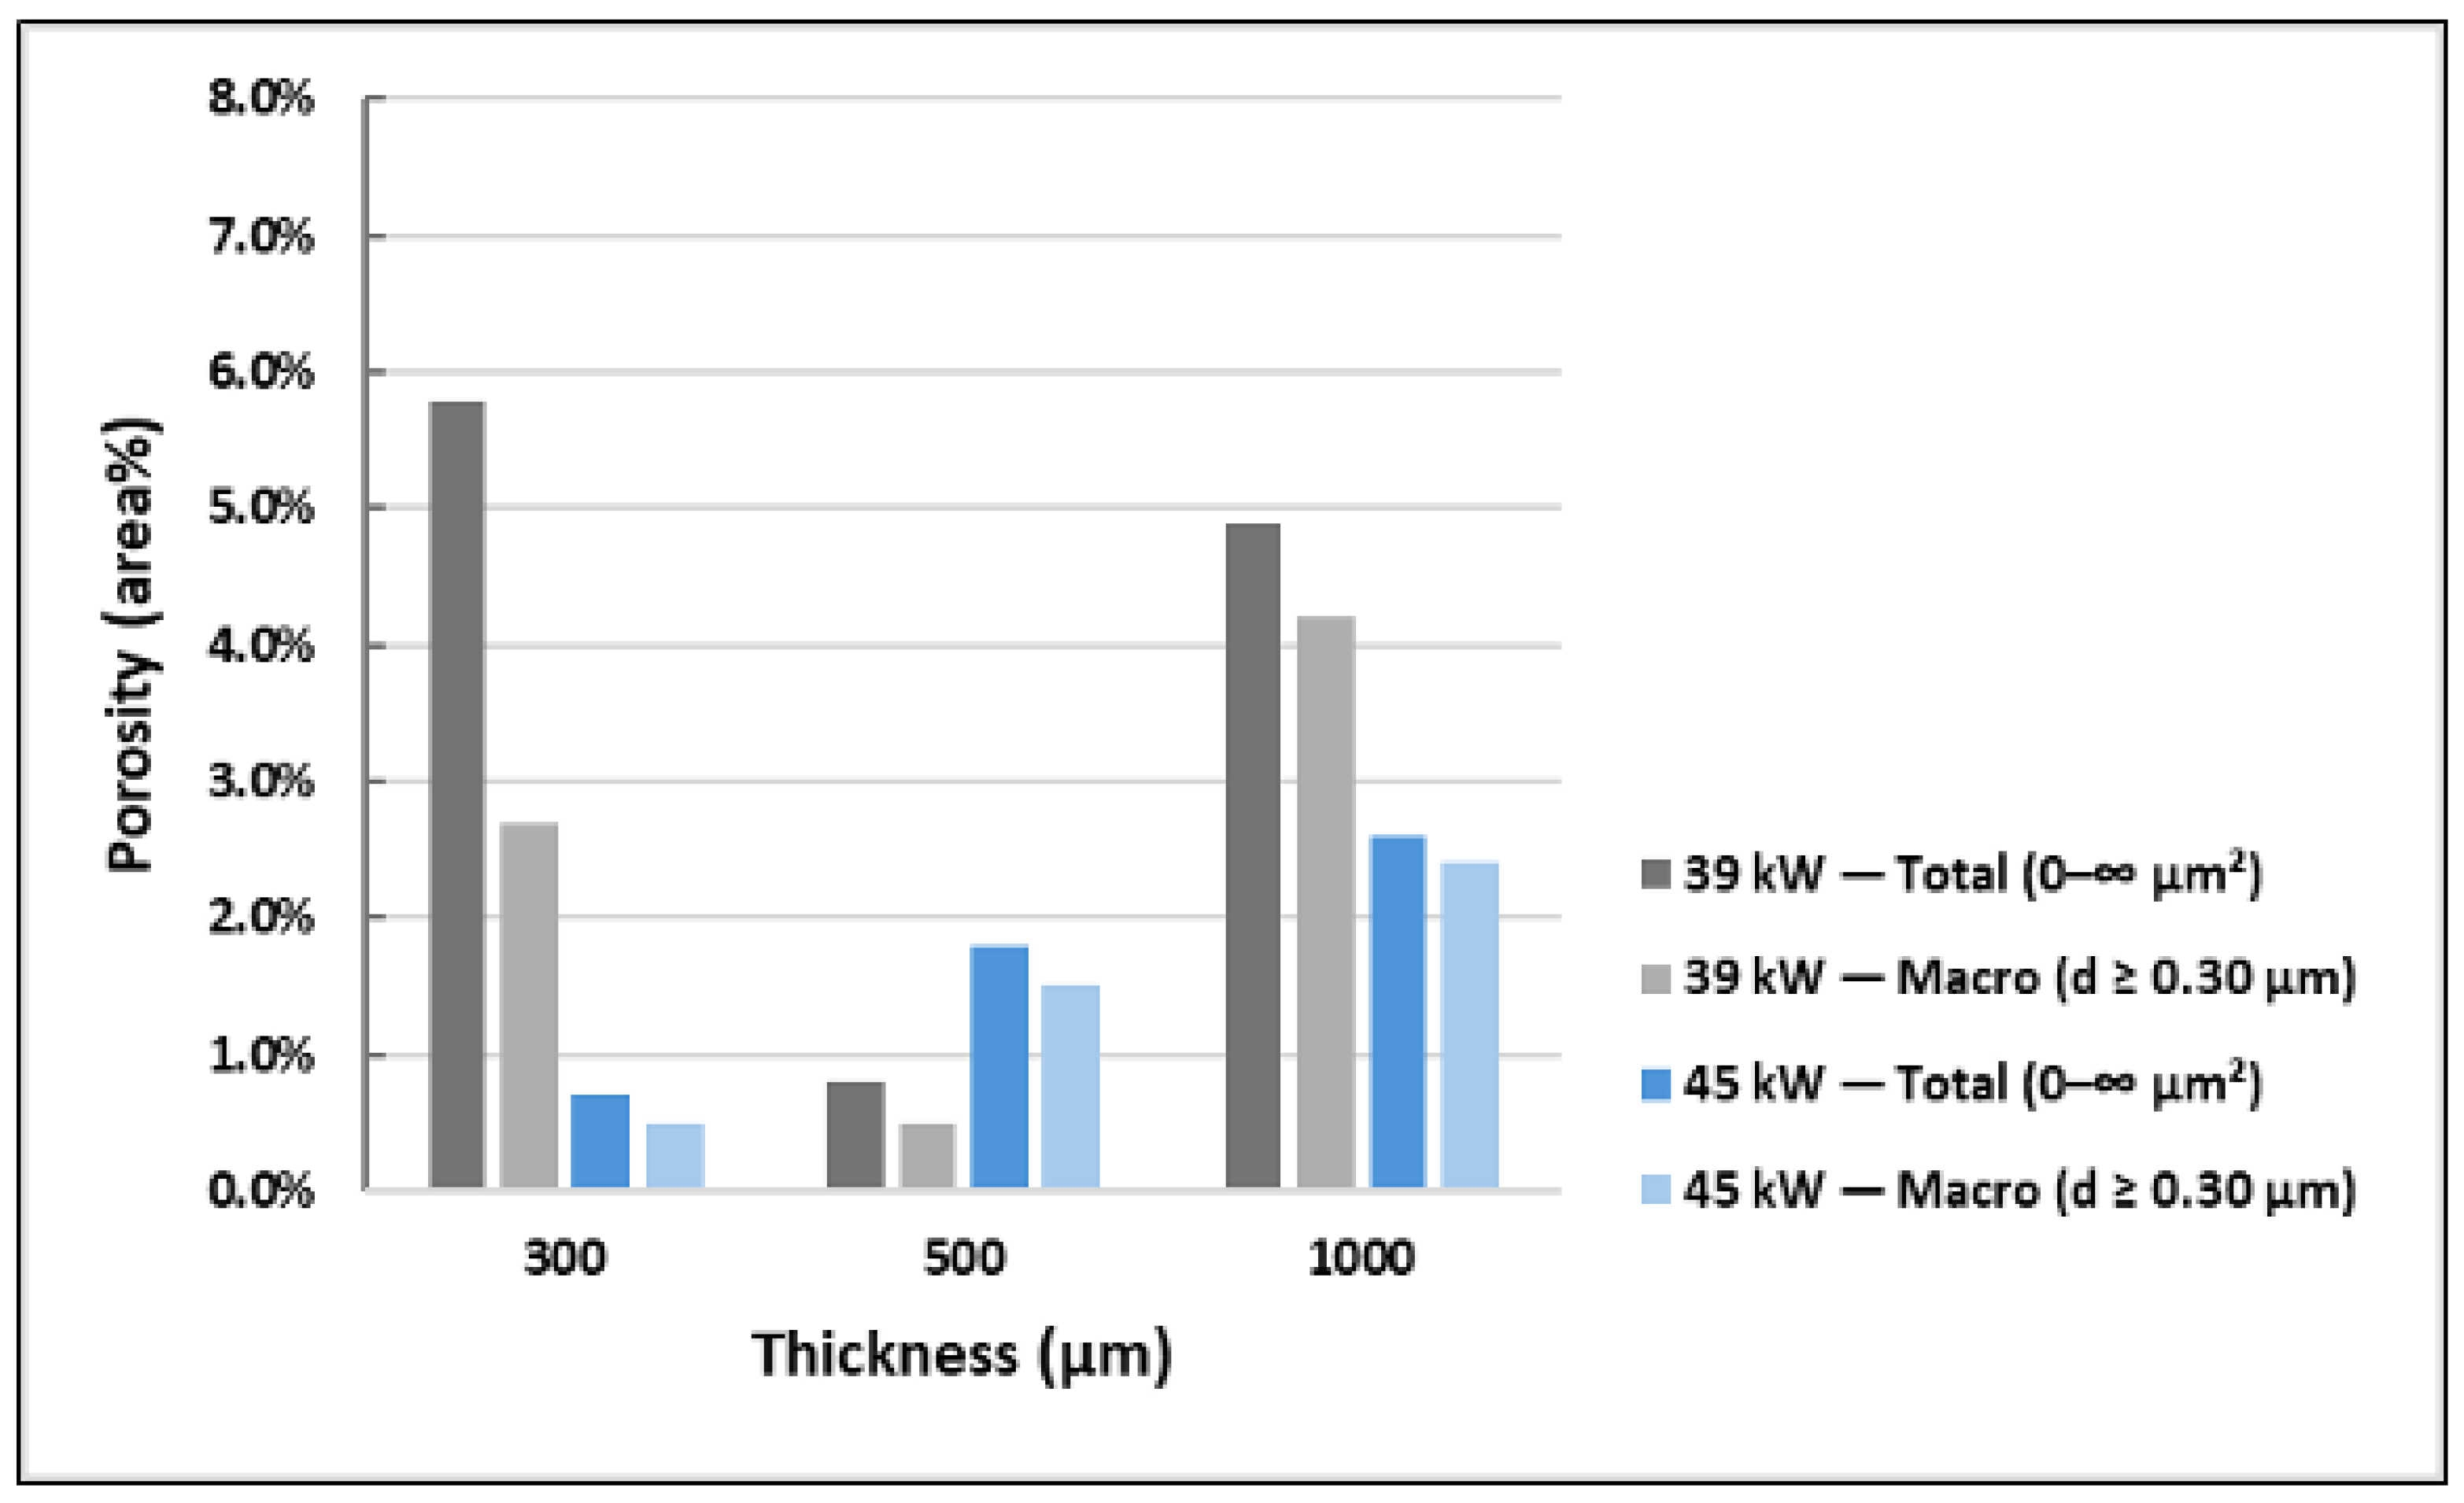
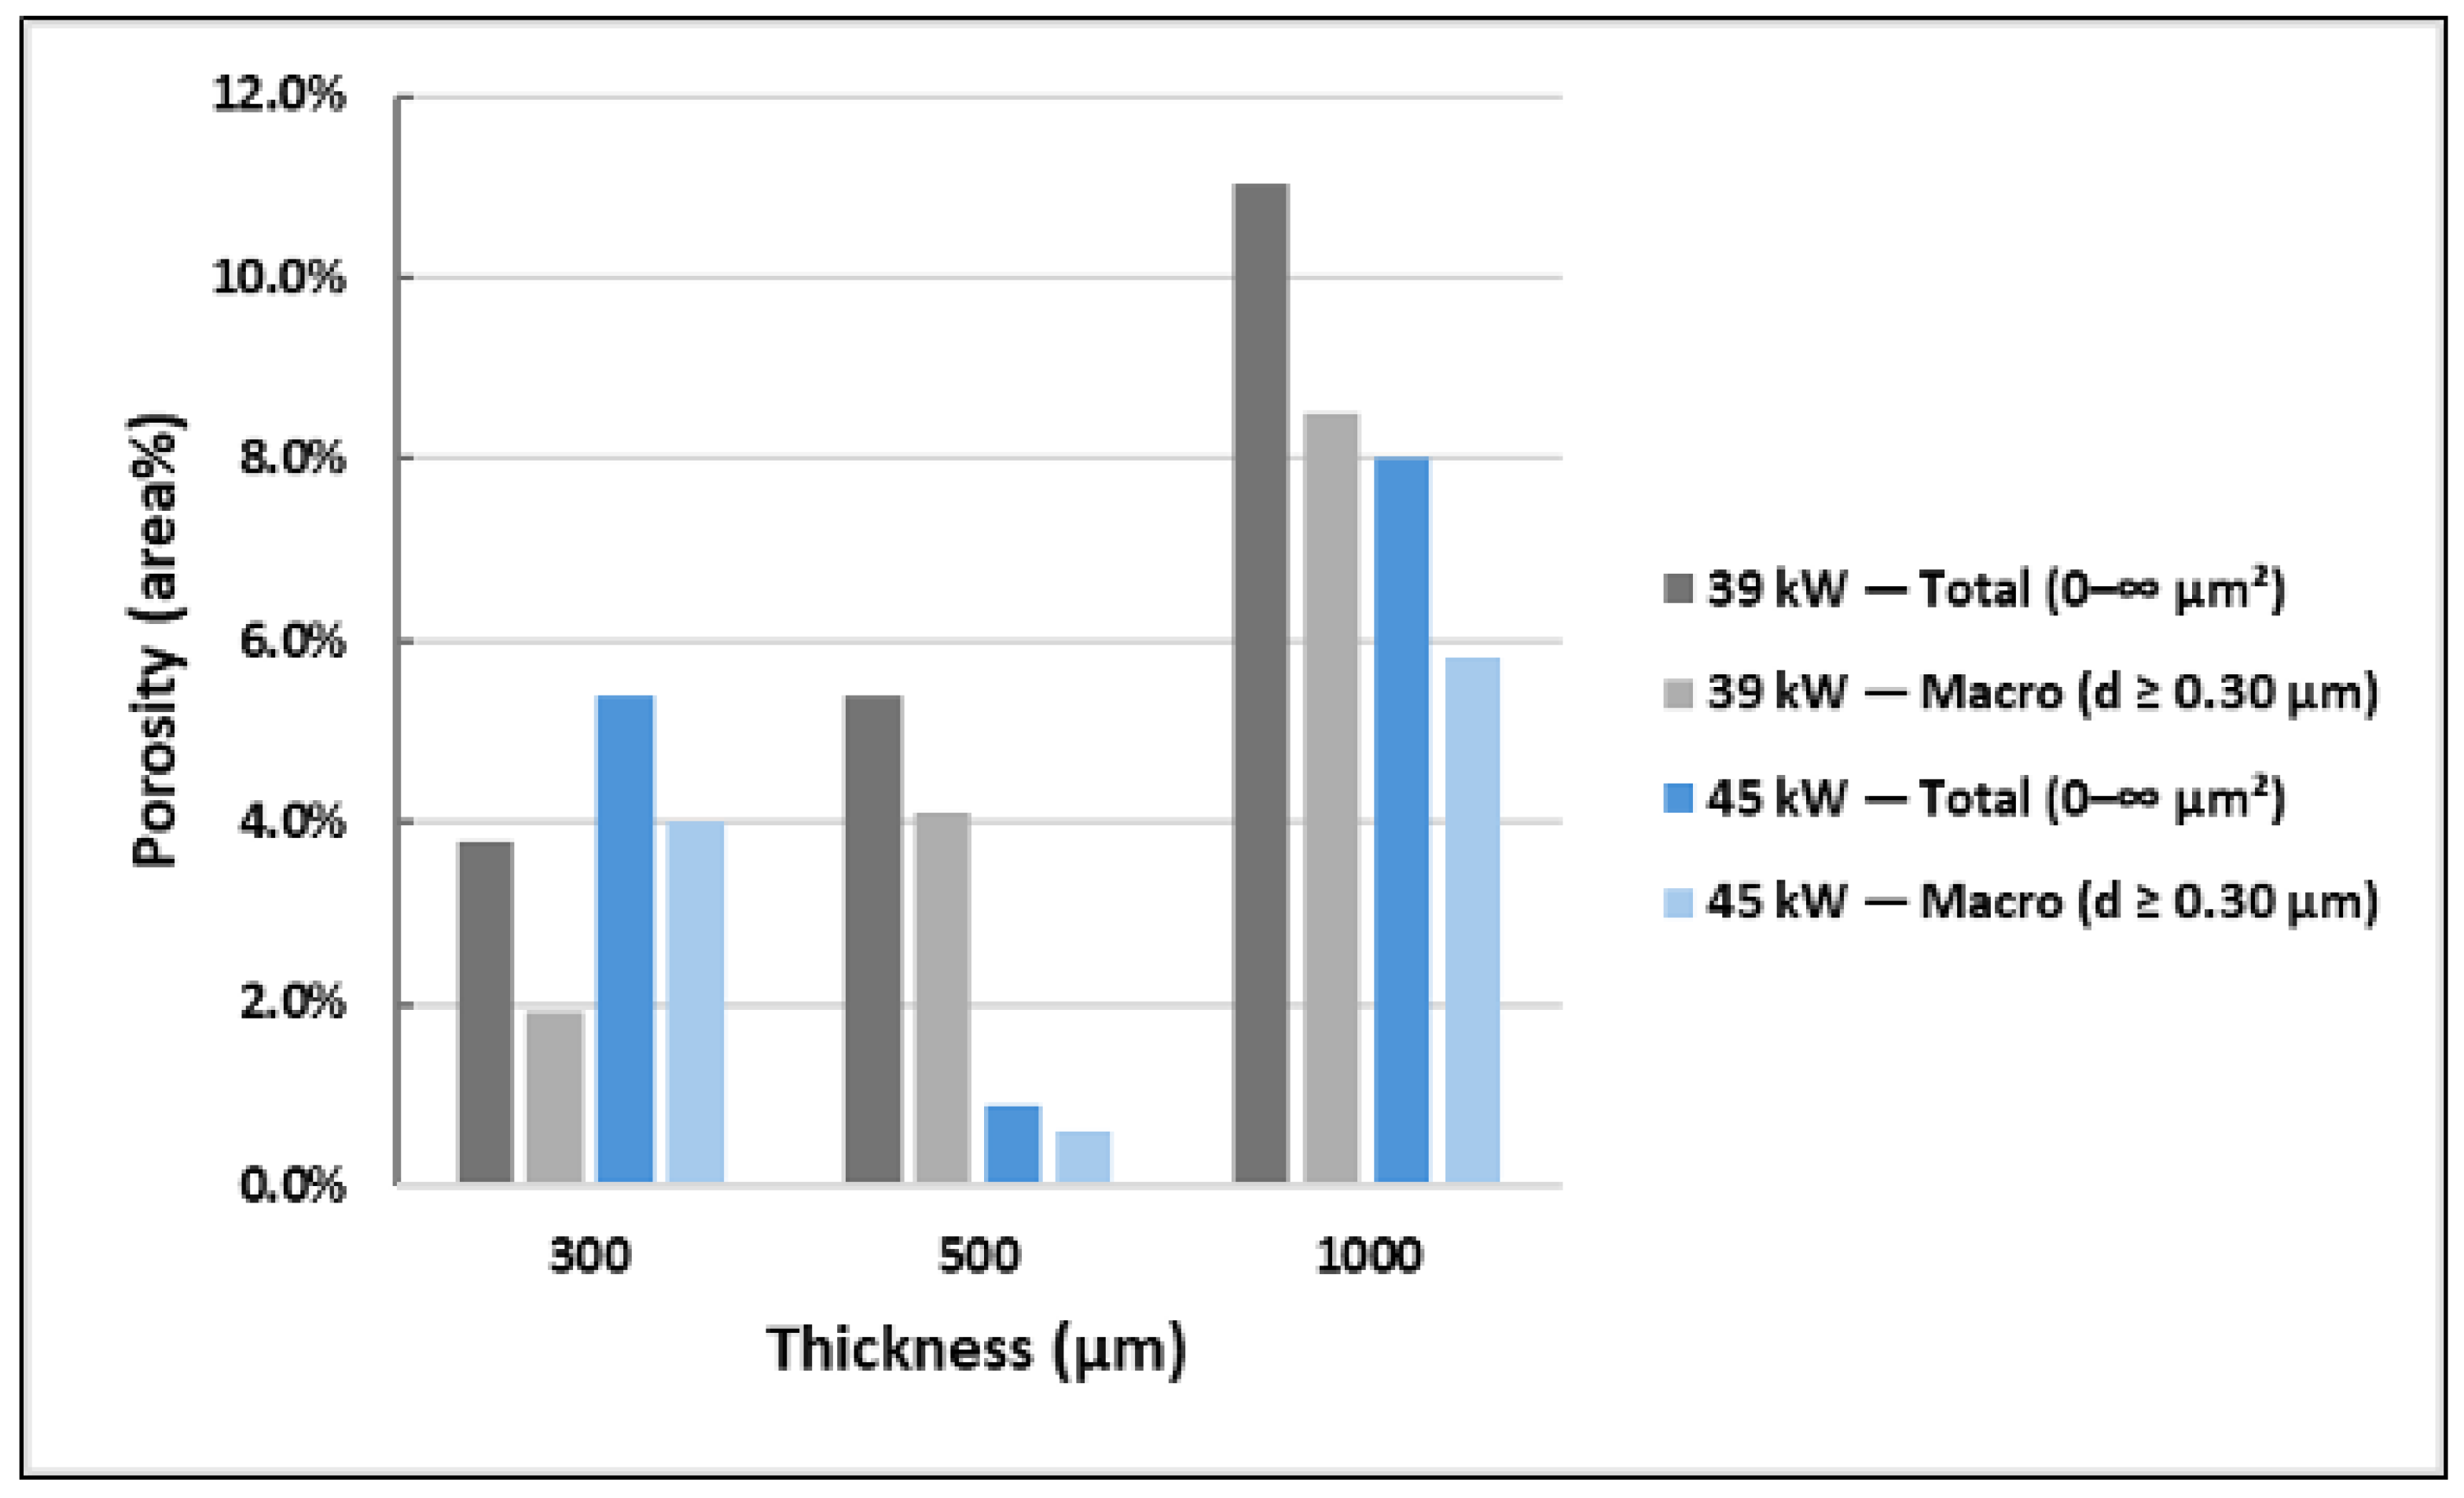
Table 4 and Figure 11 summarize the roughness results of the coated disk surfaces. The measured Ra values fall within a narrow range (0.93–1.18 μ m) across all six conditions, and no monotonic dependence on coating thickness (300–1000 μ m) or torch power (39 vs. 45 kW) is evident within the investigated window. Minor, non-monotonic variations are observed among conditions; however, the 3D maps/line profiles show faint unidirectional surface-preparation marks across all samples, indicating that the post-coating surface finishing process was performed by the coating company. In APS alumina coatings, torch power can influence roughness through changes in particle melting and splat formation; for example, Šuopys et al. reported a decrease in roughness with increasing torch power (29.4 to 45.1 kW) for plasma-sprayed A l 2 O 3 coatings [35]. Moreover, thermally sprayed coatings are frequently subjected to post-spray finishing (e.g., grinding/turning) to achieve a target surface quality, which can reduce the apparent sensitivity of roughness to deposition parameters in the final prepared surface state [36]. Additionally, the 3D profiles showed surface height differences of approximately 5–10 µm, indicating a notable increase in surface roughness compared to the original steel substrate before coating. The obtained roughness values of the coated cylinders show no significant trend related to coating thickness or plasma power. The roughness values suggest that, under the chosen spraying conditions, the surface topography was mainly influenced by the inherent APS deposition characteristics and subsequent surface finishing, rather than by changes in parameters such as thickness or power level. Qualitative analyses of the surface topographies also revealed unidirectional polishing marks across all samples, as shown in the 3D height maps and line profiles (Figure 11). These linear streaks are likely caused by the post-coating surface finishing process performed by the coating company. Porosity was evaluated from SEM images using ImageJ. Polished cross-sections were imaged in BSE mode, and as-sprayed surfaces in SE2 mode at 2000× magnification. Two size-based metrics were reported for each condition: (i) total porosity (Size = 0–∞ µm2) and (ii) macro-porosity (size ≥ 0.0707 µm2; equivalent diameter ≥ 0.30 µm). For surfaces, five independent fields were analysed and averaged. For cross-sections with only one available field, porosity was averaged over a 3 × 3 grid of ROIs across the coating thickness and reported as the mean. Figure 12 and Figure 13 display the results of the porosity analysis.
In cross-sectional porosity analysis, increasing plasma power from 39 to 45 kW generally reduces internal (interlamellar) porosity and correlates with the observed rise in hardness, except at 500 µm, where porosity is higher at 45 kW. The main trend aligns with higher particle temperatures at increased torch power, which promotes splat melting and bonding, thereby decreasing voids and increasing hardness [37,38,39]. The exception at 500 µm is not attributed to a unique origin. One plausible explanation reported for APS ceramics is that, under higher particle temperatures and rapid solidification, limited outgassing may promote a shift in pore population (e.g., more rounded pores), which can increase the measured 2D area fraction even if inter-splat porosity is locally reduced [40]. However, additional factors may also contribute to this phenomenon, including local deposition/reheating history at intermediate thickness, variability in splat stacking/inter-splat bonding, and the sensitivity of 2D image-based porosity to specimen preparation and thresholding; therefore, the interpretation is discussed as a hypothesis rather than a single definitive mechanism. These mechanisms, along with the inverse porosity–hardness relationship in APS ceramics, are well documented [40]. In surface porosity analysis, open-pit surface porosity exhibits a different pattern: at 300 µm, it is higher at 45 kW (more and larger pits), whereas at 500 and 1000 µm, it is lower at 45 kW [39]. SEM surface imaging emphasizes topographic features; therefore, surface-connected cavities (open pits) associated with splat impact/splashing or local outgassing can be prominent on the surface, even when the bulk cross-section appears to be less porous. SE2 highlights topography; therefore, open cavities caused by hot splat splashing or volatile release are prominently captured on the surface, even when the bulk section appears denser.

3.2. Mechanical Properties and Failure Modes

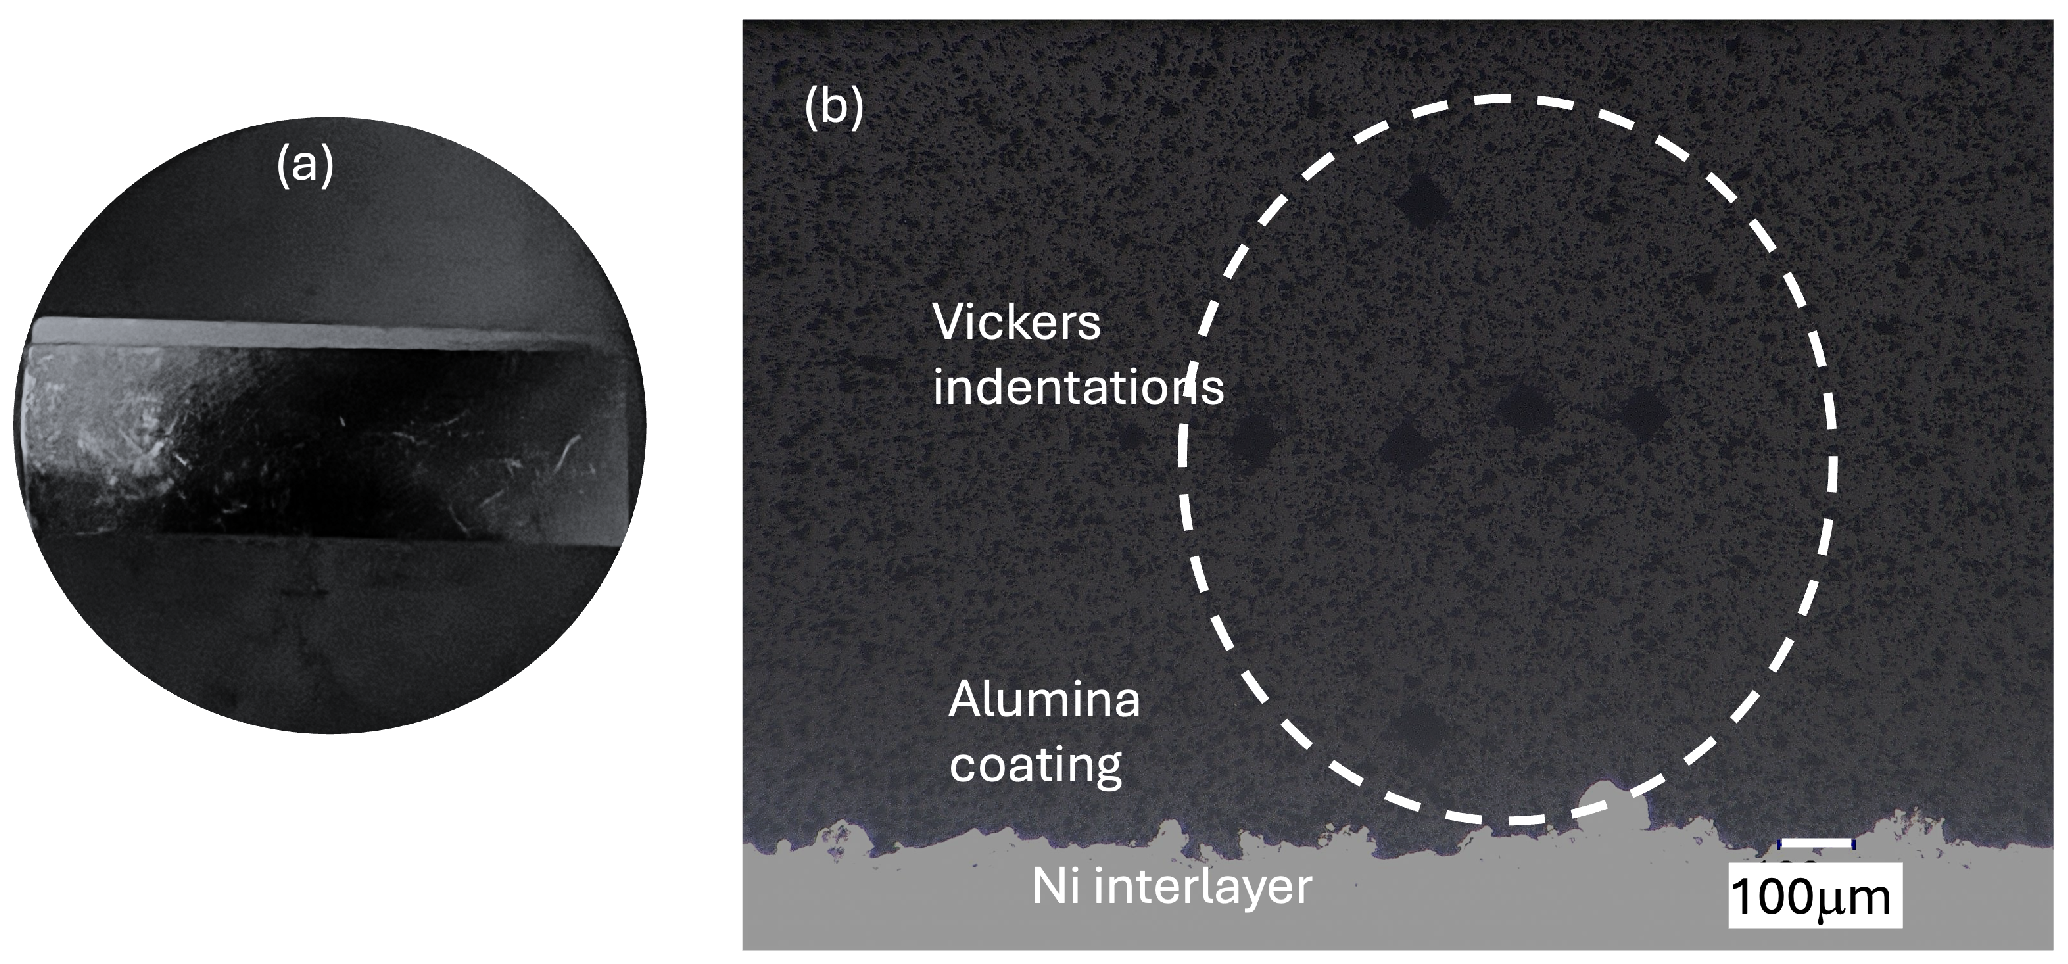
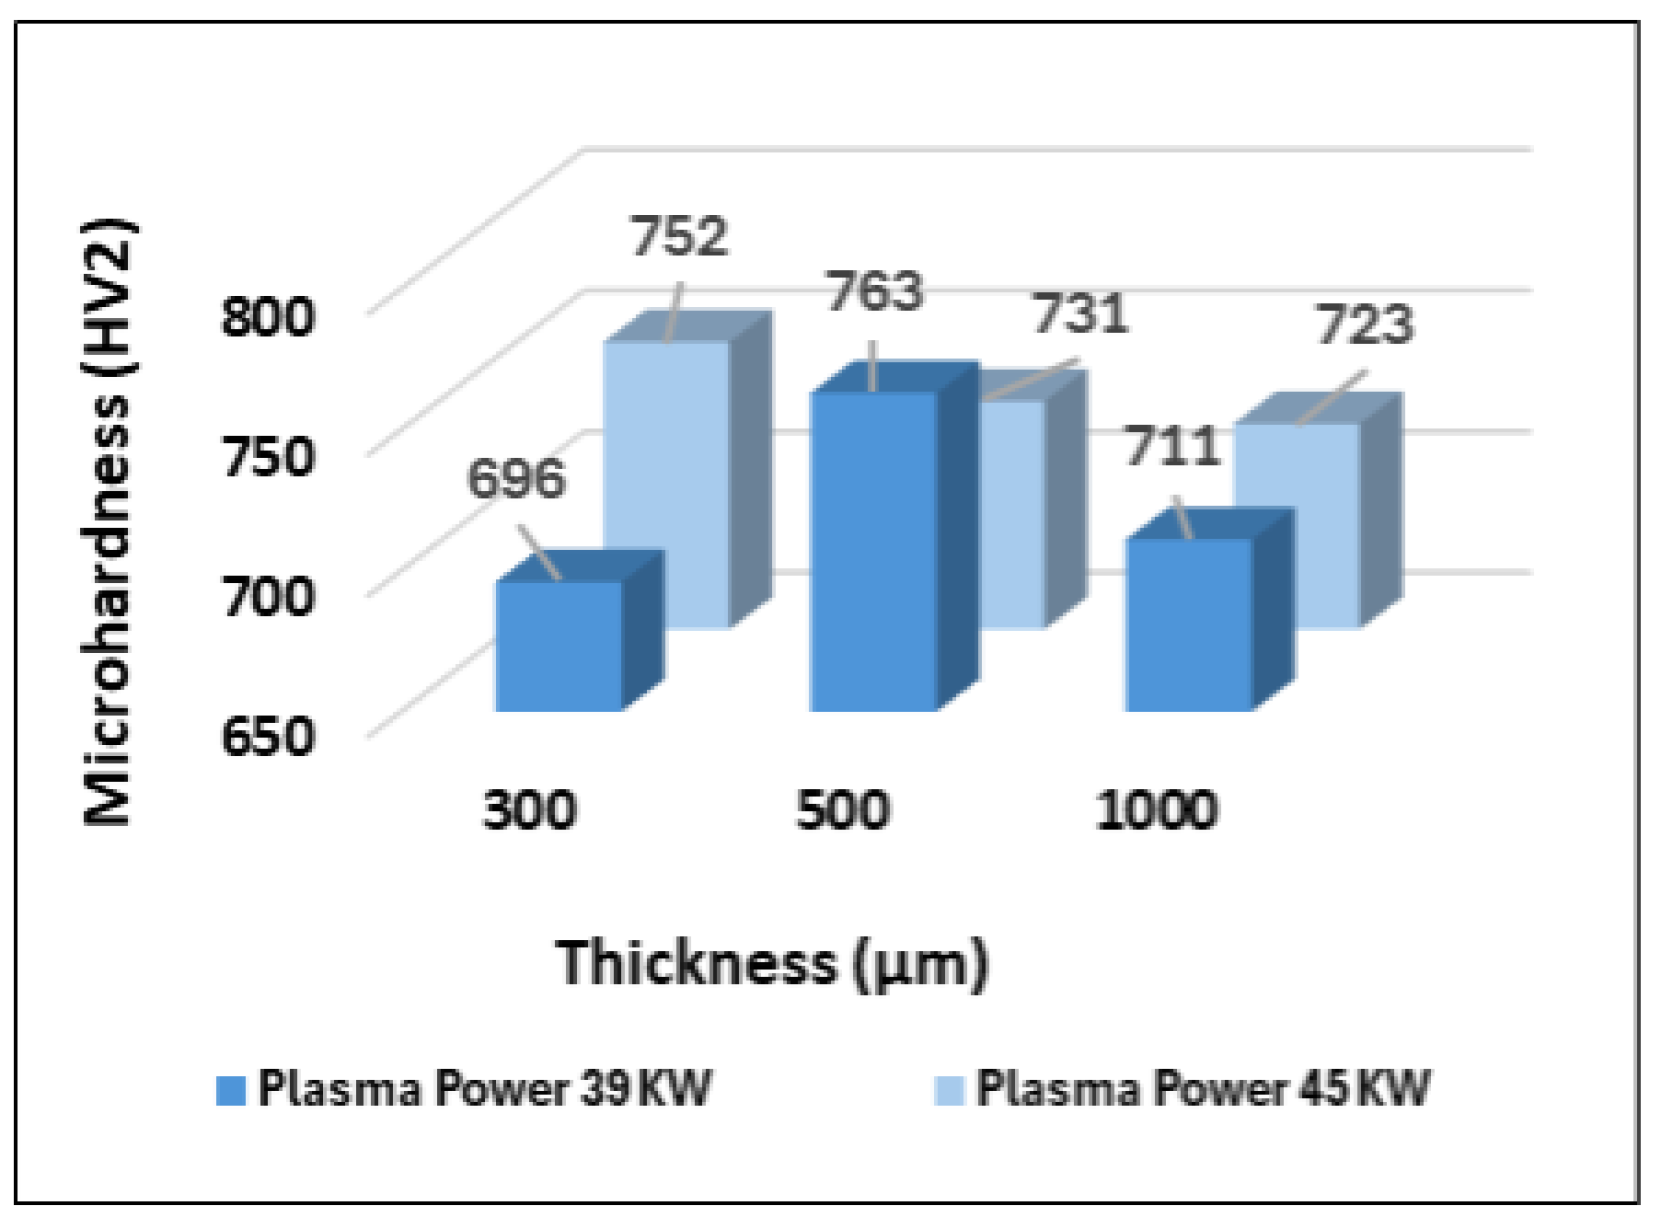
Hardness tests were performed on polished cross-sections of the coated beam specimens to evaluate the hardness of the alumina coatings. The samples were embedded in resin and gradually ground and polished to achieve a smooth cross-sectional surface (Figure 14). This method was chosen to eliminate any influence from the steel substrate and to facilitate hardness measurements near the coating–substrate interface. Vickers indentations were made using a load of 2 kg (HV2); lower loads produced indents that were too small to be reliably distinguished on the dark, porous coating microstructure. The hardness measured values are reported in Figure 15. These values were consistently lower than those typically reported in the literature for dense sintered alumina, approximately 18–20 GPa (≃1800–2000 HV) [41]. The low particle velocity in the APS process resulted in poor interlamellar adhesion and significant splat fragmentation. Consequently, splat fragmentation creates interlamellar gaps and increases porosity, ultimately reducing the coating’s hardness [42].
The 500 µm coatings reached the highest hardness (≃783 HV at 45 kW, 752 HV at 39 kW). Thinner (300 µm) coatings are softer (698–752 HV), likely due to incomplete lamella overlap and higher surface-connected porosity. Thicker (1000 µm) coatings also show reduced hardness (711–731 HV), attributed to higher residual stresses, microcracking and pore coalescence with increasing thickness. At all thicknesses, 45 kW consistently yields higher hardness than 39 kW, owing to higher particle melting, better splat flattening and a denser microstructure. However, at 1000 µm, the power effect diminishes (723 vs. 711 HV), since thickness-driven stresses and defects dominate over plasma conditions [37].

3.3. Bending Tests

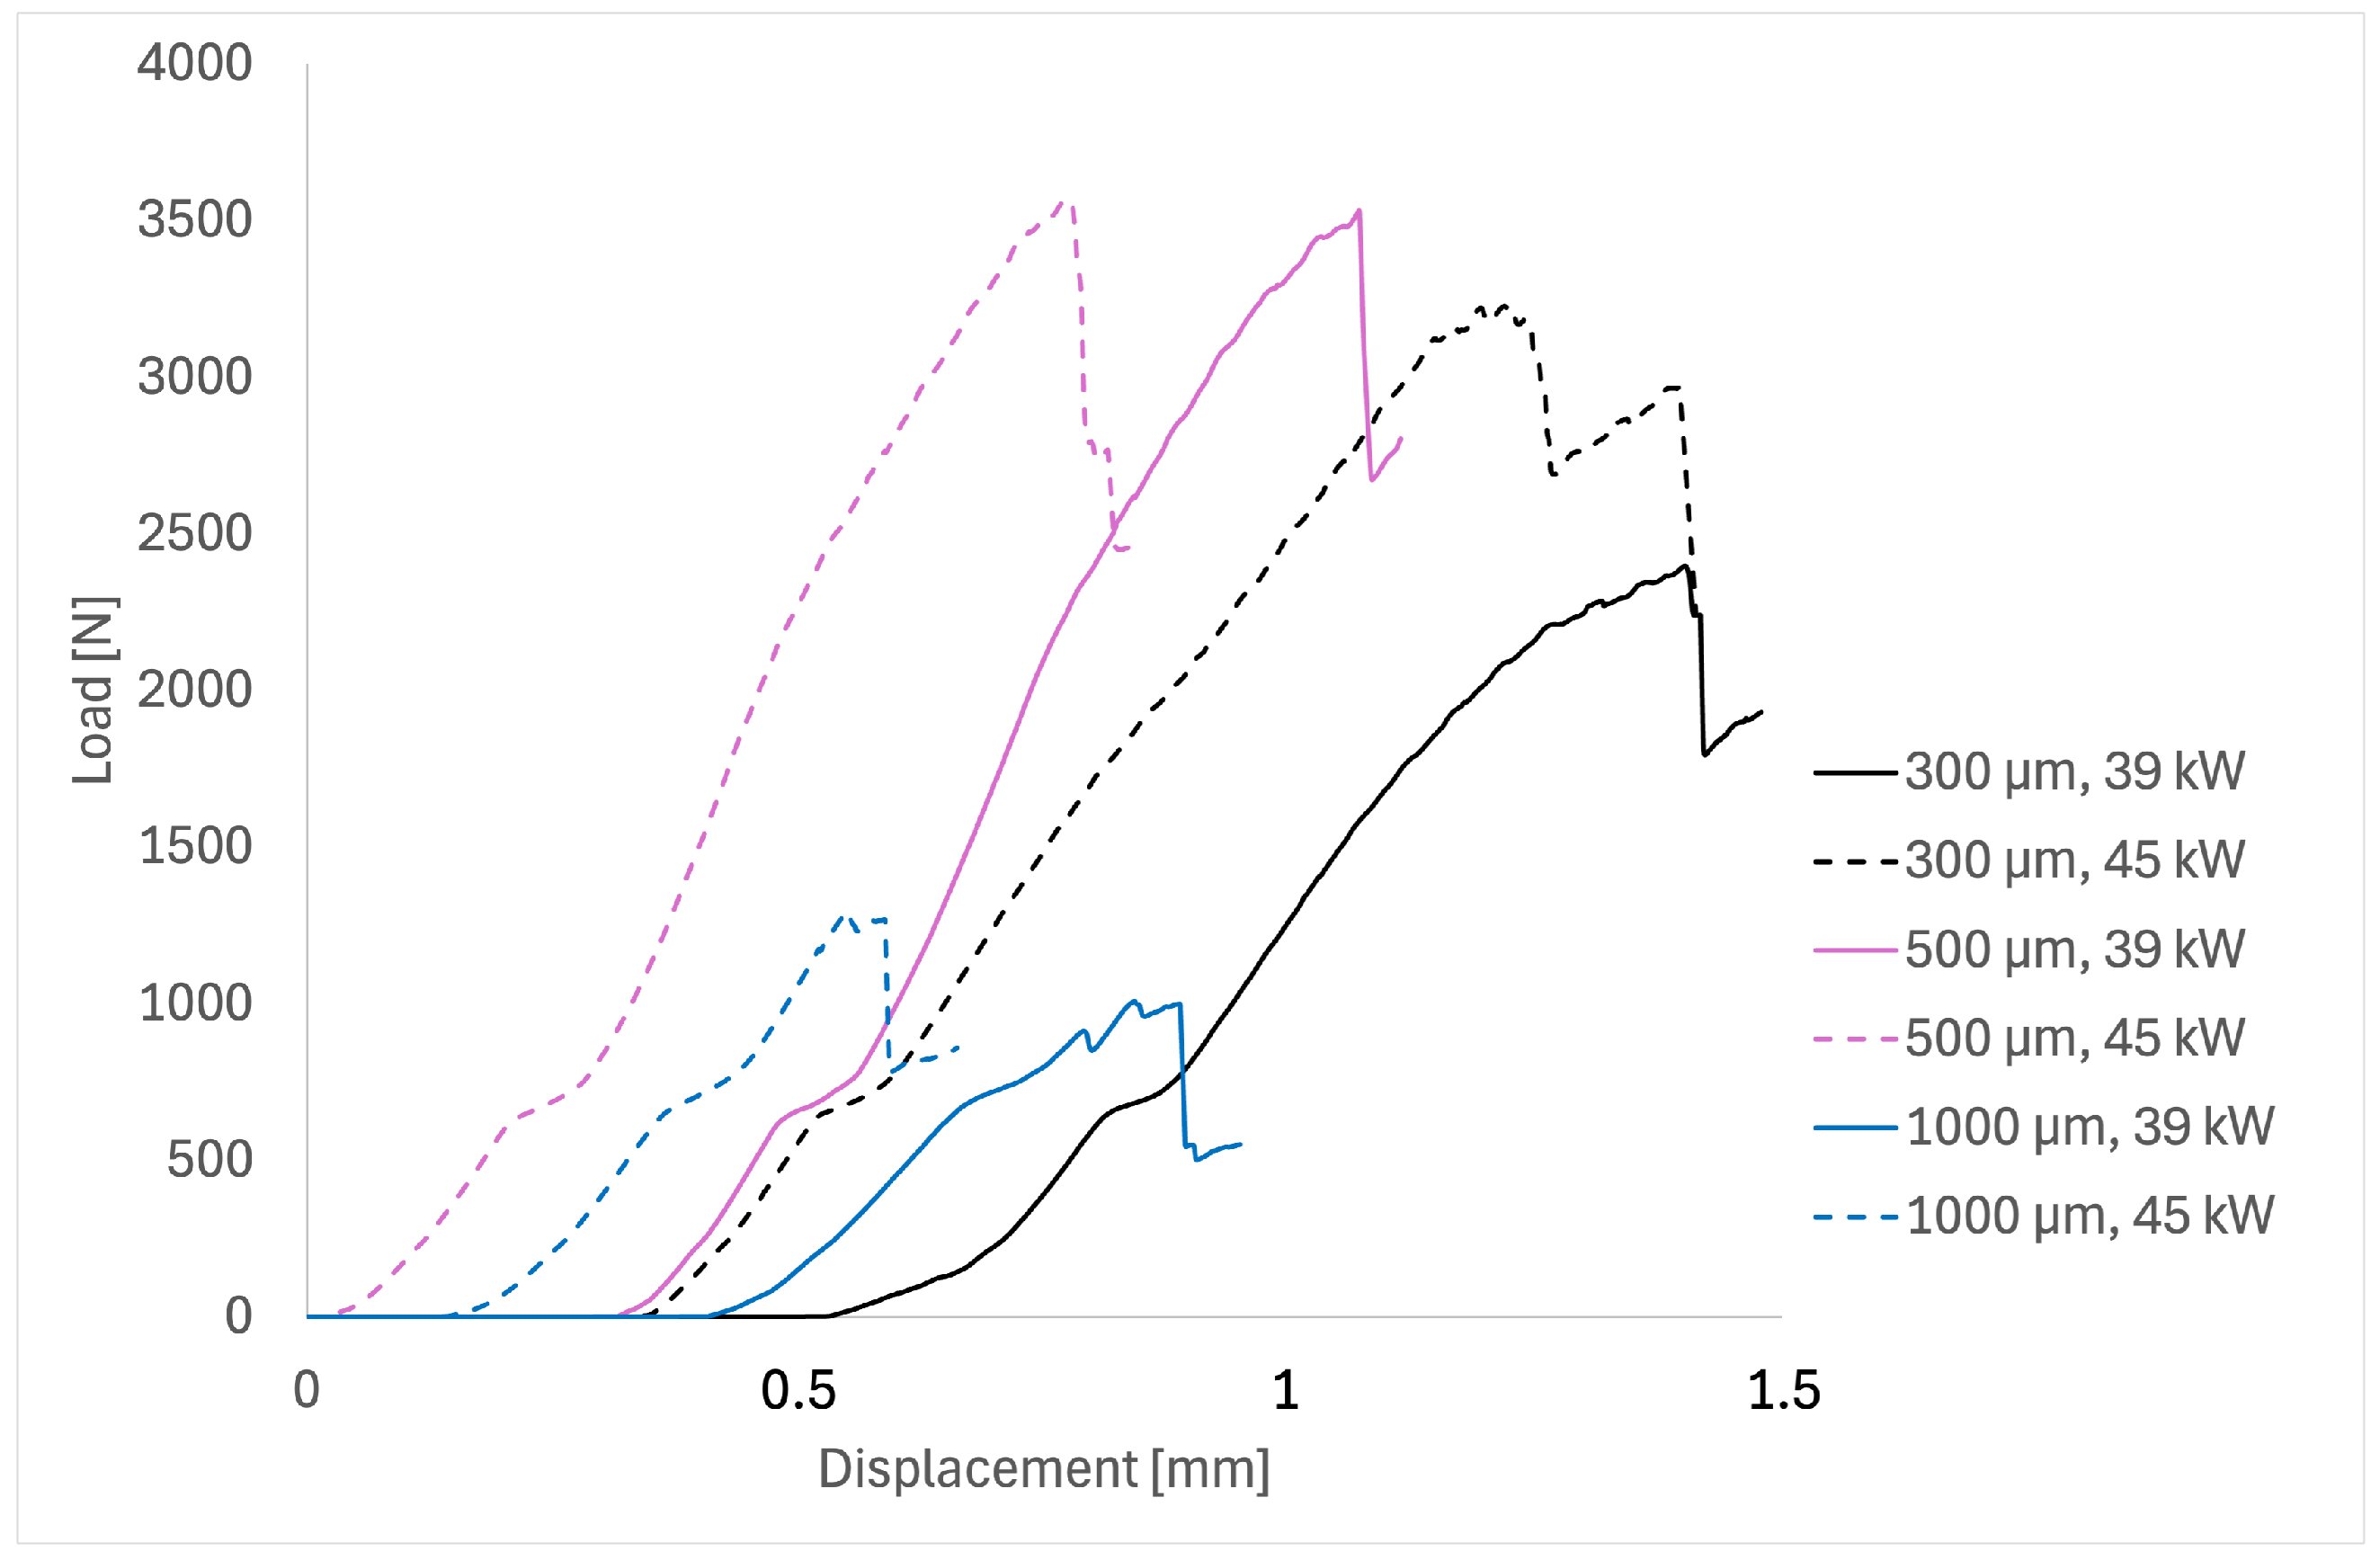
Figure 16 summarizes the three-point bending load–displacement curves grouped by coating thickness and deposition power. The maximum peak corresponds to the detachment and brittle cracking and failure of coating. Curves for 45 kW reach higher maximum forces and display a broader, rounded post-peak, indicating greater energy absorption (work of fracture) before instability, consistent with a tortuous, cohesive crack path marked by deflection and branching along splat boundaries [39]. In contrast, 39 kW curves show earlier, sharper drops, characteristic of unstable Mode-II interfacial delamination along the A l 2 O 3 -Ni interface in layered beams [43,44] (Mode-II-like is used here qualitatively, inferred from the bending geometry and the observed planar interfacial crack path; mode mixity was not quantified). Small initial knees on some curves suggest contact-induced lateral cracking beneath the loading nose; these subsurface cracks can feed nearby interfaces but, at 45 kW, typically remain localized and do not trigger immediate global failure [45].
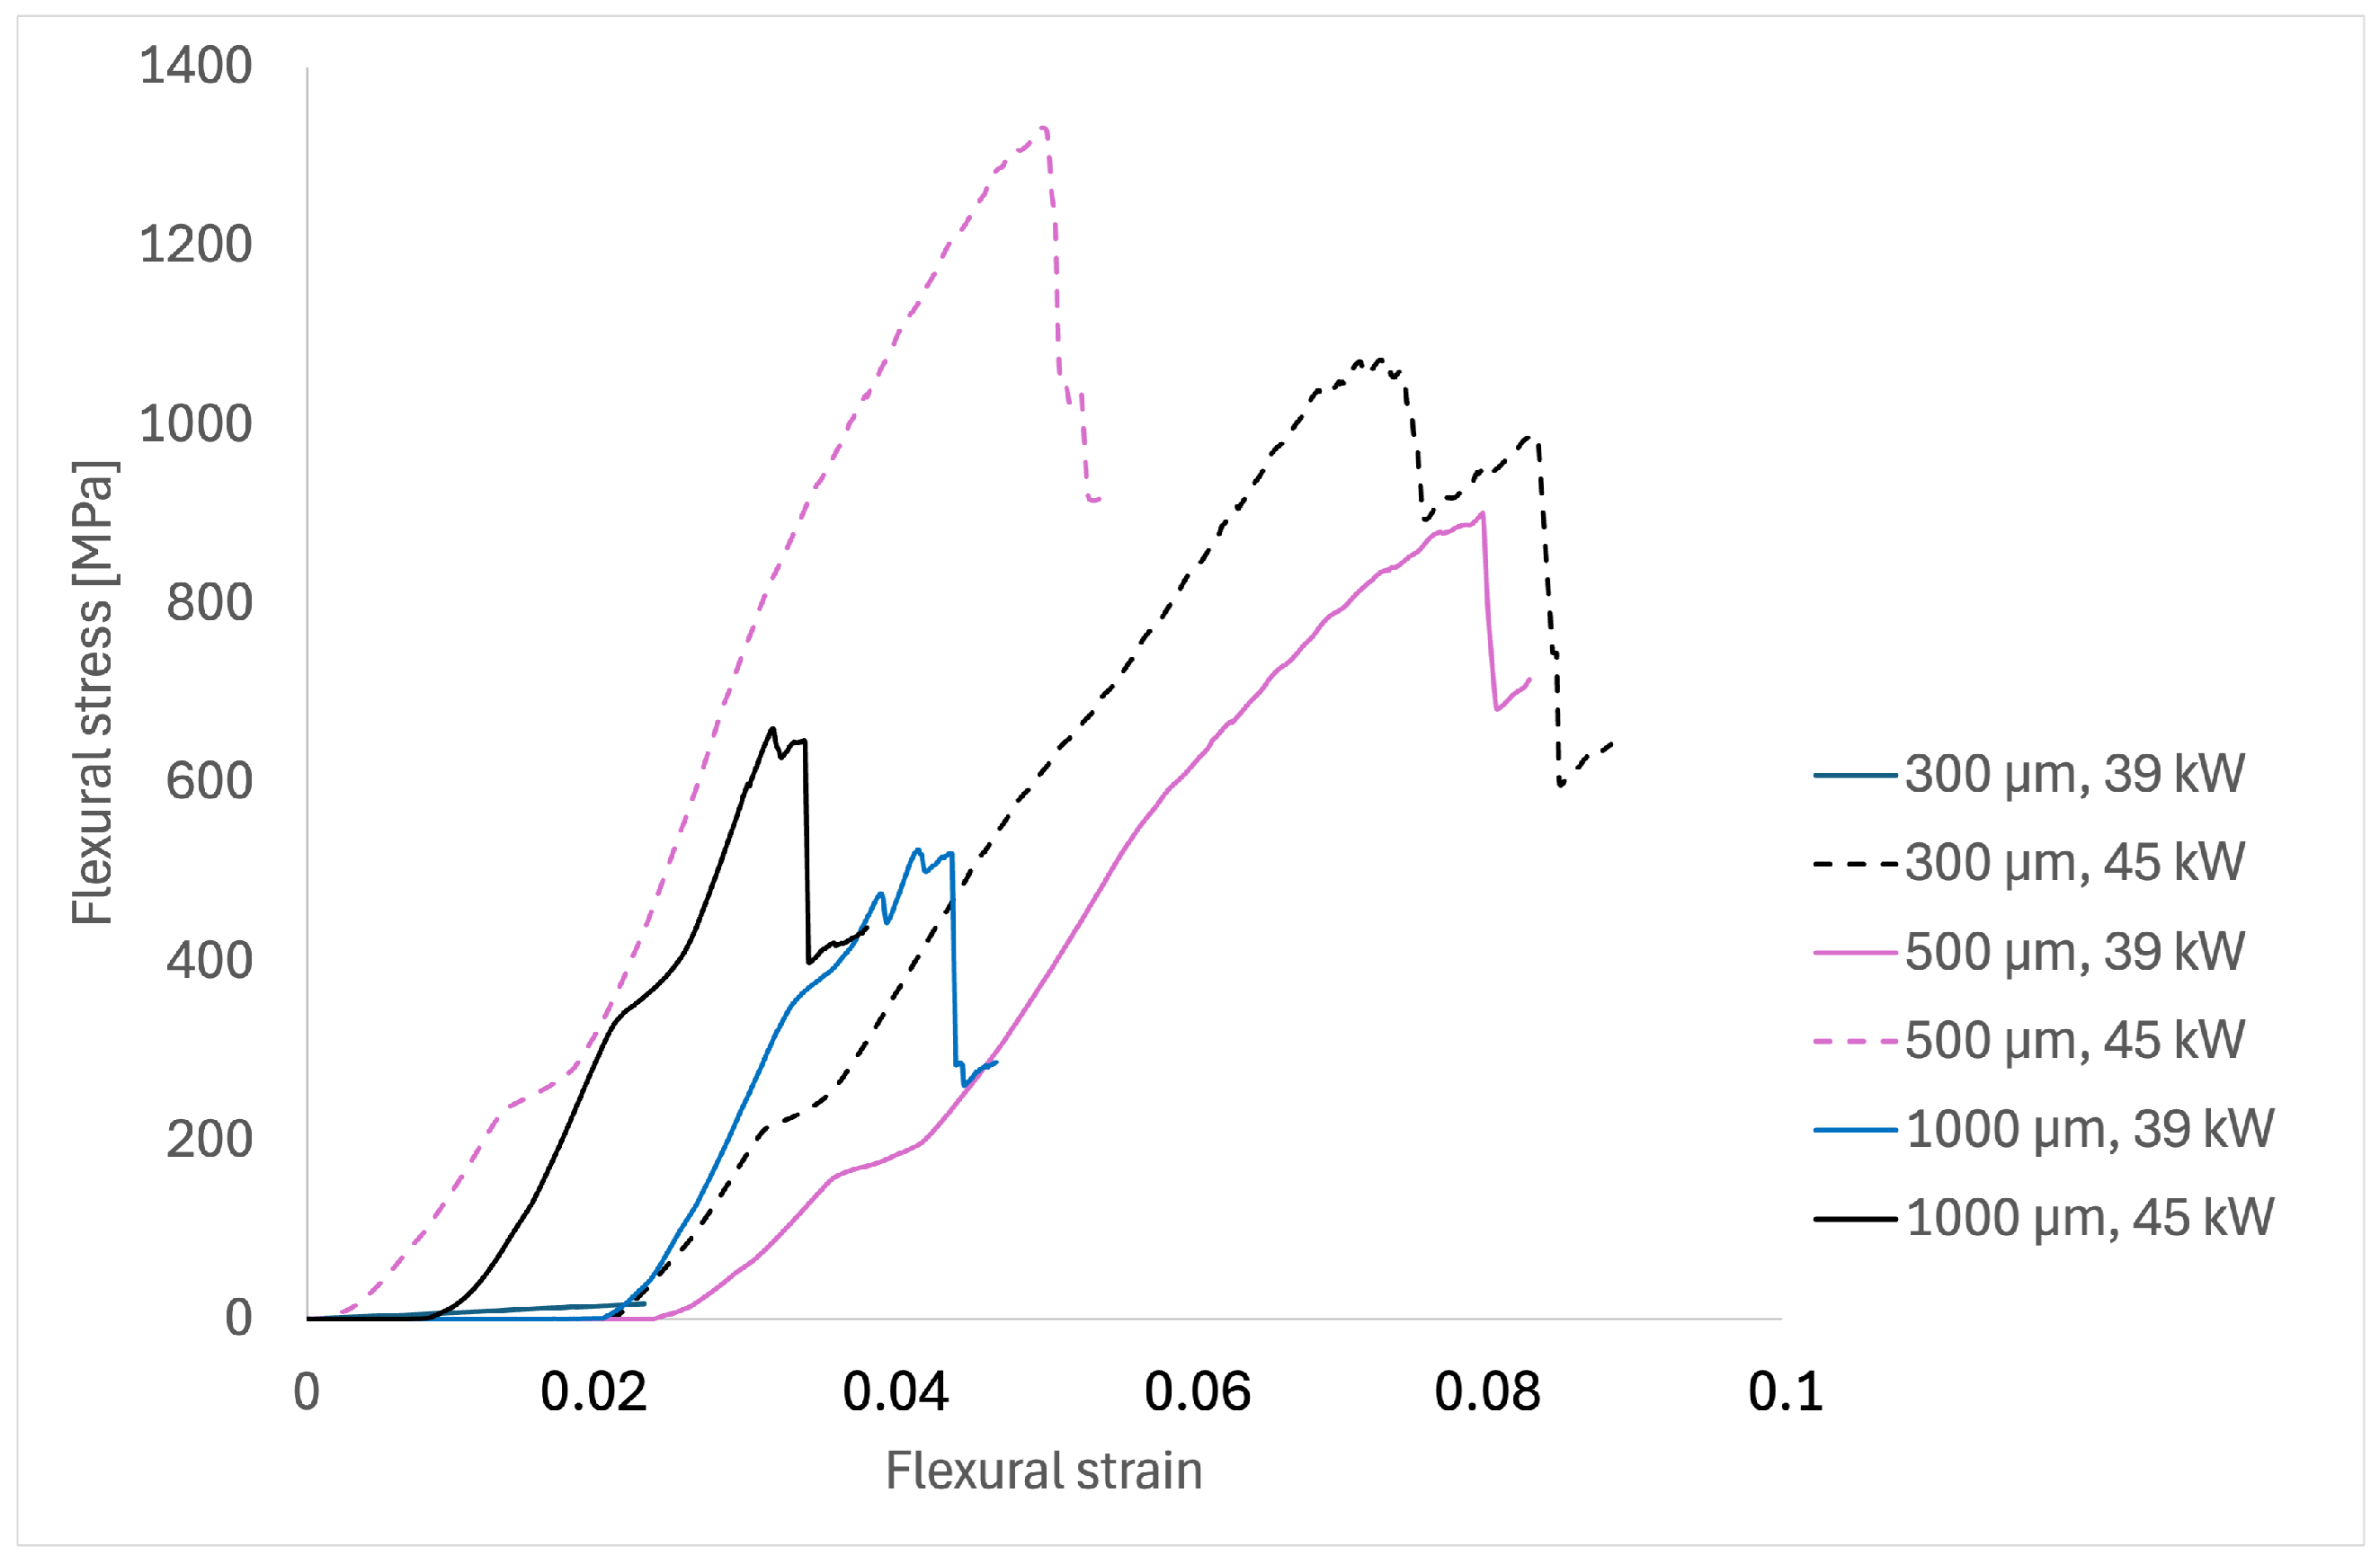
Figure 17 shows the maximum flexural stress–maximum flexural strain response depending on coating thickness and plasma power. Across all thicknesses, specimens deposited at 45 kW exhibit higher peak flexural stress and greater failure strain than those deposited at 39 kW; the initial slope (apparent modulus) remains similar or slightly higher at 45 kW. The 1000 µm coatings tend to deviate from linearity earlier and show lower peak stress compared to the 500 µm coatings, indicating that thickness influences residual stresses and defects. Curves with a broader post-peak, especially 500/45 and 1000/45, suggest cohesive intra-coating growth with deflection or branching along splat boundaries, which increases energy dissipation. Conversely, sharp drops at low strain, typical of the 39 kW samples, indicate Mode-II interfacial delamination along the A l 2 O 3 -Ni interface [46]. The results suggest a practical upper bound on coating thickness for fully exploiting the benefits of the 45 kW condition. While 45 kW promotes densification and higher flexural strength at 300–500 µm, thickness-driven damage mechanisms become increasingly dominant at 1000 µm (residual-stress-assisted cracking, interlamellar defect networking, and easier linkage to the interface), leading to diminishing returns. Although a universal critical thickness cannot be defined from the current dataset, the trend indicates that this upper bound is approached near the upper end of the investigated range (between 500 and 1000 µm) for the present coating/interlayer/substrate system.
Figure 18 summarizes the maximum flexural strength across different thicknesses and plasma powers. Flexural strength peaks at 500 µm and decreases at 1000 µm; for each thickness, 45 kW exceeds 39 kW. Consistent with the idea that higher torch energy enhances particle melting, wetting, and reduces porosity, defects are observed in APS alumina [35,38]. The lower strengths at 39 kW align with Mode-II interfacial delamination, characterized by long planar cracks along the A l 2 O 3 -Ni interface, and broad surface spallation. At 45 kW, failure involves short, tight interfacial segments with increased crack deflection and branching within the alumina (cohesive-leaning), resulting in a tougher, more energy-absorbing crack path and higher strength [46,47]. The 1000 µm drop reflects thickness-related residual stresses and more interlamellar defects, which promote early crack networking and easier linkage to the interface [38,48].

Fractographic Analysis After Bending Test

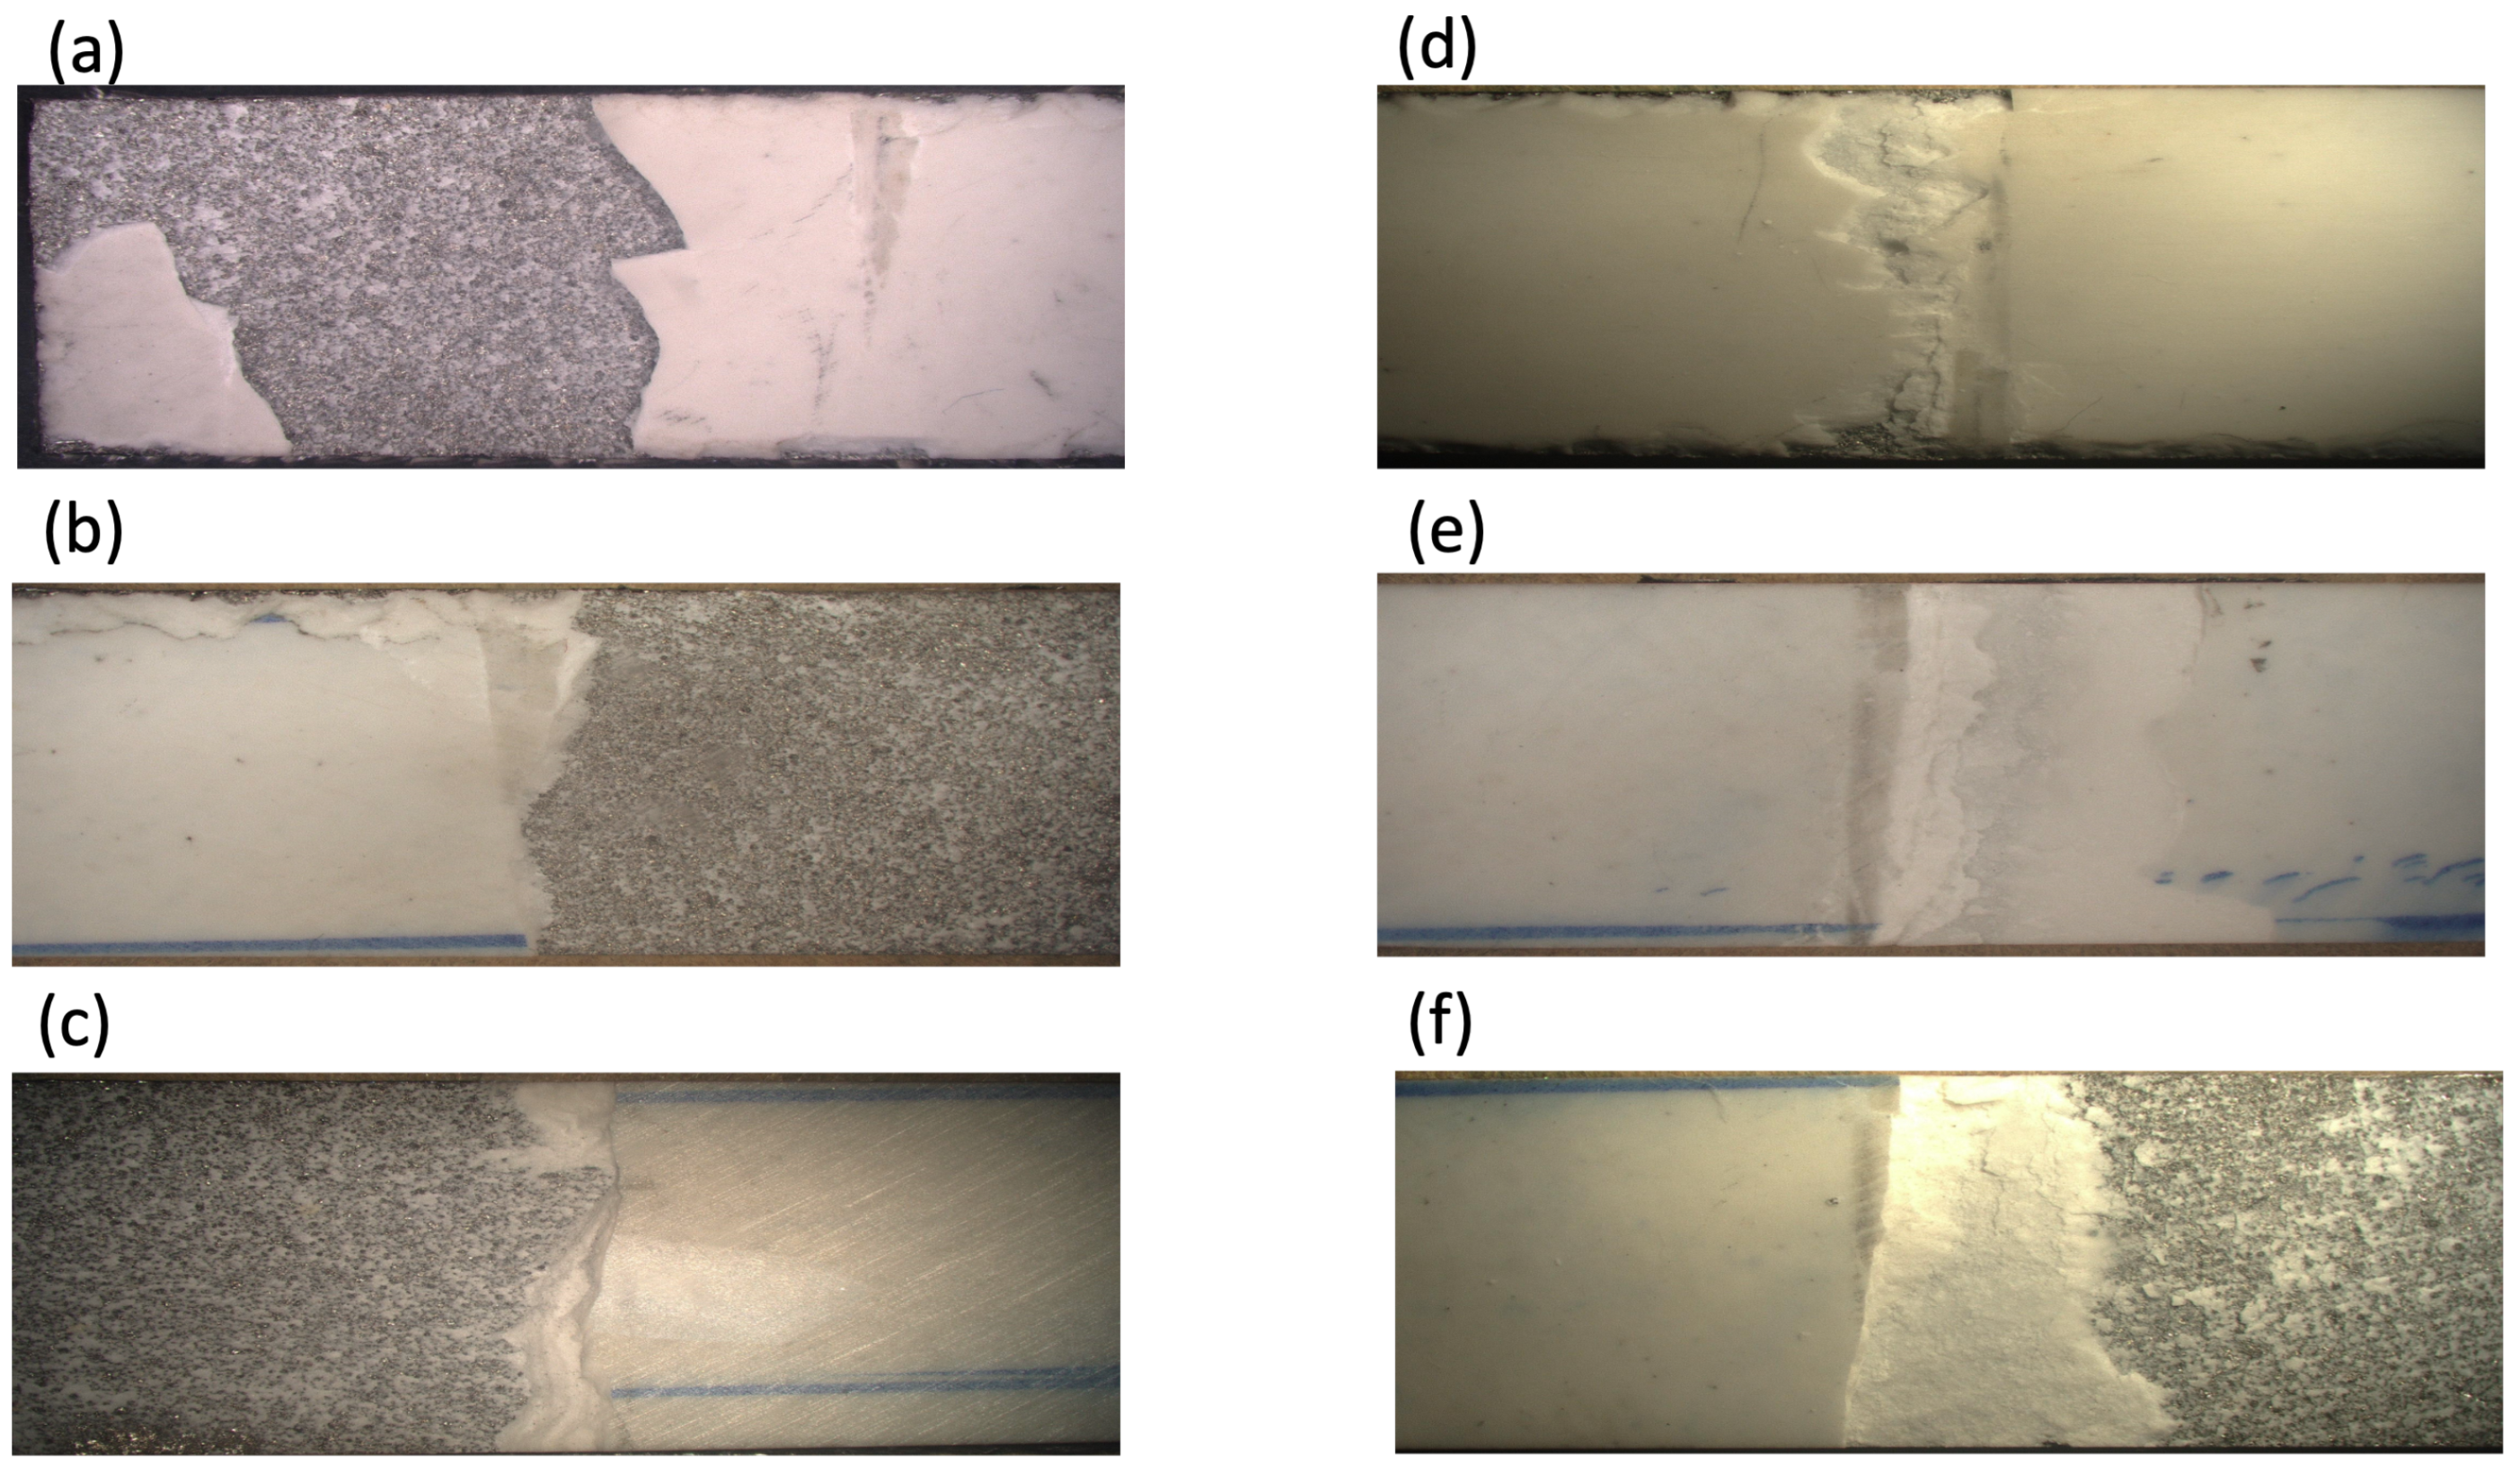
Microscopy post-bending micrographs (Figure 19) show that coatings deposited at 39 kW (a–c) display tortuous cracking with areas of surface delamination and spallation, which are typical of APS lamellar microstructures where pores promote crack branching and lamellar interfaces deflect cracks [46,49]. Large peeled regions are indicative of adhesive failures at the coating–interlayer interface, while fragmented areas within the ceramic suggest cohesive failure within the topcoat. Conversely, coatings deposited at 45 kW (d–f) appear more intact; higher torch power increases particle flattening, generally decreases porosity, and enhances inter-splat bonding, which improves resistance to bending-induced fracture [35]. Panel (d) shows a localized, non-linear crack with limited delamination (mixed mode), (e) displays a more transverse, nearly linear crack without delamination, and severe chipping is observed only in (f) [50].
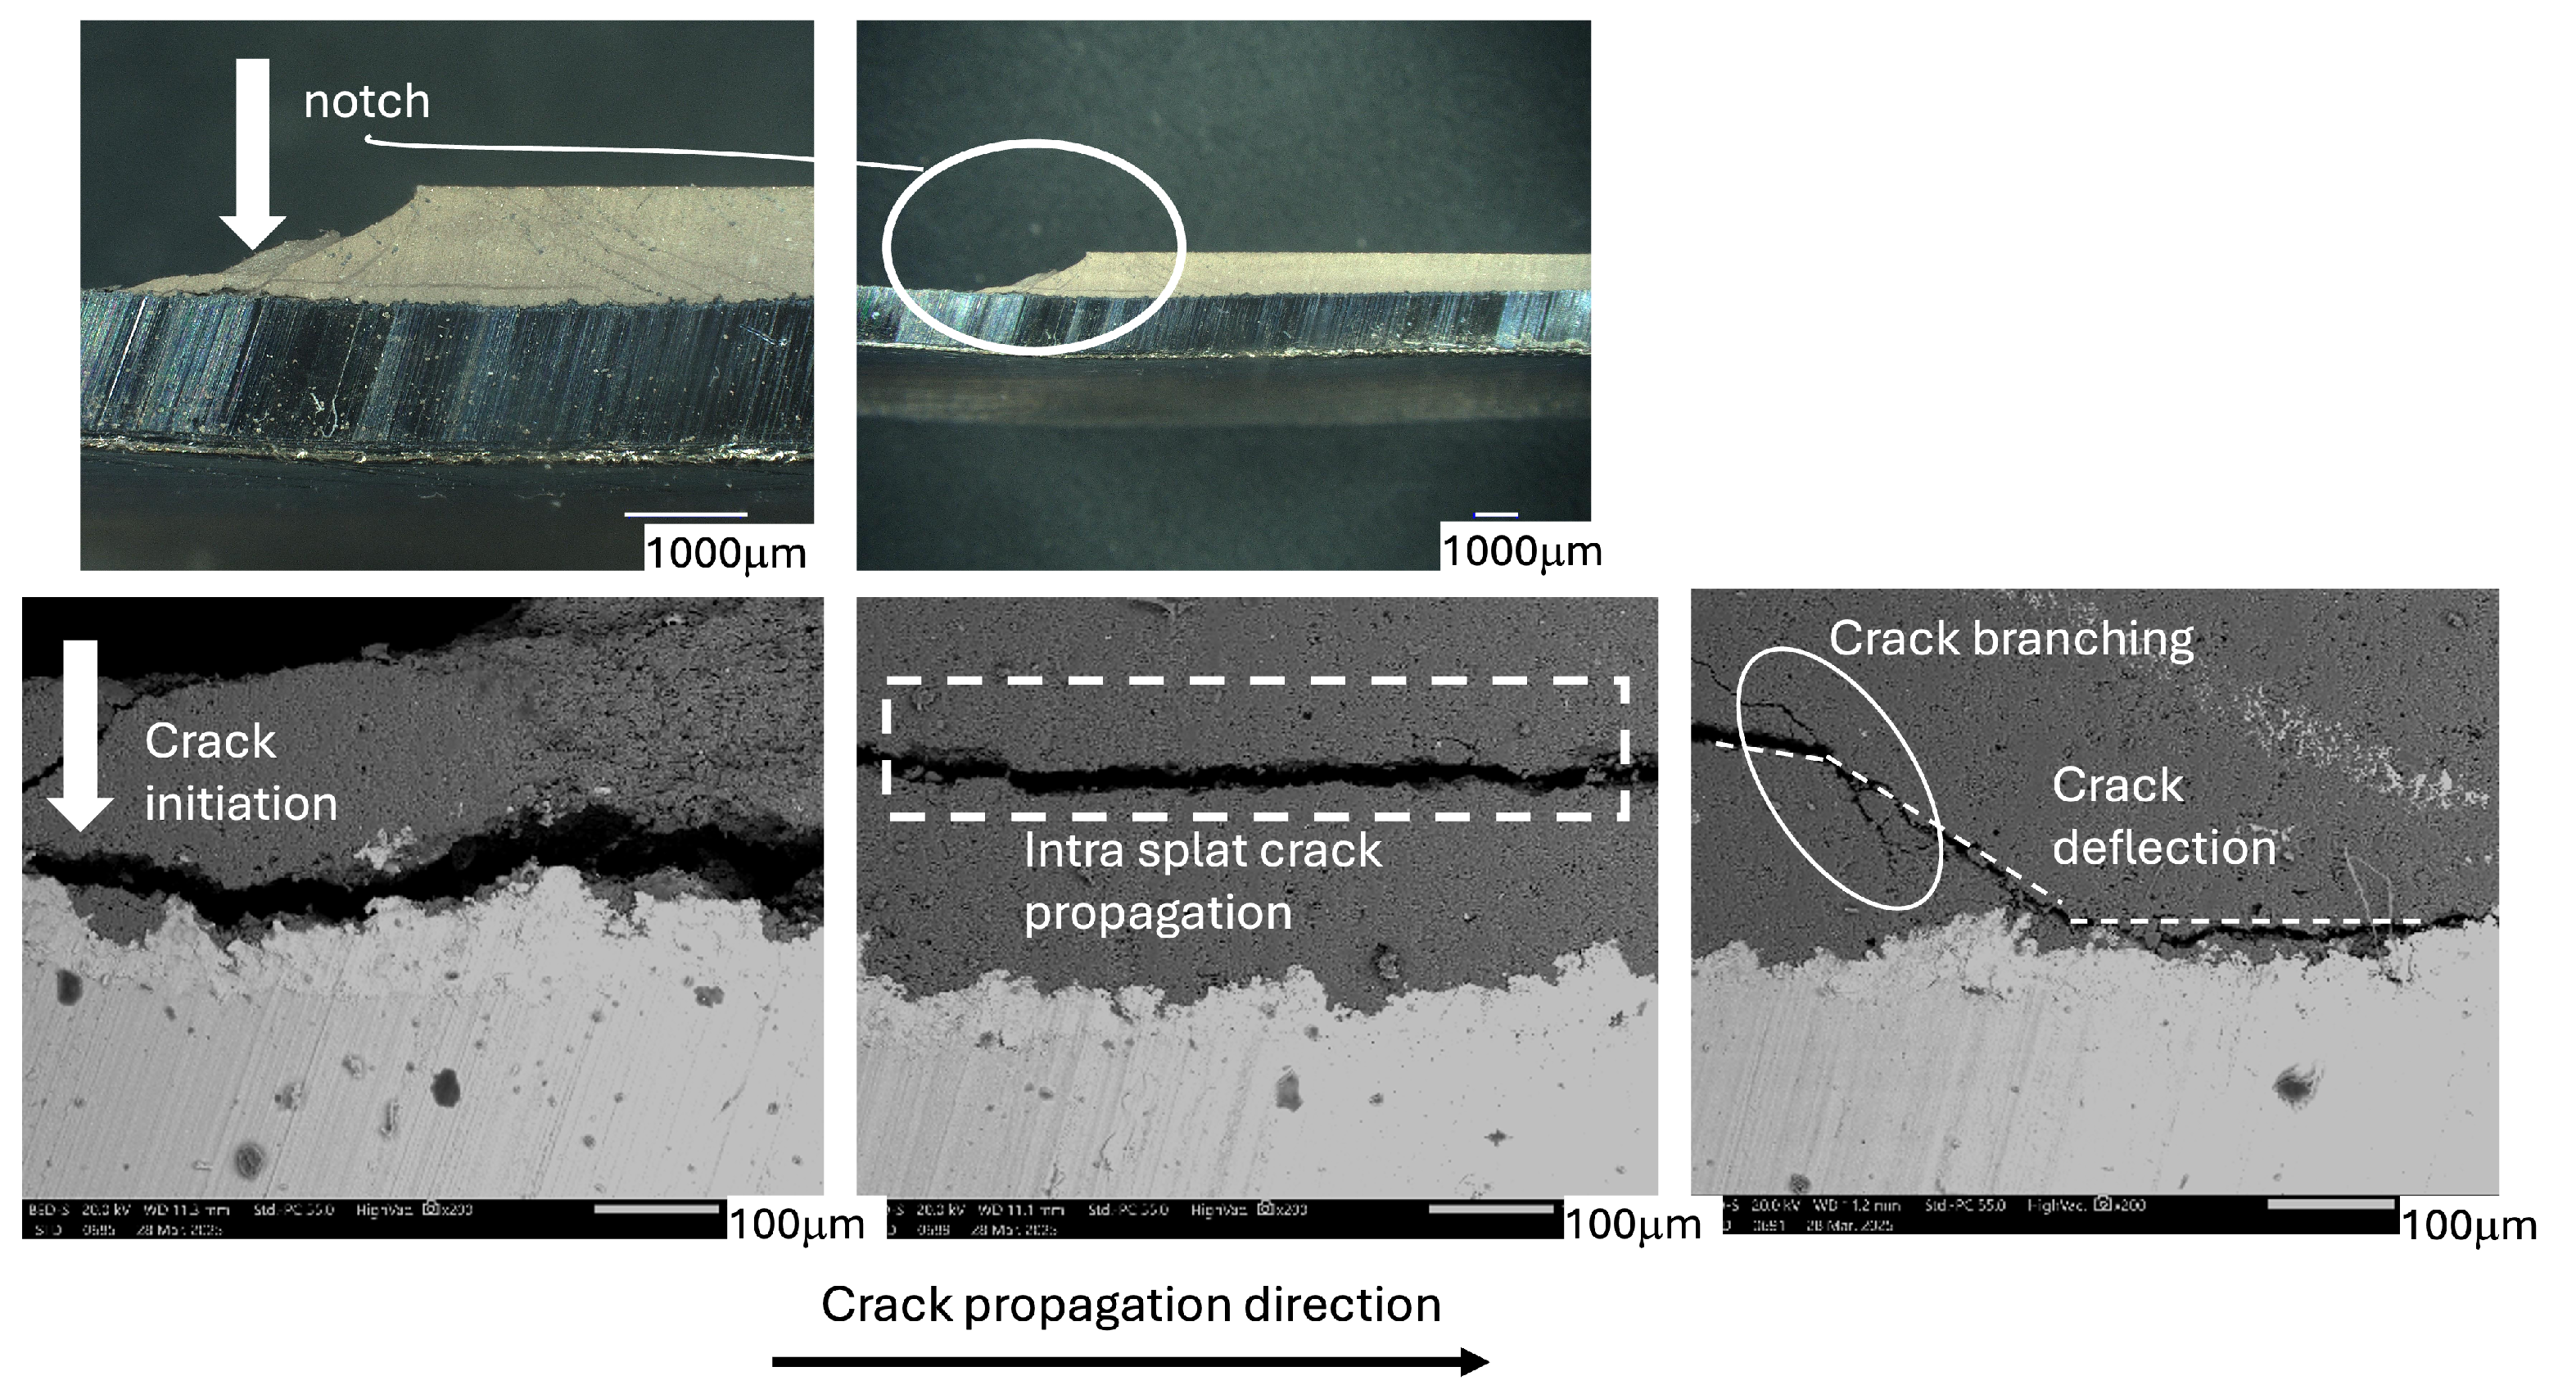
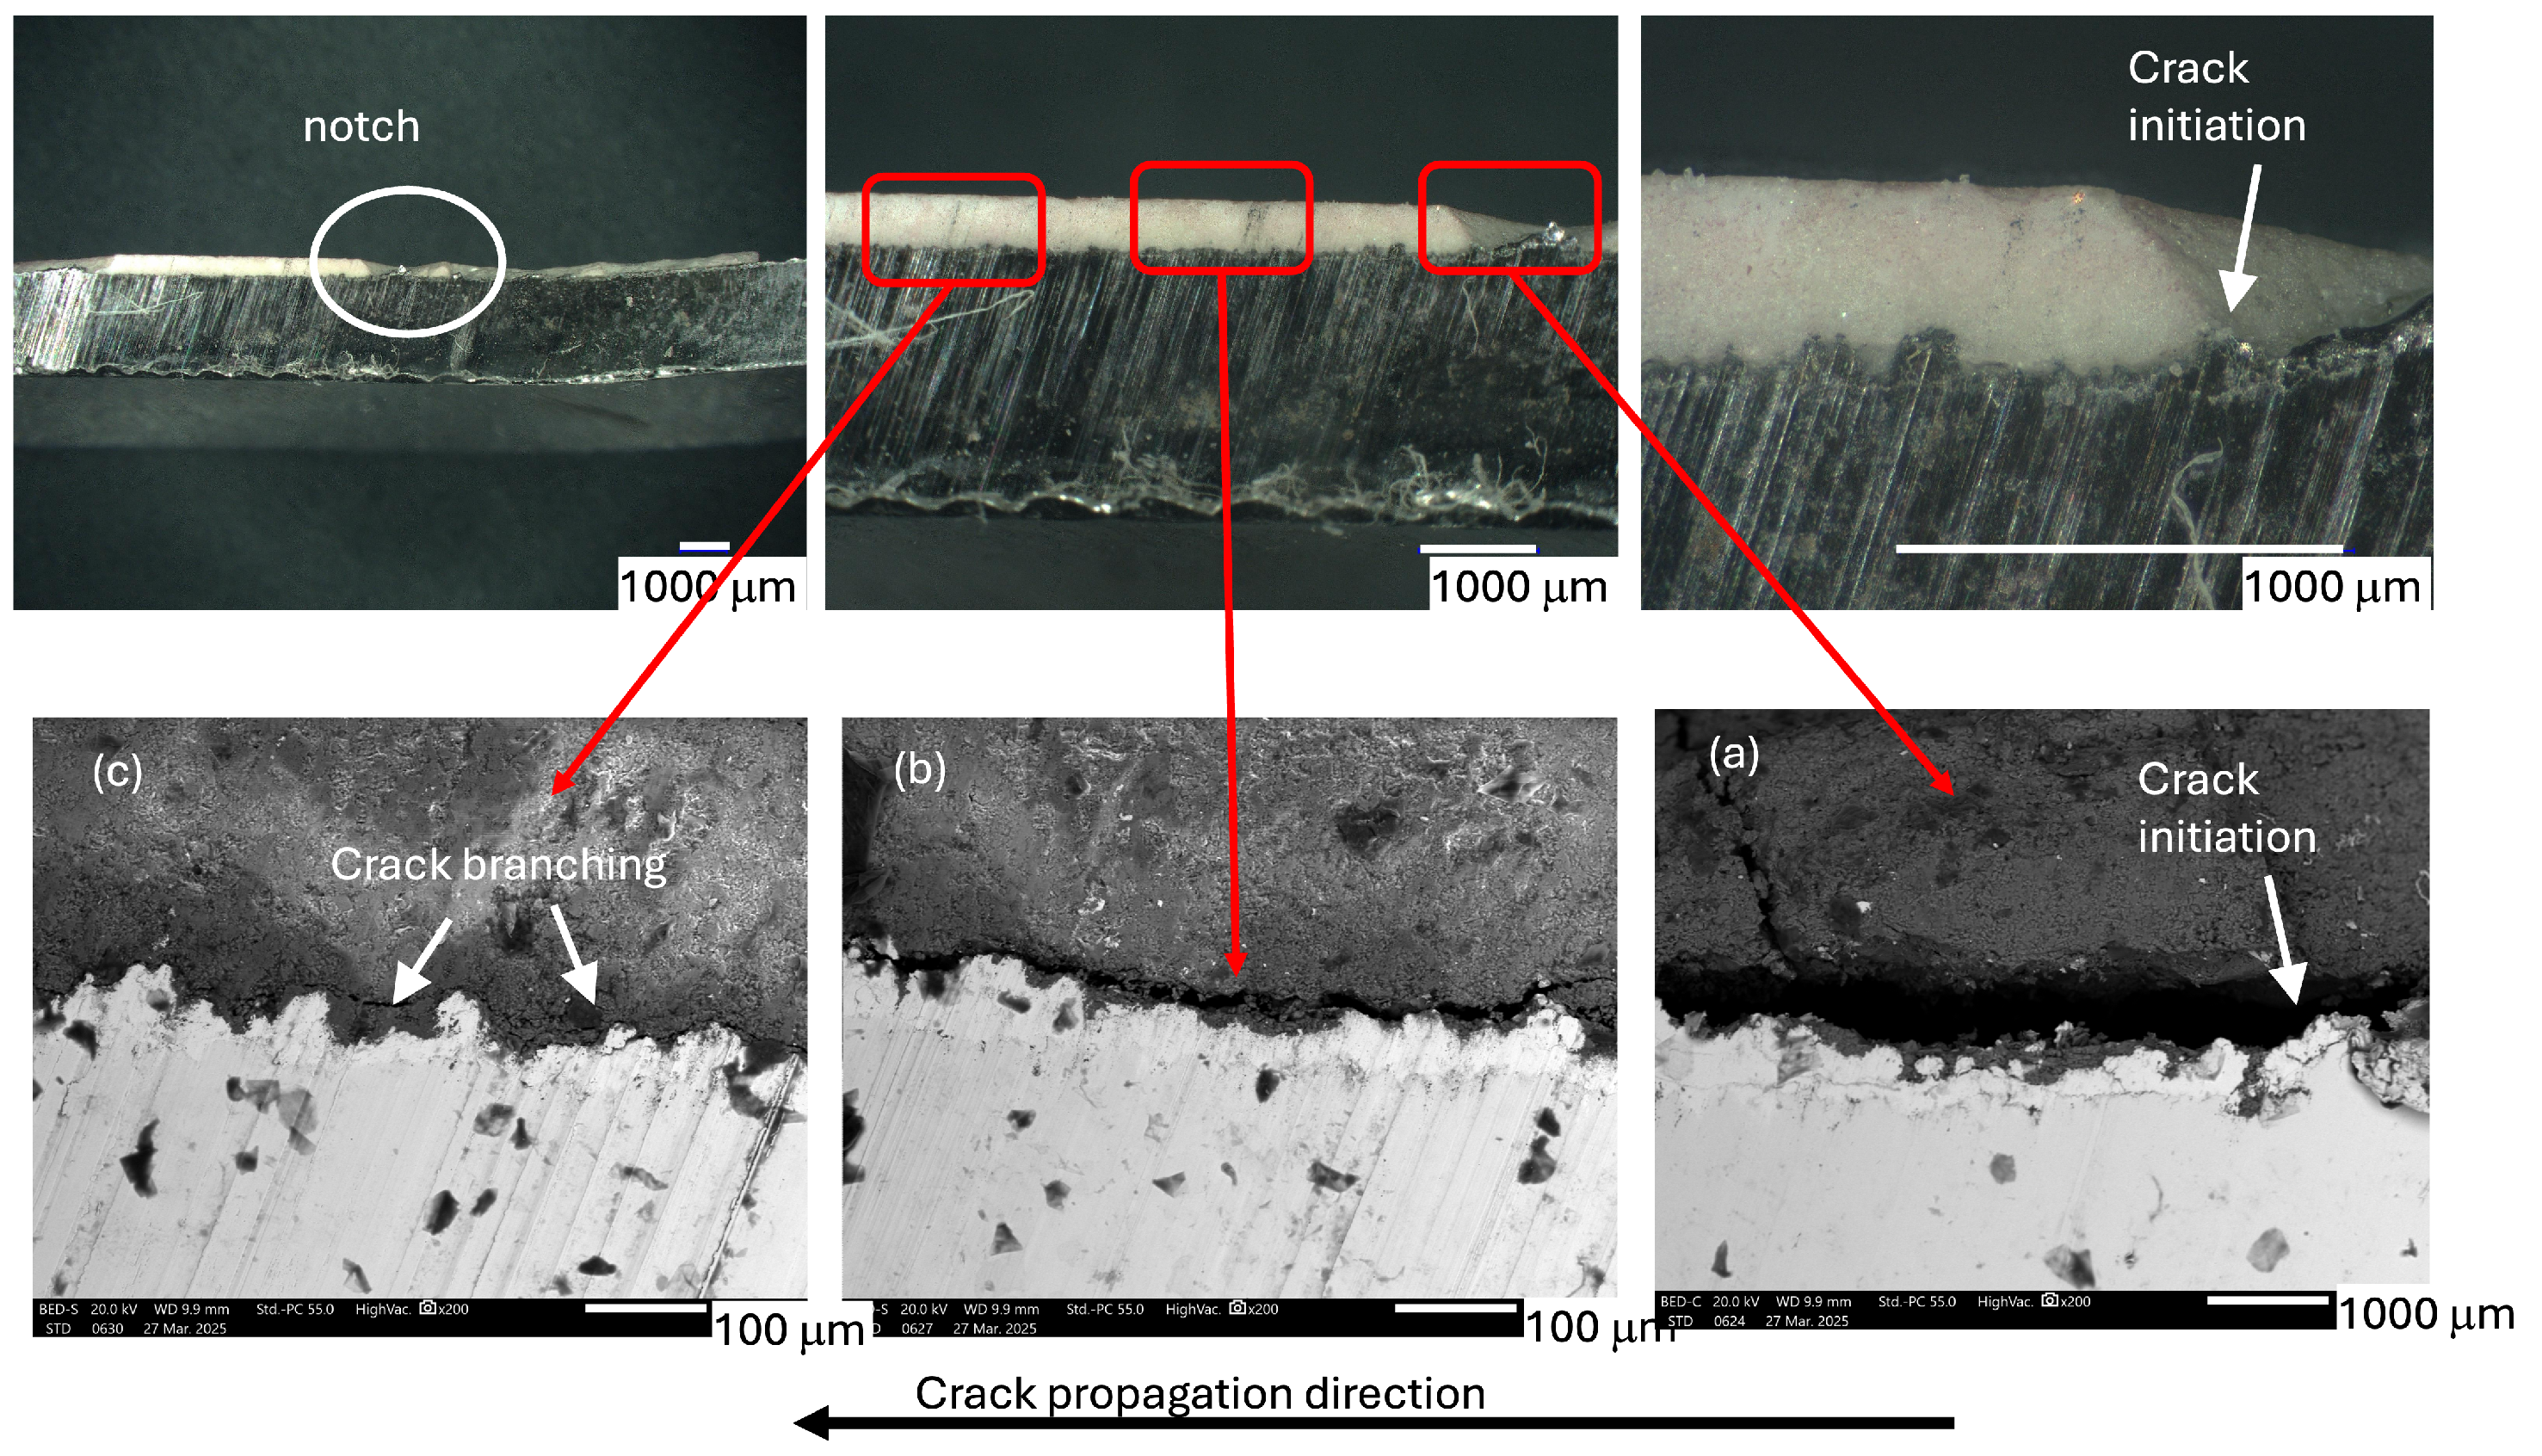
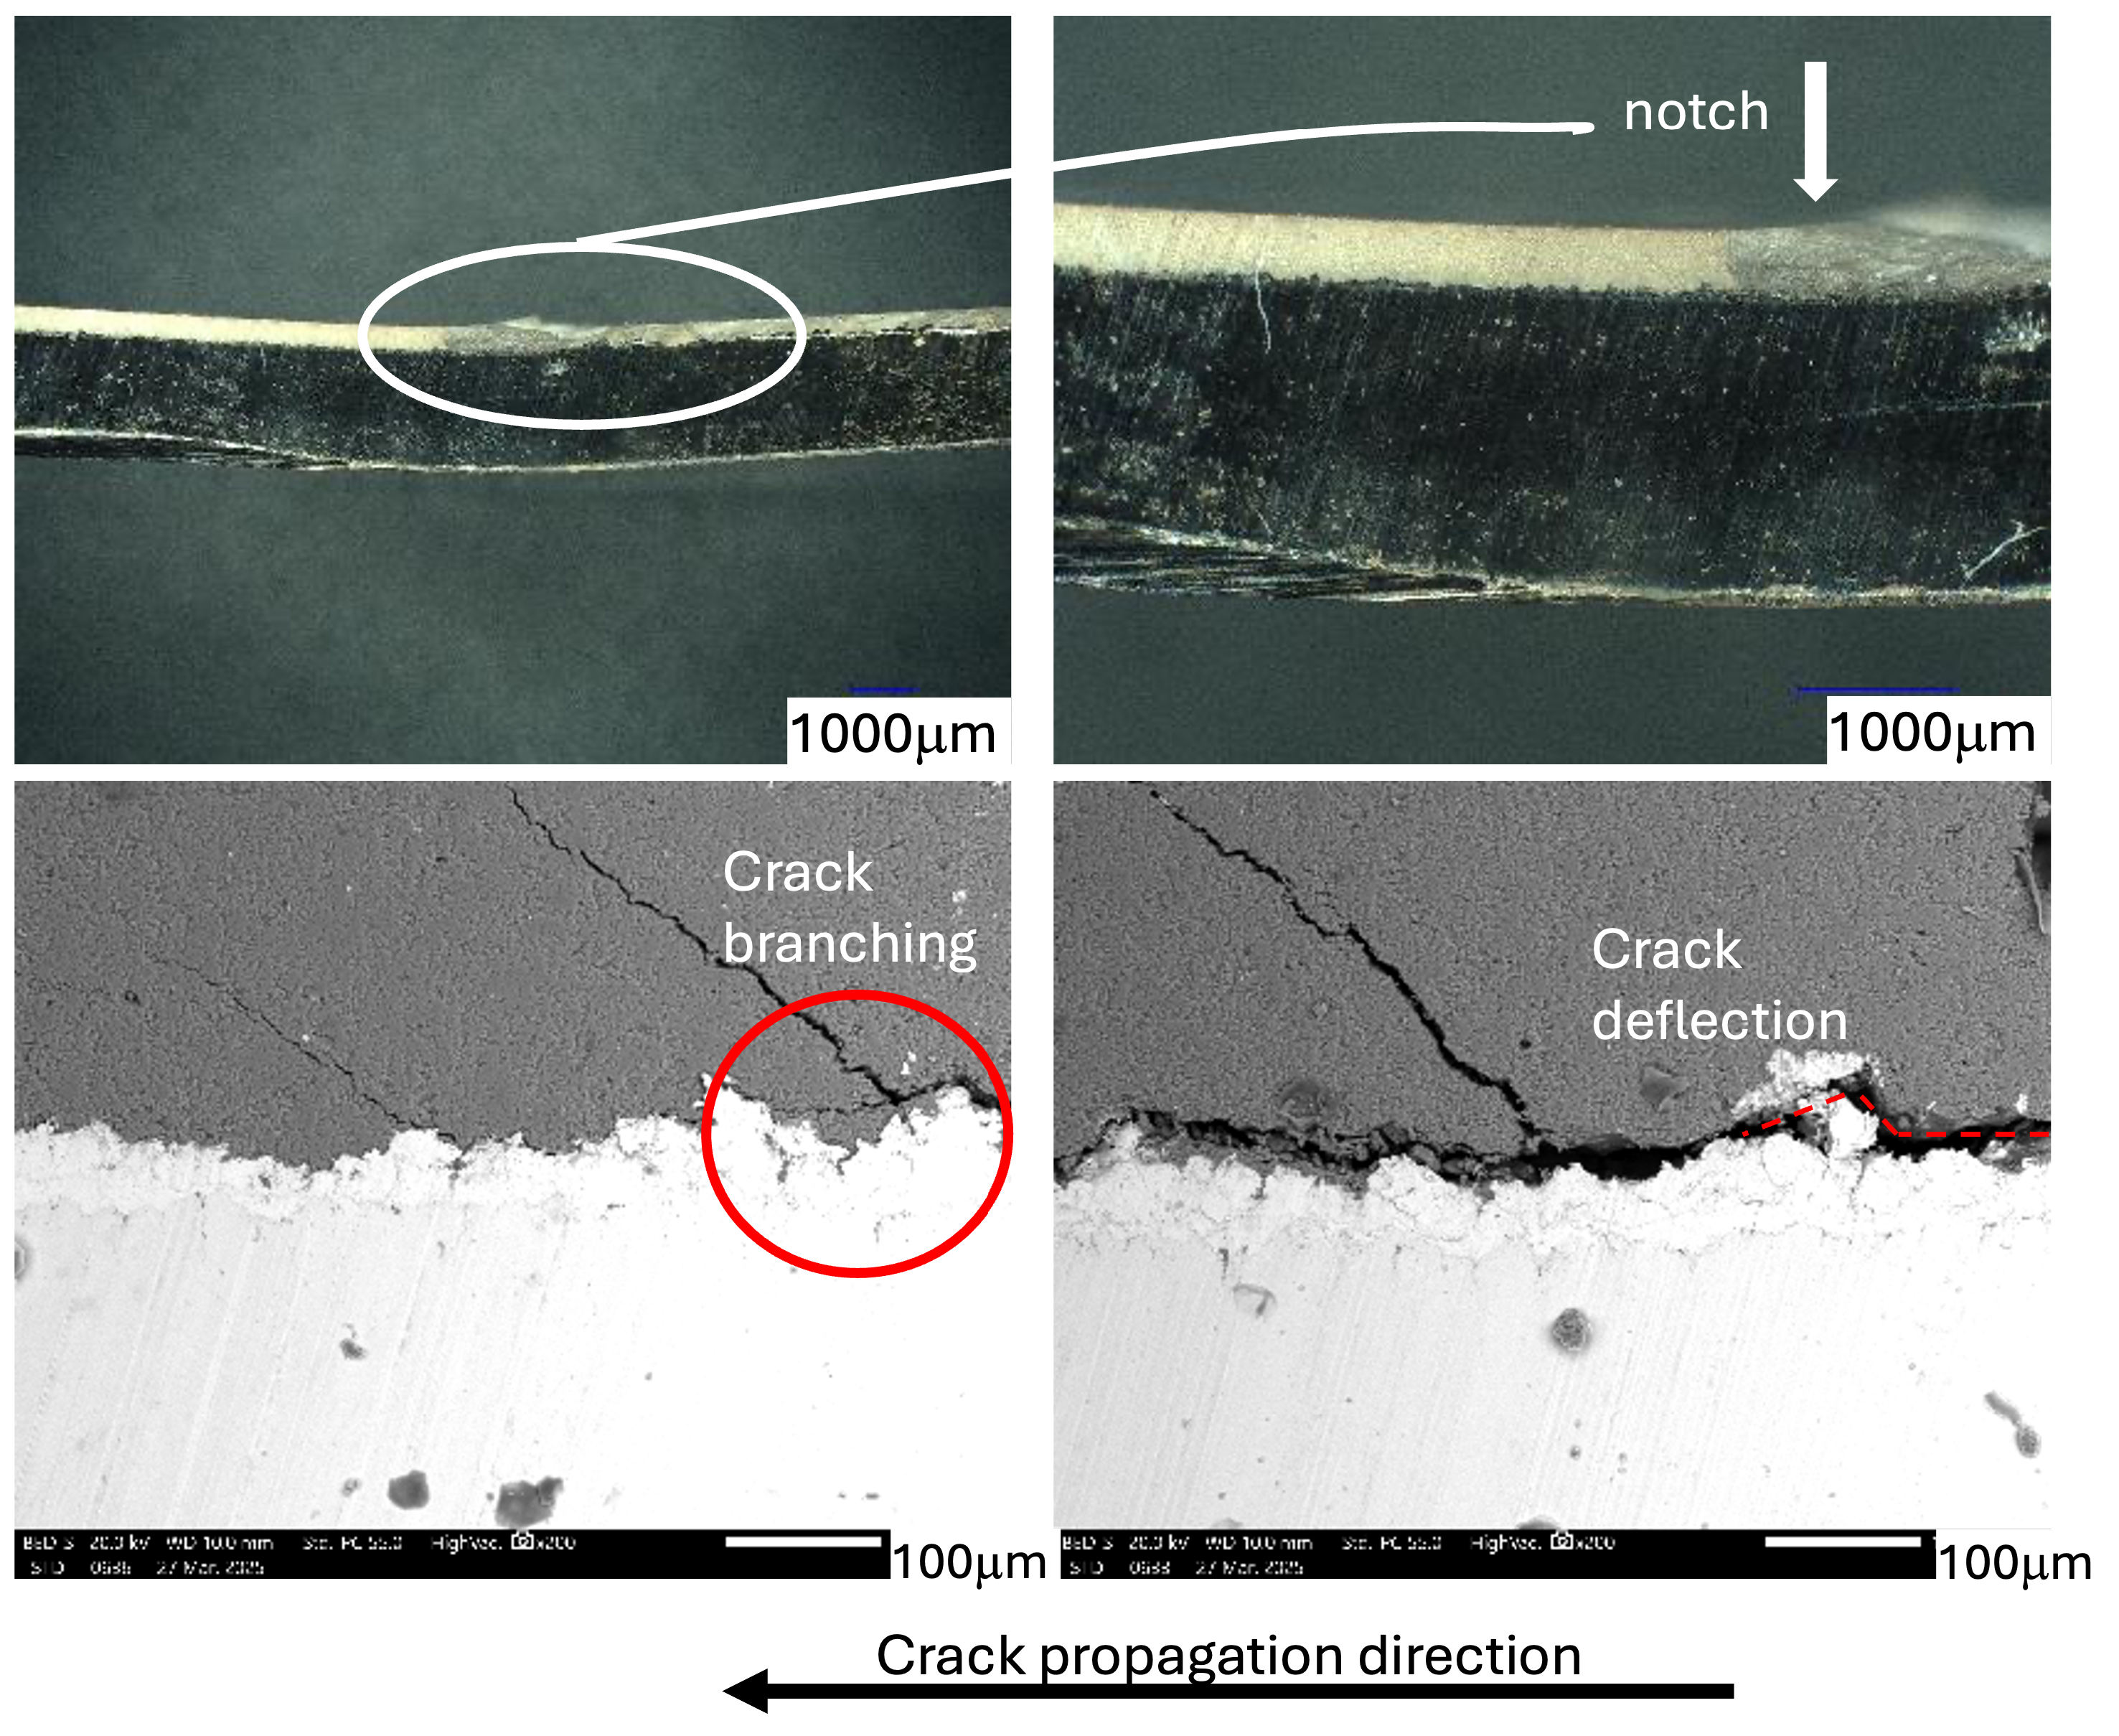
After evaluating the beam surfaces following the bending test, this section presents cross-sectional SEM micrographs of the beams’ microstructure after post-bending. Figure 20 illustrates crack propagation in beam 1 (300 µm, 39 kW). (Top): The top shows optical images of the cross-section used to identify damage; colored circles highlight regions of interest. (Bottom): The bottom shows targeted SEM-BSE views of the same regions. In Region A, crack propagation mainly occurred adhesively along the alumina–Ni interface (interfacial delamination), with secondary branching into the ceramic (indicated by the pink rectangular area). Region B exhibits mixed-mode behavior: short adhesive segments at the interface combined with cohesive crack deflection within the lamellar alumina.
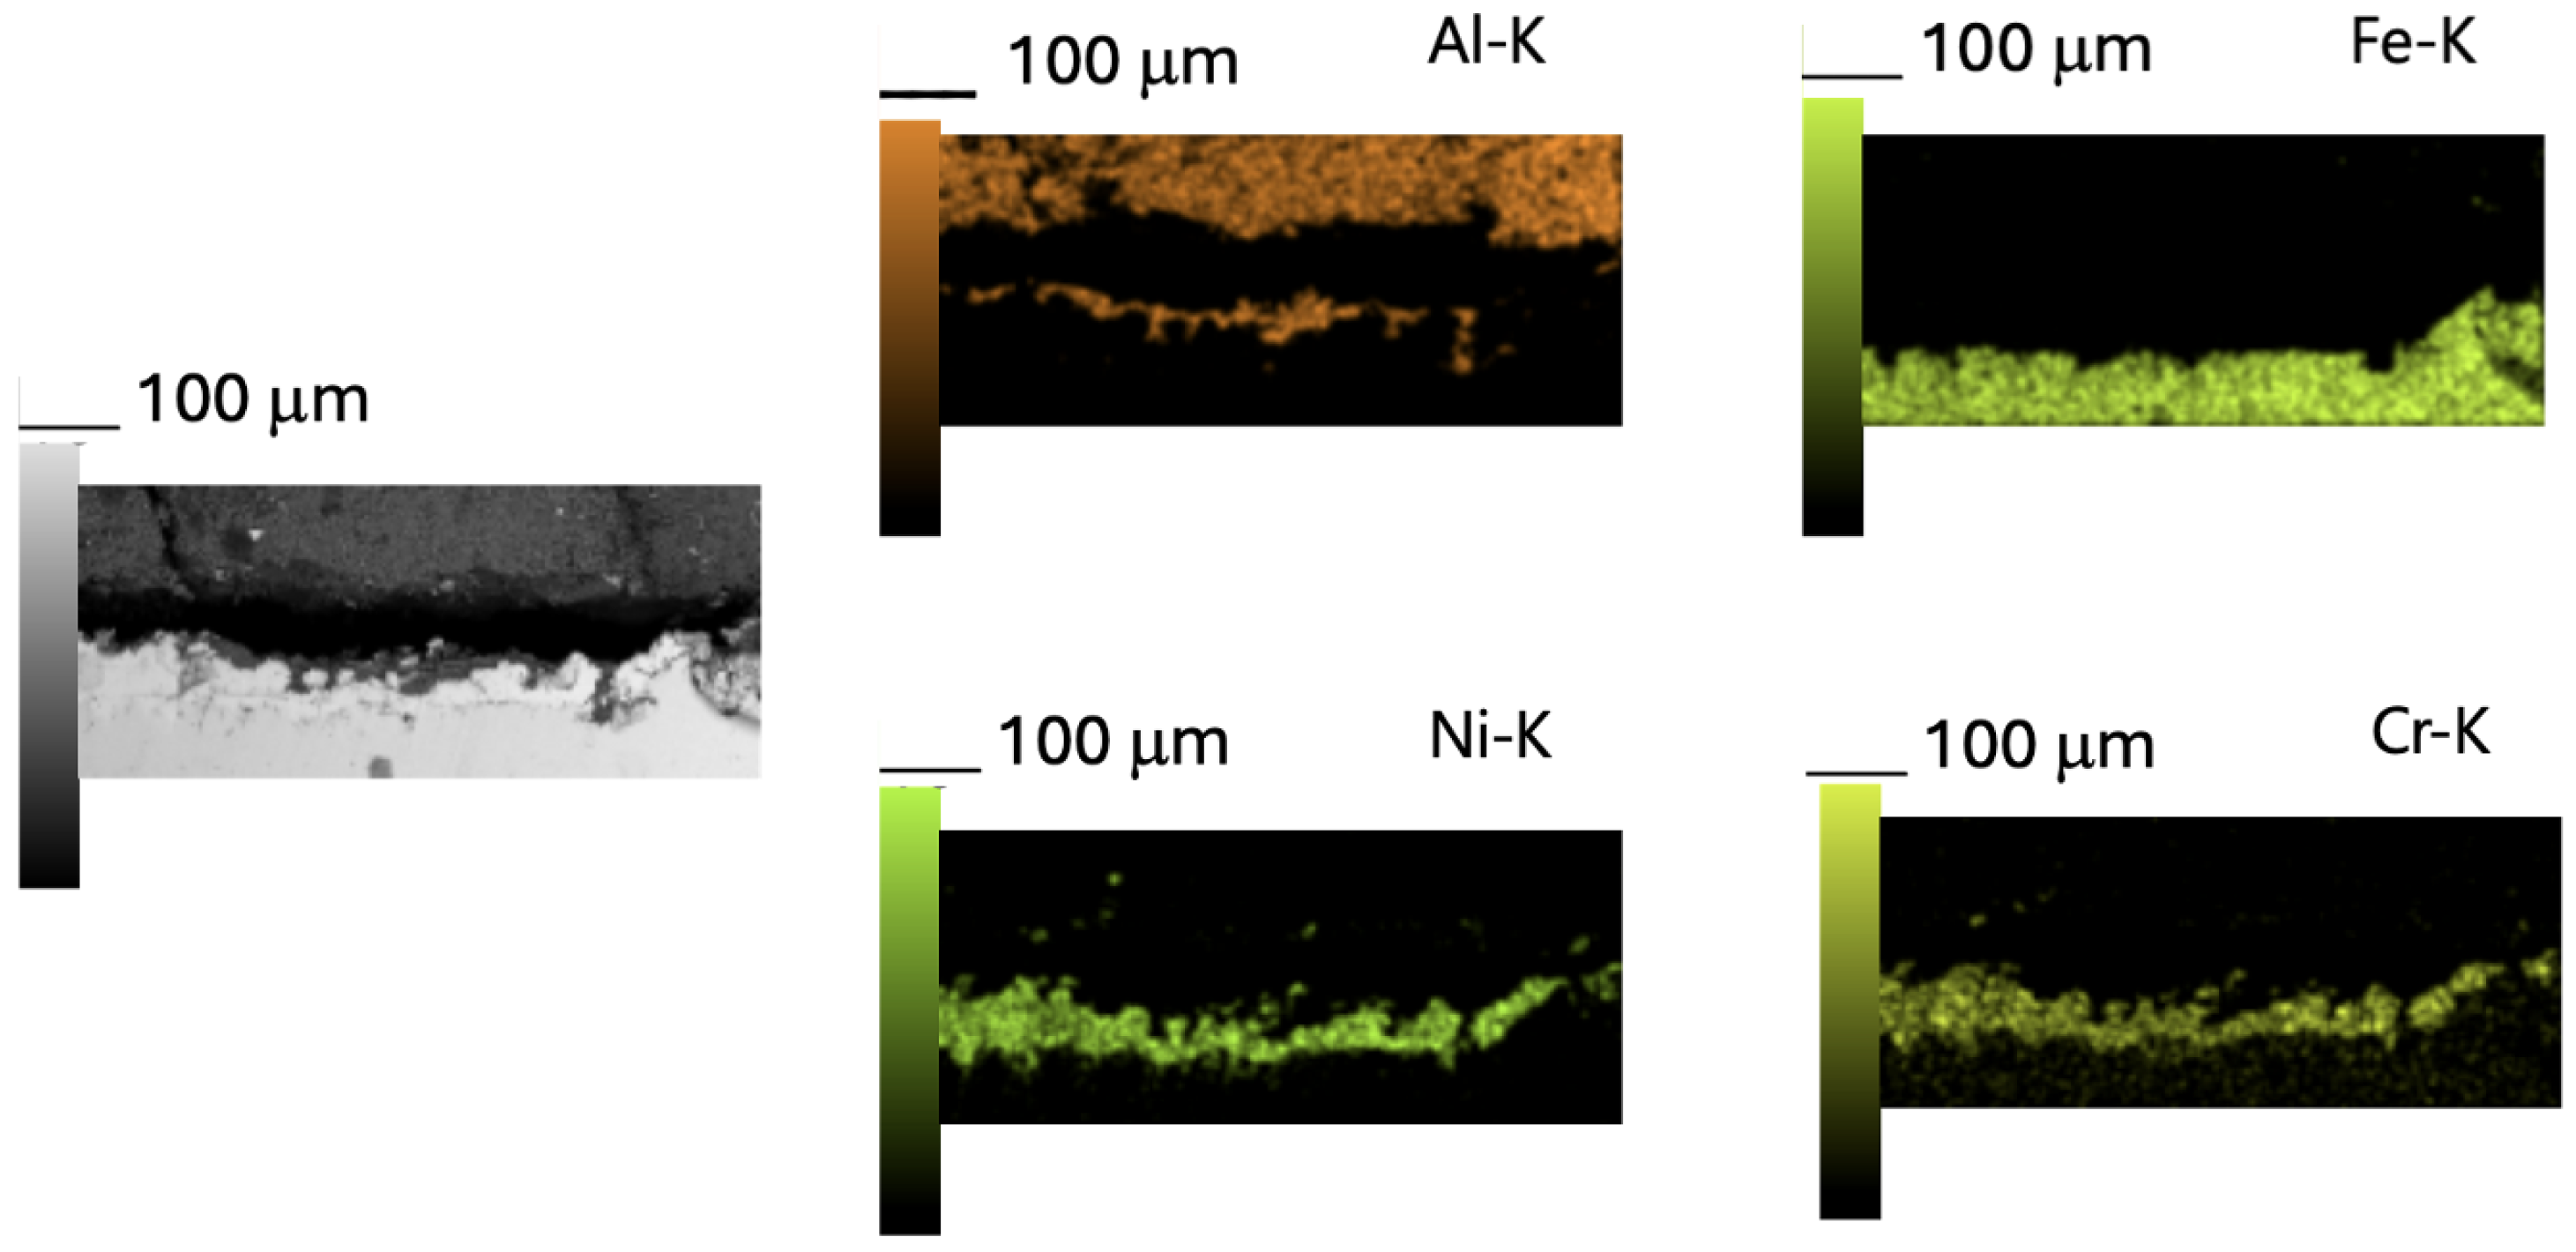
Region C is mostly cohesive, with the interface remaining bonded and damage limited to small intra-coating microcracks [46]. Figure 21 shows the EDS analysis of Region A (Figure 20). Region A displays interfacial (adhesive) delamination at the A l 2 O 3 -Ni boundary after bending, while the Ni-steel interface remains intact.
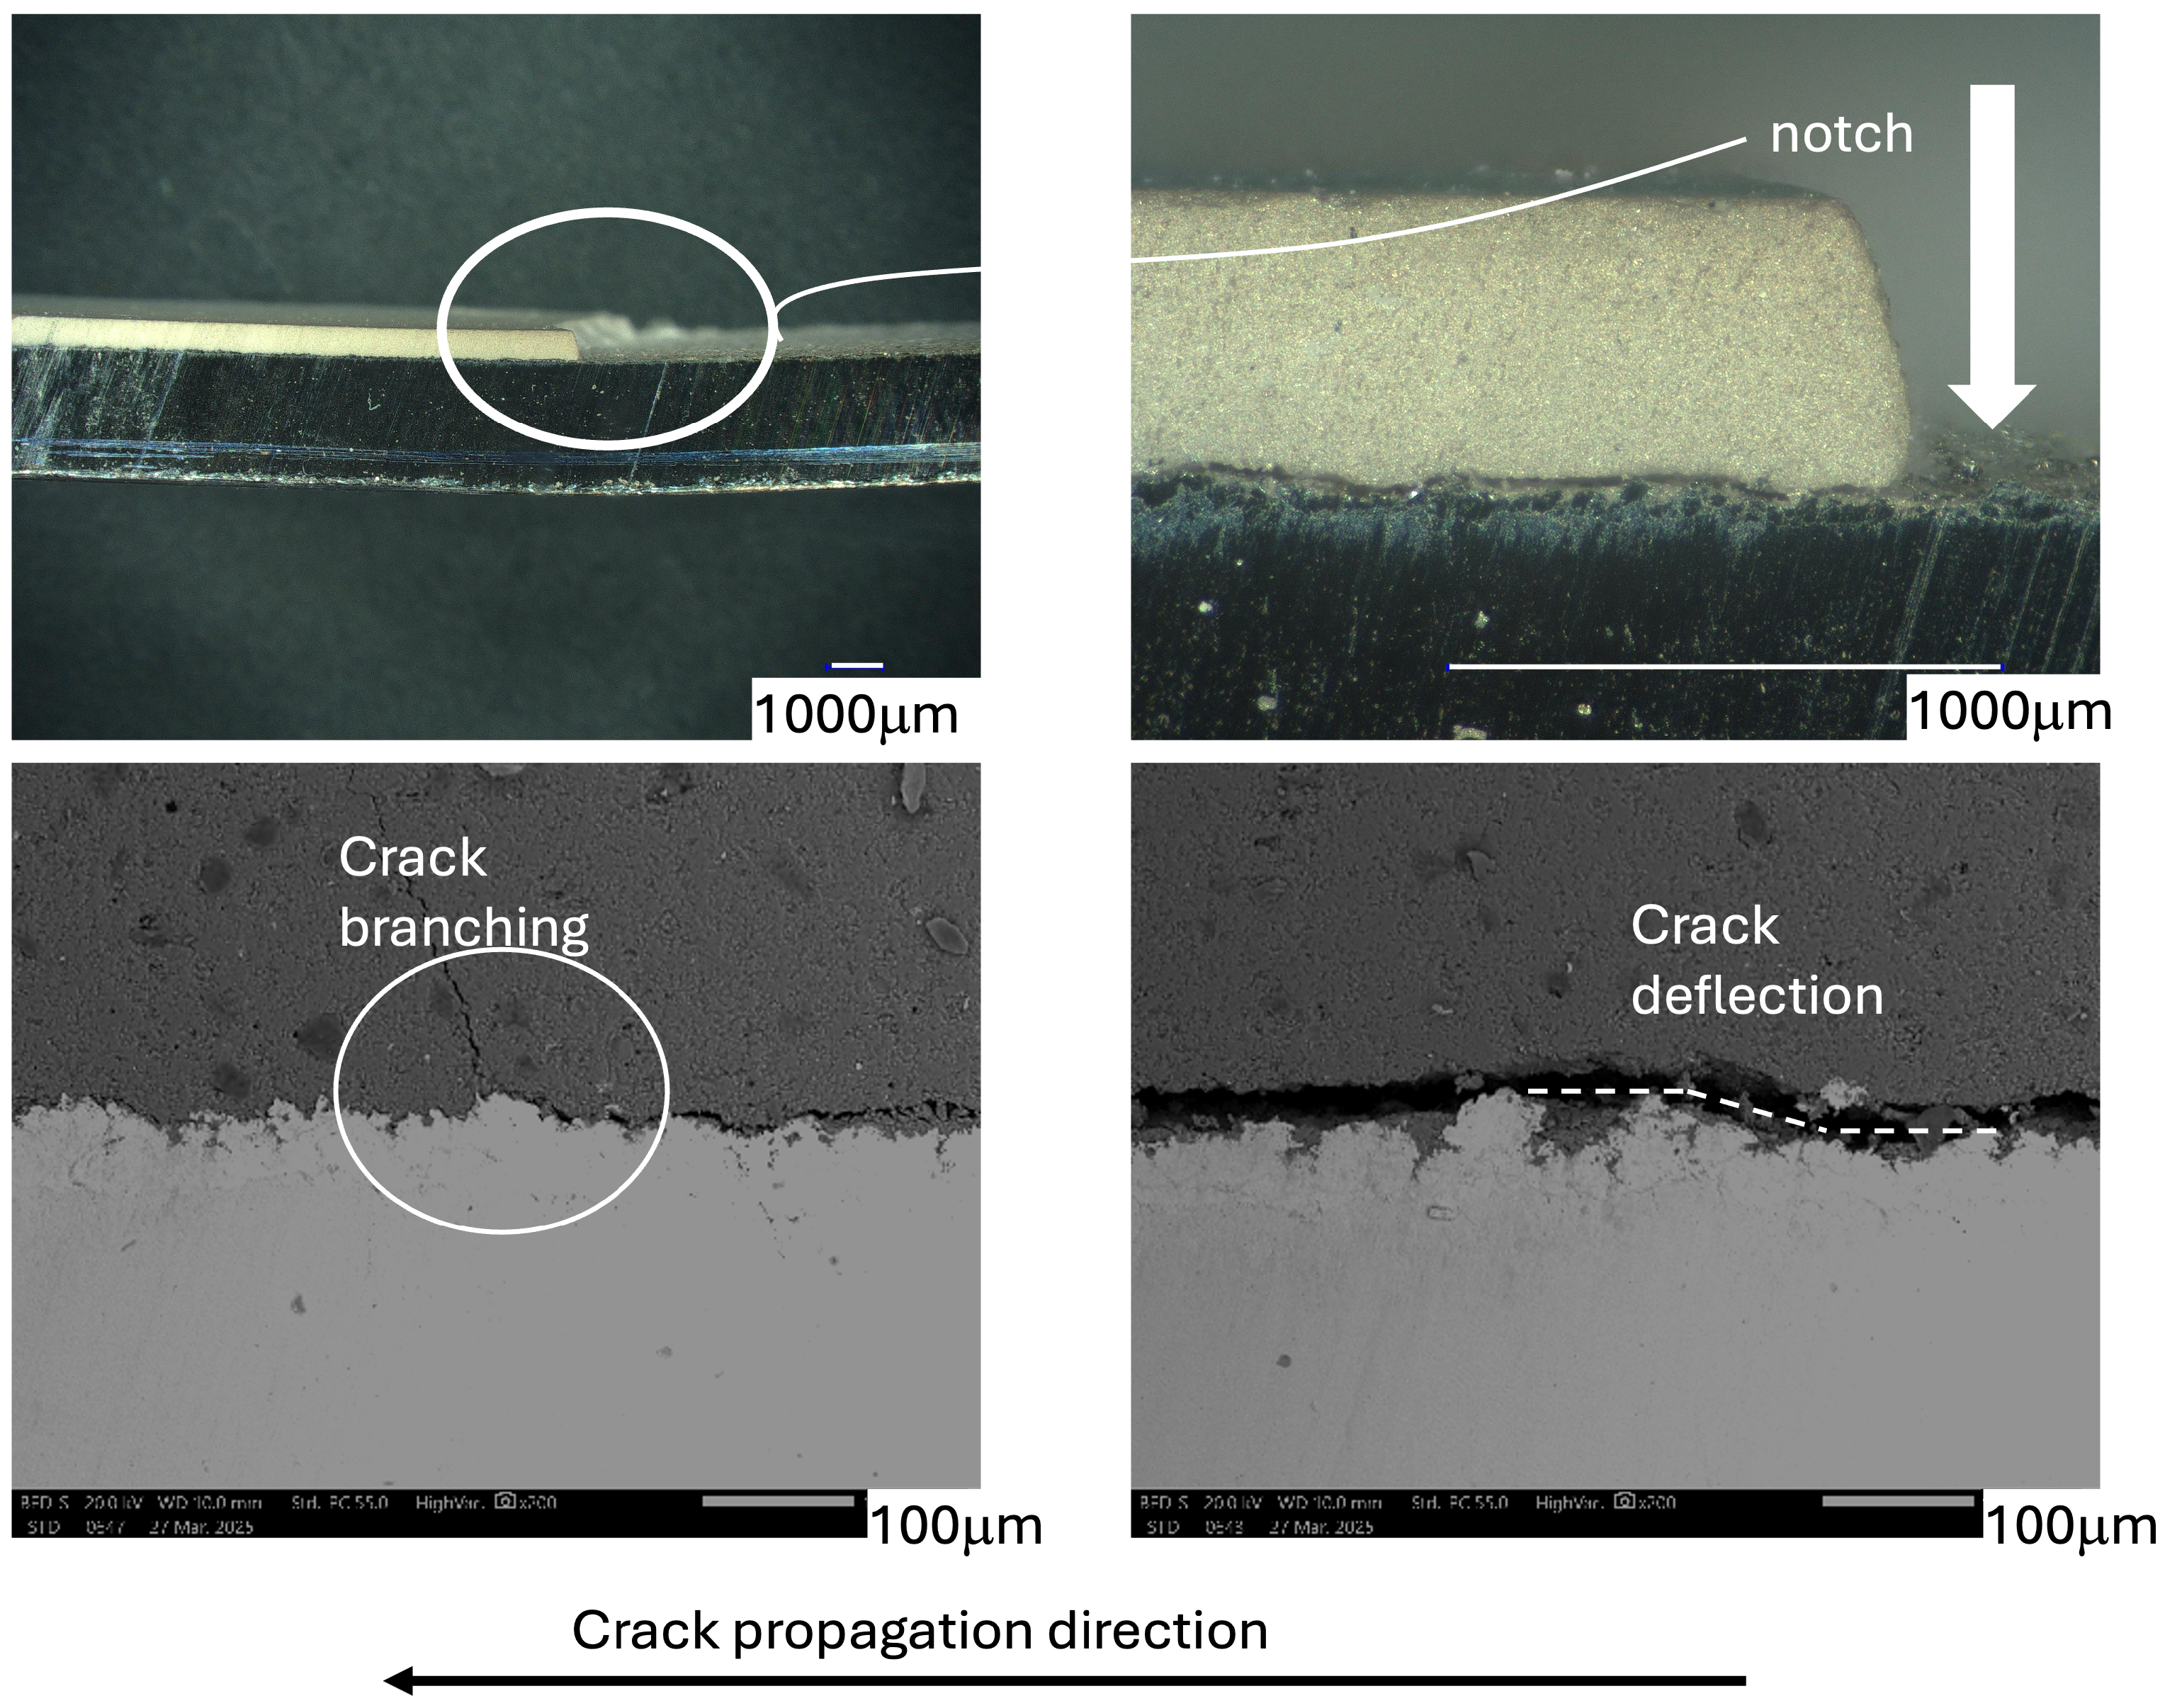
Figure 22 shows the crack growth in beam 2 (300 µm, 45 kW). Cross-sectional SEM analysis reveals a mixed-mode crack path: (i) a shallow lateral crack layer nucleated beneath the contact and (ii) segments of interfacial delamination along the A l 2 O 3 -Ni interlayer caused by high interfacial shear (Mode II). As the crack exits the contact zone, it transitions to cohesive propagation within the alumina, with visible deflection along splat boundaries and occasional branching, forming a tortuous, energy-dissipating path [46,51,52,53].
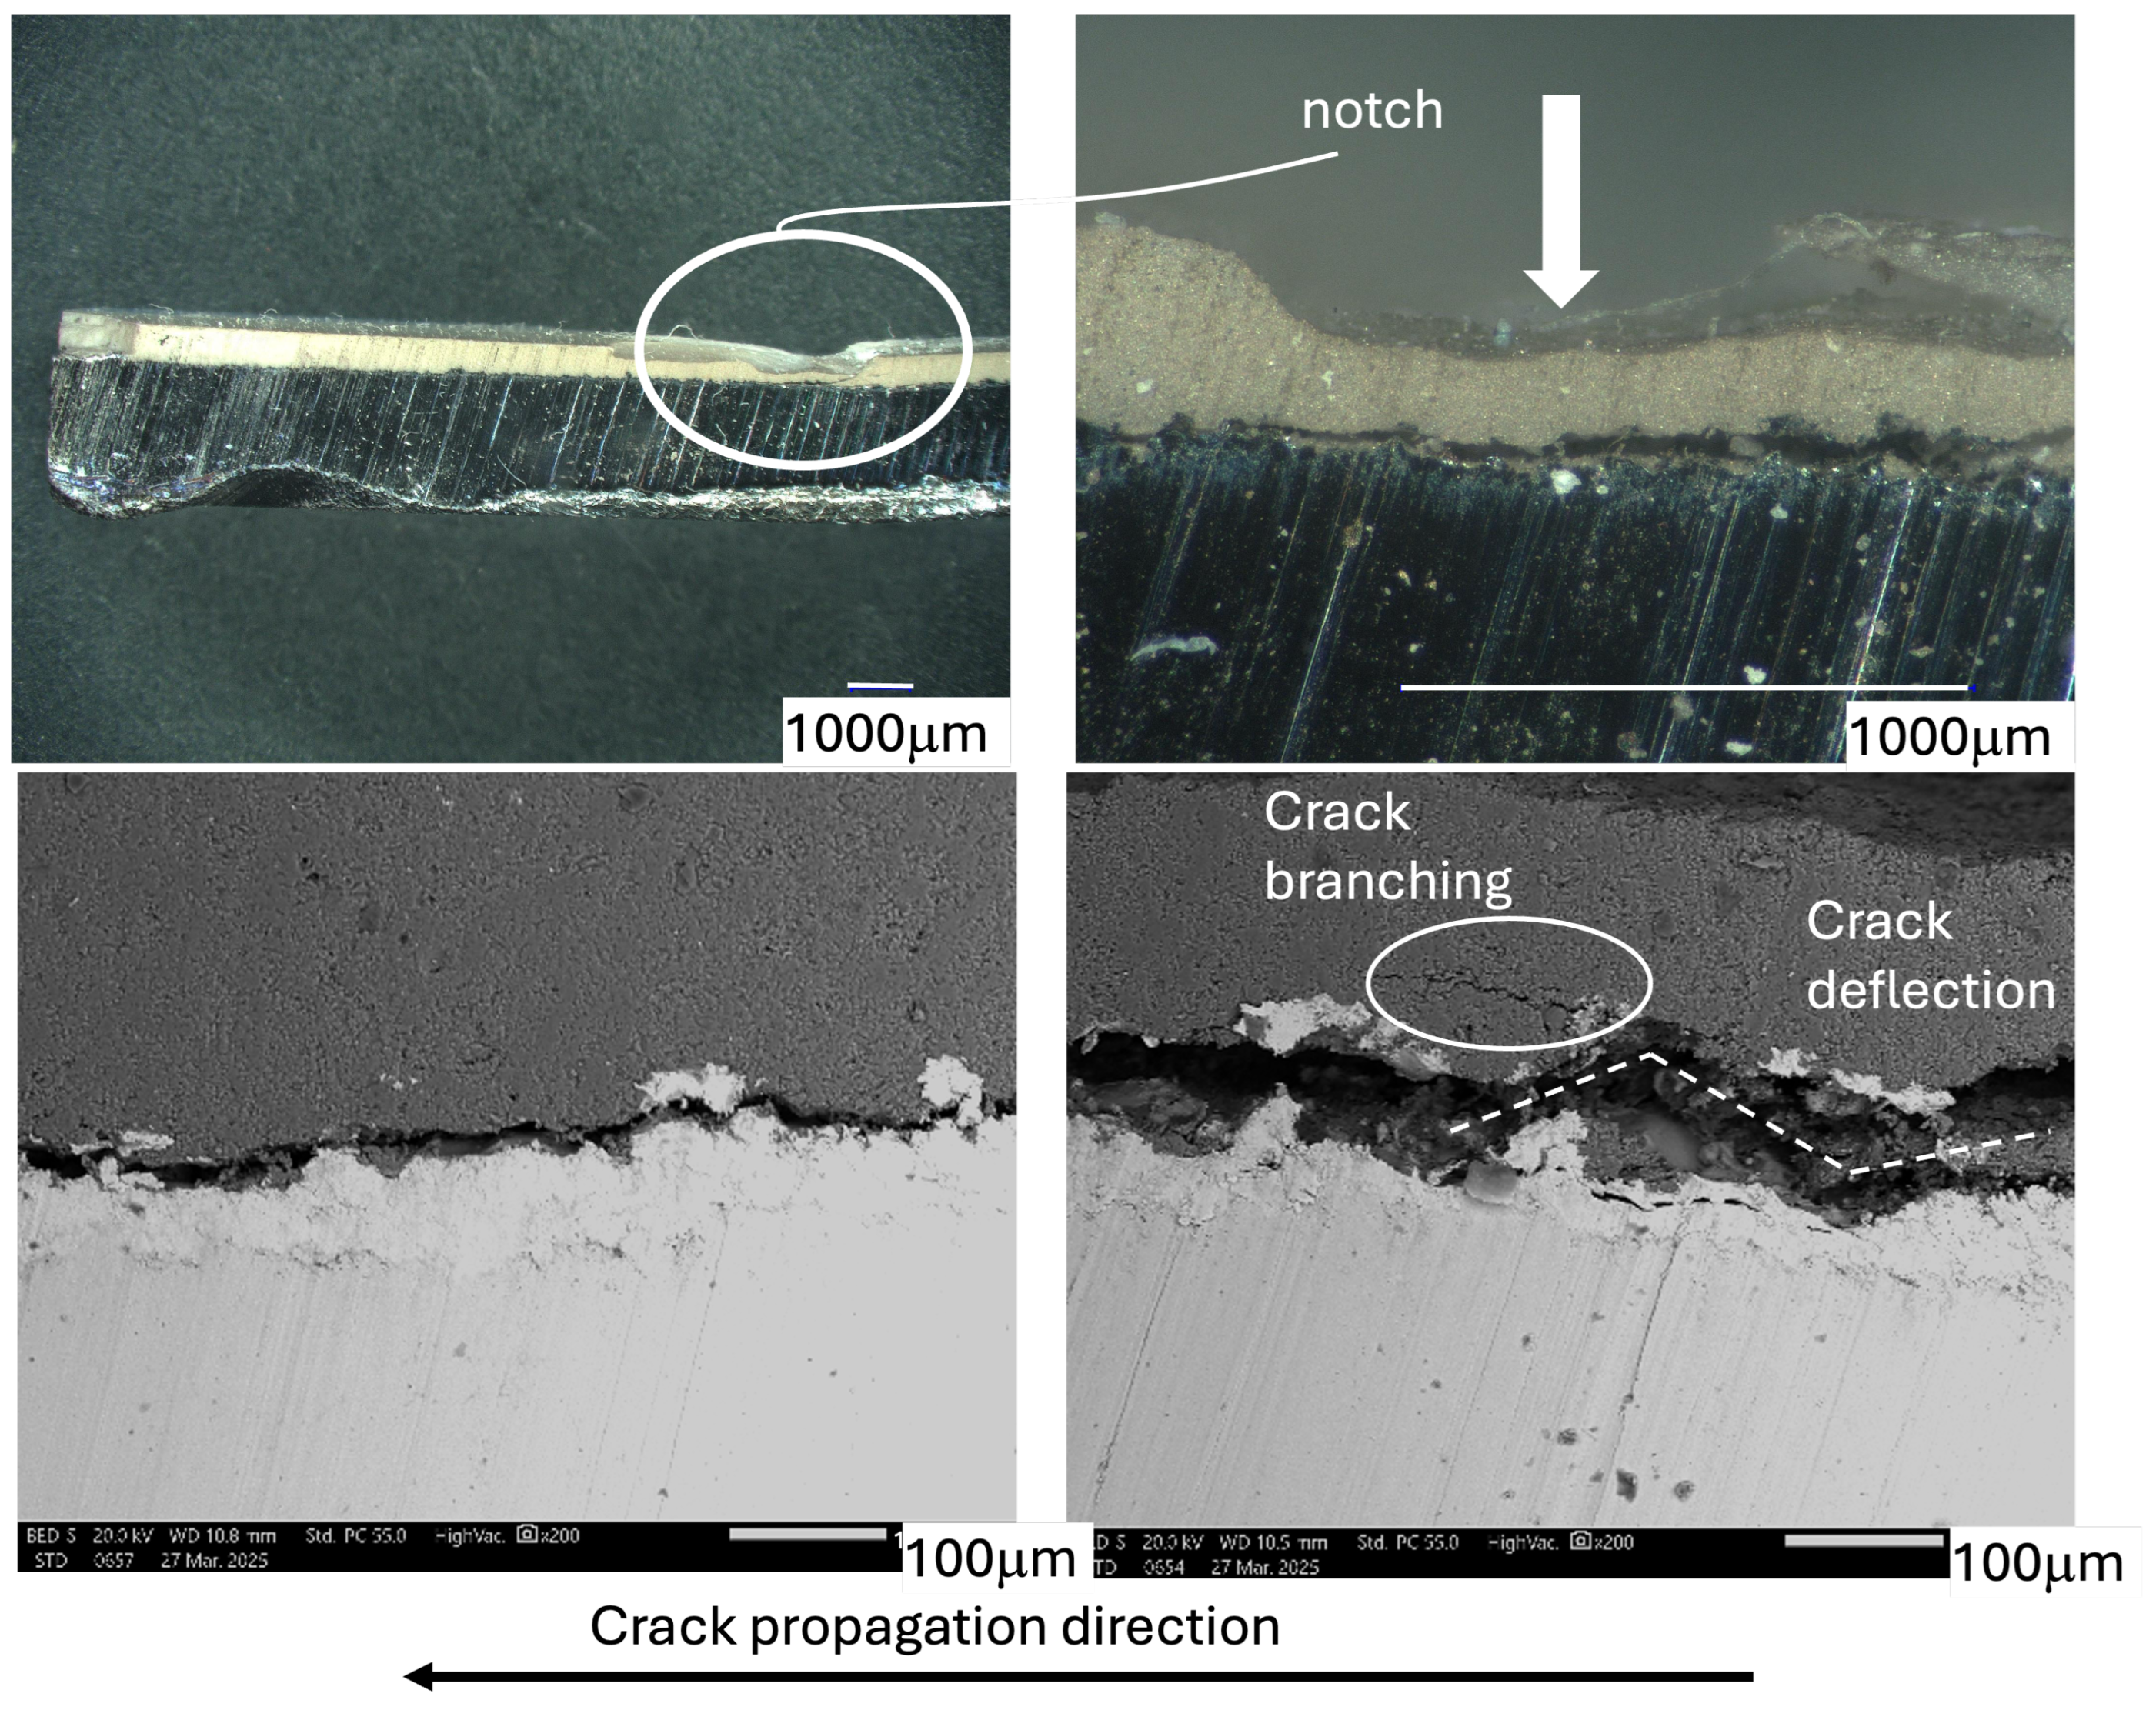
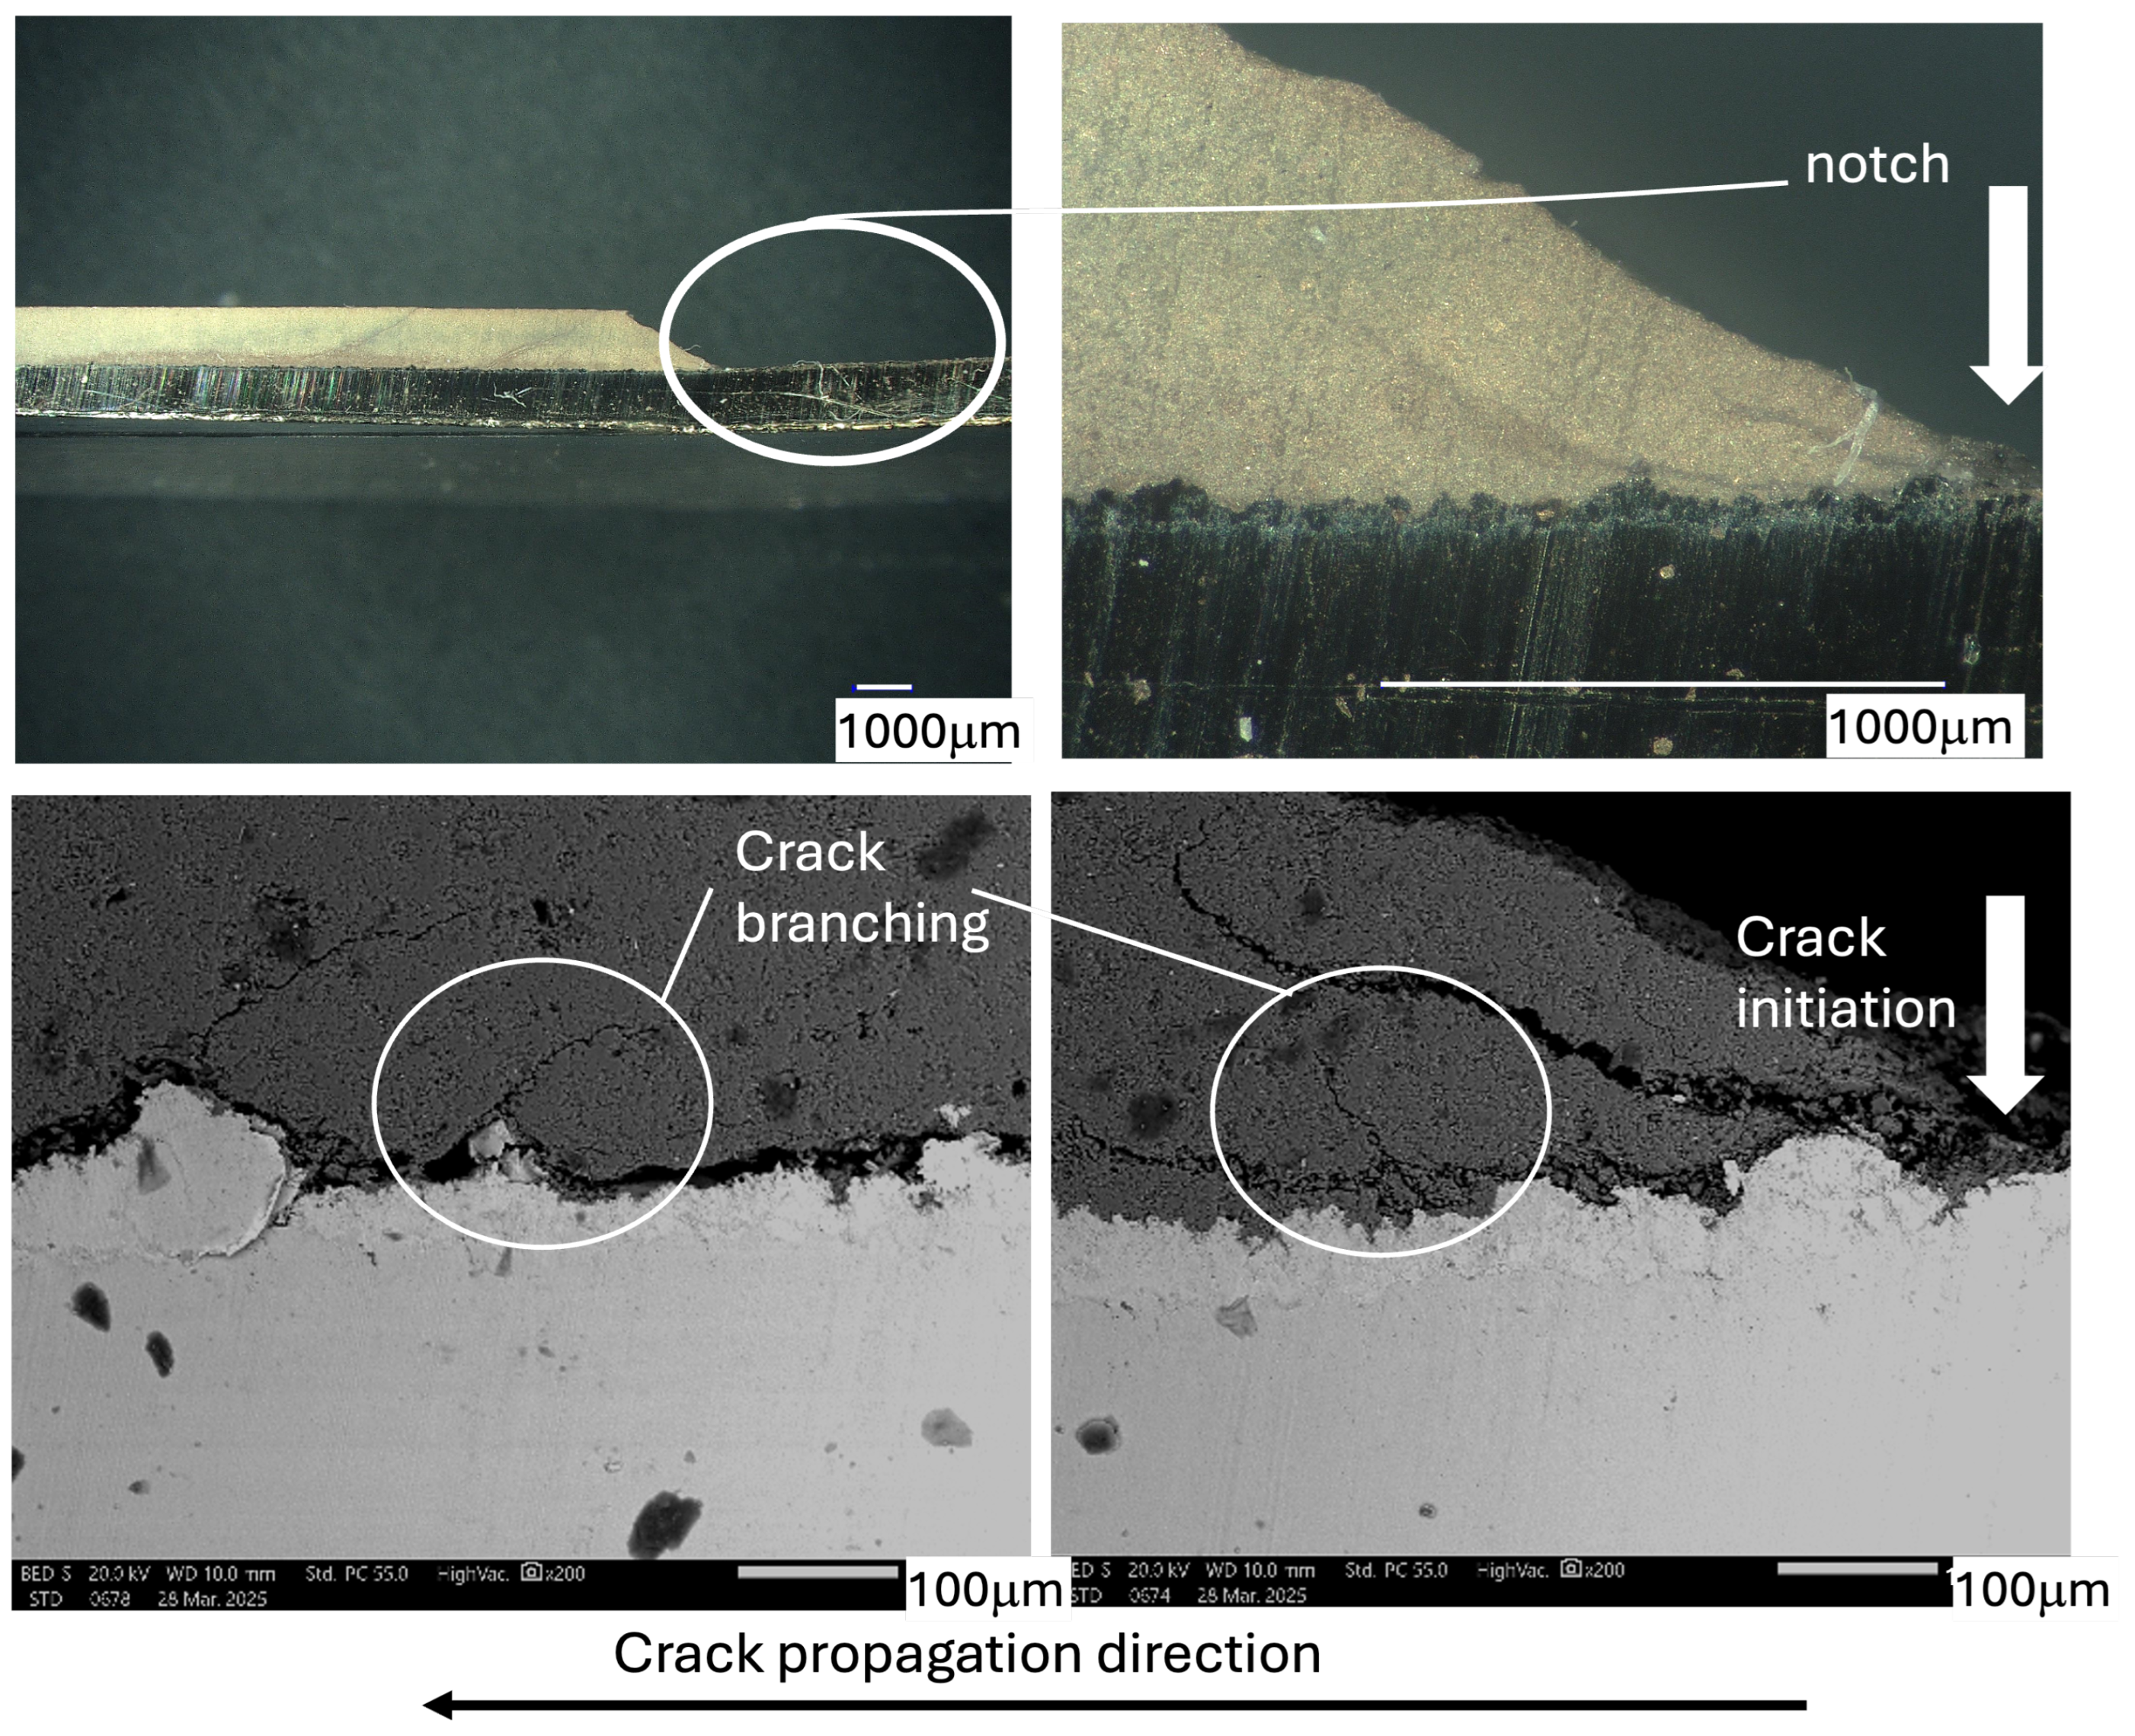
Figure 23 and Figure 24 show the crack growth in Beams (3 and 4) with a thickness of 500 µm and powers of 39 kW and 45 kW, respectively. Figure 23 shows a Mode-II (shear) interfacial delamination running along the A l 2 O 3 -Ni boundary with tight crack faces and no continuous resin-filled gap. The local crack opening is smaller than 45 kW, and it remains confined to a narrow band beneath the loading span, consistent with an interface-controlled path and the broader spalled region seen in the top-view image (Figure 19). Figure 24 shows that the crack path is likewise interfacial (Mode-II dominated); however, a localized wedge-shaped opening is observed immediately under the loading nose, with crack opening larger than 39 kW. The crack remains tight from the contact zone and does not evolve into wide-area delamination, in agreement with the top-view image (narrow scuff and no large spall). Because crack opening is a local quantity that can be amplified by contact/buckling effects and sectioning geometry, we interpret it together with surface evidence and the limited spatial extent of the debond [46,51,52,53].
Figure 25 and Figure 26 show crack growth in Beam 5 and in Beam 6 that are 1000 µm thick, exposed to power levels of 39 kW and 45 kW, respectively. In Figure 25, damage begins under the loading nose and spreads across a wide, rough, spalled area. Adhesive interfacial delamination along the A l 2 O 3 -Ni interlayer is mainly Mode-II shear-dominated. The broad peel indicates that the interface is the weakest pathway. SEM reveals a branched network of cohesive cracks (interlamellar or splat-boundary) that periodically connect to the interface. These connections feed the delamination front, allowing the spalled region to expand. At this thickness and power, high residual contact-induced shear plus a defect-rich lamellar structure favour interface-controlled failure with extensive peeling. In Figure 26, a narrow scuff band forms beneath the loading nose; the surrounding surface remains largely intact with limited local peel. Still, interfacial segments are present (Mode-II shear), but they are short and intermittent. SEM shows a long lamella-parallel (interlamellar) crack within the alumina, with deflection and occasional branching; these cohesive paths dissipate energy and confine the damaged zone. Although the crack touches the interface, the failure is less prone to delamination than at 39 kW. Higher torch power improves splat wetting and cohesion, so the fracture becomes more cohesive with limited adhesive segments and less delaminated area [46,51,52,53].

4. Conclusions

  • Increasing torch power to 45 kW generally reduced cross-sectional porosity; the 500 µm condition showed globular pores, consistent with gas entrapment at higher thermal input.
  • Surface roughness stayed near 1.0 µm (Ra) for all conditions and did not drive the observed mechanical responses.
  • Vickers hardness (HV2) increased with torch power and peaked at approximately 500 µm; the reduced values at 300 µm were attributed to incomplete lamellar overlap and open porosity, while those at 1000 µm were attributed to residual-stress-assisted microcracking.
  • Flexural strength was maximized at 500 µm and was higher at 45 kW than at 39 kW; fractography showed a shift from interface-dominated delamination to cohesive, tortuous intra-coating cracking at 45 kW.
  • For adhesion, 63 MPa was measured for 300 µm/45 kW; additional statistics are not disclosed under industrial confidentiality.
  • In this study, a coating thickness of 500 µm and a torch power of 45 kW are supported for A l 2 O 3 coatings on 100Cr6 steel with a Ni interlayer. Densification and crack-path deflection are balanced under these conditions, improving hardness and flexural properties.
Future work will (i) expand mechanical durability assessment through cyclic three-point bending on coated beam specimens and (ii) investigate tribological performance by conducting wear tests (e.g., ball-on-disk/pin-on-disk) on coated disks to link roughness/open pits to friction and wear mechanisms. In parallel, adhesion will be quantified with increased statistical coverage (multiple replicates) and complemented by fracture-based metrics where possible. Finally, XRD will be employed to determine the A l 2 O 3 phase composition ( α / γ ) and to assess residual stresses, enabling a more complete interpretation of the power- and thickness-dependent microstructure and failure behavior.

Author Contributions

Conceptualization: D.K., R.S., and N.S.; supervision: R.S., S.R., K.K., and D.K.; methodology: R.S. and N.S.; validation: R.S.; writing—original draft preparation: R.S. and N.S.; funding acquisition: S.R. and K.K.; project administration: D.K. and S.R. All authors have read and agreed to the published version of the manuscript.

Funding

This publication is part of the project PNRR-NGEU, which received funding from MUR-DM 352/2022.

Data Availability Statement

Data will be available on request.

Acknowledgments

We acknowledge Tocalo Co., Ltd. for conducting APS coating deposition and establishing the coating process parameters. We also thank Alberto Carano for their technical assistance with experimental testing and material characterization.

Conflicts of Interest

Authors N.S. and S.R. were employed by TN ITALY. Author K.K. was employed by Tsubaki Nakashima Japan. Author D.K. was employed by TOCALO Co., Ltd. The remaining authors declare that the research was conducted in the absence of any commercial or financial relationships that could be construed as a potential conflict of interest.

References

  1. Karabulut, S.; Binali, R.; Korkmaz, M.E.; Çetin, T. Machining of AISI 52100 Steel: Statistical Insights into Dry Environment with Variable Tool Nose Radius. Nat. Appl. Sci. East 2025, 8, 39–52. [Google Scholar] [CrossRef]
  2. Ang, A.S.M.; Berndt, C.C.; Cheang, P. Deposition Effects of WC Particle Size on Cold Sprayed WC–Co Coatings. Surf. Coat. Technol. 2011, 205, 3260–3267. [Google Scholar] [CrossRef]
  3. Singh, S.; Singh, P.; Singh, H.; Buddu, R.K. Characterization and Comparison of Copper Coatings Developed by Low-Pressure Cold Spraying and Laser Cladding Techniques. Mater. Today Proc. 2019, 18, 830–840. [Google Scholar] [CrossRef]
  4. Singh, S.; Raman, R.K.S.; Berndt, C.C.; Singh, H. Influence of Cold Spray Parameters on Bonding Mechanisms: A Review. Metals 2021, 11, 2016. [Google Scholar] [CrossRef]
  5. Singh, S.; Berndt, C.C.; Singh Raman, R.K.; Singh, H.; Ang, A.S.M. Applications and Developments of Thermal Spray Coatings for the Iron and Steel Industry. Materials 2023, 16, 516. [Google Scholar] [CrossRef]
  6. Tillmann, W.; Khalil, O.; Abdulgader, M. Porosity Characterization and Its Effect on Thermal Properties of APS-Sprayed Alumina Coatings. Coatings 2019, 9, 601. [Google Scholar] [CrossRef]
  7. Pavitra, B.; Padture, P.; Alexandre, V. Improved interfacial mechanical properties of Al2O3—13wt.% TiO2 plasma-sprayed coatings derived from nanocrystalline powders. Acta Mater. 2003, 51, 2959–2970. [Google Scholar]
  8. Heimann, R.B. Quality Control and Assurance Procedures. In Plasma Spray Coating: Principles and Applications, 2nd ed.; Heimann, R.B., Ed.; Wiley-VCH Verlag GmbH & Co. KGaA: Weinheim, Germany, 2008; pp. 217–219. [Google Scholar]
  9. Boulos, M.I.; Fauchais, P.L.; Heberlein, J.V.L. Industrial Applications of Thermal Spray Technology. In Plasma Spray Coating: Principles and Applications, 2nd ed.; Boulos, M.I., Fauchais, P.L., Heberlein, J.V.L., Eds.; Springer Nature: Cham, Switzerland, 2021; pp. 997–1083. [Google Scholar]
  10. Yang, Y.; Wang, Y.; Tian, W.; Yan, D.; Zhang, J.; Wang, L. Influence of composite powders’ microstructure on the microstructure and properties of Al2O3TiO2 coatings fabricated by plasma spraying. Mater. Des. 2015, 65, 814–822. [Google Scholar] [CrossRef]
  11. Song, E.P.; Hwang, B.; Lee, S.; Kim, N.J.; Ahn, J. Correlation of microstructure with hardness and wear resistance of stainless-steel blend coatings fabricated by atmospheric plasma spraying. Mater. Sci. Eng. A 2006, 429, 189–195. [Google Scholar] [CrossRef]
  12. Lin, X.; Zeng, Y.; Ding, C.; Zhang, P. Effects of temperature on tribological properties of nanostructured and conventional Al2O3–3 wt.% TiO2 coatings. Wear 2004, 256, 1018–1025. [Google Scholar] [CrossRef]
  13. Yin, Z.; Tao, S.; Zhou, X.; Ding, C. Particle in-flight behavior and its influence on the microstructure and mechanical properties of plasma-sprayed Al2O3 coatings. J. Eur. Ceram. Soc. 2008, 28, 1143–1148. [Google Scholar] [CrossRef]
  14. Sahab, A.R.M.; Saad, N.H.; Kasolang, S.; Saedon, J. Impact of Plasma Spray Variables Parameters on Mechanical and Wear Behaviour of Plasma Sprayed Al2O3 3% wt TiO2 Coating in Abrasion and Erosion Application. Procedia Eng. 2012, 41, 1689–1695. [Google Scholar] [CrossRef]
  15. Wang, C.; Fan, L.; Fan, J.; Zhang, D.; Wang, H. Effect of spraying power on microstructure and properties of supersonic plasma-sprayed Al2O3 coating on porous Si3N4 substrate. J. Alloys Compd. 2013, 559, 152–157. [Google Scholar] [CrossRef]
  16. Song, E.P.; Ahn, J.; Lee, S.; Kim, N.J. Effects of critical plasma spray parameter and spray distance on wear resistance of Al2O3–8 wt.%TiO2 coatings plasma-sprayed with nanopowders. Surf. Coat. Technol. 2008, 202, 3625–3632. [Google Scholar] [CrossRef]
  17. Shahien, M.; Suzuki, M. Low power consumption suspension plasma spray system for ceramic coating deposition. Surf. Coat. Technol. 2017, 318, 11–17. [Google Scholar] [CrossRef]
  18. Jambagi, S.C. Scratch adhesion strength of plasma-sprayed carbon nanotube reinforced ceramic coatings. J. Alloys Compd. 2017, 728, 126–137. [Google Scholar] [CrossRef]
  19. Shiby Mathew, J.; Marcinauskas, L.; Kavaliauskas, Ž.; Kėželis, R.; Kalin, M. Effect of Spraying Power on the Tribological Properties of Alumina and Alumina-Graphite Coatings. Coatings 2023, 13, 1165. [Google Scholar] [CrossRef]
  20. Prashar, G.; Thakur, L.; Vasudev, H. Coating Structure. In Thermal Spray Coatings; Thakur, L., Vasudev, H., Eds.; CRC Press (Taylor & Francis): Boca Raton, FL, USA, 2021; p. 7. [Google Scholar]
  21. Zhao, D.; Coyle, T.W.; Chien, K. Phase composition and microstructure of yttrium aluminium garnet (YAG) coatings prepared by suspension plasma spraying of Y2O3–Al2O3 powders. Surf. Coat. Technol. 2013, 235, 303–309. [Google Scholar] [CrossRef]
  22. Sivakumar, G.; Dusane, R.O.; Joshi, S.V. A novel approach to process phase pure α-Al2O3 coatings by solution precursor plasma spraying. J. Eur. Ceram. Soc. 2013, 33, 2823–2829. [Google Scholar] [CrossRef]
  23. Arikan, V. Effects of infill patterns and densities on crack propagation behavior in additive manufactured parts: A comparative study. Mater. Test. 2023, 65, 1609–1614. [Google Scholar] [CrossRef]
  24. Rasu, K.; Veerabathiran, A. Performance of high-strength natural fiber reinforced hybrid composites for structural engineering applications. Mater. Test. 2025, 67, 553–560. [Google Scholar] [CrossRef]
  25. Kumar, A.; Sharma, K.; Dixit, A.R. Tensile, flexural and interlaminar shear strength of carbon fiber reinforced epoxy composites modified by graphene. Polym. Bull. 2023, 80, 7469–7490. [Google Scholar] [CrossRef]
  26. Kallel, M.; Elleuch, K. Review on three-point bending test for evaluating the mechanical properties, fracture behavior, and adhesion strength of coating/substrate systems. Mater. Test. 2025, 67, 747–775. [Google Scholar] [CrossRef]
  27. ISO 6507-1:2023; Metallic Materials—Vickers Hardness Test—Part 1: Test Method. International Organization for Standardization: Geneve, Switzerland, 2023.
  28. ASTM C633; Standard Test Method for Adhesion or Cohesion Strength of Thermal Spray Coatings. ASTM International: West Conshohocken, PA, USA, 2021.
  29. Guilemany, J.M.; Nutting, J.; Portillo, J.; Urban, M. The Structure of an Interlayer used to Improve the Adhesion of Plasma Sprayed Al2O3 Coatings onto a Steel Substrate. In High Temperature Surface Engineering; Nicholls, J., Ed.; CRC Press: London, UK, 2020. [Google Scholar]
  30. Li, C.J.; Luo, X.T.; Yao, S.W.; Li, G.R.; Li, C.X.; Yang, G.J. The Bonding Formation during Thermal Spraying of Ceramic Coatings: A Review. J. Therm. Spray Technol. 2022, 31, 780–817. [Google Scholar] [CrossRef]
  31. Pawlowski, L. Coating Build-up. In The Science and Engineering of Thermal Spray Coatings, 2nd ed.; John Wiley & Sons Ltd.: Hoboken, NJ, USA, 2008; pp. 221–291. [Google Scholar]
  32. Altaf, S.F.; Rahman, A.; Wani, M.F. Nanostructured Thermal Barrier Coatings via Magnetron Sputtering: A Review of Enhanced Performance and Durability. Int. J. Ceram. Eng. Sci. 2025, 7, e70018. [Google Scholar] [CrossRef]
  33. Dangi, S.; Chaudhary, S.; Walia, R.S.; Karloopia, J.; Katiyar, J.K. Tribo-corrosion, mechanical, and morphological performance of multilayer ceramics deposited on cast iron via HVOF thermal spray. Tribol. Int. 2025, 212, 110999. [Google Scholar] [CrossRef]
  34. Klyatskina, E.; Espinosa-Fernández, L.; Darut, G.; Segovia, F.; Salvador, M.D.; Montavon, G.; Agorges, H. Sliding wear behaviour of Al2O3–TiO2 coatings fabricated by the suspension plasma spraying technique. Tribol. Lett. 2015, 59, 8. [Google Scholar] [CrossRef]
  35. Šuopys, A.; Grigaitienė, V.; Marcinauskas, L.; Kėželis, R.; Uscila, R.; Aikas, M. Influence of Plasma Torch Power on the Plasma Jet Properties and Microstructure of Alumina Coatings. Coatings 2022, 12, 934. [Google Scholar] [CrossRef]
  36. Starosta, B.; Dyl, T. After-Machining Surface Layer of Composite Coatings Obtained by Thermal Spraying. Coatings 2022, 12, 956. [Google Scholar] [CrossRef]
  37. Rotich, S.K.; Kipkirui, N.G.; Lin, T.T.; Chen, S.H. Effect of Varying Plasma Powers on High-Temperature Applications of Plasma-Sprayed Al0.5CoCrFeNi2Ti0.5 Coatings. Materials 2022, 15, 7198. [Google Scholar] [CrossRef]
  38. Huang, W.; Zeng, N.; Zhong, R.; Zhou, X.; Zhu, L. Effects of critical plasma spraying parameters on microstructure and mechanical properties of LaPO4-8YSZ thick composite coatings. J. Alloys Compd. 2023, 938, 168688. [Google Scholar] [CrossRef]
  39. Odhiambo, J.G.; Li, W.G.; Zhao, Y.T.; Li, C.L. Porosity and Its Significance in Plasma-Sprayed Coatings. Coatings 2019, 9, 460. [Google Scholar] [CrossRef]
  40. Ctibor, P.; Lechnerová, R.; Beneš, V. Quantitative analysis of pores of two types in a plasma-sprayed coating. Mater. Charact. 2006, 56, 297–304. [Google Scholar] [CrossRef]
  41. Rivero-Antúnez, P.; Cano-Crespo, R.; Sánchez-Bajo, F.; Domínguez-Rodríguez, A.; Morales-Florez, V. Reactive SPS for sol–gel alumina samples: Structure, sintering behavior, and mechanical properties. J. Eur. Ceram. Soc. 2021, 41, 5548–5557. [Google Scholar] [CrossRef]
  42. Karthikeyan, S.; Raja, S.; Balasubramanian, V.; Yishak, S. Evaluation of microstructure and mechanical properties of thermally sprayed NiCrAlY bond coats on Superni C-263 aero engine combustor liner alloy. Results Eng. 2025, 26, 105060. [Google Scholar] [CrossRef]
  43. Hutchinson, J.W.; Suo, Z. Mixed Mode Cracking in Layered Materials. Adv. Appl. Mech. 1991, 29, 63–191. [Google Scholar]
  44. Valvo, P.S. The effects of shear on Mode II delamination: A critical review. Fract. Struct. Integr. 2018, 12, 123–139. [Google Scholar] [CrossRef]
  45. Okuma, G.; Maeda, K.; Yoshida, S.; Takeuchi, A.; Wakai, F. Morphology of subsurface cracks in glass-ceramics induced by Vickers indentation observed by synchrotron X-ray multiscale tomography. Sci. Rep. 2022, 12, 6994. [Google Scholar] [CrossRef]
  46. Amer, M.; Curry, N.; Arshad, M.; Hayat, Q.; Janik, V.; Nottingham, J.; Bai, M. Unraveling the Cracking Mechanisms of Air Plasma-Sprayed Thermal Barrier Coatings: An In-Situ SEM Investigation. Coatings 2023, 13, 1493. [Google Scholar] [CrossRef]
  47. Ghasemi, M.A.; Falahatgar, S.R. Damage evolution in brittle coating/substrate structures under three-point bending using discrete element method. Surf. Coatings Technol. 2019, 358, 567–576. [Google Scholar] [CrossRef]
  48. Yin, Z.; Tao, S.; Zhou, X. Effect of the thickness on properties of Al2O3 coatings deposited by plasma spraying. Mater. Charact. 2011, 62, 90–93. [Google Scholar] [CrossRef]
  49. Wei, C.; Zhang, X.; Li, S. Laminated ZrB2–SiC/graphite ceramics with simultaneously improved flexural strength and fracture toughness. Ceram. Int. 2014, 40, 5001–5006. [Google Scholar] [CrossRef]
  50. Zhao, W.; Hu, Z.; Wang, L.; Wang, X.; Wu, Q.; Liu, R. Effect of Top-Coat Thickness and Interface Fluctuation on the Residual Stress in APS-TBCs. Coatings 2023, 13, 1659. [Google Scholar] [CrossRef]
  51. Martins, J.; Yu, H.; Chen, Y.; Brewster, G.; McIntyre, R.; Xiao, P. Effect of bond coat topography on the fracture mechanics and lifetime of air-plasma-sprayed thermal barrier coatings. Surf. Coatings Technol. 2021, 421, 127447. [Google Scholar] [CrossRef]
  52. Miao, X.; Zhang, J.; Hong, H.; Peng, J.; Zhou, B.; Li, Q. Study on Elastic Mixed Mode Fracture Behavior and II-III Coupling Effect. Materials 2023, 16, 4879. [Google Scholar] [CrossRef] [PubMed]
  53. Manam, B.U.; Langhof, N.; Sitzmann, C.; Schafföner, S. Overview of interfacial fracture toughness testing of ceramic coatings at room and elevated temperatures. Theor. Appl. Fract. Mech. 2025, 140, 105142. [Google Scholar] [CrossRef]
Figure 1. (a) SEM micrographs of alumina powder at 200×, 500×, and 1000×; (b) particle size distribution.
Jmmp 10 00068 g001
Figure 2. Disk samples: (a) coated surface and (b) side view.
Jmmp 10 00068 g002
Figure 3. Pull-off adhesion (ASTM C633) test configuration.
Jmmp 10 00068 g003
Figure 4. Three-point bending test setup.
Jmmp 10 00068 g004
Figure 5. Keyence 10× micrographs of A l 2 O 3 coatings: 39 kW (ac) vs. 45 kW (df).
Jmmp 10 00068 g005
Figure 6. Keyence 100× micrographs of beam cross-sections: 39 kW (ac) vs. 45 kW (df).
Jmmp 10 00068 g006
Figure 7. SEM micrographs of beam cross-sections: 39 kW (ac) vs. 45 kW (df).
Jmmp 10 00068 g007
Figure 8. Micrographic cross-sectional SEM images at 1000× magnification for Beam 3 (a) and Beam 4 (b).
Jmmp 10 00068 g008
Figure 9. Qualitative EDS maps for Beam 3 (500 µm, 39 kW). Color/brightness represents relative EDS signal intensity (brighter = higher counts), and the colors are used for visualization.
Jmmp 10 00068 g009
Figure 10. SEM micrograph: surface morphology of Beam 3 (500 µm, 45 kW).
Jmmp 10 00068 g010
Figure 11. 3D topographic map and line profile of Cylinder 1 (300 µm and 39 kW) surface. Optical profilometry surface-height map (a) and corresponding intensity image (b) for an APS A l 2 O 3 -coated disk.
Jmmp 10 00068 g011
Figure 12. Cross-section porosity analysis of coatings vs. thickness and plasma power.
Jmmp 10 00068 g012
Figure 13. Surface porosity analysis of coatings vs. thickness and plasma power.
Jmmp 10 00068 g013
Figure 14. Hardness measurement: (a) the embedded coated beam specimen (cross-section); (b) Vickers indentations on the ceramic coating.
Jmmp 10 00068 g014
Figure 15. Hardness values of cross-sectioned coated beams (HV2).
Jmmp 10 00068 g015
Figure 16. Load–displacement curves, grouped by thickness and power.
Jmmp 10 00068 g016
Figure 17. Flexural stress–strain curves vs. thickness and plasma power.
Jmmp 10 00068 g017
Figure 18. Flexural strength vs. thickness and plasma power.
Jmmp 10 00068 g018
Figure 19. Keyence 100× micrographs of beam surfaces after bending: 39 kW (ac) vs. 45 kW (df).
Jmmp 10 00068 g019
Figure 20. SEM cross-section after bending; Beam 1 (300 µm, 39 kW); regions A—C. Crack initiation at the coating–substrate interface (a); interfacial crack propagation/local debonding (b); crack branching with secondary cracks (c).
Jmmp 10 00068 g020
Figure 21. EDS map: Region A in Beam 1 (300 µm, 39 kW).
Jmmp 10 00068 g021
Figure 22. SEM cross-section after bending; Beam 2 (300 µm, 45 kW).
Jmmp 10 00068 g022
Figure 23. SEM cross-section after bending; Beam 3 (500 µm, 39 kW).
Jmmp 10 00068 g023
Figure 24. SEM cross-section after bending; Beam 4 (500 µm, 45 kW).
Jmmp 10 00068 g024
Figure 25. SEM cross-section after bending; Beam 5 (1000 µm, 39 kW).
Jmmp 10 00068 g025
Figure 26. SEM cross-section after bending; Beam 6 (1000 µm, 45 kW).
Jmmp 10 00068 g026
Table 1. Coating process parameter and dimensions for disk specimens.
Specimen IDCoating Thickness (µm)APS Plasma Power (kW)Total Axial Length (mm)Diameter (mm)
Disk 13003988.333
Disk 23004588.333
Disk 35003988.533
Disk 45004588.533
Disk 510003989.033
Disk 610004589.033
Table 2. Coating process parameter and dimensions for beam specimens.
Specimen IDCoating Thickness (µm)APS Plasma Power (kW)Total Axial Length (mm)Dimensions (Lxhxb, mm)
Beam 1300392.7524.5 × 9 × 2.75
Beam 2300452.5523 × 11 × 2.55
Beam 3500393.2028 × 9 × 3.20
Beam 4500452.7529 × 8.5 × 2.75
Beam 51000392.0027 × 10 × 2
Beam 61000452.5029 × 8 × 2.5
Table 3. Coating process parameters for nickel based interlayer and alumina coating.
ParameterDescriptionNi InterlayerAlumina Coating
Arc Power (kW)Plasma generation power4349
Plasma gasPlasma-generating gasArgon-H2Argon-H2
Carrier GasPowder-transporting gasArgonArgon
Powder Feed Rate (g/min)Rate of powder feeding2131
Spray AngleRelative to the surface90°90°
Thickness per pass (µm/pass)Thickness deposition per spray pass-12.4
Stand-off Distance (mm)Nozzle-to-substrate distance-120
APS Plasma Power (kW)Power setting during coating-39.45
Table 4. Roughness values of the coated cylinders.
SamplesDisc 1Disc 2Disc 3Disc 4Disc 5Disc 6
Thickness (µm)30050010003005001000
Plasma Power (kW)393939454545
Average Ra (µm)1.07081.11801.07500.96011.18360.9252
Disclaimer/Publisher’s Note: The statements, opinions and data contained in all publications are solely those of the individual author(s) and contributor(s) and not of MDPI and/or the editor(s). MDPI and/or the editor(s) disclaim responsibility for any injury to people or property resulting from any ideas, methods, instructions or products referred to in the content.