Abstract
To address the modeling complexity and multi-objective collaborative optimization challenges in multi-depot and multiple unmanned aerial vehicle (UAV) delivery task planning, this paper proposes a bi-layer planning framework, which comprehensively considers resource constraints, multi-depot coordination, and the coupling characteristics of path execution. The novelty of this work lies in the seamless integration of an enhanced genetic algorithm and tailored swarm optimization within a unified two-tier architecture. The upper layer tackles the task assignment problem by formulating a multi-objective optimization model aimed at minimizing economic costs, delivery delays, and the number of UAVs deployed. The Enhanced Non-Dominated Sorting Genetic Algorithm II (ENSGA-II) is developed, incorporating heuristic initialization, goal-oriented search operators, an adaptive mutation mechanism, and a staged evolution control strategy to improve solution feasibility and distribution quality. The main contributions are threefold: (1) a novel ENSGA-II design for efficient and well-distributed task allocation; (2) an improved PSO-based path planner with chaotic initialization and adaptive parameters; and (3) comprehensive validation demonstrating substantial gains over baseline methods. The lower layer addresses the path planning problem by establishing a multi-objective model that considers path length, flight risk, and altitude variation. An improved particle swarm optimization (PSO) algorithm is proposed by integrating chaotic initialization, linearly adjusted acceleration coefficients and maximum velocity, a stochastic disturbance-based position update mechanism, and an adaptively tuned inertia weight to enhance algorithmic performance and path generation quality. Simulation results under typical task scenarios demonstrate that the proposed model achieves an average reduction of 47.8% in economic costs and 71.4% in UAV deployment quantity while significantly reducing delivery window violations. The framework exhibits excellent capability in multi-objective collaborative optimization. The ENSGA-II algorithm outperforms baseline algorithms significantly across performance metrics, achieving a hypervolume (HV) value of 1.0771 (improving by 72.35% to 109.82%) and an average inverted generational distance (IGD) of 0.0295, markedly better than those of comparison algorithms (ranging from 0.0893 to 0.2714). The algorithm also demonstrates overwhelming superiority in the C-metric, indicating outstanding global optimization capability in terms of distribution, convergence, and the diversity of the solution set. Moreover, the proposed framework and algorithm are both effective and feasible, offering a novel approach to low-altitude urban logistics delivery problems.
1. Introduction
With continuous advancements in intelligent sensing, navigation, and communication technologies, multiple unmanned aerial vehicle (UAV) systems have demonstrated significant application potential in fields such as urban delivery, emergency response, and inspection operations [1]. In particular, multi-UAV logistics distribution has emerged as a key research focus within intelligent transportation systems, attracting considerable attention from both academia and industry due to its rapid, efficient, and flexible cargo transportation capabilities. Fundamentally, the multi-UAV logistics distribution problem represents a complex combinatorial optimization challenge that involves several tightly coupled subproblems, such as task assignment, route planning, and resource scheduling. In contrast to deep reinforcement learning (DRL) approaches, which prioritize sequential decision-making through trial-and-error learning but face challenges in constraint satisfaction under large-scale combinatorial optimization, and transformer-based heuristics that excel in sequence modeling yet struggle with coupled spatial–temporal dependencies in multi-depot settings, this work develops a deterministic bi-layer co-evolutionary framework. Our method explicitly decomposes the problem into hierarchical optimization layers while preserving depot-task-UAV couplings—these problems are typically characterized by high dimensionality, strong nonlinearity, and multiple constraints [2].
However, the existing studies often overlook critical challenges in large-scale and dynamic settings—such as real-time task reallocation under changing environments and decentralized coordination among heterogeneous agents—which are essential for practical deployment. The multi-UAV logistics distribution problem is widely regarded as a representative application of multi-UAV task planning in practical scenarios. Both logistics distribution and task planning share high structural and decision-making consistency, encompassing essential elements such as task allocation, route generation, and coordinated scheduling. From a modeling perspective, these problems require the integration of spatial topology, time window constraints, task priorities, and flight resource limitations into formalized models that reflect the operational characteristics of multi-UAV systems. At the algorithmic layer, task allocation and route planning are inherently interdependent and must be jointly optimized to enhance system-wide performance. Accordingly, the modeling and solution paradigms for multi-UAV logistics distribution exhibit substantial convergence with those for general task planning [3]. For instance, Wang et al. [4] proposed a resilient planning framework that incorporates task pre-assignment and reallocation modules, and they adopted an improved genetic algorithm for efficient optimization. Chang et al. [5] developed a cooperative search framework for UAV inspection route planning, combining regional grid-based decentralization and an adaptive initial solution generation strategy. Ahmed et al. [6] introduced a metaheuristic-based energy-efficient path planning method for UAV networks, aimed at minimizing energy consumption and optimizing coordination in densely obstructed environments. Li et al. [7] investigated the impact of wind fields in three-dimensional mountainous environments, constructing a wind-aware sensing space and designing a multi-objective cost function, along with an enhanced swarm intelligence algorithm. Jiang et al. [8] further extended the modeling structure by applying dominance rough set theory to hierarchical multi-UAV task assignment, achieving better decision interpretability and robustness. Yu et al. [9] proposed a deep reinforcement learning-assisted bi-level optimization method for multi-robot task allocation, enabling effective coordination in dynamic environments. Yang et al. [10] introduced a two-layer trajectory planning approach under four-dimensional constraints, significantly enhancing UAV coordination and safety in dense mission areas. Although these methods show good effectiveness in small-scale problems, their performance deteriorates as the task scale and UAV heterogeneity increase. Centralized approaches often fail to respond effectively to dynamic task environments and system fluctuations [11]. Moreover, such approaches lack structured information decomposition mechanisms, limiting their capacity to coordinate task-vehicle matching with path execution. Consequently, they exhibit limited adaptability and scalability in complex, large-scale, and constraint-intensive scenarios [12].
To address the aforementioned challenges, the development of hierarchical optimization models with explicit separation between the task layer and the routing layer has become a prominent research direction in multi-UAV task planning problems [13]. Specifically, the upper layer is responsible for determining task assignment strategies under global resource constraints, while the lower layer focuses on generating feasible routes for individual UAVs. These two layers not only pursue different optimization objectives but are also interconnected through bidirectional information flow and feedback mechanisms. Structuring such problems within a bi-layer optimization framework that explicitly delineates functional responsibilities facilitates the reduction in modeling complexity and solution dimensionality. Moreover, it enhances the adaptability of the system to dynamic task changes and heterogeneous resources, and it improves the interpretability and practical applicability of scheduling strategies [14]. For instance, the following has been achieved: Liu et al. [15] proposed DAWN, a two-layer deep framework combining global dynamic VRP assignment with local trust-network-based path planning; Gao et al. [16] introduced a two-stage (explore–exploit) hierarchical cooperation scheme for infrastructure inspection and reconstruction; Li and Liu [17] developed a bi-level planning method for agricultural logistics that jointly optimizes load distribution and flight time under battery constraints; Lei et al. [18] presented a Voronoi-partition-based hierarchical path planner for urban low-altitude environments; Liu et al. [19] designed a advanced a GA-NSGA-II bi-layer framework to minimize inspection distance variance in large-scale power-grid patrols. Cheng et al. [20] developed a distributed path planning approach for multi-UAV systems based on a bi-layer coordination framework, addressing the limitations of conventional methods such as low computational efficiency, poor scalability, and difficulties in collision avoidance in obstacle-rich environments. Yan [21] introduced an enhanced multi-type gene genetic algorithm to efficiently resolve the coupled problem of task assignment and route planning in cooperative UAV attack missions. Zhan et al. [22] proposed a genetic algorithm integrated with reinforcement learning (GA-RL) to jointly optimize task allocation and path planning in maritime multi-UAV search and rescue missions. Their approach employed dynamic population management and adaptive strategies to improve the rationality of task distribution and the efficiency of path search. Mao et al. [23] introduced DL-DRL, a double-level deep reinforcement learning approach to large-scale task scheduling, Chen et al. [24] formulated a differentiable spatiotemporal bilevel assignment model using OptNet for fast trajectory optimization, Gao et al. [25] presented an end-to-end attention-based encoder-decoder for 100-node mission planning, Wang et al. [26] applied hierarchical multi-agent RL combined with process mining to maritime search and rescue, and Li et al. [27] proposed a bi-level traffic-flow allocation method for multi-depot UAV route-network planning. However, most existing studies are based on a single-depot configuration and fail to address the practical demand for coordinated scheduling among multiple depots. The cited single-depot approaches inherently lack mechanisms to optimize cross-depot resource sharing, dynamic task reallocation between depots, or UAV routing across heterogeneous operational zones. Consequently, they cannot resolve the complex dependencies arising from the following: (i) heterogeneously distributed depot capacities and coverage radii, (ii) spatially unbalanced task densities requiring inter-depot UAV coordination, and (iii) conflicting optimization goals between local depot efficiency and global cost minimization.
In urban logistics, emergency response, and distributed operation scenarios, multiple depots typically participate simultaneously in task distribution and resource coordination. This leads to more complex spatial structures and competitive task environments. Our formulation explicitly overcomes these limitations through depot-coupled decision variables (e.g., for depot-task-UAV assignments) and constraints enforcing inter-depot load balancing. This allows the joint optimization of cross-depot task scheduling and UAV routing—capabilities absent from single-depot baselines. Under such conditions, traditional single-depot bi-layer models encounter significant limitations in adaptability. On the one hand, dynamic interactions such as resource sharing, task reassignment, and cross-regional scheduling among depots introduce coupling characteristics that cannot be effectively captured by simple task partitioning and independent route planning. On the other hand, routing problems under multi-depot settings often involve challenges such as cross-region task coverage, route synchronization, and service priority balancing, which impose more demanding requirements on both modeling capacity and computational efficiency [28]. Furthermore, the presence of multiple depots introduces more intricate real-world constraints. These include heterogeneous resource capabilities and coverage radii across depots, significantly uneven task point distributions, and the need to accommodate varying UAV flight performance, payload capacities, and configuration requirements under multi-task and heterogeneous matching mechanisms. These compounded factors intensify the dependency between the task and routing layers, further exacerbating performance degradation in decoupled modeling approaches [29]. These works collectively demonstrate the field’s move towards integrated, scalable, and efficient bi-layer frameworks customized for multi-depot, multi-UAV systems. Therefore, it is imperative to construct a bi-layer optimization framework that comprehensively captures multi-depot resource coordination mechanisms at the task layer, systematically integrates UAV heterogeneity and operational constraints at the routing layer, and enhances the feedback mechanisms between the two layers. This will facilitate the development of more intelligent, efficient, and scalable scheduling strategies.
As mentioned above, this study addresses the modeling complexity and multi-objective coordination challenges inherent to the bi-layer task planning problem for multi-depot, multi-UAV systems by developing a hierarchical task planning model. Specifically, this study is based on the hypothesis that constructing and applying a bi-layer optimization framework—explicitly coordinating task allocation across multiple depots at the upper layer and route planning for heterogeneous UAVs at the lower layer—can effectively improve the overall system performance. This includes minimizing total economic costs, cumulative task delays, and the UAV fleet size while satisfying operational constraints such as delay limits, depot time windows, UAV capacity, and flight path limitations. The upper-layer model focuses on task allocation, involving coordination among multiple depots and UAVs. The objective is to minimize the total economic cost, the cumulative task delay time, and the number of UAVs required. The model incorporates constraints including the maximum allowable delay time, depot closure time windows, UAV capacity and fleet size limitations, and the maximum flight path length. The lower-layer model is designed for route planning, taking into account multiple factors, such as the total path length, the exposure risk in hazardous grid regions, and the cost of altitude variation. Additional constraints, including altitude interval restrictions and climb rate limits, are introduced to improve the feasibility and safety of the planned routes. To solve the proposed model, the Enhanced Non-Dominated Sorting Genetic Algorithm II (ENSGA-II) is developed. This algorithm integrates a heuristic initialization method based on route feasibility constraints, a bi-directional search operator framework guided by optimization objectives, and an adaptive mutation strategy. This design enables a balanced integration of global exploration and local exploitation, enhancing convergence quality, solution diversity, and the overall robustness and efficiency of the multi-objective optimization process. This study provides a novel and systematic modeling and optimization framework for complex scheduling problems in multi-UAV multi-depot scenarios, offering both significant theoretical contributions and practical application potential.
Despite these advances, most approaches focus on small-scale or single-depot scenarios and rely on centralized control, limiting adaptability when task volumes grow or environments change. They rarely address (1) dynamic, real-time task reallocation in stochastic settings or (2) fully decentralized coordination mechanisms for large fleets—both crucial for scalable, resilient multi-UAV operations. The remainder of this paper is organized as follows. Section 2 introduces the modeling of the urban spatial environment for delivery tasks, establishing the spatial structure and constraint conditions required for task planning. Section 3 presents a formal model of the bi-layer task planning problem, including detailed formulations of the objective functions and constraints for both the task assignment and route planning layers, as well as the design principles and key components of the proposed ENSGA-II algorithm. Section 4 conducts simulation experiments and performance evaluations from multiple perspectives. Section 5 summarizes the research findings and discusses potential directions for future work.
2. Bi-Layer Collaborative Task Planning Model and Algorithm
To support intelligent task assignment and safe flight planning in complex urban environments, this study proposes a bi-layer collaborative task planning framework, which integrates a structured 3D environmental modeling approach with hierarchical decision-making for multi-UAV and multi-depot delivery operations. The proposed framework explicitly separates global-level resource-task coordination and local-level trajectory optimization while establishing an information feedback mechanism between the two layers.
2.1. Urban Environment Modeling for Planning Foundation
In multi-UAV systems designed for urban-scale delivery operations, constructing a rational and structured environmental model is essential for subsequent task allocation, path planning, and safety evaluation. Due to the spatial complexity of low-altitude urban airspace, characterized by dense building layouts and static obstacles, direct modeling and abstraction of the three-dimensional (3D) space can significantly enhance the computational tractability and algorithmic feasibility of the planning process. The core objective of environment modeling is to structurally convert the actual physical airspace into a computationally processable spatial representation, thereby enabling a mathematical formulation of complex environmental information. The existing urban environment modeling approaches predominantly include grid-based discretization, graph-theoretical modeling, and visibility graph construction. Among them, the grid-based method has gained wide adoption in low-altitude UAV flight scenarios due to its simplicity, flexibility, and ability to support diverse spatial attribute definitions.
In this study, a three-dimensional grid-based discretization method [30] is employed to model the urban delivery task area. Let the operational airspace be a cuboidal region with side lengths x, y, and z, respectively. This space is discretized into uniform cubic grid cells of side length . The total number of grids in each dimension is calculated as follows:
where denotes the floor operation. The resulting 3D grid structure forms a discretized spatial set of dimension . Figure 1 illustrates a schematic of the space partitioning process. Each grid cell is indexed by the coordinates of its centroid and can be assigned multi-dimensional attributes such as obstacle presence, path cost, and risk layer. The risk layer refers to the spatial risk level associated with UAV flight through each grid cell, typically derived from the proximity to obstacles, ground population density, or restricted airspace. Higher risk values indicate regions with a greater likelihood of collision, regulatory violation, or mission failure. This risk assessment allows the planner to prioritize safer flight corridors and avoid hazard-intensive zones.
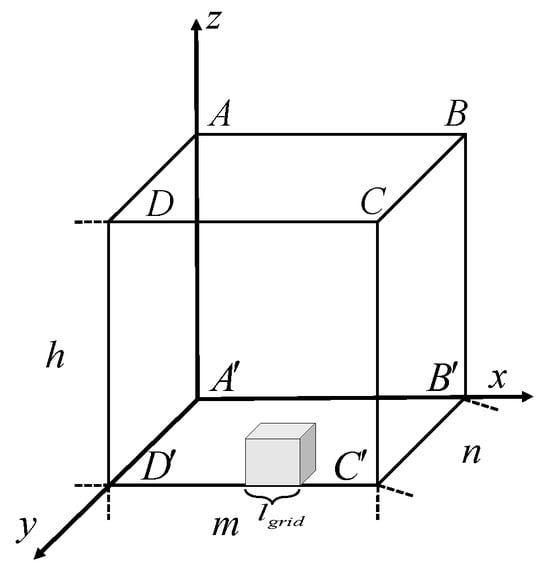
Figure 1.
Three-dimensional environment modeling using grid-based method.
The selection of grid resolution directly influences the trade-off between path planning accuracy and computational cost. A coarse grid resolution may result in insufficient path granularity or missed narrow passageways, whereas an overly fine resolution substantially increases the computational burden, potentially compromising real-time performance and scalability.
In addition, common obstacles in low-altitude urban operational environments include high-rise buildings, telecommunication towers, elevated bridges, and dense vegetation. To streamline the modeling process, all obstacles in this study are uniformly abstracted as cuboid voxel blocks with defined spatial boundaries and mapped to the corresponding positions within the grid-based environmental representation. Traditional modeling approaches generally adopt a binary labeling method, wherein grid cells corresponding to obstacles are assigned a value of 1, indicating impassable regions, while the remaining cells are assigned a value of 0, indicating traversable free space. Although this method offers implementation simplicity, it suffers from a significant limitation, as it does not provide a quantitative assessment of the risk associated with proximity to obstacle regions, thereby restricting its capacity for supporting dynamic safety evaluations.
To overcome this limitation, this study introduces a risk-based grid model derived from neighborhood relations [31], which quantitatively assesses the flight safety of traversable grid cells. Specifically, for each non-obstacle grid cell denoted as k, the associated risk value is defined as the proportion of its adjacent neighboring cells that are occupied by obstacles. This relationship is formally expressed as follows:
where denotes the number of neighboring cells occupied by obstacles, and indicates the total number of neighboring cells surrounding grid cell k. This risk index effectively captures the local hazard layer associated with traversable regions, and it is subsequently integrated into the objective function of the path planning model to achieve a balance between navigation efficiency and environmental risk avoidance. Figure 2 presents the spatial distribution of grid-based risk values. Gray-shaded areas denote obstacle cells with a risk value of 1, while white cells represent non-obstacle regions whose risk layers dynamically adjust based on the density of adjacent obstacle cells. This approach preserves the discrete modeling advantages of conventional grid-based methods while substantially enhancing the granularity with which potential environmental hazards can be represented [32]. In conclusion, the proposed risk-informed grid-based environmental modeling approach establishes a rigorous and extensible spatial data foundation for the subsequent multi-agent scheduling and trajectory optimization models. It contributes significantly to the operational robustness and navigational safety of urban airspace delivery systems.
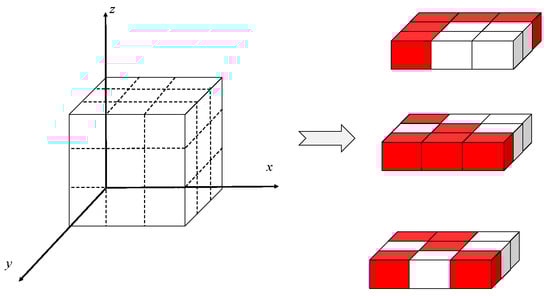
Figure 2.
Schematic illustration of risk distribution in the environmental model.
2.2. Hierarchical Task Planning Framework
This section establishes a bi-layer collaborative task planning framework for multi-UAV and multi-distribution center scenarios, as illustrated in Figure 3. The upper-layer model is responsible for global task allocation and resource configuration. It comprehensively considers task urgency, UAV performance, and distribution center locations to optimally match tasks, UAV resources, and delivery routes. The lower-layer model focuses on path planning and optimization for each UAV that has been assigned tasks. Its objective is to minimize flight costs and delay penalties, thereby improving delivery efficiency and resource utilization. A collaborative optimization mechanism is achieved through an information exchange between the two layers: the task allocation results from the upper layer serve as inputs for the lower layer, while the lower layer feeds back key indicators such as flight distance to assist the upper layer in iterative optimization. This forms a closed-loop optimization process. The following subsections provide a detailed description of the construction methods and optimization strategies for both layers of the model.
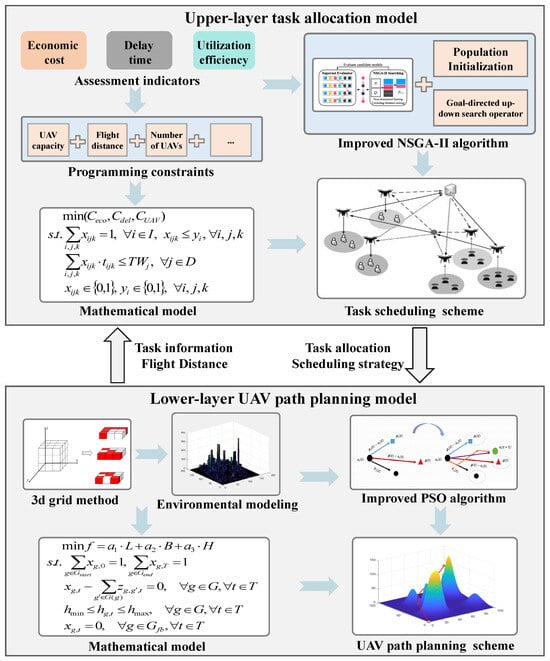
Figure 3.
The framework of the bi-layer coordinated task-planning model.
2.3. Upper-Layer Task Allocation Model and Algorithm
Figure 4 illustrates the structural schematic of the upper-layer task allocation model. Within the bi-layer collaborative task-planning framework proposed in this study, the upper-layer model focuses on global scheduling decisions involving multiple distribution centers, multiple task points, and multiple UAVs. This process takes into account several critical factors: the spatially discrete distribution of task points, the deployment locations of distribution centers, the heterogeneous performance parameters of UAVs (such as endurance, maximum payload, flight speed, etc.), and the overall scheduling costs and timeliness requirements of the system. By considering these aspects, the model aims to achieve multi-objective collaborative optimization, balancing service quality, resource utilization efficiency, and economic cost.
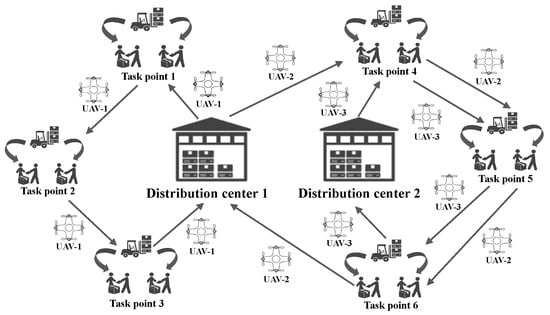
Figure 4.
Schematic diagram of multi-depot and multi-UAV task allocation structure.
2.3.1. Mathematical Model
(1) Decision variables.
In the upper-layer task assignment model, let the set of all delivery tasks be denoted as I, where . The set of distribution centers involved in scheduling is denoted as J, where . The available UAV types form the UAV model set K, where . To describe the assignment and scheduling status in the multi-depot multi-UAV system, the following key decision variables are defined to capture the matching relationship among tasks, distribution centers, and UAVs:
(2) Objective functions.
This section develops a multi-objective optimization model incorporating economic costs, delay times, and UAV resource utilization, aiming to optimize overall operational costs and resource consumption while ensuring timely task completion. Specifically, the objective function comprises the following three sub-objectives:
(1) Economic cost:
The economic cost function consists of three components: the scheduling cost induced via the task waiting time, the fixed cost incurred through UAV deployment, and the variable cost associated with the flight path length, formulated as follows:
where denotes the unit waiting cost of task i (CNY/min), and represent the delivery start time and request time of task i (min), respectively, and denote the fixed scheduling cost (CNY) and unit distance cost (CNY/km) of UAV type k, respectively, and (km) is the actual flight distance between depot j and task point i optimized via the lower-layer path planning model, accounting for obstacle avoidance and route optimization.
(2) Total delay time:
To ensure service timeliness, delivery tasks must be completed within the time windows specified by customers. Each task point, i, is assigned a service time window, , where denotes the earliest allowable service time, and denotes the latest permissible service time. If the actual arrival time of the UAV at task point i exceeds , a delay is incurred. The delay time is defined as the difference between the actual arrival time and the latest allowable service time:
where denotes the actual arrival time at task point i.
(3) Number of UAVs:
By minimizing the number of deployed UAVs, the system can effectively allocate platform resources while still meeting task requirements:
Combining the above three objectives yields a vector-based, multi-objective optimization problem:
(3) Constraints.
To ensure the feasibility of the model solution and the rationality of the scheduling results, the following constraints are imposed:
(1) Task uniqueness constraint:
This constraint guarantees that each task is performed by exactly one UAV from a specific distribution center, thus maintaining task integrity:
(2) Delay time constraint:
This constraint ensures that a delay occurs only if the actual arrival time at task i exceeds the latest allowable service time in its time window:
where denotes the delay time for task i.
(3) Distribution center time window constraint:
To align the schedule with the operating hours of each distribution center, it is required that all UAVs return to their corresponding centers before the center’s latest closing time after completing their assigned tasks:
where denotes the time at which the UAV returns to its distribution center after completing task i, and represents the closing time of distribution center j.
(4) UAV load constraint:
This constraint ensures that the total weight of goods assigned to a single UAV does not exceed its maximum carrying capacity:
where denotes the weight of goods required to be transported for task i, and represents the maximum payload capacity of a UAV of type k.
(5) UAV quantity constraint:
The maximum number of UAVs dispatched is limited by the available fleet size:
where denotes the total number of UAVs currently available.
(6) Single-task path length constraint:
To ensure flight safety and power sustainability, the flight path for each task must not exceed the maximum allowable distance:
where (km) denotes the optimized flight distance from the lower-layer path planning, which may include detours for obstacle avoidance, and (km) represents the maximum flight distance of UAV type k, determined by its endurance.
(7) Binary constraint:
As mentioned above, the multi-depot multi-UAV task allocation problem in the upper-layer model is described as follows:
where (CNY) denotes total economic cost, (min) represents cumulative delay time beyond latest service windows, (unitless) is the number of deployed UAVs, (min) is the total time for UAV k from depot j to complete task i (including flight time from previous location and on-site service time), (min) indicates the operating time window limit of depot j (maximum allowed return time), and the constraint ensures the cumulative mission time for all tasks assigned to UAVs departing from depot j does not exceed its operating window.
This multi-objective model represents a typical multi-objective mixed-integer nonlinear programming (MINLP) problem, characterized by strong coupling between objective functions, a non-convex variable space, and a large number of discrete variables. To address these complexities, a Pareto-optimal multi-objective solution strategy is required to obtain a set of balanced scheduling schemes that effectively trade off between cost efficiency and service quality.
2.3.2. Nsga-Ii Algorithm
The NSGA-II algorithm [33] is a classical multi-objective evolutionary optimization method. Its core lies in constructing a solution set that approximates the true Pareto front through fast non-dominated sorting and a crowding distance control mechanism, thereby achieving a well-balanced trade-off between solution diversity and convergence. The standard procedure of NSGA-II is as follows:
(1) Initialization.
Randomly generate an initial population, , of size N, and compute the multi-objective fitness value, , for each individual.
(2) Non-dominated sorting.
Sort all individuals in the population based on dominance relations. For any two individuals, and , if and , then is said to dominate . The first layer of non-dominated individuals forms the approximate Pareto front .
(3) Crowding distance calculation.
Within each non-dominated front, calculate the crowding distance, , of each individual, , based on the normalized distance between its neighboring solutions in each objective:
where denotes the position of individual in the sorted list for the k-th objective. The crowding distance reflects the density of surrounding solutions in the objective space.
(4) Selection.
Use a binary tournament selection strategy based on rank (non-dominated layer) and crowding distance to generate a parent population, .
(5) Crossover and mutation.
Apply simulated binary crossover and polynomial mutation operators to the selected parents to generate the offspring population .
(6) Population update.
Combine the current generation’s parents, and offspring , to form a temporary population, . Perform non-dominated sorting, and select the top N individuals to form the next generation, .
(7) Iteration.
Repeat the process until a predefined termination condition is satisfied.
While NSGA-II demonstrates advantages in non-dominated sorting and diversity preservation, it still faces limitations when handling high-dimensional objective spaces or mixed problems with strong nonlinear coupling and integer constraints. These challenges include a weak local search capability, a tendency to converge to suboptimal solutions, the diminished resolution of the Pareto front in high-dimensional objectives, leading to poor coverage, and a lack of problem-specific operator design, reducing generalizability [31]. To address these issues, this study develops an enhanced NSGA-II algorithm to improve overall solving efficiency and solution quality, thereby enabling efficient resolution and decision support for complex multi-objective scheduling problems.
2.3.3. Ensga-Ii Algorithm
The proposed ENSGA-II introduces a series of targeted improvements over the classical NSGA-II framework, including heuristic insertion-based initial population construction, goal-oriented local search operators, and stage-wise evolutionary control mechanisms.
(1) Improved strategy I: heuristic insertion-based initial population construction.
To enhance the initialization efficiency and solution feasibility of NSGA-II, this study proposes a heuristic insertion-based method for initial population construction. This approach addresses the limitations of traditional random initialization in terms of constraint satisfaction and distribution coverage within the solution space. The core idea is to incrementally construct high-quality initial solutions under the constraint of path feasibility. The improved initialization process is described as follows:
(1) A task, , is randomly selected to form the initial path, . Each path, R, represents a scheduling sequence executed by a specific UAV departing from a designated distribution center. An appropriate combination of distribution center and UAV model is assigned to the path to ensure the following constraint is satisfied:
where denotes the maximum flight range of UAV model k deployed at distribution center j, and is the Euclidean distance between nodes i and j.
(2) For the remaining tasks , each task is tentatively inserted into any legal position, l, in the existing paths . After insertion, the feasibility of the updated path must be verified, particularly with respect to the task deadline . The updated path must satisfy the following:
where is the estimated completion time of task under the current path configuration, and denotes its maximum allowable completion time. If the condition is met, the task is inserted at position l, and the path is updated as follows:
(3) If task cannot be inserted into any existing path without violating constraints, a new distribution center, , and UAV model, , are selected, under the condition that the distance between the center and the task does not exceed the maximum flight range:
A new path is then constructed as follows:
(4) The above process is iteratively executed until all tasks are successfully assigned, resulting in a set of feasible solutions, . To ensure structural diversity within the initial population, a uniqueness check is performed after each new solution is generated. A solution is added to the initial population, , only if it satisfies the following:
The resulting initial population thus consists of p structurally diverse and constraint-compliant scheduling solutions. By incorporating constraint-aware evaluation and iterative path insertion strategies, this initialization method significantly reduces the proportion of infeasible solutions and enhances structural diversity within the feasible solution space, thereby providing a high-quality basis for the subsequent multi-objective evolutionary process.
(2) Improved strategy II: goal-oriented top-down and bottom-up search operators.
To enhance both the global exploration ability and local convergence performance in the multi-objective optimization process, a goal-oriented, staged top-down and bottom-up search mechanism is proposed to improve the performance of genetic operators. This mechanism comprises two customized operators: a goal-oriented crossover operator and a goal-oriented mutation operator, which collectively enhance solution quality and diversity through a two-phase construction strategy.
(1) Goal-oriented crossover operator.
This operator constructs high-quality offspring solutions through a two-stage path recombination mechanism. The first stage focuses on identifying and extracting promising path segments from the parent individuals to build a partial, high-quality offspring; the second stage is responsible for embedding remaining unassigned tasks into the existing path structure to ensure solution completeness and feasibility.
First stage: The construction of partial offspring (path selection and information coordination). In this stage, a partial solution is constructed based on information from two parent solutions, with priority given to extracting potentially valuable delivery paths while coordinating task information across paths to form an initial offspring solution . Initially, the offspring solution is set to an empty set, i.e., . Let the two parent solutions be and , with corresponding numbers of delivery paths and . Define the minimum and maximum number of paths as follows:
Then, set the number of path extraction iterations, k, based on the current optimization objective. If the objective is to minimize UAV usage (), set to encourage path merging and reduce total UAV count. If the objective is minimizing economic cost, (), or the delay time, (), set . In each iteration, a parent solution, , is randomly selected. For the selected parent, identify the most promising path, , according to the objective function . The selection strategy is defined as follows:
where denotes the currently selected parent solution, and represents the set of delivery paths within that solution, indicates the number of task points contained in path . A lower average delay per task point in a path implies a higher preference under objective function . Once the optimal path is identified, it is copied and added to the offspring solution and simultaneously removed from the current parent solution.
In the other parent solution, all task points, , included in this selected path, , undergo a coordinated operation, as follows:
The task point i is removed from its original path, after which its predecessor and successor nodes are directly reconnected to form a continuous path structure. Relevant attributes, such as path length, payload, and time windows, are then updated to ensure the feasibility and consistency of the modified path. This procedure is iteratively executed for k rounds. If, at any point during the iterations, either parent solution no longer contains feasible paths, the phase is terminated prematurely. Ultimately, the number of paths in the partial offspring solution satisfies . However, some task points may remain unassigned and will be handled in the second phase.
Second stage: The insertion of remaining customer tasks. In the partial offspring solution constructed during the first stage, only a subset of delivery routes inherited from the parent solutions is retained, leaving some task points uncovered. Let the set of these unassigned task points be denoted as U. The aim of this phase is to insert all task points in U into the existing routes in a feasible and efficient manner, or to create new delivery routes when necessary, thereby forming a complete and feasible offspring solution.
Specifically, this stage operator processes the task points in U one by one. In each iteration, a randomly selected unassigned task point, , is chosen, and its optimal insertion position within the current solution, , is sought. The evaluation criterion for determining the best insertion position is based on the current optimization objective function, . If the current objective is to minimize the number of UAVs used (), the primary principle is to avoid adding new routes. Among all existing routes, the one with the largest number of task points is given priority:
Then, within the selected route , the operator sequentially searches for the first insertion position that satisfies all constraint conditions. Once a feasible position is found, the task point is inserted accordingly.
If the current objective is to minimize economic cost (), the algorithm evaluates all routes and feasible insertion positions to calculate the incremental cost:
The task is inserted at the position with the smallest cost increase:
To minimize delay time (), the delay increment is calculated as:
Insertion occurs at the position minimizing the delay increment:
If no feasible insertion exists, a new route, , is created. First, assign the closest distribution center:
Select a UAV type, , satisfying range constraints:
Construct the new route:
This new route is then added to the current solution, . The above steps are repeated iteratively until all unassigned customer task points, , have been successfully inserted, ultimately forming a complete and feasible offspring solution.
(2) Goal-guided mutation operator.
To enhance the population’s adaptability and responsiveness during the multi-objective evolutionary process, this study designs two types of mutation operators with objective-awareness mechanisms. These operators apply perturbations and structured repairs tailored to different path characteristics and optimization objectives, such as the number of drones used, economic cost, and service delay time, thereby strengthening the algorithm’s capability to balance multiple objectives.
Mutation operator I: The reconstruction and reinsertion of delayed paths (trigger probability ).
This mutation operator aims to identify and adjust paths containing delayed tasks in the current solution to reduce path-layer delay risks, thereby improving the timeliness and feasibility of the scheduling scheme. The specific procedure is as follows:
First, traverse all delivery paths, R, in the current solution and extract those containing at least one delayed task point to form a set of delayed paths:
Secondly, for each path, , in the set , remove all task points, , where delays have occurred (i.e., tasks satisfying the corresponding delay condition), and denote these removed task points as the set . It is noteworthy that the original distribution center and drone model of the path remain unchanged. For each removed task point, , an attempt is made to reinsert it into the remaining routes of the current solution. The insertion position must satisfy the following conditions:
Equation (36) (now without numbering) ensures that, after insertion, the service completion time of all tasks on the path does not exceed the upper bound of their respective time windows. If no feasible insertion position can be found in the existing routes for the task point, a new path, , is created for task i, starting from its original distribution center. The algorithm then searches for the optimal insertion position within the new path or its neighboring routes. The criterion for selecting the insertion position is to minimize the total service delay of the path, ideally achieving zero while satisfying all constraints. If the insertion conditions remain unmet, additional backup paths are constructed, and insertion attempts continue iteratively until all delayed task points are successfully reassigned. This strategy effectively reduces the overall delay layer of the solution, providing a target-oriented proactive intervention mechanism that facilitates precise regulation of delay metrics during the multi-objective evolutionary process.
Mutation operator II: Destruction–reconstruction mechanism (trigger probability p = 0.75).
This operator integrates the dynamic preferences of multiple objective functions to achieve targeted perturbation and reconstruction of path structures, thereby enhancing the local feasibility repair capability and global exploration diversity within the solution space. The mechanism primarily consists of two stages:
In the destruction stage, first, the set U of unassigned task points is constructed. According to the dynamic preference of the current optimization objective function , different destruction strategies are selected:
When the optimization objective is to minimize the number of drones used (), priority is given to selecting the path with the fewest task points, and all tasks on this path are moved into the set U. If, after tasks are removed from the path, its structure no longer satisfies feasibility constraints, it must be divided and reconstructed into several feasible sub-paths:
When the optimization objective is to minimize economic costs (), two mutually exclusive strategies are employed and executed with probabilities of 70% and 30% respectively: The first is “random path partial removal”, in which a path is randomly selected from the set of paths, and n task points are randomly removed from it (). The second is “iterative random removal”, through which a maximum iteration number, , is set, and in each iteration, a feasible path is randomly selected, and one task point is removed.
When the optimization objective is to minimize time delays (), two mutually exclusive strategies are also used: The first is “high-delay path partial removal”, which selects the path with the largest total delay:
Then, several task points are randomly removed from it. The second is “iterative random removal”, through which removal operations are randomly performed only on customer points in paths that contain service delays.
After the destruction phase is completed, the reconstruction phase begins, where task points in the set U are inserted one by one. In each iteration, a task point, , is randomly selected from U, and its optimal insertion position in the existing or new routes is determined based on the current optimization objective function.
If the objective function is to minimize the number of drones used (), priority is given to the earliest feasible position where the insertion does not cause service delays for existing task points. If no such position exists, the last feasible position is chosen to maximize the insertion flexibility of the route. If the objective function is to minimize economic cost (), the position causing the smallest increase in cost after insertion is selected. If the objective function is to minimize delay time (), the position resulting in the minimum increase in total route delay is selected. If the current task point cannot be inserted into any existing route, a new route is created according to the following rule: the nearest distribution center in terms of Euclidean distance to task point is selected as the starting point:
Next, assign a UAV model, , that meets the current task’s service range requirements, which must satisfy the following range constraint:
Finally, during the population update process, this study adopts a “parent plus offspring” merging strategy to construct an intermediate population of size , and it introduces an elitism-based nondominated sorting mechanism to ensure the continuous preservation of high-quality solutions. The proposed goal-oriented bi-directional search improvement operator strategy integrates structured crossover and mutation operations, enabling directional guidance and local fine-tuning reconstruction for different optimization objectives while maintaining solution feasibility. This strategy, combined with a staged evolutionary mechanism, achieves a balance between global exploration and local exploitation, significantly enhancing solution diversity and the capability to obtain high-quality solutions. It provides efficient and stable optimization support and an algorithmic foundation for multi-UAV task allocation problems. The pseudocode of the proposed ENSGA-II algorithm is presented in Algorithm 1.
2.4. Lower-Layer Path Planning Model and Algorithm
Following the determination of the initial routes through the upper-layer task allocation, the lower-layer path planning model focuses on the detailed point-to-point trajectory design for unmanned aerial vehicles (UAVs). This process comprehensively accounts for path length, the cost of traversing hazardous areas, and the cost associated with changes in flight altitude, while incorporating relevant flight constraints.
2.4.1. Mathematical Model
(1) Decision variables.
In the lower-layer path planning model, to accurately characterize the trajectory layerization behavior of a multi-UAV system during task execution, the following sets and decision variables are defined. First, let the task node set represent the departure and destination nodes for each delivery task assigned in the upper-layer scheduling model, satisfying the condition . The flyable space grid set G is used to discretize the three-dimensional airspace, where each grid, , contains geographical and flight-related attributes, such as risk coefficients and altitude information. The time step set T represents the sequence of discrete time intervals used to capture the dynamic evolution of the path generation process. Based on the above sets, the main decision variables for describing path planning are defined as follows:
| Algorithm 1 Enhanced NSGA-II algorithm |
| Input: Task set I, Depot set J, UAV model set K, Population size N, Maximum generations |
| Output: Pareto-optimal solution set |
|
(1) State variables:
(2) Continuous variables:
Let denote the flight altitude (in meters) of a UAV when located in grid g at time step t. Let represent the climb rate (in meters per second) of a UAV when moving from grid g to grid at time step t. The above sets and decision variables together form the fundamental description of the lower-layer path planning problem, providing a modeling foundation for subsequent trajectory generation and layerization.
(2) Objective function.
In the lower-layer multi-UAV path planning model, three sub-objectives are considered: path length, flight risk, and altitude variation cost.
(1) Flight path length:
The path length serves as a critical indicator of mission execution efficiency. Minimizing the total flight path length can effectively improve delivery timeliness and reduce energy consumption:
where represents the Euclidean distance between grid cell g and grid cell . By summing the distances corresponding to actual grid transitions across all time steps, the total path length can be quantified.
(2) Grid risk exposure:
To enhance mission safety, the planned path should avoid areas with high hazard coefficients, thereby reducing the risk from environmental factors. Thus, minimizing the total risk exposure becomes a secondary objective:
where represents the hazard coefficient of grid g, a predefined parameter.
(3) Altitude variation cost:
Frequent altitude adjustments during UAV flight increase energy consumption and flight control complexity. Therefore, minimizing altitude variation cost is necessary to maintain energy efficiency and stability. The altitude variation cost is computed as follows:
where denotes the change in altitude when flying from grid g to grid . The weighted sum of absolute altitude differences quantifies the cost of altitude adjustments, thereby promoting smoother and more energy-efficient flight paths.
Additionally, this study adopts a hierarchical optimization strategy tailored to the distinct characteristics of decision-making at different layers. The upper-layer model focuses on global task allocation among UAVs, task locations, and distribution centers, involving multiple objectives with inherent conflicts, such as economic costs and task delays. Here, task delay refers to the cumulative time by which UAVs complete tasks beyond their expected or scheduled time windows. It directly reflects service timeliness and significantly impacts user satisfaction and logistics system efficiency. Therefore, particular attention is given to the trade-offs among objectives. To this end, the upper-layer problem is addressed using a non-dominated sorting-based multi-objective optimization approach to construct a Pareto-front solution set, accommodating diverse decision-making preferences and enhancing the adaptability and flexibility of scheduling strategies.
In contrast, the lower-layer path-planning problem features high dimensionality, stringent constraints, and a complex combinatorial solution space. Directly applying multi-objective Pareto optimization in this context results in significant computational overhead and may hinder stable convergence. Therefore, after formulating the sub-objective functions at the lower layer, this study employs a weighted-sum method to transform the multi-objective problem into a single-objective one. This method not only enables the incorporation of decision preferences through weight coefficients but also facilitates integration with heuristic algorithms, thereby improving convergence performance and local search capability to efficiently obtain feasible solutions.
Let denote the weighting coefficients corresponding to path length, hazard exposure, and altitude variation cost, respectively, and satisfy the normalization constraint:
The final integrated optimization objective function is as follows:
By adjusting the values of the weight coefficients, the model can flexibly balance flight efficiency, safety, and energy stability according to specific application requirements, thereby ensuring optimal path planning performance for the multi-UAV system.
(3) Constraints.
To ensure that the generated path planning solutions are compatible with real-world flight operations and task execution requirements, the following constraints are introduced:
(1) Task start and end constraints:
Each delivery task must begin at a designated start grid and ultimately reach a specified end grid. This is formulated as follows:
where and represent the sets of start and end grids for task i, respectively. These constraints ensure that the UAV trajectory possesses well-defined departure and arrival nodes.
(2) Continuous movement constraint:
A UAV must move between adjacent grids in consecutive time steps. That is, if it is located in grid g at time step t, it must move to a neighboring grid at time step . The constraint is expressed as follows:
where denotes the set of grids adjacent to grid g. This ensures trajectory continuity and physical feasibility of flight paths.
(3) Flight altitude constraints:
At any time step, the UAV must operate within a predefined altitude range to comply with airspace regulations and ensure flight safety:
where and are the minimum and maximum allowable flight altitudes, respectively.
(4) Maximum climb angle constraint:
During continuous operations, the UAV’s climbing or descending angle must remain within the allowable maximum to ensure flight stability and safety. This constraint is expressed as follows:
where and denote the UAV’s spatial coordinates at consecutive time steps t and , and is the maximum allowable climb angle.
(5) Obstacle and no-fly zone avoidance constraint:
The UAV’s path must not intersect any predefined obstacles or no-fly zones. This constraint is given as follows:
where represents the set of impassable or restricted grid cells.
In summary, at the lower-layer path planning stage, a comprehensive optimization model is established that simultaneously considers minimizing the path length, reducing the flight risk, and minimizing altitude variation costs. This model accounts for the spatial–temporal dynamics of UAV flight while ensuring physical feasibility and task completion. Due to the use of grid-based spatial modeling and discrete-time step planning, the problem scale increases significantly. As a result, the overall model exhibits characteristics of a strongly coupled, non-convex, and mixed-integer optimization problem, which increases the computational complexity. Therefore, this study introduces an improved version of the traditional particle swarm optimization (PSO) algorithm to efficiently generate feasible path planning decisions.
2.4.2. Standard PSO Algorithm
The particle swarm optimization (PSO) algorithm [34] is inspired by the social foraging behavior of bird flocks. It utilizes information sharing and collaboration among individuals within the swarm to search for optimal solutions in a given space. Due to its simple structure, minimal parameter requirements, and ease of implementation, PSO has been widely applied in continuous optimization, combinatorial optimization, and multi-objective optimization problems.
In PSO, each potential solution is abstracted as a particle characterized by two key attributes: position and velocity, which correspond to the decision variable values and the direction of search, respectively. During each iteration, the velocity and position of each particle are updated based on its own historical best position () and the global best position () identified via the swarm. The update equations are defined as follows:
where and represent the velocity and position of particle i at iteration t. is the inertia weight, balancing the global and local search abilities of particles. and are the cognitive and social learning factors, respectively, which determine the attraction to and . and are random numbers within that introduce stochasticity to enhance diversity.
The standard PSO algorithm leverages a simple and efficient mechanism that integrates both local and global information, enabling rapid convergence toward optimal solutions. However, when applied to high-dimensional, non-convex, strongly coupled, and constraint-intensive problems, it tends to suffer from a reduced convergence speed, premature convergence to local optima, and insufficient search accuracy. Therefore, to address the specific characteristics of the proposed multi-UAV path planning model, it is necessary to introduce adaptive enhancements to the standard PSO framework in order to improve its solution capability and the quality of path generation.
2.4.3. Improved PSO Algorithm
(1) Improvement strategy 1: chaotic initialization.
To overcome the limited diversity and weak global search ability at the initial stage of traditional PSO, a chaotic initialization strategy [35] is introduced to enhance population diversity and global exploration. Chaotic sequences possess ergodicity, randomness, and determinism, effectively preventing premature convergence to local optima. This study adopts the Singer map for chaotic sequence generation. Compared to the Logistic and Tent maps, the Singer map maintains chaotic behavior while offering a more uniform distribution, making it suitable for initialization in high-dimensional search spaces:
where is the control parameter, typically set to 1 to ensure chaotic behavior. is the initial value within the interval , used to generate a chaotic sequence . This strategy ensures a more even distribution of the initial population in the solution space, improving solution diversity and global exploration capacity, and reducing the risk of premature convergence.
(2) Improvement strategy 2: linearly adjusted acceleration coefficients and maximum velocity.
In the PSO algorithm, the acceleration coefficients and control the particles’ tendencies to learn from personal and global best positions, respectively. Their values significantly influence algorithm performance. Traditional PSO often fixes them as constants, which cannot effectively balance global and local search in dynamic environments. Thus, a linear adjustment mechanism [36] is introduced to dynamically tune and ensure that particles transition from “exploration-oriented” to “exploitation-oriented” behaviors:
where t is the current iteration, and is the maximum number of iterations. and denote the upper and lower bounds for the individual learning coefficient, while and represent those for the social learning coefficient. In early iterations, a larger and smaller encourage exploration based on individual experience. In later iterations, decreases while increases, enhancing cooperative search and improving convergence speed and solution quality.
In addition, the maximum particle velocity plays a critical role in constraining the step size of particles, directly affecting the search range and convergence speed. If is too large, particles may overshoot promising regions, resulting in unstable convergence; if it is too small, particle movement becomes overly restricted, increasing the risk of local stagnation. To ensure a proper balance between global exploration and local refinement, a linearly decreasing velocity strategy [37] is employed to reduce as iterations progress. The adjustment rule is given as follows:
where is the maximum velocity at iteration t, is the initial maximum velocity, and is the final minimum velocity.
(3) Improvement strategy 3: particle position update based on random perturbation.
In standard PSO, particle positions are typically updated based solely on velocity. However, for path planning problems characterized by discrete space modeling and strong non-convexity, such linear updates often lead to a homogeneous particle distribution, reducing diversity and search quality. To improve exploratory capability and help escape local optima, a random perturbation-based position update mechanism [38] is introduced on top of the standard update. Specifically, a controlled stochastic disturbance is added to the position update to enable fine-scale jumping behavior. The new position of a particle is calculated as follows:
where is the position of a better-performing particle in the current iteration, and are large and small velocity values, is a perturbation control factor (typically a small positive value ), and is a random number in .
(4) Improvement strategy 4: adaptive adjustment of inertia weight.
The inertia weight is a critical parameter in the particle swarm optimization (PSO) algorithm that regulates a particle’s “memory” and guides its search behavior. The magnitude of the inertia weight directly influences the algorithm’s balance between global exploration and local exploitation. A higher inertia weight facilitates broader exploration of the search space and enhances the algorithm’s ability to escape local optima, whereas a lower inertia weight favors finer local search, thus promoting convergence to optimal solutions in promising regions. To better accommodate the varying demands of different search phases, an adaptive inertia weight adjustment strategy [39] is introduced. This strategy employs a linearly decreasing inertia coefficient based on the iteration progress, enabling a dynamic transition in the search focus from global to local as the algorithm proceeds. The adjustment formula is expressed as follows:
where is the inertia weight at generation t, and and are the maximum and minimum weights, respectively. The pseudocode of the improved PSO algorithm is presented in Algorithm 2.
| Algorithm 2 Improved PSO |
| Input: Number of particles N, Maximum number of iterations T, Maximum and minimum acceleration coefficients and , Maximum and minimum velocities and , Position update constant , control parameter |
| Output: Optimal velocity , Optimal position |
|
3. Simulation and Analysis
To comprehensively evaluate the effectiveness and applicability of the proposed bi-layer collaborative task-planning model and optimization algorithm, a series of simulation experiments are conducted. These experiments are designed to replicate realistic urban logistics scenarios and analyze model performance under various operational settings. The following subsections detail the simulation environment setup, parameter configurations, and experimental analysis.
3.1. Simulation Environment
In this study, the simulation environment is systematically constructed to replicate realistic urban logistics settings, including the spatial modeling of the target area, computational platform specification, and detailed parameter configurations for UAV deployment and algorithmic control. The subsequent subsections provide a comprehensive description of each aspect.
3.1.1. Environment Modeling
This study selects the Wudadao (Five Avenues) architectural district in Heping District, Tianjin, China, as the background for environmental modeling. As illustrated in Figure 5, Figure 5a presents the satellite imagery of the street network, while Figure 5b shows the simulated environment constructed using a grid-based method, in which each grid cell corresponds to 0.1 km in the actual geographic space.
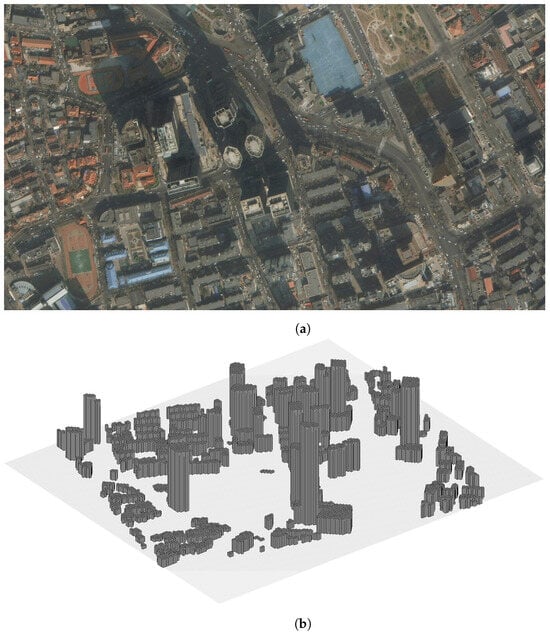
Figure 5.
Schematic diagram of UAV environmental modeling. (a) Street satellite image. (b) Environmental simulation map.
3.1.2. Experimental Setup
All simulations are conducted under the Windows 10 operating system, utilizing an Intel Core i7-13600K processor, an NVIDIA GeForce RTX 3060 graphics card with 12 GB VRAM, and 16 GB DDR4 memory. Model development and simulation implementation are performed in the PyCharm2023 integrated development environment, using Python 3.9. This experimental configuration provides computational resources to ensure efficienct and high-quality solutions for high-dimensional optimization problems.
3.1.3. Parameter Configuration
In the simulation analysis, the number of logistics depots is set to 3. The detailed configuration of depot-related parameters is provided in Table 1. Two DJI transport UAV models with distinct performance characteristics are employed, and their specifications are listed in Table 2. The number of task nodes is set to 50, with time window constraints defined as [0, 90]. Furthermore, in algorithm validation experiments, the number of task nodes is extended to 100 to fully evaluate the applicability and scalability of different algorithms under high-dimensional task conditions. The configuration of parameters related to the bi-layer optimization model is summarized in Table 3.

Table 1.
Distribution center parameter settings.
Table 2.
UAV parameter settings.
Table 3.
Parameter settings related to models and algorithms.
3.2. Experimental Results Analysis
This subsection presents a detailed analysis of the experimental results obtained from the proposed bi-layer collaborative task planning framework.
3.2.1. Task Allocation Results Analysis
Figure 6 presents the final non-dominated solution set obtained based on the multi-objective optimization model, providing a comprehensive evaluation of task allocation schemes across three dimensions: economic cost, the number of UAVs scheduled, and time window violation duration. In the figure, the green points represent the feasible solution set satisfying all constraints.
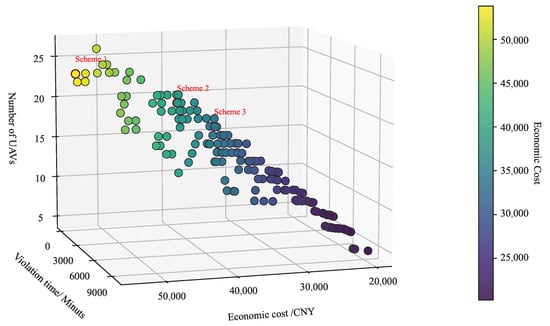
Figure 6.
Pareto front of the upper-layer model.
As illustrated in Figure 6, the constructed upper-layer multi-objective scheduling model and algorithm effectively reflect the trade-offs among the number of scheduled UAVs, service timeliness, and economic efficiency. The presented non-dominated solution set exhibits a typical concave distribution pattern, indicating that improvement in one objective often requires sacrificing performance in others. This aligns with the systemic resource constraints and dynamic priority adjustment mechanisms inherent to multi-UAV task allocation scenarios. The solution set shows good distribution density and boundary coverage within the three-dimensional objective space, demonstrating the stable convergence and extensive search capability of the model without clustering or premature convergence. These results directly validate the proposed model and the algorithm’s global adaptability and structural stability in multi-objective scheduling contexts while providing diversified alternative solutions for practical applications with varying scheduling preferences.
To further elucidate the internal trade-off relationships of the proposed multi-objective optimization model and algorithm, the three-objective Pareto front is projected onto three representative two-dimensional objective spaces for visualization, as shown in Figure 7.
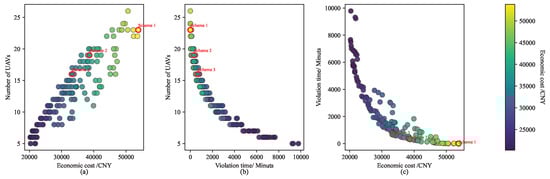
Figure 7.
Decomposed two-objective Pareto front: (a) UAVs vs. costs; (b) UAVs vs. violation time; (c) violation time vs. costs.
Figure 7a depicts the relationship between economic costs and the number of UAVs utilized, showing a pronounced positive correlation trend. This indicates that, in most cases, reducing economic expenditure requires scheduling fewer UAVs, a resource constraint particularly evident in multi-depot environments. The result highlights the coordination capacity of the task allocation scheme between resource configuration and cost control. Figure 7b illustrates the Pareto distribution between the task delay time and the UAV quantity, displaying a characteristic power-law decay. It is observable that, when the UAV quantity is limited, the overall system delay significantly increases, whereas the appropriate augmentation of UAVs effectively mitigates task time conflicts, enhancing scheduling timeliness. However, beyond a certain UAV threshold, marginal benefits diminish, reflecting saturation in resource allocation for timeliness improvement. Figure 7c presents the relationship between economic costs and the task delay time, exhibiting a typical nonlinear negative correlation. Low-cost solutions are often accompanied by higher delay durations, while achieving minimal delay incurs substantial cost penalties. This vividly demonstrates the inherent conflict between economy and timeliness, and it confirms that the proposed algorithm effectively approximates the Pareto front among competing objectives while maintaining solution diversity. The distribution characteristics of the three bi-objective Pareto fronts validate the adaptability and flexibility of the proposed model and algorithm in handling high-dimensional multi-objective conflicts.
To systematically assess the overall performance of the constructed multi-objective bi-layer collaborative task planning model and the improved optimization algorithm in practical scenarios, three representative planning schemes are selected from the obtained Pareto front for quantitative comparative analysis. The specific optimization results are summarized in Table 4. Scheme 1 corresponds to the initial non-dominated solution on the Pareto front and serves as a baseline for performance evaluation. Schemes 2 and 3 represent feasible plans achieving balanced overall improvements by comprehensively weighing UAV scheduling quantity, economic cost, and violation time under conflicting objectives.
Table 4.
Comparative optimization results of different planning schemes.
As shown in Table 4, Scheme 1 aims to completely avoid time window violations. Its planning structure embodies a resource-redundant configuration centered on optimal task timeliness, scheduling 23 UAVs to ensure zero violations throughout the entire task duration. The economic cost reaches 53,798.07 CNY, exhibiting a typical “high resource-high cost-zero delay” characteristic. Although this scheme achieves the optimal boundary in service quality, it suffers from high redundancy in resource input and relatively weak economic sustainability. Building upon this, Scheme 2 moderately relaxes the time window constraints under the premise that delivery efficiency remains acceptable. The number of scheduled UAVs is reduced from 23 in Scheme 1 to 19, a 17.4% reduction, significantly enhancing resource utilization efficiency. Correspondingly, the time window violation increases to 331.79 min, slightly higher than the zero minutes in Scheme 1 but still well below most planning tolerance thresholds, indicating controllable delay layers. Meanwhile, the economic cost decreases from 53,798.07 CNY to 38,660.01 CNY, achieving a 28.1% cost reduction. This dual optimization of resource input and cost is realized while maintaining basic timeliness. These results demonstrate that the model effectively balances delivery efficiency and economic performance, suitable for operational scenarios that are cost-sensitive yet have relatively flexible timeliness requirements. Furthermore, Scheme 3 emphasizes pushing the system’s operational limits under tightened resource constraints and cost reduction conditions. This scheme schedules only 16 UAVs, a 30.4% reduction compared to Scheme 1, demonstrating strong potential for resource compression. The economic cost further decreases to 33,267.61 CNY, a 38.2% reduction relative to Scheme 1, representing the lowest value among the three schemes. Although the violation time increases to 679.47 min, compared to zero delay in Scheme 1, the increase remains within acceptable delivery service limits. The delay accounts for only a small portion of the total task cycle time, indicating that the system maintains a stable task completion capability under high-intensity resource constraints. This scheme verifies the model and algorithm’s high robustness, cost adaptability, and structural control capability under extreme scheduling conditions.
Overall, the results indicate that the proposed model and algorithm possess strong capabilities in balancing objectives and resource allocation. They can provide high-quality, feasible solutions adapted to different scheduling preferences under multiple constraints. The computed non-dominated solutions form a clear multi-objective cooperative frontier, validating the stability and robustness of the algorithm.
As shown in Table 4, Scheme 1 aims to completely avoid time-window violations. Its planning structure embodies a resource-redundant configuration centered on optimal task timeliness, scheduling 23 UAVs to ensure zero violations throughout the entire task duration. The economic cost reaches 53,798.07 CNY, exhibiting a typical “high resource-high cost-zero delay” characteristic. Although this scheme achieves the optimal boundary in service quality, it suffers from high redundancy in resource input and relatively weak economic sustainability. Building upon this, Scheme 2 moderately relaxes the time window constraints under the premise that delivery efficiency remains acceptable. The number of scheduled UAVs is reduced from 23 in Scheme 1 to 19, a 17.4% reduction, significantly enhancing resource utilization efficiency. Correspondingly, the time window violation increases to 331.79 min, slightly higher than the zero minutes in Scheme 1 but still well below most planning tolerance thresholds, indicating controllable delay layers. Meanwhile, the economic cost decreases from 53,798.07 CNY to 38,660.01 CNY, achieving a 28.1% cost reduction. This dual optimization of resource input and cost is realized while maintaining basic timeliness. These results demonstrate that the model effectively balances delivery efficiency and economic performance, suitable for operational scenarios that are cost-sensitive yet have relatively flexible timeliness requirements. Furthermore, Scheme 3 emphasizes pushing the system’s operational limits under tightened resource constraints and cost-reduction conditions. This scheme schedules only 16 UAVs, a 30.4% reduction compared to Scheme 1, demonstrating strong potential for resource compression. The economic cost further decreases to 33,267.61 CNY, a 38.2% reduction relative to Scheme 1, representing the lowest value among the three schemes. Although the violation time increases to 679.47 min, compared to zero delay in Scheme 1, the increase remains within acceptable delivery service limits. The delay accounts for only a small portion of the total task cycle time, indicating that the system maintains stable task completion capability under high-intensity resource constraints. This scheme verifies the model and algorithm’s high robustness, cost adaptability, and structural control capability under extreme scheduling conditions.
Overall, the results indicate that the proposed model and algorithm possess strong capabilities in balancing objectives and resource allocation. They can provide high-quality, feasible solutions adapted to different scheduling preferences under multiple constraints. The computed non-dominated solutions form a clear multi-objective cooperative frontier, validating the stability and robustness of the algorithm.
3.2.2. Path Planning Results Analysis
To validate the adaptability and effectiveness of the constructed lower-layer UAV path planning model within the multi-distribution-center collaborative scheduling environment, this study systematically organizes the results of the lower-layer path planning tasks and compiles a UAV delivery task table. Table 5 presents the number of UAVs scheduled by each of the three distribution centers along with their corresponding delivery point assignments, intuitively reflecting the model’s capability in task allocation and path planning under multi-center coordination.
Table 5.
UAV delivery task table in lower-layer path planning.
As shown in Table 5, this study adopts a differentiated UAV task allocation strategy tailored to the spatial heterogeneity of each distribution center’s coverage area. Specifically, Distribution Center 3 is responsible for the largest number of delivery points (a total of 23), with a clearly dispersed and wide-area spatial distribution. To effectively address the path complexity caused by this high degree of dispersion and to achieve a balanced task load, the system assigns the highest number of UAVs (six in total) to this center. Based on spatial partitioning principles, this dense scheduling strategy divides the widely distributed delivery points into multiple operational units, thereby significantly reducing the average number of service points and flight path length per UAV. This not only ensures complete task coverage but also optimizes the overall operating cost and service timeliness. In contrast, Distribution Center 2 is responsible for fewer delivery points (a total of 10), with a highly clustered spatial distribution. For instance, nearby points such as 22, 42, 43, 52, 17, 18, and 26 are assigned to the same UAV. This natural spatial proximity allows the system to achieve efficient coverage with the smallest number of UAVs (only three). The centralized scheduling strategy leverages geographic aggregation effects, enabling a single flight mission to cover multiple nearby targets. This approach significantly reduces system dispatching costs while improving resource utilization. Distribution Center 1 falls between these two cases. It manages 18 delivery points, and its spatial configuration features a combination of local clustering and moderate dispersion. For example, points 36, 37, and 38 form a significant cluster, while points 11, 13, 15, 35, and 45 are more dispersed. The system assigns six UAVs to this center, with the number of service points per UAV varying from one to five. This allocation pattern demonstrates the model’s flexibility in task packaging and spatial resource coordination. For delivery points in close proximity, the system tends to group them into a single dispatch to improve path efficiency; for isolated or off-route points (e.g., point 20), the system adopts a low-density or single-point delivery strategy. This ensures full coverage while achieving dynamic matching between task load and resource allocation, further validating the adaptability and optimization performance of the proposed lower-layer path planning model under scenarios involving regional spatial heterogeneity.
Figure 8 illustrates the UAV path planning results corresponding to the delivery task table in Table 5. These results are generated via the lower-layer path planning model and its associated algorithm. In the figure, blue dots represent the delivery point locations, square nodes indicate dispatch centers or UAV takeoff/landing points, represents obstacle avoidance waypoints along UAV paths, and the background heatmap shows obstacle intensity, where brighter areas denote higher terrain complexity or flight cost. The lines connecting the nodes represent UAV flight paths.
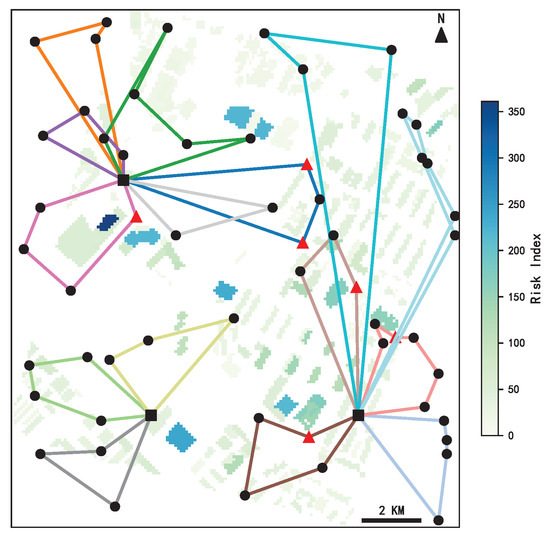
Figure 8.
UAV path planning results for the lower-layer model.
As shown in Figure 8, the overall distribution of flight paths reveals a clear spatial partitioning pattern across UAV task areas, with no significant overlap or intersection among routes. This confirms the effectiveness of the proposed lower-layer path planning algorithm in achieving a rational task load allocation. Tasks are efficiently distributed within the sub-regions managed via each distribution center, demonstrating a coordinated coupling between task area partitioning and route planning. Moreover, the majority of UAV flight paths proactively avoid high-risk zones (e.g., red triangles indicating rerouted waypoints for obstacle avoidance), revealing that the proposed model and algorithm are well adapted to flight safety constraints. The paths remain overall compact, with no redundant routes or loops, verifying the model’s capability to generate efficient route connections under multiple constraints such as time windows, flight distance, and UAV endurance. This ensures a coordinated integration of global scheduling objectives and local route optimization.
In summary, the proposed two-layer collaborative planning model establishes a robust linkage between task allocation and path planning. The upper-layer strategy effectively guides the direction of lower-layer path evolution, while the lower-layer routes are highly responsive to upper-layer requirements and constraints. This mutual coordination achieves a global balance between task completeness and cost control.
3.3. Algorithm Performance Analysis
As the performance of the path planning algorithm has already been analyzed in detail in reference [37], this section focuses solely on the performance evaluation of the task allocation algorithm.
3.3.1. Analysis of the ENSGA-II Algorithm
To systematically evaluate the search performance and convergence behavior of the proposed ENSGA-II algorithm in solving multi-objective optimization problems, this section considers three objectives: the economic cost, the time window violation time, and the number of UAVs. The convergence curves over the course of iterations are illustrated in Figure 9. The analysis is conducted from three perspectives, convergence speed, fluctuation behavior, and convergence accuracy, to validate the algorithm’s adaptability and optimization potential.
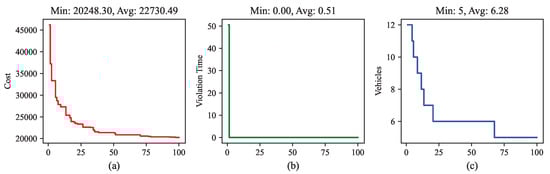
Figure 9.
Convergence process of the algorithm on different optimization objectives: (a) convergence curve of economic costs; (b) convergence curve of time window violations; (c) convergence curve of the number of UAVs.
As shown in Figure 9a, regarding the economic cost, the algorithm demonstrates a strong search capability from the initial stages, with the objective value dropping sharply and stabilizing after around 40 generations. This indicates that the ENSGA-II algorithm can quickly explore promising regions in the solution space early on and then progressively approach the Pareto frontier through fine-tuned local searches in later stages, exhibiting a well-balanced mechanism between global exploration and local exploitation. In Figure 9b, the convergence curve for the time-window violation time displays a significantly nonlinear decreasing trend, with the objective value dropping sharply within the first five generations and then converging to a lower layer. This performance suggests that the ENSGA-II algorithm can identify and avoid critical task scheduling conflicts early in the process. By adaptively adjusting crossover and mutation operations, it effectively maintains population diversity, continuously enhancing time coordination and improving overall scheduling punctuality. As shown in Figure 9c, for the number of UAVs, the convergence curve exhibits a characteristic segmented decreasing trend, with alternating phases of “descent-plateau”. The initial descent phase reflects the algorithm’s ability to rapidly compress resource allocation through task aggregation and path integration strategies. The subsequent plateau phases indicate stabilization near local optima, which is beneficial for maintaining solution feasibility and diversity. As the optimization progresses, the algorithm transitions across multiple local plateaus, further reducing the scheduling scale. The final convergence result shows that, despite a significant reduction in UAV numbers, task coverage remains effective, demonstrating that ENSGA-II achieves robust scheduling performance and optimization depths under multi-objective trade-offs.
In summary, the convergence processes of all three objectives validate the ENSGA-II algorithm’s stability and efficiency in handling high-dimensional, multi-constraint scheduling problems. The algorithm not only delivers rapid convergence and high-quality solution sets but also exhibits the ability to balance economic efficiency, timeliness, and resource feasibility, making it well suited to UAV scheduling optimization in multi-depot scenarios.
3.3.2. Comparative Algorithm Analysis
To perform a comparative analysis, a standardized experimental environment was constructed. In this experiment, the number of customer points was set to 100, and the number of distribution centers was set to 3. The detailed parameters for each distribution center are shown in Table 6. Additionally, two types of heterogeneous UAVs were deployed collaboratively to execute tasks, with the parameters of each UAV type listed in Table 7. The customer task time window was set to the interval [0, 90], and the operating time for each distribution center was uniformly limited to 8 h, comprehensively reflecting complex constraints related to both time and resources.
Table 6.
Distribution center parameter settings.
Table 7.
UAV parameter settings.
Additionally, the task-planning environment was constructed on a standardized grid map with dimensions of 1000 × 1000. This design not only ensures the spatial uniformity of task point distribution but also enhances the applicability and scalability of the model across various real-world scenarios. To evaluate the comprehensive optimization capability of the algorithms in terms of economic efficiency, timeliness, and resource utilization, five representative multi-objective evolutionary algorithms were selected for comparison: MOEA/D [38], NSGA-II [39], INSGA-II [40], PESA-II [41], and NSGA-III [42]. Three mainstream performance indicators were introduced to assess the optimization performance across the three objectives: hypervolume (HV), inverted generational distance (IGD), and C-metric (C-metric). In addition, to enhance the statistical significance and robustness of the results, each algorithm was independently executed 30 times, and the average performance over these runs was analyzed. All algorithms were tested under identical parameter settings to ensure consistency and fairness. The initial population size was set to 250, and the maximum number of generations was fixed at 100.
Table 8 summarizes the average performance of ENSGA-II and the five comparative algorithms across the three objectives, providing a comprehensive evaluation of their strengths in terms of solution set distribution, convergence behavior, and dominance ability.
Table 8.
Performance comparison of different algorithms in the task-planning problem.
In terms of the hypervolume (HV) indicator, which reflects solution set diversity and coverage, ENSGA-II achieved an average value of 1.0771, significantly outperforming all benchmark algorithms. Specifically, it surpassed INSGA-II (1.0250), PESA-II (0.7475), NSGA-II (0.5938), MOEA/D (0.5478), and NSGA-III (0.5190) by approximately 5.08%, 44.06%, 81.33%, 96.52%, and 107.49%, respectively. This result indicates that ENSGA-II possesses superior capability in expanding the Pareto front in high-dimensional objective spaces. It effectively enhances the coverage and uniformity of the solution set, ensuring a well-distributed Pareto front across the global objective space. Regarding the IGD indicator, which measures convergence accuracy and proximity to the ideal Pareto front, ENSGA-II also demonstrated outstanding performance. Its average IGD value reached 0.0295, substantially lower than those of INSGA-II (0.0945), PESA-II (0.1858), NSGA-II (0.2110), NSGA-III (0.2677), and MOEA/D (0.2877). This indicates that the solutions generated via ENSGA-II are, on average, closest to the theoretical optimal Pareto front. The result underscores the algorithm’s ability to achieve faster and more stable convergence in complex nonlinear search spaces, significantly reducing deviation and enhancing the reliability and effectiveness of global solutions. For the C-metric indicator, which evaluates the dominance ratio of the Pareto front, ENSGA-II demonstrated significantly higher dominance ratios in all pairwise comparisons with other algorithms. For instance, its C-metric value against MOEA/D was 1.0000, indicating that all solutions generated via ENSGA-II dominated those from MOEA/D. In comparison with NSGA-II and NSGA-III, the values reached 0.9771 and 0.9802, respectively, confirming a substantial dominance advantage for ENSGA-II in these comparisons. These results validate the superior performance of ENSGA-II in the studied multi-objective optimization problem based on the simulation results, demonstrating a strong global search capability according to the C-metric. Finally, from the win–same–loss (W/S/B) statistical results, ENSGA-II emerged as the overall winner in all algorithmic comparisons, without any ties or inferior outcomes. This further confirms, at a statistical layer, the algorithm’s broad adaptability and robustness in solving complex scheduling problems. In summary, ENSGA-II achieved outstanding results across all evaluation metrics, demonstrating a stronger global search capability and superior solution quality in high-dimensional multi-objective optimization tasks.
Table 9 further compares the performance of ENSGA-II and the five benchmark algorithms at the individual solution layer across the three objective functions. The comparison is based on a pairwise evaluation of individual objective values, where the frequency of ENSGA-II outperforming (<), equaling (=), or underperforming (>) each benchmark algorithm is counted. This quantifies the dominance strength and optimization stability of ENSGA-II at the single-objective layer.
Table 9.
Statistical comparison of different optimization algorithms.
As shown in Table 9, for the economic cost objective, ENSGA-II demonstrated absolute superiority in all 30 comparative runs against MOEA/D, NSGA-II, NSGA-III, and PESA-II (i.e., 30 out of 30 comparisons showed ENSGA-II as better, denoted as “<”, with “=” and “>” both being zero). However, in comparison with INSGA-II, ENSGA-II showed inferior performance in 18 instances and superior performance in only 11, indicating a certain disadvantage relative to INSGA-II in this single objective. Notably, the observed economic cost gap primarily stems from the staged evolutionary mechanism of ENSGA-II. During the initial 25% of generations, the algorithm prioritizes exploration via the first mutation operator (reconstruction of delayed paths, ), deferring the activation of the second mutation operator (destruction–reconstruction for economic costs, ). While this design enhances long-term Pareto diversity, it temporarily limits intensive cost optimization compared to INSGA-II’s continuous cost-driven search. Nevertheless, as evidenced by the convergence curves in Figure 9a, ENSGA-II progressively bridges this gap in later stages, achieving near-optimal economic cost while maintaining superior holistic performance. The marginal difference in cost (typically in final solutions) is negligible when the significant gains in solution diversity and dominance are considered. Nonetheless, from a comprehensive multi-objective optimization perspective, ENSGA-II still shows a clear advantage in overall performance across all three objectives, demonstrating a superior global scheduling capability and algorithmic stability. For the task delay time objective, ENSGA-II consistently outperformed all baseline algorithms, achieving 150 “<” outcomes without any ties (“=”) or inferior results (“>”) and reflecting its strong capability in time-efficiency control. This confirms the algorithm’s effectiveness in avoiding time window violations and ensuring high levels of timeliness. Regarding the number of UAVs required, ENSGA-II also exhibited strong competitiveness. Out of 150 comparisons, it achieved 127 superior, 18 equal, and only 5 inferior results, fully demonstrating its excellence in UAV resource allocation efficiency. This indicates that ENSGA-II can effectively distribute tasks using fewer UAV platforms, thereby reducing resource waste.
In summary, across the three objectives, ENSGA-II achieved a win ratio of 90.7% (408 out of 450) across 90 experimental runs, with an inferior rate of only 5.1%, and showed an “all-win” dominance across multiple objectives. This not only confirms the algorithm’s global effectiveness in solution space exploration but also highlights its practical applicability and robustness in addressing multi-objective, resource-constrained, and highly constrained joint optimization problems, offering an efficient intelligent optimization tool for tackling high-dimensional complex scheduling challenges.
4. Discussion
In the simulation experiments, the proposed bi-layer multi-objective collaborative scheduling optimization model and ENSGA-II algorithm demonstrated excellent performance on benchmark instances of the multi-depot-multi-UAV task planning problem. In terms of task allocation metrics, the optimization results show an average reduction of 47.8% in economic cost, a 71.4% decrease in the number of UAVs required, and significant compression of time window violation durations. Regarding algorithmic performance, the proposed ENSGA-II algorithm achieved an HV value of 1.0771, outperforming other algorithms by 72.35% to 109.82%. Its average IGD value was 0.0295, far superior to that of other baseline algorithms (ranging from 0.0893 to 0.2714), and it exhibited overwhelming dominance in the C-metric, indicating significant advantages in the distribution, convergence, and diversity of non-dominated solutions.
These improvements can be attributed to several key innovations. First, the hierarchical modeling allows for clear decoupling between strategic task assignment and tactical path generation, improving modularity and flexibility. Second, the algorithmic enhancements—such as goal-oriented genetic operators and adaptive particle control—enable a better balance between exploration and exploitation in both layers.
This work holds practical significance for real-world UAV-based logistics, especially in urban areas with dynamic environments and complex constraints. However, certain limitations remain. The simulation assumes ideal communication between UAVs and depots, neglecting potential real-world issues such as network delays or localization errors. Moreover, the current model focuses on static scenarios and does not explicitly handle dynamic task insertions, collision avoidance under uncertainty, or energy-aware scheduling.
5. Conclusions
This study addresses the challenges of modeling complexity, high-dimensional coupling, and multi-objective collaborative optimization in the multi-UAV and multi-depot task planning problem. A bi-layer optimization framework with an upper-lower coordination mechanism is developed, along with improved algorithms tailored to different hierarchical optimization needs. The objective is to enhance the adaptability and optimization capability of task planning systems in complex urban airspace logistics environments. The main contributions of this study are summarized as follows:
(1) To tackle the modeling complexity and multi-objective optimization challenges of the multi-UAV and multi-depot task planning problem, a novel bi-layer task planning model is proposed. The upper-layer model addresses task allocation, while the lower-layer model focuses on path planning. Information such as task assignment schemes and flight distances is exchanged between layers through an interaction and feedback mechanism, thereby improving the model’s solving efficiency in multi-objective, multi-constraint environments.
(2) For the task allocation problem, an ENSGA-II algorithm is proposed. It incorporates a heuristic initialization strategy under path feasibility constraints, goal-oriented top-down and bottom-up search operators, and an adaptive mutation mechanism. This design enables dynamic coordination between global exploration and local exploitation, providing robust and efficient optimization support for upper-layer task assignment.
(3) For the path planning problem, an improved PSO algorithm is proposed by integrating chaotic initialization, linearly adjusted acceleration factors and maximum velocity, particle position updates with stochastic perturbation, and adaptively tuned inertia weights. These improvements enhance the solving capacity and quality of path generation.
These results support the research hypothesis that a bi-layer optimization model combined with customized metaheuristics can significantly improve performance in complex task planning scenarios. Therefore, the hypothesis proposed at the beginning of the study is accepted based on empirical evidence.
The bi-layer coordinated optimization model and the improved algorithms developed in this study provide an effective solution for dealing with complex constraints, conflicting objectives, and large-scale task challenges. They offer a highly adaptive and high-quality decision-making tool for collaborative task planning in urban airspace logistics scenarios. The potential applications extend to smart logistics, emergency response coordination, and unmanned fleet management systems.
Despite the promising results, this study has several limitations that warrant consideration. Primarily, the current framework assumes a static environment with perfect communication and localization. It does not explicitly model dynamic obstacles (e.g., other aerial vehicles, birds) or uncertainties arising from communication delays, localization errors, or sudden UAV failures. Furthermore, the path planning layer relies on predefined risk maps and grid-based modeling, which may not fully capture the complexities of real-time collision avoidance in dense urban airspace involving interactions between multiple moving UAVs.
Future work will focus on addressing these limitations and enhancing the framework’s applicability to dynamic and uncertain operational environments. Building upon the strengths of the upper-layer task allocation model, our primary research direction involves replacing the current lower-layer PSO-based path planner with a reinforcement learning (RL) approach. Specifically, we will investigate the development of an RL agent capable of generating collision-free trajectories that dynamically avoid both static obstacles (buildings and no-fly zones) and cooperative/non-cooperative moving obstacles (other UAVs). This will involve the following: (1) designing a suitable simulation environment (e.g., based on OpenAI Gym) that incorporates realistic UAV dynamics, sensor models, and stochastic obstacle behavior; (2) formulating reward functions that effectively balance path efficiency, safety margins (e.g., minimum separation distances), energy consumption, and adherence to upper-layer constraints like time windows; (3) exploring advanced RL algorithms (e.g., PPO, DDPG, and multi-agent RL) capable of handling the high-dimensional state and action spaces inherent to multi-UAV collision avoidance; and (4) validating the RL-based planner against the current PSO approach in dynamic scenarios.
Beyond the core RL integration for dynamic collision avoidance, future research will also explore the following: (1) the integration of real-time task insertion and re-planning mechanisms triggered via new delivery requests or unexpected events (e.g., UAV failures and weather disruptions); (2) incorporating more sophisticated energy consumption models and explicit energy-aware scheduling into both layers, considering factors like wind fields and payload; (3) enhancing the framework’s robustness to communication uncertainties and partial observability; (4) conducting extensive field trials with actual UAV platforms to validate the simulation results and refine the models under real-world conditions. Incorporating digital twin technology could serve as a bridge between simulation and physical deployment.
Author Contributions
Methodology, J.W. and F.W.; Software, Y.S. All authors have read and agreed to the published version of the manuscript.
Funding
This research was funded by CAUC Innovation and Entrepreneurship Training Grant for Undergraduates, grant number 202510059044; National Key Research and Development Program Project of China, grant number 2023YFB4302903; Tianjin Natural Science Foundation Project of China, grant number 24JCYBJC01170.
Data Availability Statement
The original contributions presented in this study are included in the article. Further inquiries can be directed to the corresponding author.
Conflicts of Interest
The authors declare no conflict of interest.
References
- Darchini-Tabrizi, M.; Pakdaman-Donyavi, A.; Entezari-Maleki, R.; Sousa, L. Performance enhancement of UAV-enabled MEC systems through intelligent task offloading and resource allocation. Comput. Netw. 2025, 264, 111280. [Google Scholar] [CrossRef]
- Kurdi, H.; Aloboud, E.; Alalwan, M.; Alhassan, S.; Alotaibi, E.; Bautista, G.; How, J. Autonomous task allocation for multi-UAV systems based on the locust elastic behavior. Appl. Soft Comput. 2018, 71, 110–126. [Google Scholar] [CrossRef]
- Du, P.; He, X.; Cao, H.; Garg, S.; Kaddoum, G.; Hassan, M. AI-based energy-efficient path planning of multiple logistics UAVs in intelligent transportation systems. Comput. Commun. 2023, 207, 46–55. [Google Scholar] [CrossRef]
- Wang, X.; Gao, X.; Wang, L.; Su, X.; Jin, J.; Liu, X.; Deng, Z. Resilient multi-objective mission planning for UAV formation: A unified framework integrating task pre- and re-assignment. Def. Technol. 2025, 45, 203–226. [Google Scholar] [CrossRef]
- He, C.; Ouyang, H.; Huang, W.; Li, S.; Zhang, C.; Ding, W.; Zhan, Z.H. An adaptive heuristic algorithm with a collaborative search framework for multi-UAV inspection planning. Appl. Soft Comput. 2025, 174, 112969. [Google Scholar] [CrossRef]
- Ahmed, G.; Sheltami, T.; Ghaleb, M.; Hamdan, M.; Mahmoud, A.; Yasar, A. Energy-Efficient Internet of Drones Path-Planning Study Using Meta-Heuristic Algorithms. Appl. Sci. 2024, 14, 2418. [Google Scholar] [CrossRef]
- Li, K.; Yan, X.; Han, Y. Multi-mechanism swarm optimization for multi-UAV task assignment and path planning in transmission line inspection under multi-wind field. Appl. Soft Comput. 2024, 150, 111033. [Google Scholar] [CrossRef]
- Jiang, H.; Wang, G.; Liu, Q.; Gao, P. Hierarchical Multi-UAVs Task Assignment Based on Dominance Rough Sets. Appl. Soft Comput. 2023, 143, 110445. [Google Scholar] [CrossRef]
- Yu, Y.; Tang, Q.; Jiang, Q.; Fan, Q. A Deep Reinforcement Learning-Assisted Multimodal Multi-Objective Bi-Level Optimization Method for Multi-Robot Task Allocation. IEEE Trans. Evol. Comput. 2025, 29, 1. [Google Scholar] [CrossRef]
- Yang, Y.; Fu, Y.; Xin, R.; Feng, W.; Xu, K. Multi-UAV Trajectory Planning Based on a Two-Layer Algorithm Under Four-Dimensional Constraints. Drones 2025, 9, 471. [Google Scholar] [CrossRef]
- Xiao, Y.; Li, Y.; Liu, H.; Chen, Y.; Wang, Y.; Wu, G. Adaptive large neighborhood search algorithm with reinforcement search strategy for solving extended cooperative multi task assignment problem of UAVs. Inf. Sci. 2024, 679, 121068. [Google Scholar] [CrossRef]
- Fan, M.; Liu, H.; Wu, G.; Gunawan, A.; Sartoretti, G. Multi-UAV reconnaissance mission planning via deep reinforcement learning with simulated annealing. Swarm Evol. Comput. 2025, 93, 101858. [Google Scholar] [CrossRef]
- Li, H.; Huang, J. Hierarchical federated deep reinforcement learning based joint communication and computation for UAV situation awareness. Veh. Commun. 2024, 50, 100853. [Google Scholar] [CrossRef]
- Wu, Y.; Gou, J.; Ji, H.; Deng, J. Hierarchical mission replanning for multiple UAV formations performing tasks in dynamic situation. Comput. Commun. 2023, 200, 132–148. [Google Scholar] [CrossRef]
- Liu, D.; Fei, B.; Bao, W.; Zhu, X.; Li, X. DAWN: Dynamic Task Planning of Multi-UAV With Two-Layer Optimization Mechanism in Uncertain Environments. IEEE Internet Things J. 2024, 11, 1. [Google Scholar] [CrossRef]
- Gao, C.; Wang, X.; Chen, X.; Chen, B.M. A hierarchical multi-UAV cooperative framework for infrastructure inspection and reconstruction. Control Theory Technol. 2024, 22, 394–405. [Google Scholar] [CrossRef]
- Li, Z.; Liu, Y. Research On Bilevel Task Planning Method For Multi UAV Logistics Distribution. INMATEH Agric. Eng. 2024, 74, 761–770. [Google Scholar] [CrossRef]
- Lei, H.; Yan, Y.; Liu, J.; Han, Q.; Li, Z. Hierarchical Multi-UAV Path Planning for Urban Low Altitude Environments. IEEE Access 2024, 12, 2109–2124. [Google Scholar] [CrossRef]
- Liu, Y.; Chen, C.; Sun, Y.; Miao, S. Advancing Multi-UAV Inspection Dispatch Based on Bilevel Optimization and GA-NSGA-II. Appl. Sci. 2025, 15, 3673. [Google Scholar] [CrossRef]
- Cheng, Z.; Zhao, L.; Shi, Z. Decentralized Multi-UAV Path Planning Based on Two-Layer Coordinative Framework for Formation Rendezvous. IEEE Access 2022, 10, 45695–45708. [Google Scholar] [CrossRef]
- Yan, F.; Chu, J.; Hu, J.; Zhu, X. Cooperative task allocation with simultaneous arrival and resource constraint for multi-UAV using a genetic algorithm. Expert Syst. Appl. 2024, 245, 123023. [Google Scholar] [CrossRef]
- Zhan, H.; Zhang, Y.; Huang, J.; Song, Y.; Xing, L.; Wu, J.; Gao, Z. A reinforcement learning-based evolutionary algorithm for the unmanned aerial vehicles maritime search and rescue path planning problem considering multiple rescue centers. Memetic Comput. 2024, 16, 373–386. [Google Scholar] [CrossRef]
- Mao, X.; Wu, G.; Fan, M.; Cao, Z.; Pedrycz, W. DL-DRL: A Double-Level Deep Reinforcement Learning Approach for Large-Scale Task Scheduling of Multi-UAV. IEEE Trans. Autom. Sci. Eng. 2025, 22, 1028–1044. [Google Scholar] [CrossRef]
- Chen, Q.; Cheng, S.; Hovakimyan, N. Simultaneous Spatial and Temporal Assignment for Fast UAV Trajectory Optimization Using Bilevel Optimization. IEEE Robot. Autom. Lett. 2023, 8, 3860–3867. [Google Scholar] [CrossRef]
- Gao, J.; Jia, L.; Kuang, M.; Shi, H.; Zhu, J. An End-to-End Solution for Large-Scale Multi-UAV Mission Path Planning. Drones 2025, 9, 418. [Google Scholar] [CrossRef]
- Zou, Z.; Wu, Y.; Peng, L.; Wang, M.; Wang, G. Multi-UAV maritime collaborative behavior modeling based on hierarchical deep reinforcement learning and DoDAF process mining. Aerosp. Syst. 2025, 8, 447–466. [Google Scholar] [CrossRef]
- Li, S.; Zhang, H.; Yi, J.; Liu, H. A bi-level planning approach of logistics unmanned aerial vehicle route network. Aerosp. Sci. Technol. 2023, 141, 108572. [Google Scholar] [CrossRef]
- Xue, K.; Zhai, L.; Li, Y.; Lu, Z.; Zhou, W. Task offloading and multi-cache placement based on DRL in UAV-assisted MEC networks. Veh. Commun. 2025, 53, 100900. [Google Scholar] [CrossRef]
- Shianios, D.; Kolios, P.; Kyrkou, C. MultiFire20K: A semi-supervised enhanced large-scale UAV-based benchmark for advancing multi-task learning in fire monitoring. Comput. Vis. Image Underst. 2025, 254, 104318. [Google Scholar] [CrossRef]
- Akay, R.; Yildirim, M. SBA*: An efficient method for 3D path planning of unmanned vehicles. Math. Comput. Simul. 2025, 231, 294–317. [Google Scholar] [CrossRef]
- Huang, J.; Chen, C.; Shen, J.; Liu, G.; Xu, F. A self-adaptive neighborhood search A-star algorithm for mobile robots global path planning. Comput. Electr. Eng. 2025, 123, 110018. [Google Scholar] [CrossRef]
- Yildirim, M.; Akay, R. An efficient grid-based path planning approach using improved artificial bee colony algorithm. Knowl. Based Syst. 2025, 318, 113528. [Google Scholar] [CrossRef]
- Ruan, F.; Chen, C.; He, C.; Cheng, Y.; Sun, Y. Optimization method of public decontamination location and allocation problem in off-site nuclear emergency based improved NSGA-II. J. Hazard. Mater. 2025, 489, 137572. [Google Scholar] [CrossRef] [PubMed]
- Xu, W.; Cheng, L.; Cui, Y.; Yan, H.; Jiang, H.; Jiao, W. An improved method of applying PSO-BP to optimize PAT energy efficiency based on entropy production theory. Energy Convers. Manag. 2025, 327, 119472. [Google Scholar] [CrossRef]
- Xiang, X.; Yan, X.; Gao, C.; Zhu, S.; Xi, M.; Gao, H. A circle chaos random search strategy particle swarm optimization with its application. Comput. Electr. Eng. 2022, 102, 108219. [Google Scholar] [CrossRef]
- Zhao, J.; Cui, Y.; Huang, J.; Zhu, R. Adaptive grey wolf optimizer based on transfer function inertia weight of second-order high-pass filter. Alex. Eng. J. 2024, 107, 443–454. [Google Scholar] [CrossRef]
- Wang, F.; Yang, Q. A Bi-level Task Planning Method for Multi-UAV Logistics Delivery. J. Beijing Univ. Aeronaut. Astronaut. 2023, 49, 1–14. [Google Scholar] [CrossRef]
- Chen, X.; Luo, D.; Yu, D.; Fang, Z. Multi-objective test case prioritization based on an improved MOEA/D algorithm. Expert Syst. Appl. 2025, 266, 126086. [Google Scholar] [CrossRef]
- Wen, X.; Zhang, X.; Li, H.; Ji, S.; Wang, H.; Ye, G.; Xing, H.; Liu, S. An improved NSGA-II algorithm based on reinforcement learning for aircraft moving assembly line integration optimization problem. Swarm Evol. Comput. 2025, 94, 101911. [Google Scholar] [CrossRef]
- Srivastava, G.; Singh, A.; Mallipeddi, R. NSGA-II with objective-specific variation operators for multiobjective vehicle routing problem with time windows. Expert Syst. Appl. 2021, 176, 114779. [Google Scholar] [CrossRef]
- Khaleghi, A.; Eydi, A. Multi-period hub location problem considering polynomial time-dependent demand. Comput. Oper. Res. 2023, 159, 106357. [Google Scholar] [CrossRef]
- Hou, Y.; Liao, X.; Chen, G.; Chen, Y. Co-Evolutionary NSGA-III with deep reinforcement learning for multi-objective distributed flexible job shop scheduling. Comput. Ind. Eng. 2025, 203, 110990. [Google Scholar] [CrossRef]
Disclaimer/Publisher’s Note: The statements, opinions and data contained in all publications are solely those of the individual author(s) and contributor(s) and not of MDPI and/or the editor(s). MDPI and/or the editor(s) disclaim responsibility for any injury to people or property resulting from any ideas, methods, instructions or products referred to in the content. |
© 2025 by the authors. Licensee MDPI, Basel, Switzerland. This article is an open access article distributed under the terms and conditions of the Creative Commons Attribution (CC BY) license (https://creativecommons.org/licenses/by/4.0/).