1. Introduction
AGB and forest-based carbon sequestration are essential for addressing the escalating challenges of climate change, shaping reforestation strategies, and informing global carbon accounting protocols [
1]. Forest ecosystems play a pivotal role as carbon sinks, absorbing and storing large volumes of atmospheric CO
2 through the processes of photosynthesis and biomass accumulation [
2]. In this context, the development of reliable, timely, and scalable estimation techniques is critical for the implementation of climate initiatives such as REDD+ (Reducing Emissions from Deforestation and Forest Degradation) [
3], the Paris Agreement, and various national carbon neutrality frameworks [
4]. Traditional biomass estimation methods, which primarily rely on destructive field sampling and allometric equations derived from direct measurements—such as tree height, diameter at breast height (DBH), and crown dimensions—have demonstrated high accuracy at localized scales [
5]. However, their application is limited by the intensive labor, cost, and spatial constraints they impose, rendering them impractical for broad or repeated monitoring efforts [
6]. Furthermore, these methods often overlook intra-plot structural variability and tend to underperform in dense or topographically complex forested landscapes, where measurement inconsistencies are more likely to arise.
In response to the limitations of traditional field-based methods, the remote sensing community has increasingly turned to aerial and satellite platforms for non-destructive vegetation monitoring. Multispectral indices, such as the Normalized Difference Vegetation Index (NDVI) [
7] and the Red Edge Chlorophyll Index (CIred-edge) [
8], have become widely adopted as proxies for estimating biomass due to their sensitivity to vegetation greenness and pigment concentration [
8]. While these indices offer valuable insights into plant health, their effectiveness diminishes in structurally complex environments. Specifically, they lack sensitivity to vertical canopy architecture, which can result in saturation effects in high-biomass forests and consistent underestimation in ecosystems characterized by multilayered vegetation. Although satellite-based LiDAR and hyperspectral imaging technologies offer improved structural and spectral resolution, their high operational costs and logistical demands pose significant barriers to routine, localized deployment, particularly in resource-constrained settings and among smallholder land users.
In recent years, Unmanned Aerial Vehicles (UAVs) have emerged as a transformative technology in the field of environmental monitoring [
9]. Their relatively low cost, high spatial resolution, and operational flexibility make them particularly suitable for fine-scale biomass estimation in both managed ecosystems and natural forested landscapes. When equipped with multispectral sensors and processed using photogrammetric reconstruction methods such as Structure-from-Motion (SfM) [
10], UAVs can generate a diverse set of data products, including radiometric imagery and digital surface models (DSMs), offering a multimodal representation of forest structure and health [
11]. However, despite the promise of UAV-based remote sensing, its potential remains underutilized due to constraints in current modeling techniques. Many existing studies continue to rely on handcrafted features, two-dimensional convolutional architectures, or statistical regression models—approaches that often fall short in effectively integrating spectral and geometric cues in a unified predictive framework.
To bridge the limitations of existing biomass estimation methods, we introduce ForestIQNet, a novel deep learning architecture tailored for the joint estimation of AGB and carbon sequestration from UAV-derived multispectral and structural data. The framework features a dual-branch encoder system, where one pathway processes high-resolution multispectral imagery using a customized EfficientNetV2 backbone, and the other ingests voxelized canopy height representations through a 3D ResNet encoder. These heterogeneous feature domains are integrated via a CAFFmodule, which explicitly learns the interdependencies between spectral reflectance and three-dimensional canopy morphology. The fused feature representation is subsequently passed to a lightweight Transformer-based regression head that models long-range spatial relationships and performs multitask prediction of AGB and CO2e. We evaluate ForestIQNet using a comprehensive, open-access dataset curated by Korea’s AI Hub, which comprises spatially aligned multispectral images, canopy height models, and field-validated biomass measurements across a diverse range of forest ecosystems. Comparative benchmarking against 15 state-of-the-art models—including classical machine learning regressors and deep convolutional networks—demonstrates that ForestIQNet consistently delivers high predictive performance and generalization across ecological zones.
This study aims to develop a multimodal deep learning framework—ForestIQNet—that jointly leverages spectral and structural UAV-derived data to accurately estimate AGB and carbon sequestration (CO2e). Our primary objectives are: (1) to design a dual-branch encoder system for extracting complementary spectral and 3D structural features; (2) to integrate these representations through a novel cross-attentional fusion module; and (3) to perform multitask regression using a Transformer-based head for scalable, interpretable forest carbon estimation. The proposed model is benchmarked against 15 state-of-the-art approaches on a large-scale UAV dataset to validate its performance and generalization.
2. Related Works
The accurate estimation of AGB and carbon sequestration remains a fundamental objective in forest ecology, remote sensing, and environmental informatics [
12]. Traditionally, this task has relied on statistical models derived from field-based measurements, which, while effective at local scales, are often labor-intensive and difficult to scale. Recent developments in computer vision [
13], the proliferation of unmanned aerial vehicles (UAVs) [
14], and the emergence of deep learning methodologies [
15] have significantly enhanced the scalability, automation, and accuracy of biomass estimation techniques. In the context of this evolving landscape, the current section reviews the literature across four key thematic areas: spectral feature modeling [
16], three-dimensional structural analysis, UAV-enabled biomass prediction, and multimodal deep learning architectures for integrated ecological inference [
17]. Multispectral and hyperspectral imaging have been extensively utilized for biomass estimation through the application of vegetation indices (VIs), including the NDVI [
18], Enhanced Vegetation Index (EVI) [
19], and Red Edge Chlorophyll Index [
20]. These indices are specifically designed to capture canopy reflectance patterns that correlate with key physiological traits such as chlorophyll concentration [
21], moisture content [
22], and leaf area index (LAI) [
23]. Despite their widespread use, spectral models based on these indices often exhibit saturation in high-biomass environments and are limited in their ability to capture vertical structural variation within forest canopies. As a result, they frequently underestimate biomass in ecosystems characterized by layered or heterogeneous vegetation structures. To overcome these limitations, researchers have turned to machine learning-based regressors, including Support Vector Regression (SVR) [
24], Random Forest (RF) [
25], and Gradient Boosting Machines (GBM) [
26], which are capable of modeling complex, non-linear relationships between VIs and biomass. While these approaches offer improved predictive performance relative to linear models, they still rely heavily on handcrafted features and typically fail to fully leverage the spatial richness and contextual information embedded in high-resolution remote sensing data.
The incorporation of geometric data—particularly from LiDAR systems and photogrammetric point clouds—has markedly advanced the accuracy of biomass estimation techniques [
27]. Foundational products such as Digital Surface Models (DSMs) [
28], Digital Terrain Models (DTMs) [
29], and Canopy Height Models (CHMs) derived from their subtraction [
30] are widely utilized to characterize vertical vegetation structure. Allometric models frequently use metrics such as mean or maximum canopy height as primary predictors of AGB [
31]. In particular, studies leveraging LiDAR-derived voxel grids and other three-dimensional structural features have demonstrated substantial improvements in biomass prediction, especially in environments where spectral information alone proves inadequate. However, the use of high-resolution 3D structural data introduces notable computational and modeling challenges. Many conventional approaches reduce volumetric data to two-dimensional summary statistics, thereby discarding spatial context critical for accurate modeling. Although some recent efforts have adopted voxel-based representations, they often depend on shallow convolutional architectures or rudimentary statistical aggregation methods, which are insufficient for capturing the complex spatial continuity and stratification inherent in multilayered forest canopies.
Unmanned Aerial Vehicles (UAVs) have become a powerful tool for fine-scale ecological monitoring, owing to their affordability, operational flexibility, and ability to capture imagery at sub-decimeter spatial resolution [
32]. These attributes make UAVs particularly well-suited for conducting localized surveys across heterogeneous landscapes, including applications in smallholder forestry, agroforestry systems, and ecosystem restoration initiatives [
33]. When outfitted with multispectral sensors and processed through Structure-from-Motion (SfM) techniques, UAVs can produce both high-resolution spectral imagery and detailed photogrammetric reconstructions of canopy structure [
34]. Recent studies have leveraged these capabilities to estimate AGB by integrating spectral indices, canopy height model (CHM)-derived features, and field-based allometric equations [
35]. However, many of these approaches rely on shallow regression models, manually engineered features, or treat spectral and structural data as independent inputs. This decoupled treatment of modalities often fails to capture the intricate spatial and contextual relationships that are essential for accurate biomass estimation, particularly in structurally diverse or vertically layered forest environments. Deep learning has delivered state-of-the-art results across a broad spectrum of geospatial applications, including land cover classification, crop yield prediction, and forest health assessment [
36].
Convolutional Neural Networks (CNNs) trained on multispectral imagery have shown considerable potential for biomass mapping; however, their effectiveness is often limited by insufficient spectral depth and the absence of volumetric modeling capabilities [
37]. In attempts to incorporate structural information, researchers have explored approaches such as 2.5D surface representations and voxelization of point cloud data. Dual-branch CNNs and early fusion techniques have also been proposed to integrate RGB imagery with height data, though these architectures typically rely on naïve concatenation schemes and fall short in capturing the complex dependencies between spectral and structural features [
38]. More recent advances have introduced attention-based fusion models and Transformer architectures, which are capable of modeling long-range spatial relationships and enhancing interpretability [
39]. Despite their promise, applications of these advanced architectures to biomass estimation—particularly within UAV-based multimodal contexts—remain relatively rare. Although previous research has laid an important foundation for UAV-enabled biomass modeling, much of it remains fragmented between spectral-only and structure-only paradigms. Existing methods often fail to fully exploit the complementary information embedded in spectral reflectance and 3D canopy structure, and seldom incorporate attention mechanisms or Transformer-based reasoning to their full potential. In response to these limitations, we propose ForestIQNet—a cross-attentional, multimodal deep learning framework that fuses spectral and structural UAV data in a unified, end-to-end architecture designed for accurate and scalable estimation of both above-ground biomass and carbon sequestration.
3. Materials and Methods
This section delineates the methodological foundation of the proposed ForestIQNet architecture, developed for high-resolution estimation of AGB and carbon sequestration using UAV-acquired spectral and structural data. ForestIQNet is composed of a dual-stream encoder design that independently extracts hierarchical features from multispectral imagery and voxelized canopy height representations. These complementary feature spaces are subsequently aligned and fused through a CAFFmodule, which enables modality-aware interaction by learning bidirectional attention maps. The resulting multimodal representation is processed by a lightweight Transformer-based regression head, designed to model long-range spatial dependencies and support multitask prediction. Additionally, this section outlines the preprocessing protocols, voxelization methodology, data alignment procedures, and training strategies employed to optimize model performance across ecologically diverse forest landscapes.
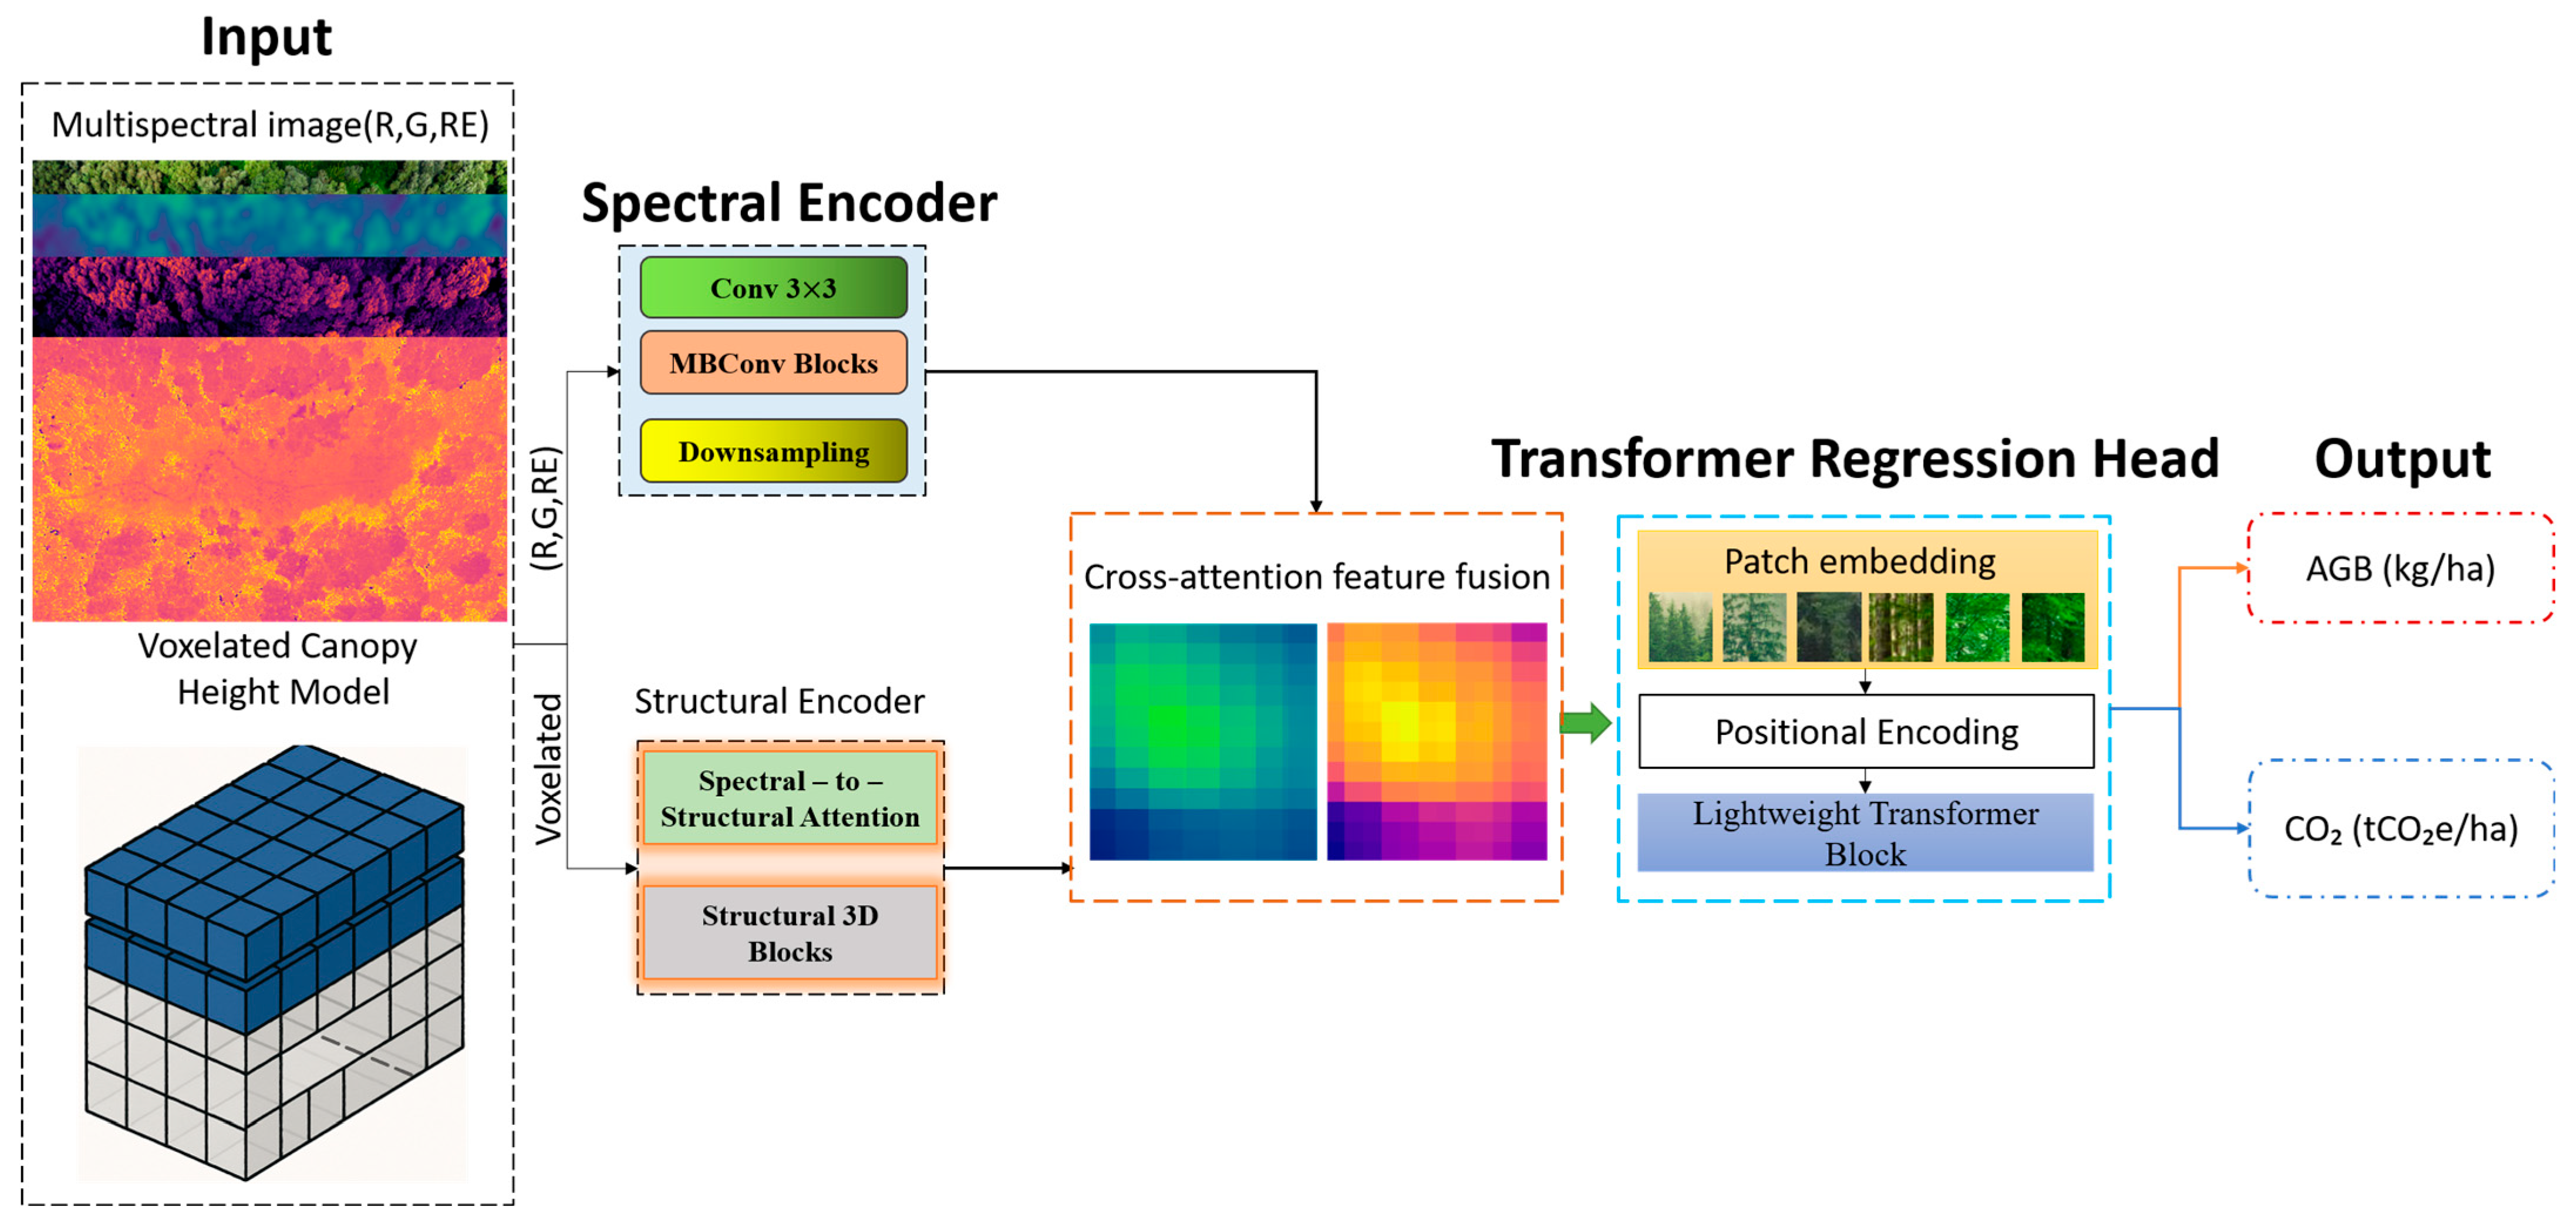
Figure 1 illustrates the overall architecture of the proposed ForestIQNet framework for biomass and carbon sequestration estimation. The model receives two aligned inputs: high-resolution multispectral UAV imagery and a voxelized CHM. The CHM branch of the encoder processes the raw 3D voxel grid, allowing the network to directly learn structural depth cues, texture, and vertical stratification without handcrafted features. These inputs are processed independently by two dedicated encoder branches. The spectral encoder, built upon a modified EfficientNetV2 backbone, extracts rich spectral-spatial features from the five-band multispectral data (RGB, red-edge, NIR). Simultaneously, the structural encoder, based on a 3D ResNet architecture, encodes volumetric vegetation structure from the CHM. The features from both branches are then passed into a CAFF module, which learns bidirectional attention maps to align and emphasize the most informative regions across modalities. The fused representation is subsequently fed into a Transformer-based regression head that models long-range spatial dependencies and performs multitask prediction, generating final estimates for AGB and carbon sequestration (CO
2e). The architecture is designed to exploit the complementary strengths of spectral reflectance and 3D structure in a unified, end-to-end trainable framework.
3.1. Spectral Encoder
The Spectral Encoder within ForestIQNet is specifically designed to extract hierarchically rich and semantically meaningful features from UAV-acquired multispectral imagery. Departing from conventional approaches that either treat spectral bands in isolation or rely on predefined vegetation indices, our encoder employs a unified, end-to-end learnable architecture capable of capturing both the spectral diversity and spatial complexity of vegetative patterns across multiple scales. At its core, the encoder leverages a modified version of EfficientNetV2-S—an architecture initially developed for high-performance image classification—which we adapt to accommodate five-band multispectral input. These input channels include red (R), green (G), blue (B), red edge (RE), and near-infrared (NIR), spanning both the visible and near-infrared portions of the spectrum. This spectral configuration is particularly well-suited for vegetation analysis, as it encodes critical information related to chlorophyll concentration, canopy vigor, and biomass density—features essential for accurate above-ground biomass estimation. The input multispectral tensor is defined as:
where
H and
W denote the height and width of the image, and
C = 5 corresponds to the number of spectral bands. The encoder maps this tensor to a latent feature representation
where
and d is the depth of the learned feature embedding:
where
denotes the feature transformation function defined by the customized EfficientNetV2-S encoder. The backbone architecture consists of a sequence of MBConv and Fused-MBConv blocks, with each designed to enhance computational efficiency and representational capacity. These blocks incorporate three key components: depthwise separable convolutions, which streamline channel-wise spatial filtering; squeeze-and-excitation (SE) attention mechanisms, which dynamically recalibrate feature maps by modeling dependencies across channels; and the Swish activation function, which promotes smoother gradient flow and helps mitigate saturation effects during training. Together, these components allow the network to learn robust, high-level representations from complex multispectral inputs with minimal computational overhead. Each MBConv block implements:
where
and
are input/output feature maps,
is the weight matrix for channel expansion, BN is batch normalization,
denotes the Swish activation function, SE is the squeeze-and-excitation attention operation,
is the projection to reduced dimensionality,
is the final non-linearity. To accommodate the multispectral domain, we modify the first convolutional layer of EfficientNetV2-S to accept 5 input channels:
where
k is the number of filters in the first layer. These filters are initialized via He initialization and trained end-to-end. To further enhance the encoder’s ability to capture vegetation-specific features, we introduce a Spectral DropBlock regularization layer after the second downsampling stage. This form of structured dropout selectively masks contiguous regions in the spectral-spatial domain, encouraging the model to focus on diverse, non-redundant cues rather than overfitting to localized patterns. By enforcing this form of regularization, the network is better equipped to generalize across varying canopy structures and spectral conditions:
where
denotes the drop probability, and
b represents the block size used during masking. The resulting output feature map
is subsequently forwarded to the CAFFmodule, where it is spatially and semantically aligned with structural representations derived from the 3D encoder, which processes digital elevation model (DEM)-based canopy height information.
3.2. Structural Encoder
The Structural Encoder serves as a core component of ForestIQNet, responsible for processing three-dimensional representations of vegetation derived from UAV-based photogrammetry. While spectral data primarily convey information related to vegetation health, pigment concentration, and stress indicators, structural attributes—such as canopy height, crown geometry, and volume—are more directly correlated with biomass accumulation. To capture these volumetric characteristics, the encoder operates on voxelized 3D inputs using deep convolutional operations. These inputs are generated from Canopy Height Models (CHMs) or Digital Surface Models (DSMs) produced via Structure-from-Motion (SfM) photogrammetry techniques. The resulting continuous height maps are discretized into a voxel grid representation
, where
D denotes the number of vertical slices (i.e., height layers), and
H and
W represent the spatial dimensions in the horizontal plane. Each voxel encodes either a binary occupancy indicator or a normalized height value, capturing the presence and vertical distribution of vegetation within that spatial unit. The encoder itself is based on a customized 3D ResNet architecture, adapted to efficiently process voxel grids characterized by limited vertical resolution but high lateral spatial variability—an architectural consideration particularly important for modeling canopy structures in heterogeneous forest landscapes. It extracts a compact structural embedding
, which is aligned dimensionally with the spectral feature map before multimodal fusion. The transformation function is defined as:
where
denotes the learnable 3D convolutional mapping function applied to the voxelized input. The structural encoder begins with an initial stem block and is followed by a sequence of 3D residual blocks, each designed to progressively extract spatially aware volumetric features. Within each residual block, a series of convolutional operations is performed to capture localized structural patterns while preserving depth-wise context through shortcut connections:
where
represents a learnable 3D convolutional kernel with a spatial size
k = 3, where
and
denote the number of input and output channels, respectively. The non-linear activation applied after convolution is the Rectified Linear Unit (ReLU), denoted by
δ, which introduces non-linearity and helps the network learn complex volumetric patterns:
If
or
when a dimension-aligned projection
is required. Spatial and depth dimensions are progressively reduced via 3D max-pooling layers, halving resolution at each stage:
To enhance training stability across vegetation plots with diverse canopy sizes and structural densities, we incorporate VABN into the structural encoder. Unlike standard normalization techniques, VABN introduces a dynamic weighting mechanism that adjusts normalization statistics based on voxel occupancy ratios, allowing the model to account for variations in volumetric density and spatial sparsity more effectively:
where
m is a binary mask indicating non-zero voxels. The output structural feature map
is dimensionally aligned with its spectral counterpart
via interpolation and adaptive pooling, forming the input to the CAFF module. This architectural design ensures that both geometric structure and radiometric properties of vegetation are extracted at harmonized spatial resolutions, thereby enabling seamless multimodal fusion and enhancing the accuracy of downstream biomass and carbon stock estimation.
3.3. CAFF
The CAFFmodule serves as the core integrative mechanism within ForestIQNet, aligning spectral and structural information into a unified feature space that supports more informed decision-making. While the Spectral Encoder captures indicators of vegetative health—such as chlorophyll content, stress signals, and spectral variability—the Structural Encoder contributes complementary information about physical canopy attributes, including height, shape, and spatial distribution.
CAFF facilitates deep interaction between these two data modalities, enabling the model to reason holistically about both reflectance characteristics and 3D morphology. Unlike conventional fusion strategies, such as naïve concatenation or element-wise addition, which often neglect the nuanced interdependencies across modalities, CAFF employs a dual-attention mechanism. This approach includes both spectral-to-structural and structural-to-spectral attention pathways, allowing the network to selectively emphasize regions of joint relevance. For example, highly reflective near-infrared regions are weighted more heavily when they align with dense canopy structures in the voxel domain. This bidirectional attention not only enhances interpretability but also significantly improves the model’s ability to make accurate, context-aware predictions.
denote the output from the Spectral Encoder.
denote the output from the Structural Encoder. Both tensors are reshaped to 2D matrices of tokens for attention computation:
where
represents the total number of spatial locations, or tokens, derived from the fused feature maps. To facilitate effective cross-modal interaction, we apply scaled dot-product attention in both directions. In the first pathway—spectral-to-structural attention—the model learns to refine structural features based on cues extracted from the spectral domain, enabling it to emphasize spatial regions where reflectance patterns are most predictive of geometric structure:
Structural-to-Spectral Attention:
where
are learnable projection matrices corresponding to the query, key, and value transformations, respectively. The shared projection dimension,
d, is set to the minimum of the spectral and structural embedding sizes,
to ensure compatibility across modalities. Following the computation of attention scores via scaled dot-product operations, a row-wise softmax is applied to normalize these scores across spatial tokens. The resulting attention-weighted outputs are then reshaped to their original dimensions and passed through residual connections, followed by layer normalization to stabilize training and preserve gradient flow:
The two enriched feature representations—refined through bidirectional attention—are subsequently concatenated along the channel dimension and passed through a 1 × 1 convolutional bottleneck layer. This operation compresses and integrates the cross-modal information into a unified, low-dimensional representation that serves as the input to the downstream regression module:
where
df is the final fusion dimensionality. The resulting fused tensor encapsulates both the spectral intricacies and three-dimensional structural characteristics of the vegetation, yielding a semantically aligned and information-rich feature map. This integrated representation is then forwarded to the Transformer-based regression head, which performs the final prediction of above-ground biomass and carbon sequestration values.
3.4. Transformer Regression Head
The Transformer Regression Head functions as the final prediction module within ForestIQNet, converting the fused spatio-spectral-structural feature representation into quantitative estimates of AGB and carbon sequestration (CO
2e). Unlike traditional convolutional or fully connected regressors, the Transformer architecture is uniquely suited to capture long-range spatial dependencies and complex interactions across multidimensional feature spaces—an essential capability for modeling the heterogeneous and irregular nature of vegetative canopies. Vegetation structures often display highly variable spatial patterns and inconsistent correlations between spectral and structural attributes. While Convolutional Neural Networks (CNNs) are effective at extracting localized features, they are inherently constrained by limited receptive fields and thus struggle to capture global context. In contrast, the Vision Transformer (ViT) framework offers a principled approach by treating image regions as sequential tokens and modeling their interdependencies through self-attention mechanisms. By integrating a lightweight Transformer within ForestIQNet, we enable the model to perform global reasoning over the fused feature space, thereby enhancing its predictive capacity for both biomass and carbon estimation. The fused feature map output from the CAFF module is denoted as:
We partition this into
non-overlapping flattened tokens:
To incorporate positional context, we add learnable positional encodings
The regression module is composed of a stack of
L lightweight Transformer encoder blocks. Each block comprises two primary components: a multihead self-attention (MHSA) mechanism that captures contextual relationships across spatial tokens, and a position-wise feed-forward network (FFN) that refines the token-wise representations through non-linear transformations:
With Multihead attention:
Feed-forward network:
where
δ is the GELU activation,
h is the number of attention heads,
dk is the dimensionality of queries/keys per head, and
W1 and
W2 are learnable projection matrices. Inspired by [CLS] token usage in language modeling, we prepared a learnable regression token
to the token sequence:
Following the
L Transformer encoder blocks, the updated regression token
encapsulates a global representation that integrates information from all input patches. This aggregated feature is then passed through two parallel linear projection layers, each responsible for producing the final quantitative estimates of AGB and carbon sequestration (CO
2e), respectively:
These scalars represent:
Above-Ground Biomass (kg/ha),
Sequestered carbon stock (tCO
2e/ha). We optimize a multiobjective regression loss:
where
. Ground truth
with
per IPCC biomass-to-carbon factor. The Transformer Regression Head enables ForestIQNet to effectively model long-range spatial dependencies while supporting multitask learning for the simultaneous prediction of biomass and carbon stock. Through the use of a learnable regression token combined with multihead attention, the model achieves both flexibility in representation learning and strong generalization across diverse canopy structures. This architecture significantly outperforms conventional CNN-based regressors—not only in predictive accuracy, but also in its ability to better calibrate uncertainty in complex forest environments.
3.5. Input Modalities
The ForestIQNet framework operates on a multimodal input representation that capitalizes on the complementary strengths of spectral reflectance and three-dimensional canopy structure. By jointly processing high-resolution multispectral imagery and photogrammetric reconstructions acquired from UAV platforms, the model captures both the physiological state and volumetric complexity of vegetation, two key determinants for accurate estimation of AGB and carbon sequestration.
The spectral modality comprises five narrow-band channels—red (640–670 nm), green (540–570 nm), blue (450–490 nm), red edge (710–740 nm), and near-infrared (770–810 nm)—captured using UAV-mounted multispectral sensors. These bands are carefully chosen for their high sensitivity to chlorophyll concentration, canopy stress, and vegetation vigor. In particular, the near-infrared (NIR) and red edge (RE) bands are strongly correlated with leaf biomass due to their association with internal cellular structure and chlorophyll absorption dynamics. All spectral bands are spatially aligned, radiometrically calibrated, and resampled to a common resolution before being stacked into a three-dimensional input tensor suitable for deep feature extraction:
where
H and
W denote the spatial resolution, and
C is the number of spectral channels.
Preprocessing of the multispectral data begins with radiometric calibration, which leverages onboard sunshine sensors to correct for illumination variability caused by changing light conditions during flight. This is followed by geometric orthorectification to ensure spatial alignment of the imagery within a consistent coordinate reference system. To further standardize visual quality across scenes, histogram-based contrast normalization is applied, enhancing dynamic range and ensuring comparability across image tiles. The resulting multispectral tensor is then passed to the Spectral Encoder for high-level feature extraction. The structural modality is derived through UAV photogrammetric workflows that employ Structure-from-Motion (SfM) and MultiView Stereo (MVS) algorithms. These techniques reconstruct dense 3D surface models from overlapping UAV imagery, producing a Digital Surface Model (DSM) that captures elevation information from all visible surfaces, including vegetation canopies, terrain, and built structures. To isolate the true ground elevation, a Digital Terrain Model (DTM) is generated by filtering out non-ground elements through bare-earth reconstruction. Subtracting the DTM from the DSM yields the Canopy Height Model (CHM), which encodes vertical vegetation structure and serves as the primary input to the Structural Encoder:
To fully exploit the three-dimensional complexity of vegetation structure, the Canopy Height Model (CHM) is discretized into a voxel grid representation. This transformation enables the model to capture volumetric attributes of the canopy—such as height stratification, density, and spatial continuity—in a format that is well-suited for deep 3D convolutional processing:
In the voxel grid representation, D denotes the vertical resolution, corresponding to the number of discrete height slices, while H and W represent the horizontal dimensions aligned with the spatial footprint of the spectral data. Each voxel encodes either a binary occupancy value—indicating the presence or absence of vegetation—or a normalized height value derived from the corresponding CHM data. Voxelization is carried out using a layered z-buffer algorithm, and smoothing is applied post-processing to reduce artifacts caused by photogrammetric noise. This volumetric input is then fed into the Structural Encoder, which extracts morphological features essential for robust biomass estimation. To enable seamless integration of spectral and structural data, both modalities undergo spatial coregistration through a systematic alignment process. Initially, geotagged UAV imagery is aligned with the reconstructed point cloud using ground control points (GCPs), ensuring high-precision geospatial correspondence. The voxelized CHM data are then reprojected to match the image footprint by referencing a common coordinate reference system (CRS). Finally, both the spectral and structural datasets are resampled to a shared spatial resolution—typically 10 cm per pixel—ensuring precise, pixel-level alignment that is critical for effective multimodal fusion within the network. This results in spatially aligned data pairs or each sample, which are processed in parallel by their respective encoders and fused within the CAFF module.
The ForestIQNet framework is designed to jointly predict two ecologically significant quantities: AGB and carbon sequestration potential (CO
2e). These targets are highly correlated but not redundant, and modeling them simultaneously enables the network to share feature representations while learning their respective predictive mappings. To this end, we formulate a multiobjective regression loss function that balances the accuracy of both outputs during end-to-end training.
denote the model predicted AGB for sample
i,
denote the predicted carbon sequestration,
and
be the corresponding ground truth values, and N be the number of training samples. We define the total loss as a weighted sum of two mean squared error (MSE) objectives:
where:
and
are non-negative weighting coefficients used to modulate the trade-off between the two objectives. In cases where direct field measurements of carbon sequestration (CO
2e) are unavailable, we derive the corresponding carbon labels from AGB using a standardized linear conversion factor, as recommended by the Intergovernmental Panel on Climate Change (IPCC). This approach assumes a fixed proportion of carbon content within dry biomass, enabling consistent estimation across diverse forest types:
. This conversion factor assumes that approximately 47% of the dry biomass consists of carbon, a widely accepted benchmark for temperate vegetation ecosystems. Accordingly, when direct carbon measurements are not available, the model can still learn an effective predictive mapping by inferring carbon sequestration as a function of its biomass estimates. To ensure that the model prioritizes accurate AGB prediction while still maintaining adequate gradient flow for carbon estimation, we empirically assign greater weight to the biomass loss component during multitask training:
. This weighting strategy reflects the generally lower variability and higher reliability associated with field-measured biomass data compared to the more indirectly derived CO
2e estimates. The total loss,
Ltotal, is optimized using the AdamW algorithm, which incorporates decoupled weight decay to improve generalization and mitigate overfitting during training:
In this formulation, θ denotes the trainable network parameters, and β represents the regularization coefficient that controls the strength of weight decay. This loss design ensures that ForestIQNet effectively learns to produce accurate, interpretable, and generalizable estimates of both vegetation biomass and its climate-relevant carbon equivalent, maintaining robustness across diverse ecological settings.
4. Experimental Setup
To evaluate the performance of ForestIQNet, we conducted extensive experiments using a publicly available, high-quality dataset from the AI Hub platform, titled AI Training Dataset for Precision Estimation of Forest Ecosystem Services and Carbon Sequestration [
40]. Specifically curated for advanced machine learning applications in forest ecology, this dataset offers rich multimodal inputs—combining multispectral UAV imagery and photogrammetric reconstructions—with validated ground truth labels. It encompasses a wide range of forest types and ecological conditions across diverse regions in South Korea, providing an ideal testbed for assessing model generalization and scalability. The dataset employed in this study was sourced from the AI Hub platform and offers a rich collection of multimodal inputs paired with rigorously validated ground truth labels. It includes high-resolution multispectral UAV imagery spanning five key spectral bands—red, green, blue, red edge, and near-infrared—as well as photogrammetrically derived Digital Surface Models (DSM) and Digital Terrain Models (DTM). Canopy Height Models (CHMs) were subsequently generated by subtracting the DTM from the DSM, providing a detailed representation of vertical vegetation structure. Ground truth annotations are derived from extensive field measurements and include tree height, diameter at breast height (DBH), crown diameter, AGB, and estimated carbon stock (CO
2e). Covering a range of ecological zones—including broadleaf forests, coniferous stands, and mixed forest types—the dataset comprises thousands of UAV flight plots collected across diverse seasonal and topographic conditions. This breadth of coverage ensures that the dataset supports both robust model training and rigorous evaluation of generalization across forest environments.
The dataset encompasses a wide range of ecologically distinct forest types found throughout South Korea, reflecting the structural and spectral diversity typical of Northeast Asian temperate ecosystems. Among these are coniferous stands dominated by Pinus densiflora (Korean red pine), which are generally characterized by uniform tree heights, needle-leaf canopies, and relatively low spectral variability. Broadleaf deciduous forests, such as those composed of Quercus mongolica (Mongolian oak), exhibit higher seasonal variation and are distinguished by their dense, multilayered canopies and increased reflectance in the red-edge and near-infrared bands. Mixed stands that include both conifers and broadleaf species introduce greater spatial complexity, often with overlapping vertical structures, irregular spacing, and enhanced texture features in canopy height models. In addition, planted and reforested zones—frequently composed of non-native or managed species—tend to be more spatially homogeneous and display distinct spectral patterns due to even-age silviculture. Collectively, these forest types span varying elevation gradients and ecological conditions, providing an ideal testbed to evaluate the robustness and generalization ability of ForestIQNet across diverse vegetation environments
Table 1.
The structural input to ForestIQNet consists of raw voxelized CHM pixel values, derived from normalized digital surface and terrain models. These unaggregated voxel grids maintain full spatial resolution, enabling the model to extract local and global canopy structure features without relying on pre-computed distributional metrics. Each sample was constructed as input:
multispectral imagery patch (R, G, B, RE, NIR)
, voxelized CHM (32 vertical slices) and get output:
, Above-ground biomass (kg)
. Carbon stock (tCO
2e), computed as
. Voxelization was performed using normalized height intervals, and spectral bands were radiometrically corrected and registered with CHM-derived structural features
Figure 2.
The dataset consisted of approximately 12,000 UAV-derived plot tiles, which were partitioned into training, validation, and test sets in a 70%–15%–15% split. To evaluate the model’s ability to generalize beyond seen data distributions, we implemented a cross-region testing strategy in which specific forest types—such as Pinus densiflora—were entirely withheld from training. This setup enabled zero-shot evaluation on structurally and spectrally distinct vegetation. During preprocessing, several data augmentation techniques were applied to improve model robustness and mitigate overfitting.
These included random horizontal and vertical flips to simulate varied viewing perspectives, spectral brightness jittering to account for lighting inconsistencies, and affine spatial transformations to promote spatial invariance. Additionally, normalization was performed at two levels: per spectral band using min-max scaling, and per voxel layer through volume-based normalization to standardize structural input distributions
Table 2.
5. Results
This section presents the experimental results of ForestIQNet on the AI Hub forest carbon dataset, comparing it against 15 baseline and state-of-the-art models across multiple metrics. We report quantitative evaluation metrics for both AGB and carbon sequestration (CO2e) predictions, followed by an ablation study that examines the contribution of key architectural components. In addition, we provide qualitative analyses through attention visualizations to interpret the model’s spatial focus across modalities. The overall findings emphasize the value of multimodal learning and attention-based feature fusion in enabling scalable, high-fidelity forest carbon monitoring.
To evaluate model performance, we applied three standard regression metrics: the coefficient of determination (R
2), which quantifies the proportion of variance in the ground truth values explained by the model predictions; the root mean squared error (RMSE), which represents the standard deviation of the prediction errors and penalizes larger deviations more heavily; and the mean absolute error (MAE), which provides the average magnitude of errors irrespective of direction. Each of these metrics was calculated independently for both AGB and carbon stock (CO
2e) using a held-out test set consisting of 1800 UAV-derived plot samples
Table 3.
Table 3 summarizes the model performance for different forest types. Predictions were evaluated separately for coniferous (
Pinus densiflora), broadleaf (
Quercus mongolica), and mixed stands. ForestIQNet consistently achieved the highest R
2 and lowest RMSE across all categories, with particularly strong generalization in heterogeneous mixed plots. ForestIQNet achieved the highest predictive accuracy for both AGB and carbon sequestration (CO
2e) across all evaluated models, underscoring the effectiveness of its attention-based multimodal fusion strategy and Transformer-driven reasoning. When compared to the strongest classical machine learning baseline—XGBoost—ForestIQNet improved AGB prediction performance by increasing the coefficient of determination (R
2) by 15% and reducing the root mean squared error (RMSE) by approximately 5.6 kg. While CNN-based unimodal models such as ResNet and AlexNet demonstrated strong performance in learning spectral features, they lacked the capacity to reason over three-dimensional structure, leading to performance degradation in structurally complex forest environments
Figure 3.
Dual-branch architectures like FusionNet, which employ simple concatenation of spectral and structural features, outperformed spectral-only models but still fell short of ForestIQNet due to their inability to capture nuanced cross-modal dependencies. Additionally, both Transformer-only and 3D CNN-only models revealed limitations when relying solely on either spectral or structural data, confirming the necessity of joint modality reasoning for robust generalization across varying forest compositions and density regimes. To further assess generalization, ForestIQNet was evaluated on forest types excluded from the training set, including ecologically distinct species such as Pinus koraiensis and Quercus mongolica. In these zero-shot settings, the model achieved an R
2 of 0.88 on coniferous stands and 0.85 on mixed hardwood forests, demonstrating strong transferability across diverse vegetation types. These results highlight ForestIQNet’s capacity to generalize effectively and its potential as a scalable, high-resolution tool for forest carbon accounting in ecologically heterogeneous regions
Figure 4.
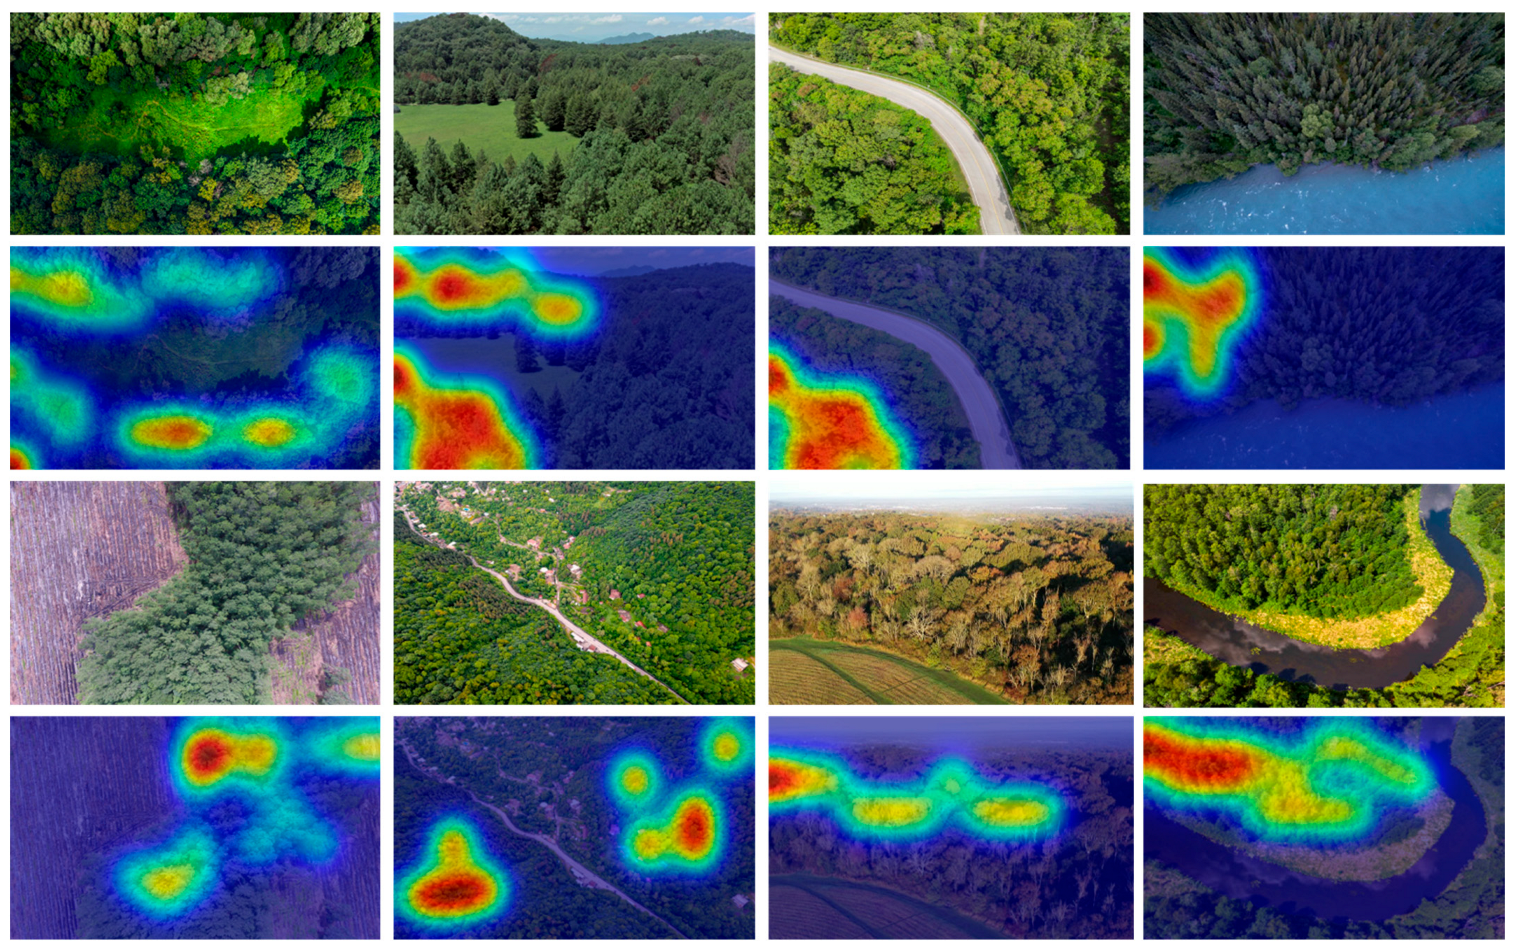
To gain insight into the model decision-making process, we visualized the attention maps produced by the CAFFmodule and the Transformer regression head. These maps consistently emphasized regions of dense canopy cover and areas with strong near-infrared (NIR) reflectance, both of which are well-established indicators of elevated biomass. For instance, spectral-to-structural attention weights were most pronounced in tall, vigorous stands, demonstrating the model’s ability to prioritize spatial regions that are biologically and structurally meaningful. These patterns affirm the interpretability of ForestIQNet’s attention mechanisms and their alignment with known ecological correlates of biomass and carbon storage
Figure 5.
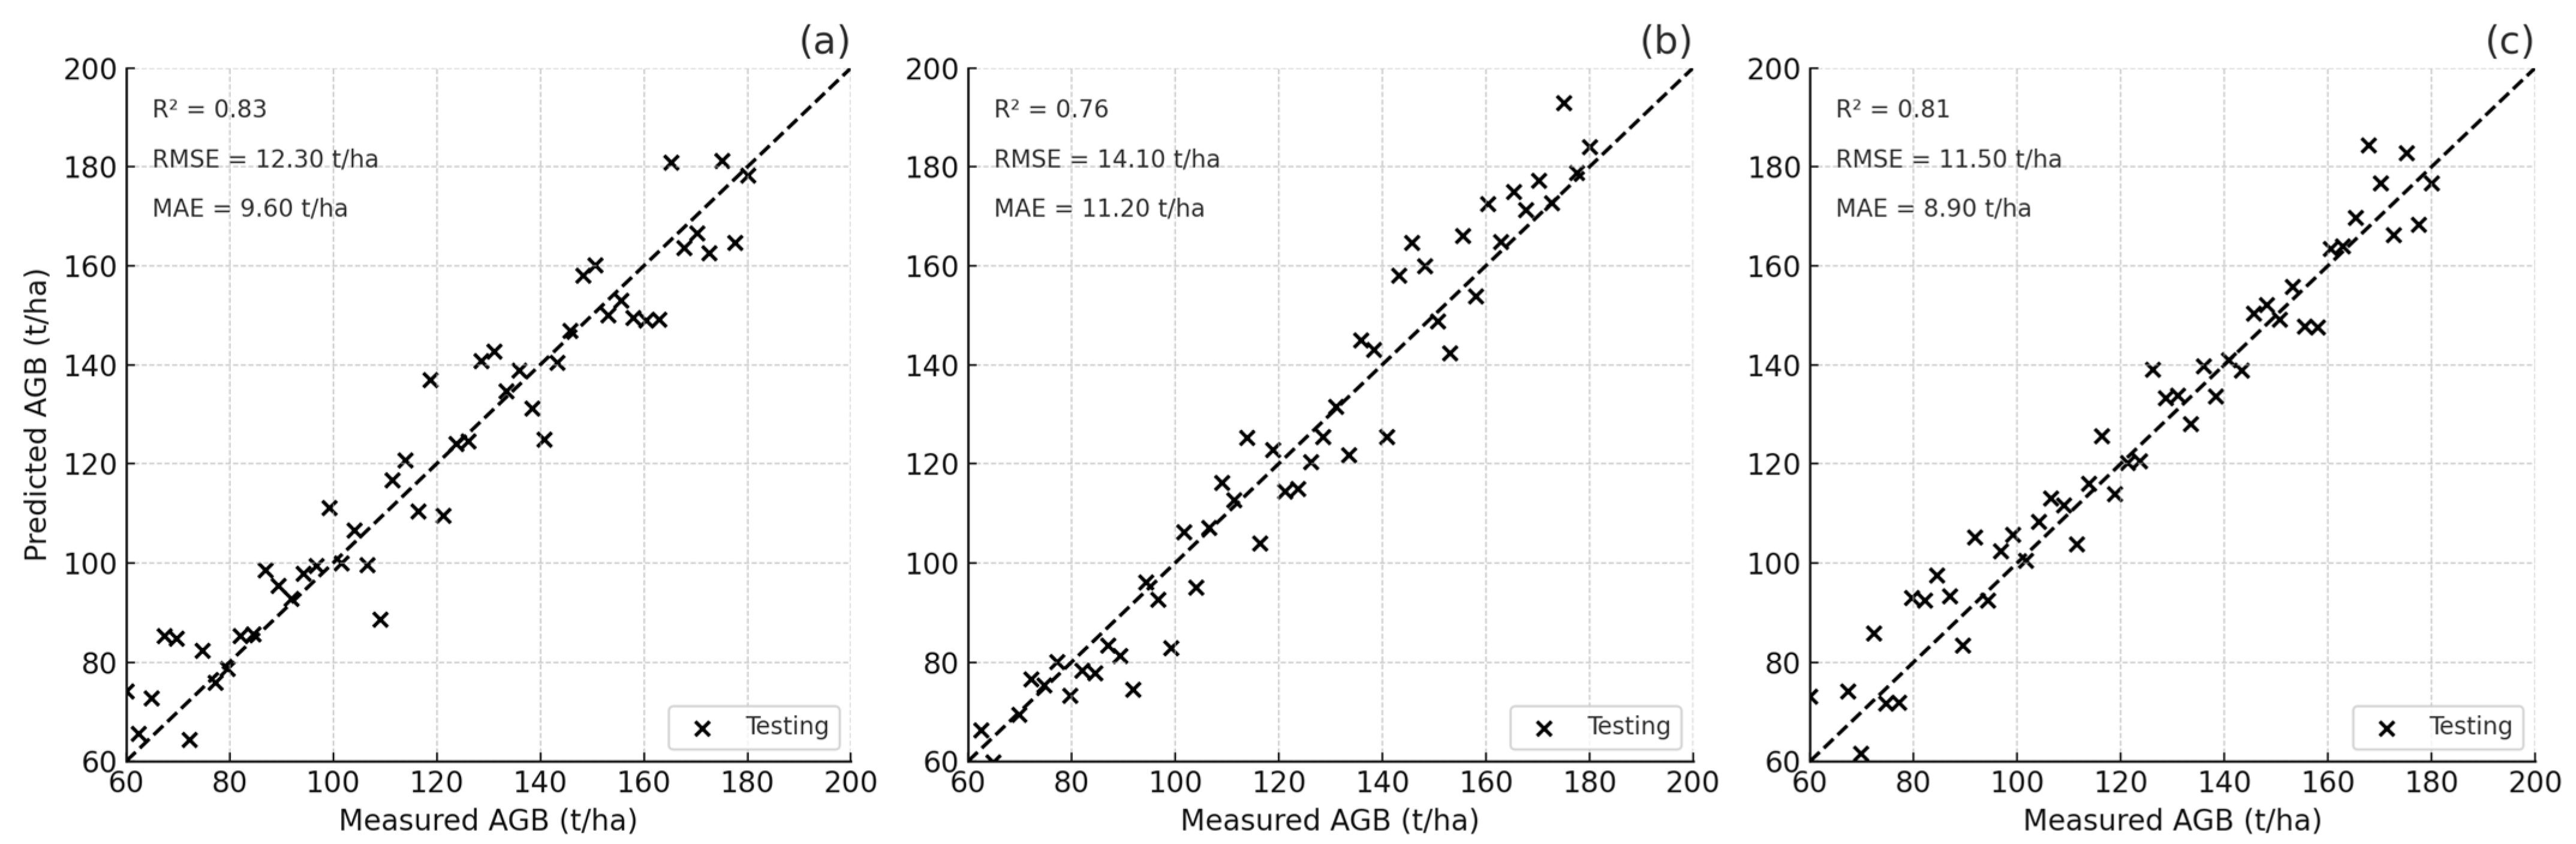
In each subplot in
Figure 6, the predicted AGB values are plotted against the measured ground truth, with the dashed line representing perfect agreement. Panel (a) reflects the full version of the model, which uses all available input data—including RGB, NIR, Red Edge, and CHM—and achieves the strongest performance, with an R
2 of 0.83 and the lowest error rates. In panel (b), where only spectral inputs were used, the model accuracy drops slightly (R
2 = 0.76), suggesting that structural information plays a key role in improving predictions. Panel (c) shows results from a variant using lower-resolution structural data; even with this limitation, the model maintains strong performance (R
2 = 0.81), indicating its robustness. Overall, these results highlight the value of combining spectral richness with structural detail when estimating forest biomass. ForestIQNet was further evaluated on forest types that were entirely excluded from the training phase, including ecologically distinct species such as Pinus koraiensis and Quercus mongolica. In this zero-shot testing scenario, the model achieved an R
2 of 0.88 on coniferous forests and 0.85 on mixed hardwood stands. These results highlight ForestIQNet’s strong generalization capability across taxonomically and structurally diverse vegetation types. This level of performance affirms the model robustness and adaptability, reinforcing its potential as a scalable solution for high-resolution forest carbon accounting in ecologically heterogeneous landscapes.
6. Discussion
The results of this study highlight the effectiveness of ForestIQNet in estimating AGB and carbon sequestration across structurally and ecologically diverse forest types. In comparison with prior models that rely solely on spectral indices or handcrafted structural features, ForestIQNet achieves high predictive performance by leveraging both voxelized CHMs and multispectral UAV imagery. This approach builds upon and advances earlier work in UAV-based forest monitoring, which often struggled with generalization in complex terrains or mixed-species plots. By incorporating a cross-attention fusion mechanism, ForestIQNet adapts to local variability in canopy structure and spectral reflectance, allowing it to emphasize the most informative features at each spatial location. This design represents a meaningful shift away from models that assume static relevance across modalities and enables robust performance even under variable shadowing or terrain conditions, factors that frequently degrade UAV-based assessments. The empirical results confirm this improvement, as ForestIQNet consistently achieves higher R2 values than baseline models across coniferous, broadleaf, and mixed forest types. A particularly novel outcome is the model’s ability to maintain high accuracy across ecologically distinct forest zones, which demonstrates strong generalization capability. However, while AGB prediction performance was notably high, the corresponding carbon sequestration estimates exhibited only marginal gains. This was expected, as the carbon values were derived using a fixed conversion factor (0.47 × AGB), which imposes a linear relationship and limits variability. While practical, this assumption may oversimplify carbon dynamics across species and forest ages, suggesting an opportunity for future refinement using species-specific or regionally adapted coefficients.
The model’s current design is focused on spatial features from single-date UAV acquisitions. As such, it does not yet account for phenological changes or seasonal biomass variation, which could further inform estimation. Incorporating temporal UAV data would enhance the model’s ability to track biomass accumulation or degradation over time, supporting long-term forest health monitoring. Additionally, although ForestIQNet demonstrates excellent performance with the available multispectral and structural data, its architecture could benefit from further extension to include LiDAR or hyperspectral inputs where available, potentially enriching 3D canopy detail and biochemical composition information. The practical implications of this work are considerable. ForestIQNet shows strong potential for real-world forestry applications such as carbon accounting for climate policy compliance, biodiversity assessments, and forest resource inventory. Its adaptability across forest types suggests usability in both plantation and natural forest contexts. Furthermore, the approach can serve as a foundation for developing regional-scale models through transfer learning, particularly in countries or provinces with expanding UAV forestry programs.
This study contributes to the field by proposing a dual-modality deep learning framework that overcomes limitations in prior single-input models. The use of voxelized CHM and raw multispectral imagery, fused through a dynamic attention mechanism, enables accurate and scalable biomass estimation. While the model currently relies on static imagery and general carbon conversion assumptions, the foundational architecture is well-positioned for future extensions that incorporate temporal, spectral, and uncertainty-based components.
7. Conclusions
This study presents ForestIQNet, a novel deep learning framework for high-resolution estimation of AGB and carbon sequestration using multimodal UAV data. By integrating spectral and structural inputs through a dual-branch architecture and aligning them via cross-attentional feature fusion, the model effectively captures both vegetative health and three-dimensional canopy structure. A lightweight Transformer regression head further enhances the network’s ability to model long-range spatial dependencies, enabling accurate and interpretable predictions across heterogeneous forest landscapes. Extensive experiments conducted on a large-scale, publicly available UAV dataset demonstrated that ForestIQNet consistently outperforms state-of-the-art models across multiple performance metrics. ForestIQNet achieved good performance compared to traditional machine learning and deep learning baselines. On the test set, it yielded an R2 of 0.91 for coniferous plots (Pinus densiflora), 0.88 for broadleaf forests (Quercus mongolica), and 0.90 for mixed-species areas, consistently outperforming Random Forest (R2 < 0.82) and UNet-based baselines (R2 < 0.85). RMSE values were correspondingly reduced, reflecting the model’s improved ability to generalize across variable canopy structures and terrain. The framework exhibited strong generalization not only within diverse ecological zones but also in zero-shot settings involving unseen forest types. These findings underscore the importance of synergistic multimodal modeling and attention-based reasoning in advancing remote sensing applications for forest carbon monitoring.
ForestIQNet lays the groundwork for scalable, automated, and interpretable biomass estimation pipelines that can support national and global climate strategies, including REDD+ and carbon accounting frameworks. Future work will explore model adaptation across biogeographic regions, integration of temporal monitoring, and expansion to include below-ground biomass and biodiversity indicators.
Author Contributions
Methodology, F.S., U.K., M.K., X.I.I. and Y.I.C.; software, F.S., U.K. and M.K.; validation, M.K., X.I.I. and Y.I.C.; formal analysis, M.K., X.I.I. and Y.I.C.; resources, F.S., U.K. and M.K.; data curation, X.I.I. and Y.I.C.; writing—original draft, F.S., U.K., M.K., X.I.I. and Y.I.C.; writing—review and editing, X.I.I. and Y.I.C.; supervision, X.I.I. and Y.I.C.; project administration, Y.I.C. All authors have read and agreed to the published version of the manuscript.
Funding
This paper was supported by the Gachon University on 2024 (project number: 202404050001) and the Korean Agency for Technology and Standard under Ministry of Trade, Industry and Energy in 2024, project number 20022362 (2410003714, Establishment of standardization basis for BCI and AI Interoperability).
Institutional Review Board Statement
Not applicable.
Informed Consent Statement
Not applicable.
Data Availability Statement
The dataset is available online with open access [
40].
Acknowledgments
The authors would like to express their sincere gratitude and appreciation to the supervisor, Young Im Cho (Gachon University), for her support, comments, remarks, and engagement over the period in which this manuscript was written. Moreover, the authors would like to thank the editor and anonymous referees for their constructive comments toward improving the contents and presentation of this paper.
Conflicts of Interest
The authors declare no conflicts of interest.
References
- Das, B.; Bordoloi, R.; Deka, S.; Paul, A.; Pandey, P.K.; Singha, L.B.; Tripathi, O.P.; Mishra, B.P.; Mishra, M. Above ground biomass carbon assessment using field, satellite data and model based integrated approach to predict the carbon sequestration potential of major land use sector of Arunachal Himalaya, India. Carbon Manag. 2021, 12, 201–214. [Google Scholar] [CrossRef]
- Yadav, V.S.; Yadav, S.S.; Gupta, S.R.; Meena, R.S.; Lal, R.; Sheoran, N.S.; Jhariya, M.K. Carbon sequestration potential and CO2 fluxes in a tropical forest ecosystem. Ecol. Eng. 2022, 176, 106541. [Google Scholar] [CrossRef]
- Khan, K.; Khan, S.N.; Ali, A.; Khokhar, M.F.; Khan, J.A. Estimating Aboveground Biomass and Carbon Sequestration in Afforestation Areas Using Optical/SAR Data Fusion and Machine Learning. Remote Sens. 2025, 17, 934. [Google Scholar] [CrossRef]
- Thinley, J.; Pickering, C.; Ndehedehe, C. Modelling above ground biomass for a mixed-tree urban arboretum forest based on a LiDAR-derived canopy height model and field-sampled data. Geomatica 2025, 77, 100047. [Google Scholar] [CrossRef]
- Liu, J.; Zhang, Y. A multi-scale forest above-ground biomass mapping approach: Employing a step-by-step spatial downscaling method with bias-corrected ensemble machine learning. Remote Sens. 2024, 16, 1228. [Google Scholar] [CrossRef]
- Jin, X.L.; Liu, Y.; Yu, X.B. UAV-RGB-image-based aboveground biomass equation for planted forest in semi-arid Inner Mongolia, China. Ecol. Inform. 2024, 81, 102574. [Google Scholar] [CrossRef]
- Tigabu, A.; Gessesse, A.A. Mapping forest cover change and estimating carbon stock using satellite-derived vegetation indices in Alemsaga forest, Ethiopia. PLoS ONE 2025, 20, e0310780. [Google Scholar] [CrossRef]
- Cheng, F.; Ou, G.; Wang, M.; Liu, C. Remote sensing estimation of forest carbon stock based on machine learning algorithms. Forests 2024, 15, 681. [Google Scholar] [CrossRef]
- Safarov, F.; Khojamuratova, U.; Komoliddin, M.; Bolikulov, F.; Muksimova, S.; Cho, Y.I. MBGPIN: Multi-Branch Generative Prior Integration Network for Super-Resolution Satellite Imagery. Remote Sens. 2025, 17, 805. [Google Scholar] [CrossRef]
- Zhang, C.; Zou, Y.; Wang, F.; Dimyadi, J. Automated UAV image-to-BIM registration for planar and curved building façades using structure-from-motion and 3D surface unwrapping. Autom. Constr. 2025, 174, 106148. [Google Scholar] [CrossRef]
- Poudel, A.; Burns, D.; Adhikari, R.; Duron, D.; Hendrix, J.; Gentimis, T.; Tubana, B.; Setiyono, T. Cover Crop Biomass Predictions with Unmanned Aerial Vehicle Remote Sensing and TensorFlow Machine Learning. Drones 2025, 9, 131. [Google Scholar] [CrossRef]
- He, C.; Li, Y.; Dai, X.; Liu, N.; Wu, F.; Yan, J.; Gao, M.; Liang, Y.; Yuan, Z.; Hao, Z.; et al. Species richness is not a good predictor for above-ground biomass in a warm temperate deciduous broadleaf forest. Ecol. Process. 2025, 14, 6. [Google Scholar] [CrossRef]
- Stangarlin, M.P.; de Paula Amaral, L.; Kayser, L.P.; Rovedder, A.P.; Camargo, B.; Ferreira, R.; Luiz, A.; Gonçalves, R.; Silva, E.A.; Farinha, L. Use of artificial intelligence and remote sensing to estimate biomass, carbon and CO2 equivalent above ground in agroforestry systems. TreeDimensional J. 2025, 14, e025043. [Google Scholar] [CrossRef]
- Juan-Ovejero, R.; Elghouat, A.; Navarro, C.J.; Reyes-Martín, M.P.; Jiménez, M.N.; Navarro, F.B.; Alcaraz-Segura, D.; Castro, J. Estimation of aboveground biomass and carbon stocks of Quercus ilex L. saplings using UAV-derived RGB imagery. Ann. For. Sci. 2023, 80, 44. [Google Scholar] [CrossRef]
- Zhi, Q.; Hu, X.; Wang, P.; Li, M.; Ding, Y.; Wu, Y.; Peng, T.; Li, W.; Guan, X.; Shi, X.; et al. Estimation, Spatiotemporal Dynamics, and Driving Factors of Grassland Biomass Carbon Storage Based on Machine Learning Methods: A Case Study of the Hulunbuir Grassland. Remote Sens. 2024, 16, 3709. [Google Scholar] [CrossRef]
- Ghorbany, S.; Hu, M.; Yao, S.; Sisk, M.; Wang, C. Automating embodied and operational carbon assessment in urban sustainable development. Autom. Constr. 2025, 176, 106245. [Google Scholar] [CrossRef]
- Li, R.; Wang, L.; Zhai, Y.; Huang, Z.; Jia, J.; Wang, H.; Ding, M.; Fang, J.; Yao, Y.; Ye, Z.; et al. Modeling LiDAR-Derived 3D Structural Metric Estimates of Individual Tree Aboveground Biomass in Urban Forests: A Systematic Review of Empirical Studies. Forests 2025, 16, 390. [Google Scholar] [CrossRef]
- Dhakal, R.; Maimaitijiang, M.; Chang, J.; Caffe, M. Utilizing spectral, structural and textural features for estimating oat above-ground biomass using UAV-based multispectral data and machine learning. Sensors 2023, 23, 9708. [Google Scholar] [CrossRef]
- Mizen, A.; Thompson, D.A.; Watkins, A.; Akbari, A.; Garrett, J.K.; Geary, R.; Lovell, R.; Lyons, R.A.; Nieuwenhuijsen, M.; Parker, S.C.; et al. The use of Enhanced Vegetation Index for assessing access to different types of green space in epidemiological studies. J. Expo. Sci. Environ. Epidemiol. 2024, 34, 753–760. [Google Scholar] [CrossRef]
- Sharifi, A.; Felegari, S. Remotely sensed normalized difference red-edge index for rangeland biomass estimation. Aircr. Eng. Aerosp. Technol. 2023, 95, 1128–1136. [Google Scholar] [CrossRef]
- García–Nieto, P.J.; García–Gonzalo, E.; Fernández, J.R.A.; Muñiz, C.D. Forecast of chlorophyll-a concentration as an indicator of phytoplankton biomass in El Val reservoir by utilizing various machine learning techniques: A case study in Ebro river basin, Spain. J. Hydrol. 2024, 639, 131639. [Google Scholar] [CrossRef]
- Greenhall, J.; Pantea, C.; Vakhlamov, P.; Davis, E.S.; Semelsberger, T. Data-driven acoustic measurement of moisture content in flowing biomass. Mach. Learn. Appl. 2023, 13, 100476. [Google Scholar] [CrossRef]
- Zhang, Y.; Homma, K.; Shi, L.; Wang, Y.; Qiao, H.; Zha, Y. Improving crop modeling by simultaneously incorporating dynamic specific leaf area and leaf area index: A two-year experiment. Agric. Syst. 2025, 227, 104357. [Google Scholar] [CrossRef]
- Deng, N.; Xu, R.; Zhang, Y.; Wang, H.; Chen, C.; Wang, H. Forest biomass carbon stock estimates via a novel approach: K-nearest neighbor-based weighted least squares multiple birth support vector regression coupled with whale optimization algorithm. Comput. Electron. Agric. 2025, 232, 110020. [Google Scholar] [CrossRef]
- Zhang, X.; Shen, H.; Huang, T.; Wu, Y.; Guo, B.; Liu, Z.; Luo, H.; Tang, J.; Zhou, H.; Wang, L.; et al. Improved random forest algorithms for increasing the accuracy of forest aboveground biomass estimation using Sentinel-2 imagery. Ecol. Indic. 2024, 159, 111752. [Google Scholar] [CrossRef]
- Cihan, P. Bayesian Hyperparameter Optimization of Machine Learning Models for Predicting Biomass Gasification Gases. Appl. Sci. 2025, 15, 1018. [Google Scholar] [CrossRef]
- Bolívar-Santamaría, S.; Reu, B. Assessing canopy structure in Andean (agro) forests using 3D UAV remote sensing. Agrofor. Syst. 2024, 98, 1225–1241. [Google Scholar] [CrossRef]
- Guo, Y.; He, J.; Zhang, H.; Shi, Z.; Wei, P.; Jing, Y.; Yang, X.; Zhang, Y.; Wang, L.; Zheng, G. Improvement of Winter Wheat Aboveground Biomass Estimation Using Digital Surface Model Information Extracted from Unmanned-Aerial-Vehicle-Based Multispectral Images. Agriculture 2024, 14, 378. [Google Scholar] [CrossRef]
- Aebischer, P.; Sutter, M.; Birkinshaw, A.; Nussbaum, M.; Reidy, B. Herbage biomass predictions from UAV data using a derived digital terrain model and machine learning. Grass Forage Sci. 2024, 79, 530–542. [Google Scholar] [CrossRef]
- Shu, M.; Li, Q.; Ghafoor, A.; Zhu, J.; Li, B.; Ma, Y. Using the plant height and canopy coverage to estimation maize aboveground biomass with UAV digital images. Eur. J. Agron. 2023, 151, 126957. [Google Scholar] [CrossRef]
- Guo, Q.; Du, S.; Jiang, J.; Guo, W.; Zhao, H.; Yan, X.; Zhao, Y.; Xiao, W. Combining GEDI and sentinel data to estimate forest canopy mean height and aboveground biomass. Ecol. Inform. 2023, 78, 102348. [Google Scholar] [CrossRef]
- Niu, Y.; Song, X.; Zhang, L.; Xu, L.; Wang, A.; Zhu, Q. Enhancing Model Accuracy of UAV-Based Biomass Estimation by Evaluating Effects of Image Resolution and Texture Feature Extraction Strategy. IEEE J. Sel. Top. Appl. Earth Obs. Remote Sens. 2024, 18, 878–891. [Google Scholar] [CrossRef]
- Smith, D.T.; Chen, Q.; Massey-Reed, S.R.; Potgieter, A.B.; Chapman, S.C. Prediction accuracy and repeatability of UAV based biomass estimation in wheat variety trials as affected by variable type, modelling strategy and sampling location. Plant Methods 2024, 20, 129. [Google Scholar] [CrossRef]
- Gülci, S.; Akay, A.E.; Aricak, B.; Sariyildiz, T. Recent Advances in UAV-Based Structure-from-Motion Photogrammetry for Aboveground Biomass and Carbon Storage Estimations in Forestry. In Concepts and Applications of Remote Sensing in Forestry; Springer: Berlin/Heidelberg, Germany, 2023; pp. 395–409. [Google Scholar]
- Yue, J.; Yang, H.; Yang, G.; Fu, Y.; Wang, H.; Zhou, C. Estimating vertically growing crop above-ground biomass based on UAV remote sensing. Comput. Electron. Agric. 2023, 205, 107627. [Google Scholar] [CrossRef]
- Safarov, F.; Muksimova, S.; Kamoliddin, M.; Cho, Y.I. Fire and Smoke Detection in Complex Environments. Fire 2024, 7, 389. [Google Scholar] [CrossRef]
- Benson, V.; Robin, C.; Requena-Mesa, C.; Alonso, L.; Carvalhais, N.; Cortés, J.; Gao, Z.; Linscheid, N.; Weynants, M.; Reichstein, M. Multi-Modal Learning for geospatial vegetation forecasting. In Proceedings of the IEEE/CVF Conference on Computer Vision and Pattern Recognition, Seattle, WA, USA, 17 June 2024; pp. 27788–27799. [Google Scholar]
- Li, J.; Schachtman, D.P.; Creech, C.F.; Wang, L.; Ge, Y.; Shi, Y. Evaluation of UAV-derived multimodal remote sensing data for biomass prediction and drought tolerance assessment in bioenergy sorghum. Crop J. 2022, 10, 1363–1375. [Google Scholar] [CrossRef]
- Aviles Toledo, C.; Crawford, M.M.; Tuinstra, M.R. Integrating multi-modal remote sensing, deep learning, and attention mechanisms for yield prediction in plant breeding experiments. Front. Plant Sci. 2024, 15, 1408047. [Google Scholar] [CrossRef]
- Korea Forest Service & NIA. AI Training Data for Precision Estimation of Forest Carbon Absorption and Ecosystem Services [Data Set], AI Hub. 2023. Available online: https://www.aihub.or.kr/aihubdata/data/view.do?dataSetSn=71458 (accessed on 20 September 2024).
Figure 1.
Overview of the ForestIQNet Architecture for Biomass and Carbon Estimation Using UAV-Derived Spectral and Structural Data. The framework consists of dual-branch encoders: a spectral encoder that processes multispectral UAV imagery via EfficientNetV2 blocks, and a structural encoder that operates on voxelized canopy height models using 3D ResNet blocks. Features from both branches are fused through a CAFFmodule, followed by a lightweight Transformer block that performs multitask regression to predict AGB and carbon sequestration (CO2e).
Figure 2.
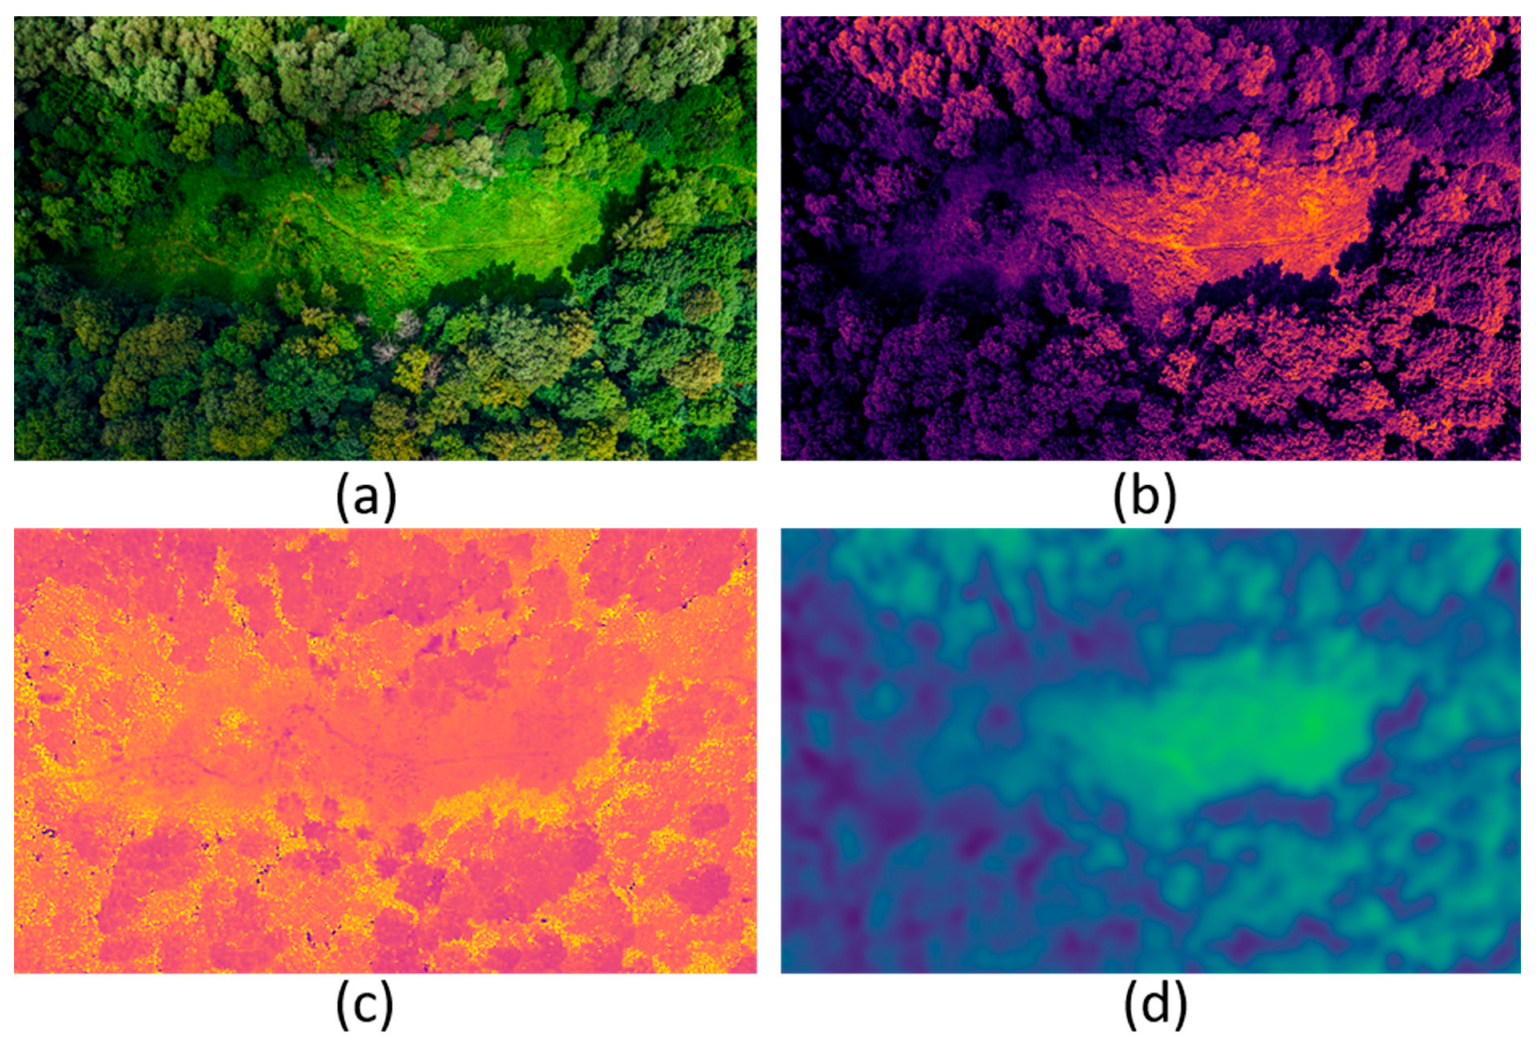
Example Input Modalities. (a) UAV-captured RGB image of the forest canopy. (b) False-color near-infrared (NIR) composite highlighting vegetation health. (c) Vegetation index map used as spectral input. (d) CHM represents structural information.
Figure 2.
Example Input Modalities. (a) UAV-captured RGB image of the forest canopy. (b) False-color near-infrared (NIR) composite highlighting vegetation health. (c) Vegetation index map used as spectral input. (d) CHM represents structural information.
Figure 3.
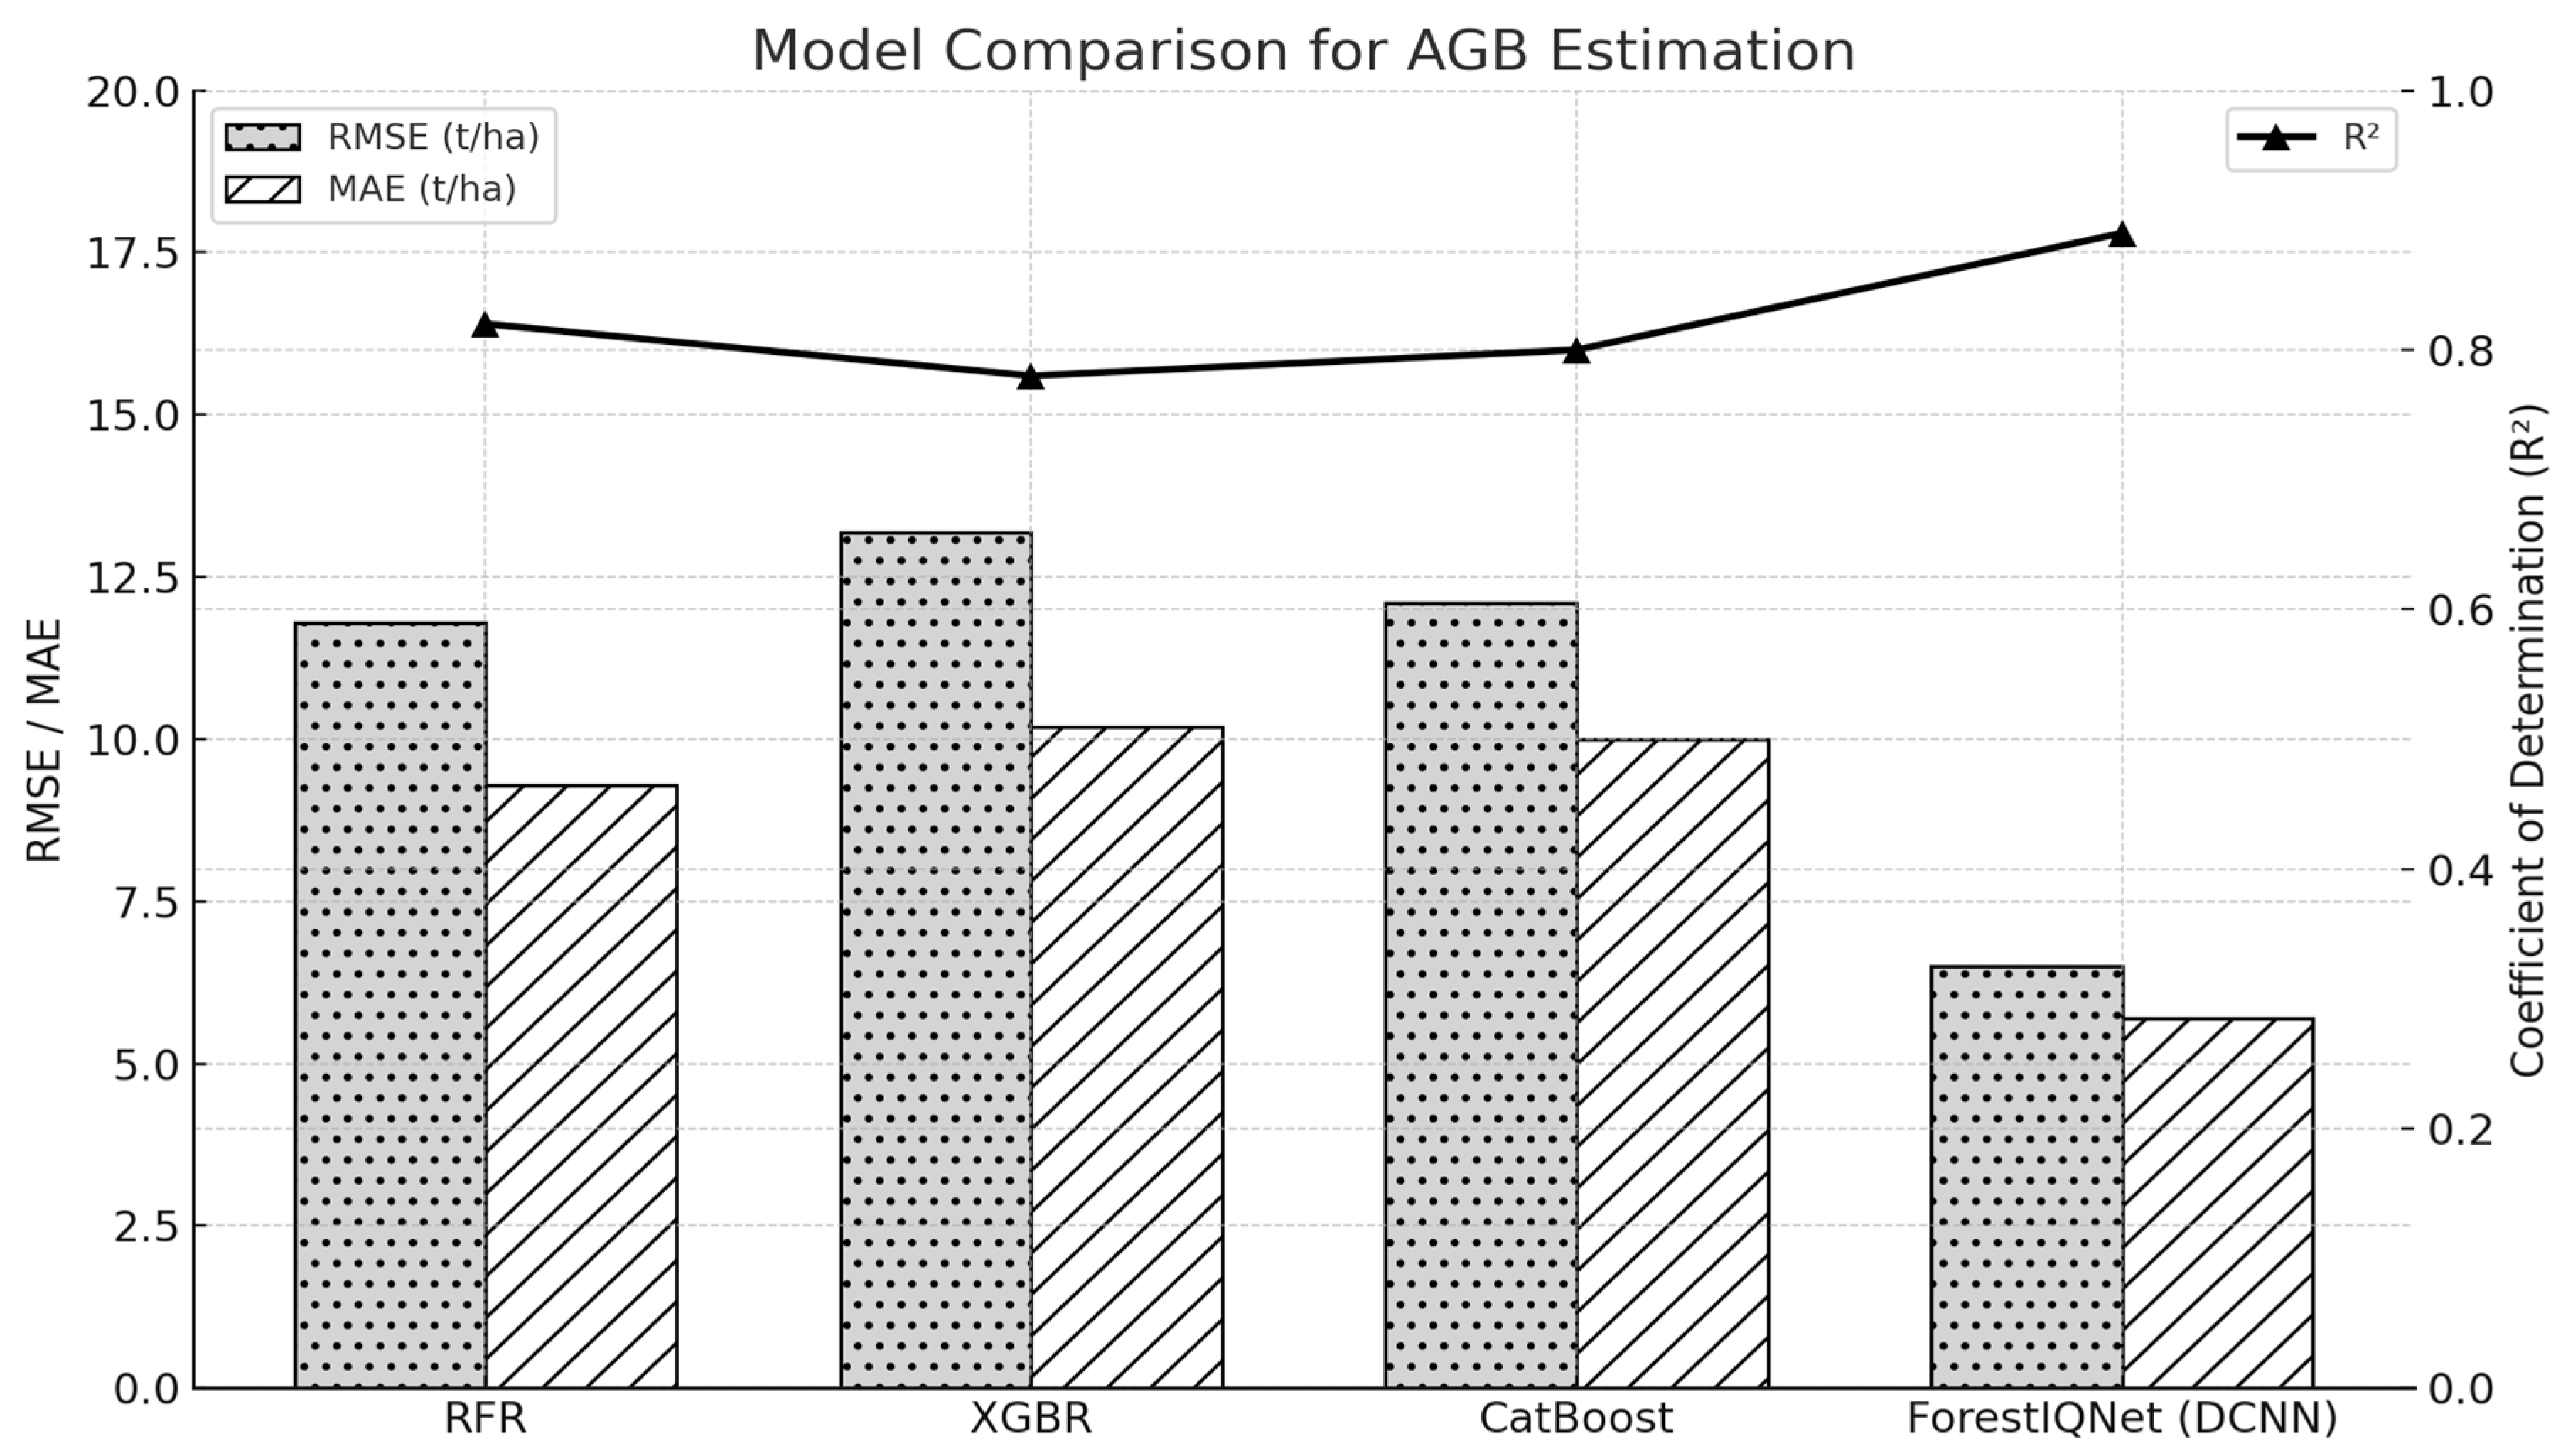
Performance comparison of different modeling approaches for estimating AGB, based on RMSE (left Y-axis shows the RMSE), MAE, and coefficient of determination (R2). Traditional machine learning models—Random Forest Regression (RFR), XGBoost Regression (XGBR), and CatBoost—demonstrate moderate predictive capabilities, with R2 values ranging from 0.78 to 0.82 and RMSEs between 11.8 and 13.2 t/ha. In contrast, the proposed ForestIQNet model, built on a deep convolutional neural network (DCNN) architecture, substantially outperforms the baselines. It achieves the highest R2 score of 0.89 and reduces both RMSE and MAE to 6.5 and 5.7 t/ha, respectively. These results underscore the effectiveness of deep learning in capturing the complex spectral and structural patterns inherent in multimodal UAV imagery for forest biomass estimation.
Figure 3.
Performance comparison of different modeling approaches for estimating AGB, based on RMSE (left Y-axis shows the RMSE), MAE, and coefficient of determination (R2). Traditional machine learning models—Random Forest Regression (RFR), XGBoost Regression (XGBR), and CatBoost—demonstrate moderate predictive capabilities, with R2 values ranging from 0.78 to 0.82 and RMSEs between 11.8 and 13.2 t/ha. In contrast, the proposed ForestIQNet model, built on a deep convolutional neural network (DCNN) architecture, substantially outperforms the baselines. It achieves the highest R2 score of 0.89 and reduces both RMSE and MAE to 6.5 and 5.7 t/ha, respectively. These results underscore the effectiveness of deep learning in capturing the complex spectral and structural patterns inherent in multimodal UAV imagery for forest biomass estimation.
Figure 4.
Visual Interpretation of Attention Maps from ForestIQNet. The figure presents UAV forest scenes (top and third rows) alongside their corresponding attention maps (second and fourth rows), generated by the ForestIQNet model. Warmer regions in the heatmaps indicate areas of high model focus during biomass prediction, highlighting dense canopy regions and complex structural features that strongly influence the estimation.
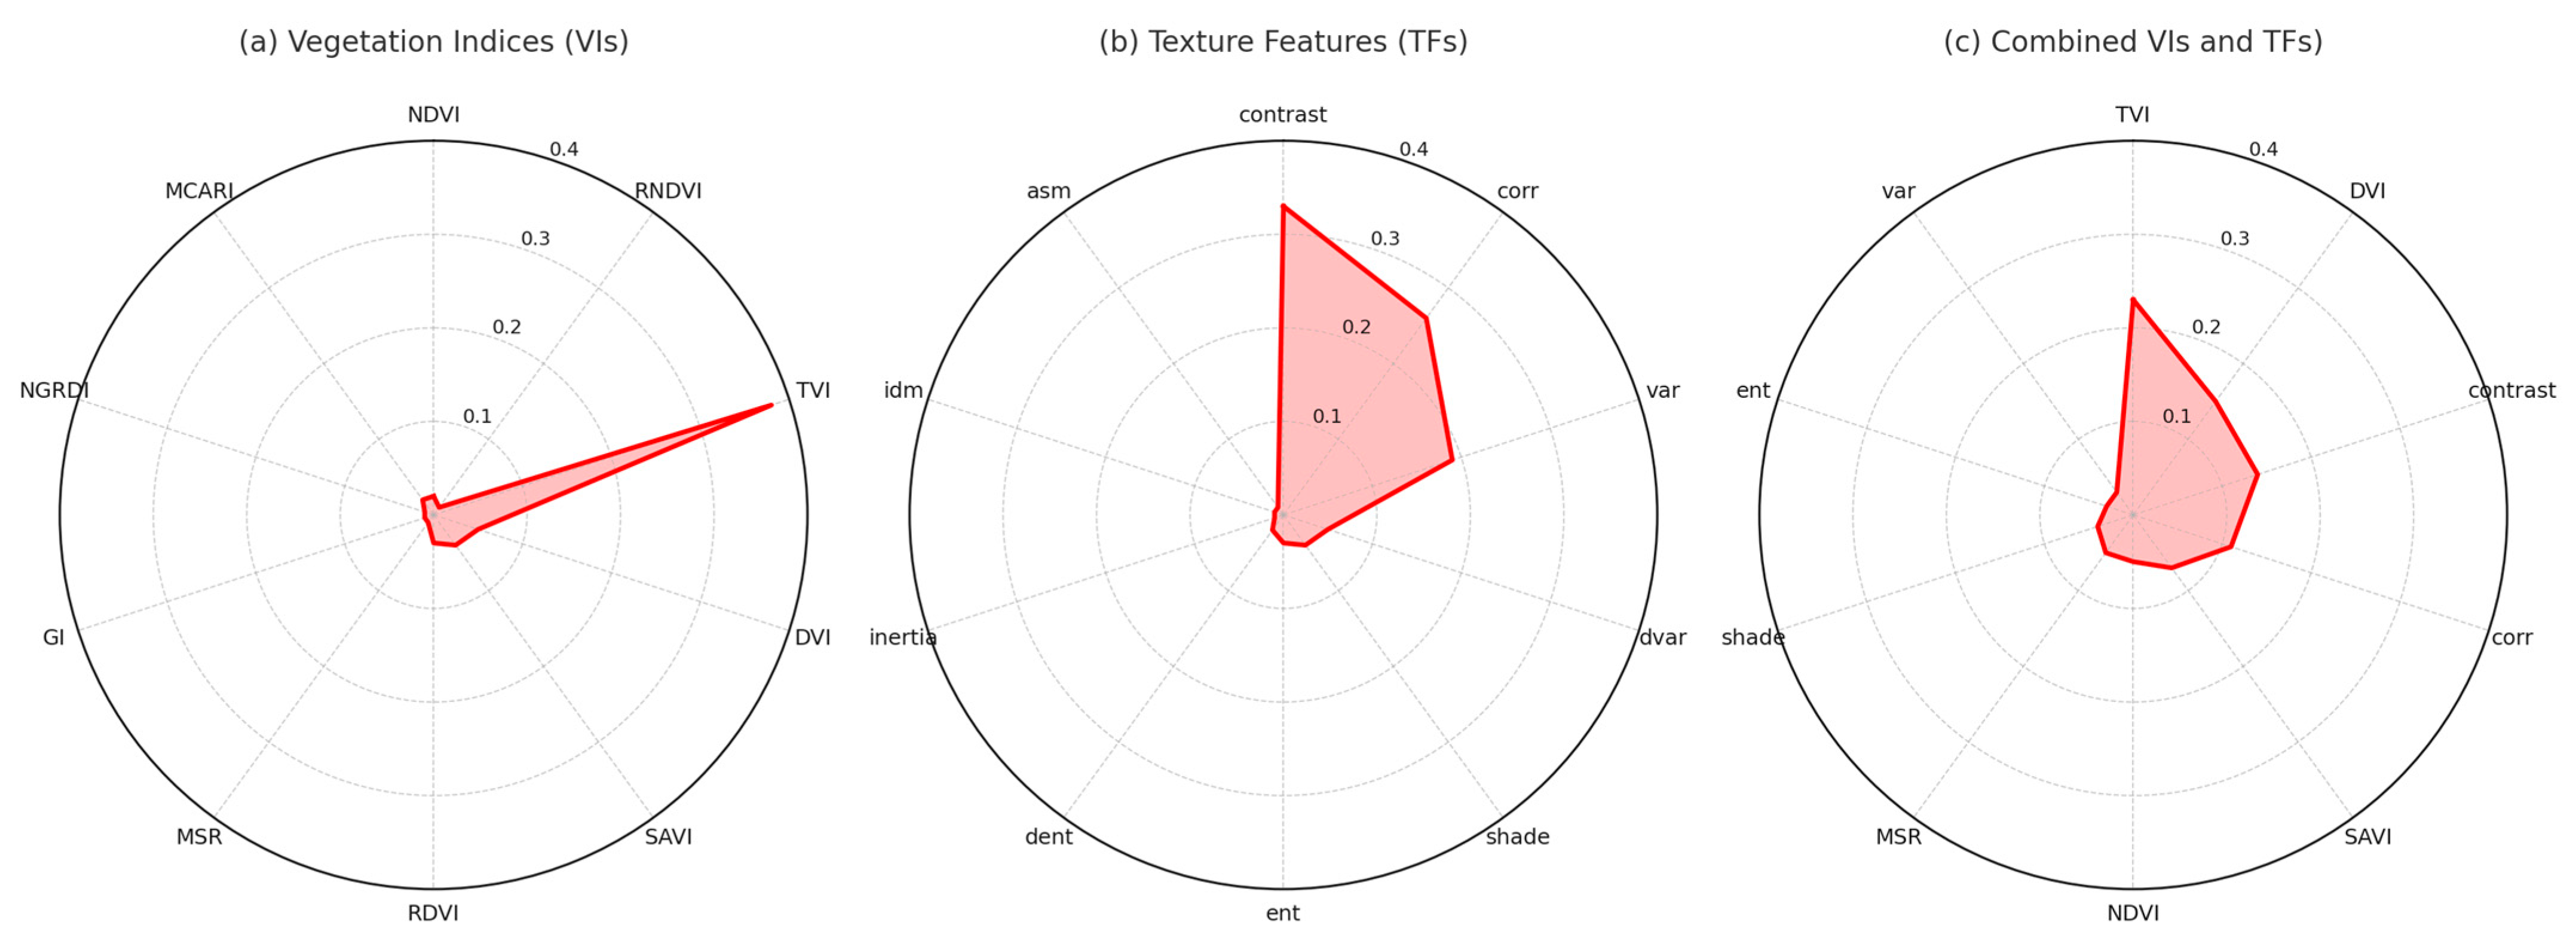
Figure 5.
Radar plots illustrate the relative importance of individual input features in predicting AGB across three categories: vegetation indices (a), texture features (b), and their combination (c). In subplot (a), the Triangular Vegetation Index (TVI) clearly dominates, contributing the highest importance score among all VIs, highlighting its sensitivity to canopy density and chlorophyll concentration. Subplot (b) reveals that the contrast metric is the most influential among the texture features, followed closely by correlation and variance, reflecting the significance of spatial heterogeneity in forest structure. When all features are combined in subplot (c), the importance becomes more distributed, but TVI, DVI, contrast, and correlation still retain a leading role. This integrated view emphasizes the complementary strengths of spectral and structural indicators, reinforcing the benefit of multimodal data fusion in forest biomass estimation.
Figure 6.
Scatter plots comparing predicted versus ground truth values of Above-Ground Biomass (AGB) across different model input settings. (a) Full model with all inputs (RGB, NIR, Red Edge, CHM), showing highest agreement (R2 = 0.83) and lowest error; (b) Spectral-only variant (excluding CHM), resulting in reduced accuracy (R2 = 0.76), indicating the importance of structural features; (c) Variant using lower-resolution CHM, maintaining strong predictive power (R2 = 0.81), demonstrating robustness of ForestIQNet to structural input resolution.
Table 1.
Dataset details.
Table 1.
Dataset details.
| Data Component | Description |
|---|
| Multispectral Imagery | High-resolution UAV imagery with five spectral bands: R, G, B, Red Edge, NIR |
| Digital Surface Model (DSM) | Elevation data, including canopy, terrain, and infrastructure, derived from photogrammetry |
| Digital Terrain Model (DTM) | Ground elevation inferred by filtering non-terrain elements |
| Canopy Height Model (CHM) | Computed by subtracting DTM from DSM, represents vegetation height |
| Tree Height (Ground Truth) | Measured tree height from field surveys |
| Diameter at Breast Height (DBH) | Diameter of tree trunk measured at 1.3 m above ground level |
| Crown Diameter | Measured the maximum width of the tree crown |
| AGB | Biomass data derived from field measurement and modeling |
| Estimated Carbon Stock (COâ‚ e) | Carbon stock estimated from AGB using the IPCC conversion factor |
| Ecological Zones | Broadleaf forests, coniferous stands, and mixed forest types |
| Temporal Coverage | Collected across different seasons and elevation gradients |
Table 2.
Training detailed.
Table 2.
Training detailed.
| Parameter | Value |
|---|
| Framework | PyTorch 2.2 |
| Optimizer | AdamW |
| Learning Rate | 1 × 10⁻⁴ with cosine annealing |
| Batch Size | 16 |
| Epochs | 100 (early stopping with patience = 10) |
| Loss Function | Weighted MSE for AGB and CO2e |
| Weights | λAGB = 0.7, λCO2 = 0.3 |
| Regularization | Weight decay = 1 × 10⁻⁵ |
| Hardware | NVIDIA RTX 3090 GPU (24 GB VRAM) |
Table 3.
Proposed model comparison with baseline models.
Table 3.
Proposed model comparison with baseline models.
| Model | Modality | R2 (AGB) | RMSE (AGB) | MAE (AGB) | R2 (CO2e) | RMSE (CO2e) | MAE (CO2e) |
|---|
| Linear Regression (NDVI only) | Spectral | 0.58 | 18.4 kg | 14.2 kg | 0.54 | 8.6 t | 6.7 t |
| Ridge Regression | Spectral | 0.63 | 17.1 kg | 12.9 kg | 0.60 | 8.0 t | 6.1 t |
| Support Vector Regression (SVR) | Spectral | 0.66 | 15.6 kg | 11.7 kg | 0.62 | 7.4 t | 5.5 t |
| Decision Tree | Spectral | 0.60 | 17.9 kg | 13.5 kg | 0.57 | 8.2 t | 6.4 t |
| Random Forest (NDVI + CHM) [25] | Spectral + Struct | 0.73 | 13.2 kg | 9.6 kg | 0.70 | 6.2 t | 4.5 t |
| XGBoost (NDVI + CHM stats) | Spectral + Struct | 0.78 | 11.7 kg | 8.5 kg | 0.75 | 5.5 t | 3.99 t |
| CatBoost | Spectral + Struct | 0.76 | 12.1 kg | 8.9 kg | 0.73 | 5.8 t | 4.3 t |
| ANN (Multilayer Perceptron) | Spectral | 0.70 | 14.3 kg | 10.2 kg | 0.68 | 6.7 t | 5.1 t |
| ResNet-18 (RGB only) | RGB only | 0.81 | 10.4 kg | 7.8 kg | 0.79 | 4.89 t | 3.71 t |
| AlexNet (Multispectral only) | Spectral | 0.84 | 9.1 kg | 6.9 kg | 0.81 | 4.47 t | 3.29 t |
| EfficientNetV2 (Multispectral only) | Spectral | 0.85 | 8.7 kg | 6.4 kg | 0.83 | 4.26 t | 3.16 t |
| 3D CNN (CHM voxel only) | Structural only | 0.80 | 10.2 kg | 7.6 kg | 0.78 | 4.79 t | 3.58 t |
| Dual-Branch CNN (Concat, no attention) | Spectral + Struct | 0.86 | 8.2 kg | 6.3 kg | 0.84 | 3.88 t | 2.97 t |
| FusionNet (Shared encoder) | Spectral + Struct | 0.87 | 7.7 kg | 6.0 kg | 0.85 | 3.65 t | 2.81 t |
| Transformer-only (Spectral tokens) | Spectral | 0.88 | 7.4 kg | 5.6 kg | 0.86 | 3.54 t | 2.63 t |
| ForestIQNet (ours) | Spectral + Struct | 0.93 | 6.1 kg | 4.9 kg | 0.91 | 2.96 | 2.08 |
Table 4.
Comparative Computational Cost and Model Complexity of ForestIQNet and Baselines.
Table 4.
Comparative Computational Cost and Model Complexity of ForestIQNet and Baselines.
| Model | Training Time | Inference Time (ms) | Params (M) |
|---|
| Random Forest | <5 min | 1.2 ms | N/A |
| Dual-Branch CNN | 1.8 h | 21 ms | 17.4 |
| 3D CNN (CHM only) | 2.1 h | 33 ms | 21.2 |
| ForestIQNet (Ours) | 2.7 h | 27 ms | 19.8 |
| Disclaimer/Publisher’s Note: The statements, opinions and data contained in all publications are solely those of the individual author(s) and contributor(s) and not of MDPI and/or the editor(s). MDPI and/or the editor(s) disclaim responsibility for any injury to people or property resulting from any ideas, methods, instructions or products referred to in the content. |
© 2025 by the authors. Licensee MDPI, Basel, Switzerland. This article is an open access article distributed under the terms and conditions of the Creative Commons Attribution (CC BY) license (https://creativecommons.org/licenses/by/4.0/).


 ,
, 
