Article

Flight Parameters for Spray Deposition Efficiency of Unmanned Aerial Application Systems (UAASs)

by
Thiago Caputti
1,
Luan Pereira de Oliveira
2,
Camila Rodrigues
1,
Paulo Cremonez
3,
Wheeler Foshee
1,
Alvin M. Simmons
4 and
Andre Luiz Biscaia Ribeiro da Silva
1,*
1
Department of Horticulture, Auburn University, 101 Funchess Hall, Auburn, AL 36849, USA
2
Department of Horticulture, University of Georgia, Tifton, GA 31793, USA
3
Department of Entomology and Plant Pathology, Auburn University, 301 Funchess Hall, Auburn, AL 36849, USA
4
U.S. Vegetable Laboratory, USDA-ARS, Charleston, SC 29414, USA
*
Author to whom correspondence should be addressed.
Drones 2025, 9(7), 461; https://doi.org/10.3390/drones9070461
Submission received: 28 April 2025 / Revised: 9 June 2025 / Accepted: 23 June 2025 / Published: 27 June 2025

Abstract

The use of unmanned aerial application systems (UAASs) for precision pesticide applications has increased alongside the demand for sustainable agricultural practices. However, limited studies have standardized the necessary flight parameters ensuring the optimal use of UAASs in specialty crops (e.g., fruits and vegetables). Thus, the objective of this study was to evaluate the effects of flight speed, droplet size, and application volume on the spray deposition of UAASs, creating guidelines to facilitate their use in specialty crops. Field experiments were conducted in a three-factorial experimental design of three flight speeds (i.e., 4, 7, and 10 m/s), three droplet sizes (i.e., 150, 250, and 350 µm), and two application volumes (i.e., 18.75 and 28.10 L/ha). Spraying droplet parameters (i.e., coverage, droplet density, and droplet spectra, and application uniformity), measured through the effective swath width, were recorded to assess spray deposition efficiency. Flight speed, droplet size, and application volume significantly influenced spray deposition. Treatments with slower flight speeds (4 m/s) and higher application volumes (28.10 L/ha) increased spray coverage, while droplet density was maximized at 4 m/s with the finest droplet size (150 µm), which are desirable characteristics for pesticide applications in specialty crops. Ultimately, the effective swath width and spray uniformity were maximized at a flight speed of 7.93 m/s with a droplet size of 350 µm. These results help optimize UAAS-based pesticide application, increasing efficiency and reducing environmental impact; however, understanding pesticide translocation dynamics (i.e., systemic or contact) on plants is key for growers to determine flight parameters.

1. Introduction

Pesticide application in agriculture has historically relied on ground-based equipment, primarily through broadcast applications [1,2]; however, conventional ground sprayers face several limitations, such as difficulties in maneuvering across uneven terrain and mechanical damage to crops [3,4]. To meet rising demands for field productivity, agricultural machinery has become progressively larger, increasing both sprayer width and total weight. This advancement has contributed to higher rates of crop injury, including root system impairment, physical damage to plants, and cross-contamination by pathogens from previously treated areas [5]. As a result, yield losses from mechanical damage using ground-based spraying equipment was reported to range from 1% to over 6%, depending on the crop, application timing, and machinery used [6,7,8]. Excessive rainfall on slow-draining soil types is also another environmental condition that can hinder effective ground applications, resulting in yield losses and contributing to soil compaction [9]. Because of that, aerial pesticide applications have been adopted by growers, and approximately 28% of cropland in the United States receives aerial pesticide treatment via manned agricultural aircraft [10]. This aerial application method offers improved speed but lacks the precision needed to prevent off-target application; consequently, aerial pesticide treatment via manned agricultural aircraft has raised environmental and economic concerns [11].
Under the aforementioned agricultural scenario, the use of sprayer drones, also called unmanned aerial application systems (UAASs), has emerged as an alternative for the application of crop protection products [12]. The UAASs are advanced tools that can autonomously fly and apply agricultural inputs (i.e., herbicides, fungicides, and insecticides) based on pre-set flight routes [13]. This equipment offers several advantages, including the facilitation of late-season spraying on tall crops, access to areas that are difficult for ground sprayers to reach, reduction in labor demands by replacing backpack sprayers, and enhancement of safety for the applicator [14]. In addition, agricultural sprayer drones have been reported to contribute to reduced pesticide use and minimize environmental impacts through low-volume applications, making UAAS a more sustainable option for precision agriculture [15].
The effectiveness of UAAS pesticide application depends on flight parameters that include flight speed, droplet size, and application volume. These parameters significantly influence spray deposition, which is the amount of pesticide that successfully reaches and adheres to the target surface. Effective spray deposition ensures the active ingredient of products are delivered for pest control while minimizing product waste and off-target contamination. Therefore, effective spray deposition is a critical metric to evaluate application efficiency and environmental safety [16]. Nevertheless, flight parameters affect not only the total spray output but also application uniformity, which can be impacted by droplet distribution, potential drift, and surface coverage. The precision and consistency of pesticide deposition across crop canopy are directly tied to these variables, and recent research on UAAS has focused on assessing their performance in pesticide application. For example, Cavalaris et al. (2022) [4], using traditional hydraulic nozzles, found that UAAS-based ultra-low-volume (ULV) applications to desiccate cotton were more effective than ground-based sprayers, improving defoliation, boll opening, and yield. The study also indicated that lower spray altitudes (i.e., 2 m) performed the best, reducing spray volume (i.e., 10 L/ha) requirement for efficient cotton management. Wang et al. (2019) [17] evaluated the impact of UAAS spray volume on pesticide deposition in wheat. Results indicated that UAAS had a similar performance to knapsack sprayers at volumes above 16.8 L/ha with coarse nozzles. However, a lower spray volume (9.0 L/ha) with fine nozzles resulted in reduced pesticide deposition, which highlights the importance of optimizing UAAS spray parameters for effective pest and disease control.
Recent UAAS models, such as the DJI AGRAS T20, T25, T40, and T50, are equipped with centrifugal nozzles, allowing operators to adjust droplet size directly from the remote controller. This feature simplifies machine operation and eliminates the need for manual nozzle changes, reducing operator exposure [18]. Ribeiro et al. (2025) [19] evaluated the efficiency and safety of using a DJI AGRAS T40 drone for pesticide applications in eucalyptus sprout eradication, comparing different spray ranges and droplet sizes to a manual backpack sprayer. The drone provided better droplet distribution, especially at a flight height of 7 and 9 m with droplet sizes of 150 and 300 µm, while reducing applicator exposure by 160 times compared to manual spraying. In the same trend, Wang et al. (2024) [20] used a DJI AGRAS T25 sprayer drone to evaluate UAAS-based pollination on pear orchards, and indicated that a flight height of 1.5 m and speed of 2 m/s provided the best droplet deposition.
While various sprayer drones have been evaluated under different field and environmental conditions, most studies have focused on individual parameters or general performance rather than systematically optimizing flight parameters for drones equipped with centrifugal nozzles. Research has examined droplet size and flight speed independently; contrarily, few studies have investigated the combined effects of flight speed, droplet size, and application volume using a factorial design. In general, there is a gap of knowledge, particularly relevant for specialty crops, where dense canopies and variable target structures demand greater application precision. Despite a widespread adoption in UAAS applications, centrifugal nozzles remain underexplored. Addressing this gap is essential given the complex airflow dynamics generated by multirotor drone systems. Therefore, starting from the hypothesis that spray deposition is influenced by different flight parameters of a sprayer drone equipped with centrifugal nozzles, and that a specific combination of flight parameters can improve droplet deposition, the objectives of this study were to (1) evaluate the effect of flight parameter combinations on spray deposition and (2) determine the optimal configuration that maximizes application efficiency by improving spray quality and uniformity using the DJI AGRAS T40 sprayer drone.

2. Materials and Methods

2.1. Experimental Site and Meteorological Conditions

Experimental trials were conducted in 2024 at the Turfgrass Unit from Auburn University in Auburn, AL, USA (32°34′41.58″ N, 85°30′3.73″ W). The test area was flat and open, surfaced with synthetic grass, measuring 120 m in length and 20 m in width. Application tests were conducted on 19 and 25 April 2024.
Weather data, including wind speed (m/s), air temperature (°C), and relative humidity (%), were recorded at 10 s intervals using a Kestrel 5500 weather meter (Kestrel Instruments, Boothwyn, PA, USA) mounted on a 1.8 m tripod. Data collected in each application test for each replication were averaged by treatment for analysis. Subsequently, these data were also averaged for both application tests across treatments to ensure consistency (Table 1). All application tests were conducted within the acceptable wind speed of up to 2 m/s and wind angle of up to ±15°, according to the ASAE S386.2 standards [21].
A DJI AGRAS T40 (T40—SZ DJI Technology Co., Shenzhen, China) (Figure 1A) was used to assess the effects of flight speed, application volume, and droplet size on spray deposition patterns and droplet spectra. The T40 is a quadcopter with a total weight of 50 kg (including battery), a 40 L tank, and a payload capacity of 40 kg [22]. Each motor delivers 4000 W of power, and the battery has a capacity of 30,000 mAh, allowing for approximately 7 min of hover time with a full tank. The aircraft features a dual atomized spray system with sprinklers mounted on the rear rotors, capable of generating droplets ranging from 50 to 500 μm. The UAAS has a maximum speed of 10 m/s, but its maximum effective spray width is 11 m at an altitude of 2.5 m when flying at 7 m/s. The system’s flow rate is 12 L/min, with each sprinkler delivering up to 6 L/min. For precision application, the aircraft is equipped with an active phased array omnidirectional radar and a terrain-follow system with a maximum incline of 30°. Ultimately, the T40 was operated using the DJI AGRAS intelligent remote controller with integrated flight planning software, while a GNSS mobile base station (Model D-RTK 2, SZ DJI Technology Co.) provided positioning accuracy within ±1 cm for horizontal and vertical coordinates.

2.2. Experimental Design

A three-factorial experimental design was used to evaluate the effect of flight speed (i.e., 4, 7, and 10 m/s), droplet size (i.e., 150, 250, and 350 μm), and application volume (i.e., 18.75 and 28.10 L/ha) on spray deposition. Treatments were selected based on the T40 operator’s manual [22] recommendations and the ASABE S572.1 standard [23], which classifies droplet size ranges commonly used for agricultural pesticide applications. The droplet size range tested (i.e., 150, 250, and 350 µm) reflects typical recommendations for insecticide and fungicide applications under aerial spraying. Application volumes of 18.75 and 28.10 L/ha were chosen to reflect label requirements for a wide variety of commercial insecticides and selected fungicides in aerial applications for specialty crops, including vegetables, fruits, and greenhouse-grown produce [24]. For instance, product labels for methoxyfenozide and acetamiprid specify a minimum aerial application volume of 18.75 L/ha to ensure effective canopy penetration and pest control in crops such as tomatoes, peppers, and leafy greens [25,26]. Similarly, fungicides containing azoxystrobin and the combination of fluopyram + trifloxystrobin recommend minimum aerial spray volumes of 18.75 L/ha, particularly in high-density specialty crops [27,28]. These volume thresholds are consistent with the guidelines outlined in the EPA’s PR Notice 93-2, which recommends a minimum of 18.75 L/ha for aerial applications in field crops [29]. Flight speeds of 4, 7, and 10 m/s were selected to reflect realistic operational conditions for UAAS-based pesticide applications. The mid-level speed (7 m/s) corresponds to the DJI Agras T40’s manufacturer-reported optimal condition, where the drone achieves its maximum effective spray width (11 m) at 2.5 m height [22]. The highest speed (10 m/s) represents the drone’s maximum rated speed, included to evaluate spray performance under high-efficiency scenarios. The lowest speed (4 m/s) was chosen based on ranges commonly tested in previous UAAS spray studies, such as Martin and Latheef (2022) [30] and Fritz and Martin (2020) [31], enabling a full assessment across slow, moderate, and fast speed applications. Therefore, there was a total of 18 treatments (3 speeds × 3 droplet sizes × 2 volumes) replicated four times, which resulted in a total of 72 flights (Table 2). Flight applications followed the single-pass pattern testing method outlined in ASAE S386.2, with the UAAS flying at a fixed altitude of 3 m above ground and a 10 m target swath width (Figure 1B). Although ASAE S386.2 does not prescribe specific flight altitudes or swath widths, this standard was adapted for UAV research in previous studies. The selected 3 m altitude reflects common practice for UAV spraying to balance rotor turbulence and spray deposition uniformity [32], while the 10 m target swath width aligns with manufacturer specifications for optimal spray coverage under standard operating conditions for the DJI AGRAS T40 [22].

2.3. Treatment Application and Data Collection

In each flight, water and the Vision Pink™ dye (GarrCo Products, Converse, IN, USA) were mixed at a rate of 20 mL/L. This mixture was UAAS applied in parallel to the prevailing wind over the center line of a 12 m × 0.1 m wooden board placed perpendicular to the UAAS flight path (Figure 1B). Kromekote white paper (KWP) cards (101.6 × 25.4 mm; glossy C/1S, 8 pt cover, 170 g/m2, brightness 89; The Paper Mill Store, Neenah, WI, USA) were spaced at 1 m intervals along the board using alligator clips affixed with double-sided tape. The board was only partially covered to allow unobstructed and independent sampling at fixed positions across the swath, minimizing the risk of droplet overlap, drift distortion, or cross-contamination between cards. Flight passes were initiated and terminated at least 50 m from the sample area to ensure consistent speed and minimize variability. After treatment application, the KWP cards were immediately collected, stored in pre-labeled adhesive note blocks, and placed in plastic bags with silica pouches to prevent contamination from atmospheric moisture.
The KWP cards were scanned using an Epson Perfection V39II flatbed scanner (Epson America Inc., Long Beach, CA, USA) at a resolution of 1200 DPI, which provides sufficient detail for accurate droplet size and distribution analysis. Previous research has demonstrated that scanning resolutions of at least 600 DPI are required to capture extremely fine droplet details, with 1200 DPI improving accuracy in detecting smaller droplets and reducing segmentation errors in image analysis [33]. According to the ASABE S572.1 standard, “extremely fine” droplets are defined as those with a volume median diameter (VMD) of less than 60 microns, which aligns with the detection capabilities required for accurate spray quality classification [23]. Scanned images were processed using the AccuStain software (Version 0.32, developed by Matt Gill, University of Illinois at Urbana-Champaign) following the user manual to assess spray deposition patterns and droplet spectra parameters. For image processing, automatic thresholding was applied using the software’s default settings for cast-coat papers.
While AccuStain provides a standardized and reproducible method for analyzing droplet deposition, it is important to note that the software outputs serve as quantitative guidance rather than exact deposition values. As stated in the user manual, measurements may be subject to sampling and segmentation errors, particularly for smaller droplets or under high background noise. Nevertheless, when used with a 1200 DPI scanner and cast-coated papers stained with rhodamine dye, the software’s algorithms have been shown to produce reliable estimates of droplet coverage and density in aerial spray trials. The automatic thresholding and ROI (region of interest) calibration features help reduce operator variability, though manual adjustments are sometimes needed when droplet contrast is low or background interference is present. These capabilities are supported both by the user manual and by recent studies involving UAAS-based spray applications [34,35].

2.3.1. Spraying Droplet Parameters

The following spraying droplet parameters were measured: spray coverage (%), droplet density (drops/cm2), and droplet spectra. Parameters were measured using images from the KWPs following the droplet analysis protocols within AccuStain software [32,36]. Spray coverage represents the percentage of the surface of the droplet collection material covered by spray droplets, while droplet density indicates the number of droplets deposited per unit area of the collection material [12,37]. Spray droplet spectrum parameters included volume diameter at the 10th percentile or Dv0.1 (μm), volume median diameter (VMD) or Dv0.5, volume diameter at the 90th percentile or Dv0.9 (μm), and relative span factor (RSF). The Dv0.1, Dv0.5, and Dv0.9 represent the droplet diameter (μm) encompassing 10, 50, and 90% of the total spray volume, respectively [30]. For example, if Dv0.1 is 100 μm, this indicates that 10% of the total spray volume consists of droplets with diameters smaller than or equal to 100 μm. Similarly, if Dv0.5 is 250 μm, then half of the total spray volume is composed of droplets smaller than or equal to 250 μm; this value is also referred to as the VMD. Lastly, if Dv0.9 is 400 μm, it indicates that 90% of the total spray volume is made up of droplets with diameters smaller than or equal to 400 μm. Ultimately, the RSF is a dimensionless value that indicates the uniformity of the droplet size distribution [38], defined as
R S F = D v 0.9 D v 0.1 D v 0.5  

2.3.2. Uniformity of Application

The uniformity of application was determined using the spraying pattern and effective swath width, which were measured using the AccuStain through KWPs [32,36]. The swath analysis function of the software simulated how the spray pattern would perform when repeated in a racetrack application pattern, where dyed solution deposited from the right side of the aircraft in one pass overlaps with solution from the left side in the following pass. Each pass was analyzed independently with the software automatically centering the spray pattern to correct for shifts caused by crosswinds or minor deviations in the flight path. An equal area function was used to standardize deposition intensity, compensating for variations caused by meteorological conditions or changes in the aircraft performance. Eventually, the uniformity of spray deposition was evaluated by calculating the coefficient of variation (CV) across multiple simulated effective swaths. The effective swath width was then defined as the widest swath where the CV was ≤25%, considered the limit for acceptable spray uniformity [13]. For example, in a random pass, if the target swath was 10 m but only 7 m had uniform coverage with a CV ≤ 25%, then 7 m was considered the effective swath width for that specific pass.

2.4. Statistical Analysis

Spray coverage and droplet density were analyzed using a repeated measurement approach, employing restricted maximum likelihood estimation for variance–covariance matrix modeling via the PROC GLIMMIX procedure in SAS (Version 9.4, 2024). This approach was chosen to account for the correlation effects associated with repeated measurements. The variance–covariance matrix structure was modeled using a first-order ante-dependence structure. Flight speed, droplet size, and application volume were considered fixed effects, while block effects were treated as random to account for variability within experimental units. For the analysis of spray deposition, when data were taken at multiple sampling points across the swath within each flight, repeated observations were accounted for within the model. This ensures that within-flight correlations are properly modeled, rather than treating each measurement as independent. By doing so, the analysis distinguishes between variability within flights and variability between flights, leading to more precise estimates of treatment effects. Data normality was assessed using the Shapiro–Wilk test for each treatment combination. All p-values exceeded 0.05, indicating that the assumption of normality was met. No data transformation or alternative distributional modeling was required for coverage or spray uniformity variables. Additionally, this approach prevented inflated Type I errors and improved the robustness of statistical inferences. Ultimately, least-square means comparisons were conducted using Tukey’s test (p ≤ 0.05) when significant F-values were detected in the variance analysis for all variable responses. Pearson’s correlation coefficient was used to assess the relationships between spray coverage, droplet density, and deposition across flight parameters. Additionally, droplet density and deposition data were analyzed assuming a Poisson distribution, incorporating the log-link function and the Laplace approximation to improve model convergence.

3. Results

Table 3 shows the analysis of variance for all variable responses evaluated. In general, there was a significant interaction between flight speed and application volume for spray coverage, Dv0.1, Dv0.5, and Dv0.9. Flight speed and droplet size significantly interacted to impact the effective swath and Dv0.9; while spray droplet density and RSF were significantly affected only by the main effects of flight speed and droplet size.

3.1. Spray Coverage, Droplet Density, and Droplet Spectra on KWP Cards

3.1.1. Spray Coverage

The interaction between flight speed and application volume significantly affected spray coverage (Table 4). For the effect of flight speed within application volume, coverage decreased as flight speed increased for both application volumes tested, in which every 1 m/s increase in flight speed decreased spray coverage in 0.34% for the 18.75 L/ha volume and 0.87% for the 28.10 L/ha volume. For the effect of application volume within flight speeds, spray coverage was significantly higher with 28.10 L/ha volume at flight speeds of 4 and 7 m/s compared to 18.75 L/ha volume. However, at 10 m/s, coverage was not significantly different between the two application volumes.

3.1.2. Spray Droplet Density

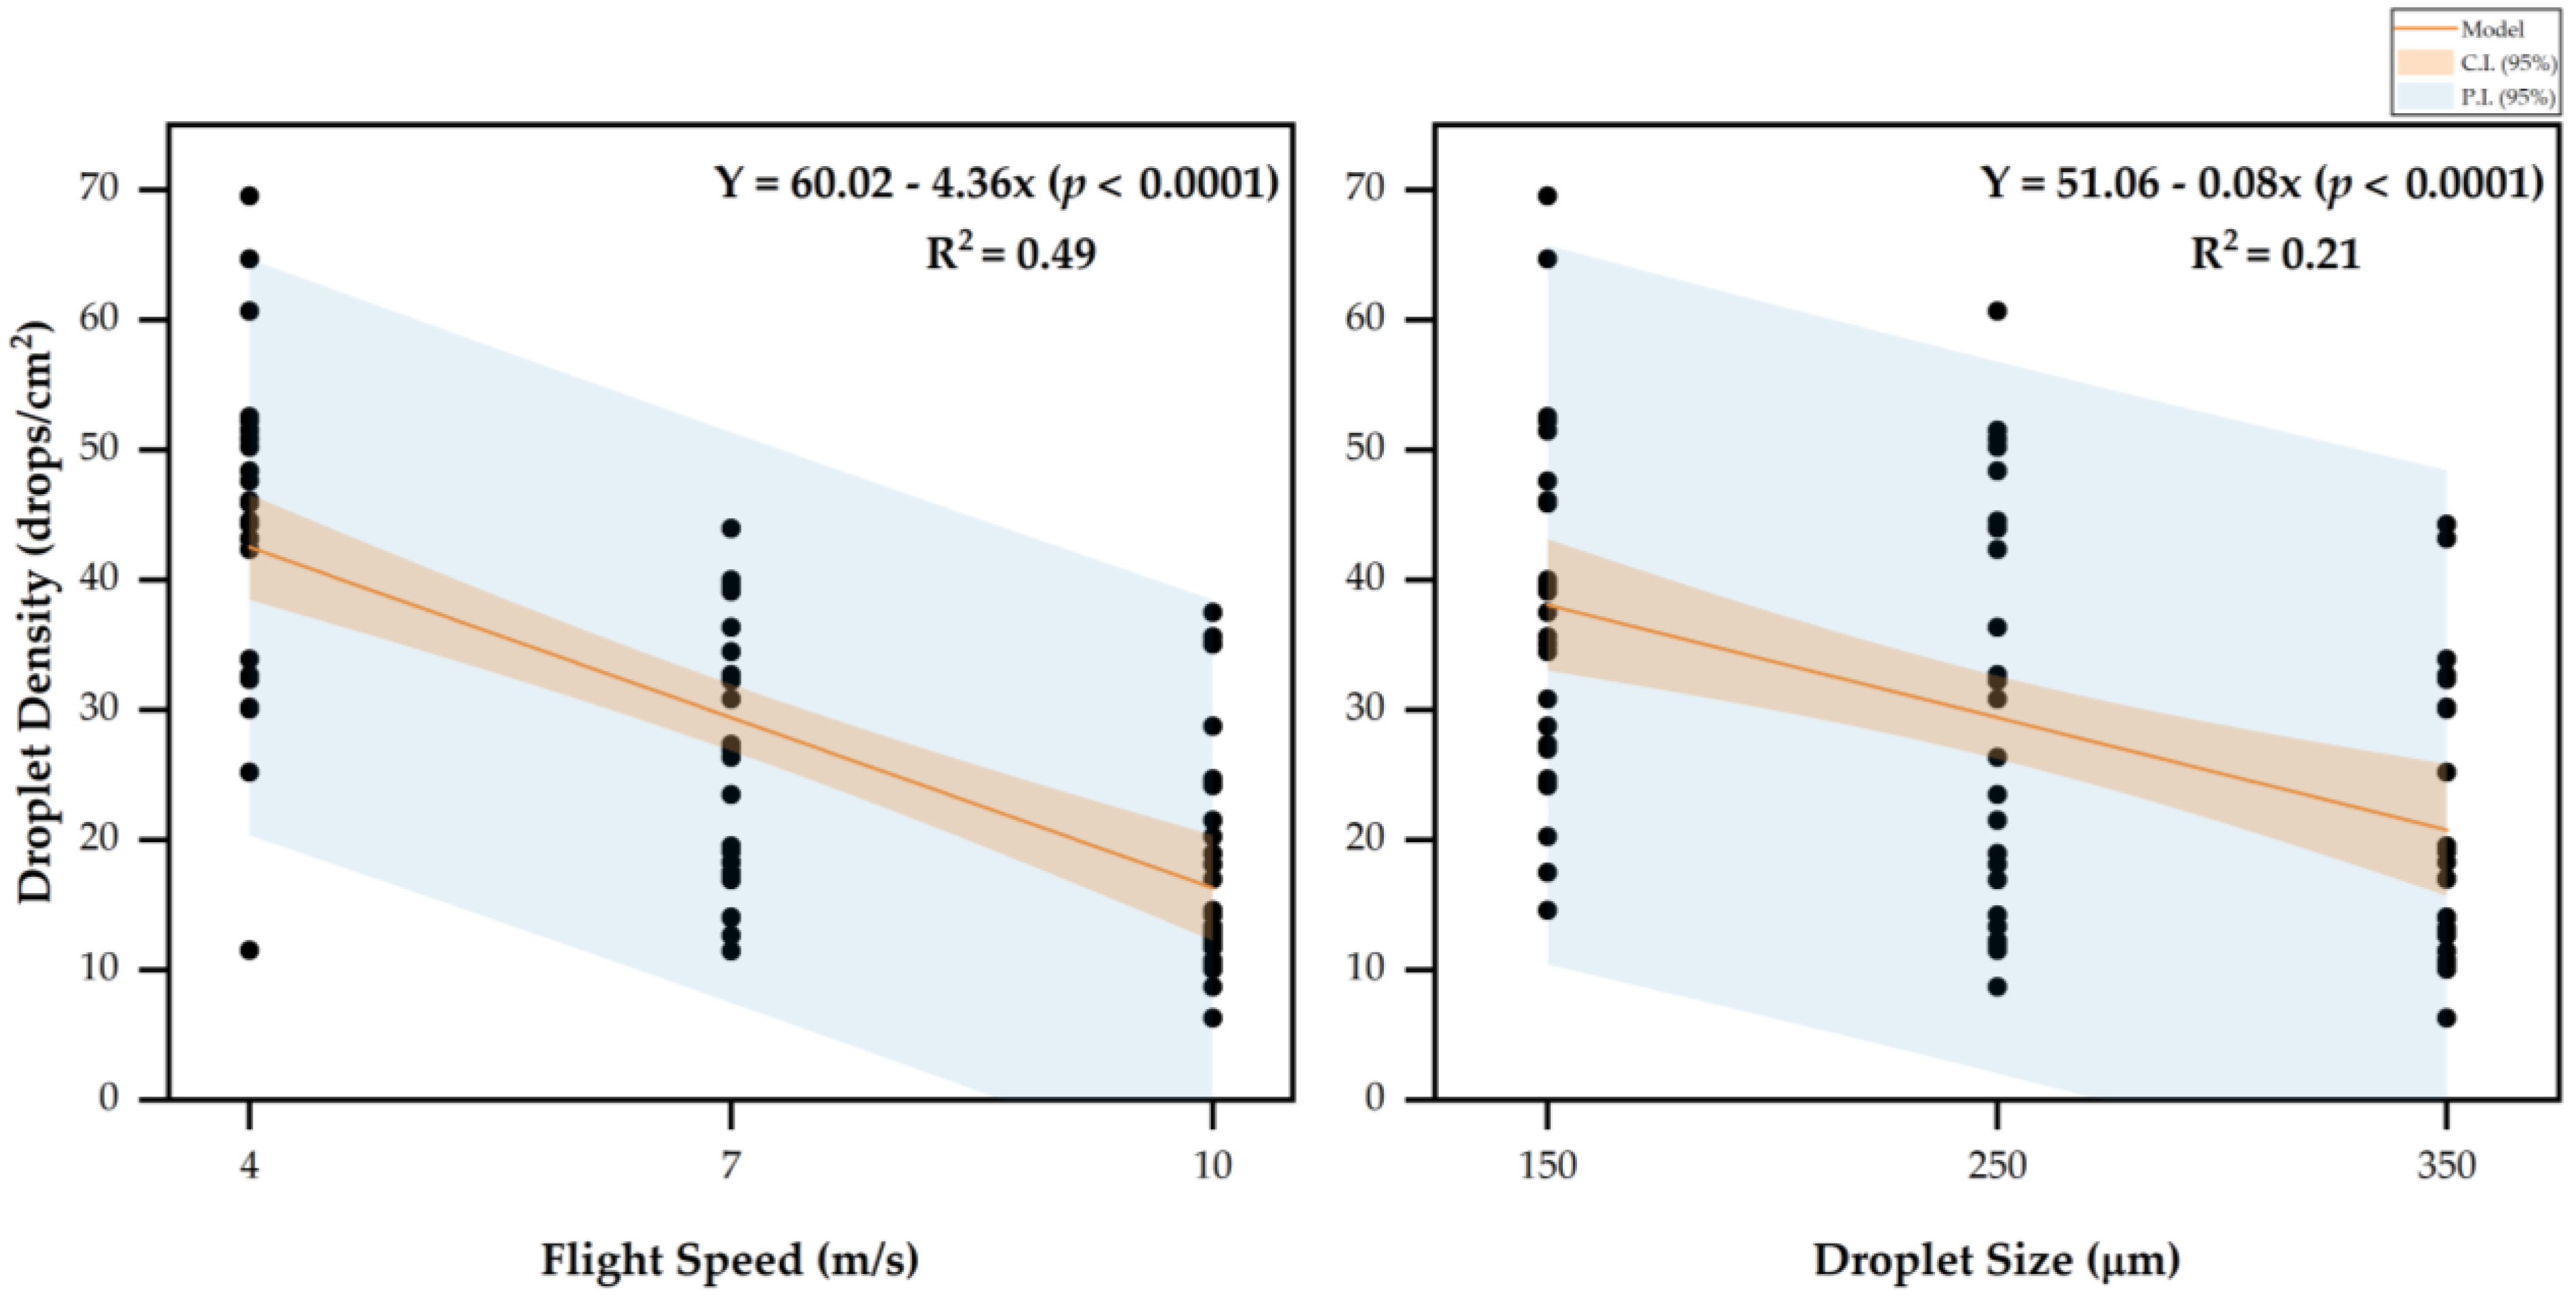
For the main effect of flight speed and droplet size on droplet density, there was a decrease in droplet density as flight speed and droplet size increased (Figure 2). Particularly, an increase in flight speed of 1 m/s decreased droplet density by 4.36 drops/cm2, while a 1 µm increase in droplet size decreased droplet density by 0.08 drops/cm2. The slowest flight speed (4 m/s) produced the highest droplet density, while droplet density significantly decreased at 7 and 10 m/s flight speeds. A similar trend was measured with droplet size, where the smallest droplet size (150 µm) produced the highest droplet density. Consequently, droplet density decreased as droplet size increased from 150 µm to 250 and 350 µm.

3.1.3. Spray Droplet Spectra

The interaction between flight speed and application volume significantly affected Dv0.1, Dv0.5, and Dv0.9, while the main effect of droplet size impacted Dv0.1, Dv0.5, and RSF. The main effect of flight speed also had a significant effect on RSF, while the interaction between flight speed and droplet size had a significant effect on Dv0.9.
Table 5 shows the significant main effect and interactions of flight speed, application volume, and droplet size on Dv0.1, Dv0.5, and Dv0.9. For the interaction between flight speed and application volume on the Dv0.1, Dv0.5, and Dv0.9, the application volume of 28.10 L/ha had higher Dv0.1, Dv0.5, and Dv0.9 than the application volume of 18.75 L/ha under the flight speed of 4 and 7 m/s; however, application volume treatments had no significant difference under the flight speed of 10 m/s. Regarding the effect of flight speed within application volume treatments, regression analyses were not significantly different for Dv0.1, Dv0.5, and Dv0.9.
For the main effect of droplet size on Dv0.1 and Dv0.5, when droplet size increased by 1 µm, it increased Dv0.1 by 0.25 µm and Dv0.5 by 0.43 µm. At the same time, regardless of flight speed, there was a significant positive linear relationship measured among droplet sizes for the Dv0.9, where every 1 µm increase in droplet size increased Dv0.9 by 0.36 µm at 4 m/s, 0.59 µm at 7 m/s, and 0.65 µm at 10 m/s. For the 150 µm droplet size, there was a significant negative linear relationship among flight speed for Dv0.9, in which a 1 m/s increase in flight speed reduced Dv0.9 by 5.89 µm. This trend was not measured for the 250 and 350 µm droplet sizes. Regarding the main effect of droplet size on Dv0.1 and Dv0.5, when droplet size increased by 1 µm, it also increased Dv0.1 by 0.25 µm and Dv0.5 by 0.43 µm.
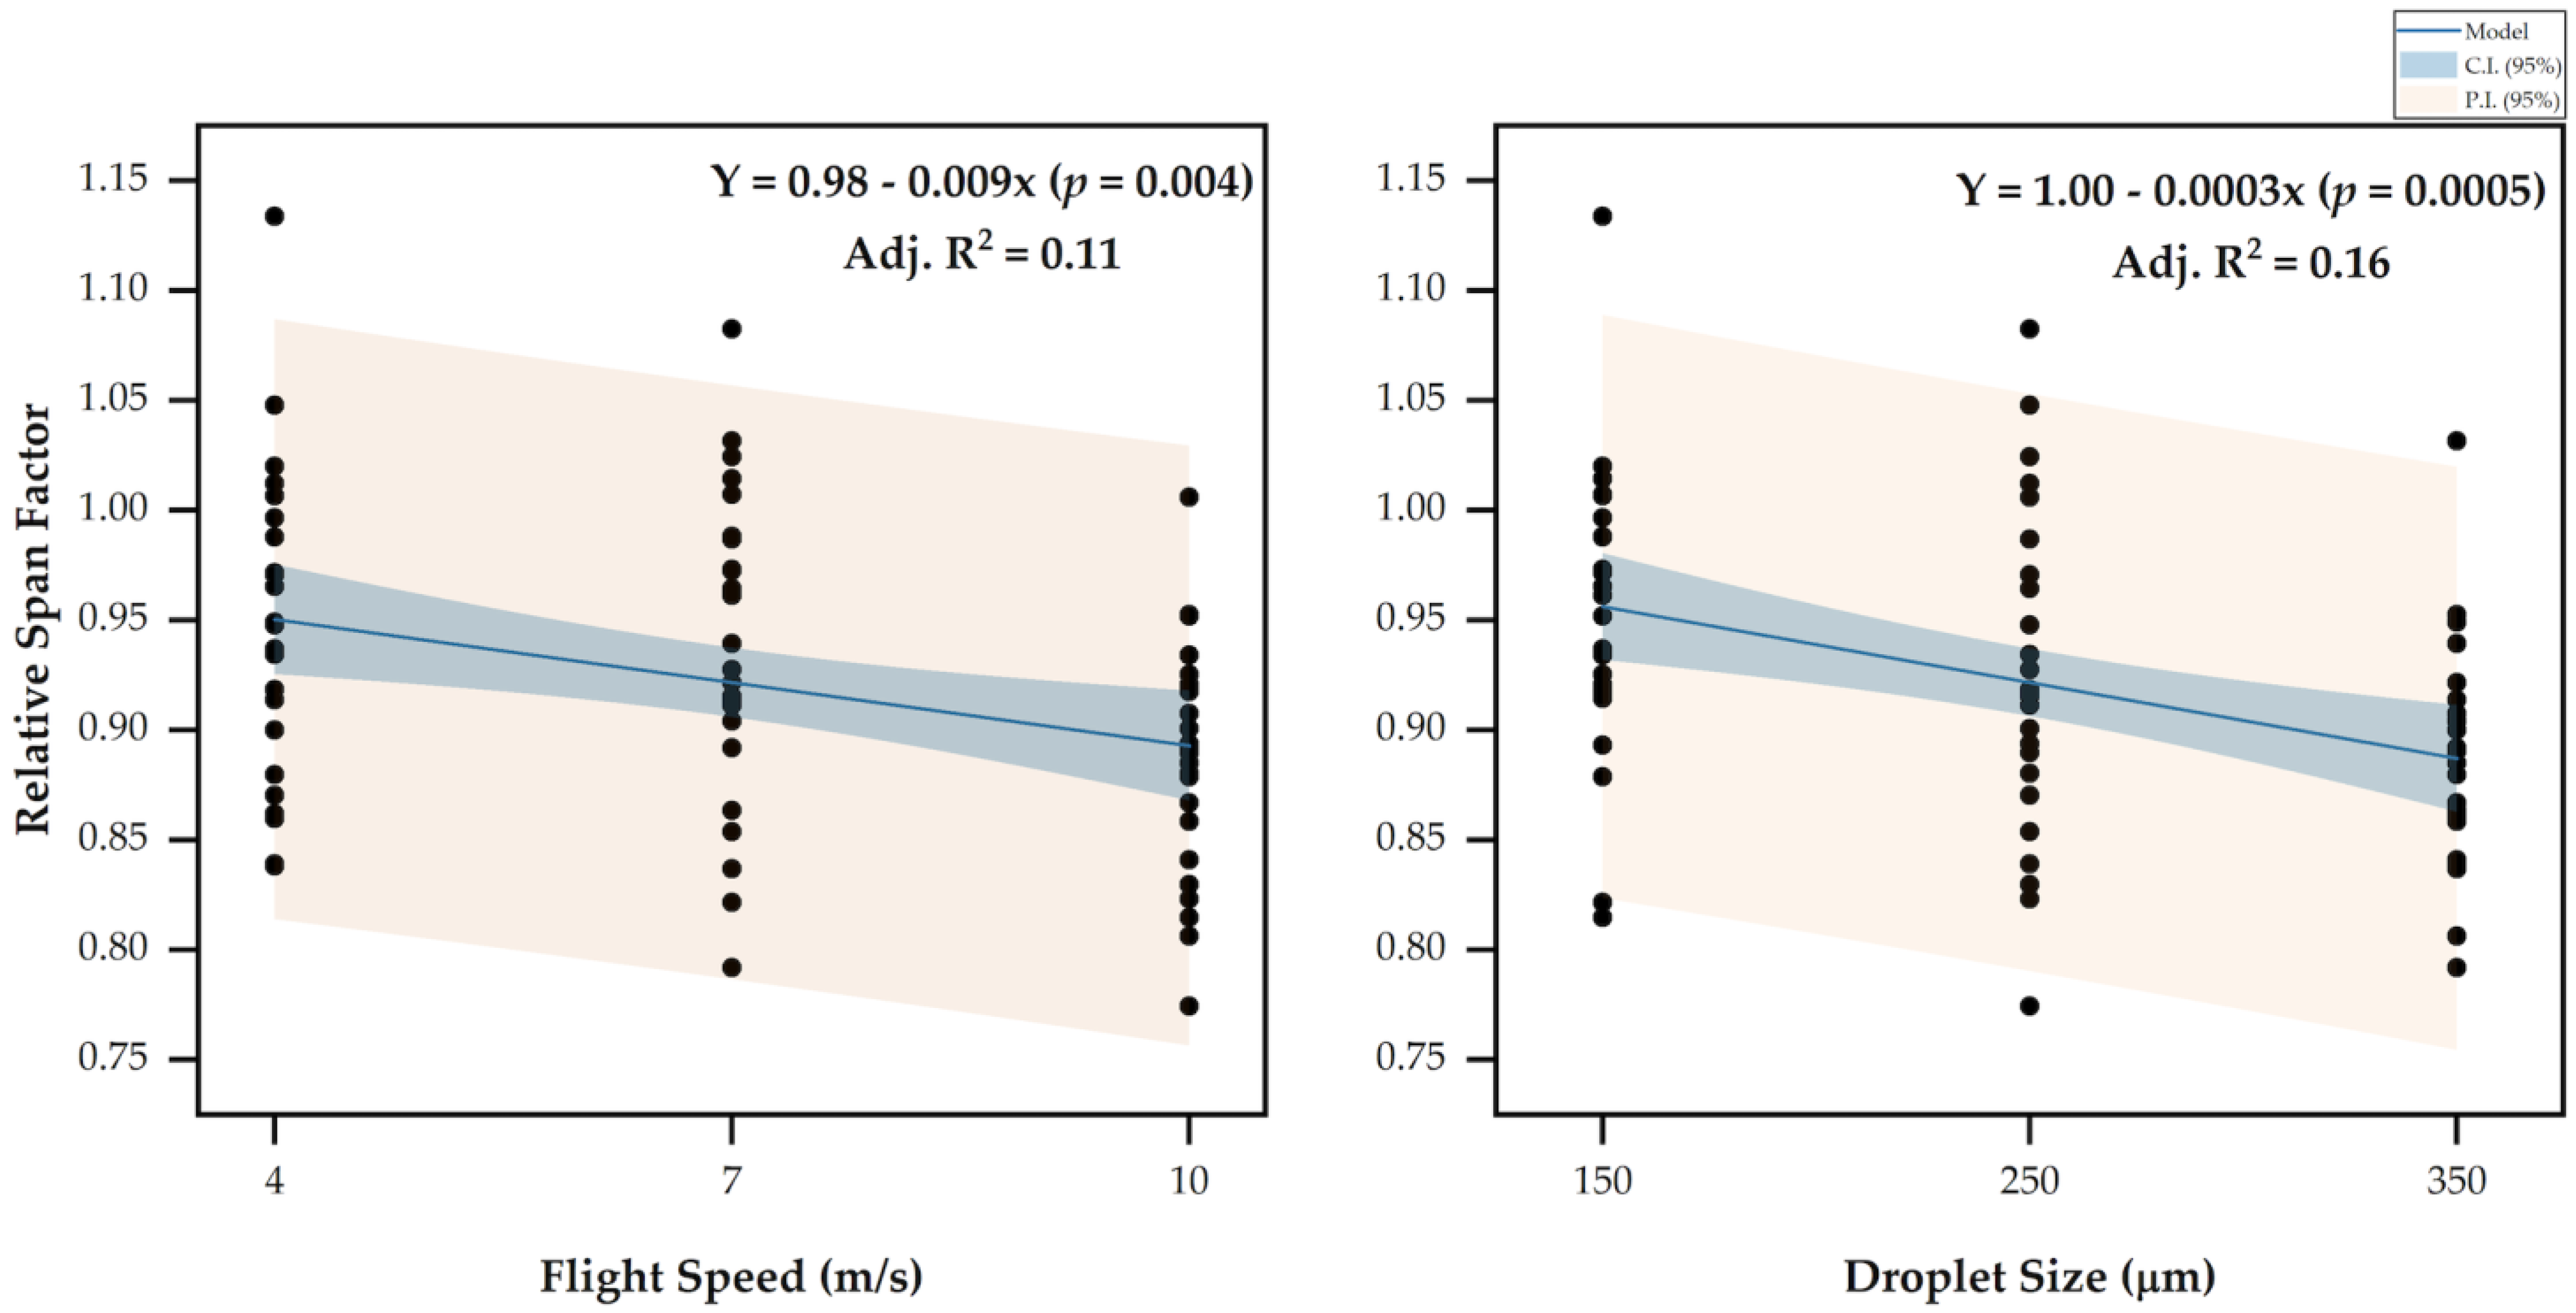
Figure 3 shows the main effect of flight speed and droplet size on RSF. Particularly, the RSF decreased as flight speed and droplet size increased. At flight speeds of 4 and 7 m/s, the RSF was significantly higher compared to 10 m/s. A similar trend was measured for droplet size, where 150 µm produced a significantly higher RSF than 350 µm.

3.2. Spray Effective Swath

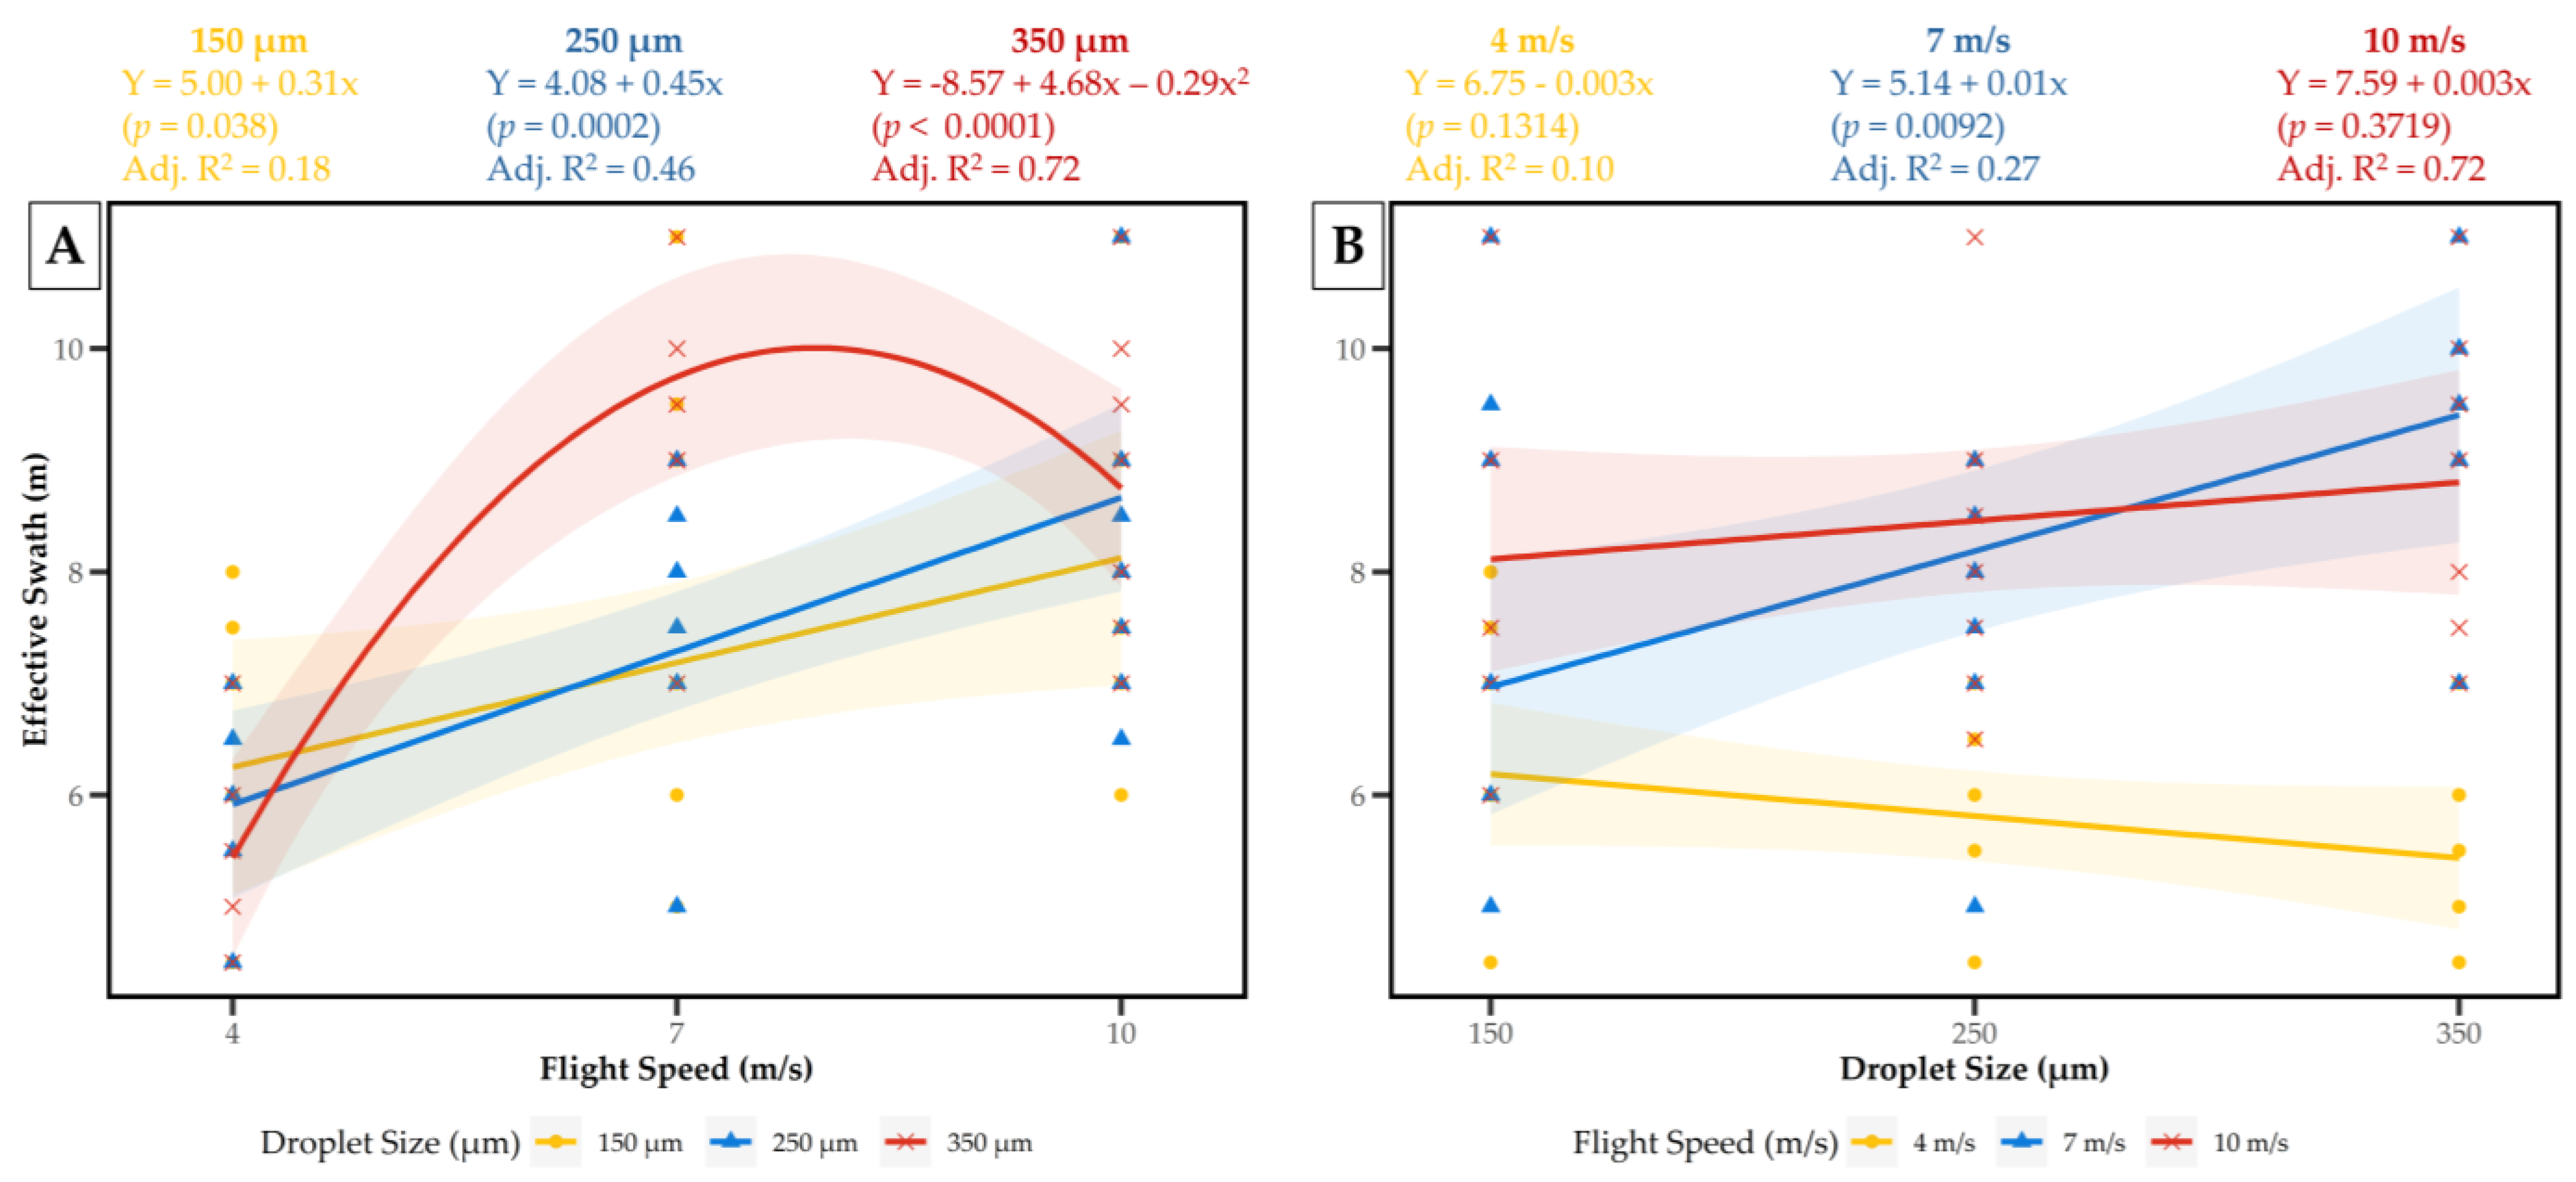
Figure 4 shows the significant interaction between flight speed and droplet size on the effective swath. For the effect of flight speed within droplet size (Figure 3), a significant positive linear relationship was measured for treatments of 150 µm and 250 µm, in which the effective swath increased as flight speed increased. For every 1 m/s increase in flight speed, the effective swath increased by 0.31 m for the 150 µm droplet size and by 0.45 m for the 250 µm droplet size. In contrast, a significant quadratic relationship was measured for flight speed within the 350 µm droplet size treatment, where the effective swath increased with flight speed up to 7.93 m/s, peaking at approximately 10 m. For the effect of droplet size within flight speed (Figure 3), there was a significant positive linear relationship measured at a flight speed of 7 m/s for droplet size, where every 1 µm increase resulted in a 0.01 m increase in effective swath. However, at flight speeds of 4 m/s and 10 m/s, droplet size had no significant impact on effective swath.

4. Discussion

This study investigated the influence of flight speed, droplet size, and application volume on spray deposition using the DJI AGRAS T40 sprayer drone. These parameters significantly affected spray coverage, droplet density, and effective swath width, ultimately impacting application efficiency and uniformity. Overall, flight speed and application volume significantly influenced spray coverage. As flight speed increased, coverage decreased for the 18.75 L/ha and 28.10 L/ha volumes of application. Slower speeds (4 m/s and 7 m/s), especially with higher application volumes, generally resulted in better coverage than the fastest speed (10 m/s) evaluated, which had no significant difference between the two volumes of application. At 4 m/s, the highest coverage was achieved with 28.10 L/ha. Higher speeds, especially 10 m/s, likely reduced spray coverage due to the faster UAAS movement, limiting the time droplets are available to deposit on the target surface and increasing the spray volume requirement, which can be associated to an increased drift and rotor airflow lifting droplets [39,40]. Consequently, there was higher off-target movement and reduced deposition efficiency as flight speed increased. Previous studies have reported similar results, in which spray coverage increased with slower flight speeds and higher application volumes. Particularly, studies using the DJI AGRAS T30 (4.5–6.7 m/s) and the TTA M4E (2.5–5.0 m/s) have reported that reducing flight speed increases spray coverage [12]. Similarly, studies on application volume demonstrated that increasing the spray volume from 12 to 18 L/ha and from 9 to 28 L/ha at a flight speed of 5 m/s—comparable to the lower speeds tested in this study—resulted in a significant increase in coverage percentage [17,41].
Overall, droplet density decreased as flight speed and droplet size increased, with the lower speed (4 m/s) and droplet size (150 µm) delivering the highest number of droplets per unit area (drops/cm2). These effects are likely driven by the factor that fast UAAS movement increases turbulence and airflow instability, reducing droplet deposition. Also, the negative relationship between droplet size and droplet density is explained by the faster deposition of larger droplets due to their greater mass [42,43]. Similar patterns of measurement have been reported in the literature [44], in which higher flight speeds combined with crosswind speeds increased droplet drift and reduced deposition efficiency, confirming the positive relationship between speed, airflow, and droplet distribution. A particular study using a UAAS simulation platform under laboratory conditions reported that slow speeds significantly increased droplet deposition density. Specifically, when flight speeds ranged from 0.3 to 1.0 m/s, lower speeds resulted in a higher number of droplets per unit area [37]. A study comparing droplet deposition across four spray volumes and three different VMDs (150, 200, and 300 µm) indicated that, at a constant spray volume, droplet density decreased as droplet size increased [45]. These findings further reinforce the influence of flight speed and droplet size on spray deposition efficiency, supporting the trends observed in the present study. Beyond evaluating deposition patterns and swath uniformity, achieving adequate droplet density is essential for effective pesticide performance [37]. Although optimal values depend on the target pest and mode of action, previous research suggests that pre-emergence herbicides and systemic insecticides typically require 20–30 droplets/cm2, contact post-emergence herbicides require 30–40 droplets/cm2, and contact fungicides and insecticides may require 40–70 droplets/cm2. These reference values provide useful benchmarks for interpreting deposition results and optimizing UAAS application strategies according to the intended product use [46,47,48,49,50].
While this study assumed idealized spray initiation and shutoff (i.e., instantaneous nozzle switching), we minimized the influence of nozzle delay by initiating and terminating each flight pass at least 50 m from the sample area to ensure consistent speed and stable spray conditions. Nonetheless, previous research has shown that nozzle actuation delays can affect coverage uniformity near the start and end of spray passes. Teske et al. (2018) [39] demonstrated that low-speed vortex interactions may disrupt deposition patterns, while Fritz and Martin (2020) [31] emphasized the need for buffer zones to account for nozzle response lag in UAV spraying. Although transient spray dynamics were not directly modeled in this study, they represent an important consideration for future field-scale applications and real-time spray control.
Variations in flight speed and application volume affected droplet spectra (i.e., Dv0.1, Dv0.5, Dv0.9, and RSF), indicating a trade-off between droplet size and uniformity. While lower flight speeds and higher application volume favored larger droplet spectra with greater variability, higher speeds (10 m/s) produced a more uniform droplet distribution. These findings align with previous research, which reported that higher nozzle flow rates (0.6–1.0 L/min) and lower flight speeds (1.0–3.0 m/s) influenced droplet formation, leading to larger but less uniformly distributed droplets [15]. Additionally, larger droplet sizes correlated with higher Dv0.1, Dv0.5, and Dv0.9 values, which are decisive in minimizing drift potential, particularly when Dv0.5 remains below 160 µm [51]. Another study testing eighteen hydraulic nozzles similarly found that larger droplets were associated with a higher Dv0.5 [52].
Even though the desired droplet size can be selected using the UAAS remote controller, sprayer drones equipped with centrifugal nozzles often struggle to generate fine droplets. Compared to hydraulic nozzles used in drones like the DJI T30, centrifugal nozzles generate more stable droplet sizes at higher speeds due to their rotational mechanism [30]. While hydraulic nozzles (e.g., XR, AIXR, and AITX) can produce finer droplets, they are more sensitive to airflow disturbances, often resulting in greater variability in coverage under UAAS rotor-induced turbulence [32]. The stability of centrifugal nozzles likely contributed to the consistent droplet spectra observed at 10 m/s in this study, although their atomization efficiency for fine droplets may be limited and require careful adjustment. This limitation is likely due to restrictions in atomizer rotation speed and the resistance of the liquid to fine atomization under centrifugal forces [53]. Beyond nozzle mechanics, the aerodynamic performance of UAAS spray systems is heavily influenced by interactions between rotor-induced turbulence and environmental factors, which directly affect droplet behavior. At higher flight speeds and with finer droplets (e.g., 150 µm), increased aerodynamic forces create turbulent airflow that can destabilize the spray cloud, accelerating droplet evaporation or promoting unintended droplet aggregation. Jackiw and Ashgriz (2021) [54] demonstrated that aerodynamic droplet breakup is governed by internal flow dynamics, where disruptive forces deform and fragment droplets, changing the final droplet size distribution. This effect becomes more pronounced at higher air speeds caused by higher flight speeds, where increased airflow contributes to secondary droplet fragmentation, raising the risk of drift and reducing deposition efficiency. New et al. (2023) [55] also demonstrated that rapid changes in airflow around the drone body and rotors can cause asymmetric dispersions, which are commonly called “vortices”, that disrupt the trajectory of fine droplets, compromising spray uniformity. While these findings highlight the challenges associated with spraying fine droplets at high speeds, the results of the present study suggest a different trend when coarser droplets are used. Specifically, treatments with higher flight speeds and larger droplet sizes produced more uniform droplet spectra (i.e., lower RSF), indicating enhanced spray consistency. In contrast, lower flight speeds and higher application volumes resulted in broader droplet size distributions (i.e., higher RSF), which may help reduce drift but at the cost of droplet uniformity. This pattern was also evident in the interaction between flight speed and droplet size on Dv0.9, where larger droplets increased with speed, while smaller droplets decreased. This suggests that at higher speeds, coarser droplets are less affected by turbulence and maintain their size due to greater momentum, whereas finer droplets are more prone to breakup and evaporation, reducing their size at the upper end of the distribution. Also, the ability of 350 µm droplets to maintain uniformity at higher flight speeds may be attributed to their greater inertial momentum, which reduces susceptibility to aerodynamic turbulence. Larger droplets are less prone to secondary breakup due to their mass and stability during flight, helping them maintain size and trajectory even in strong rotor-induced airflow [30]. Additionally, centrifugal nozzles may produce a more uniform initial droplet size distribution, which further supports stable deposition at higher speeds [56]. These results suggest that under specific conditions—particularly when using larger droplets—higher flight speeds may promote more uniform application without the degree of destabilization reported in previous studies.
Effective swath was determined using a coefficient of variation (CV), a statistical index that measures the uniformity of spray distribution across the target swath, where lower CV values indicate more uniform spray coverage [57,58]. A CV of 25% or less is typically acceptable for effective swath determination [30], although some studies recommend that 15% or less is preferable to minimize issues with over- or under-application [59]. The uneven spray pattern may result in over- or under-application in some areas, wasting product, causing environmental unsafety, and increasing the risk of biological target resistance and lack of control [13,60]. Flight speed and droplet size impacted the effective swath width. As flight speed increased, the effective swath increased for smaller droplets (150 µm and 250 µm); however, this relationship was more complex for larger droplets (350 µm), in which the effective swath initially increased with increasing flight speed, peaking at around 10 m. A previous study reported optimal spray droplet deposition and distribution by increasing the flight speed from 3 to 5 m/s, with a predominant fine droplet spectrum ranging from 100 to 200 µm when testing insecticidal efficacy against plant hoppers in rice crops using the HyB-15L UAV [61]. Contrarily, other studies reported that the effective swath was strongly affected by meteorological and machinery conditions [62] and it had non-uniform spray deposits when flight speed increased [63]. Decreases in effective swath at higher speeds are likely due to increased aerodynamic turbulence, which affects droplet deposition uniformity [64]. As previously reported, larger droplets, though less susceptible to drift, require optimized flight speeds to maintain accurate deposition [51]. Thus, optimum spray deposition and uniform droplet distribution in the present study were achieved at a flight speed of 7.93 m/s and a droplet size of 350 µm, regardless of spray volume. These findings were supported by the treatment-level results, where the widest effective swath (9.50 m) was measured at 7 m/s with 350 µm droplets and 18.75 L/ha. Across all treatments, higher flight speeds generally increased swath width, while coarser droplets (350 µm) were more effective at maximizing uniform coverage. For smaller droplet sizes (150 µm and 250 µm), given the observed trend, it is possible that testing higher flight speeds (above 10 m/s) would have shown an optimal point with a maximum effective swath, followed by a decrease in swath width at even higher speeds. Although this study was conducted under controlled environmental conditions, variables such as wind speed and relative humidity can significantly influence spray deposition. Wind affects droplet trajectory and drift potential, especially for finer droplets, while low humidity increases evaporation rates, reducing droplet size and impacting coverage. Future research should evaluate how these environmental factors interact with UAAS flight parameters to optimize deposition in variable field conditions.

5. Conclusions

This study demonstrated that flight parameters, specifically flight speed, droplet size, and application volume, have significantly influenced spray deposition performance when using the DJI AGRAS T40 sprayer drone equipped with centrifugal nozzles. Results support the hypothesis that spray deposition is affected by flight parameters and that certain combinations can enhance application efficiency. Lower flight speeds (4 m/s) and higher application volumes (28 L/ha) lead to higher coverage and droplet density, while increased flight speeds, particularly 10 m/s, reduced spray deposition, regardless of application volume. Droplet spectra results indicate that lower speeds and higher volumes favored the formation of larger droplets. Optimal spray uniformity (i.e., larger effective swath width of 9.50 m) is achieved at 7.93 m/s with a droplet size of 350 µm; however, the study was conducted under controlled meteorological conditions, and future research should expand to other sprayer drone models, varied environmental scenarios, and additional flight configurations to enhance the applicability of these results. Exploring factors such as droplet evaporation and spray height could further improve the performance and sustainability of UAAS-based pesticide applications.

Author Contributions

Conceptualization, T.C. and A.L.B.R.d.S.; methodology, T.C. and A.L.B.R.d.S.; software, T.C. and A.L.B.R.d.S.; validation, T.C., C.R., L.P.d.O., W.F., A.M.S. and A.L.B.R.d.S.; formal analysis, T.C., C.R., L.P.d.O., A.M.S. and A.L.B.R.d.S.; investigation, T.C., C.R., L.P.d.O., W.F. and A.L.B.R.d.S.; resources, A.L.B.R.d.S.; data curation, T.C. and A.L.B.R.d.S.; writing—original draft preparation, T.C.; writing—review and editing, T.C., C.R., L.P.d.O., P.C., W.F., A.M.S. and A.L.B.R.d.S.; visualization, A.L.B.R.d.S.; supervision, A.L.B.R.d.S.; project administration, A.L.B.R.d.S.; funding acquisition, A.M.S. and A.L.B.R.d.S. All authors have read and agreed to the published version of the manuscript.

Funding

The study was funded by the United States Department of Agriculture Non-Assistance Cooperative Agreement (#58-6080-9-006 “Managing whiteflies and whitefly-transmitted viruses in vegetable crops in the southeastern U.S.”).

Data Availability Statement

The data presented in this study are available on request from the corresponding author.

Acknowledgments

Authors acknowledge Thiago Rutz for his contributions to data analysis, João Vitor Gonçalves for his support with data analysis and fieldwork, and Lucas Barion for his assistance during field activities. In addition, authors thank the staff of the Auburn University Turfgrass Research Unit for providing the facilities to conduct experimental trials. The mention of a proprietary product does not constitute an endorsement or a recommendation for its use by United States Department of Agriculture.

Conflicts of Interest

The authors declare no conflicts of interest.

References

  1. Dhananjayan, V.; Jayakumar, S.; Ravichandran, B. Conventional Methods of Pesticide Application in Agricultural Field and Fate of the Pesticides in the Environment and Human Health. In Controlled Release of Pesticides for Sustainable Agriculture; K.R., R., Thomas, S., Volova, T.K.J., Eds.; Springer International Publishing: Cham, Switzerland, 2020; pp. 1–39. ISBN 978-3-030-23396-9. [Google Scholar]
  2. Gibbs, J.L.; Peters, T.M.; Heck, L.P. Comparison of Droplet Size, Coverage, and Drift Potential from UAV Application Methods and Ground Application Methods on Row Crops. Trans. ASABE 2021, 64, 819–828. [Google Scholar] [CrossRef]
  3. Yu, S.; Zhu, J.; Zhou, J.; Cheng, J.; Bian, X.; Shen, J.; Wang, P. Key Technology Progress of Plant-Protection UAVs Applied to Mountain Orchards: A Review. Agronomy 2022, 12, 2828. [Google Scholar] [CrossRef]
  4. Cavalaris, C.; Karamoutis, C.; Markinos, A. Efficacy of Cotton Harvest Aids Applications with Unmanned Aerial Vehicles (UAV) and Ground-Based Field Sprayers—A Case Study Comparison. Smart Agric. Technol. 2022, 2, 100047. [Google Scholar] [CrossRef]
  5. Moraes, T.R.; Cornago Junior, V.M.; de Araújo, V.C.R.; Esperancini, M.S.T.; Antuniassi, U.R. Cost of Aerial and Ground Sprayings and Technological Replacement Point: A Case Study in the Region of Mineiros, GO, Brazil. Eng. Agríc. 2021, 41, 359–367. [Google Scholar] [CrossRef]
  6. Abi Saab, O.J.G.; Couto, D.T.A.; Higashibara, L.R. Perdas de Produtividade Causadas Pelo Rodado de Pulverizadores; FEPAF: Botucatu, SP, Brazil, 2007. [Google Scholar]
  7. González, C.; Bongiovanni, R.; Picone, L. Efecto de la Pisada del Equipo Pulverizador Sobre la Estructura y Rendimiento del Cultivo de Soja en Aplicaciones de Fin de Ciclo; Universidad Nacional del Litoral: Rosario, Argentina, 2023. [Google Scholar]
  8. Hanna, S.O.; Conley, S.P.; Shaner, G.E.; Santini, J.B. Fungicide Application Timing and Row Spacing Effect on Soybean Canopy Penetration and Grain Yield. Agron. J. 2008, 100, 1488–1492. [Google Scholar] [CrossRef]
  9. Shaheb, M.R.; Venkatesh, R.; Shearer, S.A. A Review on the Effect of Soil Compaction and Its Management for Sustainable Crop Production. J. Biosyst. Eng. 2021, 46, 417–439. [Google Scholar] [CrossRef]
  10. Struttmann, T.; Zawada, J. 2019 NAAA Aerial Application Industry Survey: Operators; National Agricultural Aviation Association (NAAA): Alexandria, VA, USA, 2019; p. 150. [Google Scholar]
  11. Thomson, S.J.; Womac, A.R.; Mulrooney, J.E. Reducing Pesticide Drift by Considering Propeller Rotation Effects From Aerial Application Near Buffer Zones. Sustain. Agric. Res. 2013, 2, 41. [Google Scholar] [CrossRef]
  12. Byers, C.; Virk, S.; Rains, G.; Li, S. Spray Deposition and Uniformity Assessment of Unmanned Aerial Application Systems (UAAS) at Varying Operational Parameters. Front. Agron. 2024, 6, 1418623. [Google Scholar] [CrossRef]
  13. Martin, D.E.; Woldt, W.E.; Latheef, M.A. Effect of Application Height and Ground Speed on Spray Pattern and Droplet Spectra from Remotely Piloted Aerial Application Systems. Drones 2019, 3, 83. [Google Scholar] [CrossRef]
  14. He, X. Rapid Development of Unmanned Aerial Vehicles (UAV) for Plant Protection and Application Technology in China. Outlooks Pest Manag. 2018, 29, 162–167. [Google Scholar] [CrossRef]
  15. Xing, W.; Cui, Y.; Wang, X.; Shen, J. Optimization of Operational Parameters of Plant Protection UAV. Sensors 2024, 24, 5132. [Google Scholar] [CrossRef] [PubMed]
  16. Sanderson, R.; Huddleston, E. II.7 Factors Affecting Application and Chemical Deposition. In IPM Handbook; Pest Management Research: Sidney, MT, USA, 2004. [Google Scholar]
  17. Wang, G.; Lan, Y.; Qi, H.; Chen, P.; Hewitt, A.; Han, Y. Field Evaluation of an Unmanned Aerial Vehicle (UAV) Sprayer: Effect of Spray Volume on Deposition and the Control of Pests and Disease in Wheat. Pest Manag. Sci. 2019, 75, 1546–1555. [Google Scholar] [CrossRef]
  18. OECD. Report on the State of the Knowledge—Literature Review on Unmanned Aerial Spray Systems in Agriculture; Series on Pesticides and Biocides; OECD: Paris, France, 2021; ISBN 978-92-64-98314-4. [Google Scholar]
  19. Felipe Oliveira Ribeiro, L.; Leandro da Vitória, E.; Pereira Bastos, H.; Vieira Zanelato, J.; de Assis Martins Júnior, J.; de Vicente Ferraz, A.; Gomes dos Santos, T.; de Assis Ferreira, F.; Victor Oliveira Ribeiro, J.; de Assis Silva, S.; et al. Droplet Distribution and Mitigation of Occupational Exposure Risk in Eucalyptus Sprout Eradication Using a Remotely Piloted Aircraft. Front. Plant Sci. 2025, 15, 1504608. [Google Scholar] [CrossRef]
  20. Wang, P.; He, M.; Li, M.; Yang, Y.; Li, H.; Xi, W.; Zhang, T. Optimization of Application Parameters for UAV-Based Liquid Pollination in Pear Orchards: A Yield and Cost Perspective. Agronomy 2024, 14, 2033. [Google Scholar] [CrossRef]
  21. American Society of Agricultural and Biological Engineers. ASAE S386.2 FEB1988 (R2018) Calibration and Distribution Pattern Testing of Agricultural Aerial Application Equipment; American Society of Agricultural and Biological Engineers: St. Joseph, MI, USA, 2018; p. 9. [Google Scholar]
  22. DJI. AGRAS T40/T20P User Manual v1.4; DJI: Shenzhen, China, 2023; p. 89. [Google Scholar]
  23. American Society of Agricultural and Biological Engineers. ASABE S572.1 Droplet Size Classification; American Society of Agricultural and Biological Engineers: St. Joseph, MI, USA, 2017; p. 8. [Google Scholar]
  24. United States Department of Agriculture (USDA). Specialty Crops Program; United States Department of Agriculture: Washington, DC, USA, 2024. [Google Scholar]
  25. Corteva Agriscience. Intrepid® 2F Insecticide—EPA Reg. No. 62719-442; United States Environmental Protection Agency: Washington, DC, USA, 2023. [Google Scholar]
  26. United Phosphorus, Inc. (UPL). Assail® 30SG Insecticide—EPA Reg. No. 8033-36-70506; United States Environmental Protection Agency: Washington, DC, USA, 2023. [Google Scholar]
  27. Bayer CropScience LP. Luna Sensation® Fungicide—EPA Reg. No. 264-1066; United States Environmental Protection Agency: Washington, DC, USA, 2023. [Google Scholar]
  28. Syngenta Crop Protection, LLC. Quadris® Flowable Fungicide—EPA Reg. No. 100-1098; United States Environmental Protection Agency: Washington, DC, USA, 2023. [Google Scholar]
  29. United States Environmental Protection Agency (EPA). Pesticide Regulation (PR) Notice 93-02: Waiver of Crop Field Trial Data for Aerial Applications; U.S. Environmental Protection Agency, Office of Pesticide Programs: Washington, DC, USA, 1993. [Google Scholar]
  30. Martin, D.E.; Latheef, M.A. Payload Capacities of Remotely Piloted Aerial Application Systems Affect Spray Pattern and Effective Swath. Drones 2022, 6, 205. [Google Scholar] [CrossRef]
  31. Fritz, B.K.; Martin, D.E. Measurement and Analysis Methods for Determination of Effective Swath Width from Unmanned Aerial Vehicles. In Pesticide Formulation and Delivery Systems: 40th Volume, Formulation, Application, and Adjuvant Innovation; Elsik, C.M., Ed.; ASTM International: West Conshohocken, PA, USA, 2020; pp. 62–85. [Google Scholar]
  32. Houston, T. Optimization of Nozzle, Application Height, and Speed for UASS Pesticide Applications. Master’s Thesis, University of Nebraska-Lincoln, Lincoln, NE, USA, 2022. [Google Scholar]
  33. Zhu, H.; Salyani, M.; Fox, R.D. A Portable Scanning System for Evaluation of Spray Deposit Distribution. Comput. Electron. Agric. 2011, 76, 38–43. [Google Scholar] [CrossRef]
  34. Gill, M. AccuStain Software User Guide; University of Illinois at Urbana-Champaign: Champaign, IL, USA, 2020. [Google Scholar]
  35. Kannan, N.; Martin, D.; Srinivasan, R.; Zhang, W. Adjuvants for Drone-Based Aerial Chemical Applications to Mitigate Off-Target Drift. Drones 2024, 8, 667. [Google Scholar] [CrossRef]
  36. Kannan, N.; Read, Q.; Zhang, W. An Algae-Based Polymer Material as a Pesticide Adjuvant for Mitigating off-Target Drift. Heliyon 2024, 10, e35510. [Google Scholar] [CrossRef]
  37. Lv, M.; Xiao, S.; Yu, T.; He, Y. Influence of UAV Flight Speed on Droplet Deposition Characteristics with the Application of Infrared Thermal Imaging. Int. J. Agric. Biol. Eng. 2019, 12, 10–17. [Google Scholar] [CrossRef]
  38. Lodwik, D.; Pietrzyk, J.; Malesa, W. Analysis of Volume Distribution and Evaluation of the Spraying Spectrum in Terms of Spraying Quality. Appl. Sci. 2020, 10, 2395. [Google Scholar] [CrossRef]
  39. Teske, M.E.; Wachspress, D.A.; Thistle, H.W. Prediction of Aerial Spray Release from UAVs. Trans. ASABE 2018, 61, 909–918. [Google Scholar] [CrossRef]
  40. Chen, P.; Douzals, J.P.; Lan, Y.; Cotteux, E.; Delpuech, X.; Pouxviel, G.; Zhan, Y. Characteristics of Unmanned Aerial Spraying Systems and Related Spray Drift: A Review. Front. Plant Sci. 2022, 13, 870956. [Google Scholar] [CrossRef] [PubMed]
  41. Ribeiro, L.F.O.; Vitória, E.L.D.; Soprani Júnior, G.G.; Chen, P.; Lan, Y. Impact of Operational Parameters on Droplet Distribution Using an Unmanned Aerial Vehicle in a Papaya Orchard. Agronomy 2023, 13, 1138. [Google Scholar] [CrossRef]
  42. Guo, S.; Li, J.; Yao, W.; Zhan, Y.; Li, Y.; Shi, Y. Distribution Characteristics on Droplet Deposition of Wind Field Vortex Formed by Multi-Rotor UAV. PLoS ONE 2019, 14, e0220024. [Google Scholar] [CrossRef]
  43. Bryant, J.E.; Yendol, W.G. Evaluation of the Influence of Droplet Size and Density of Bacillus Thuringiensis Against Gypsy Moth Larvae (Lepidoptera: Lymantriidae). J. Econ. Entomol. 1988, 81, 130–134. [Google Scholar] [CrossRef]
  44. Wang, B.; Zhang, Y.; Wang, C.; Teng, G. Droplet Deposition Distribution Prediction Method for a Six-Rotor Plant Protection UAV Based on Inverse Distance Weighting. Sensors 2022, 22, 7425. [Google Scholar] [CrossRef]
  45. Shan, C.; Wang, G.; Wang, H.; Xie, Y.; Wang, H.; Wang, S.; Chen, S.; Lan, Y. Effects of Droplet Size and Spray Volume Parameters on Droplet Deposition of Wheat Herbicide Application by Using UAV. Int. J. Agric. Biol. Eng. 2021, 14, 74–81. [Google Scholar] [CrossRef]
  46. Chaim, A.; Neto, J.C.; Gattaz, N.C. Programa de Análise de Deposição de Agrotóxicos; Brazilian Health Regulatory Agency: Brasília, Brazil, 2023. [Google Scholar]
  47. Ghafoor, A.; Khan, F.A.; Khorsandi, F.; Khan, M.A.; Nauman, H.M.; Farid, M.U. Development and Evaluation of a Prototype Self-Propelled Crop Sprayer for Agricultural Sustainability in Small Farms. Sustainability 2022, 14, 9204. [Google Scholar] [CrossRef]
  48. Khan, F.A.; Ghafoor, A.; Khan, M.A.; Umer Chattha, M.; Kouhanestani, F.K. Parameter Optimization of Newly Developed Self-Propelled Variable Height Crop Sprayer Using Response Surface Methodology (RSM) Approach. Agriculture 2022, 12, 408. [Google Scholar] [CrossRef]
  49. Kjær, C.; Bruus, M.; Bossi, R.; Løfstrøm, P.; Andersen, H.V.; Nuyttens, D.; Larsen, S.E. Pesticide Drift Deposition in Hedgerows from Multiple Spray Swaths. J. Pestic. Sci. 2014, 39, 14–21. [Google Scholar] [CrossRef]
  50. Pereira, R.B.; de Moura, A.P.; Pinheiro, J.B. Tecnologia de Aplicação de Agrotóxicos Em Cultivo Protegido de Tomate e Pimentão; Embrapa Hortaliças: Brasília, Brazil, 2015. [Google Scholar]
  51. Chen, S.; Lan, Y.; Zhou, Z.; Ouyang, F.; Wang, G.; Huang, X.; Deng, X.; Cheng, S. Effect of Droplet Size Parameters on Droplet Deposition and Drift of Aerial Spraying by Using Plant Protection UAV. Agronomy 2020, 10, 195. [Google Scholar] [CrossRef]
  52. Yu, S.-H.; Kim, Y.-K.; Jun, H.-J.; Choi, I.S.; Woo, J.-K.; Kim, Y.-H.; Yun, Y.-T.; Choi, Y.; Alidoost, R.; Lee, J. Evaluation of Spray Characteristics of Pesticide Injection System in Agricultural Drones. J. Biosyst. Eng. 2020, 45, 272–280. [Google Scholar] [CrossRef]
  53. Zhou, Q.; Xue, X.Y.; Qin, W.C.; Cai, C.; Zhou, L.F. Optimization and Test for Structural Parameters of UAV Spraying Rotary Cup Atomizer. Int. J. Agric. Biol. Eng. 2017, 10, 78–86. [Google Scholar] [CrossRef]
  54. Jackiw, I.M.; Ashgriz, N. On Aerodynamic Droplet Breakup. J. Fluid Mech. 2021, 913, A33. [Google Scholar] [CrossRef]
  55. New, T.H.; Teo, Z.W.; Li, S.; Ong, Z.A.; Nagel, B. Flow Structures and Aerodynamic Behavior of a Small-Scale Joined-Wing Aerial Vehicle under Subsonic Conditions. Aerospace 2023, 10, 661. [Google Scholar] [CrossRef]
  56. Qing, T.; Ruirui, Z.; Liping, C.; Min, X.; Tongchuan, Y.; Bin, Z. Droplets Movement and Deposition of an Eight-Rotor Agricultural UAV in Downwash Flow Field. Int. J. Agric. Biol. Eng. 2017, 10, 47–56. [Google Scholar]
  57. Grift, T.E.; Walker, J.T.; Gardisser, D.R. Spread Pattern Analysis Tool (SPAT): II. Examples of Aircraft Pattern Analysis. Trans. ASAE 2000, 43, 1351–1362. [Google Scholar] [CrossRef]
  58. Carpenter, T.G.; Reichard, D.L.; Khan, A.S. Spray Deposition from a Row-Crop Airblast Sprayer. Trans. ASAE 1983, 26, 338–342. [Google Scholar] [CrossRef]
  59. Smith, D.B.; Oakley, D.; Williams, E.; Kirkpatrick, A. Broadcast Spray Deposits from Fan Nozzles. Appl. Eng. Agric. 2000, 16, 109–113. [Google Scholar] [CrossRef]
  60. Kim, C.J.; Yuan, X.; Kim, M.; Kyung, K.S.; Noh, H.H. Monitoring and Risk Analysis of Residual Pesticides Drifted by Unmanned Aerial Spraying. Sci. Rep. 2023, 13, 10834. [Google Scholar] [CrossRef]
  61. Qin, W.-C.; Qiu, B.-J.; Xue, X.-Y.; Chen, C.; Xu, Z.-F.; Zhou, Q.-Q. Droplet Deposition and Control Effect of Insecticides Sprayed with an Unmanned Aerial Vehicle against Plant Hoppers. Crop Prot. 2016, 85, 79–88. [Google Scholar] [CrossRef]
  62. Richardson, B.; Rolando, C.A.; Somchit, C.; Dunker, C.; Strand, T.M.; Kimberley, M.O. Swath Pattern Analysis from a Multi-Rotor Unmanned Aerial Vehicle Configured for Pesticide Application. Pest Manag. Sci. 2020, 76, 1282–1290. [Google Scholar] [CrossRef] [PubMed]
  63. Shilin, W.; Jianli, S.; Xiongkui, H.; Le, S.; Xiaonan, W.; Changling, W.; Zhichong, W.; Yun, L. Performances Evaluation of Four Typical Unmanned Aerial Vehicles Used for Pesticide Application in China. Int. J. Agric. Biol. Eng. 2017, 10, 22–31. [Google Scholar] [CrossRef]
  64. Zhang, Y.; Zhou, Z.; Wang, K.; Li, X. Aerodynamic Characteristics of Different Airfoils under Varied Turbulence Intensities at Low Reynolds Numbers. Appl. Sci. 2020, 10, 1706. [Google Scholar] [CrossRef]
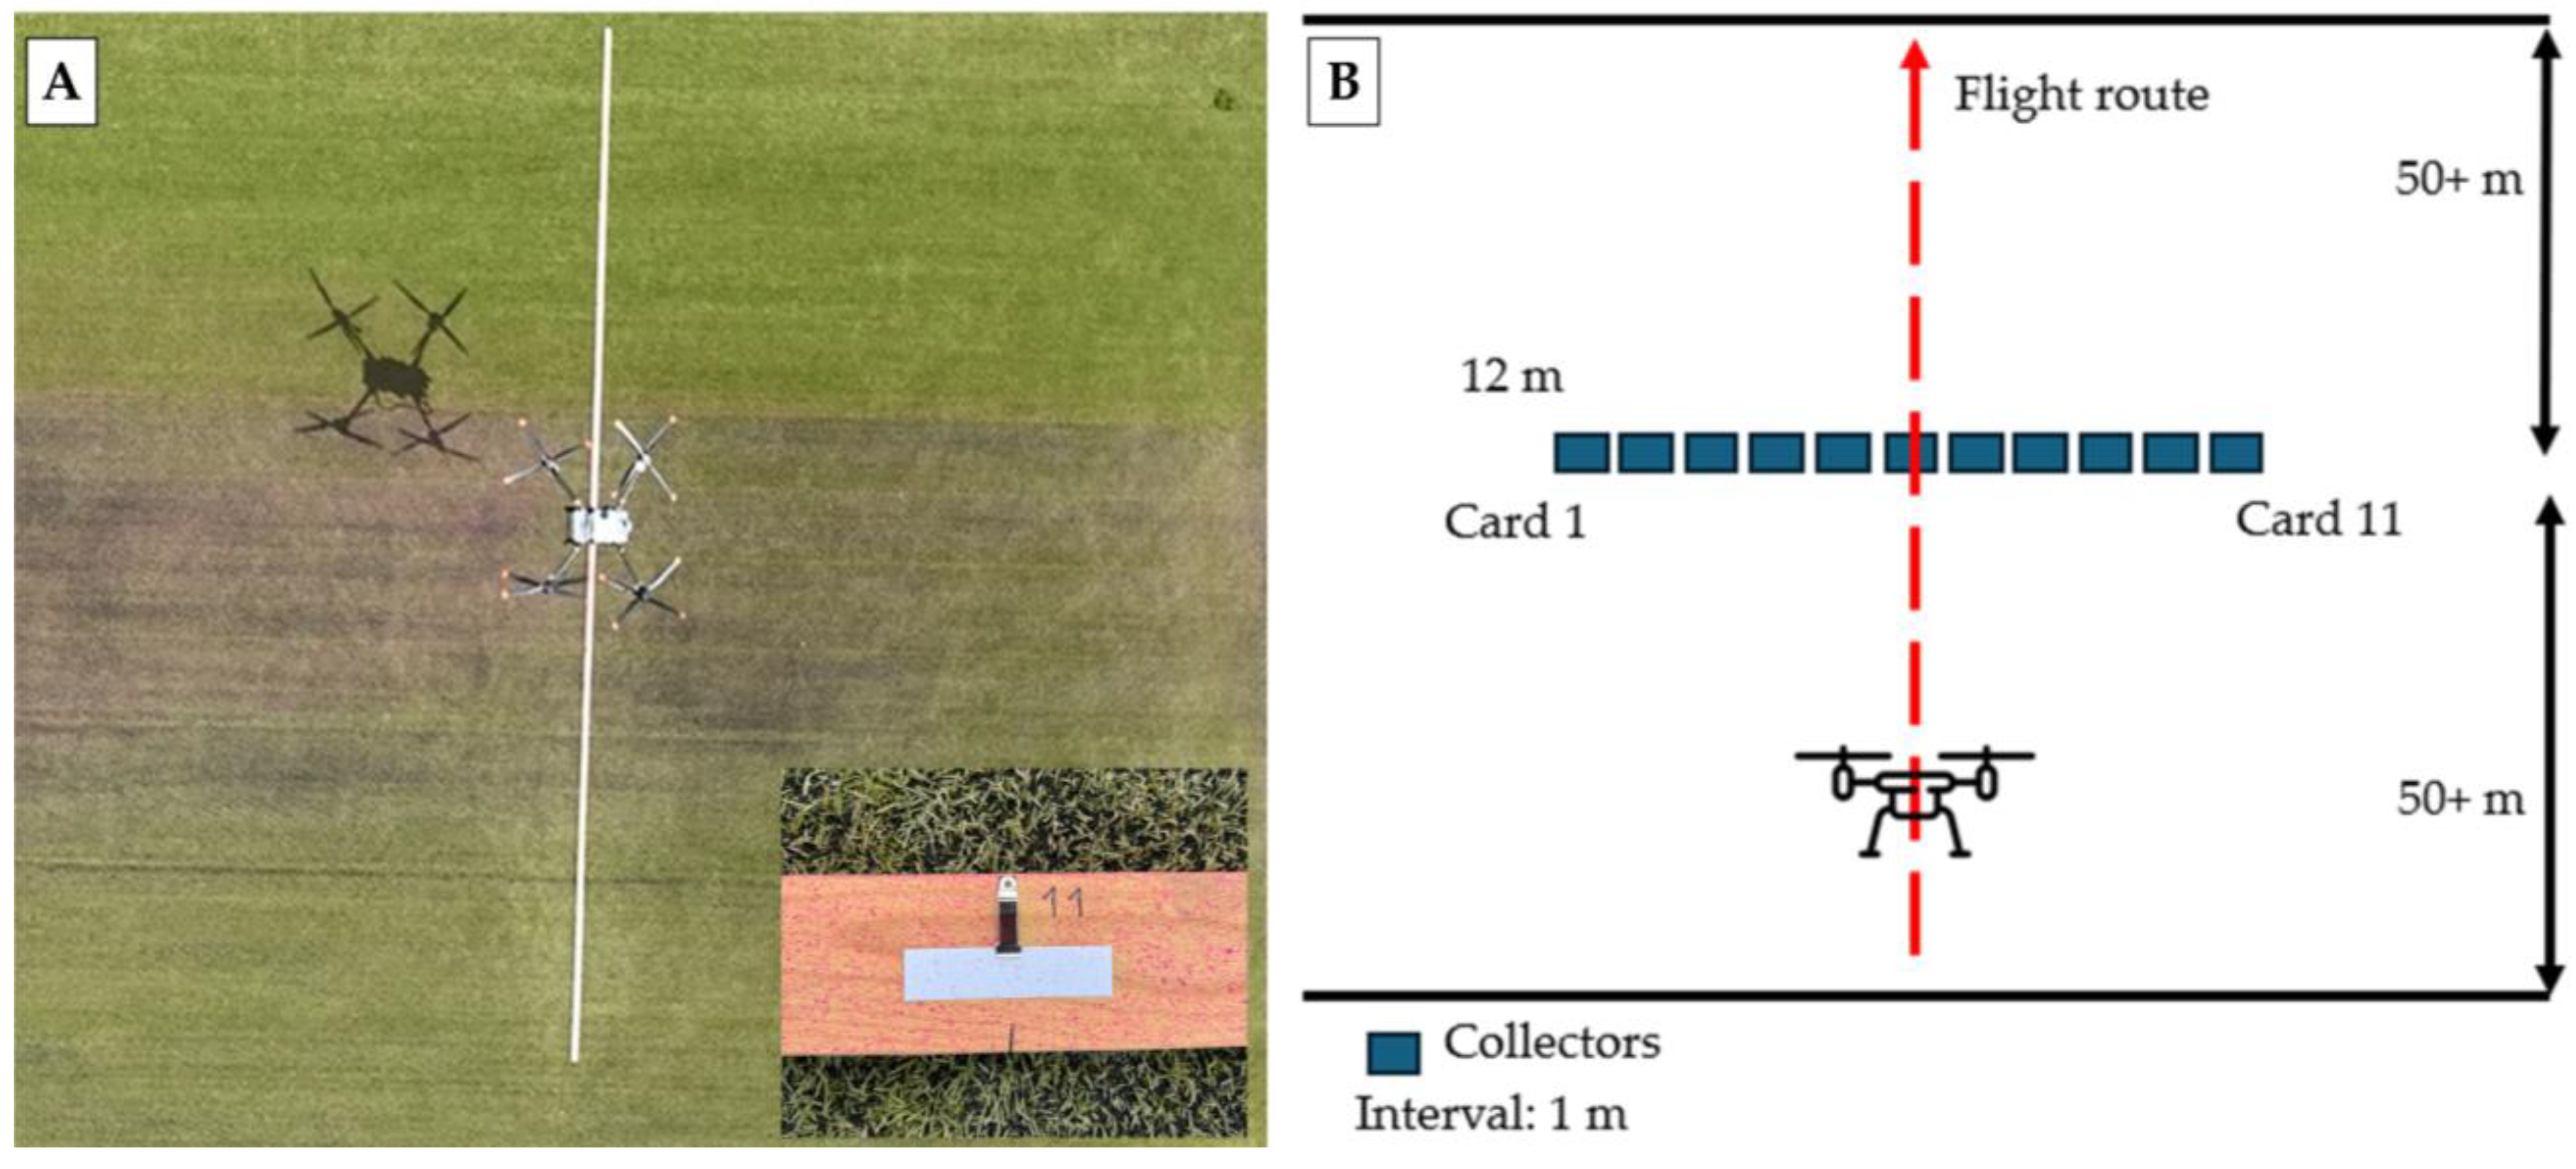
Figure 1. Experimental setup evaluating spray deposition using an unmanned aerial application system (UAAS). Overhead view of the UAAS flying over a synthetic grass surface, passing directly above a sample line; the inset shows a close-up of a collection card (i.e., Kromekote paper) placed on the sampling board (A). Schematic representation of the experimental layout, where 11 collection cards were placed at 1 m intervals across a 12 m wide sampling transect perpendicular to the flight path (B).
Drones 09 00461 g001
Figure 2. Linear regression models for the effect of flight speed and droplet size on droplet density. The solid orange line represents the fitted regression model, the shaded orange region indicates the 95% confidence interval (CI), and the shaded blue region represents the 95% prediction interval (PI).
Drones 09 00461 g002
Figure 3. Main effect of flight speed and droplet size on the relative span factor.
Drones 09 00461 g003
Figure 4. Effect of droplet sizes within flight speed (A) and flight speed within droplet size (B) for the effect swath width.
Drones 09 00461 g004
Table 1. Meteorological conditions recorded during the test periods.
Meteorological Parameters19-April25-April
Wind Speed (m/s)0.98 ± 0.200.90 ± 0.28
Temperature (°C)25.2 ± 1.0624.6 ± 1.95
Relative Humidity (%)61.9 ± 4.7660.0 ± 6.89
Table 2. Treatments used in the study, consisting of three flight speeds (4, 7, and 10 m/s), three droplet sizes (150, 250, and 350 µm), and two application volumes (18.75 and 28.10 L/ha), totaling eighteen treatments.
TreatmentFlight Speed (m/s)Droplet Size (µm)Application Volume (L/ha)
1415018.75
2415028.10
3425018.75
4425028.10
5435018.75
6435028.10
7715018.75
8715028.10
9725018.75
10725028.10
11735018.75
12735028.10
131015018.75
141015028.10
151025018.75
161025028.10
171035018.75
181035028.10
Table 3. Main effects and interactions of flight speed, droplet size, and application volume on coverage, droplet density, Dv0.1, Dv0.5, Dv0.9, relative span factor (RSF), and effective swath.
EffectsCoverage
(%)
Droplet Density
(drops/cm2)
Dv0.1
(µm)
Dv0.5
(µm)
Dv0.9
(µm)
RSFEffective Swath
(m)
Flight Speed******nsns****
Droplet Sizens**********ns
Application Volume**ns******nsns
FS 1 × DS 2nsnsnsns**ns*
FS × AV 3**ns******nsns
DS × AVnsnsnsnsnsnsns
FS × DS × AVnsnsnsnsnsnsns
ns = nonsignificant; * = significant at p ≤ 0.05; ** = significant at p ≤ 0.01. 1 “FS” denotes flight speed. 2 “DS” denotes droplet size. 3 “AV” denotes application volume.
Table 4. Effect of the interaction between flight speed and application volume on spray coverage.
Flight Speed (m/s)Application Volume (L/ha)
18.7528.10
Spray Coverage (%)
45.54 ± 0.41 B 8.51 ± 0.52 A
74.13 ± 0.32 B 5.37 ± 0.27 A
103.48 ± 0.22 A 3.27 ± 0.22 A
Regression Y = 6.77 − 0.34x (p < 0.0001)
Adj. R2 = 0.36
Y = 11.83 − 0.87x (p < 0.0001)
Adj. R2 = 0.75
Values followed by different letters indicate significant difference (p ≤ 0.05) between application volume treatments (columns) within flight speed treatments (rows). Regressions for the effect of flight speed treatments (rows) within application volume treatments (columns).
Table 5. Significant main effect and interactions of flight speed, application volume, and droplet size on Dv0.1, Dv0.5, and Dv0.9.
Dv0.1
Flight Speed (m/s)Application Volume (L/ha)
18.7528.10
4174.58 ± 5.97 B 192.00 ± 5.61 A
7182.25 ± 7.95 B194.67 ± 6.97 A
10194.33 ± 8.27 A191.08 ± 6.65 A
Regression Y = 160.68 + 3.29x
(p = 0.06) Adj. R2 = 0.09
Y = 193.65 − 0.15x
(p = 0.91) Adj. R2 = 0.0003
Droplet Size (µm)Dv0.1
150161.62 ± 2.20
250189.71 ± 2.73
350213.12 ± 2.58
RegressionY = 123.77 + 0.25x
(p < 0.0001) Adj. R2 = 0.75
Dv0.5
Flight Speed (m/s)Application Volume (L/ha)
18.7528.10
4306.17 ± 9.25 B339.67 ± 9.98 A
7308.83 ± 11.48 B344.17 ± 11.37 A
10330.67 ± 12.95 A323.17 ± 11.54 A
RegressionY = 286.63 + 4.08x
(p = 0.1327) Adj. R2 = 0.06
Y = 354.91 − 2.75x
(p = 0.2950) Adj. R2 = 0.03
Droplet Size (µm)Dv0.5
150282.17 ± 3.84
250325.96 ± 4.01
350368.21 ± 3.71
RegressionY = 217.89 + 0.43x
(p < 0.0001) Adj. R2 = 0.78
Dv0.9
Flight Speed (m/s)Application Volume (L/ha)
18.7528.10
4463.92 ± 9.76 B507.58 ± 9.86 A
7464.92 ± 14.67 B522.58 ± 17.28 A
10479.92 ± 16.69 A482.92 ± 18.05 A
RegressionY = 450.91 + 2.66x
(p = 0.41) Adj. R2 = 0.01
Y = 533.13 − 4.11x
(p = 0.27) Adj. R2 = 0.03
Dv0.9
Flight Speed (m/s)Droplet Size (µm)
150250350Regression
4449.12 ± 10.30485.13 ± 8.31523.00 ± 9.63Y = 393.40 + 0.36x (p < 0.0001)
Adj. R2 = 0.59
7429.88 ± 12.75502.75 ± 14.46548.62 ± 13.12Y = 345.31 + 0.59x (p < 0.0001)
Adj. R2 = 0.64
10413.75 ± 5.77484.87 ± 9.21545.62 ± 7.94Y = 316.57 + 0.65x (p < 0.0001)
Adj. R2 = 0.87
RegressionY = 472.18 − 5.89x
(p = 0.01) Adj. R2 = 0.22
nsns
Values followed by different letters indicate significant difference (p ≤ 0.05) between column treatments within row treatments. Regressions for the effect of row treatments within column treatments, or column treatments within row treatments. ns denotes no significance.
Disclaimer/Publisher’s Note: The statements, opinions and data contained in all publications are solely those of the individual author(s) and contributor(s) and not of MDPI and/or the editor(s). MDPI and/or the editor(s) disclaim responsibility for any injury to people or property resulting from any ideas, methods, instructions or products referred to in the content.