Article

A Deep Learning-Based Trajectory and Collision Prediction Framework for Safe Urban Air Mobility

1
Aerospace Technology Research Institute, Korean Air, 461-1 Jeonmin-dong, Yuseong-gu, Daejeon 34028, Republic of Korea
2
Department of Computer Science & Engineering, Chungnam National University, 99 Daehak-ro, Yuseong-gu, Daejeon 305-764, Republic of Korea
*
Author to whom correspondence should be addressed.
These authors contributed equally to this work.
Drones 2025, 9(7), 460; https://doi.org/10.3390/drones9070460
Submission received: 12 May 2025 / Revised: 17 June 2025 / Accepted: 25 June 2025 / Published: 26 June 2025
(This article belongs to the Special Issue Urban Air Mobility Solutions: UAVs for Smarter Cities)

Abstract

As urban air mobility moves rapidly toward real-world deployment, accurate vehicle trajectory prediction and early collision risk detection are vital for safe low-altitude operations. This study presents a deep learning framework based on an LSTM–Attention network that captures both short-term flight dynamics and long-range dependencies in trajectory data. The model is trained on fifty-six routes generated from a UAM planned commercialization network, sampled at 0.1 s intervals. To unify spatial dimensions, the model uses Earth-Centered Earth-Fixed (ECEF) coordinates, enabling efficient Euclidean distance calculations. The trajectory prediction component achieves an RMSE of 0.2172, MAE of 0.1668, and MSE of 0.0524. The collision classification module built on the LSTM–Attention prediction backbone delivers an accuracy of 0.9881. Analysis of attention weight distributions reveals which temporal segments most influence model outputs, enhancing interpretability and guiding future refinements. Moreover, this model is embedded within the Short-Term Conflict Alert component of the Safety Nets module in the UAM traffic management system to provide continuous trajectory prediction and collision risk assessment, supporting proactive traffic control. The system exhibits robust generalizability on unseen scenarios and offers a scalable foundation for enhancing operational safety. Validation currently excludes environmental disturbances such as wind, physical obstacles, and real-world flight logs. Future work will incorporate atmospheric variability, sensor and communication uncertainties, and obstacle detection inputs to advance toward a fully integrated traffic management solution with comprehensive situational awareness.

1. Introduction

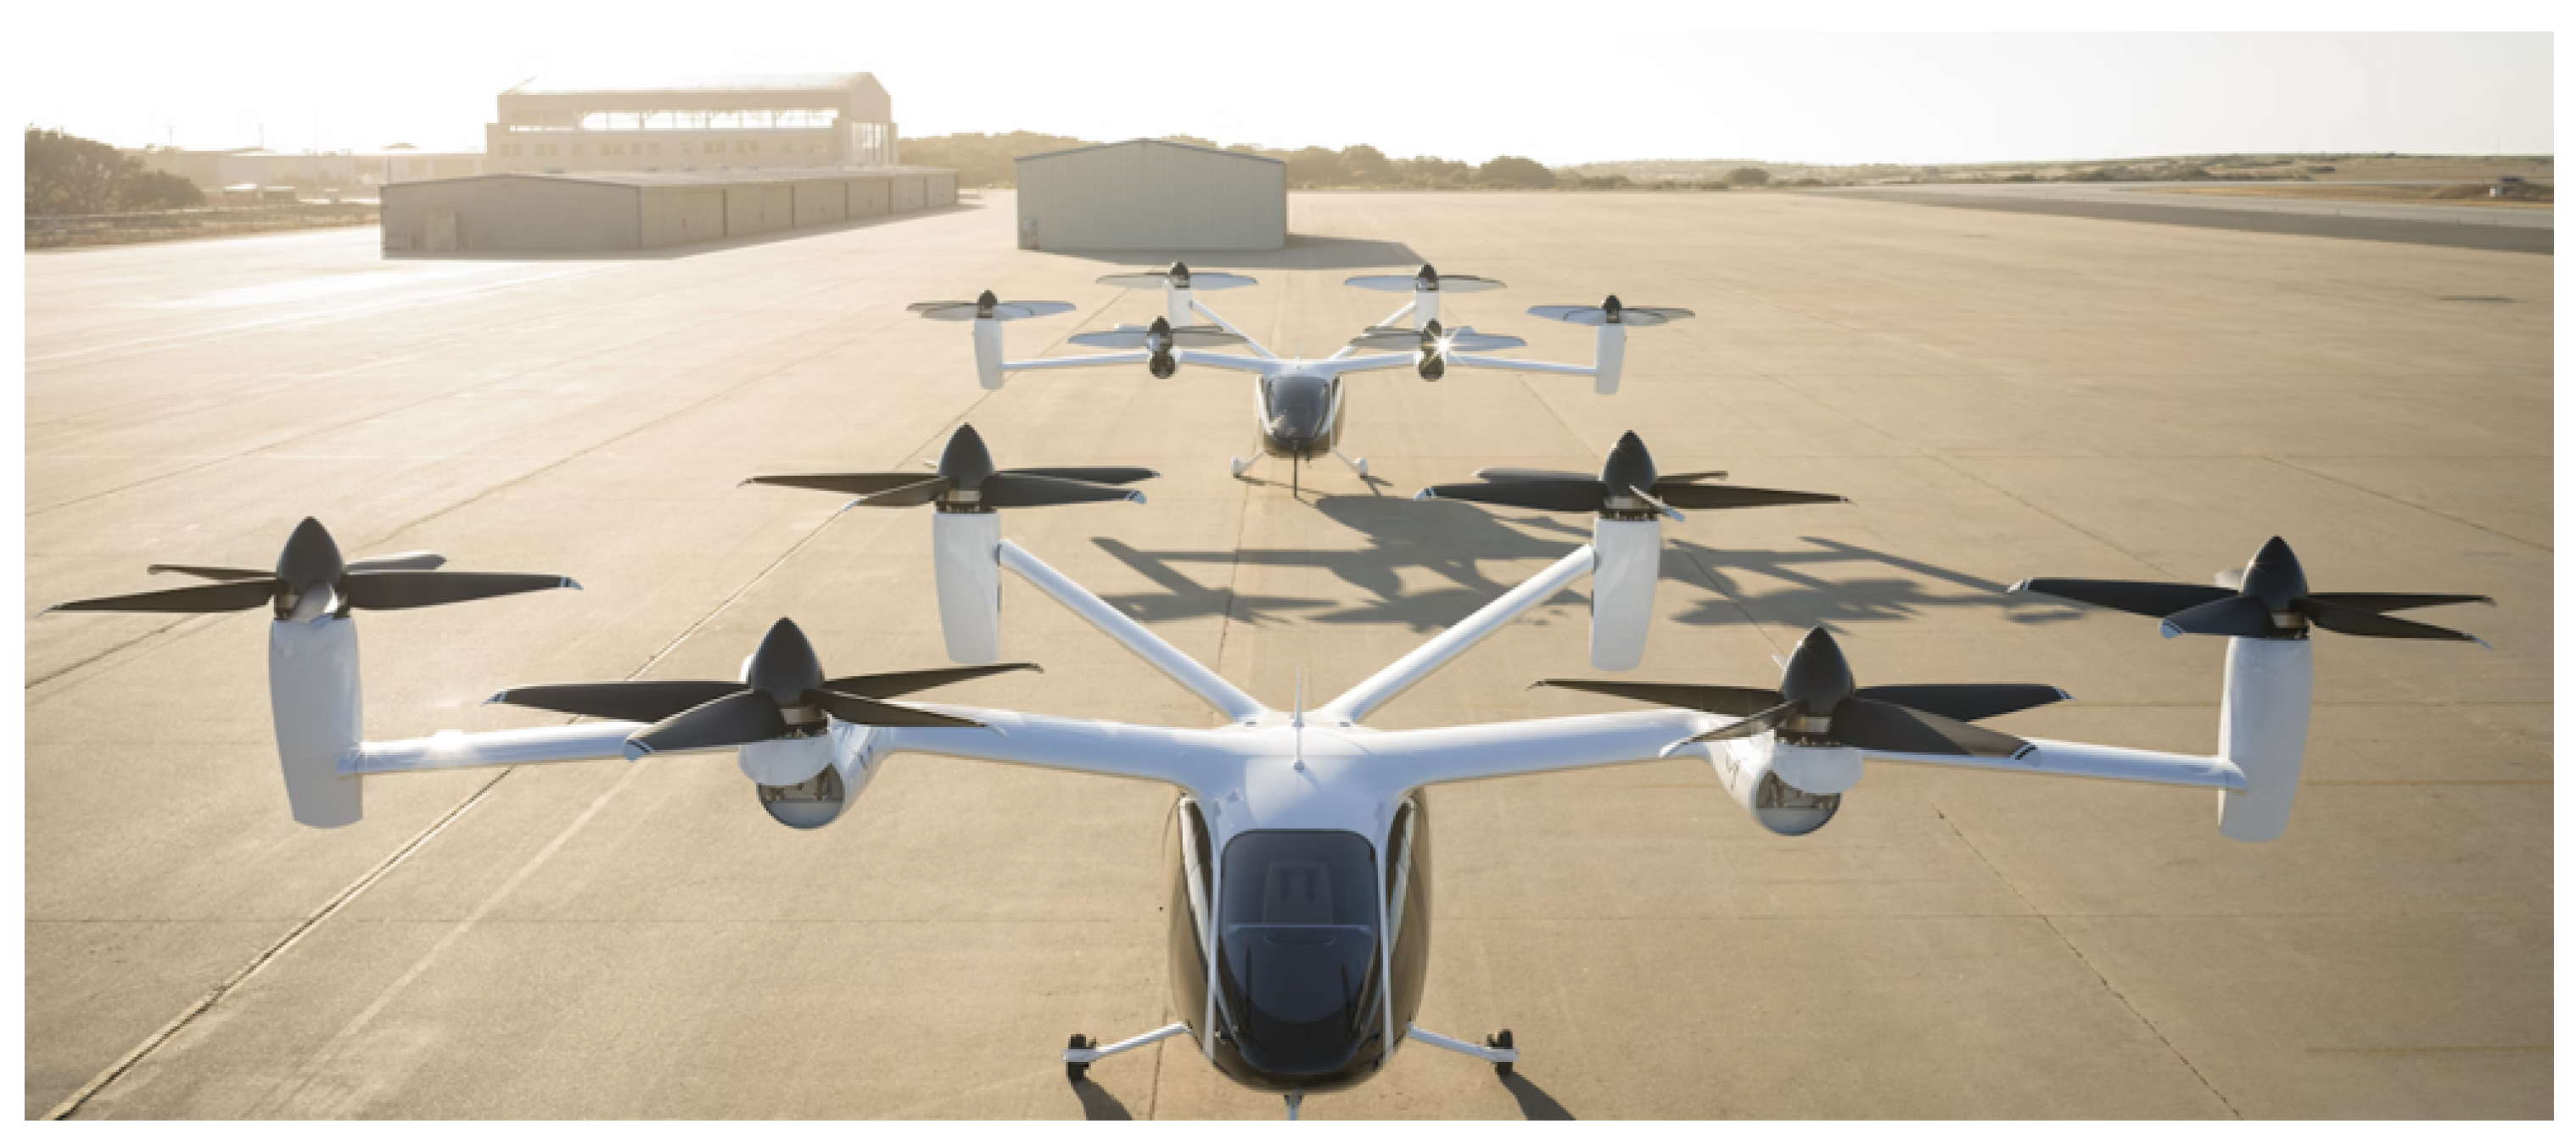
1.1. Urban Air Mobility Trajectory Prediction: Background and Importance

The concept of urban air mobility (UAM), depicted in Figure 1, refers to an emerging air transportation system that utilizes environmentally friendly electric vertical takeoff and landing (eVTOL) aircraft for passenger and cargo transport at low altitudes across dense urban centers and surrounding metropolitan regions. These aircraft feature innovative designs that integrate electric propulsion and vertical takeoff and landing capabilities. Consequently, UAM is positioned as a transformative transport solution for future megacities, significantly reducing emissions and noise compared to traditional transportation modes [1].
Urban traffic congestion considerably diminishes the quality of urban life and results in substantial economic costs. UAM has been proposed as a novel alternative capable of overcoming the constraints of existing ground-based transportation infrastructures, thereby facilitating more efficient urban mobility. By utilizing aerial routes, UAM effectively bypasses congested road networks, substantially reducing travel time, a benefit especially pronounced in densely populated urban regions. For instance, implementing a UAM system connecting Seoul Station and Incheon International Airport could substantially alleviate traffic congestion and result in considerable time savings [2].
Unlike roads and railways, UAM systems remain largely unaffected by congestion or accidents, rendering them exceptionally well suited to emergency rescue operations, urgent scheduling, and rapid-response missions; their direct aerial routing overcomes geographical barriers, enhances access to remote or hard-to-reach locations, and significantly improves the efficiency of medical services. Since Uber’s 2016 “Elevate” white paper galvanized global interest and provided foundational safety and economic guidelines, eVTOL development has accelerated across industry and academia. NASA now spearheads efforts to establish a comprehensive UAM ecosystem, identifying airport-to-urban shuttle services as a prime initial market, devising hierarchical mission-level decision frameworks for unexpected operational scenarios and exploring the integration of machine learning into safety-critical system management [3]. Analysts forecast that the UAM market will expand at approximately 30 percent per annum, potentially reaching a total value of USD 1.5 trillion by 2040; key public companies such as Vertical Aerospace, Archer, Lilium and Joby Aviation have already demonstrated test flights and early service deployments, with Joby notably accelerating commercialization through its acquisition of Uber’s Elevate division.
Figure 1. Conception of urban air mobility [4].
Drones 09 00460 g001

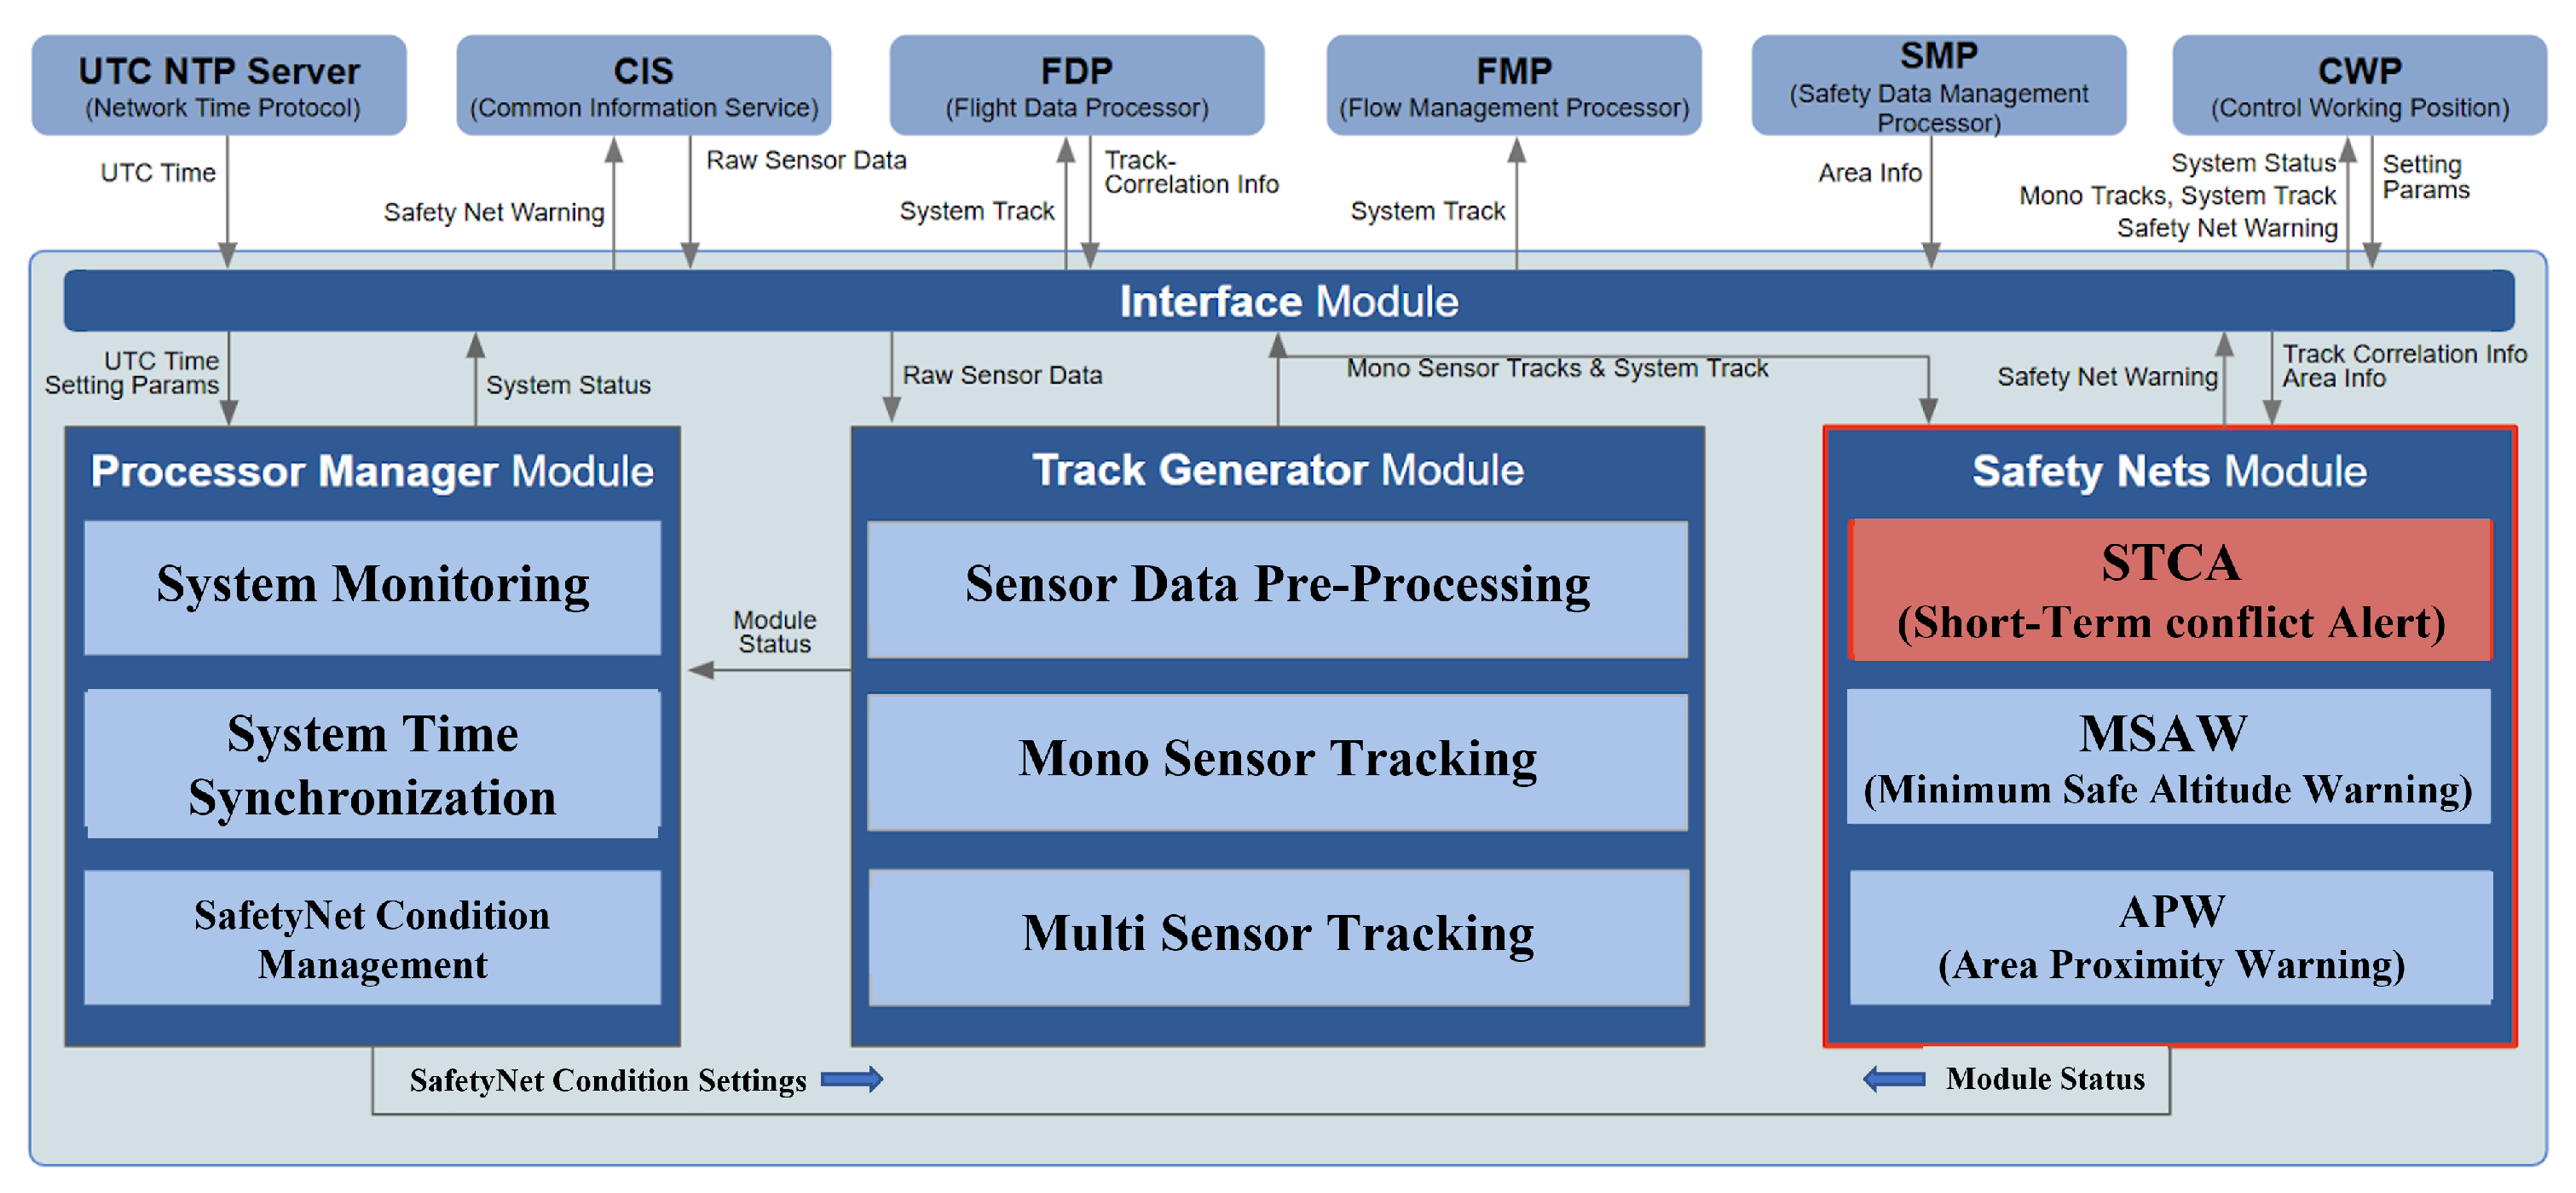
1.2. Integration of Deep Learning-Based Trajectory and Collision Prediction into Short Term Conflict Alert Module

The trajectory prediction and collision assessment model based on deep learning proposed in this paper is embedded within the Short-Term Conflict Alert (STCA) component of the Safety Nets module, as designed by Korean Air. The Surveillance Data Processor (SDP), illustrated in Figure 2, uses a deep neural network to predict each UAM vehicle’s flight path in real time after ingesting fused surveillance tracks from the Common Information Service and sensors both on board and on the ground. A collision prediction algorithm is then executed. For rapid operational response, STCA categorizes these predicted trajectories and collision alerts into one of four levels: Safe, Caution, Warning, or Collision. The resulting alerts are routed seamlessly to ground-based air traffic control systems or to an Unmanned Traffic Management interface for autonomous operations. By integrating trajectory prediction and collision assessment for multiple aircraft directly within STCA, the proposed framework markedly enhances the safety, responsiveness, and scalability of urban air mobility traffic management.
The forthcoming commercialization of urban air mobility will entail a dramatic increase in aircraft density at low altitudes, where the environment of urban corridors is highly dynamic and full of obstacles such as high buildings and complex ground infrastructure. Conventional static rule-based avoidance schemes are therefore inadequate. Ground-based air traffic control frameworks, optimized for sparse high-altitude traffic and relying primarily on predefined coordination protocols, lack the scalability and responsiveness required to manage the complexity of dense low-altitude UAM operations [5]. This discrepancy underscores the urgent need for autonomous learning-based conflict management systems tailored to the unique demands of urban air mobility.
By integrating deep learning-based trajectory and collision prediction at the core of the SDP, the proposed architecture substantially enhances both the safety and operational reliability of urban air operations. Its design ensures full compatibility with prevailing ATC infrastructures, thereby enabling a gradual and secure transition toward next-generation air traffic management paradigms. This framework enables the experimental evaluation of path-based operations for both manned and unmanned eVTOL aircraft within UAM environments and quantitatively analyzes the safety and efficiency of those flight paths. In fulfilling the stringent safety criteria necessary for UAM commercialization, this approach also fosters broader societal acceptance by demonstrating the feasibility of high-density, low-altitude urban airspace operations underpinned by advanced, data-driven conflict management [6].

1.3. Related Work

Trajectory and collision prediction algorithms are essential components for ensuring safe and efficient operations of autonomous systems across diverse applications, including unmanned aerial vehicles, autonomous maritime vessels equipped with automatic identification systems, and the emerging urban air mobility sector. These predictive algorithms typically rely on real-time data provided by broadcast-based sensing technologies, notably automatic dependent surveillance broadcast and automatic identification systems, which continuously deliver updates on vehicle position, velocity, and heading information.
This section presents an extensive review of state-of-the-art deep learning models for trajectory prediction, summarized in Table 1, and collision prediction methodologies, outlined in Table 2, covering autonomous vehicles such as aerial drones and maritime vessels. This review subsequently leads to the formal introduction of the novel collision prediction methodology proposed in this work.

1.3.1. Deep Learning-Based Trajectory Prediction

Accurate three-dimensional trajectory prediction is essential for ensuring safe and efficient operations in urban air mobility systems, which are currently approaching commercialization. Unlike traditional two-dimensional prediction approaches, the comprehensive utilization of latitude, longitude, and altitude data is necessary to fully represent the inherent complexities of three-dimensional urban airspace. Therefore, this study systematically reviews recent deep learning-based research on trajectory prediction methodologies, specifically designed for high-fidelity three-dimensional flight path estimation. These state-of-the-art models are critically evaluated to assess their applicability and effectiveness within realistic operational scenarios typical of emerging UAM environments.
Zhang et al. [7] transformed 3890 s of simulated flight trajectory data into the Earth-Centered Earth-Fixed coordinate system and proposed the AttConvLSTM model. By combining spatial convolutional layers with recurrent temporal dynamics, their architecture achieved a single-step mean absolute error of 2.09 m and maintained predictive accuracy with a mean absolute error of 45.73 m at a 2.5 s prediction horizon. These results highlight the model’s efficacy across short- and intermediate-term predictions.
Zhu et al. [8] utilized a dataset consisting of 39,548 drone trajectory data points, represented within the ECEF coordinate frame, and introduced the quartile regression bidirectional gated recurrent unit deep learning model. Their approach employed quantile regression to explicitly model prediction uncertainties, enabling probabilistic trajectory estimation. Experimental results demonstrated a root mean squared error of 15.65 m at the single-step prediction horizon, increasing to 161.73 m at a 40-s horizon. These results illustrate the potential advantages of probabilistic quantile-based approaches in managing long-range, safety-critical predictions.
Chen et al. [9] advanced the trajectory prediction literature through a hybrid architecture integrating convolutional preprocessing, an LSTM-based core model, and Kalman filtering for prediction refinement. Evaluated on drone trajectory data sampled between 0.1 and 1 s intervals, their method maintained high accuracy through a 3 s prediction horizon, achieving a two-dimensional root mean squared error of 0.1336 m and a vertical axis root mean squared error of 0.0108 m. These findings indicate the strong potential of hybrid architectures for precise trajectory prediction suitable for near-real-time operational applications.

1.3.2. Trajectory Prediction and Collision Detection

Parallel to prediction efforts, numerous studies have sought to integrate trajectory prediction with collision avoidance, frequently relying on classical filtering techniques and geometric risk models. Wu et al. [10] employed linear extrapolation on ADS-B UAV data sampled at 1 Hz for seven targets, utilizing a cylindrical protection zone to flag potential conflicts within a 1 s window. Although computationally efficient, this method offers minimal predictive foresight.
Advancing beyond linear extrapolation, Tong et al. [11] applied a Kalman filter to ADS-B data streams from two UAVs, extending the prediction horizon to 60 steps. Coupling this with a Velocity Obstacle algorithm enabled the real-time assessment of collision risks every second, illustrating how dynamic state estimation enhances decision-making across longer timeframes.
In maritime navigation, Liu et al. [12] trained an LSTM model on AIS sampled data, comprising position, speed, heading, and vessel dimensions. Their model achieved a 98.3% accuracy rate in predicting vessel positions 10 steps ahead and generated collision alerts using a time-weighted positive collision risk (PCR) formula. This demonstrates how deep sequence learning can be effectively applied to slower-moving platforms requiring extended prediction windows.

1.3.3. Limitations of Related Works and Proposal of Deep Learning-Based Trajectory and Collision Prediction System for UAM

Although many existing studies have laid important groundwork for trajectory and collision prediction in aviation and maritime domains, they exhibit several critical limitations when applied to the ultra-dense, three-dimensional urban air mobility environment.
Traditional collision frameworks developed for UAVs and maritime vessels have primarily focused on a limited number of targets, typically involving fewer than ten vehicles, thereby inadequately capturing realistic UAM scenarios, where multiple eVTOL aircraft simultaneously occupy densely populated urban airspaces. Additionally, many existing collision prediction methods rely heavily on deterministic or rule-based techniques, such as fixed geometric zones or Velocity Obstacle algorithms, which fail to accommodate the inherent stochastic variability and complex spatiotemporal patterns of urban flight environments, often resulting in overly conservative or insufficiently safe alerts under dynamic conditions.
Moreover, the prevalent use of Earth-Centered Earth-Fixed (ECEF) coordinates in advanced trajectory prediction models, while beneficial for standardized measurements, introduces local distortion effects, numerical inaccuracies at low altitudes, and increased computational overhead due to necessary conversions back to geodetic coordinates. To date, systematic evaluations or corrections of these local distortions in densely populated urban contexts remain limited.
To address these challenges, this study constructed a large scale, high-fidelity simulated dataset encompassing realistic urban operational conditions, sensor noise, and varied flight patterns. Using this dataset, we propose an integrated deep learning-based system capable of the real-time processing of multi-vehicle kinematic streams, scalable to ten or more simultaneous UAM vehicles. The system incorporates both trajectory prediction and collision risk assessment within a unified neural architecture for joint optimization and introduces local geodetic correction layers to mitigate coordinate distortions. Validation was performed on a comprehensive synthetic dataset containing over 670,000 samples collected from 56 prospective commercial routes, recorded at intervals of 0.1 s with full positional and velocity information.
Section 2 describes the dataset acquisition and preprocessing procedures, the deep learning-based trajectory prediction framework, and the multi-level collision risk assessment algorithms. Section 3 presents experimental results, evaluating the LSTM–Attention model’s prediction accuracy and validating the collision prediction method through detailed case studies. Section 4 offers an analytical discussion, comparing model configurations, interpreting attention map visualizations, and highlighting the study’s contributions to urban air mobility trajectory prediction and collision risk assessment. Section 5 concludes by summarizing practical implications and suggesting directions for future research.

2. Materials and Methods

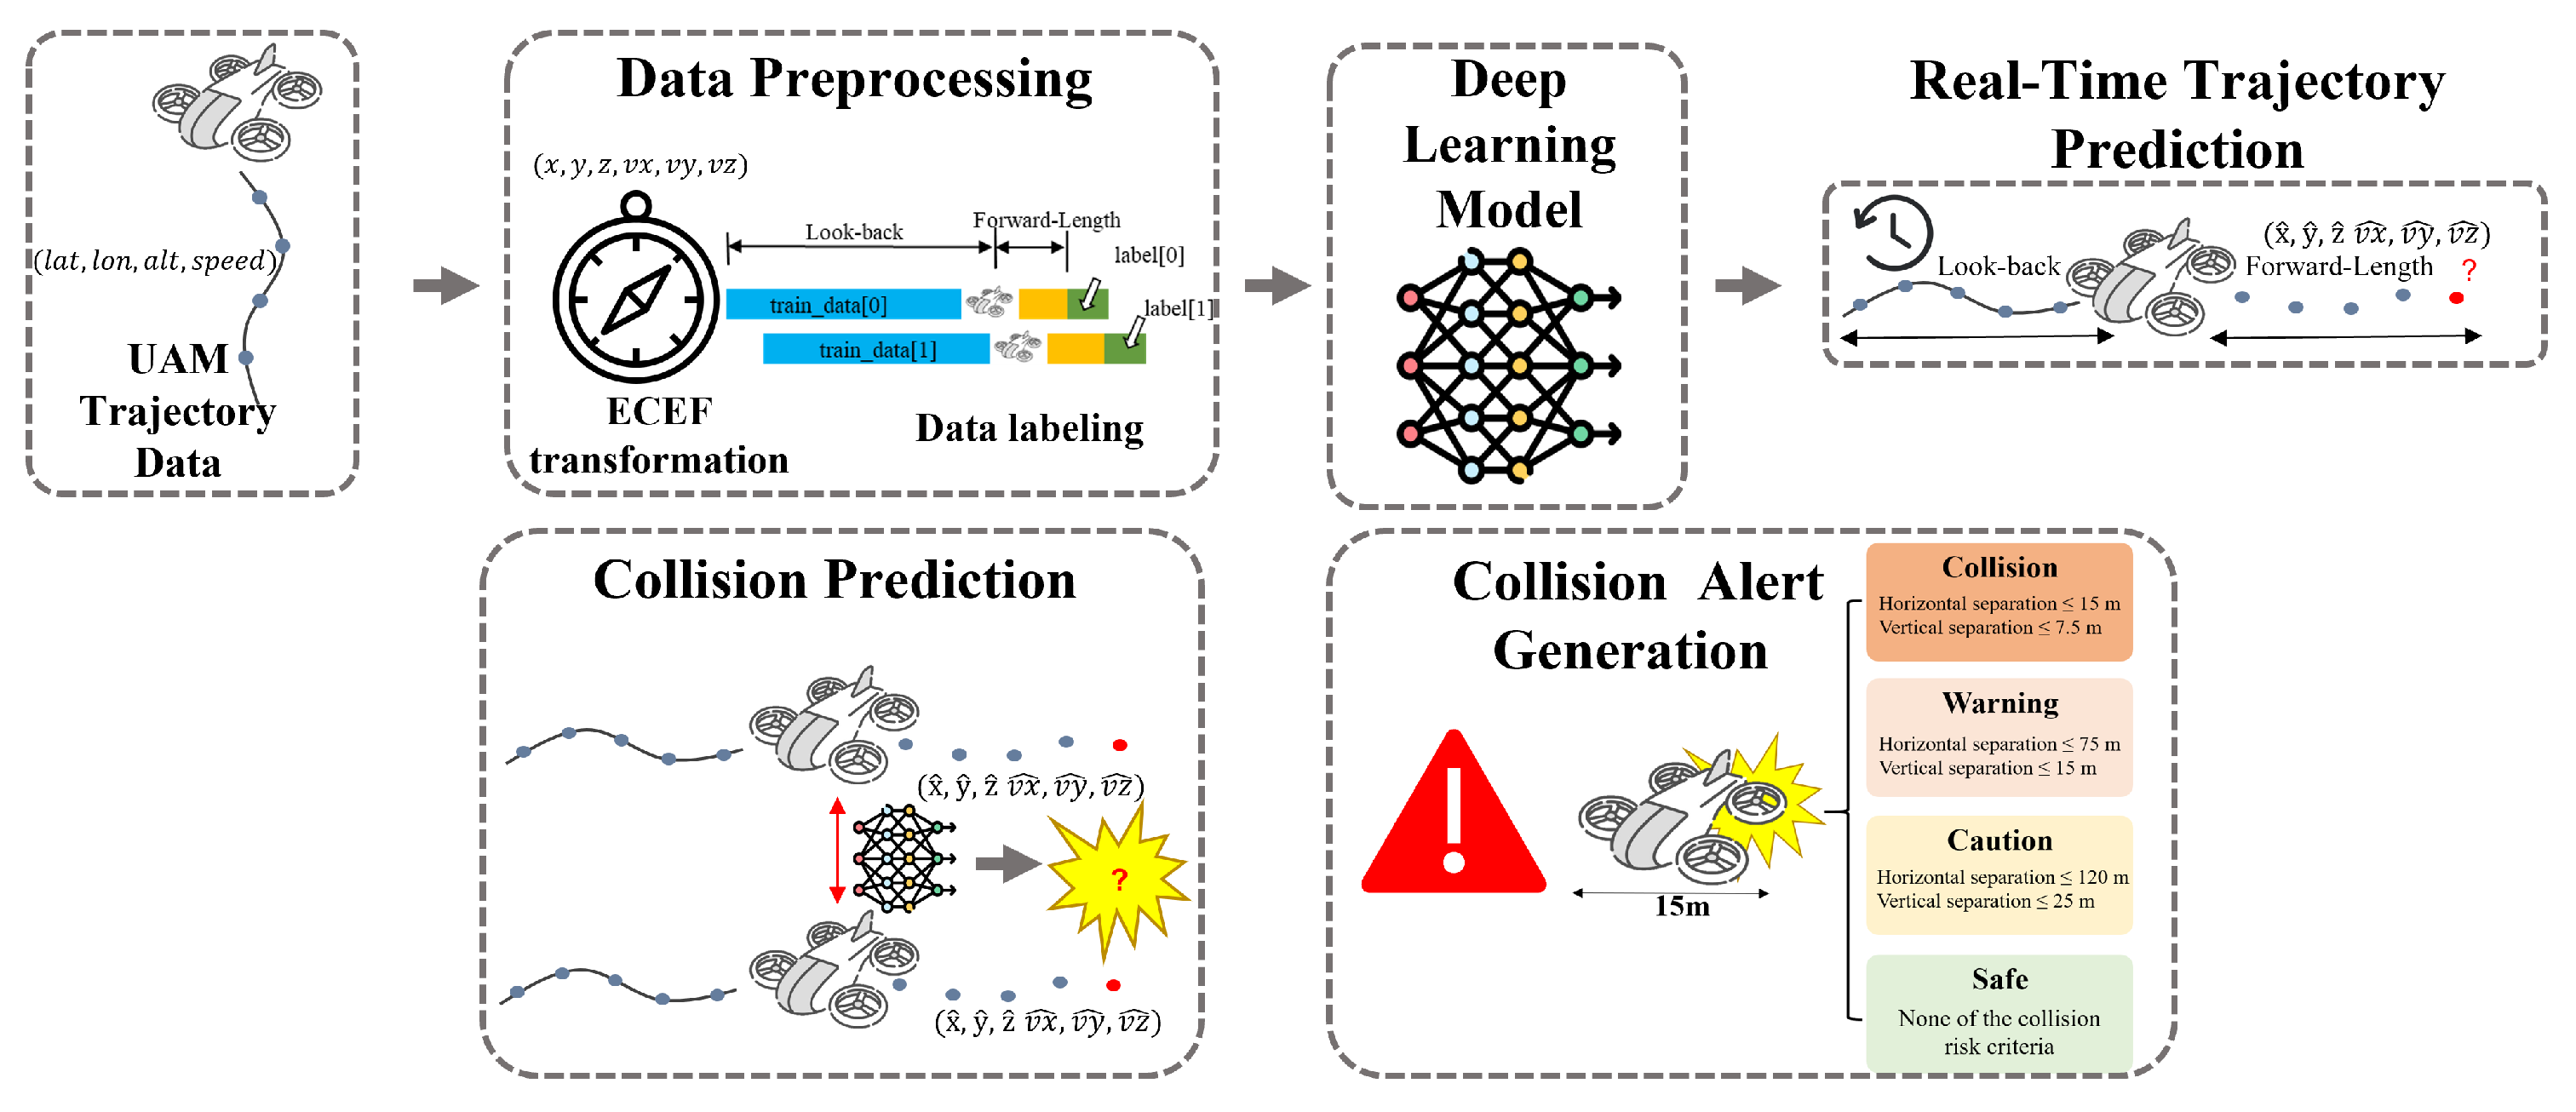
2.1. Overall Workflow for Deep Learning-Based Urban Air Mobility Trajectory Prediction and Collision Risk Assessment

This study introduces a comprehensive deep learning-driven framework designed to enhance the accuracy and operational efficiency of trajectory prediction and collision risk assessment in UAM environments. The overall system workflow, as presented in Figure 3, is composed of the following core components:
1. UAM Trajectory Data. Flight trajectories are synthesized using a high-fidelity Virtual Trajectory Generator (VTG) developed by Korean Air. Building on the planned UAM demonstration network in the Seoul Capital Area, eight vertiports are designated and 56 distinct flight corridors are defined.
2. ECEF Transformation. Raw geodetic coordinates (latitude, longitude, altitude) are converted into Earth-Centered Earth-Fixed (ECEF) coordinates to ensure consistent metric scaling and to mitigate non-linear distortions inherent in spherical systems.
3. Data Labeling. To structure the time series learning task, trajectories are segmented into overlapping windows defined by a look-back and a forward-length window. The look-back window aggregates recent flight history as model inputs, while the forward-length window specifies the prediction targets (positions and velocities). This dual-window approach embeds both past behaviors and future movement patterns, yielding context-rich samples that mitigate overfitting and enhance responsiveness to abrupt maneuvers.
4. Trajectory Prediction. An LSTM network with an integrated attention mechanism serves as the predictive engine. The LSTM captures long-term temporal dependencies, and the attention module adaptively weights salient features, enabling precise multi-step trajectory predictions under dynamic UAM conditions.
5. Collision Prediction. Predicted trajectories are classified into four risk levels—Collision, Warning, Caution and Safe—by computing the minimum positive time-to-closest approach (TCA) from relative ECEF positions and velocities. For Warning or Collision, a real-time alert reports the UTC timestamp, time to collision, risk category and collision coordinates in both ECEF and WGS-84 geodetic formats.
This integrated deep learning-based workflow facilitates rapid risk identification and enables proactive collision avoidance, thereby significantly bolstering the safety and reliability of emerging UAM operations. Furthermore, the proposed approach seamlessly integrates with existing UAM traffic management systems, enhancing overall situational awareness and reinforcing the robustness and effectiveness of real-time collision prevention measures in densely populated urban airspaces.

2.2. Dataset and Preprocessing

In this section, we comprehensively detail the data preparation and preprocessing procedures employed for the development of ultra-short-term trajectory prediction and collision risk assessment algorithms for use in complex and dynamic UAM environments. First, Korean Air’s VTG was used to simulate Lift and Cruise-type eVTOL flight operations at a sampling rate of 10 Hz, yielding approximately 670,000 high-density temporal observations across 56 routes connecting eight vertiports. As the resulting dataset maintained uniform time intervals and contained no missing values along any route, no additional interpolation or imputation steps were necessary.
To eliminate the non-linear distortions inherent to geodetic coordinates, all flight records are subsequently transformed into the ECEF coordinate system based on the WGS-84 ellipsoidal model [13]. This conversion enables real-time collision risk evaluation via straightforward Euclidean distance calculations, obviating the need for computationally intensive trigonometric operations and ensuring that deep learning models can learn local trajectory patterns without encountering superfluous non-linearities.
To address the computational challenges associated with processing entire continuous sequences, we propose a window-based labeling scheme. This scheme defines look-back windows for historical data and forward-length windows for future prediction horizons, employing overlapping segments to preserve temporal continuity. This segmentation enables the model to capture intricate motion dynamics within short intervals and simultaneously reduces the overall computational load.

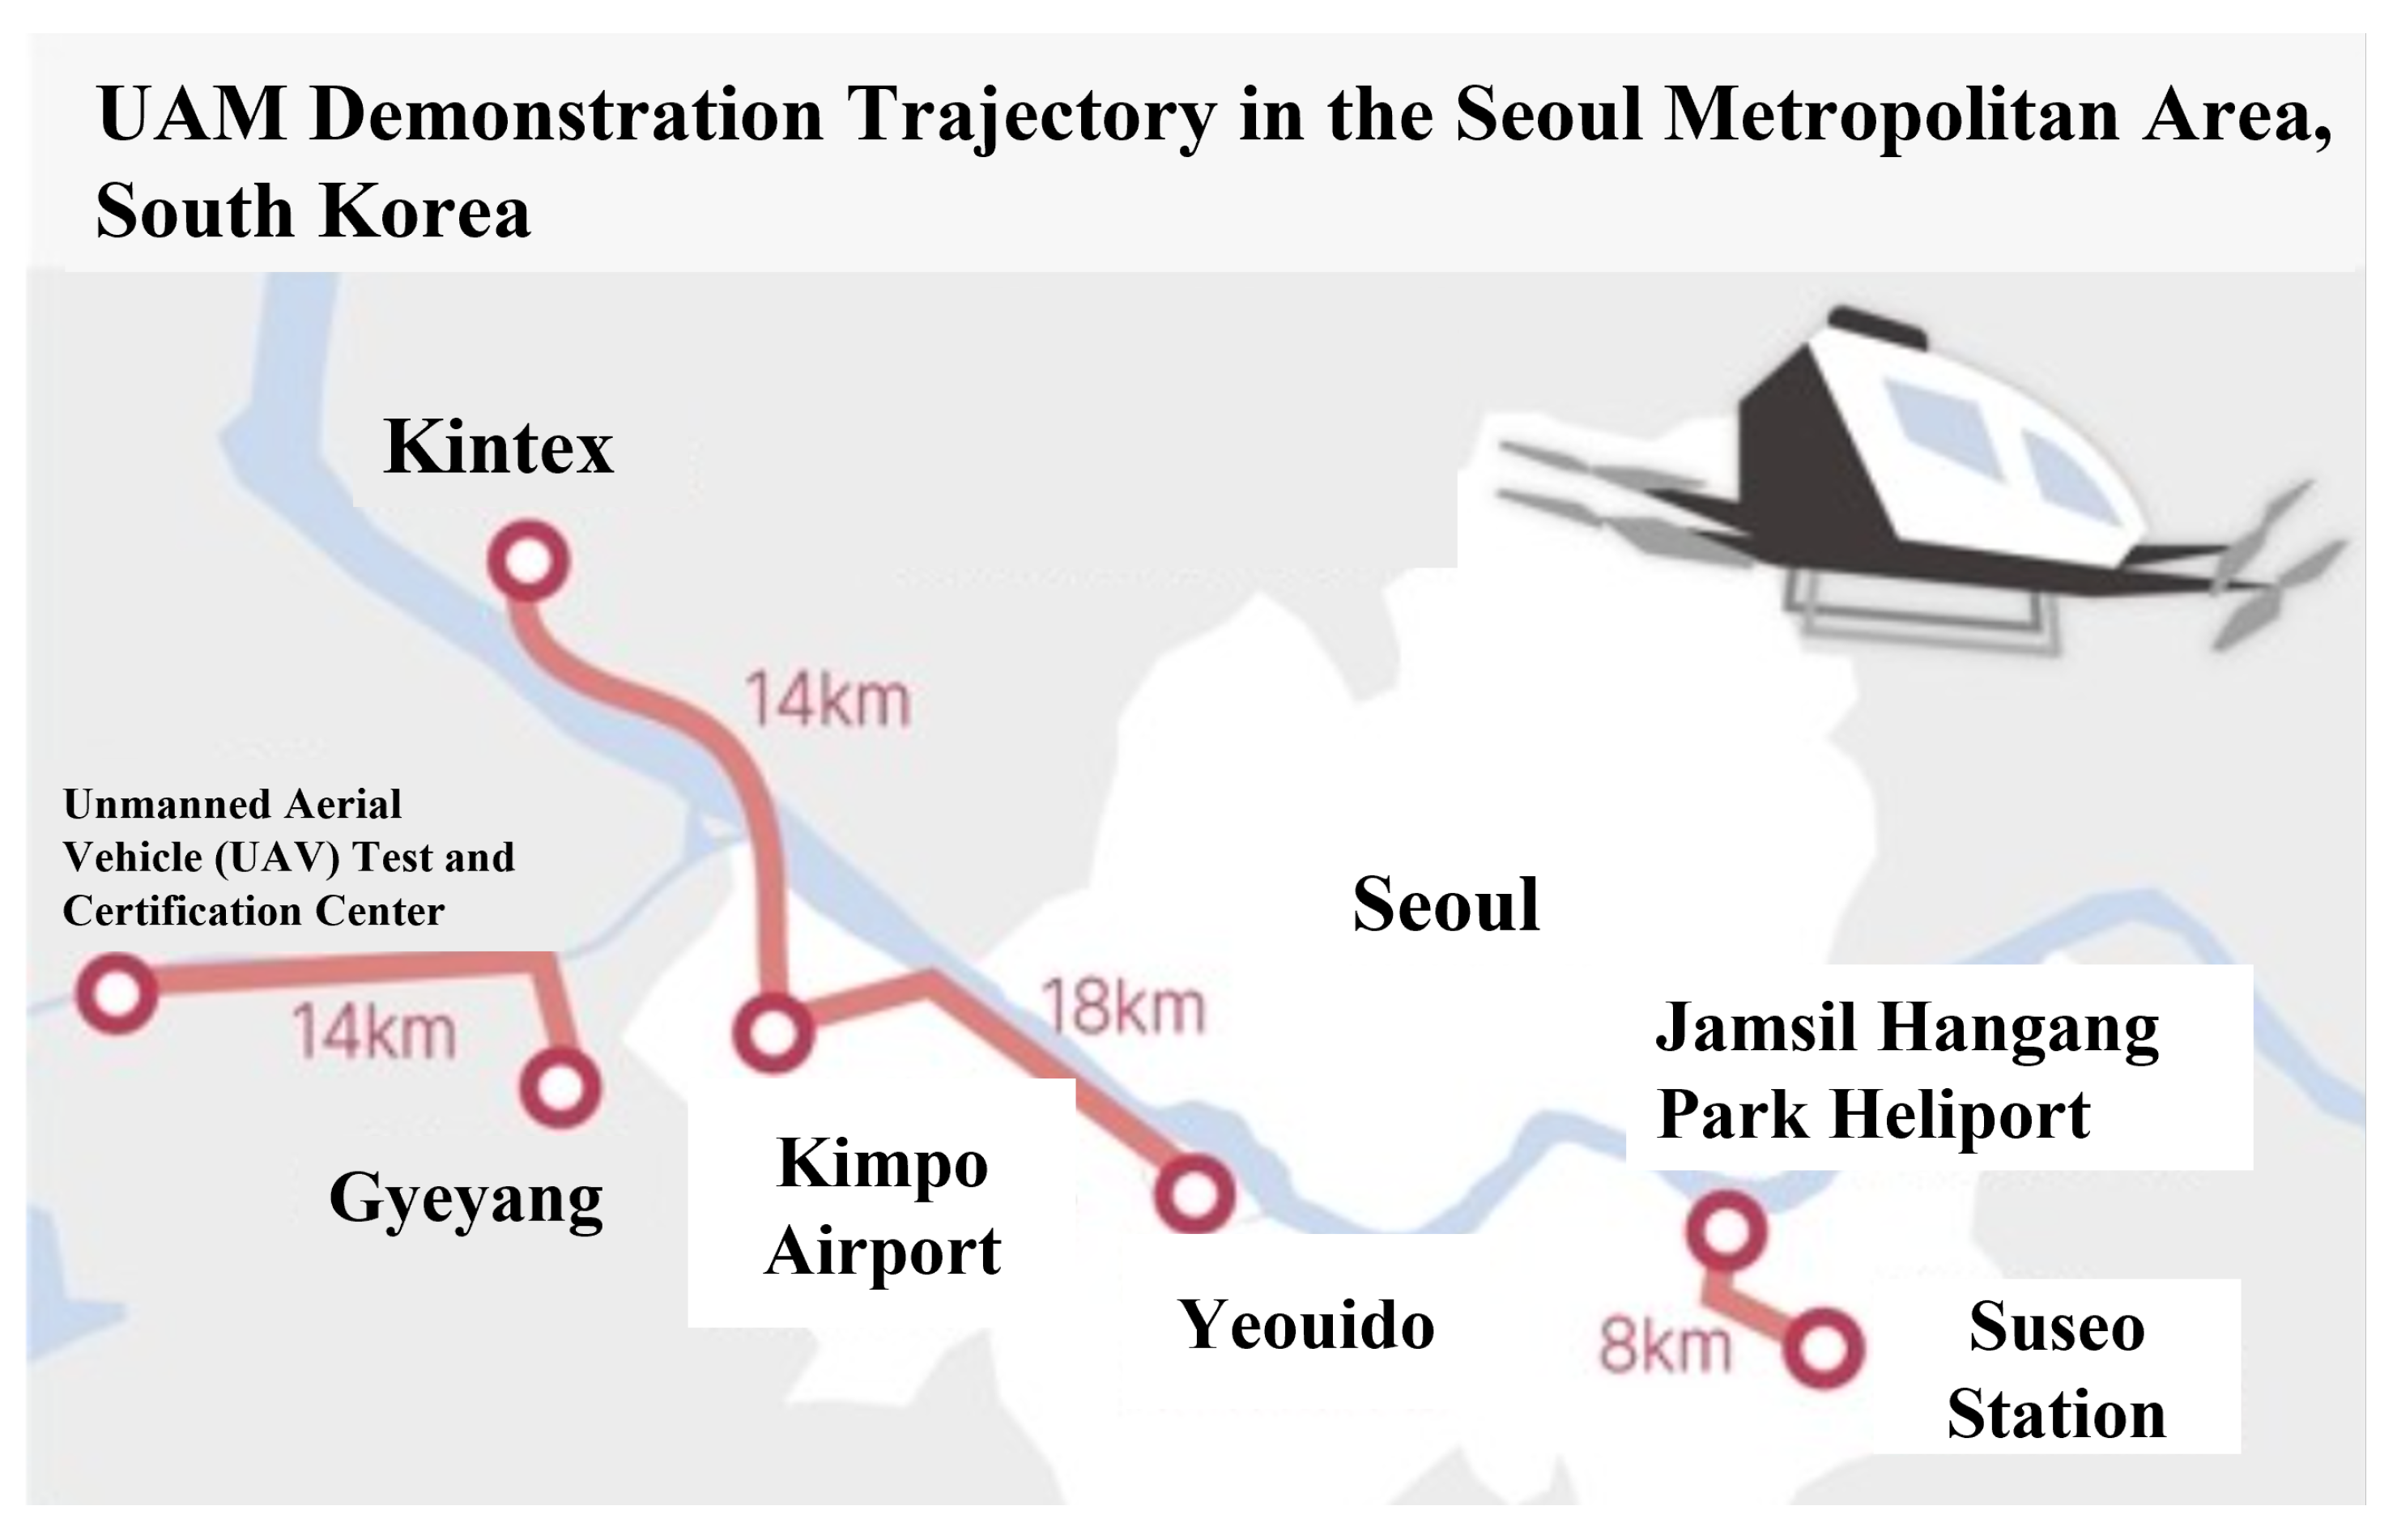
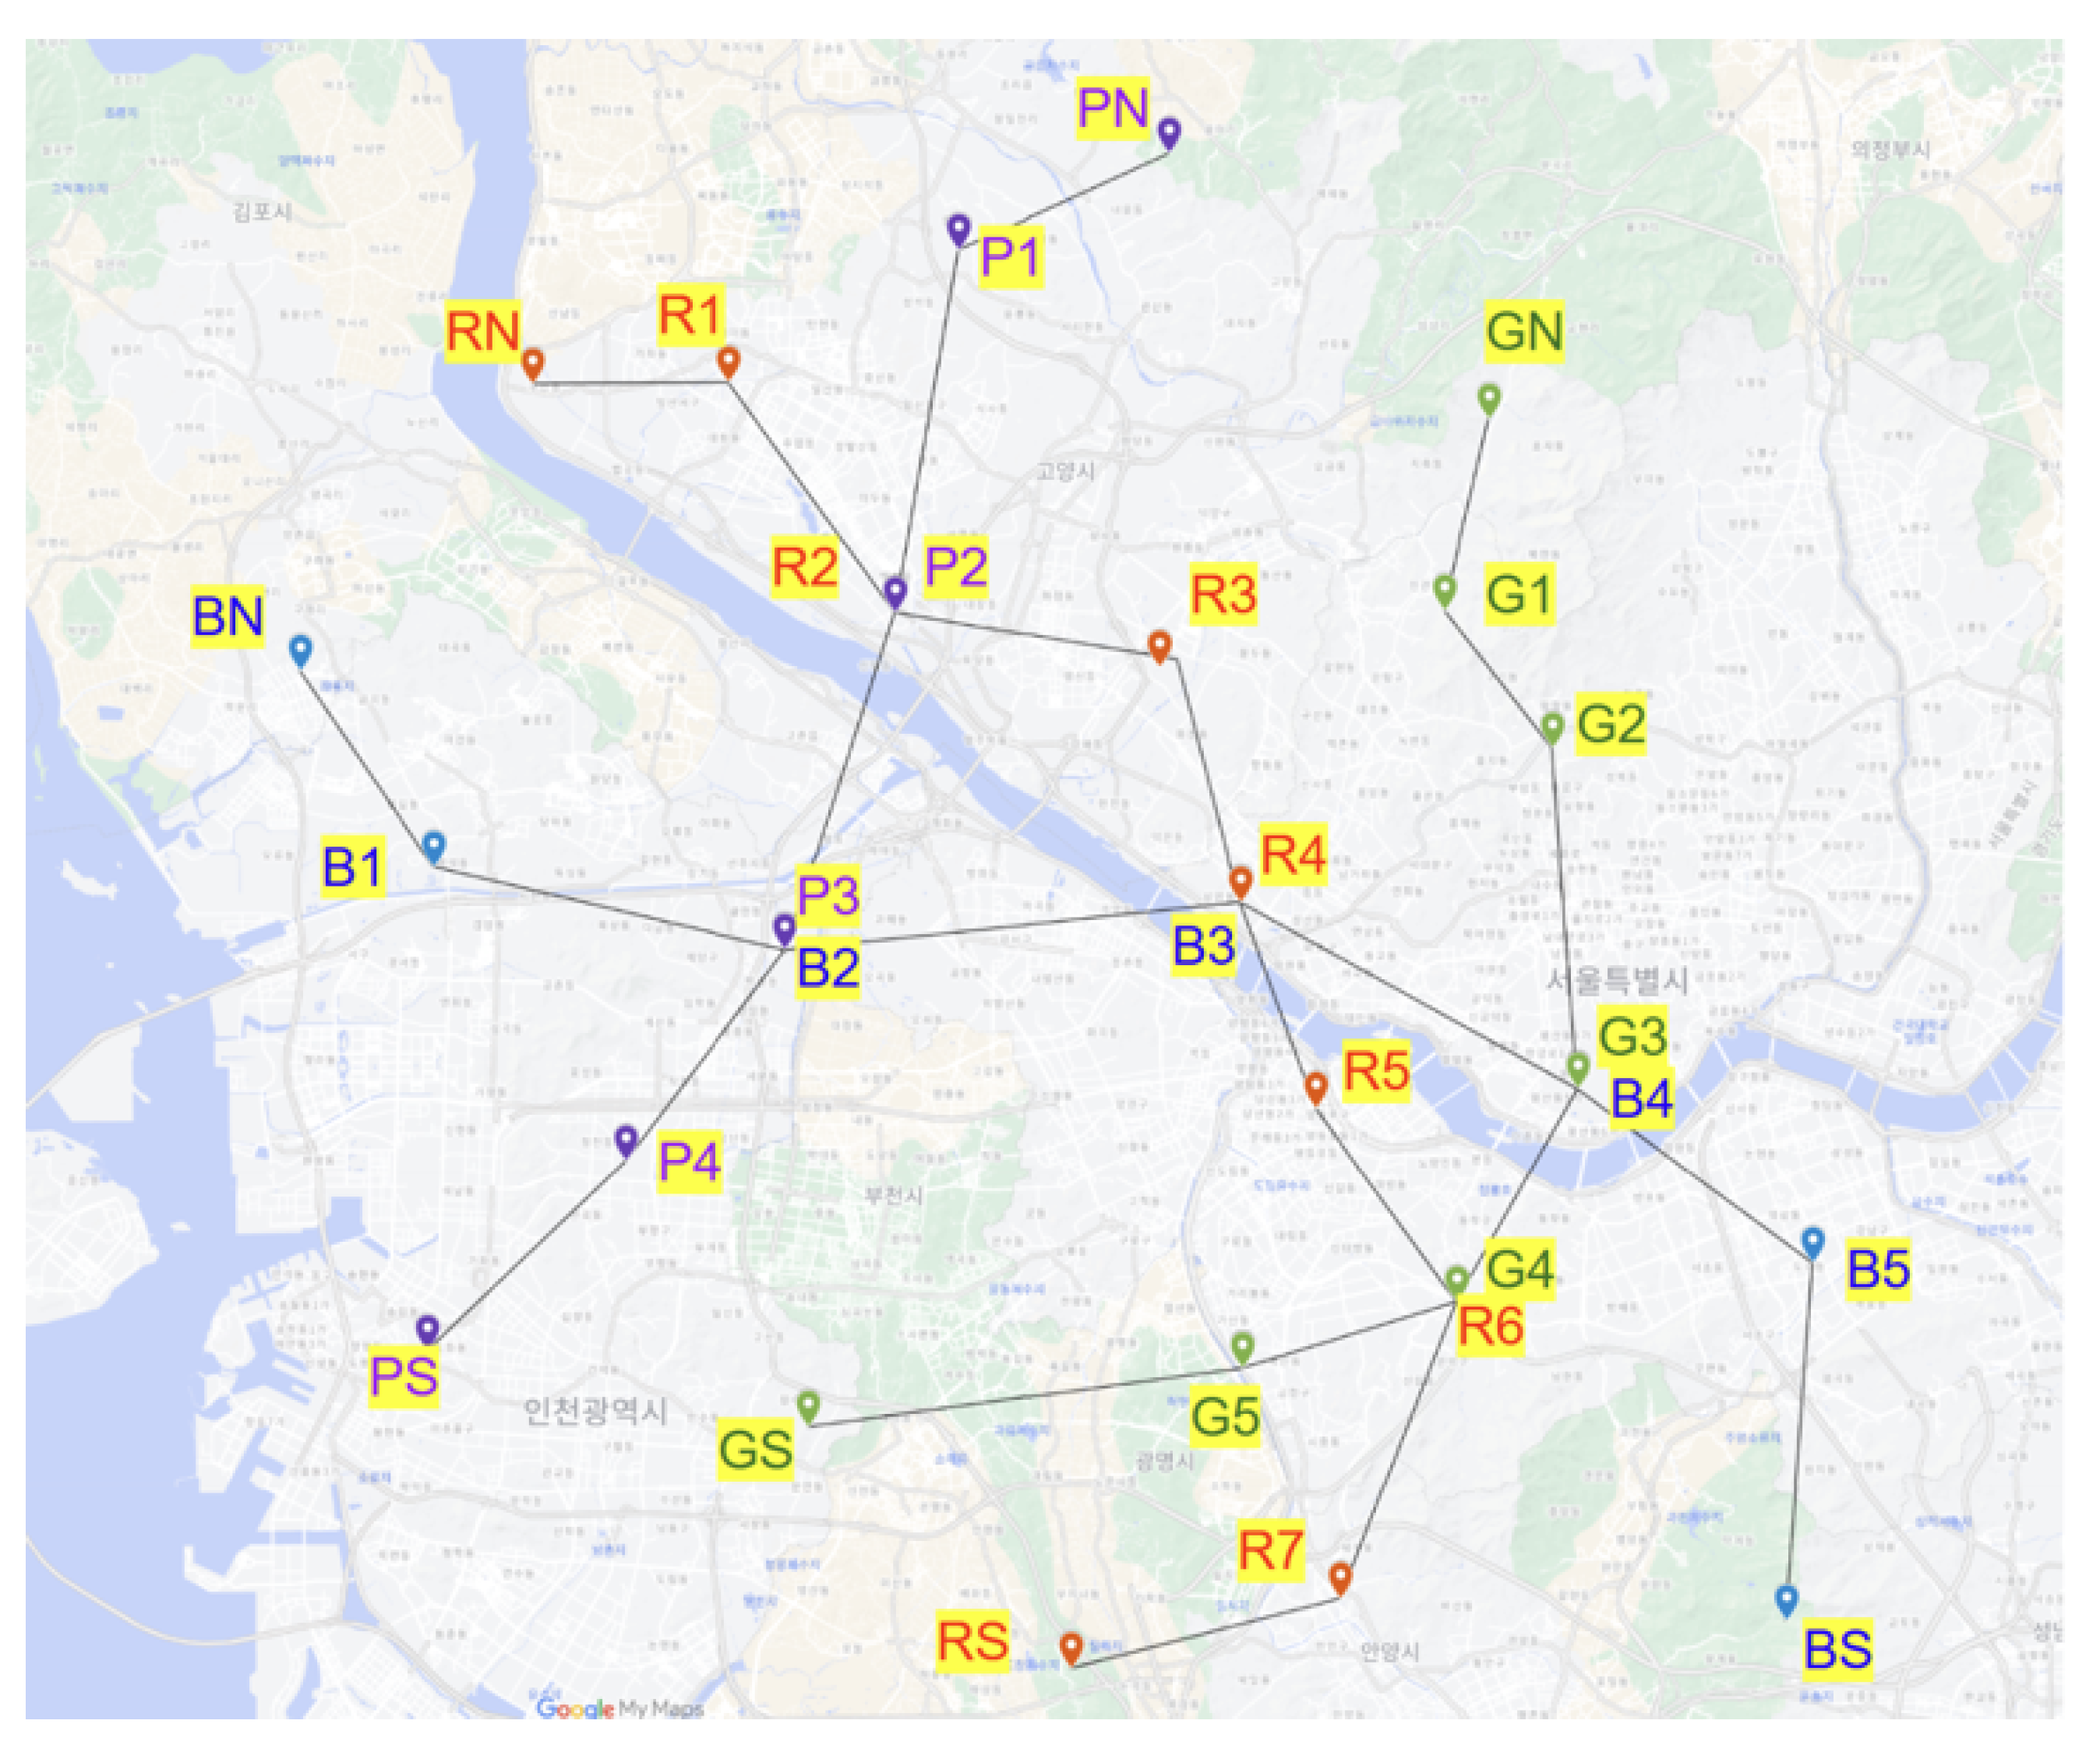
2.2.1. VTG-Based Simulation Dataset for UAM Trajectories

The primary objective of this research is to reinforce the safety of UAM systems by accurately predicting multi-aircraft trajectories and identifying collision risks before they manifest. To this end, deep learning architectures were trained on VTG-derived datasets. These models were specifically trained using actual planned UAM flight trajectories, enabling them to learn realistic trajectory patterns and potential conflict scenarios. Given that UAM has not yet achieved commercialization and, consequently, no operational flight data are available, Korean Air meticulously generated a high-fidelity simulation dataset. This dataset, centered on the planned Seoul Capital Area operations, served as the indispensable empirical basis for model development.
Building upon the demonstration network of planned commercial UAM corridors within the Seoul Capital Area, eight vertiports were meticulously designated, and 56 distinct flight corridors connecting each pair (see Figure 4) were precisely defined. Simulation data were subsequently produced using the VTG—a high-fidelity tool developed by Korean Air for internal validation. The VTG rigorously simulates Lift- and Cruise-type eVTOL aircraft, enabling the comprehensive evaluation of flight trajectory integrity, precise collision risk quantification, and robust air traffic management performance. As depicted in the map, P, G, B, and R denote Purple, Green, Blue, and Red routes, respectively, with the suffixes N and S indicating the North and South vertiports.
Importantly, this dataset directly corresponds to a planned commercial UAM demonstration network intended for implementation within the Seoul Capital Area, the metropolitan region surrounding South Korea’s capital. This detailed network consists of eight vertiports interconnected via 56 distinct flight corridors. Each corridor was simulated for approximately 20 min, generating around 12,000 trajectory samples per corridor and resulting in a comprehensive dataset containing approximately 670,000 data points, all integral to the training and validation of the predictive models. The dataset was recorded at a high temporal resolution of 10 Hz, capturing ten essential attributes per observation, including an aircraft identifier, corridor designation, a timestamp, airframe dimensions, geographic coordinates (latitude and longitude), altitude, horizontal and vertical velocity components, and heading, as detailed in Table 3. The high sampling frequency employed was critical for accurately capturing spatiotemporal dynamics, thereby substantially enhancing the precision and reliability of collision prediction algorithms.
Moreover, as the dataset had complete coverage and uniform timesteps, no imputation or temporal interpolation was required. Although operational UAM procedures commonly employ vertical separation to reduce in-flight conflicts, all aircraft in this simulation flew at a fixed altitude of 300 m. This constraint was intentionally imposed to stress-test the collision detection algorithms in a uniform-flight-level environment, thereby ensuring that the model’s predictions are robust even under the most demanding conditions.
This study presents the actual demonstration route map based on the projected UAM demonstration routes in the Seoul Capital Area in Figure 5.
From the synthesized VTG dataset, six key features (timestamp, latitude, longitude, altitude, horizontal speed, and vertical speed) were extracted and used to train the LSTM–Attention architecture for simultaneous trajectory and collision prediction. As a result, the model makes use of this extensive feature set to detect collisions in real time and achieve high prediction accuracy.

2.2.2. Coordinate Transformation from Geodetic to ECEF

Geodetic coordinates (latitude, longitude, altitude) mix angular and linear units, complicating normalization and forcing expensive trigonometric distance calculations (e.g., haversine) when evaluating many aircraft interactions at high frequency. By contrast, the Earth-Centered Earth-Fixed (ECEF) Cartesian system represents all dimensions in meters, so inter-aircraft distances reduce to simple Euclidean norms:
d = ( X 2 X 1 ) 2 + ( Y 2 Y 1 ) 2 + ( Z 2 Z 1 ) 2 .
And relative velocities and time-to-closest-approach (TCA) become straightforward vector operations:
v r e l = v 2 v 1 , TCA = ( p 2 p 1 ) · ( v 2 v 1 ) v 2 v 1 2 .
v rel = v j v i , TCA = r 0 · v v 2 .
This unified metric scale allows uniform feature normalization, improves numerical stability, and reduces inference latency—critical for real-time UAM applications.
Raw geodetic measurements ( ϕ , λ , h ) are converted to ECEF ( X , Y , Z ) via the WGS-84 ellipsoid:
e 2 = 1 b a 2 , N ( ϕ ) = a 1 e 2 sin 2 ϕ ,
X = ( N + h ) cos ϕ cos λ , Y = ( N + h ) cos ϕ sin λ , Z = b 2 a 2 N + h sin ϕ .
Velocities ( v x , v y , v z ) follow the finite differencing of ( X t , Y t , Z t ) over time, with a small-dt floor to avoid division by zero.
Figure 6a,b illustrate how ECEF coordinates yield a more linear trajectory representation, streamlining both model training and collision risk assessment.

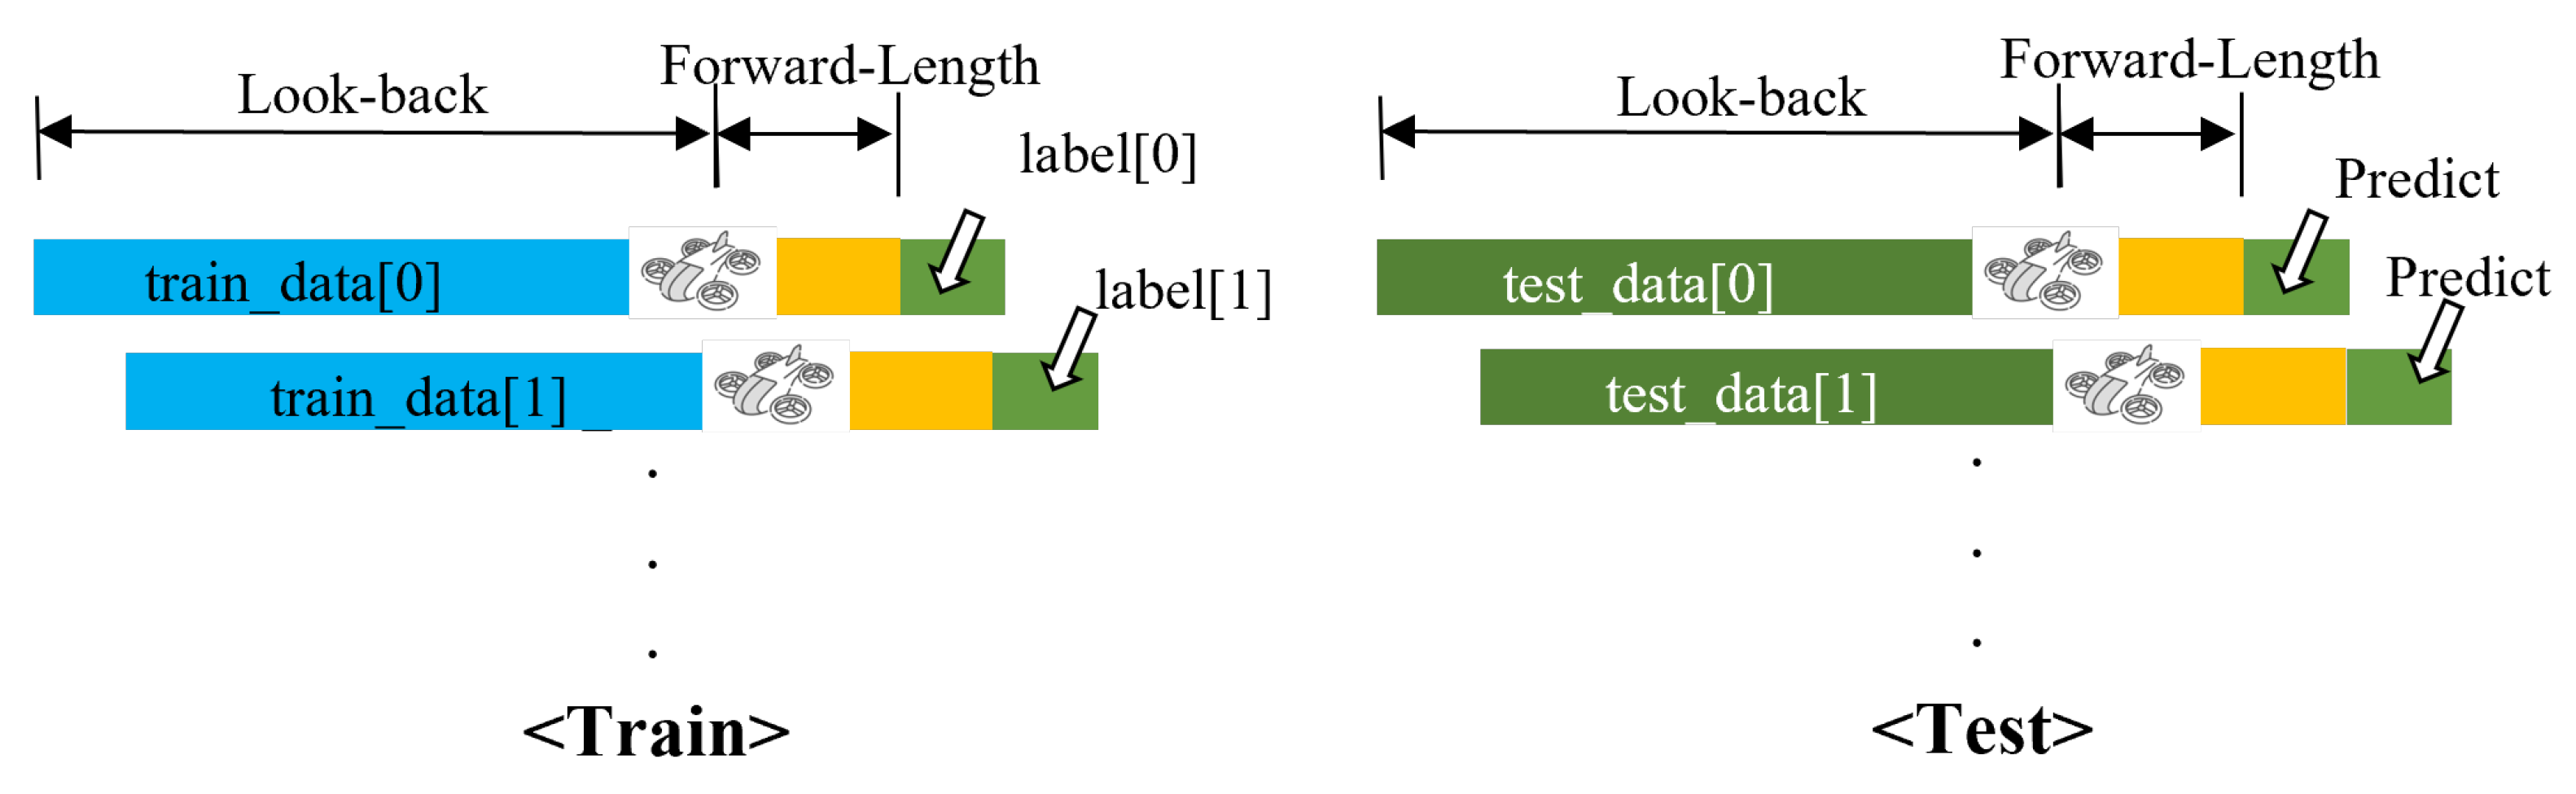
2.2.3. Data Labeling Method for Trajectory Prediction in Urban Air Mobility

Recognizing the complex, dynamic nature of UAM flight trajectories, we apply a window-based labeling approach to improve both predictive accuracy and computational efficiency. Rather than using the entire flight dataset in one continuous sequence [14], we segment the data into overlapping windows defined by two parameters:
  • Look-Back: The immediate historical window (e.g., the past several seconds of flight data), used as the input feature sequence.
  • Forward-Length: The prediction horizon (e.g., the next several seconds), for which the model predicts positions and velocities.
Figure 7 illustrates the division of trajectory data into overlapping windows used during model training. This method restricts the learning process to short, localized segments of time, reducing the risk of overfitting and improving the model’s ability to respond effectively to dynamic maneuvers, such as sudden changes in speed or direction.
The deep learning model proposed herein is specifically designed to extract salient local features from the look-back window while generating precise future trajectory estimates within the forward-length window. This design not only improves prediction accuracy in capturing subtle motion variations but also facilitates efficient collision risk assessment in real-world UAM operations.

2.3. Deep Learning Model for Urban Air Mobility Trajectory Prediction

This study was conducted with the objective of enhancing trajectory prediction and collision risk estimation in UAM operations. To this end, a deep learning-based time series prediction model was developed. Given that UAM flight trajectory data exhibit continuous and complex dynamic behavior over time, the LSTM network was selected as the base model due to its suitability for sequential data. Although the LSTM architecture is effective in capturing long-term dependencies in time series, it is known to suffer from information dilution when processing extended input sequences. To address this limitation, we propose an LSTM–Attention hybrid model, in which an attention mechanism is integrated to assign greater weights to salient timesteps within the input sequence. This enables the model to better capture long-range temporal patterns. The proposed LSTM–Attention model is designed to predict future positions and velocities (forward-length), based on a fixed-length historical window (look-back) of input data.

2.3.1. LSTM Model

LSTM networks [15] capture long-range dependencies in sequential data via an internal memory cell and three gating mechanisms. The forget gate regulates the preservation of the previous cell state,
f t = σ ( W f x t + U f h t 1 + b f ) ,
the input gate controls the incorporation of new information,
i t = σ ( W i x t + U i h t 1 + b i ) ,
and the candidate memory update is computed as
c ˜ t = tanh ( W c x t + U c h t 1 + b c )
The cell state evolves according to
c t = f t c t 1 + i t c ˜ t
The output gate filters the updated memory,
o t = σ ( W o x t + U o h t 1 + b o ) ,
and the hidden state is given by
h t = o t tanh ( c t )
We stack two LSTM layers with thirty-two units each and apply layer normalization [16] after each layer to improve training stability and convergence.

2.3.2. Multi-Head Self-Attention with Learnable Pooling

To extract multi-scale temporal features from the LSTM hidden states, we employ multi-head self-attention Vaswani et al. [17]. Given the hidden-state sequence H = { h 1 , , h T } , each head projects H into queries Q, keys K, and values V. Attention weights are computed as
α t , i = exp q t k i / d k j = 1 T exp q t k j / d k
Each head produces a context vector by weighting V with α . Head outputs are concatenated and projected back to the original dimension. A learnable pooling layer then aggregates these vectors by selecting timesteps that maximize predictive power and compresses them into a single context vector.
By integrating LSTM networks with a multi-head attention mechanism, this study utilizes the complementary strengths of both methods. The LSTM encoder effectively maintains a dynamic memory of prior flight states, capturing both gradual trajectories and abrupt maneuvers. Concurrently, the attention mechanism systematically evaluates this stored information, emphasizing critical segments pertinent to each prediction task. This combined approach mitigates inherent limitations found in architectures relying exclusively on recurrent or transformer-based structures.
In trajectory prediction tasks, the model simultaneously accounts for immediate navigational changes and strategic flight objectives over extended timeframes. The attention weights explicitly indicate the relative significance of each past timestep, facilitating interpretability and enabling operators to assess and validate the model’s decision-making processes clearly. This targeted attentiveness significantly enhances prediction accuracy, particularly within complex urban corridors characterized by dense traffic flows, frequent maneuvering between vertiports, and dynamic obstacle avoidance.
In collision prediction contexts, the integrated representation encapsulates both individual aircraft dynamics and implicit interactions among neighboring vehicles. The model proactively identifies converging flight paths and provides timely collision risk alerts. The application of layer normalization and adaptive pooling optimizes computational efficiency, ensuring rapid execution necessary for real-time predictions within urban air mobility traffic management systems.

2.3.3. Hyperparameters and Experimental Setup

To comprehensively evaluate the trajectory prediction and collision risk classification methodologies, a detailed experimental analysis was conducted utilizing a dataset comprising 56 UAM flight trajectories. From these, 33 trajectories were designated specifically for model development, including training, validation, and internal testing, whereas the remaining 23 trajectories were reserved exclusively for the final end-to-end collision prediction evaluation. Each trajectory consisted of approximately 12,000 timestamped records capturing both positional and velocity information, thus offering an extensive, high-resolution dataset suitable for robust performance assessment.
All models were implemented in PyTorch 2.6.0 and trained for 100 epochs on an NVIDIA RTX 6000 GPU; inference latency was measured alongside prediction accuracy to assess real-time deployment feasibility.
The LSTM–Attention deep learning model was configured to accept an input vector comprising a timestamp and six kinematic features and employed two stacked recurrent layers of 32 hidden units. A four-headed self-attention mechanism was applied to the final hidden states before passing through a 20% dropout layer and linear mapping to the six output dimensions ( X , Y , Z , v x , v y , v z ) . The model was trained for up to 500 epochs using the Adam optimizer [18] with a fixed learning rate of 0.001 and mean squared error as the loss function. Training was conducted in mini-batches of 70 samples. A ReduceLROnPlateau scheduler halved the learning rate whenever the validation loss failed to improve for five consecutive epochs, and early stopping was employed to terminate training if no improvement occurred over fifteen epochs. This unified training protocol was applied across all look-back and forward-length configurations to ensure consistent optimization.

2.4. Trajectory-Based Multi-Level Collision Prediction for Urban Air Mobility

The operational UAM environment is characterized by low-altitude high-density flight operations involving human passengers which inherently imposes stringent safety requirements far beyond those encountered in conventional unmanned or high-altitude air traffic scenarios. Given these constraints, conventional binary or single-threshold collision risk frameworks are inadequate in supporting the nuanced and proactive decision-making needed in UAM scenarios.
To address this limitation, we propose a four-level risk classification scheme, explicitly designed to reflect both the urgency and severity of potential mid-air conflicts. The proposed levels are defined as follows: Level 1 (Collision), Level 2 (Warning), Level 3 (Caution), and Level 4 (Safe). This stratification allows for more granular situational awareness and decision support, enabling both autonomous UAM systems and human air traffic controllers to respond with actions proportionate to the level of threat.
Through incorporating multiple risk levels, this framework provides a scalable and interpretable structure for operational risk management. It supports timely and context-sensitive mitigation strategies, thereby enhancing overall system robustness and passenger safety in complex urban airspaces.

2.4.1. Overall Collision Risk Assessment Workflow in Urban Air Mobility Systems

The Traffic Collision Avoidance System (TCAS) is a control-system-level active safety module standardized by ICAO Annex 10 and RTCA DO-185B/DO-212A [19,20]. It acquires the three-dimensional relative positions and velocities of nearby aircraft through periodic transponder signal interrogation [21]. The TCAS operates in two main phases: surveillance, which updates relative positions and velocities approximately every second, and threat resolution, which calculates the TCA to identify potential collisions.
We adopt and extend the fundamental TCA logic from TCAS II within a machine learning-driven collision risk assessment framework specifically tailored for UAM systems. Unlike a conventional TCAS, our approach uses an LSTM–Attention network to predict aircraft trajectories at a higher temporal resolution. In each predicted timestep, t i , we compute the relative position and velocity vectors:
r 0 ( t i ) = p 2 ( t i ) p 1 ( t i ) ,
v ( t i ) = v 2 ( t i ) v 1 ( t i ) .
And we subsequently calculate the TCA as follows:
TCA ( t i ) = max 0 , r 0 ( t i ) · v ( t i ) v ( t i ) 2 .
Instead of the conventional single-snapshot approach used in TCASs, we aggregate TCA values across the entire prediction window, selecting the minimum positive TCA as the representative value. This method leverages multiple prediction points, significantly enhancing the accuracy and responsiveness of conflict detection.
The predicted separations at this representative TCA are classified into four risk levels (Collision, Warning, Caution, and Safe), specifically calibrated according to the dimensions and operational constraints of UAM aircraft. Our approach facilitates a precise and efficient collision-avoidance strategy optimized for densely populated urban airspace environments.

2.4.2. Risk-Level Definitions and Threshold Justification

To establish a robust and safety-centric collision prediction framework tailored to UAM operations with human passengers, we propose a four-tier risk classification scheme. This scheme affords a nuanced assessment of conflict severity and enables proactive, graduated mitigation measures beyond the capabilities of binary approaches. Thresholds are set to 15 m in the horizontal plane and 7.5 m in the vertical axis. The 15 m horizontal threshold corresponds to the upper bound of carrying passengers, eVTOL wingspan, and critical airframe dimensions as specified in the AiRMOUR Guidebook [22], ensuring that rotor sweep envelopes do not overlap. The 7.5 m vertical threshold, exactly half the maximum wingspan, provides a conservative safety margin that accounts for typical eVTOL height, rotor downwash effects, and vertical flight path variability. This configuration aligns with emerging UAM regulatory recommendations on separation minima in low-altitude operations and reflects established industry practice for three-dimensional aircraft clearance.
Each risk level is defined as follows (also see Figure 8).
  • Level 1—Collision: This is triggered when horizontal separation is less than or equal to 15 m and vertical separation is less than or equal to 7.5 m. These thresholds correspond to the physical overlap or near-overlap of aircraft fuselages, indicating imminent collision.
  • Level 2—Warning: This is assigned at the predicted TCA when horizontal separation is less than or equal to 75 m and vertical separation is less than or equal to 15 m. This level represents a high-risk encounter necessitating immediate evasive action.
  • Level 3—Caution: This is defined by horizontal separation less than or equal to 120 m and vertical separation less than or equal to 25 m at TCA. This classification allows for the early detection of potential conflicts and timely trajectory adjustments.
  • Level 4—Safe: This applies to all predicted aircraft encounters that do not meet the criteria of the above three levels, indicating no immediate conflict.
Through the adoption of this multi-level scheme, the proposed framework enhances interpretability, operational responsiveness and, ultimately, the safety and reliability of real-time trajectory and collision prediction systems in complex UAM environments.

2.4.3. Ground Truth Label Generation

To quantitatively assess the performance of the proposed framework without manual annotation, the ground truth risk level for each aircraft pair is automatically derived based on their predicted states in the final prediction timestep. Specifically, let the denormalized state vector of the k-th aircraft at the terminal prediction instant be represented by
s k = [ x k , y k , z k , v x , k , v y , k , v z , k ] ,
where the positional components ( x k , y k , z k ) denote Earth-Centered Earth-Fixed (ECEF) coordinates in meters, and the velocity components ( v x , k , v y , k , v z , k ) are expressed in meters per second. The velocity vectors indicate the aircraft’s instantaneous movement direction and speed within the three-dimensional spatial domain. Subsequently, the position-only vector is extracted as
p k = [ x k , y k , z k ] .
Consequently, for any two distinct aircraft, i and j, the three-dimensional Euclidean separation is defined as
d i j = p i p j = ( x i x j ) 2 + ( y i y j ) 2 + ( z i z j ) 2 ,
where d i j , measured in meters, quantifies the spatial proximity between the aircraft pair, thus serving as the criterion for systematically assigning collision risk levels.
The distance d i j is then mapped onto one of the four risk categories according to the thresholds defined in Section 2.4.2. These automatically generated labels constitute the ground truth (‘risk_true’) against which our model’s pairwise risk predictions (‘risk_pred’) are compared. Performance metrics, including accuracy, the confusion matrix, precision, recall, and F1-score, are computed based on this correspondence, enabling the end-to-end assessment of both trajectory prediction and risk classification performance without requiring manual annotation.

2.4.4. Collision Prediction Algorithm

This section details the integration of deep learning-generated trajectory outputs with a threshold-based collision risk algorithm. Predicted ECEF positions and velocities from the LSTM–Attention model are paired for every two aircraft, and their relative motion is used to compute the time-to-closest approach (TCA) in each predicted timestep. Encounters are automatically classified as Safe, Caution, Warning, or Collision according to predefined TCA thresholds. When a pair transitions into Warning or Collision, the system immediately issues a UTC-timestamped alert that specifies the risk level and provides collision coordinates in both ECEF and WGS-84 geodetic formats. This streamlined pipeline enables real-time situational awareness and rapid conflict mitigation within urban air mobility operations.
Algorithm 1 summarizes this comprehensive procedure explicitly, encapsulating each step from trajectory data preprocessing through risk computation to alert generation, providing a robust foundation for proactive collision avoidance decision-making within complex, dynamically evolving urban air mobility scenarios. Alerts are issued in real time upon the detection of elevated collision risk. Furthermore, the predicted collision coordinates, initially computed in the ECEF frame ( x , y , z ) , are converted into geodetic format (latitude, longitude, altitude) using the WGS-84 reference model to facilitate visualization and integration with operational airspace charts.
Algorithm 1 Collision risk prediction and alert generation.
 1:  Alerts                       ▹ Initialize alert storage
 2: for all aircraft trajectories do
 3:      Normalize input features using pre-fitted scaler
 4:      Segment trajectory into look-back and forward-length prediction windows
 5:      Predict future positions and velocities using LSTM–Attention model
 6:      Denormalize predicted outputs to ECEF coordinates
 7: end for
 8: for all unique aircraft pairs ( i , j )  do
 9:      for all prediction timesteps t do
10:           Compute relative position: r 0 ( t ) = p j ( t ) p i ( t )
11:           Compute relative velocity: v ( t ) = v j ( t ) v i ( t )
12:           Calculate TCA: TCA ( t ) = max 0 , r 0 ( t ) · v ( t ) v ( t ) 2
13:      end for
14:      Identify minimum positive TCA min over prediction horizon
15:      Compute spatial separation at TCA min
16:      Assign risk level { Safe , Caution , Warning , Collision } based on thresholds
17:      if risk level ≠ Safe then
18:           Create alert with timestamp, predicted states, and risk level
19:           Convert predicted collision coordinates ( x , y , z ) to geodetic format (lat, lon, alt)
20:           Append alert to Alerts
21:      end if
22: end for
23: return  Alerts                      ▹ Return complete alert log
By integrating high-frequency trajectory prediction and a systematically structured, multi-level risk assessment framework, the proposed algorithm enables proactive conflict detection and supports real-time decision-making in densely populated urban air mobility environments. The continuous evaluation of collision risk throughout the prediction horizon, rather than relying solely on single point estimates, enhances the algorithm’s sensitivity and reliability, particularly in dynamic scenarios involving multiple aircraft.

3. Results

3.1. Integrated Evaluation of the LSTM–Attention Model for UAM Trajectory Prediction

3.1.1. Evaluation Metrics for Trajectory Prediction

To rigorously evaluate the accuracy and reliability of our deep learning-based trajectory predictions, we employ three complementary performance metrics: the root mean squared error (RMSE), mean absolute error (MAE), and mean squared error (MSE). Each metric quantifies prediction accuracy by comparing predicted values, denoted as y ^ , against actual observed values, represented as y.
Firstly, the RMSE is defined as the square root of the average squared differences between predicted ( y ^ ) and true (y) values:
RMSE = 1 N i = 1 N ( y ^ i y i ) 2 .
The RMSE returns values in the original units of measurement, making it intuitively interpretable while strongly penalizing larger errors due to squaring.
Secondly, the MAE measures the average magnitude of absolute prediction errors, defined as
MAE = 1 N i = 1 N | y ^ i y i | .
The MAE provides a clear, intuitive measure of typical prediction deviation directly expressed in the same units as the target values, offering insight into the overall prediction consistency.
Thirdly, the MSE quantifies the average of squared prediction errors and is formulated as
MSE = 1 N i = 1 N ( y ^ i y i ) 2 .
MSE emphasizes larger errors more significantly due to the squared term, offering insights into the variance of prediction errors and potential outlier impacts, but the results are expressed in squared units, limiting direct intuitive interpretation.
In UAM contexts, precise trajectory prediction is vital due to the operational necessity of maintaining safe separation between aircraft within dense, low-altitude corridors. Even minor trajectory prediction deviations can result in elevated collision risks or unsafe proximities. Utilizing the RMSE, MAE, and MSE collectively provides comprehensive insight into prediction accuracy and reliability. RMSE balances ease of interpretation with sensitivity to outliers, MAE straightforwardly indicates typical prediction errors, and the MSE explicitly highlights variability and outlier influence within the predictions.

3.1.2. Look-Back Window Configuration for UAM Trajectory Prediction

In this work, we propose and rigorously evaluate deep learning architectures specifically engineered to capture the temporal dependencies and multi-scale dynamic patterns characteristic of urban air mobility trajectories. Our principal aim is to quantify each model’s capacity to learn and predict the intricate spatiotemporal behavior of UAM vehicles operating within dense, low-altitude urban airspace.
To identify the optimal temporal context for reliable prediction, we systematically varied the look-back window length across four configurations—10, 30, 50, and 100 timesteps—thereby controlling the extent of historical data available for prediction. This design enabled the assessment of how the depth of past information influences model accuracy and the trade-off between capturing critical flight maneuvers and avoiding overfitting to distant, less relevant patterns.
As shown in Table 4, 50 steps in the look-back window delivered superior performance, with an RMSE of 0.2172, MAE of 0.0524, and MSE of 0.1668 across all output dimensions. This configuration provided sufficient temporal context to represent dynamic maneuvers while mitigating noise and redundant correlations associated with longer histories. Windows shorter than 50 steps lacked necessary context for abrupt maneuvers, whereas windows exceeding 50 steps exhibited slight performance degradation, likely due to overfitting. Consequently, we adopted 50 look-back steps for all subsequent experiments.

3.1.3. Comparative Analysis of Geodetic and ECEF Coordinates

To systematically assess the influence of coordinate system selection on trajectory prediction accuracy, eight sequence model architectures were evaluated: GRU [23], LSTM [15], Bi-LSTM [24], Bi-GRU [25], CNN-LSTM [26], Transformer [17], GRU–Attention, and LSTM–Attention. All experiments were conducted under identical conditions. Prediction performance was then compared before and after applying the ECEF transformation to evaluate its impact and necessity.
As shown in Table 5, the ECEF transformation consistently improved the predictive performance of all evaluated deep learning models, underscoring the effectiveness of a linearized spatial representation in facilitating model learning. Specifically, the Transformer exhibited a notable reduction in the RMSE from 0.3056 to 0.2259, demonstrating the enhanced utilization of self-attention mechanisms to effectively capture long-range spatial dependencies. Similarly, the LSTM–Attention network achieved the lowest RMSE of 0.2172 after the transformation, confirming the benefit of employing ECEF coordinates to enhance model accuracy in precise trajectory prediction tasks within urban air mobility contexts.
These results confirm that converting latitude longitude and altitude data into an Earth-Centred Earth-Fixed coordinate system is a powerful preprocessing step. This transformation alleviates surface curvature distortions and improves the linear separability of spatiotemporal sequences, thereby enhancing the predictive performance of both recurrent and attention-based neural models.

3.1.4. Real-Time Inference Evaluation for Urban Air Mobility Trajectory Prediction

To ensure safe and responsive UAM operations, real-time trajectory prediction is not merely advantageous but essential. High-frequency prediction at 0.1 s intervals enables rapid adaptation to dynamic environments, timely conflict detection, and proactive collision avoidance in dense, low-altitude airspace.
The real time feasibility of the proposed LSTM–Attention model was systematically assessed by measuring inference latency using time series data sampled at intervals of 0.1 s. In particular, forward-pass computation times were recorded for varying prediction horizons, ranging from the immediate next timestep (0.1 s) up to 100 timesteps (10 s). As shown in Table 6, the LSTM–Attention architecture achieved inference latencies consistently within approximately 0.51 to 0.54 milliseconds per timestep, substantially lower than the sampling interval. These experimental findings indicate that the model can reliably produce predictions spanning the full prediction horizon within a small fraction of the available 0.1-s interval, thereby affirming its suitability for deployment in real-time, safety-critical urban air mobility operations.
Importantly, despite the computational demands of longer horizons, the model maintained high accuracy with an RMSE of at most 0.242 across all tested forward-lengths. This level of robustness combined with sub-millisecond inference latency demonstrates the model’s suitability for continuous airspace monitoring and collision avoidance in operational contexts.

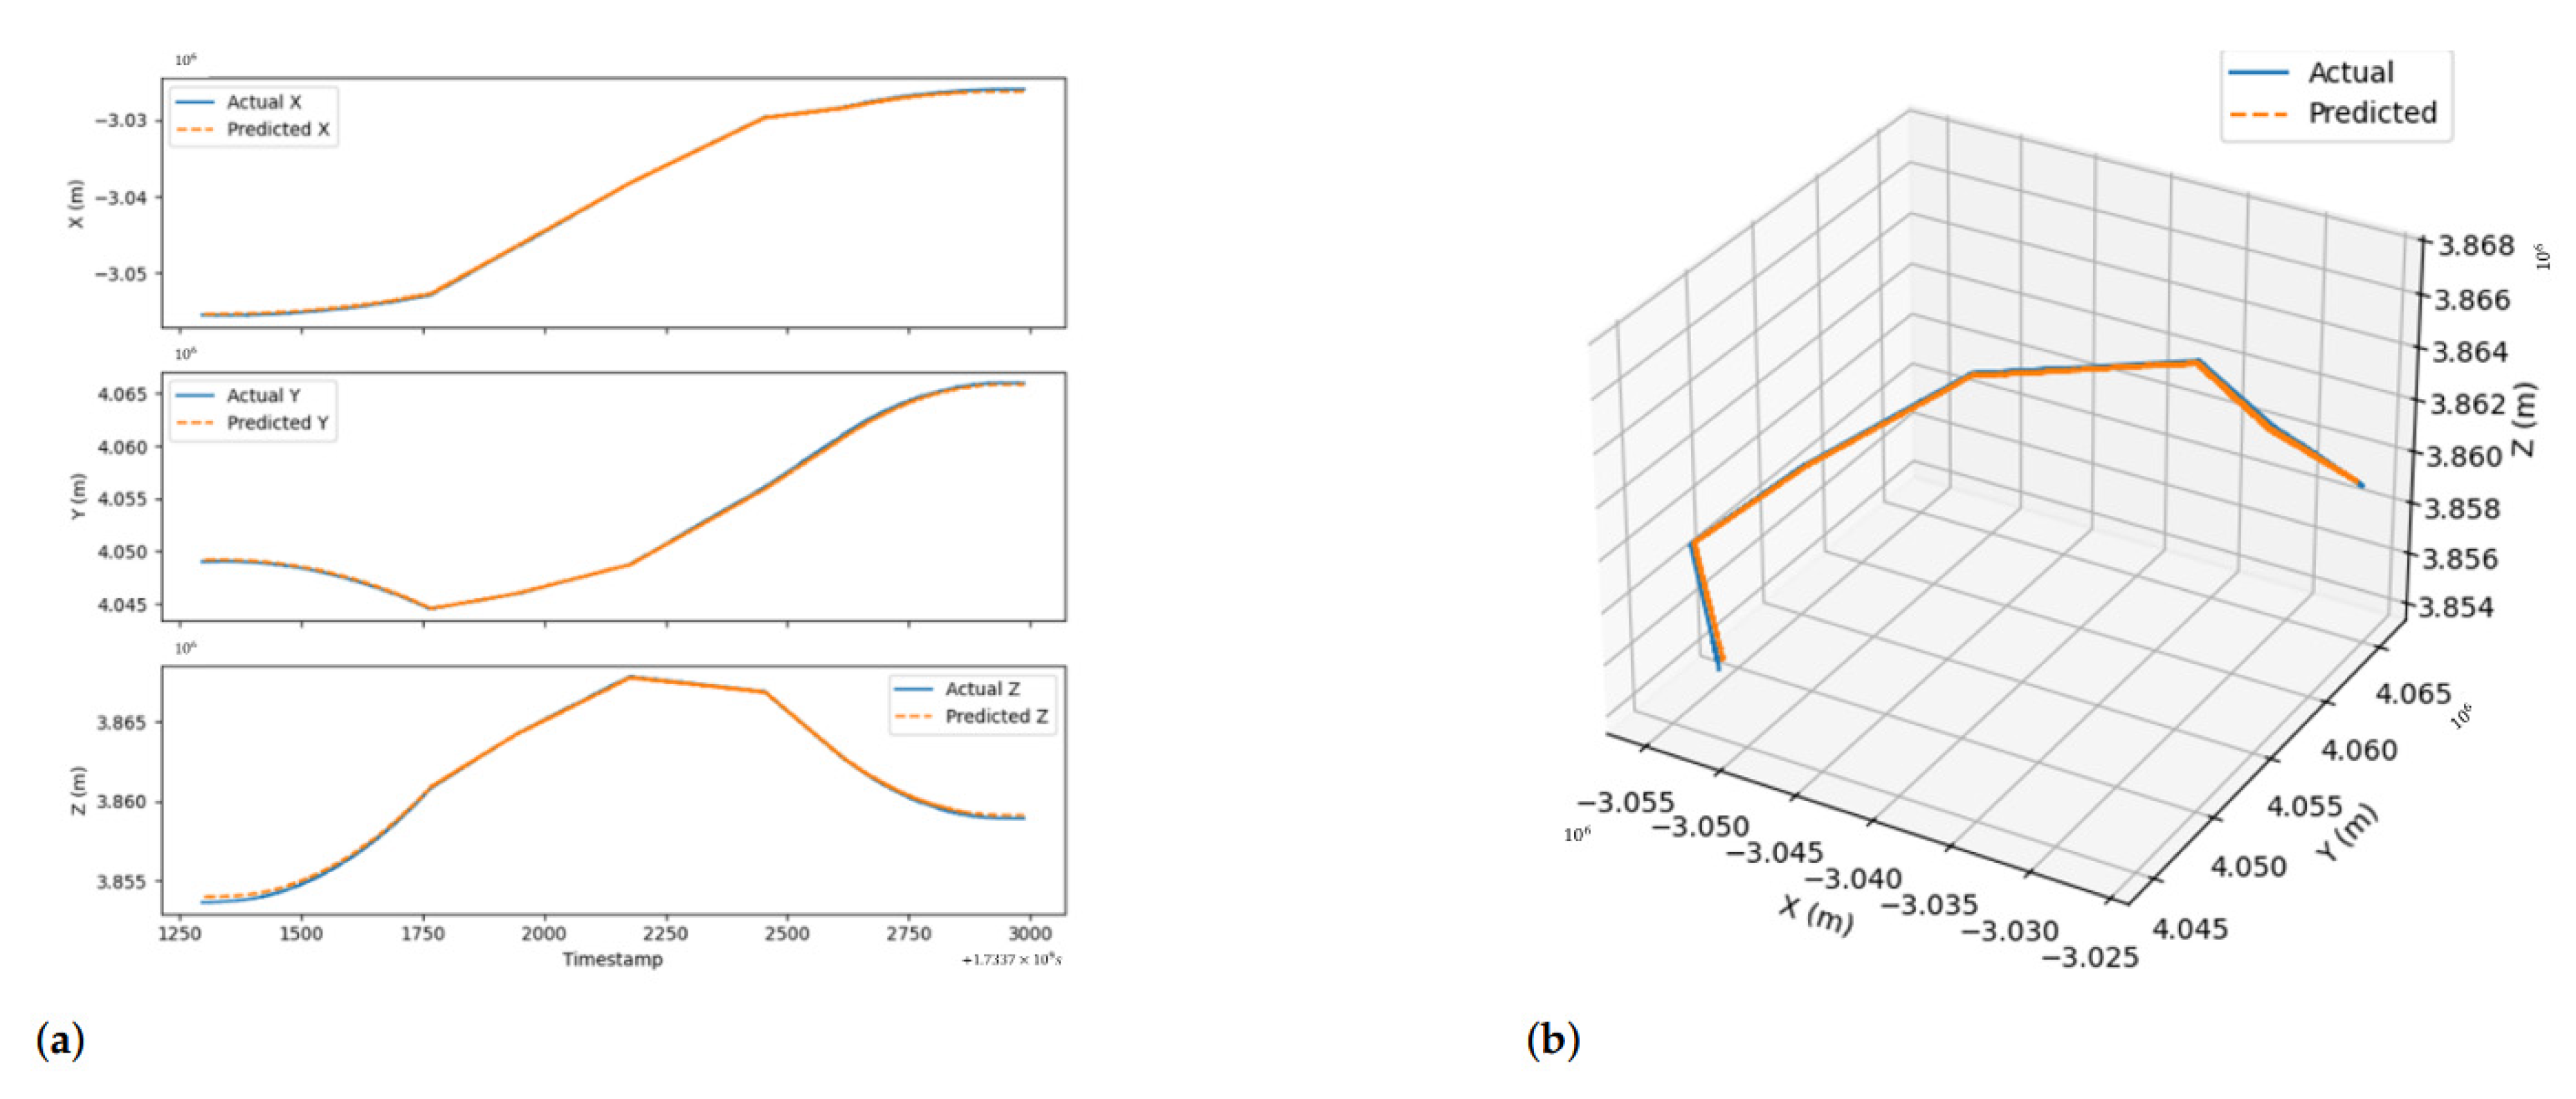
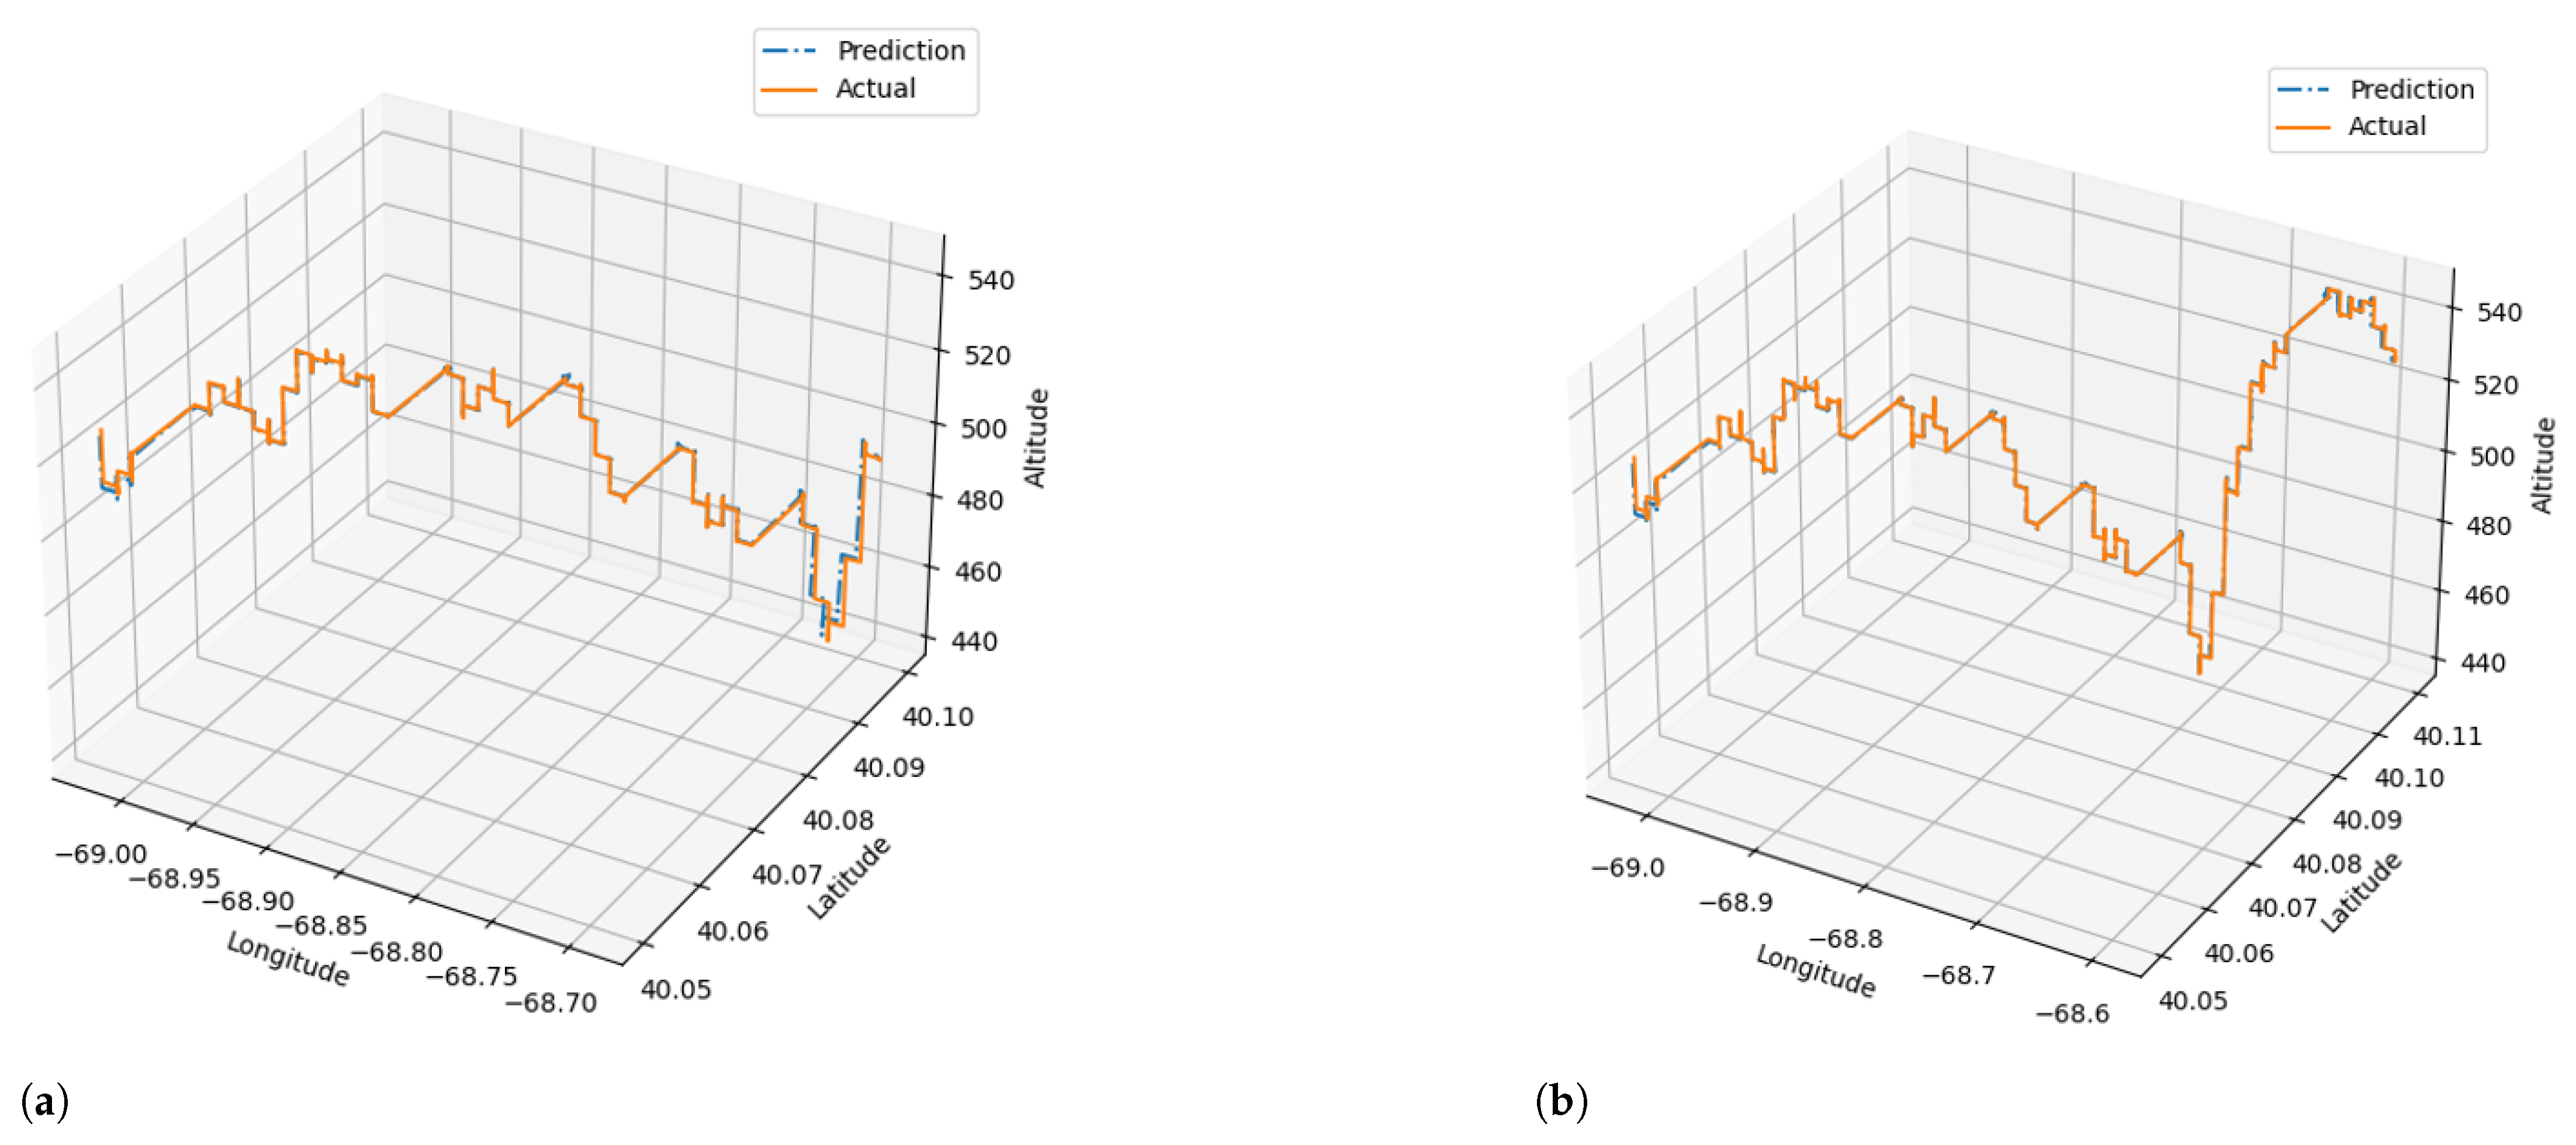
3.1.5. Case Study on LSTM–Attention Model

A case study on 23 unseen UAM flight sequences with a 10 s prediction horizon yielded an overall RMSE of 0.1897, MAE of 0.1157, and MSE of 0.0364 and an average inference latency of 0.97 s. Testing scenarios encompassed diverse operational profiles absent from training to rigorously assess generalization, and Table 7 summarizes these quantitative results. Figure 9a presents 2D plots along the x , y , and z axes, where the blue curves denote the actual trajectories and the orange curves the one-step-ahead predictions—showing tight alignment with minimal temporal lag. Figure 9b overlays the actual (blue) and predicted (orange) 3D flight paths, revealing substantial spatial overlap across all axes. Together, these visual and numerical results confirm that the LSTM–Attention architecture delivers strong predictive accuracy, temporal responsiveness, and robust generalization to novel UAM operational data.
Through a comprehensive evaluation that encompassed quantitative prediction accuracy, inference efficiency, and qualitative visual comparisons, the proposed LSTM–Attention model was demonstrated to be a robust and safety-oriented trajectory prediction framework suitable for real-world UAM applications. The model consistently exhibited low prediction errors across a variety of operational flight conditions while achieving inference speeds compatible with real-time processing constraints. Collectively, these results indicate that the model effectively provides accurate and timely trajectory predictions, even within densely populated and dynamically evolving urban airspace environments.
Given the current scarcity of available commercial UAM flight datasets, additional validation experiments were conducted using helicopter flight logs to further evaluate the practical performance of the LSTM–Attention model. Helicopters share comparable flight characteristics with UAM aircraft, particularly regarding low-altitude maneuverability and short-range transit profiles. Thus, helicopter data were leveraged to enhance the practical applicability of the proposed model through cross-validation. Specifically, the publicly available MetaSLAM helicopter dataset from the GPR Competition, comprising 24,212 samples collected during a 150-km flight segment from Ohio to Pittsburgh, was utilized for quantitative trajectory prediction assessments, accompanied by visual evaluations of prediction results.
Helicopters, similar to eVTOL aircraft, require the rapid processing of high-resolution positional, velocity, and attitude sensor data obtained from GPS sources, especially when operating in complex urban settings. Consequently, employing rotary-wing helicopter data provided an effective means of rigorously evaluating the model’s predictive performance in realistic scenarios closely resembling anticipated UAM conditions.
Table 8 summarizes the predictive accuracy of the LSTM–Attention model evaluated on real-world helicopter flight logs, demonstrating an overall RMSE of 0.4412, MAE of 0.1654, and MSE of 0.1946. Additionally, Figure 10 illustrates two distinct three-dimensional flight trajectories—Flight Path 1 and Flight Path 2—employed solely for case study analysis and not included in the model’s training phase. In both cases, the close alignment between predicted and actual trajectories, marked by minimal spatial deviations, confirms the LSTM–Attention architecture’s capability to accurately replicate complex three-dimensional flight behaviors characteristic of rotary-wing operations. These findings thus reinforce the robustness, reliability, and practical relevance of the proposed model for trajectory prediction within realistic UAM operational contexts.

3.2. Experimental Evaluation of the Collision Prediction Algorithm

3.2.1. Collision Prediction Algorithm Performance Evaluation Method

To rigorously validate the practical applicability of our proposed trajectory prediction framework, we integrated the developed LSTM–Attention-based prediction model with a collision prediction algorithm. This module utilizes trajectory estimates projected 10 s into the future (forward-length = 100), in order to assess potential conflicts and classify flight states into four pre-defined risk levels: Level 4 (Safe), Level 3 (Caution), Level 2 (Warning), and Level 1 (Collision). These classification levels are designed to support safe and reliable UAM system operations by providing tiered risk assessments that align with the urgency and severity of potential mid-air conflicts.
Subsequently, we evaluated the collision prediction algorithm on 23 routes whose data were not used in model training. Using the four-level risk classification (Safe, Caution, Warning, Collision), predicted alerts were compared against ground truth labels to compute the following metrics.
Accuracy = T P + T N T P + T N + F P + F N ,
Precision = T P T P + F P ,
Recall = T P T P + F N ,
F 1 = 2 Precision Recall Precision + Recall .
where T P , T N , F P , and F N denote true positives, true negatives, false positives, and false negatives, respectively.

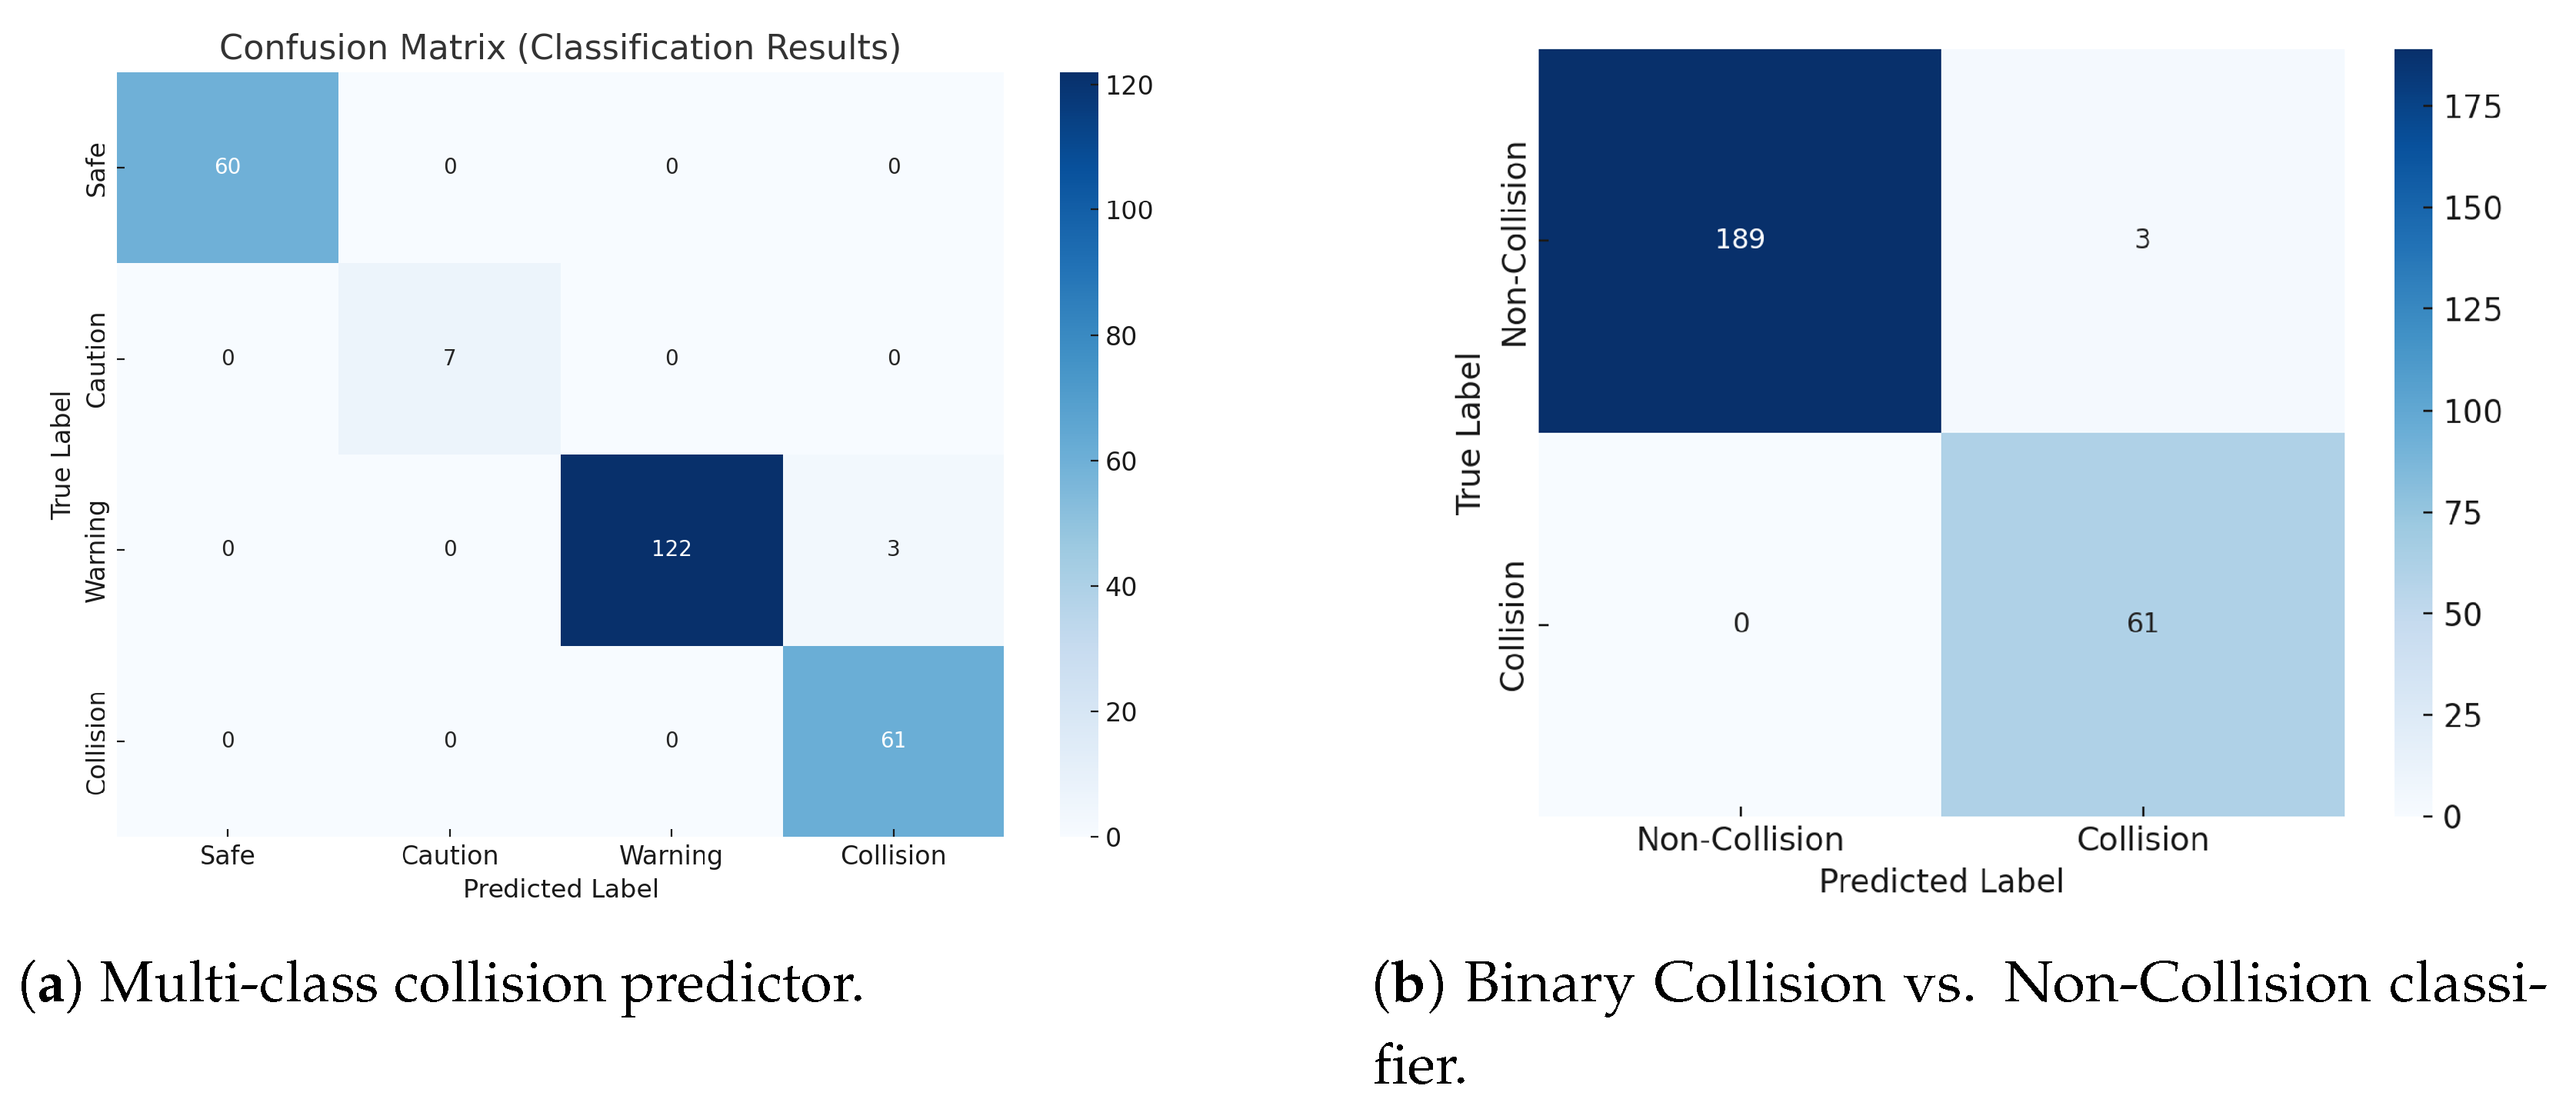
3.2.2. Results of the Collision Prediction

We performed a comprehensive evaluation of our integrated trajectory prediction and collision classification framework under a dynamic multi-agent scenario in which all 23 UAM vehicles were operating simultaneously in a congested urban airspace, using an independent test set of 23 previously unseen UAM flight sequences. This rigorous validation ensures the model’s capability to generalize beyond the data employed during training. The trajectory prediction module, built on the LSTM–Attention architecture, demonstrated excellent predictive accuracy, achieving a mean RMSE of 0.1897, MAE of 0.1157, and MSE of 0.0364, with an average inference latency of 0.97 s over a forward-length prediction horizon of 10 s. These results validate its suitability for real-time applications in dynamic UAM scenarios.
To rigorously evaluate collision risk, we employed a hierarchical four-level classification system: Level 1 (Collision), Level 2 (Warning), Level 3 (Caution), and Level 4 (Safe). Table 9 presents the overall performance metrics for this multi-class classification framework, highlighting exceptional predictive capability across all risk categories. Specifically, the model demonstrated an overall precision of 0.9887, recall of 0.9881, F1-score of 0.9882, accuracy of 0.9881, and area under the receiver operating characteristic curve (AUC) of 0.9950. These metrics collectively underscore the model’s efficacy in accurately discriminating risk levels under diverse and rapidly evolving operational conditions.
Further, detailed insights provided by Figure 11a illustrate the model’s strong discriminative performance, even during challenging flight conditions involving abrupt maneuvers or proximity to restricted airspaces. By converting the four-level taxonomy into a binary classification framework (Collision vs. Non-Collision, the latter aggregating Safe, Caution, and Warning categories), the classifier maintained flawless sensitivity, detecting all collision scenarios without omission. The associated false-positive rate was maintained below 5%, as depicted in Figure 11b, demonstrating the system’s robustness in issuing reliable alerts without excessive false alarms.
Collectively, these outcomes substantiate the robustness and real-time applicability of the proposed LSTM–Attention-based trajectory estimation combined with a systematic multi-level collision risk classification. By delivering highly accurate trajectory predictions 10 s in advance, coupled with reliable risk assessments, our framework significantly advances the capabilities required for ensuring safety and efficiency in autonomous urban air mobility, thereby providing foundational support for future air traffic management architectures.

4. Discussion

This study proposes a deep learning-based trajectory prediction and collision risk classification system designed to support safe operations in the UAM context. In collaboration with Korean Air, a dataset was constructed using realistic flight trajectories intended for future UAM deployment. To evaluate the reliability of the proposed trajectory prediction and collision assessment framework, a comprehensive validation encompassing both predictive accuracy and operational robustness under realistic conditions was conducted. Moreover, the underlying LSTM–Attention model has been integrated into the Safety Nets module’s Short-Term Conflict Alert (STCA) component of the UAM traffic management architecture, where it ingests real-time GPS sensor streams to perform rolling and second-by-second trajectory prediction and generate conflict-aware flight paths; this capability is scheduled for deployment within the operational control system.

4.1. Comparison of RMSE by Number of Attention Heads

To ensure both real-time applicability and consistently robust predictive performance in trajectory prediction for UAM operations, we conducted an ablation study to evaluate the optimal number of attention heads across various recurrent neural network architectures. Specifically, this study examined how variations in the number of parallel attention heads affected prediction accuracy, quantified by the RMSE, using a fixed look-back window length of 50 timesteps. The results, summarized in Table 10, highlight that an optimal configuration of attention heads significantly enhances the model’s predictive precision, reinforcing the critical role of attention mechanisms in capturing complex temporal dependencies inherent in trajectory prediction tasks.
Attention mechanisms enable models to capture multiple temporal dependencies simultaneously; however, increasing the number of heads can introduce redundancy, overfitting, and excessive computational overhead—issues that undermine real-time deployment in resource-constrained systems.
Various attention-head configurations were evaluated for the LSTM–Attention model. Among these, the four-head configuration demonstrated the best overall predictive performance in terms of the RMSE, MAE, and MSE, making it the preferred choice for UAM trajectory prediction.

4.2. Visualization of the Attention Mechanism

We visualized attention weights as heatmaps to reveal which timesteps most influence each prediction, allowing us to detect critical events such as sudden altitude changes or velocity transitions and to uncover hidden biases in focus allocation. These insights guide targeted refinements, including the adjustment of positional encodings and attention heads, and enable domain experts to intuitively assess and trust the model’s decisions. Finally, the consistency of attention patterns across diverse samples demonstrates the model’s strong generalization and robustness.
As illustrated in Figure 12, analysis of the LSTM–Attention model’s attention heatmap reveals that the initial timestep—corresponding to the sequence’s departure point—consistently receives the greatest weight, indicating that the model prioritizes departure-point information as the fundamental basis for trajectory prediction. Furthermore, recurrently amplified attention in certain intermediate timesteps demonstrates the model’s capacity to pinpoint and emphasize those moments that exert decisive influence on prediction under dynamic trajectory conditions. Importantly, this pattern of salient timestep detection further validates the appropriateness of a 50-step look-back window for optimizing predictive accuracy. Collectively, these findings confirm that the model transcends simple sequence compression by dynamically identifying and weighting critical timesteps, thereby substantially enhancing UAM flight path prediction performance.

4.3. Contributions of This Study

This study delivers a unified framework for UAM safety by combining precise trajectory prediction with proactive collision detection. At its core lies the LSTM–Attention model, whose LSTM layers capture temporal dependencies and whose multi-head attention mechanism highlights the most influential past timesteps. The proposed model achieves state-of-the-art prediction accuracy and robust generalization to unseen routes, ensuring reliable, long-term predictions with minimal retraining. By reducing trajectory uncertainty, it can be seamlessly integrated into existing air traffic management systems to enable real-time conflict avoidance and enhance overall operational efficiency.
As shown in Table 11, our LSTM–Attention model, trained on an unprecedented dataset of approximately 670,000 trajectory points—far exceeding the scale of prior work—consistently outperforms existing approaches. It achieved an RMSE of 0.2172 for one-step-ahead predictions and sustained an RMSE of 0.2530 at t + 10 s, demonstrating both immediate precision and long-horizon reliability. Evaluation on rotary-wing helicopter flight logs further yielded an RMSE of 0.4412, MAE of 0.1654, and MSE of 0.1946, confirming the model’s robustness and applicability to real-world UAM scenarios. These results highlight the clear advantage of our architecture in terms of predictive accuracy and generalization relative to contemporary state-of-the-art methods.
As detailed in Table 12, the present study represents a significant advance over earlier efforts that were constrained to small cohorts of vehicles or relied on simplistic extrapolation techniques and single-step LSTM models. By concurrently predicting the flight paths of up to twenty-three UAM vehicles, our approach not only captures complex multi-aircraft interactions but also preserves high temporal fidelity across extended prediction horizons. The deployment of an advanced LSTM–Attention architecture yields exceptionally accurate trajectory estimates, which form the foundation for a downstream collision prediction module achieving 0.9881 classification accuracy and an AUC of 0.9950. These performance metrics reflect both a minimal false alarm rate and robust detection capability under conditions closely emulating real-world operational environments. Collectively, these findings substantiate the scalability, reliability, and safety of our integrated framework, thereby establishing it as a compelling candidate for the commercial rollout of UAM services where stringent certification and regulatory standards must be met.
Despite promising outcomes, several limitations must be acknowledged. First, the model was trained solely on idealized clear-sky simulations, leaving its robustness under variable meteorological conditions, such as wind, turbulence, and precipitation, untested. Second, to establish a stable inter-aircraft trajectory and collision prediction baseline, we deliberately excluded environmental factors, including sensor noise, communication latency, pilot interventions, and obstacle detection. Given the nascent stage of UAM commercialization and the lack of accurately modeled disruptions, most notably wind and in-path obstacles, in current UAV swarm simulations [27], this study initially focuses on GPS-derived trajectory and collision prediction to establish a resilient baseline.
Upon integration into a centralized UAM traffic management system, the proposed framework will enable controllers to monitor vehicle states and projected flight paths in real time across urban regions. Its centralized architecture supports concurrent data fusion from geographically dispersed UAM vehicles, which facilitates rapid and precise proximity risk assessments and enables proactive collision mitigation.
Our phased approach, beginning with deep learning based solely on GPS for trajectory prediction and foundational collision prediction, ensures the reliability and stability required for early operational deployment. This foundation paves the way for the incremental integration of advanced capabilities such as meteorological sensor networks and obstacle detection systems, thus laying the groundwork for a comprehensive and commercially viable UAM traffic management solution.
The primary contribution of this research lies in developing a centralized UAM safety system featuring GPS-based trajectory prediction and multi-aircraft collision prediction. Future work will extend this foundation by incorporating diverse environmental variables, obstacle awareness, and explicit collision avoidance strategies, thereby advancing the safety, efficiency, and market readiness of urban air mobility services.

5. Conclusions

This study introduced an LSTM–Attention-based framework for urban air mobility trajectory prediction and collision risk classification, trained on 56 high-fidelity simulated routes. By applying an ECEF coordinate transformation, it achieved a trajectory RMSE of 0.2172 and a four-level risk classification accuracy of 0.9881 on unseen data, demonstrating both robustness and generalizability.
Future work will extend this baseline, which is currently limited to clear-sky simulations and excludes sensor noise, communication delays, pilot interventions, and obstacle data, by incorporating atmospheric variability, sensor and link uncertainties, and obstacle detection inputs. These enhancements will advance the system toward a fully integrated UAM traffic-management solution with comprehensive situational awareness.

Author Contributions

Conceptualization, H.Y., S.Y. and K.L.; methodology, H.Y. and S.Y.; software, H.Y., S.Y., J.K. and Y.K.; validation, S.Y., J.K. and Y.K.; formal analysis, H.Y.; investigation, J.K.; resources, J.K. and Y.K.; data curation, J.K. and Y.K.; writing—original draft preparation, H.Y.; writing—review and editing, H.Y. and S.Y.; visualization, H.Y.; supervision, K.L. All authors have read and agreed to the published version of the manuscript.

Funding

This study was supported by the Ministry of Land, Infrastructure and Transport and the Korea Agency for Infrastructure Technology Advancement (Project No. RS-2022-00143965). This work was supported by BK21 FOUR Program by Chungnam National University Research Grant, 2025.

Data Availability Statement

The original contributions presented in this study are included in the article. Further inquiries can be directed to the corresponding author.

Conflicts of Interest

The authors declare no conflicts of interest.

References

  1. Bauranov, A.; Rakas, J. Designing airspace for urban air mobility: A review of concepts and approaches. Prog. Aerosp. Sci. 2021, 125, 100726. [Google Scholar] [CrossRef]
  2. Straubinger, A.; Rothfeld, R.; Shamiyeh, M.; Rudolph, F.; Plötz, A.; Kaiser, J.; Antoniou, C. An overview of current research and developments in urban air mobility—Setting the scene for UAM introduction. J. Air Transp. Manag. 2020, 87, 101852. [Google Scholar] [CrossRef]
  3. UAM Team Korea. K-UAM Concept of Operations 1.0. Technical Report Version 1.0; Ministry of Land, Infrastructure and Transport (MOLIT): Sejong City, Republic of Korea, 2021. [Google Scholar]
  4. Joby Aviation. Website and Media Assets; Joby Aero, Inc.: Santa Cruz, CA, USA, 2025; Available online: https://www.jobyaviation.com/ (accessed on 5 June 2025).
  5. Savita, V. Exploration of Near-term Potential Routes and Procedures for Urban Air Mobility. In Proceedings of the Aviation Technology, Integration and Operations Conference, Dallas, TX, USA, 17–21 June 2019. [Google Scholar]
  6. Neto, E.C.P.; Baum, D.M.; Junior, J.R.d.A.; Junior, J.B.C.; Cugnasca, P.S. Trajectory-based urban air mobility (UAM) operations simulator (TUS). arXiv 2019, arXiv:1908.08651. [Google Scholar]
  7. Zhang, A.; Zhang, B.; Bi, W.; Mao, Z. Attention based trajectory prediction method under the air combat environment. Appl. Intell. 2022, 52, 17341–17355. [Google Scholar] [CrossRef]
  8. Zhu, R.; Yang, Z.; Chen, J. Conflict risk assessment between non-cooperative drones and manned aircraft in airport terminal areas. Appl. Sci. 2022, 12, 10377. [Google Scholar] [CrossRef]
  9. Chen, K.; Zhang, P.; You, L.; Sun, J. Research on Kalman Filter Fusion Navigation Algorithm Assisted by CNN-LSTM Neural Network. Appl. Sci. 2024, 14, 5493. [Google Scholar] [CrossRef]
  10. Wu, S.; Mao, F. uAV collision avoidance system based on ADS-B real-time information. In Proceedings of the 2023 5th International Symposium on Robotics & Intelligent Manufacturing Technology (ISRIMT), Changzhou, China, 22–24 September 2023; pp. 275–279. [Google Scholar]
  11. Tong, L.; Gan, X.; Wu, Y.; Yang, N.; Lv, M. An ADS-B information-based collision avoidance methodology to UAV. Actuators 2023, 12, 165. [Google Scholar] [CrossRef]
  12. Liu, T.; Xu, X.; Lei, Z.; Zhang, X.; Sha, M.; Wang, F. A multi-task deep learning model integrating ship trajectory and collision risk prediction. Ocean Eng. 2023, 287, 115870. [Google Scholar] [CrossRef]
  13. National Imagery and Mapping Agency (NIMA). Department of Defense World Geodetic System 1984: Its Definition and Relationships with Local Geodetic Systems. Technical Report NIMA TR8350.2; National Imagery and Mapping Agency: Bethesda, MA, USA, 2000. [Google Scholar]
  14. Yoon, S.; Jang, D.; Yoon, H.; Park, T.; Lee, K. GRU-based deep learning framework for real-time, accurate, and scalable UAV trajectory prediction. Drones 2025, 9, 142. [Google Scholar] [CrossRef]
  15. Hochreiter, S.; Schmidhuber, J. Long short-term memory. Neural Comput. 1997, 9, 1735–1780. [Google Scholar] [CrossRef] [PubMed]
  16. Ba, J.L.; Kiros, J.R.; Hinton, G.E. Layer normalization. arXiv 2016, arXiv:1607.06450. [Google Scholar]
  17. Vaswani, A.; Shazeer, N.; Parmar, N.; Uszkoreit, J.; Jones, L.; Gomez, A.N.; Kaiser, Ł.; Polosukhin, I. Attention is all you need. Adv. Neural Inf. Process. Syst. 2017, 30, 1–11. [Google Scholar]
  18. Kingma, D.P.; Ba, J.L. Adam: A Method for Stochastic Optimization. arXiv 2014, arXiv:1412.6980. [Google Scholar]
  19. International Civil Aviation Organization. Annex 10—Aeronautical Telecommunications, Volume IV: Surveillance and Collision Avoidance Systems, 7th ed.; ICAO: Montreal, QC, Canada, 2020. [Google Scholar]
  20. Radio Technical Commission for Aeronautics. Minimum Operational Performance Standards for Traffic Alert and Collision Avoidance System (TCAS) Change 7.0; RTCA: Washington, DC, USA, 2013. [Google Scholar]
  21. EUROCONTROL. Specification for TCAS II Operating Procedures. 2018. Available online: https://www.eurocontrol.int/publication/specification-tcas-ii (accessed on 15 April 2025).
  22. Stjernberg, J.; Durnford, P.; van Egmond, P.; Krivohlavek, J.; Martijnse-Hartikka, R.; Solbø, S.A.; Wachter, F.; Wigler, K. Guidebook for Urban Air Mobility Integration: AiRMOUR Deliverable 6.4; AiRMOUR Consortium/European Union Aviation Safety Agency. 2023. Available online: https://www.easa.europa.eu/sites/default/files/dfu/airmour_-_d6.4_guidebook_for_uam_integration_process_management.pdf (accessed on 15 April 2025).
  23. Cho, K.; Van Merriënboer, B.; Gulcehre, C.; Bougares, F.; Schwenk, H.; Bengio, Y. Learning phrase representations using RNN encoder–decoder for statistical machine translation. In Proceedings of the 2014 Conference on Empirical Methods in Natural Language Processing (EMNLP), Doha, Qatar, 25–29 October 2014; pp. 1724–1734. [Google Scholar]
  24. Schuster, M.; Paliwal, K.K. Bidirectional recurrent neural networks. IEEE Trans. Signal Process. 1997, 45, 2673–2681. [Google Scholar] [CrossRef]
  25. Chung, J.; Gülçehre, Ç.; Cho, K.; Bengio, Y. Empirical evaluation of gated recurrent neural networks on sequence modeling. arXiv 2014, arXiv:1412.3555. [Google Scholar]
  26. Donahue, J.; Hendricks, L.A.; Guadarrama, S.; Rohrbach, M.; Venugopalan, S.; Saenko, K.; Darrell, T. Long-term recurrent convolutional networks for visual recognition and description. In Proceedings of the IEEE Conference on Computer Vision and Pattern Recognition (CVPR), Boston, MA, USA, 7–12 June 2015; pp. 2625–2634. [Google Scholar]
  27. Phadke, A.; Medrano, F.A.; Chu, T.; Sekharan, C.N.; Starek, M.J. Modeling wind and obstacle disturbances for effective performance observations and analysis of resilience in UAV swarms. Aerospace 2024, 11, 237. [Google Scholar] [CrossRef]
Figure 2. Detailed module of UAM traffic management system designed by in Korean AIR.
Drones 09 00460 g002
Figure 3. Overall workflow for UAM trajectory prediction and collision risk assessment. Starting from raw UAM trajectory data, the pipeline performs data preprocessing, feeds the cleaned inputs into a deep-learning model for real-time trajectory prediction, and then evaluates pairwise trajectories to predict future collisions, triggering a collision-alert generation when a risk is detected. Question-mark symbols indicate predictions of whether a future collision will occur, and colored dots denote the predicted future trajectory points.
Drones 09 00460 g003
Figure 4. Actual UAM demonstration route map based on projected corridors in the Seoul Capital Area.
Drones 09 00460 g004
Figure 5. Based on the Seoul Capital Area UAM demonstration network, eight vertiports are designated (numbered markers), from which all possible combinations yield 56 flight corridors (solid lines); “N” and “S” denote North and South, respectively, with each representing a vertiport.
Drones 09 00460 g005
Figure 6. Comparison of flight trajectory representations. (a) A trajectory represented in the geodetic coordinate system, and (b) the same trajectory after transformation into the ECEF coordinate system, which yields a more linear representation due to unified metric scaling.
Drones 09 00460 g006
Figure 7. An illustration of our data labeling scheme. We divide each flight log into overlapping windows: the look-back window captures recent trajectory history, and the forward-length window defines the future point used as the prediction target.
Drones 09 00460 g007
Figure 8. Four-level collision risk classification.
Drones 09 00460 g008
Figure 9. Case study evaluation on UAM data not used during training: (a) decomposed two-dimensional coordinate predictions for the x, y, and z axes and (b) full three-dimensional trajectory overlay comparing true and predicted paths.
Drones 09 00460 g009
Figure 10. Three-dimensional trajectory predictions on real-world helicopter logs exhibiting UAM–like flight characteristics. (a) Flight Path 1: ground truth vs. model-predicted routes. (b) Flight Path 2: ground truth vs. model-predicted routes.
Drones 09 00460 g010
Figure 11. Confusion matrices for (a) multi-class collision prediction across Safe, Caution, Warning, and Collision conditions and (b) binary Collision vs. Non-Collision classification.
Drones 09 00460 g011
Figure 12. Attention heatmap of a sample trajectory. Colors indicate the attention weights assigned by each query timestep to each key timestep.
Drones 09 00460 g012
Table 1. Comparison of deep learning-based trajectory prediction methods. ‘t+1 Performance’ refers to the performance in the immediately following timestep, while ‘t+max Performance’ indicates that in the maximum prediction.
ReferenceData TypeNumber of DataCoordinate TransformationDeep Learning ModelEvaluation MetricMax. Prediction Timet+1 Performancet+max Performance
Zhang et al.
(2022) [7]
Simulation Flight Data3890ECEFAttConv
LSTM
MAE2.5 s2.09 (MAE)45.73 (MAE)
Zhu et al.
(2022) [8]
Drone39,548ECEFGRURMSE, MAE, MAPE40 s15.65 (RMSE)161.73 (RMSE)
Chen et al.
(2024) [9]
Drone-ECEFCNN + LSTMRMSE3 sx, y: 0.1336; z: 0.0108 (RMSE)-
Table 2. Comparison of collision detection methods based on trajectory prediction.
ReferenceData TypeVariables UsedNo. of TargetsTrajectory Prediction MethodPrediction Performance
Wu et al.
(2023) [10]
ADS-B UAVlatitude, longitude, altitude, velocity7Straight-line extrapolation
Tong et al.
(2022) [11]
ADS-B UAVlatitude, longitude, altitude, speed, heading2Kalman Filter
Liu et al.
(2023) [12]
AIS shiplatitude, longitude, speed, heading, ship lengthLSTMAccuracy: 98.3%
Table 3. Aircraft data parameters.
#ItemDescriptionUnit
1Registration numberAircraft identifier
2RouteName of route
3TimestampTime of datatime
4SizeSize of aircraft15 m
5Long.Longitudedeg
6Lat.Latitudedeg
7Alt.Altitudem
8Horizontal speedAircraft’s horizontal speedm/s
9Vertical speedAircraft’s vertical speedm/s
10DirectionFlight directiondeg
Table 4. Performance metrics of the LSTM–Attention model for different look-back window lengths.
Look-Back (Timesteps)RMSEMAEMSE
100.22990.05280.1685
300.22950.05270.1694
500.21720.05240.1668
1000.23410.05480.1725
Bolds are used to highlight the best performance value in the table.
Table 5. RMSE values obtained using geodetic and Earth-Centred Earth-Fixed coordinate representations with a look-back window of 50 timesteps. The reduction column indicates the decrease in error following conversion.
ModelGeodetic RMSEECEF RMSEReduction
GRU0.29290.2440−0.0489
LSTM0.51770.2429−0.2748
Bi-LSTM0.43330.2435−0.1898
Bi-GRU0.30680.2442−0.0626
CNN–LSTM0.29300.2436−0.0494
Transformer0.30560.2259−0.0797
GRU–Attention0.38880.2434−0.1454
LSTM–Attention0.25310.2172−0.0359
Bolds are used to highlight the best performance value in the table.
Table 6. Inference metrics for different forward-length values. Look-back window fixed at 50 timesteps.
Forward-LengthRMSEMAEMSEInference Time (ms)
00.21720.16680.05240.5088
5 (0.5 s)0.23910.17110.05720.5266
10 (1 s)0.24140.17370.05830.5272
15 (1.5 s)0.24150.17340.05830.5390
20 (2 s)0.24080.17360.05800.5226
100 (10 s)0.24170.17280.05840.5196
Table 7. Overall trajectory prediction error metrics on UAM data.
ModelRMSEMAEMSE
LSTM–Attention0.18970.11570.0364
Table 8. Overall trajectory prediction error metrics on real world helicopter flight data.
ModelRMSEMAEMSE
LSTM–Attention0.44120.16540.1946
Table 9. Overall collision prediction classification metrics.
PrecisionRecallF1-ScoreAccuracyAUC
Overall0.98870.98810.98820.98810.9950
Table 10. Comparison of model performance by number of attention heads.
ModelHeadsRMSEMAEMSE
LSTM–Attention40.21720.16680.0524
80.22900.16860.0524
GRU–Attention40.22960.16880.0527
80.22870.16830.0523
CNN–LSTM–Attention40.22920.16730.0525
80.22700.16540.0515
Table 11. Comparison of our UAM trajectory prediction model with previous prediction studies. ‘t+1 Performance’ refers to the performance in the immediately following timestep, while ’t+max Performance’ indicates that in the maximum prediction.
ReferenceData TypeNumber of DataCoordinate TransformationDeep Learning ModelEvaluation MetricMax. Prediction Timet+1 Performancet+max Performance
Zhang et al.
(2022) [7]
Simulation Flight Data3890ECEFAttConv
LSTM
MAE2.5 s2.09 (MAE)45.73 (MAE)
Zhu et al.
(2022) [8]
Drone39,548ECEFQRDGRURMSE, MAE, MAPE40 s15.65 (RMSE)161.73 (RMSE)
Chen et al.
(2024) [9]
DroneECEFCNN+LSTMRMSE3 sx, y: 0.1336, z: 0.0108 (RMSE)
Ours (2025)Simulation UAM Data670,000ECEFLSTM–AttentionRMSE, MSE, MAE10 s0.2172 (RMSE)
0.1668 (MAE)
0.0524 (MSE)
0.2417 (RMSE)
0.1728 (MAE)
0.0584 (MSE)
Bolds are used to highlight our own results.
Table 12. Comparison of our model with previous collision prediction studies.
ReferenceData TypeVariables UsedNo. of TargetsTrajectory Prediction MethodPrediction Performance
Wu et al. (2023) [10]ADS-B UAVlatitude, longitude, altitude, velocity7Straight-line extrapolation
Tong et al. (2022) [11]ADS-B UAVlatitude, longitude, altitude, speed, heading2Kalman Filter
Liu et al. (2023) [12]AIS shiplatitude, longitude, speed, heading, ship lengthLSTMAccuracy: 98.3%
Ours (2025)UAMlatitude, longitude, altitude, velocity23LSTM–AttentionAccuracy: 98.81%
Bolds are used to highlight our own results.
Disclaimer/Publisher’s Note: The statements, opinions and data contained in all publications are solely those of the individual author(s) and contributor(s) and not of MDPI and/or the editor(s). MDPI and/or the editor(s) disclaim responsibility for any injury to people or property resulting from any ideas, methods, instructions or products referred to in the content.

