Article

Detection and Geolocation of Peat Fires Using Thermal Infrared Cameras on Drones

1
Astrophysics Research Institute, Liverpool John Moores University, Brownlow Hill, Liverpool L3 5RF, UK
2
Central Kalimantan, Indonesia’s—Center for International Cooperation in Sustainable Management of Tropical Peatland (UPT LLG—CIMTROP UPR), University of Palangka Raya, Kota Palangka Raya 74874, Indonesia
3
School of Computer Science and Mathematics, Liverpool John Moores University, Byrom Street, Liverpool L3 3AF, UK
4
School of Biological and Environmental Sciences, Liverpool John Moores University, Byrom Street, Liverpool L3 3AF, UK
*
Author to whom correspondence should be addressed.
Drones 2025, 9(7), 459; https://doi.org/10.3390/drones9070459
Submission received: 17 March 2025 / Revised: 30 May 2025 / Accepted: 4 June 2025 / Published: 25 June 2025

Abstract

Peat fires are a major hazard to human and animal health and can negatively impact livelihoods. Once peat fires start to burn, they are difficult to extinguish and can continue to burn for months, destroying biomass and contributing to carbon emissions globally. In areas with limited accessibility and periods of thick haze and fog, these fires are difficult to detect, localize, and tackle. To address this problem, thermal infrared cameras mounted on drones can provide a potential solution since they allow large areas to be surveyed relatively quickly and can detect thermal radiation from fires above and below the peat surface. This paper describes a deep learning pipeline that detects and segments peat fires in thermal images. Controlled peat fires were constructed under varying environmental conditions and thermal images were taken to form a dataset for our pipeline. A semi-automated approach was adopted to label images using Otsu’s adaptive thresholding technique, which significantly reduces the required effort often needed to tag objects in images. The proposed method uses a pre-trained ResNet-50 model as a backbone (encoder) for feature extraction and is augmented with a set of up-sampling layers and skip connections, like the UNet architecture. The experimental results show that the model can achieve an IOU score of 87.6% on an unseen test set of thermal images containing peat fires. In comparison, a MobileNetV2 model trained under the same experimental conditions achieved an IOU score of 57.9%. In addition, the model is robust to false positives, which is indicated by a precision equal to 94.2%. To demonstrate its practical utility, the model was also tested on real peat wildfires, and the results are promising, as indicated by a high IOU score of 90%. Finally, a geolocation algorithm is presented to identify the GNSS location of these fires once they are detected in an image to aid fire-fighting responses. The proposed scheme was built using a web-based platform that performs offline detection and allows peat fires to be geolocated.

1. Introduction

Peat and forest fires have gained the attention of governments and non-government organizations in recent years as they are now an environmental and economic issue, particularly across densely populated regions in Southeast Asia. They comprise both flaming and smouldering combustion [1]. Wildfires in peatlands can be attributed to the burning of porous fuels, vegetation, and litter [2]. They can propagate deep into the soil and burn slowly for long periods of time. The incomplete combustion that occurs during peat fires means that many toxic particulates are released into the atmosphere, leading to degraded air quality conditions for people and animals in the affected areas.
In tropical nations such as Indonesia, these large-scale peat fires are a huge re-occurring problem. This is illustrated by the devastating consequences of the 2015 fires, in which an area of 4.6 million hectares was burnt [3]. These fires led to economic losses for millions of Indonesian people, and the World Bank estimated that tens of millions of people suffered serious health problems. A peer-reviewed study estimated that 69 million people were exposed to smoke haze pollution for 3 months and 100,300 deaths arose from these fires [4]. In addition to the human tragedy this presents, losing so many lives has resulted in huge long-term economic losses for the country. The high carbon content contained within peat makes it one of Nature’s most efficient carbon stores; therefore, burning peat contributes significantly to anthropogenic carbon emissions [2]. Detecting and extinguishing peat fires at an early stage is of vital importance if we are to mitigate the effects caused by large, out-of-control peat fires.
Fighting fires on peatlands is difficult and dangerous work owing to limited accessibility and visibility, particularly in remote forested areas. Fire-fighting is traditionally carried out on foot by experts surveying the terrain. More recently, satellite imagery-based systems have been proposed for fire detection [5]. However, in many cases the temporal and spatial resolutions of these systems are still very low for effective forest fire-fighting, especially where haze impacts detection by satellites [6].
This has resulted in an increased use of drones to tackle these problems [7,8]. The rapid maneuverability of drones and their extended operational range and improved personal safety provide an alternative solution. They can be used to survey large areas quickly from the air, whilst allowing the pilot to remain at a safe distance from the hazardous site. Additionally, the operating costs of drones are considerably lower than those of satellite-based systems [9].
Beyond the requirements for flexibility drones fulfill, it is crucial to be able to process data received from drones and pinpoint the locations of fires quickly. Processing this data offline manually is slow, time-intensive, and costly. Recently, deep convolutional neural networks (CNNs) have become the standard models used for image processing tasks. In particular, object detection and segmentation have been successfully applied to various image and video recognition applications [10]. This has largely been due to advancements in deep learning, high-performance hardware, and data availability. CNN models trained to identify peat fires from images can rapidly speed up the analysis process in both off- and online modes, especially now it is possible to stream data directly from consumer drones.
The rest of this paper is organized as follows: Section 2 presents a comprehensive literature review of the existing UAV-based fire detection techniques. Section 3 describes the data collection and model architecture. Section 4 discusses the results and provides a discussion of the proposed model architecture. Finally, Section 5 concludes the paper.

2. Background

Zhao et al. [11] used a drone equipped with GNSS and deployed a saliency detection algorithm for the localization and segmentation of fire regions in aerial images. A 15-layered self-learning architecture was employed for both low- and high-level fire feature extraction and classification. In a similar project, Tang et al. [12] captured 4K data from a drone and introduced a coarse-to-fine framework for detecting sparse, small, and irregularly shaped fires. The coarse detector adaptively selected sub-regions containing objects of interest. The fine detector was passed the details of the sub-regions to subject them to further scrutiny. In [13], Jiao et al. deployed a large-scale YOLOv3 network for forest fire detection that captured images of fires from a drone and transmitted them to a ground station for further analysis.
The studies mentioned relied on RGB cameras for data acquisition, which use the visual wavelength range of light. This means that RGB cameras can be constrained, and the quality of data can vary significantly, depending on the environmental conditions, such as rain, fog, and day and night cycles. Another constraint is that visual-spectrum cameras are unable to detect fires through haze [14]. As a result, their use in peat fire detection is limited.
To overcome these peat fire detection constraints, the use of thermal infrared (TIR) cameras has been proposed to detect peat fires through fog and smoke. Their wavelengths are longer than optical (visible) wavelengths (thermal infrared wavelengths are 8–14 µm, compared to optical wavelengths of 0.6–0.9 µm). The thermal infrared wavelengths of light can pass through different types of suspended particulate matter—such as smoke or fog—unhindered, whereas visible light is scattered [15]. Consequently, thermal sensors have proven to be far more robust at detecting fires in challenging environments. A further justification for the use of thermal infrared cameras is the fact that visible-spectrum imaging sensors are less sensitive to heat flux. Hotter objects emit TIR radiation and appear as very bright pixels in TIR imagery. This makes the automated detection of fires with TIR cameras a much more viable solution than that using their RGB counterparts. For these reasons, we chose to apply deep learning techniques to thermal images for automated fire detection rather than to RGB images. It is worth highlighting that there has been some work on multimodal fusion for fire detection. Ref. [16] combines the use of SAR sensors and Optical Sensors for real-time wildfire monitoring Similarly, Ref. [17] combines the use of visual and infrared images to improve fire detection using a pre-trained U-Net 50 architecture with a ResNet50 encoder.
For early and reliable fire detection, an approach that is robust to varying environmental conditions is required. This paper investigates whether peat fires can be reliably detected using an off-the-shelf drone equipped with a thermal infrared camera and deep learning. We first propose a semi-automated approach for data annotation to speed up the data tagging process in the deep learning pipeline. Secondly, we propose a method to train a UNet-like architecture for fire detection. The proposed method is robust for the detection of fires at varying scales and under varying environmental conditions. Finally, we present a geolocation algorithm to identify the GNSS location of detected fires, which is useful for fire-fighting crews so that they can act accordingly. Our approach proved very easy to train and the trained model converged to a reliable solution in just a few epochs, hence saving computing resources and time.

3. Methodology

In this study, carefully controlled peat fires were constructed in degraded peatland near Palangkaraya in Central Kalimantan, Indonesia. A series of pits were dug to house fires, as shown in Figure 1. The fires were contained in an aluminum cylinder with a 30 cm × 19 cm diameter and filled with charcoal briquettes (approx. a 2.8 kg capacity). The experimental setup for the fires was similar to the one described in [15].

3.1. Data Collection

A DJI MAVIC Dual Enterprise equipped with a FLIR Lepton Thermal sensor (HFOV of 57°, resolution of 160 × 120) as well as a RGB sensor (FOV of 85°, resolution of 1920 × 1080) was used to collect images above the fire pits. Although the thermal sensor had a resolution of 160 × 120 pixels, the thermal images were internally upscaled to 640 by 480 pixels [18]. A total of ten experiments were performed to capture different-sized fires from the drone under varying weather conditions. A variable number of aluminum cylinders were used to control the size of the fires for different experiments. The sizes of the fires were in the range of 3–5 m. The experiments were performed under weather conditions of between 27 and 33 °C, 60–75% humidity, light winds of 1–5 km/h, and a pressure of 1007–1009 hPa. During each experiment the drone flew above the fire at a starting height of 5 m, increasing to 100 m over a period of 5 min. The increase in the surface temperature above an underground fire in comparison to the ambient ground temperature made the fires easily distinguishable in the thermal images (see Figure 2). A total of 1800 images were gathered. The images were split into three non-overlapping sets of images: a training set (80%), a validation set (10%), and a test set (10%). Augmentation techniques such as Random Cropping, changes in the brightness and contrast, and random affine and perspective changes were used to increase the size of the training set for generalization purposes.
In Figure 2 above, the top panels show RGB images of the controlled fires at a height of 60 m (left) and 80 m (right) above the ground. The panels directly below the RGB images show thermal images taken at the same time as the RGB images. The fires show up clearly as hot (white) spots in the centre of the thermal images but are not visible in the RGB images.

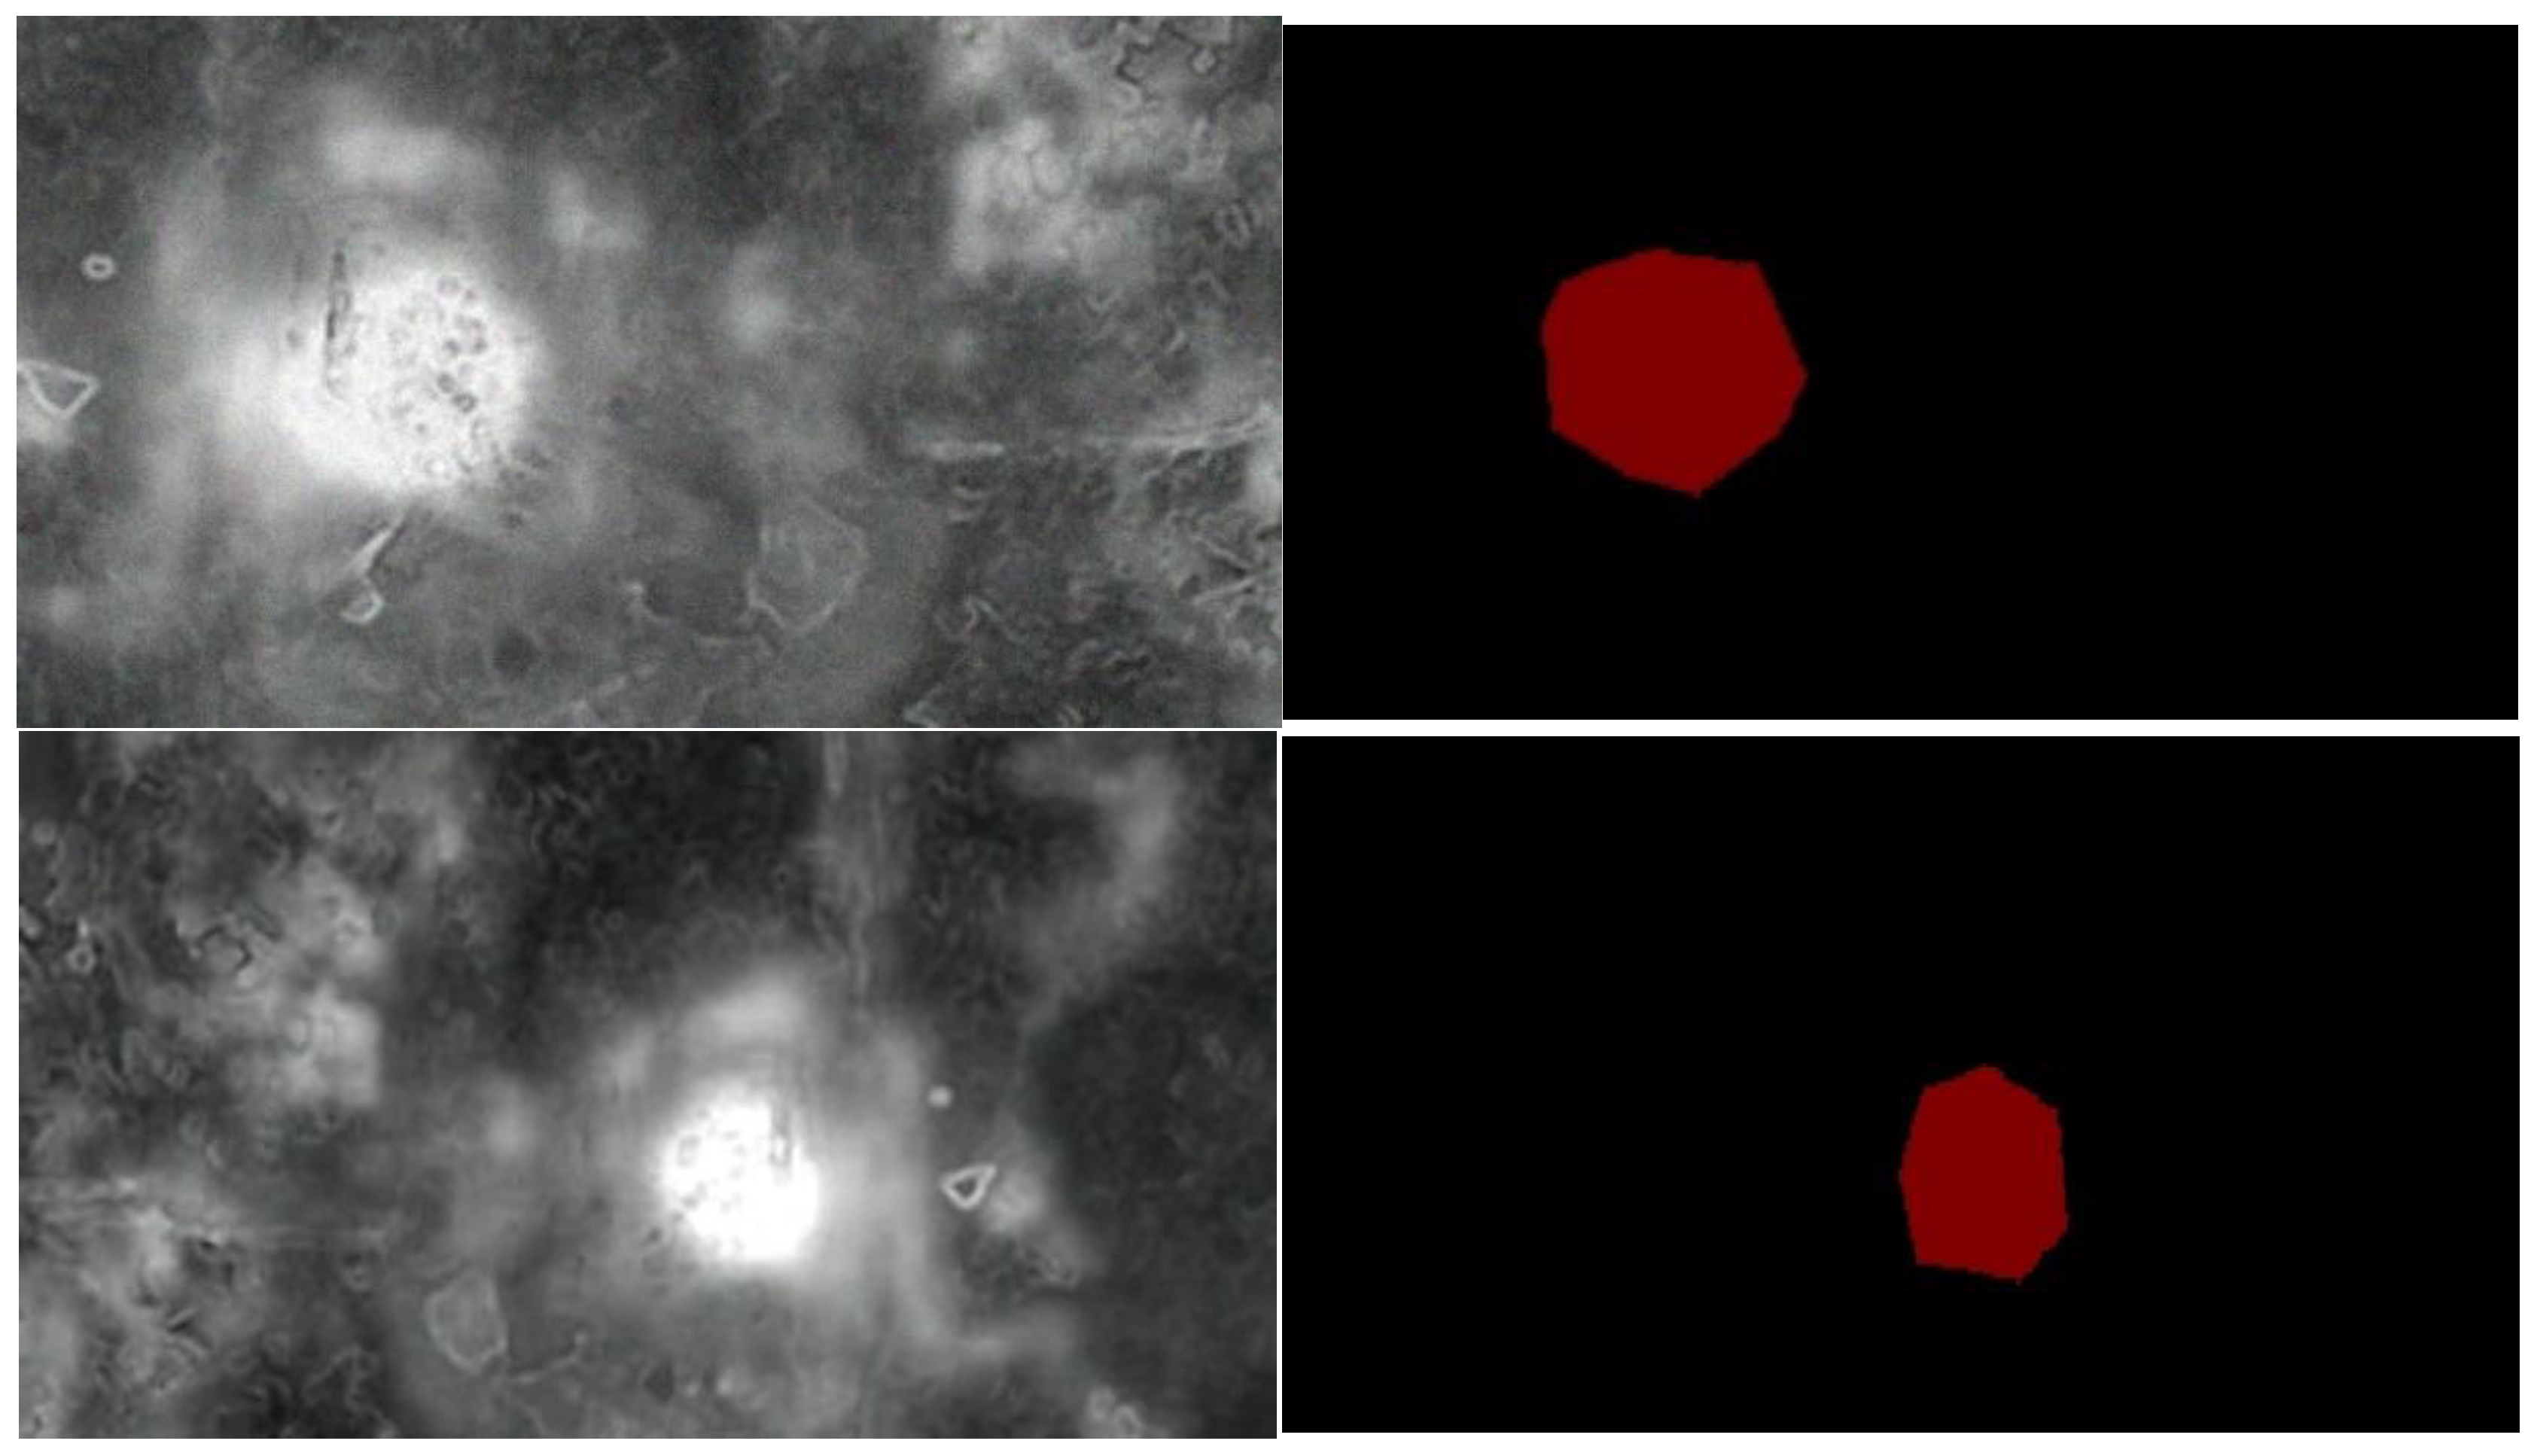
3.2. Data Annotation

A set of ground truth annotations was required to train our deep learning model, as well as to evaluate our segmentation results. Ideally, a human expert should create such ground truth segmentation masks. The process involves drawing polygons around the region of interest to create these masks. However, this is a time-consuming process. To overcome this limitation, we adopted a semi-automatic approach for the annotation of our dataset. This eliminated the need to annotate every pixel of interest in the image by hand. For annotation, we adopted Otsu’s adaptive thresholding technique [19]. The algorithm was designed to find the optimal threshold via an exhaustive search that separated two classes (foreground and background) in the image. The method minimized the intra-class variances of the segmented image and could achieve good results when the histogram of the image had two distinct peaks, one belonging to the background and the other belonging to the foreground. This method was implemented in Python 3.1 using the OpenCV 4.5.0 library. The output was a set of masks that highlighted the regions of interest (fire pixels) in the images. Otsu’s method may create suboptimal results when the histogram of the image has more than two peaks or if one of the classes has a larger variance. Hence the generated masks were reviewed by a human annotator to ensure the ground truth segmentation masks were accurate. If any of the ground truth segmentation masks were inaccurate, the necessary corrections were applied by the human annotator to adjust the polygons of interest. This step significantly reduced the annotation time in our pipeline. To adjust the annotations, we utilized the open-source LabelMe annotation tool (https://github.com/wkentaro/labelme, accessed on 10 January 2025). Approximately 20% of the images required manual editing after being automatically annotated using Otsu’s thresholding technique. Figure 3 below shows an example of the adaptive thresholding technique used for segmentation.

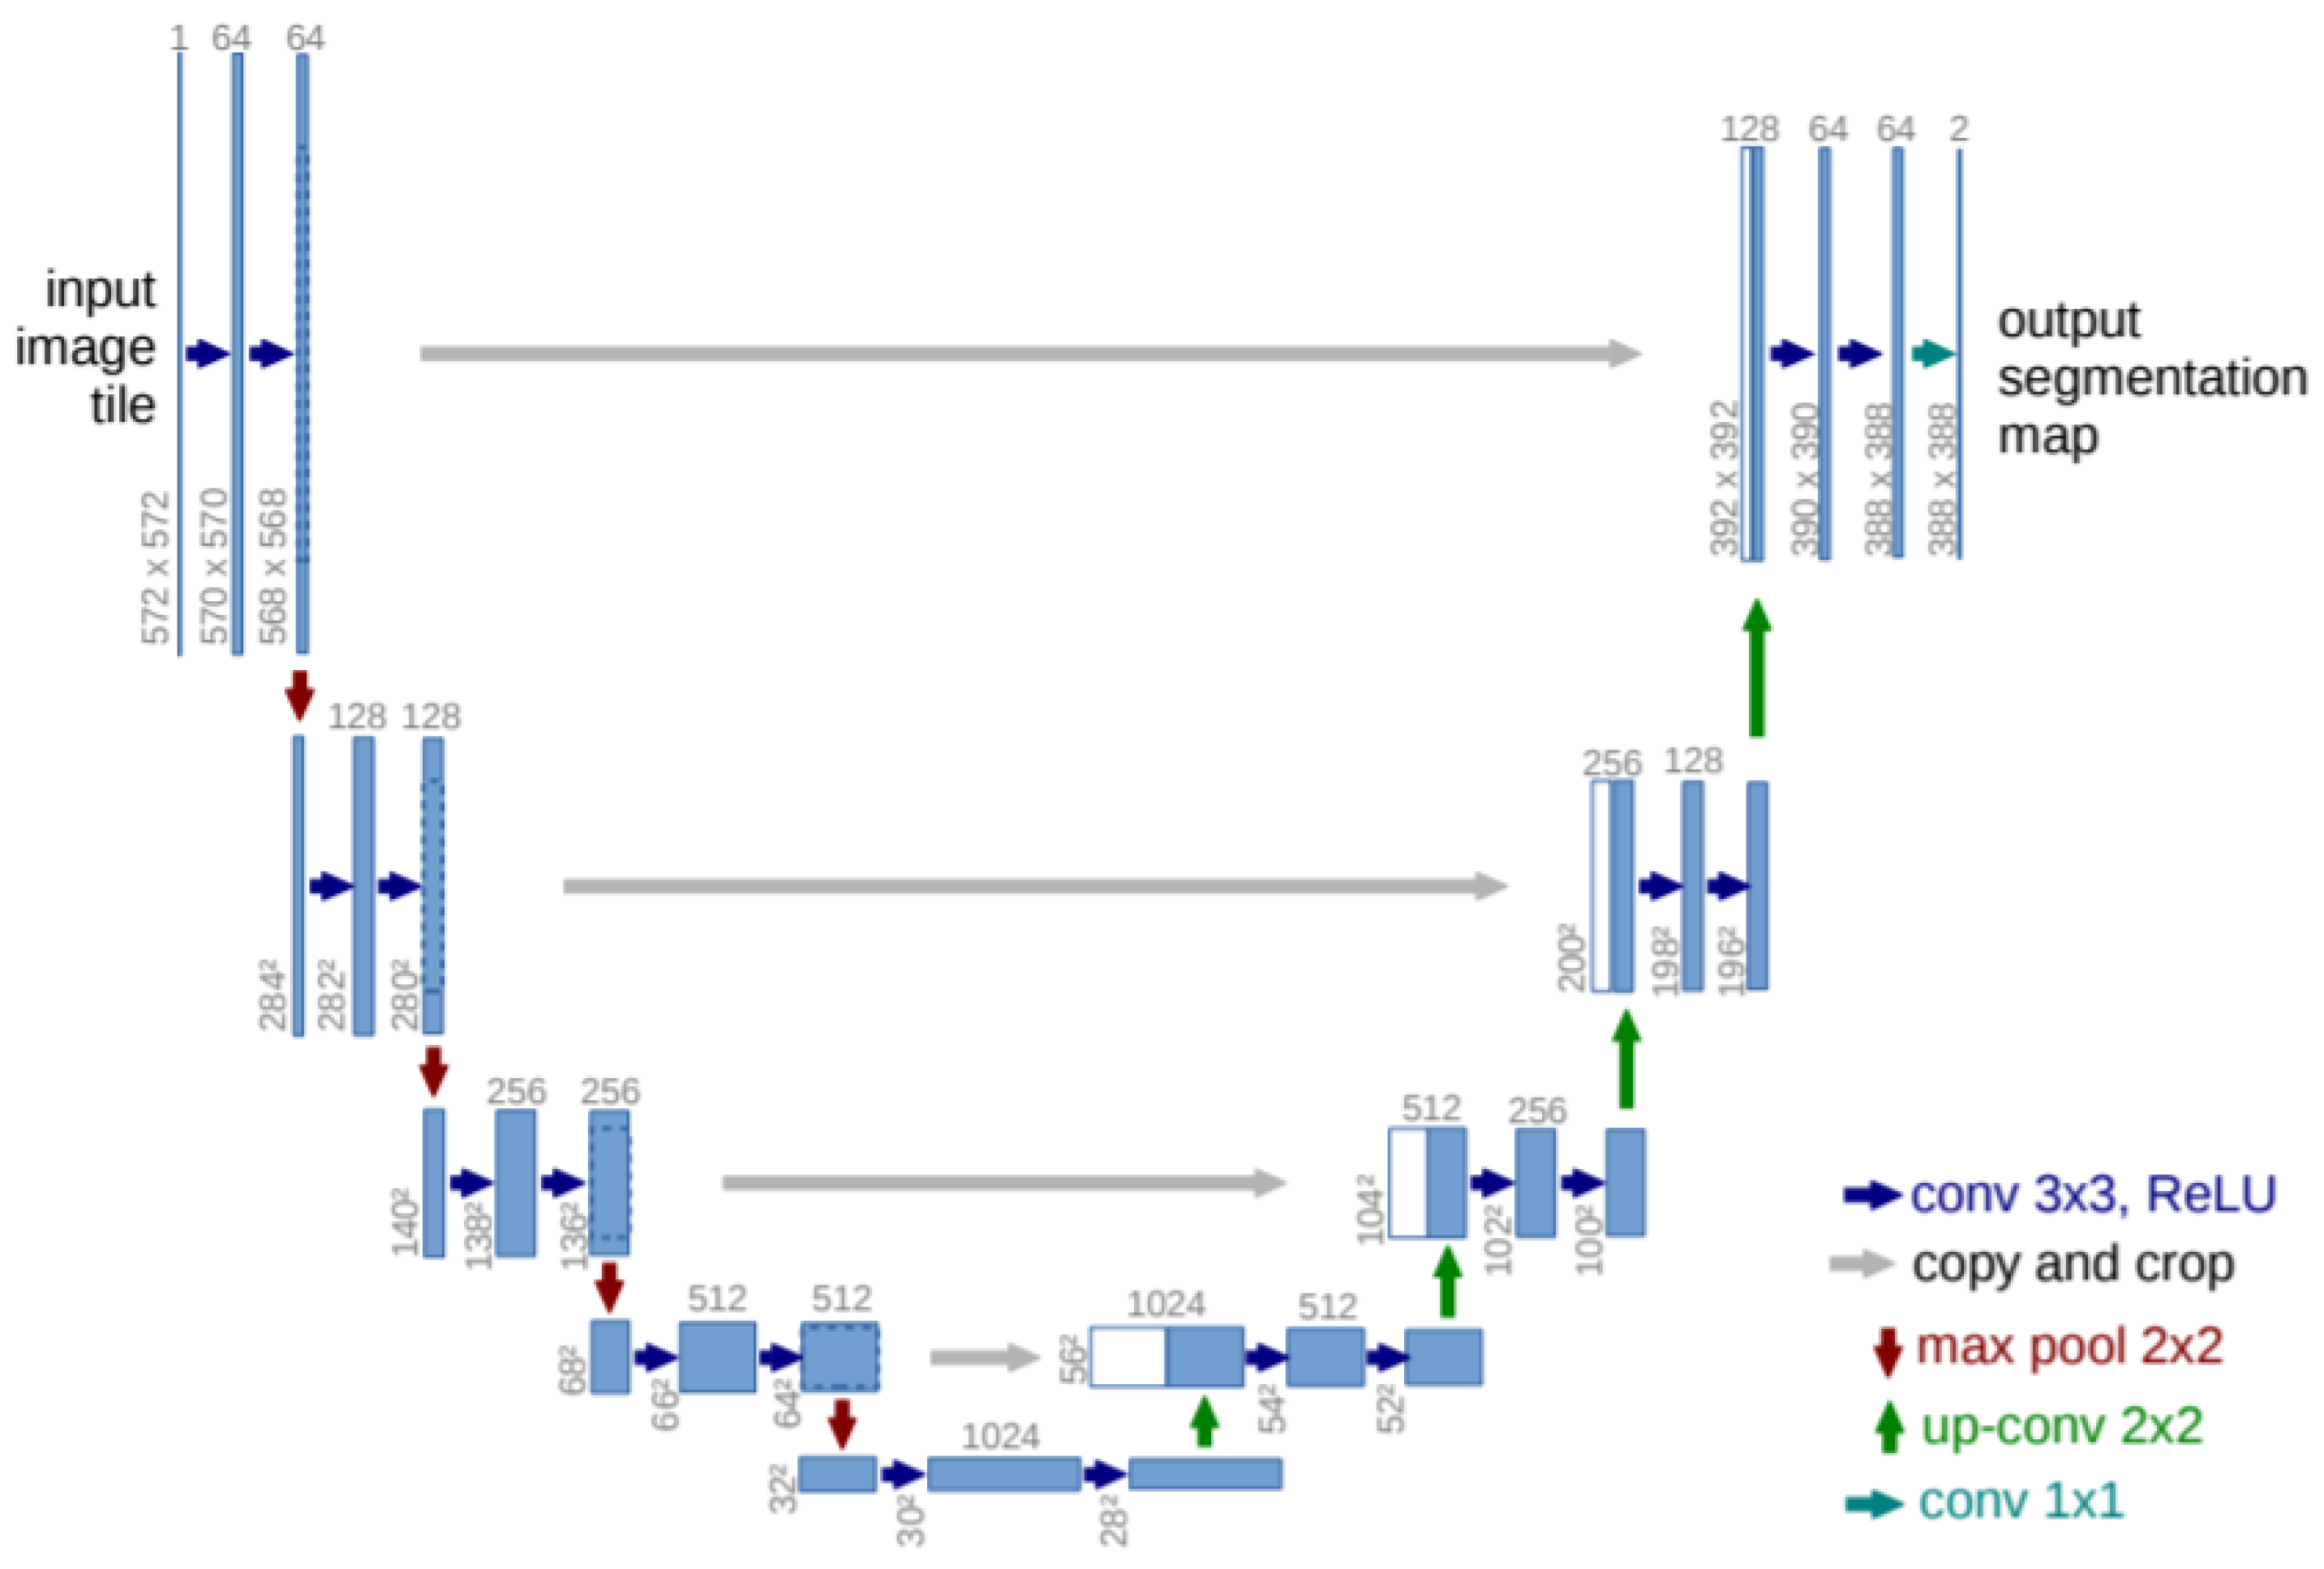
3.3. Deep Learning Network Architecture

The classical U-Net architecture [20] is a symmetric, U-shaped, fully convolutional neural network that has become a standard method for image segmentation. U-Net adopts an encoder–decoder structure that extracts features, whereby low-resolution features are mapped to a high-resolution space. This is achieved using skip connections that fuse multiple features to enhance the segmentation detail. The encoder is a down-sampling path which allows the model to learn complex features, and the decoder is a symmetric expanding path that enables precise localization. As seen in Figure 4, the encoder consists of a sequence of blocks for down-sampling operations, with each block including two 3 × 3 convolution layers followed by 2 × 2 max pooling layers with a stride of 2.
The number of filters in the convolution layers is doubled after each down-sampling operation. Towards the bottom of the U, the encoder adopts two 3 × 3 convolution layers as a bridge to the decoder. The decoder is a series of up-sampling blocks which consists of 2 × 2 transposed convolutions which halve the number of filters in the output and two 3 × 3 convolution layers. Then a 1 × 1 convolution layer is used as the final layer to generate a segmentation map.
A traditional U-Net architecture uses four blocks of convolution layers for feature extraction. In order to allow for faster convergence during training, we replaced the encoder with a pre-trained network trained on the ImageNet dataset [21]. The backbone selection is largely dependent on the complexity of the problem and the amount of training data available. In this study, we investigated two different network architectures, MobilenetV2 [22] and ResNet-50 [23], for the feature extraction process.

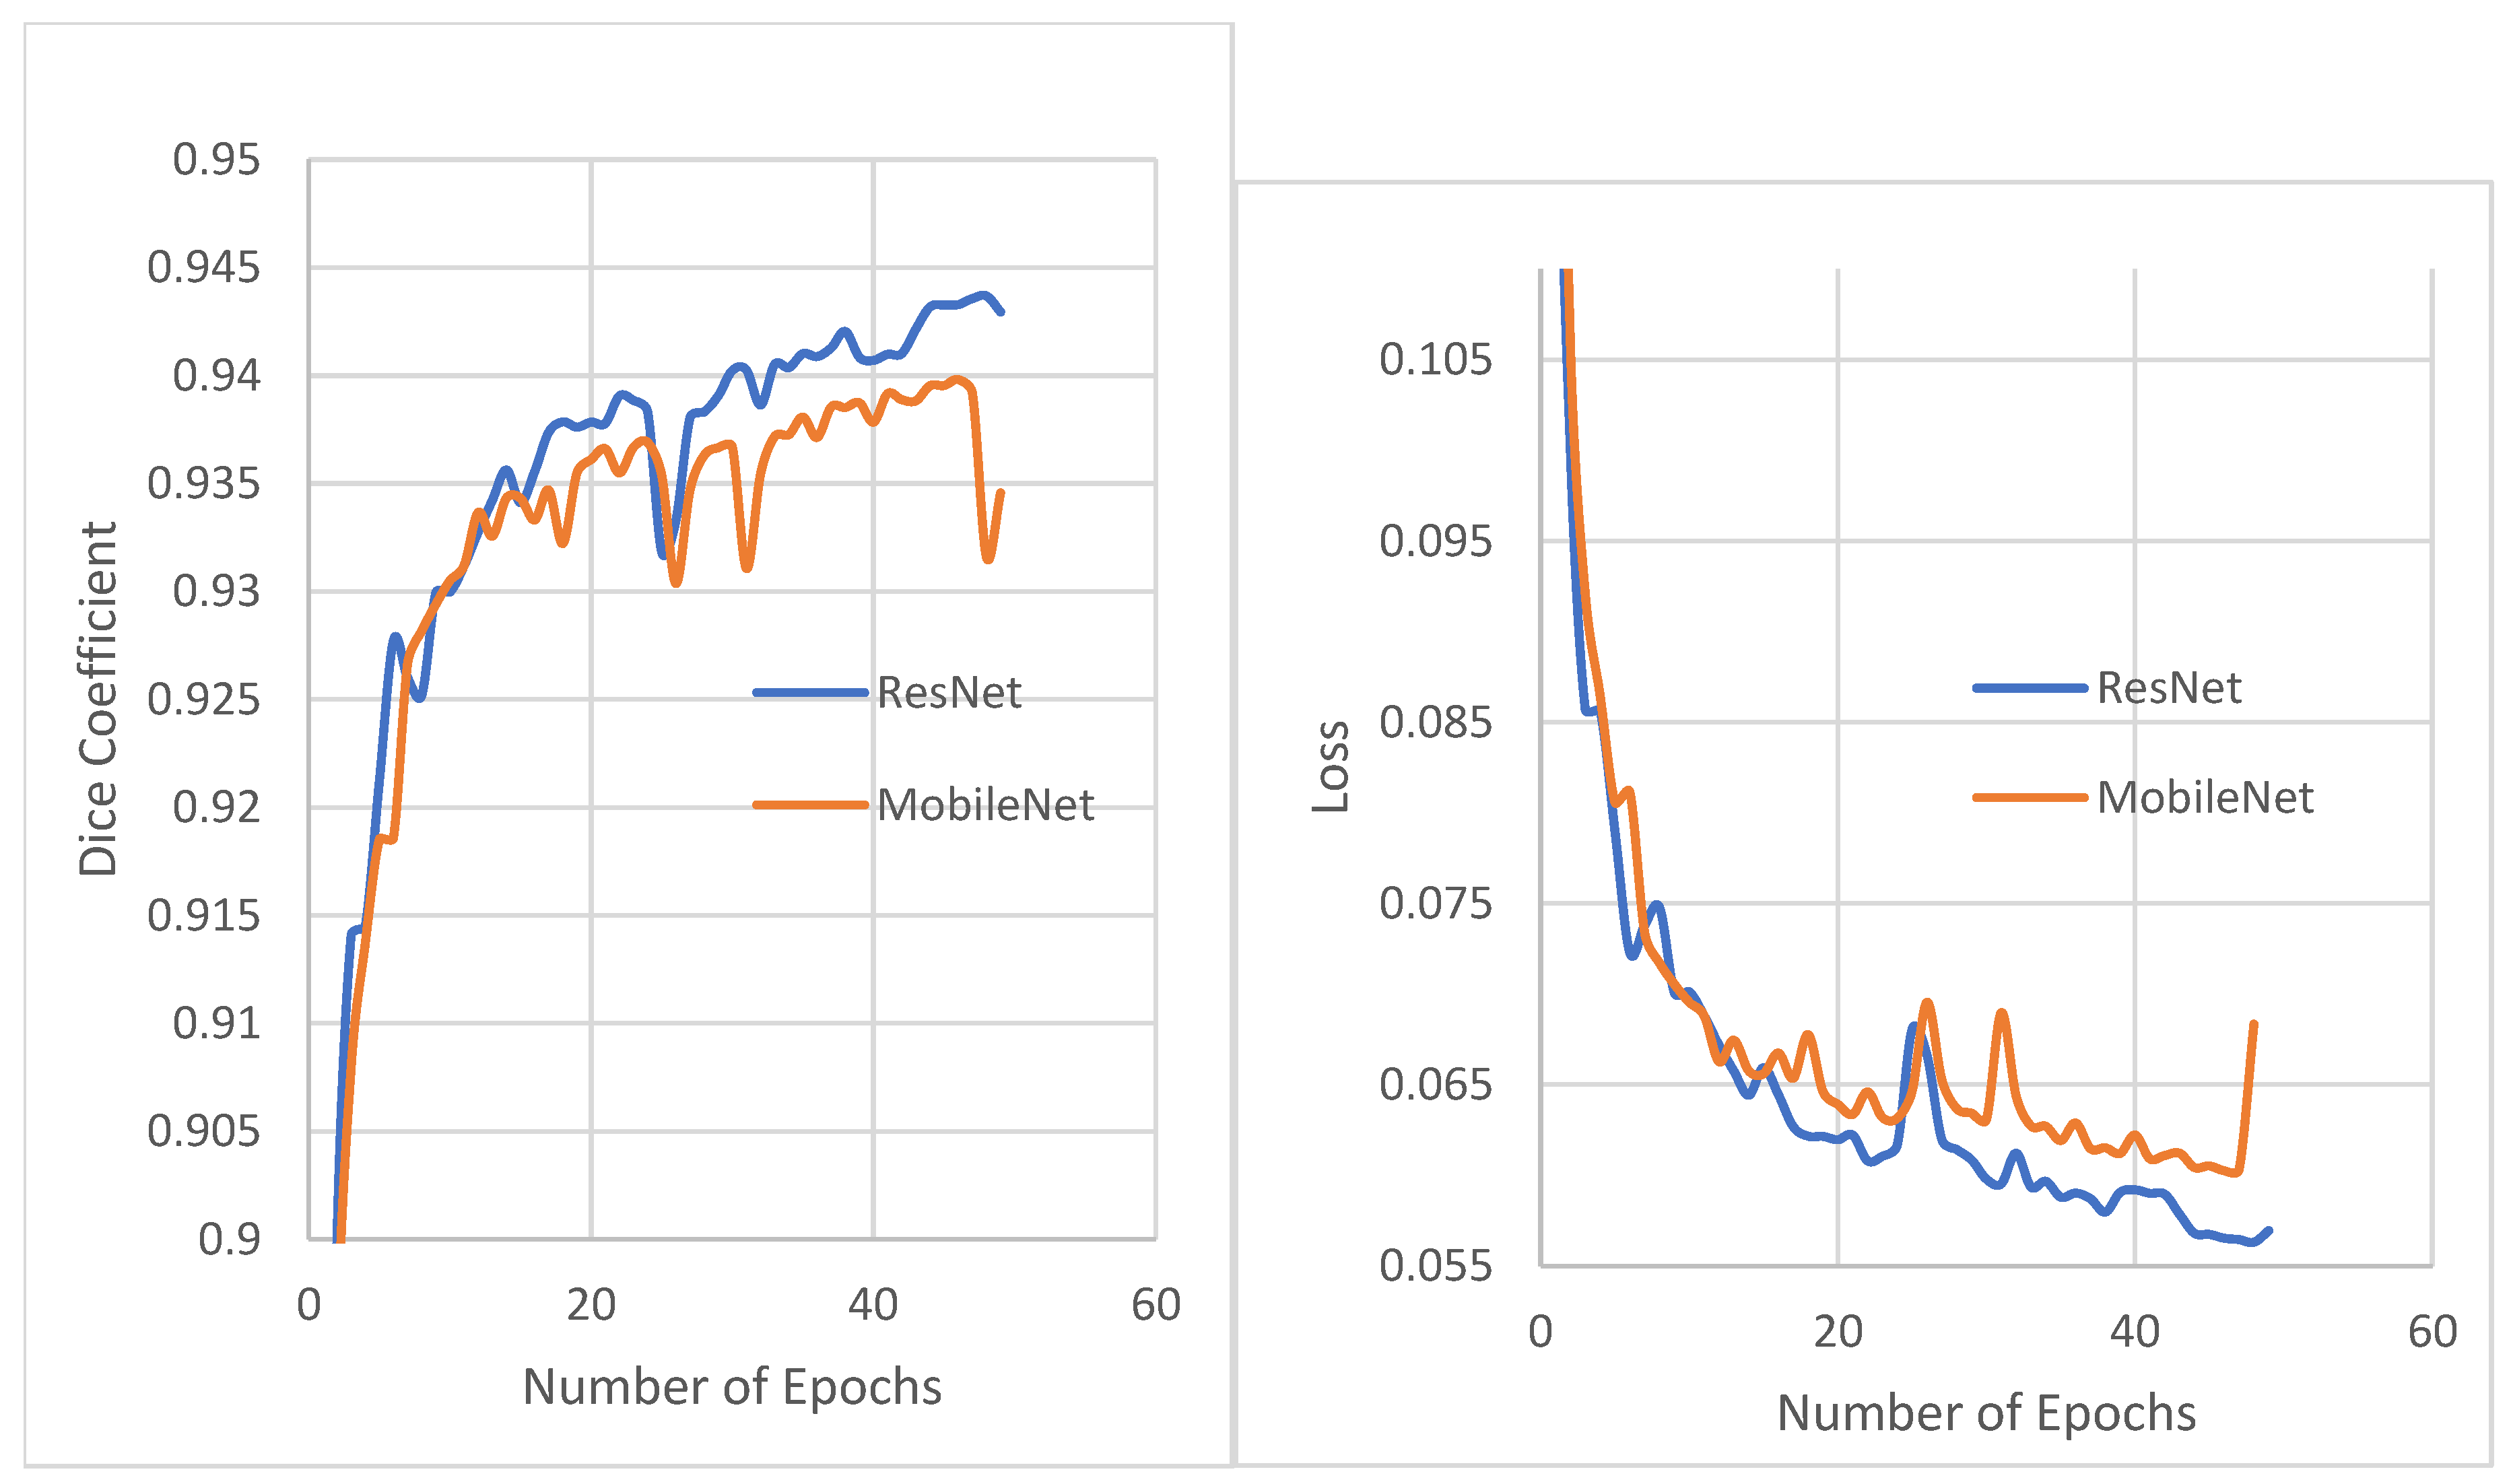
3.4. ResNet-50 as Encoder
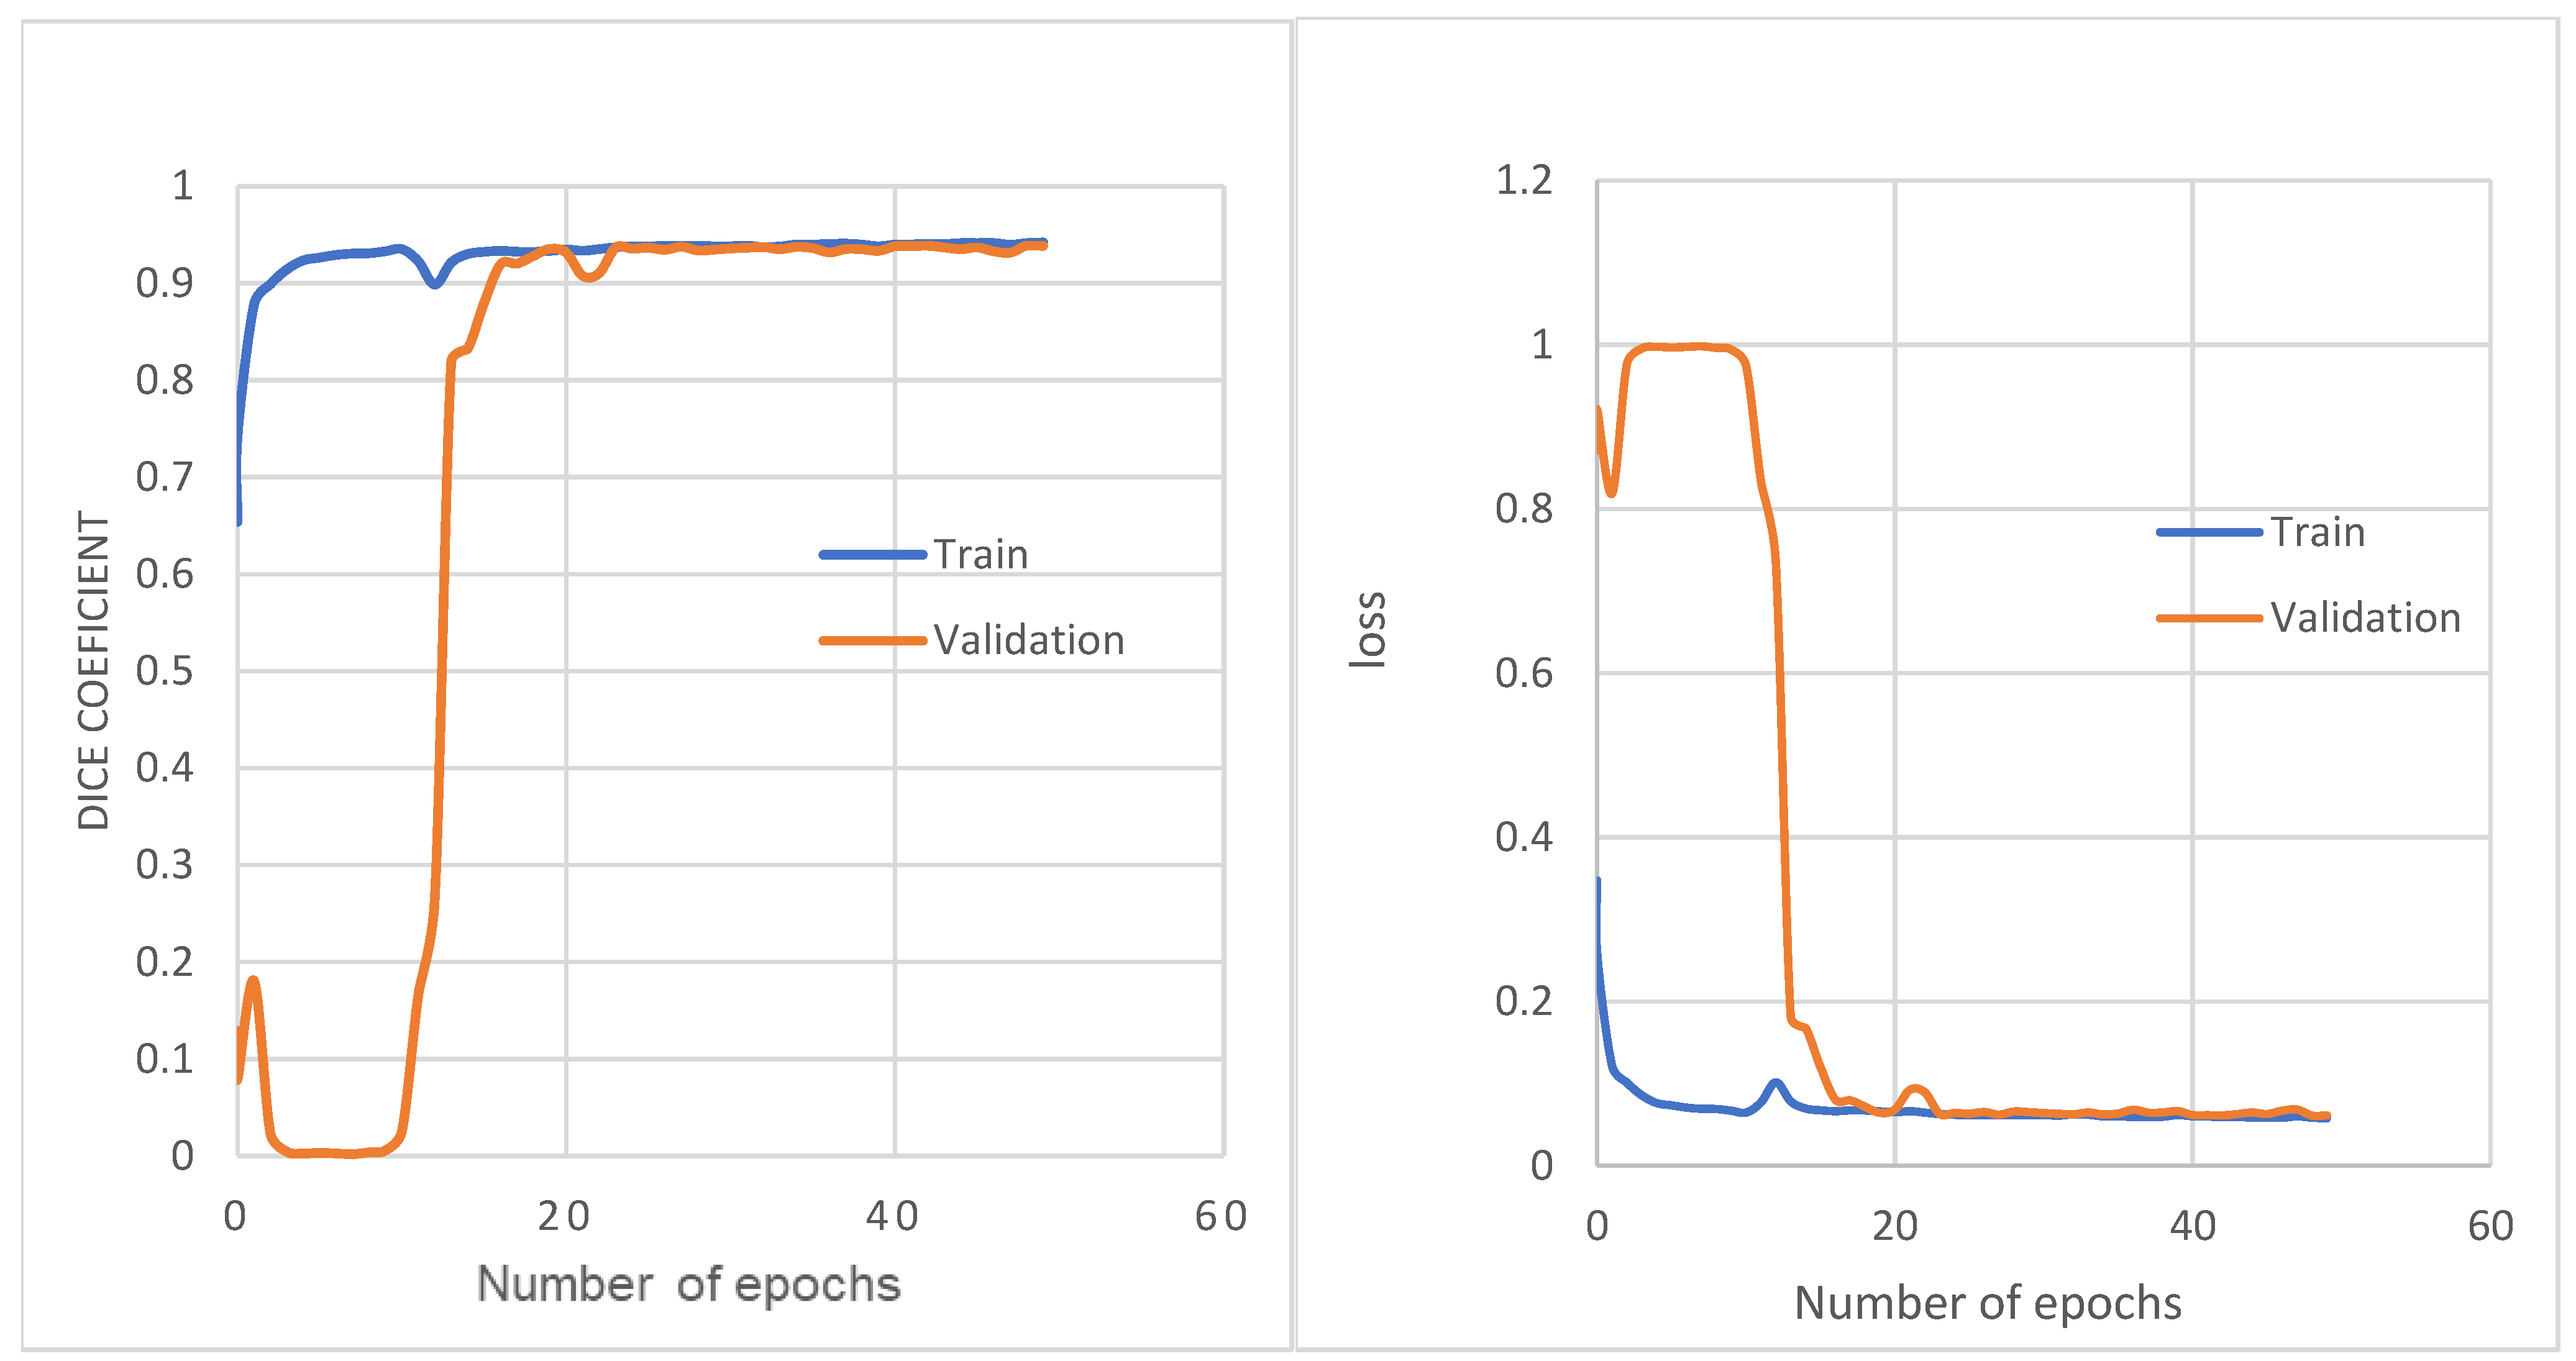
The ResNet architecture has previously shown high convergence and compelling accuracy, which allowed it to come in first place in the Common Objects in Context (COCO) classification challenge in 2015 [23]. Its success was attributed to the skip connections added between layers, making it easier for the network to learn identity mappings, as shown in Figure 5. This allows more layers to be stacked together without running into the well-known vanishing gradient problem. Using a pre-trained ResNet as an encoder in a U-Net architecture helps improve the classification accuracy of the segmentation network as the number of layers can be increased. As a result, more spatial information is preserved. In addition, the network already has features such as borders, edges, and shapes. This helps to reduce the training time and computational burden whilst allowing the model to converge faster and enhances the quality of the segmentation results.
The layers we chose to use within the ResNet network were the ReLU activation layers, which have the highest number of convolutional filter bands within their feature map size category (112 × 112, 56 × 56, 28 × 28, etc.). For example, a layer, l i , is selected which changes the image size to (112 × 112) with 64 channels. Another layer, l i + n , is selected that changes the image size to (56 × 56) with 256 channels. This process is repeated until the selection of the last layer, which changes the image size to (14 × 14) with 1024 channels. Afterwards the decoder from the UNET architecture is used for up-sampling and concatenation with the previous output layer and each selected l i of the ResNet50 model. Transposed convolutional layers are used for this operation. The output of the proposed model was of the size (224 × 224) with 1 channel. Since fire detection is a binary classification task (fire/no fire), we applied a sigmoid activation function—see Equation (1) below—as the final step to obtain a probability distribution.
P ( l a b e l = F i r e ) = 1 1 + e γ ( θ )
where γ ( θ ) is the value of the output tensor extracted from the final deconvolution step.

3.5. Model Training

Model training was conducted on a machine with an Intel(R) Core (TM) i7 CPU@2.30 GHz with 16 GB of RAM. Since CNN computations can inherently be sped up by using high-performance computing devices like GPUs, we utilized the NVIDIA Geoforce RTX2080Ti GPU in this training procedure. Tensorflow 1.13.1, CUDA 10.0, and CuDNN version 7.5 were the software versions used as the basis of our training pipeline.
The network training process solved θ = { W , B } . This was achieved by minimizing the Dice loss of the training set data.
L d i c e = 1 N ( 1 D C )
where N is the number of samples and DC is the dice coefficient, which is expressed as
D C = 2 | Y ˇ Y | Y ˇ + Y + ϵ
where Y ˇ represents the predicted value of the network and Y represents the true label of the sample. ϵ is a small factor included to prevent division by zero. We set ϵ = 10 6 . Using this loss function overcame the problem of the unbalanced distribution of the positive and negative samples, considerably improving the accuracy of segmentation.
The loss was minimized using batch stochastic gradient descent (SGD) and backpropagation [24]. The SGD method optimized the weights and biases of the network by computing derivates and backpropagating them through the previous layers in the network using the chain rule. This learning rate procedure was repeated until the training error was considered negligible and is expressed as
v t = γ v t 1 + α L W t
W t = W t 1 v t
where t is the iteration index, γ is the momentum variable, v is the current velocity, α is the learning rate, and L W t is the derivative. The other parameters required for training are shown in Table 1.
The proposed semantic segmentation architecture was developed in Tensorflow 2.0. The network was trained on images with a 224 by 224 resolution and a batch size of 32 as stated in Table 1 and for 50 epochs. The ResNet weights pre-trained on ImageNet were used to initialize the encoder and were finetuned in the training/validation stage.
The creation of more data for training was performed using augmentation techniques, which randomly changed the images before inputting them into the model. The augmentation process in this study was based on affine transformations such as translations, rotations, and changes in the scale.

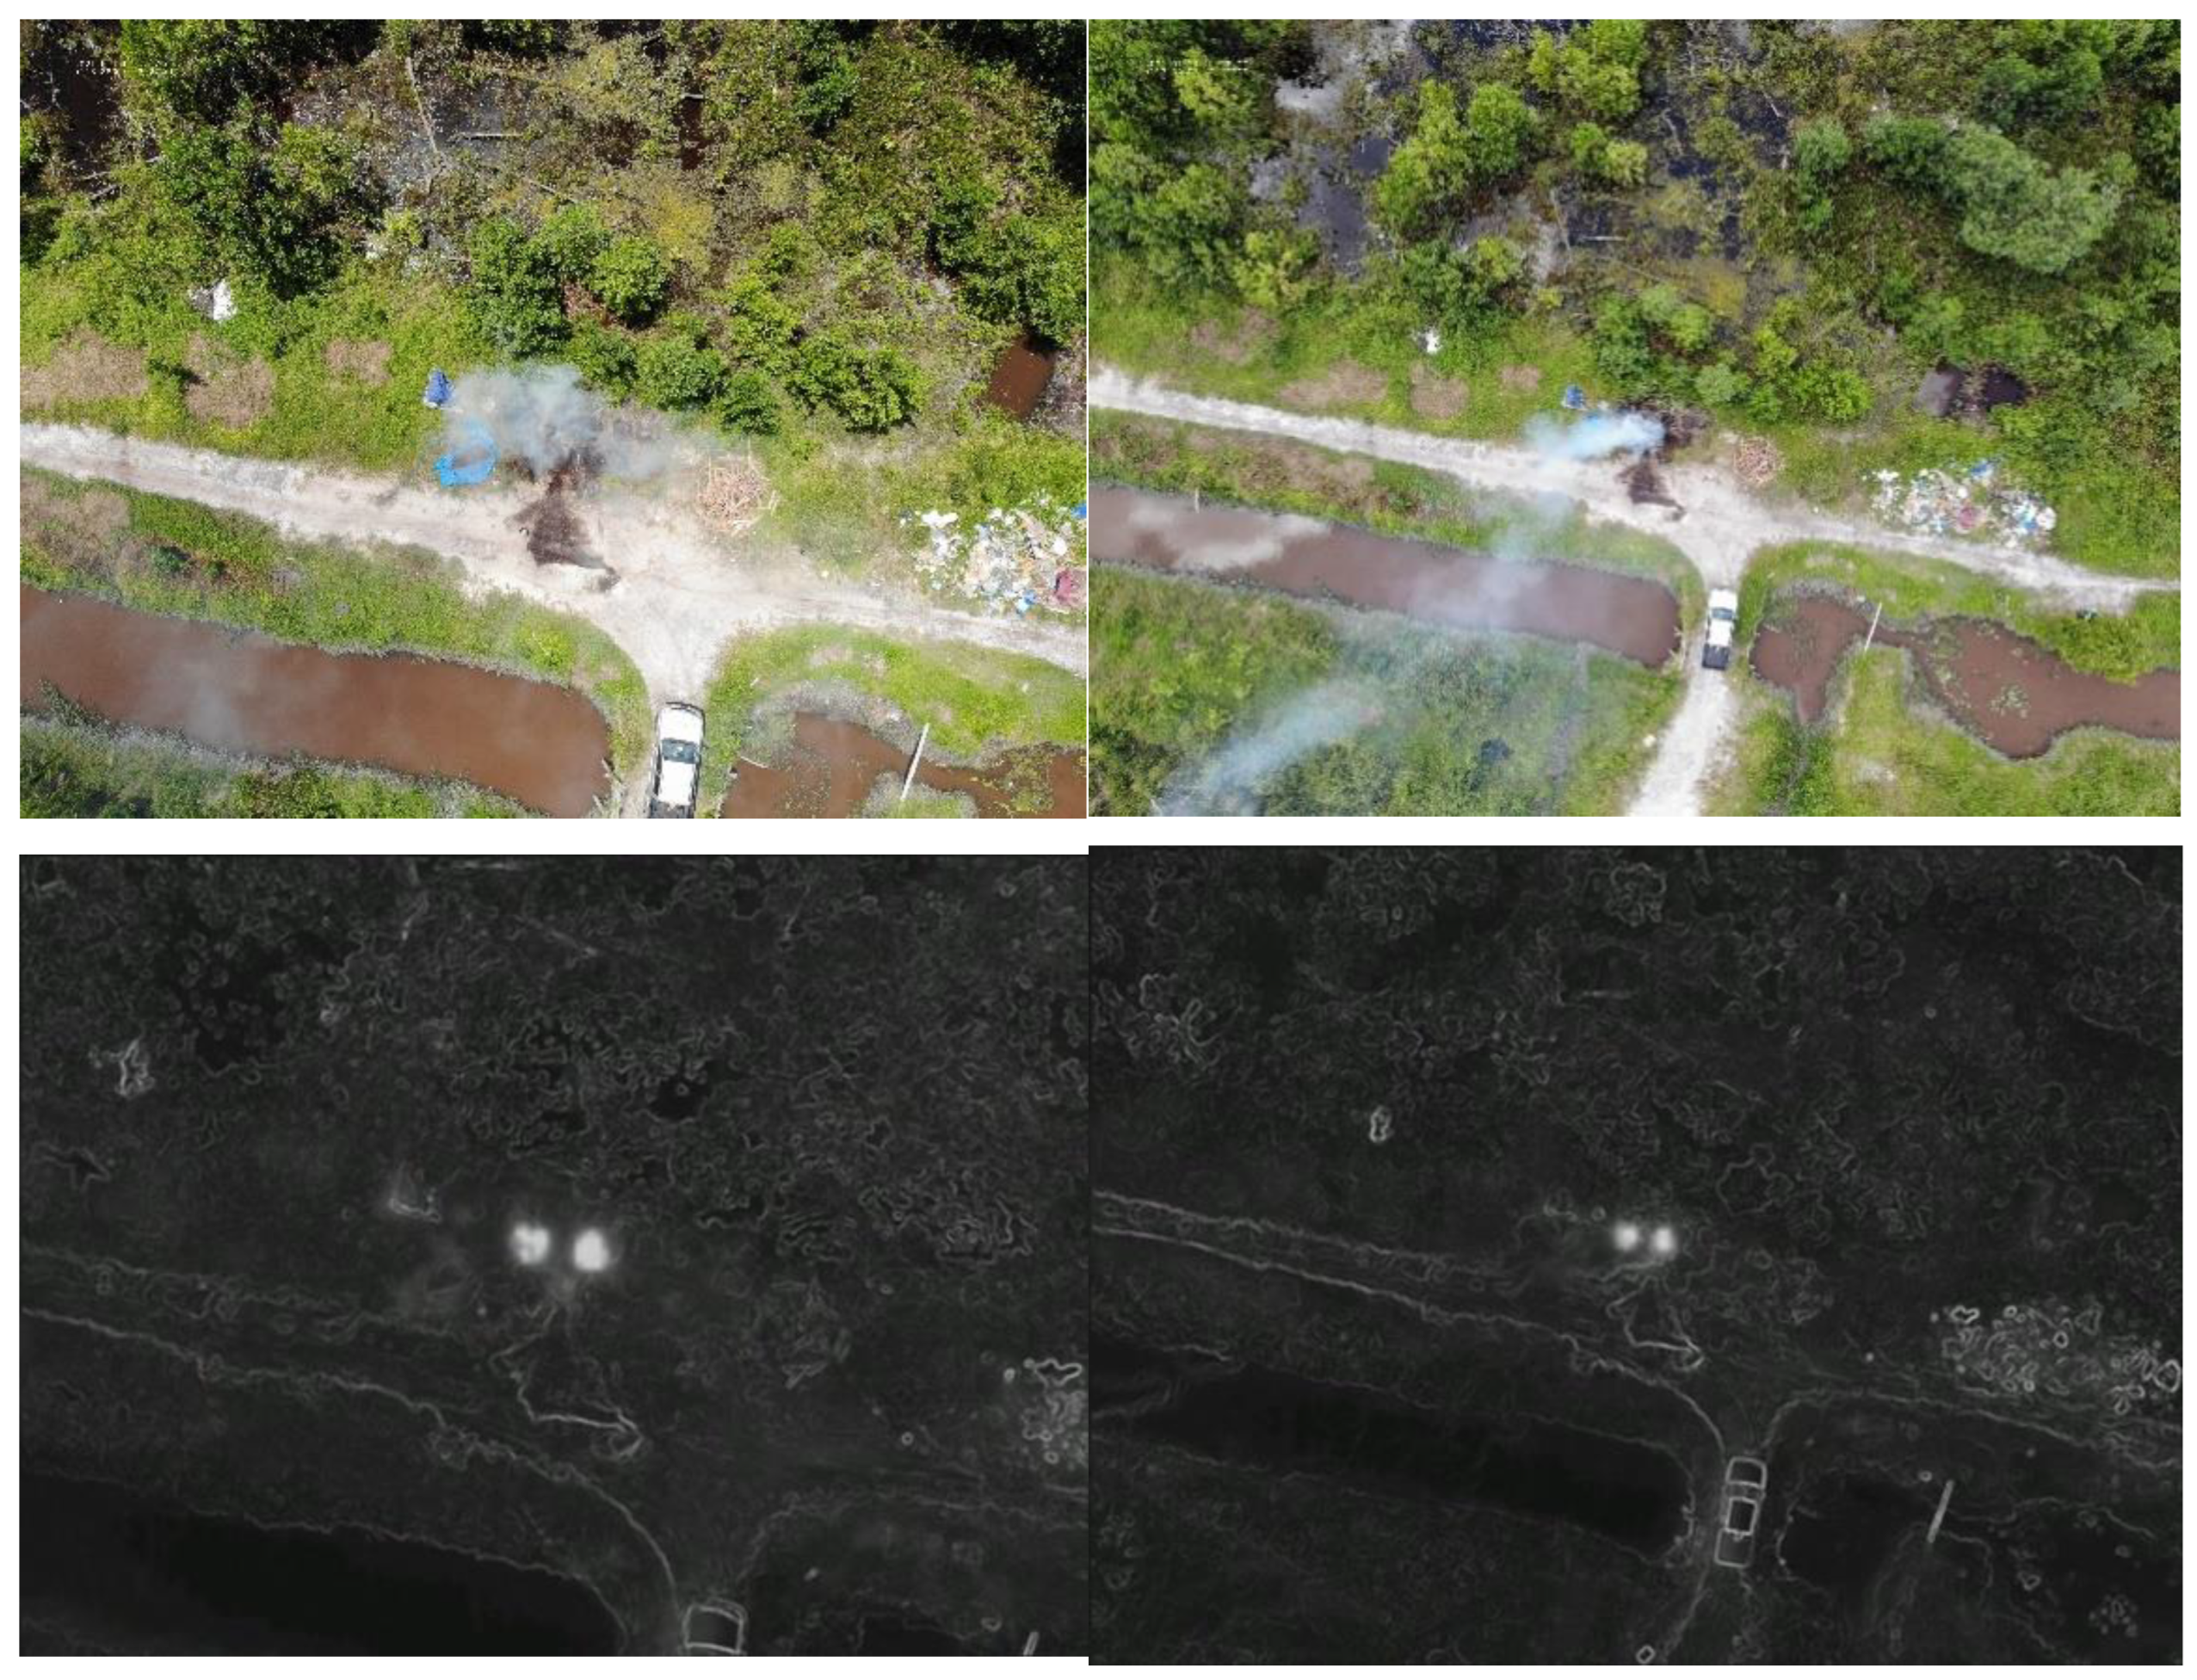
4. Results and Discussion

Figure 6 shows the accuracy and loss for the training data. The model converged smoothly and reached a stable state within 20 training epochs for both the training and validation datasets. The training time took approximately 5 h.
We further evaluated the model against a U-Net architecture using MobileNetV2 [22] as the encoder. We could see that we achieved a higher Dice coefficient and a lower loss during training in comparison with those of the model incorporating MobilenetV2 as shown in Figure 7.
The test set was used to make comparisons between these models using the metrics of the recall, precision, and Intersection over Union (IoU). The recall corresponds to the accuracy of positive examples, and it refers to how many of the samples from the positive classes were labelled correctly by the model. This can be calculated as follows:
R e c a l l = T P T P + F N
where T P s refer to the true positives, which include the number of instances that are positive and correctly identified. F N s are the false negatives, which include the number of positive samples that are mis-classified as negative. The precision is a measure of correctness; i.e., out of those samples predicted to be positive, how many of them are positive. F P s represent the false positives.
P r e c i s i o n = T P T P + F P
Finally, the IoU is given by Equation (7), where T stands for the true label of the image and P for the prediction of the output image.
I o U = T P T P
In K-fold cross-validation, the entire dataset is split into K groups randomly. For every fold, one out of the K subsets is chosen for validation and K-1 subsets are used for training. Experiments were conducted for a 10-fold cross-validation, as indicated in Table 2. For each cross-validation iteration, the model was trained using nine subsets and was tested using the other subset as the validation set. The procedure was then repeated for 10-fold cross-validation. Each sample was used once as a validation subset.
The number of datasets used for the training process was 1440 images, and 180 images were used for the testing process in each fold run. The model with the highest average IOU is the model with the best performance in the K-fold cross-validation experiment and has been marked with bold print. For a robust comparison, the evaluation metrics reported in Table 2 were averaged over the 10-fold cross-validation. The results show that ResNet50 had a slightly higher probability of mistaking non-fire regions as fire regions, as indicated by the slightly lower precision value in comparison to that of MobileNetV2. However, ResNet50 showed a relatively better trade-off by achieving higher recall and IOU values in comparison to MobileNetV2. The lower FNs associated with a higher recall indicate the higher reliability of ResNet50 if the model predicts a non-fire.
MobileNetV2 provided a much lighter network that reduced the computational cost, as indicated by the lower number of trainable parameters. This was mainly because of the depth-wise separable convolution replacing the standard convolution in the ResNet50 model. A standard convolution both filters and combines inputs into a new set of outputs in one step. Depth-wise separable convolution splits this into two steps. In one step, separate spatial convolution is applied to each input channel, and in another step 1 × 1 convolutions are used to combine the outputs from all the channels. This factorization has the effect of drastically reducing the computation and model size. For real-time applications, the MobileNetV2 architecture is often preferred because it is faster and more lightweight and consumes less power compared to the ResNet-50 architecture.
In our experiments, we could correctly distinguish between the fire and background under different conditions, such as the presence of smoke, different weather conditions, and various levels of brightness in the environment. In addition, we could identify fires of varying scales and their precise shapes. Some examples from the test dataset are shown in Figure 8.
We tested our model on real-world open peat fires. We gathered just over 350 images during the fire season in Palangkaraya. We achieved an IOU score of 0.90 for these datasets. Our model was able to generalize well and perform reliable detection for these types of fires as well, as shown in Figure 9.
To demonstrate that our model possesses high precision and is not merely biassed toward classifying all bright regions above a certain threshold as fire pixels, we conducted a test flight at midday over the rooftops of various houses, capturing thermal images. When applying the adaptive Otsu thresholding technique described in Section 3.2 to these images, we observed a significant number of false positives, despite the absence of actual fire pixels. Figure 10 shows an example below.
We then proceeded to test the performance of our trained model over a range of similar background images also not containing any fire pixels as shown in Figure 11 below.
The predicted masks generated by our model did not include any bright regions corresponding to fire, demonstrating that the model had learned meaningful semantic features for fire detection and localization rather than merely flagging bright pixels in the images as fire. Several practical challenges arise in deploying our proposed system, as outlined below.
Currently, model inference is conducted offline, meaning that the collected data must be downloaded and processed after the drone flight. By the time the analysis is completed, the fire may have already spread, significantly reducing the system’s effectiveness for enabling a real-time response. To improve the practicality of the solution, real-time (online) fire detection capabilities are necessary.
Additionally, most multirotor drones have a limited flight duration of 20 to 45 min, which constrains the area they can survey in a single mission and poses challenges for monitoring large regions. In contrast, fixed-wing drones offer a more viable alternative, as they can cover significantly larger areas per flight, making them better suited for wide-area surveillance applications.

5. Conclusions

In this study, we presented a fire monitoring system that builds on recent advances in computer vision, machine learning, and UAV technology. By utilizing advanced deep learning segmentation networks, we could reliably detect and geolocalize potential fires in a sequence of aerial images. We adopted a ResNet architecture for feature extraction and a U-Net architecture for solving the fire segmentation task. The experimental results demonstrated the feasibility and effectiveness of utilizing a ResNet U-Net model for fire detection on the acquired thermal dataset. A comparison of the employed ResNet U-Net architecture against a MobileNetV2 architecture showed that the proposed network outperformed the MobileNet2 network in terms of its metrics, recall, and IOU. Additionally, to demonstrate the robustness of the model, the model was tested against images captured of real wildfires, and the precise pixel locations of these fires in the images were also captured precisely. We have developed a user-friendly web application to allow users to easily interact with our application for uploading images for fire detection and geolocation.
To provide early warnings and a rapid response, an online detection system is critical. Moving forward, we plan to develop a custom UAV solution that supports the integration of embedded platforms for real-time fire detection. Ongoing and future research objectives also involve capturing higher-resolution images for further training to improve accuracy, as well as model optimization and an investigation into how using different thermal imaging wavelength spectra affects fire temperature measurements and detection. Finally, the geolocation algorithm presented in Appendix A does not consider the error or uncertainty arising from camera calibration and the vehicle positioning. More complex geolocation algorithms will be investigated to further improve the localization accuracy.

Author Contributions

Conceptualization, T.S.-O.; Software, T.S.-O.; Resources, S.N.L. and S.A.W.; Data curation, P.P.; Writing—review & editing, C.C., P.F., S.N.L. and S.A.W.; Project administration, S.A.W.; Funding acquisition, S.N.L. and S.A.W. All authors have read and agreed to the published version of the manuscript.

Funding

TSO: SNL and SAW acknowledge funding from the UK Research and Innovation (UKRI) Science and Technology Facilities Council (STFC) through grant ST/S00288X/1.

Data Availability Statement

The raw data supporting the conclusions of this article will be made available by the authors on request.

Conflicts of Interest

The authors declare no conflicts of interest.

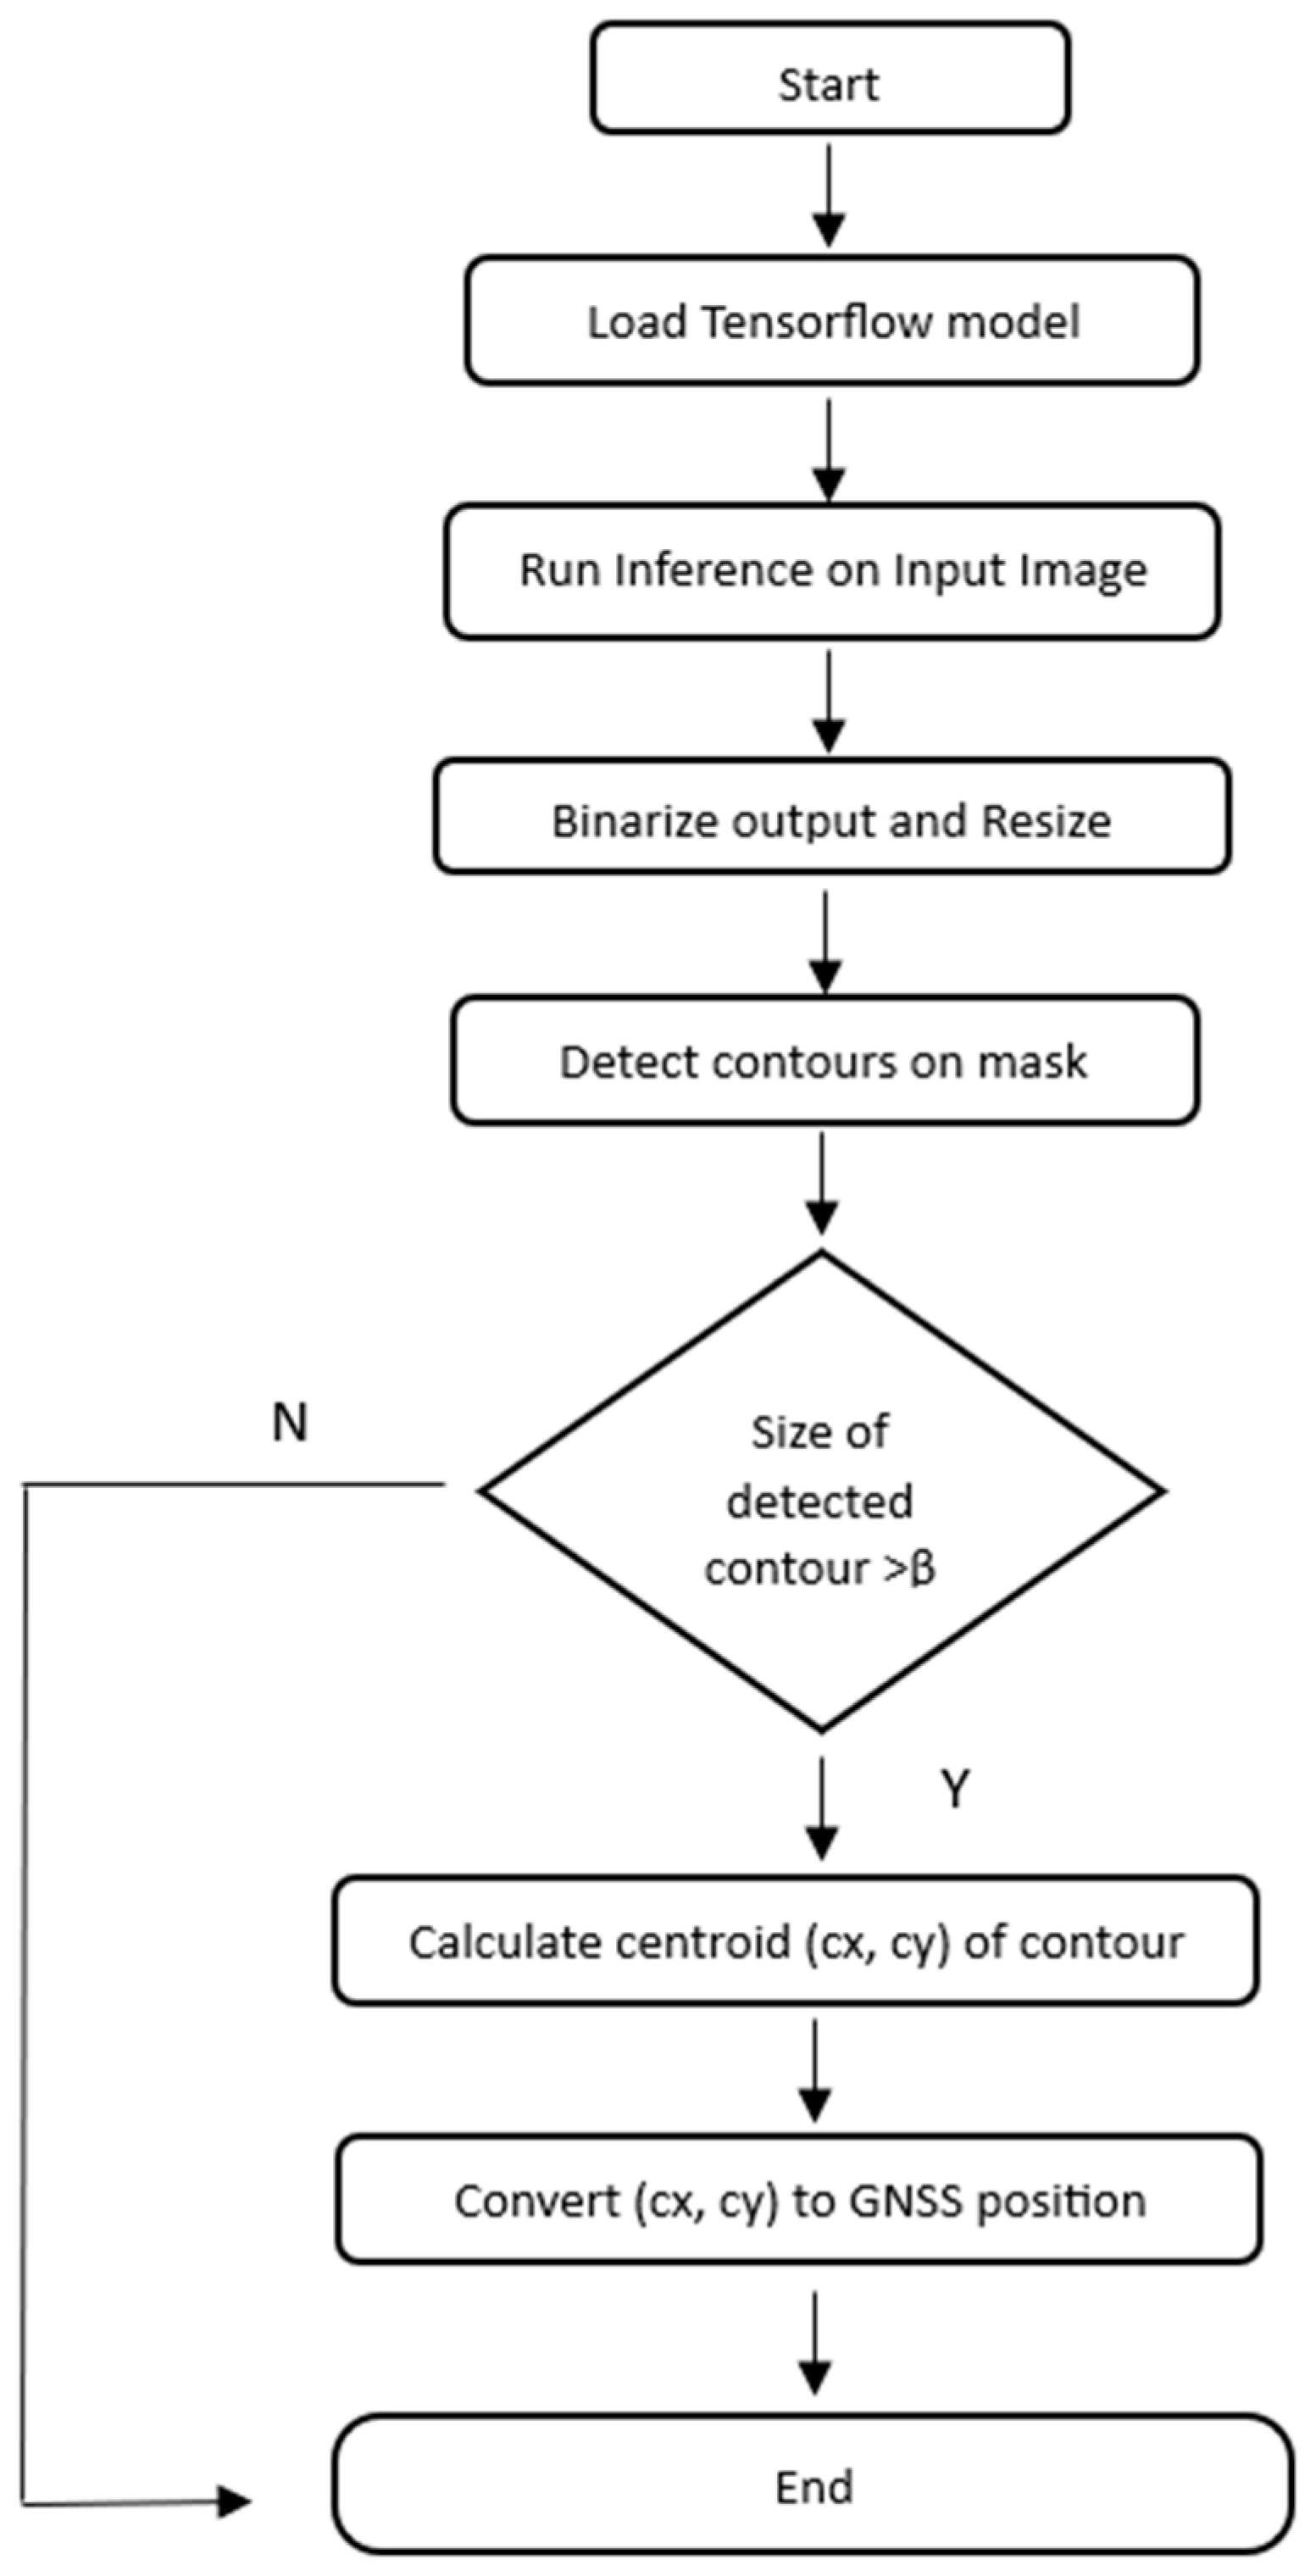
Appendix A. Fire Geolocation Algorithm

Appendix A.1. Geolocation Pipeline

When a fire is detected in an image, the fire’s geolocation is required to allow for the deployment of fire-fighting resources to extinguish the fire. The geolocation algorithm utilized employs various components and is described in the flow chart below.
As shown in Figure A1, inference is performed on each input image using the trained model as discussed in the previous section. The output from the model is a floating-point value between 0 and 1 since a sigmoid activation function has been used (see Equation (1)). The binarization of the output image is performed as follows:
f p = 0 , p β 255 , p > β
Here, β is chosen to be 0.5. The binarized image is then passed into OpenCV’s cv2.findContour function to find all the contours in the binary image. Once the contours are found, the centroid of each contour is calculated as
C x = M 10 M 00
C y = M 01 M 00
C x and C y denote the x and y pixel coordinates of the centroid, and M is the Image Moment [25].
Figure A1. Flow chart for geolocation algorithm.
Drones 09 00459 g0a1

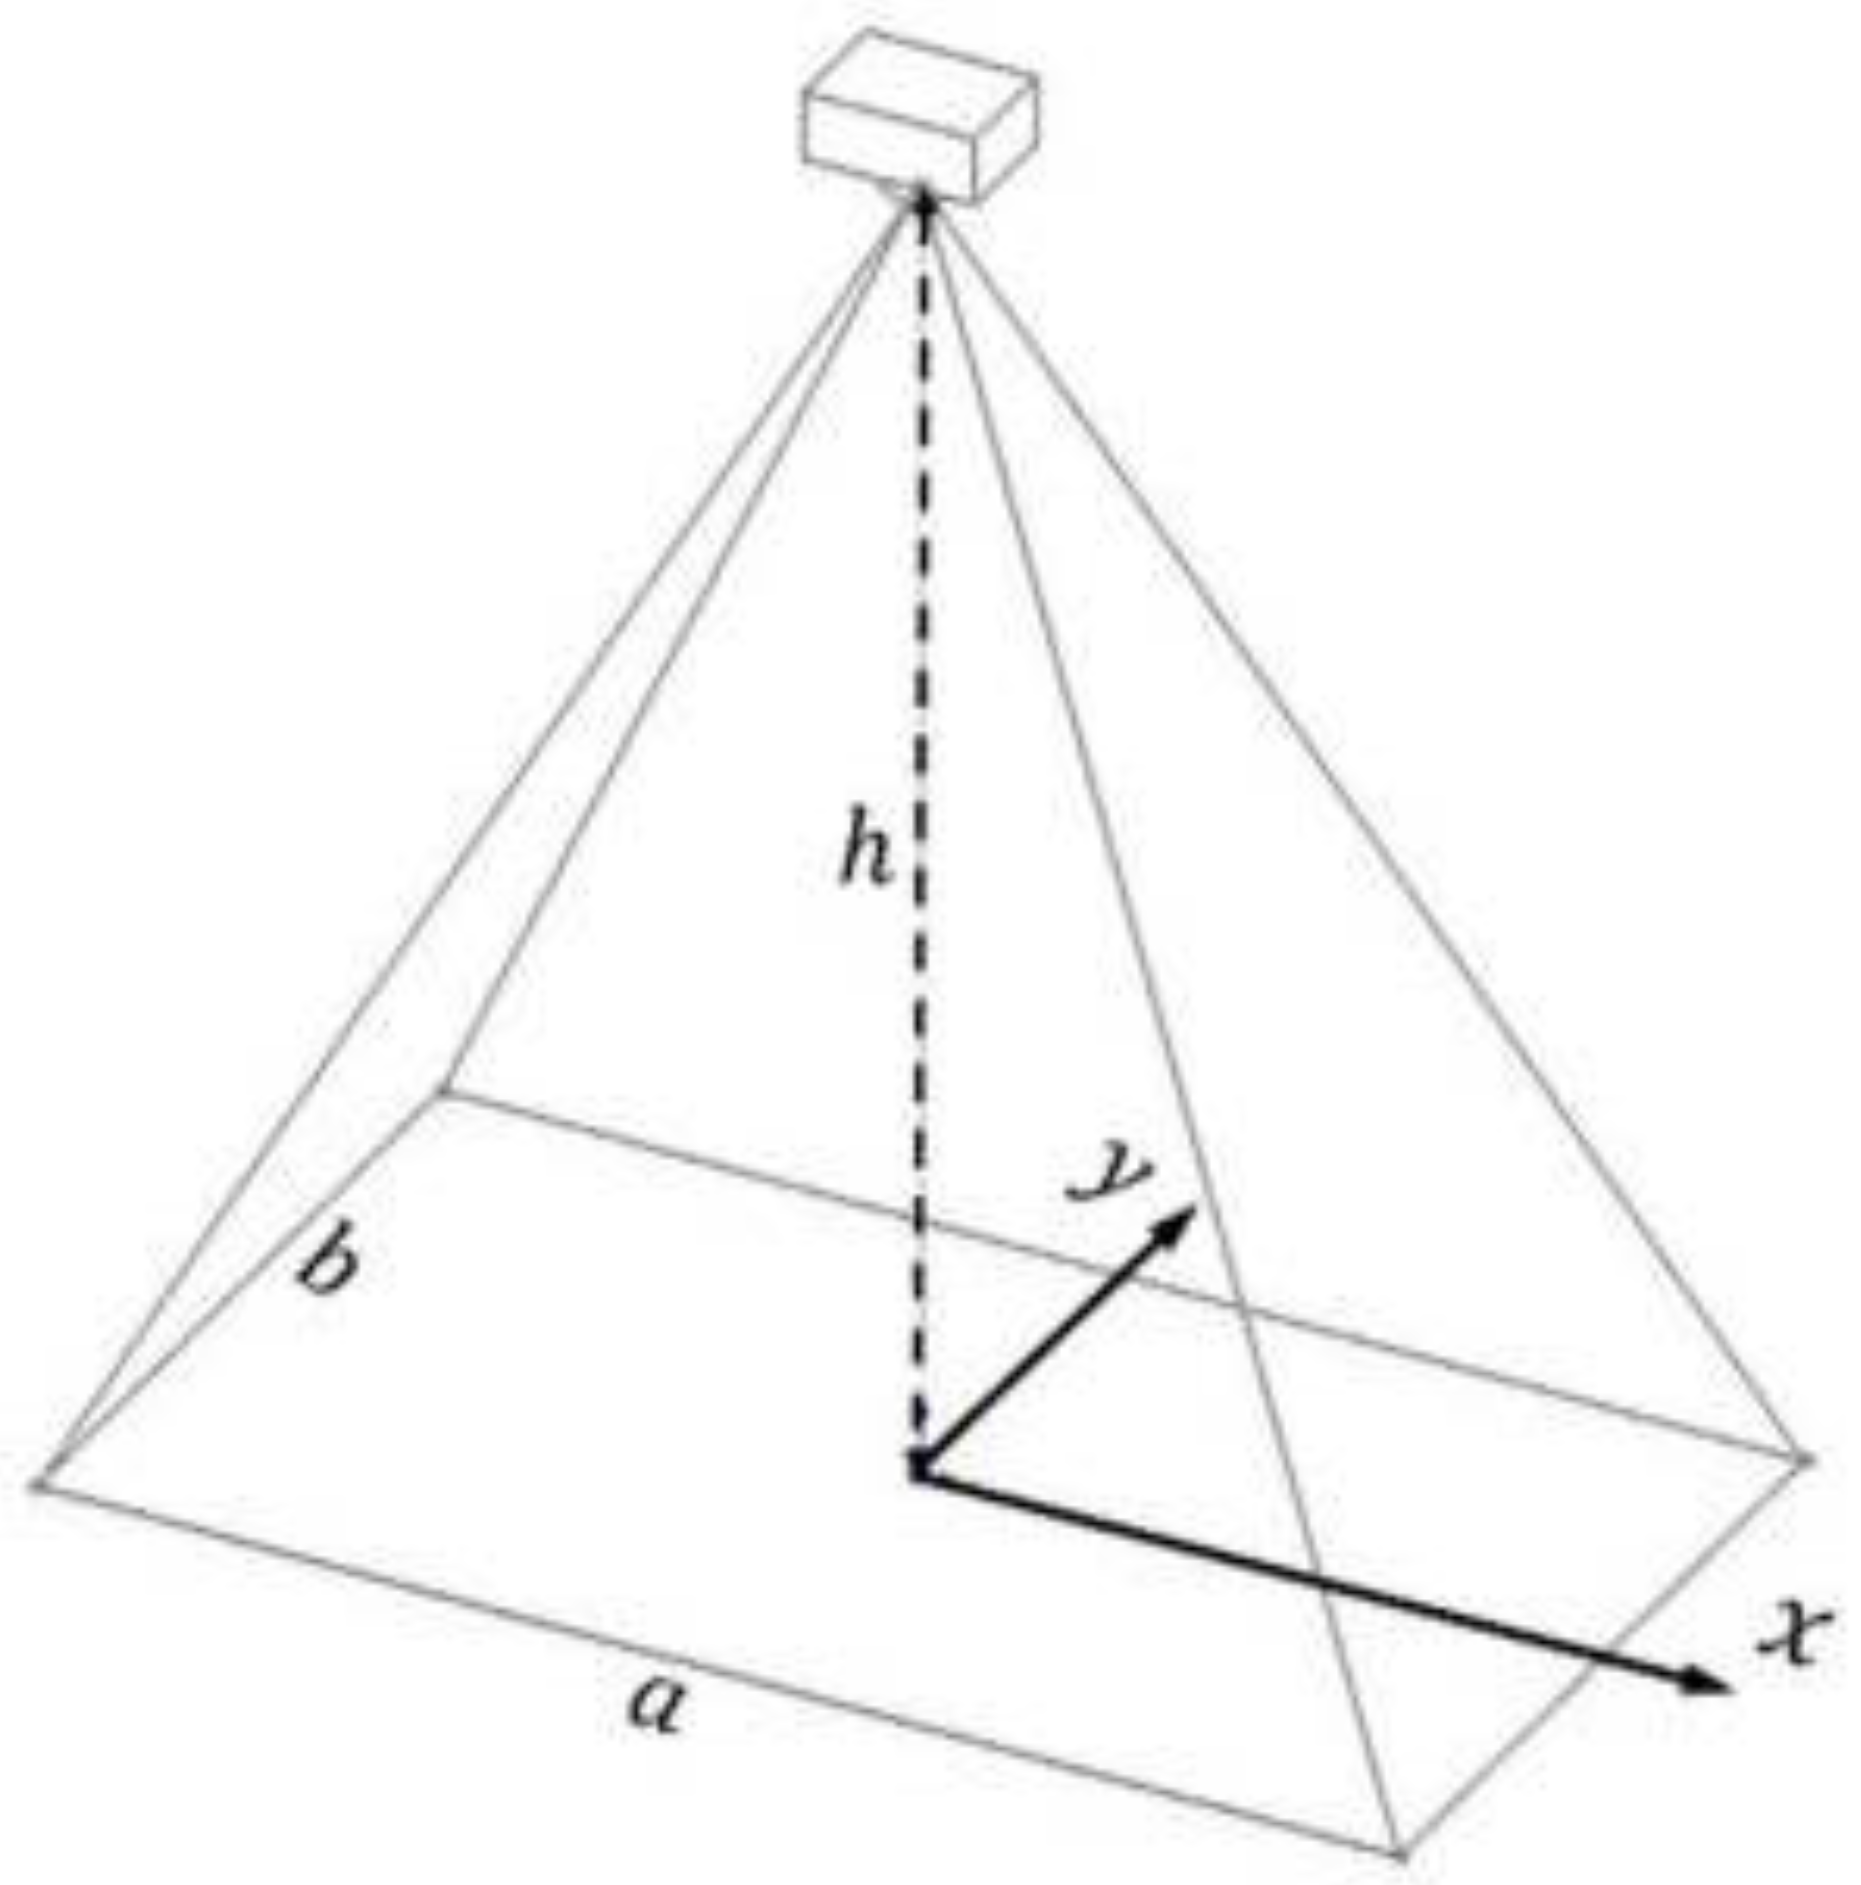
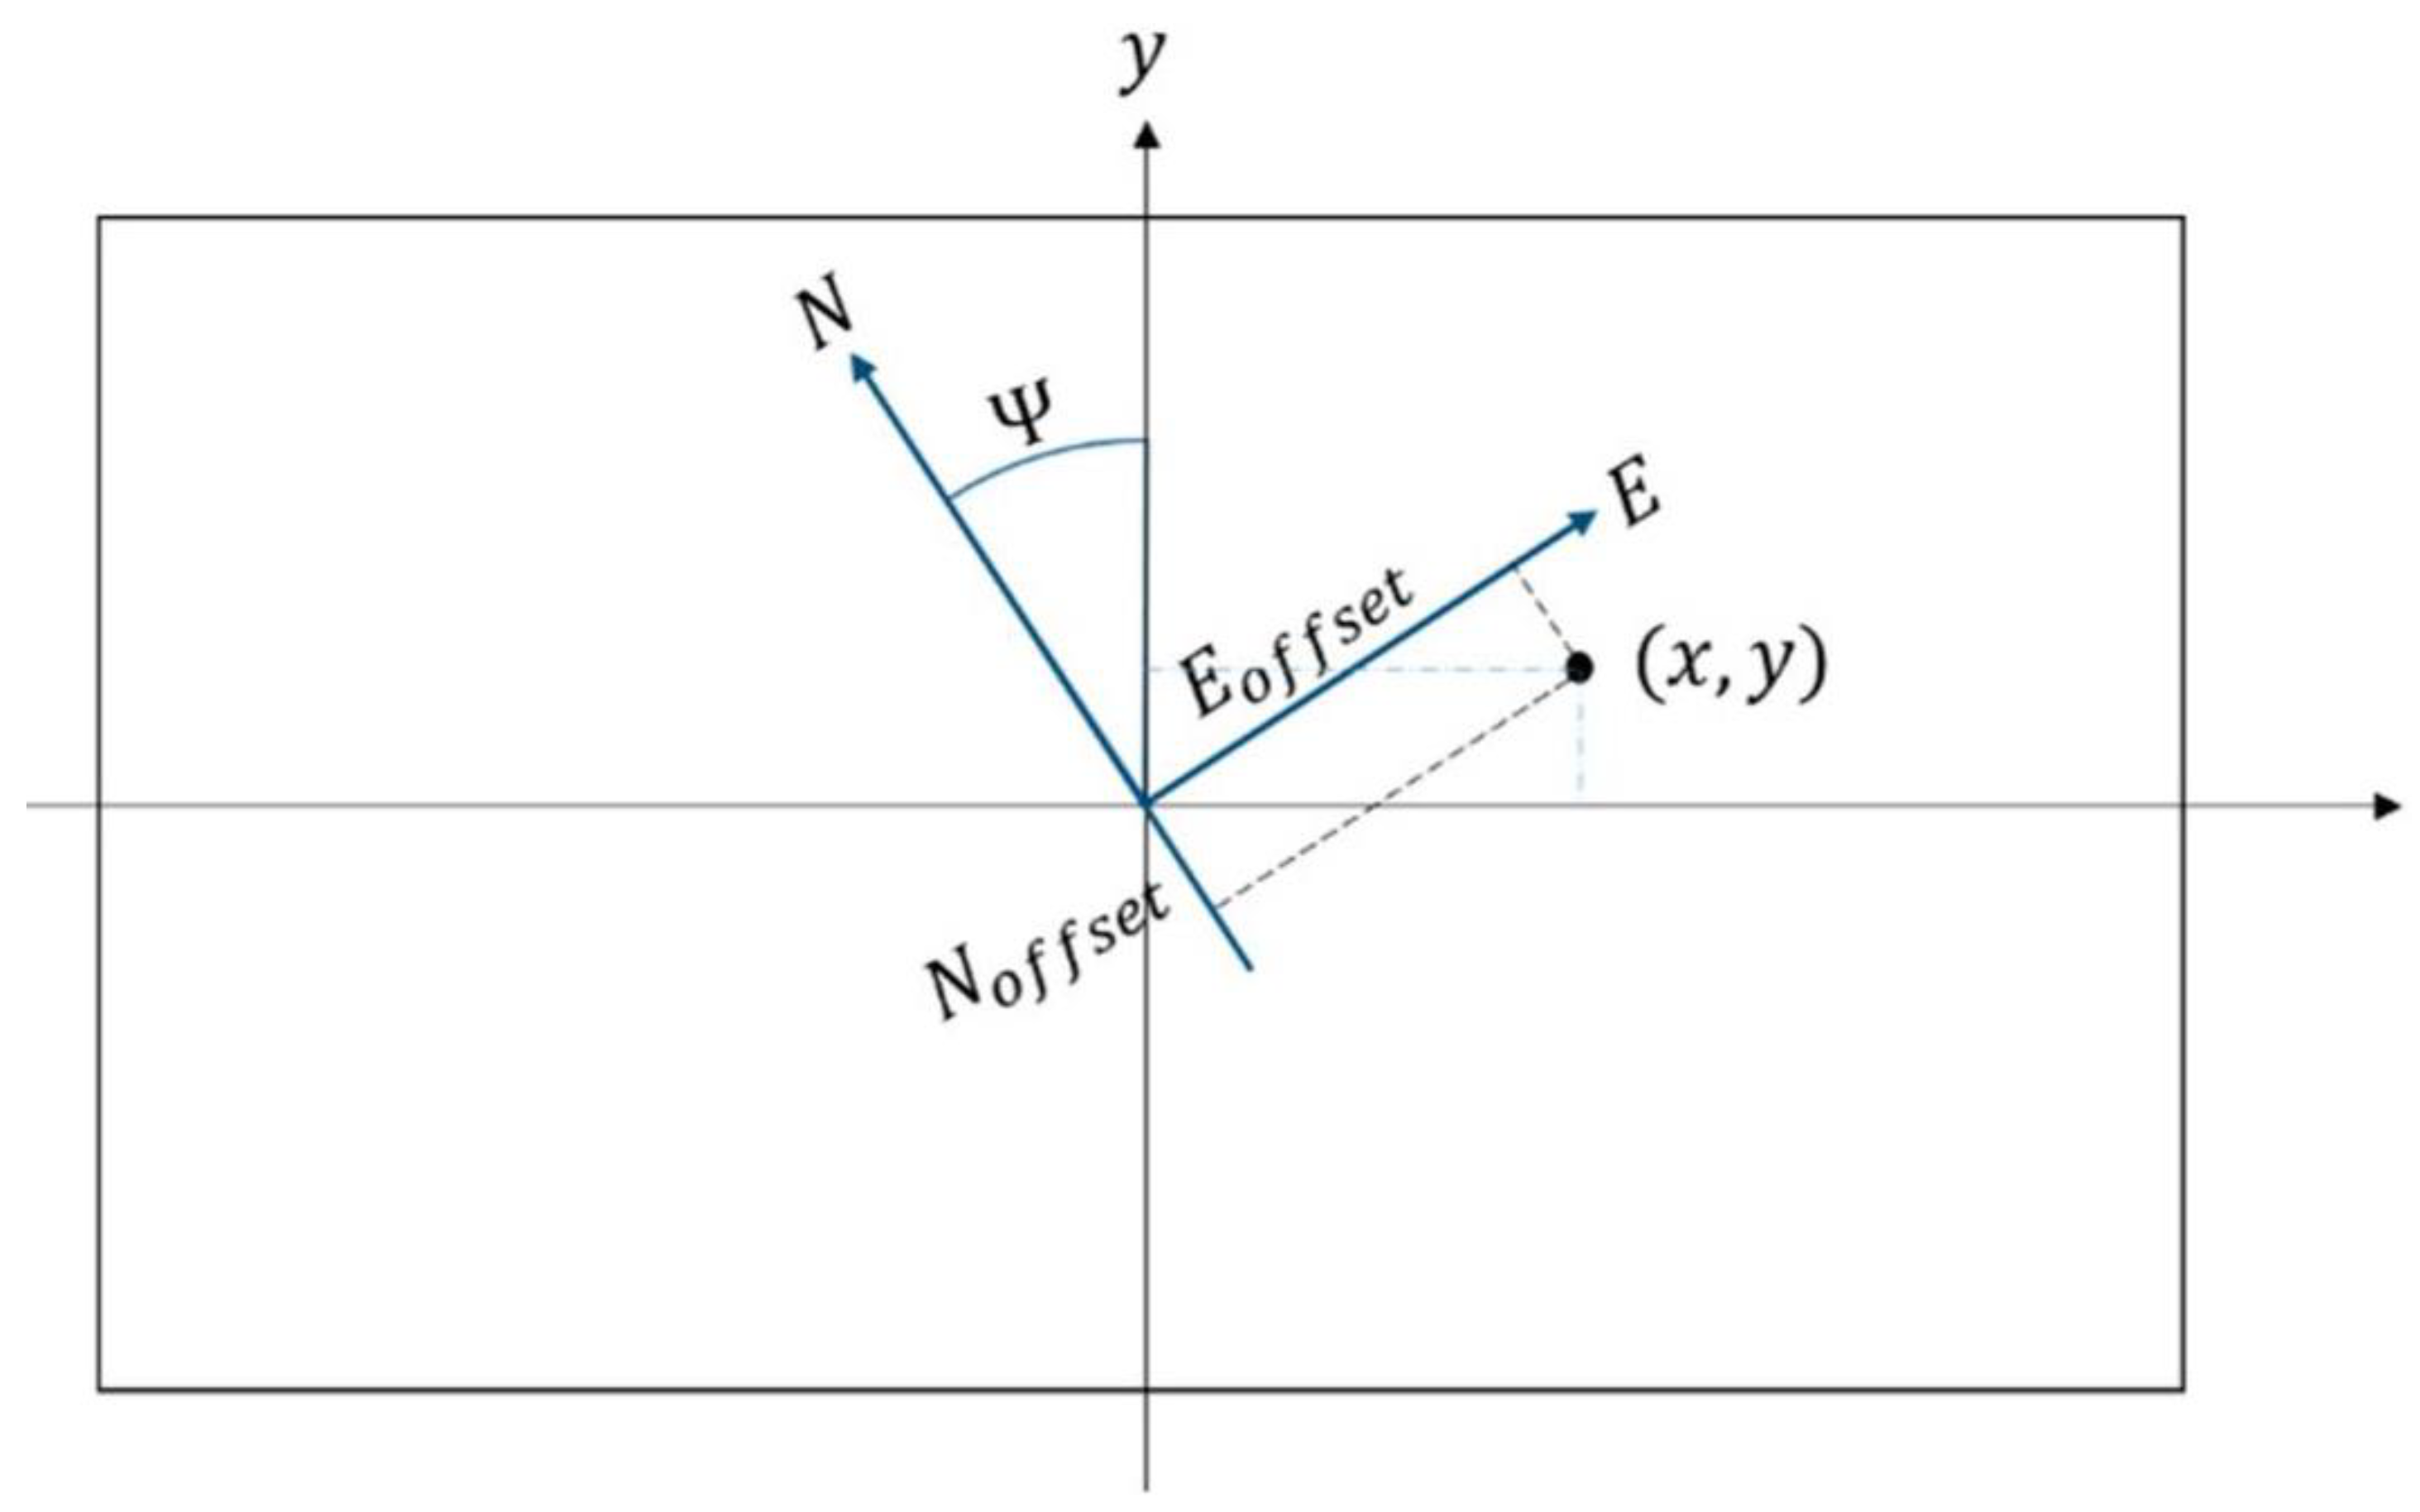
Appendix A.2. GNSS Transformation to Locate Fire Pixels

The coverage of an image in the x and y directions (as shown in Figure A2) can be estimated using the camera’s field of view (FOV) as described in Equations (A2) and (A3), assuming that the camera is always pointing straight down.
Figure A2. Area Coverage of onboard camera.
Drones 09 00459 g0a2
a = 2 h c o s F O V x 2
b = 2 h c o s F O V y 2
For an image size of 640 × 480, the scale between the distance and pixels is assumed to be a linear relationship, as shown below:
s c a l e x = a 640 = 2 h 640 F O V x 2
s c a l e y = b 480 = 2 h 480 F O V y 2
As shown in Figure A3, a target is assumed to be located in the ( x , y ) pixel in the image, and the offset of the target from the centre of the image is
o f f s e t t a r g e t = s c a l e x · x s c a l e y · y ( m )
Figure A3. Coordinates of image and world frame.
Drones 09 00459 g0a3
For a transformation from a north-east (NE) world-to-camera frame with the angle φ , the rotation matrix is defined as
R W C = cos φ s i n ( φ ) s i n ( φ ) c o s ( φ )
φ denotes the yaw angle of the UAV. Hence the position offset in the world frame can be described as
P = R W C T · o f f s e t t a r g e t = P E P N
Finally, the GNSS location can be determined using
G N S S f i r e = G N S S c a m + P E / f x P N / f y
where f x and f y denote the distances represented by one degree of longitude and latitude, respectively.
A user-friendly visualization application was built using the Flask library, a lightweight Python web development framework. Users can access our web application and upload images for offline analysis. Our application has an embedded map for visualizing the GNSS location of the detected fires, as shown in Figure A4. Our users have provided feedback that the interface is intuitive and easy to navigate with quick response times for both the model prediction and geolocation of fire-affected areas.
Figure A4. User Interface (top). Blue markers on marks (bottom) denote GPS positions of detected fires displayed on map.
Drones 09 00459 g0a4
We observed a positional error of ±5 m when the results were validated against the GNSS positions reported by Google Earth. The main error in target geolocation came from system errors, mainly measurement errors from the GNSS and IMU. These sensors introduced errors into the position and attitude information for the UAV.

References

  1. Rein, G.; Cleaver, N.; Ashton, C.; Pironi, P.; Torero, J.L. The severity of smouldering peat fires and damage to the forest soil. CATENA 2008, 74, 304–309. [Google Scholar] [CrossRef]
  2. Page, S.E.; Hooijer, A. In the line of fire: The peatlands of Southeast Asia. Philos. Trans. R. Soc. B Biol. Sci. 2016, 371, 20150176. [Google Scholar] [CrossRef] [PubMed]
  3. Lohberger, S.; Stängel, M.; Atwood, E.C.; Siegert, F. Spatial evaluation of Indonesia’s 2015 fire-affected area and estimated carbon emissions using Sentinel-1. Glob. Change Biol. 2018, 24, 644–654. [Google Scholar] [CrossRef] [PubMed]
  4. Crippa, P.; Castruccio, S.; Archer-Nicholls, S.; Lebron, G.B.; Kuwata, M.; Thota, A.; Sumin, S.; Butt, E.; Wiedinmyer, C.; Spracklen, D.V. Population exposure to hazardous air quality due to the 2015 fires in Equatorial Asia. Sci. Rep. 2016, 6, 37074. [Google Scholar] [CrossRef] [PubMed]
  5. Kelhä, V.; Rauste, Y.; Häme, T.; Sephton, T.; Buongiorno, A.; Frauenberger, O.; Soini, K.; Venäläinen, A.; San Miguel-Ayanz, J.; Vainio, T. Combining AVHRR and ATSR satellite sensor data for operational boreal forest fire detection. Int. J. Remote Sens. 2003, 24, 1691–1708. [Google Scholar] [CrossRef]
  6. He, L.; Li, Z. Enhancement of a fire-detection algorithm by eliminating solar contamination effects and atmospheric path radiance: Application to MODIS data. Int. J. Remote Sens. 2011, 32, 6273–6293. [Google Scholar] [CrossRef]
  7. Zhang, L.; Wang, B.; Peng, W.; Li, C.; Lu, Z.; Guo, Y. A Method for Forest Fire Detection Using UAV. In Proceedings of the Computer Science and Technology 2015, Zurich, Switzerland, 2–3 January 2015; pp. 69–74. [Google Scholar] [CrossRef]
  8. Yuan, C.; Liu, Z.; Zhang, Y. UAV-based forest fire detection and tracking using image processing techniques. In Proceedings of the 2015 International Conference on Unmanned Aircraft Systems (ICUAS), Denver, CO, USA, 9–12 June 2015; pp. 639–643. [Google Scholar] [CrossRef]
  9. Christensen, B.R. Use of UAV or remotely piloted aircraft and forward-looking infrared in forest, rural and wildland fire management: Evaluation using simple economic analysis. N. Z. J. For. Sci. 2015, 45, 16. [Google Scholar] [CrossRef]
  10. Krizhevsky, A.; Sutskever, I.; Hinton, G.E. ImageNet Classification with Deep Convolutional Neural Networks. Adv. Neural Inf. Process. Syst. 2012, 25. Available online: https://code.google.com/archive/p/cuda-convnet/ (accessed on 23 September 2021). [CrossRef]
  11. Zhao, Y.; Ma, J.; Li, X.; Zhang, J. Saliency detection and deep learning-based wildfire identification in UAV imagery. Sensors 2018, 18, 712. [Google Scholar] [CrossRef] [PubMed]
  12. Tang, Z.; Liu, X.; Chen, H.; Hupy, J.; Yang, B. Deep Learning Based Wildfire Event Object Detection from 4K Aerial Images Acquired by UAS. AI 2020, 1, 166–179. [Google Scholar] [CrossRef]
  13. Jiao, Z.; Zhang, Y.; Mu, L.; Xin, J.; Jiao, S.; Liu, H.; Liu, D. A YOLOv3-based Learning Strategy for Real-time UAV-based Forest Fire Detection. In Proceedings of the 2020 Chinese Control and Decision Conference (CCDC), Hefei, China, 22–24 August 2020; pp. 4963–4967. [Google Scholar] [CrossRef]
  14. Burke, C.; McWhirter, P.R.; Veitch-Michaelis, J.; McAree, O.; Pointon, H.A.G.; Wich, S.; Longmore, S. Requirements and Limitations of Thermal Drones for Effective Search and Rescue in Marine and Coastal Areas. Drones 2019, 3, 78. [Google Scholar] [CrossRef]
  15. Burke, C.; Wich, S.; Kusin, K.; McAree, O.; Harrison, M.E.; Ripoll, B.; Ermiasi, Y.; Mulero-Pázmány, M.; Longmore, S. Thermal-Drones as a Safe and Reliable Method for Detecting Subterranean Peat Fires. Drones 2019, 3, 23. [Google Scholar] [CrossRef]
  16. Tlig, M.; Bouchouicha, M.; Sayadi, M.; Moreau, E. Visible and infraredimage fusion framework for fire semantic segmentation using U-Net-ResNet50. In Proceedings of the 2022 IEEE Information Technologies & Smart Industrial Systems (ITSIS), Paris, France, 15–17 July 2022; pp. 1–5. [Google Scholar]
  17. Zhang, P.; Ban, Y.; Nascetti, A. Learning U-Net without forgetting for near real-time wildfire monitoring by the fusion of SAR and optical time series. Remote Sens. Environ. 2021, 261, 112467. [Google Scholar] [CrossRef]
  18. Mavic 2 Enterprise Series—Specifications—DJI. Available online: https://www.dji.com/uk/mavic-2-enterprise/specs (accessed on 5 April 2022).
  19. Liao, P.-S.; Chen, T.-S.; Chung, P.-C. A Fast Algorithm for Multilevel Thresholding. J. Inf. Sci. Eng. 2001, 17, 713–727. [Google Scholar]
  20. Ronneberger, O.; Fischer, P.; Brox, T. U-net: Convolutional networks for biomedical image segmentation. arXiv 2015, arXiv:1505.04597. [Google Scholar] [CrossRef]
  21. Russakovsky, O.; Deng, J.; Su, H.; Krause, J.; Satheesh, S.; Ma, S.; Huang, Z.; Karpathy, A.; Khosla, A.; Bernstein, M.; et al. ImageNet Large Scale Visual Recognition Challenge. Int. J. Comput. Vis. 2015, 115, 211–252. [Google Scholar] [CrossRef]
  22. Sandler, M.; Howard, A.; Zhu, M.; Zhmoginov, A.; Chen, L.-C. MobileNetV2: Inverted Residuals and Linear Bottlenecks. In Proceedings of the 2018 IEEE/CVF Conference on Computer Vision and Pattern Recognition (CVPR), Salt Lake City, UT, USA, 18–22 June 2018; pp. 4510–4520. [Google Scholar]
  23. He, K.; Zhang, X.; Ren, S.; Sun, J. Deep Residual Learning for Image Recognition. In Proceedings of the 2016 IEEE Conference on Computer Vision and Pattern Recognition (CVPR), Las Vegas, NV, USA, 27–30 June 2016; pp. 770–778. [Google Scholar] [CrossRef]
  24. LeCun, Y.; Bottou, L.; Bengio, Y.; Haffner, P. Gradient-based learning applied to document recognition. Proc. IEEE 1998, 86, 2278–2323. [Google Scholar] [CrossRef]
  25. Rocha, L.; Velho, L.; Carvalho, P.C.P. Image moments-based structuring and tracking of objects. In Proceedings of the XV Brazilian Symposium on Computer Graphics and Image Processing, Fortaleza, Brazil, 10 October 2002; pp. 99–105. [Google Scholar] [CrossRef]
Figure 1. Experimental setup for data collection. A pit was dug which contained the fires within a 30 cm long × 19 cm diameter cylinder filled with charcoal.
Drones 09 00459 g001
Figure 2. Aerial capture of fire.
Drones 09 00459 g002
Figure 3. Adaptive thresholding using Otsu’s method—thermal image acquired from DJI drone (left) and segmentation map (right), where (black) red corresponds to pixels in which fire was (not) detected. Setup shown above was for experimental test fire, as shown in Figure 1.
Drones 09 00459 g003
Figure 4. Overview of UNET architecture [20].
Drones 09 00459 g004
Figure 5. Residual learning: a building block.
Drones 09 00459 g005
Figure 6. Accuracy (left) and loss curves (right) obtained during training.
Drones 09 00459 g006
Figure 7. Comparison between Res-Net50 and MobileNetV2 encoders.
Drones 09 00459 g007
Figure 8. Semantic segmentation of experimental fires. Image acquired from onboard thermal camera (left). Model’s prediction of fires (right).
Drones 09 00459 g008
Figure 9. Model prediction on real-world fire images. Fire images acquired from DJI drone (left). Model prediction using ResNet50 (right).
Drones 09 00459 g009
Figure 10. Thermal image captured by DJI drone (left). Output mask created using Otsu’s segmentation technique (right).
Drones 09 00459 g010
Figure 11. Captured image from DJI drone (left). Model prediction by trained model (right).
Drones 09 00459 g011
Table 1. Hyperparameter settings.
Solver TypeBase Learning RateGammaMomentumBatch Size
SGD0.0010.10.932
Table 2. K-fold cross-validation result.
ModelsAverage PrecisionAverage RecallAverage IoUParameters
ResNet500.9420.9150.87620,670,359
MobileNetV20.9780.5470.5793,630,593
Comparison of various models using different metrics; bolded value represents best result.
Disclaimer/Publisher’s Note: The statements, opinions and data contained in all publications are solely those of the individual author(s) and contributor(s) and not of MDPI and/or the editor(s). MDPI and/or the editor(s) disclaim responsibility for any injury to people or property resulting from any ideas, methods, instructions or products referred to in the content.

