1. Introduction
Understanding the abundance and distribution of specific waterfowl species during the nonbreeding season is critical for both ecological insight and effective wildlife management. Species such as mallards (Anas platyrhynchos), blue-winged teal (Spatula discors), and northern pintails (Anas acuta) are not only economically valuable game birds, but also play essential ecological roles in nutrient cycling, seed dispersal, and maintaining wetland ecosystem health [
1,
2,
3,
4]. As bioindicators, their population dynamics reflect underlying changes in habitat quality and hydrological conditions. Consequently, accurate population estimates are indispensable for informing adaptive management decisions by conservation agencies, including the regulation of water levels, hunting seasons, and wetland restoration priorities [
5].
Traditional waterfowl monitoring methods—such as ground-based surveys and low-altitude crewed aircraft—are often limited by high operational costs, logistical constraints, and the potential to disturb wildlife. In recent years, the integration of uncrewed aerial systems (UASs) with artificial intelligence (AI)-driven analysis has emerged as a promising alternative for avian population monitoring [
6,
7]. These technologies enable efficient, scalable, and non-intrusive data collection [
8,
9], aligning with broader conservation objectives outlined in major initiatives. Among AI-based solutions, deep learning object detectors such as the YOLO (“You Only Look Once”) family have gained popularity for real-time wildlife detection due to their fast inference speed and high accuracy in single-stage object detection frameworks [
10,
11]. Variants like YOLOv4 [
12] and YOLOv5 [
13] have demonstrated effective bird and mammal detection from aerial imagery, with improvements in feature extraction and backbone efficiency to support complex environmental scenes. More recently, lightweight adaptations such as WilDect-YOLO, based on YOLOv4 [
10], and WildARe-YOLO, based on YOLOv5s [
11], have been designed to balance performance and computational cost, enabling use on edge devices in remote conservation areas. These developments illustrate the growing role of YOLO-based frameworks in ecological applications, motivating their continued evaluation for robust waterfowl detection under variable conditions.
In this work, we have developed an end-to-end system that employs a variety of AI technologies, especially deep learning and generative AI, to accurately count waterfowl and identify their habitats in drone imagery. This system culminates in the generation of detailed, text-based reports that effectively summarize the collected imagery. Traditional approaches to waterfowl population survey and habitat monitoring have predominantly relied on manual techniques such as field observation from manned aircraft [
14]. The manual methods are often time-consuming, labor-intensive, expensive, and constrained by limited spatial coverage. By utilizing drone imagery and AI techniques, our work aims to overcome these challenges, enabling more efficient data collection and analysis while maintaining accuracy comparable to human observation [
15,
16].
This study proposes an end-to-end system for waterfowl monitoring and habitat assessment based on drone imagery. Our system integrates automated bird detection, habitat segmentation, image overlap detection, and plain-language report generation into a unified pipeline.
Several novel components are introduced within this system. First, we propose several new methods for detecting overlapping regions between consecutive drone images, which help avoid double-counting and improve spatial accuracy. Second, we present a habitat segmentation approach that combines the Segment Anything Model (SAM) [
17] with a classifier to identify habitat regions with high accuracy. Our proposed system and methods present several advancements over previous work [
7,
18].
The main contributions of this work are as follows:
Designing and evaluating an end-to-end system for waterfowl detection and habitat mapping using UAV imagery.
Proposing several new methods to detect overlapping regions in consecutive drone images.
Introducing a new hybrid segmentation and classification method based on SAM for habitat region identification.
2. Related Work
Our proposed system incorporates several deep learning and AI technologies for wildlife survey and monitoring: deep learning models for bird detection in drone imagery, deep learning models for segmentation and classification of habitats, detection of overlapping regions between pairs of images, and ChatGPT for generation of text reports. This section reviews related work.
With recent advancements in AI and drone technologies, many wildlife survey and monitoring studies have adopted these tools. Among the existing wildlife detection programs employing aerial imagery gathered by UAVs, birds have been the focus in many studies [
6]. A notable example is the work in [
15], which developed a model capable of not only detecting but also classifying waterfowl in aerial images.
Recent studies have demonstrated the effectiveness of combining high-resolution aerial imagery and deep learning models for monitoring colonially nesting birds. Wilkin et al. [
19] developed an automated pipeline using convolutional neural networks (CNNs) to detect and count double-crested cormorants and their nests on urban bridges. Their pipeline achieved a 93.6% agreement with manual counts while reducing human labor by 96%, highlighting the practicality of AI-assisted ecological monitoring. Similarly, Cusick et al. [
20] used a YOLO-based object detection framework to count Antarctic shag nests in challenging remote island environments. Their system achieved F1 scores exceeding 0.95 on orthomosaic images and generalized well across both temporal and spatial domains. These works underscore the potential of computer vision in avian population assessments, and directly motivate the integration of deep learning detectors in our system for waterfowl abundance estimation.
In the realm of waterfowl habitat classification, ref. [
16] used a conventional CNN model for segmenting drone-captured images of bog vegetation, combined with a pixel-based Random Forest (RF) classifier for species labeling. Similarly, ref. [
18] applied a pixel-based Support Vector Machine (SVM) classifier to classify coastal habitats from drone imagery. More recent studies have advanced toward integrated deep learning pipelines using high-resolution remote sensing data. For example, Sun et al. [
21] proposed a hybrid semantic segmentation framework that integrates habitat and tidal context with U-Net architecture to map mangrove ecosystems at fine spatial resolution, achieving over 92% accuracy in complex tidal environments. Diegues et al. [
22] employed CNNs on data collected by autonomous underwater vehicles (AUVs) for automatic seabed habitat mapping, showing the versatility of deep learning beyond terrestrial environments. Additionally, Paul and Pal [
23] conducted a comparative study between machine learning and deep learning algorithms for predicting wetland habitat health in India. Their results showed that deep learning methods, particularly Dense Neural Blocks, outperformed traditional ML models in identifying degraded habitats and offered valuable insights for targeted restoration. Collectively, these studies demonstrate the growing applicability of AI-driven methods in environmental monitoring and inform the methodological choices in our proposed UAV-based waterfowl habitat and abundance mapping framework.
In our methods, we used the Segment Anything Model (SAM) from Meta [
17], whose advanced promptable segmentation capabilities had very good performance. Although SAM was not specifically designed for aerial images, its extensive training dataset may lead to good performance on drone imagery. However, there are limitations to SAM, as highlighted by [
24]. SAM exhibited sub-optimal performance when processing low-contrast images and segmenting smaller regions.The robustness of SAM was examined in [
25], which revealed that SAM’s performance substantially decreased on perturbed images as opposed to raw images, and that well-crafted user prompts can markedly enhance accuracy.
Due to the impressive text generation capabilities of ChatGPT, many researchers are applying ChatGPT for various applications. For example, ref. [
26] used both GPT-3.5 and GPT-4 to generate text reports from technical radiology data using a structured prompt. Given the complexity and low interpretability of radiology reports for general readers, GPT models were employed to transform these reports into more accessible formats. The generated texts were subsequently evaluated and scored by experienced radiologists. The study concluded that both GPT-3.5 and GPT-4 effectively converted complex data into comprehensible content, with radiologists giving an average rating of 4.27 out of 5.
3. Dataset
The dataset used in this study comprises 572 aerial images collected using a DJI Mavic Pro 2 drone across multiple conservation areas in Missouri, USA. To ensure diversity, images were captured at different altitudes (15 m, 30 m, 60 m, and 90 m) and include GPS metadata such as flight altitude, latitude/longitude, and environmental conditions. The waterfowl species observed in our imagery primarily include mallards, gadwalls, and teal species, which are dominant in Missouri wetland complexes during migration [
5]. These species are focal points of state-level waterfowl management due to their ecological roles and fluctuating population statuses. Their accurate detection and counting contribute to evaluating the effectiveness of wetland habitat conservation programs and ensuring regulatory compliance with flyway population goals.
The drone imagery used in this study was collected between October and March during the 2021–2022 nonbreeding season for waterfowl across ten conservation areas in Missouri. Waterfowl were actively present at the survey sites during this period [
5]. Flights were conducted in the morning hours, beginning no earlier than two hours after sunrise and ending by 1:00 p.m., to ensure adequate lighting and minimize behavioral disturbance to the birds [
5]. To account for variation in environmental conditions, images were collected across different altitudes (15–90 m), habitat types (e.g., open water, moist-soil, and flooded crop fields), and sky conditions (sunny and cloudy) [
9]. This design allowed us to test model performance under realistic survey conditions. Previous research has shown that lighting, vegetation cover, and survey altitude can significantly influence both image quality and waterfowl detectability [
5]. For instance, flight speeds were reduced at lower altitudes to avoid motion blur, and survey periods were spaced to avoid overlap with potential disturbances (e.g., helicopter flights), based on UAS behavior protocols outlined in [
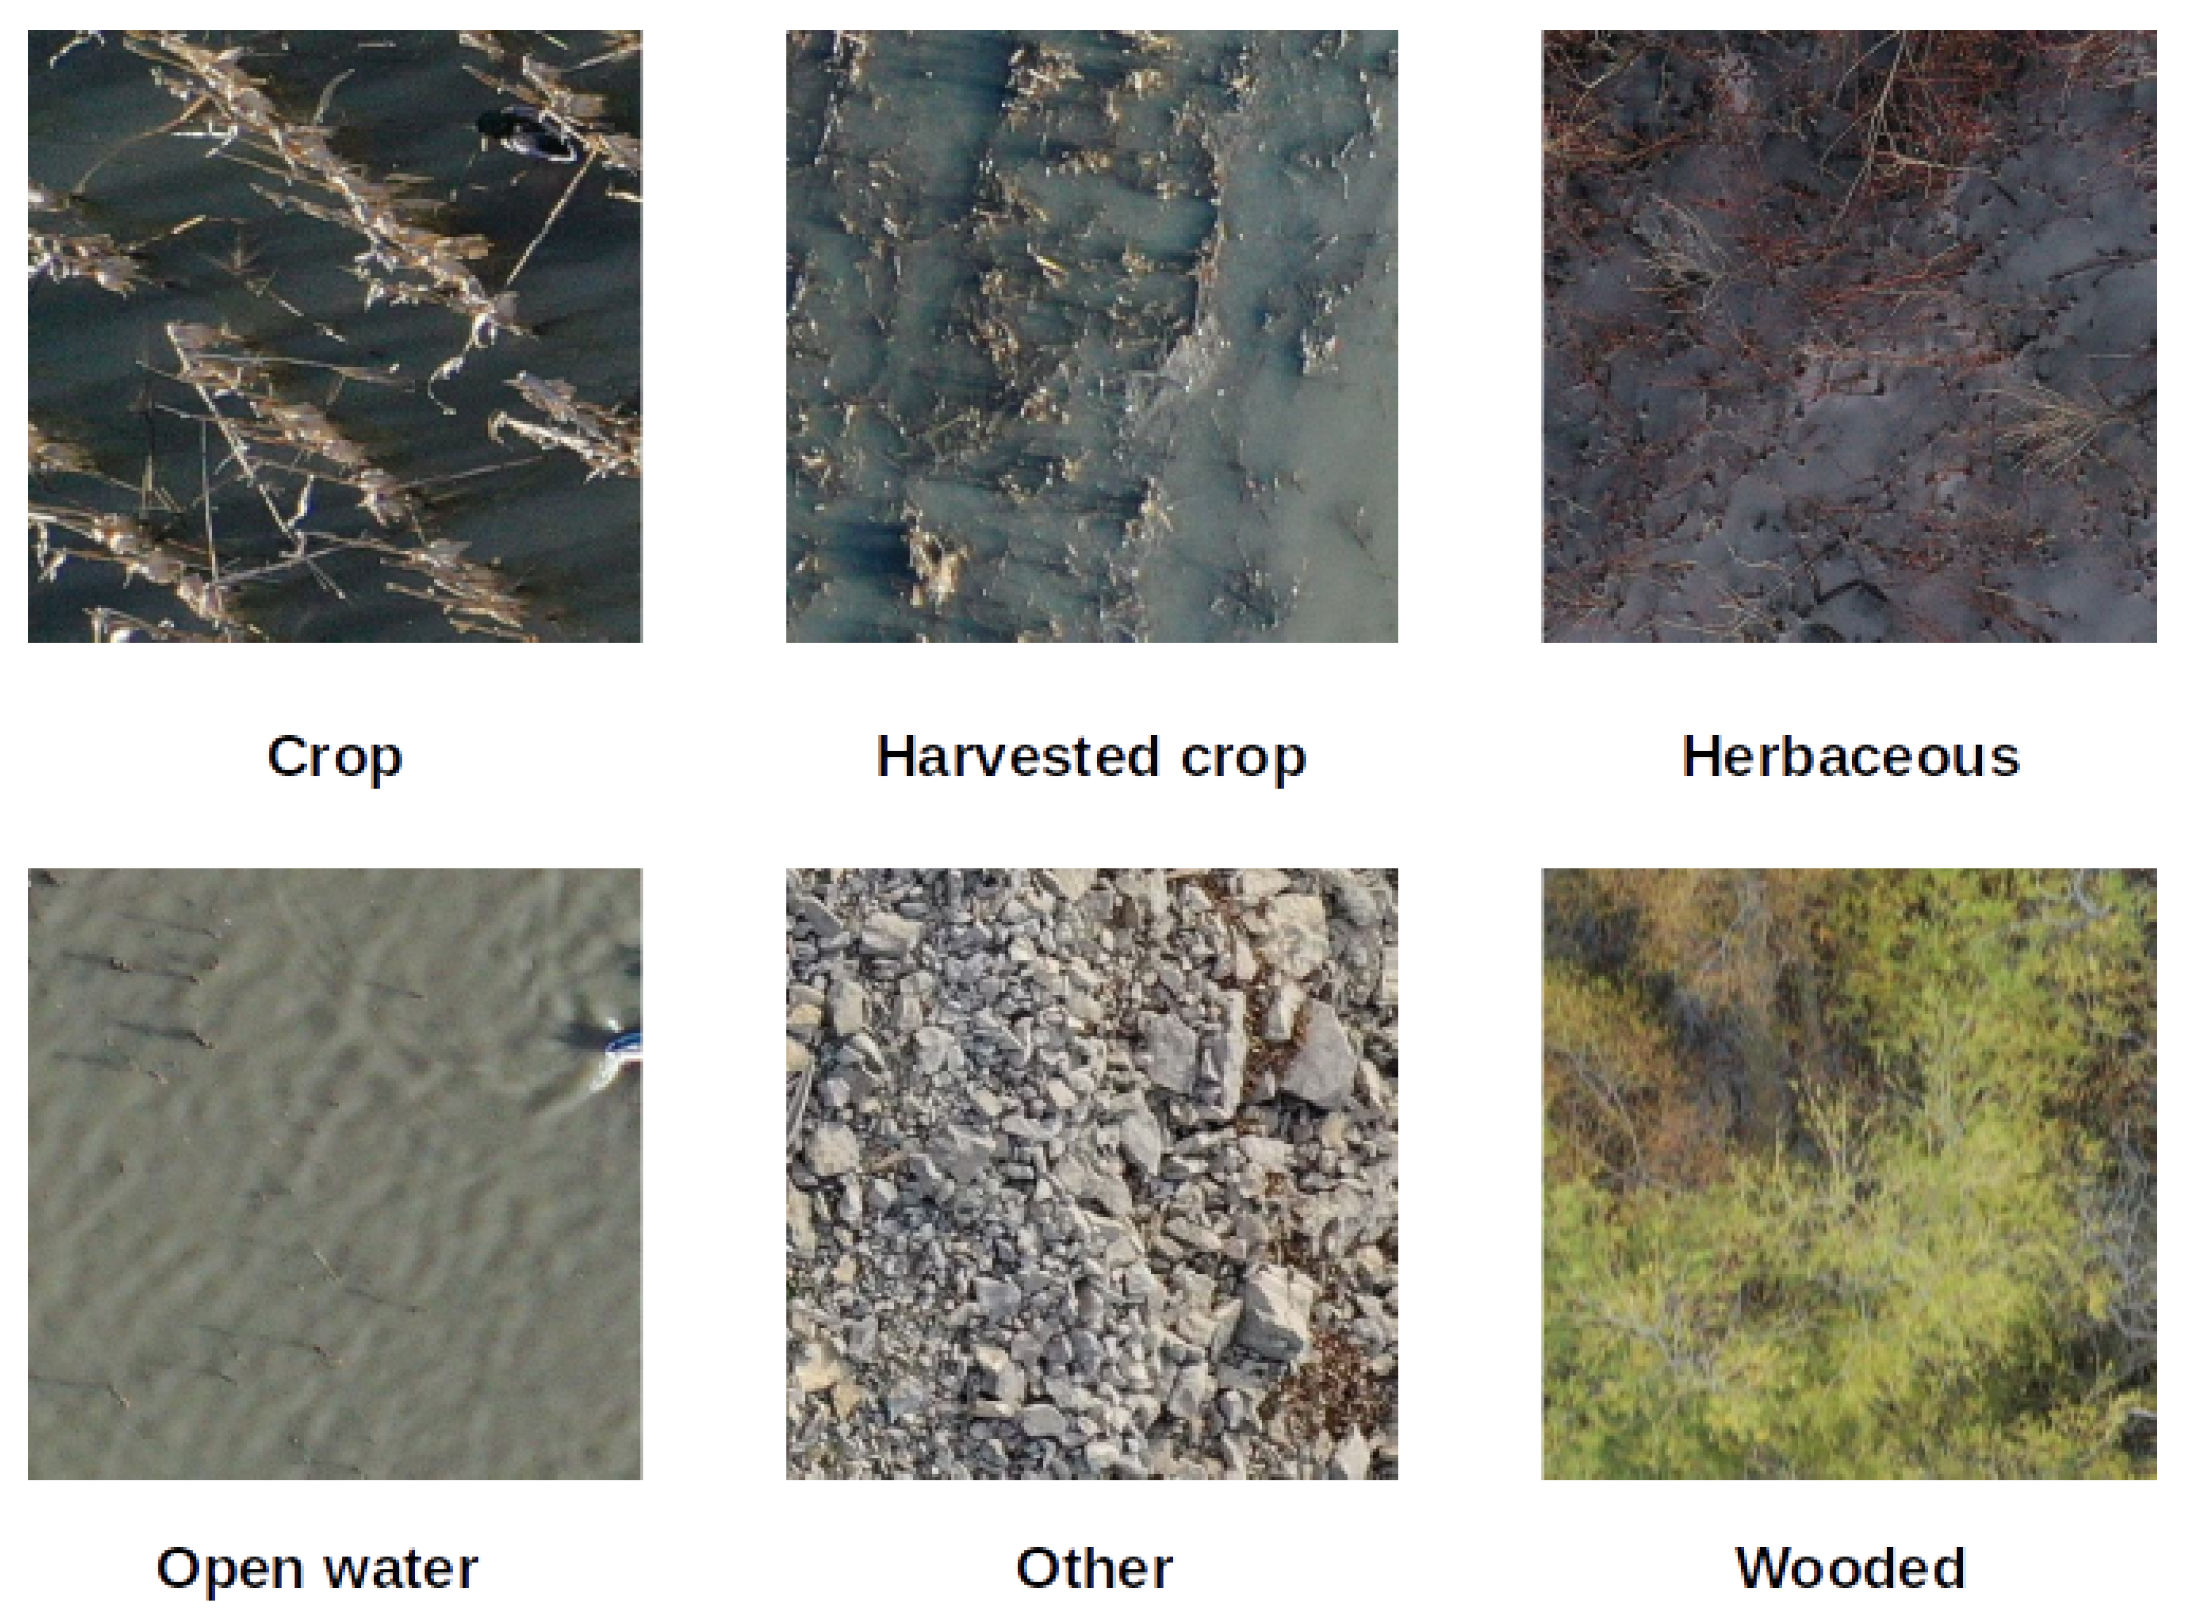
5]. Therefore, our dataset captures representative and operationally relevant imagery that reflects the temporal and environmental variability typical of wildlife monitoring scenarios. Each image was manually annotated for three key aspects: waterfowl detection, habitat segmentation, and overlapping region identification. For waterfowl detection, birds were labeled with bounding boxes using Labelme 5.2.1 software, and annotations were reviewed by experts to ensure accuracy. Habitat segmentation was performed by categorizing images into six habitat types: open water, cropland, harvested crop, wooded, herbaceous, and other, as shown in
Figure 1. To facilitate model training and evaluation, the dataset was split into training (80%), validation (10%), and test (10%) sets. The training set was used to fine-tune deep learning models for habitat classification, while the validation set helped with hyperparameter tuning. While this ensures that the test set images were not used during training, the splits were conducted within each dataset collected from the same conservation areas and seasons. Therefore, the training and test sets are not strictly independent in terms of spatial or temporal domains. Future work will include validation using independent datasets collected from different regions and seasons.
Additionally, overlapping regions in consecutive drone images were manually identified to create ground truth data for evaluating overlap detection methods. In our study, we selected representative image sequences captured at 30 m and 60 m altitudes to demonstrate our proposed methods and end-to-end system. The altitude selection was based on multiple factors, including ensuring adequate image overlap for robust analysis, compliance with local UAV regulations, and minimizing disturbances to wildlife, particularly waterfowl. Lower altitudes, such as 15 m, resulted in minimal overlap between consecutive images, while higher altitudes, such as 90 m, led to extensive overlap. We chose 30 m and 60 m as a balanced approach, allowing for effective segmentation while maintaining image clarity and minimizing bird disturbance according to previous studies [
27,
28]. The dataset used in our experiments was collected over diverse wetland habitats, including open water, crop lands, harvested fields, wooded areas, and herbaceous regions, enabling a comprehensive evaluation of the proposed methods. To ensure that only high-quality images were included in the dataset, all collected drone images underwent a manual quality screening process conducted by trained researchers.
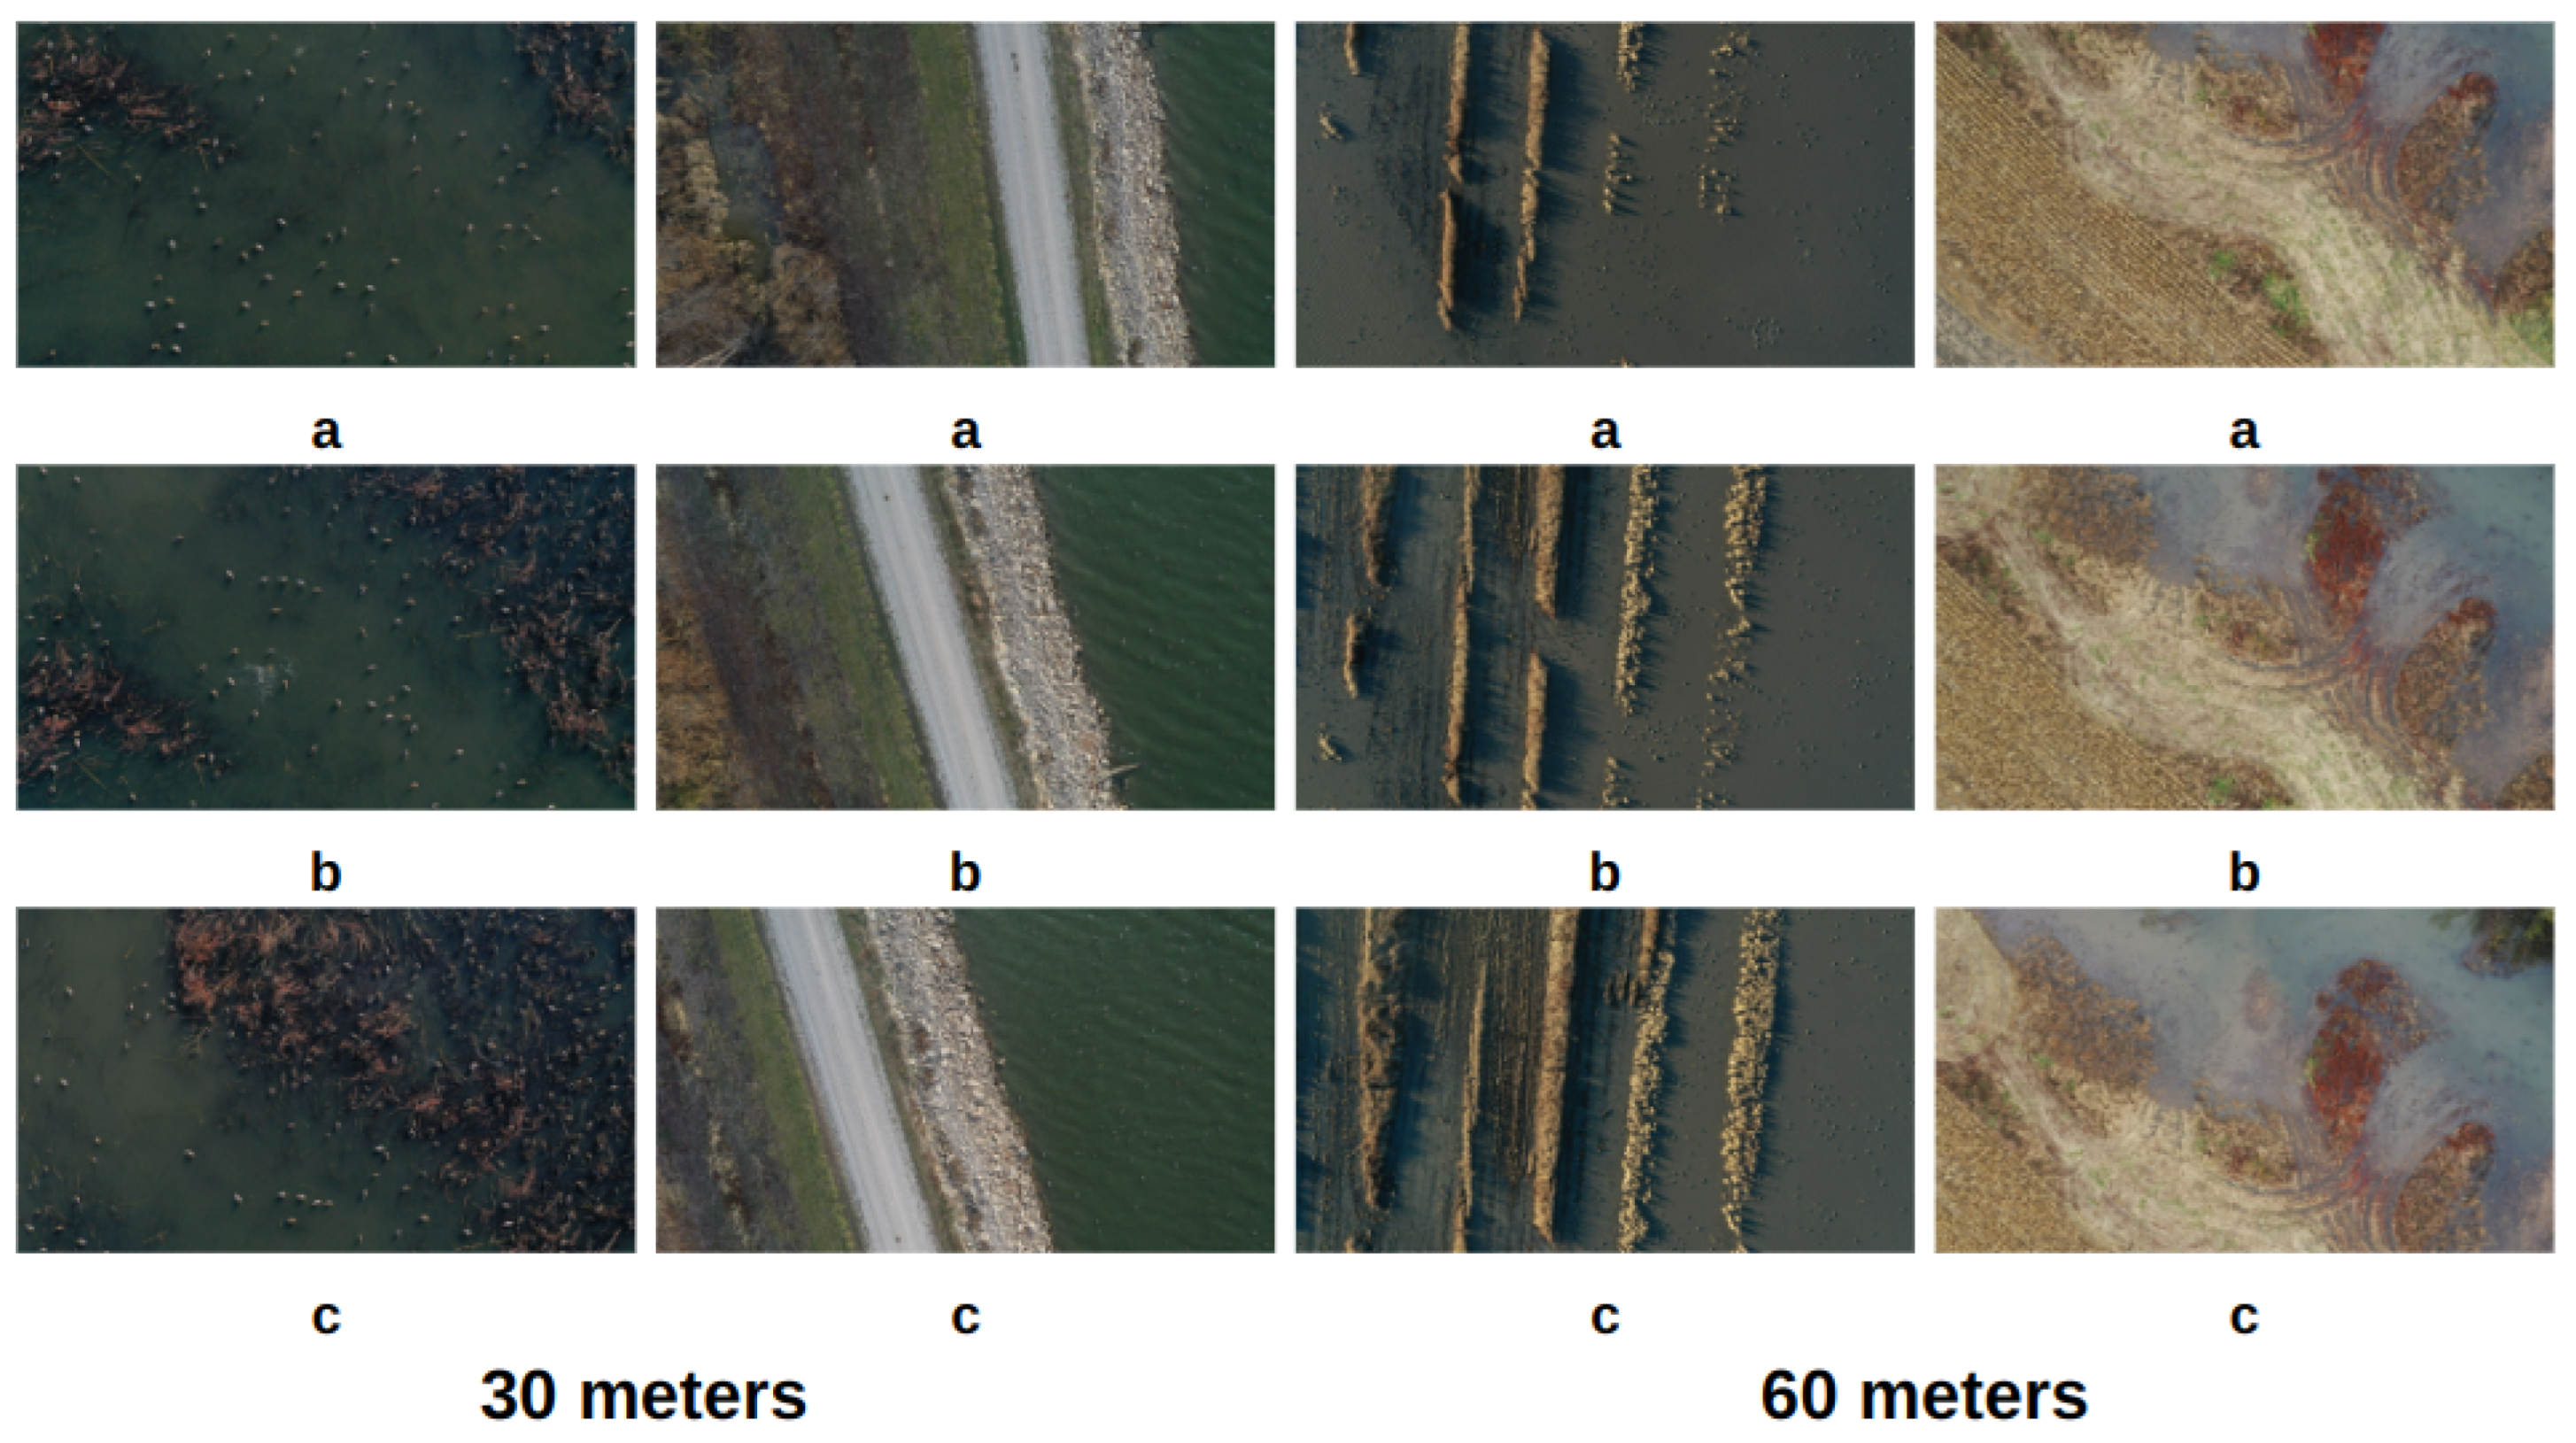
Figure 2 presents example images from two sequences captured at 30 m and 60 m altitudes, respectively.
In total, the dataset comprises 572 aerial images. For bird detection and habitat segmentation tasks, the dataset was divided into 458 images for training, 57 images for validation, and 57 images for testing. For the overlap detection experiments, we selected 10 image sequences (5 sequences captured at 30 m and 5 sequences at 60 m), with each sequence consisting of 9 consecutive images in average. All selected images were manually annotated as described above.
4. Proposed Methods
The proposed system aims to automate waterfowl detection and habitat segmentation using drone imagery and deep learning. As illustrated in
Figure 3a, the system integrates AI-based bird detection, habitat classification, and automated report generation to provide a comprehensive analysis of the surveyed area. The study follows a structured workflow, as depicted in
Figure 3b. The process begins with drone image collection and dataset creation. The system development phase includes key modules: a bird detector module, a habitat segmentation module, overlap region detection module to eliminate redundant data, and a GPT-4o-based report generator. These components work together to produce automated reports based on detected waterfowl and habitat classifications.
The architecture of our proposed system for identification of waterfowl populations in their habitats using deep learning and drone imagery is shown in
Figure 4. Our system combines object detection, semantic segmentation, report generation, and spatial overlap detection to support UAV-based waterfowl monitoring and habitat assessment. The following provides a summary of each component:
Waterfowl Detection: We evaluated three popular deep learning models for bird detection—YOLOv5, RetinaNet, and Faster R-CNN. YOLOv5 is fast and efficient, RetinaNet balances speed and accuracy, and Faster R-CNN offers high accuracy in complex scenes. We selected Faster R-CNN for its better performance in dense and vegetated environments.
Habitat Segmentation: We implemented a new method that combines the Segment Anything Model (SAM) with a ResNet50 habitat classifier, which provides more detailed and flexible segmentation results.
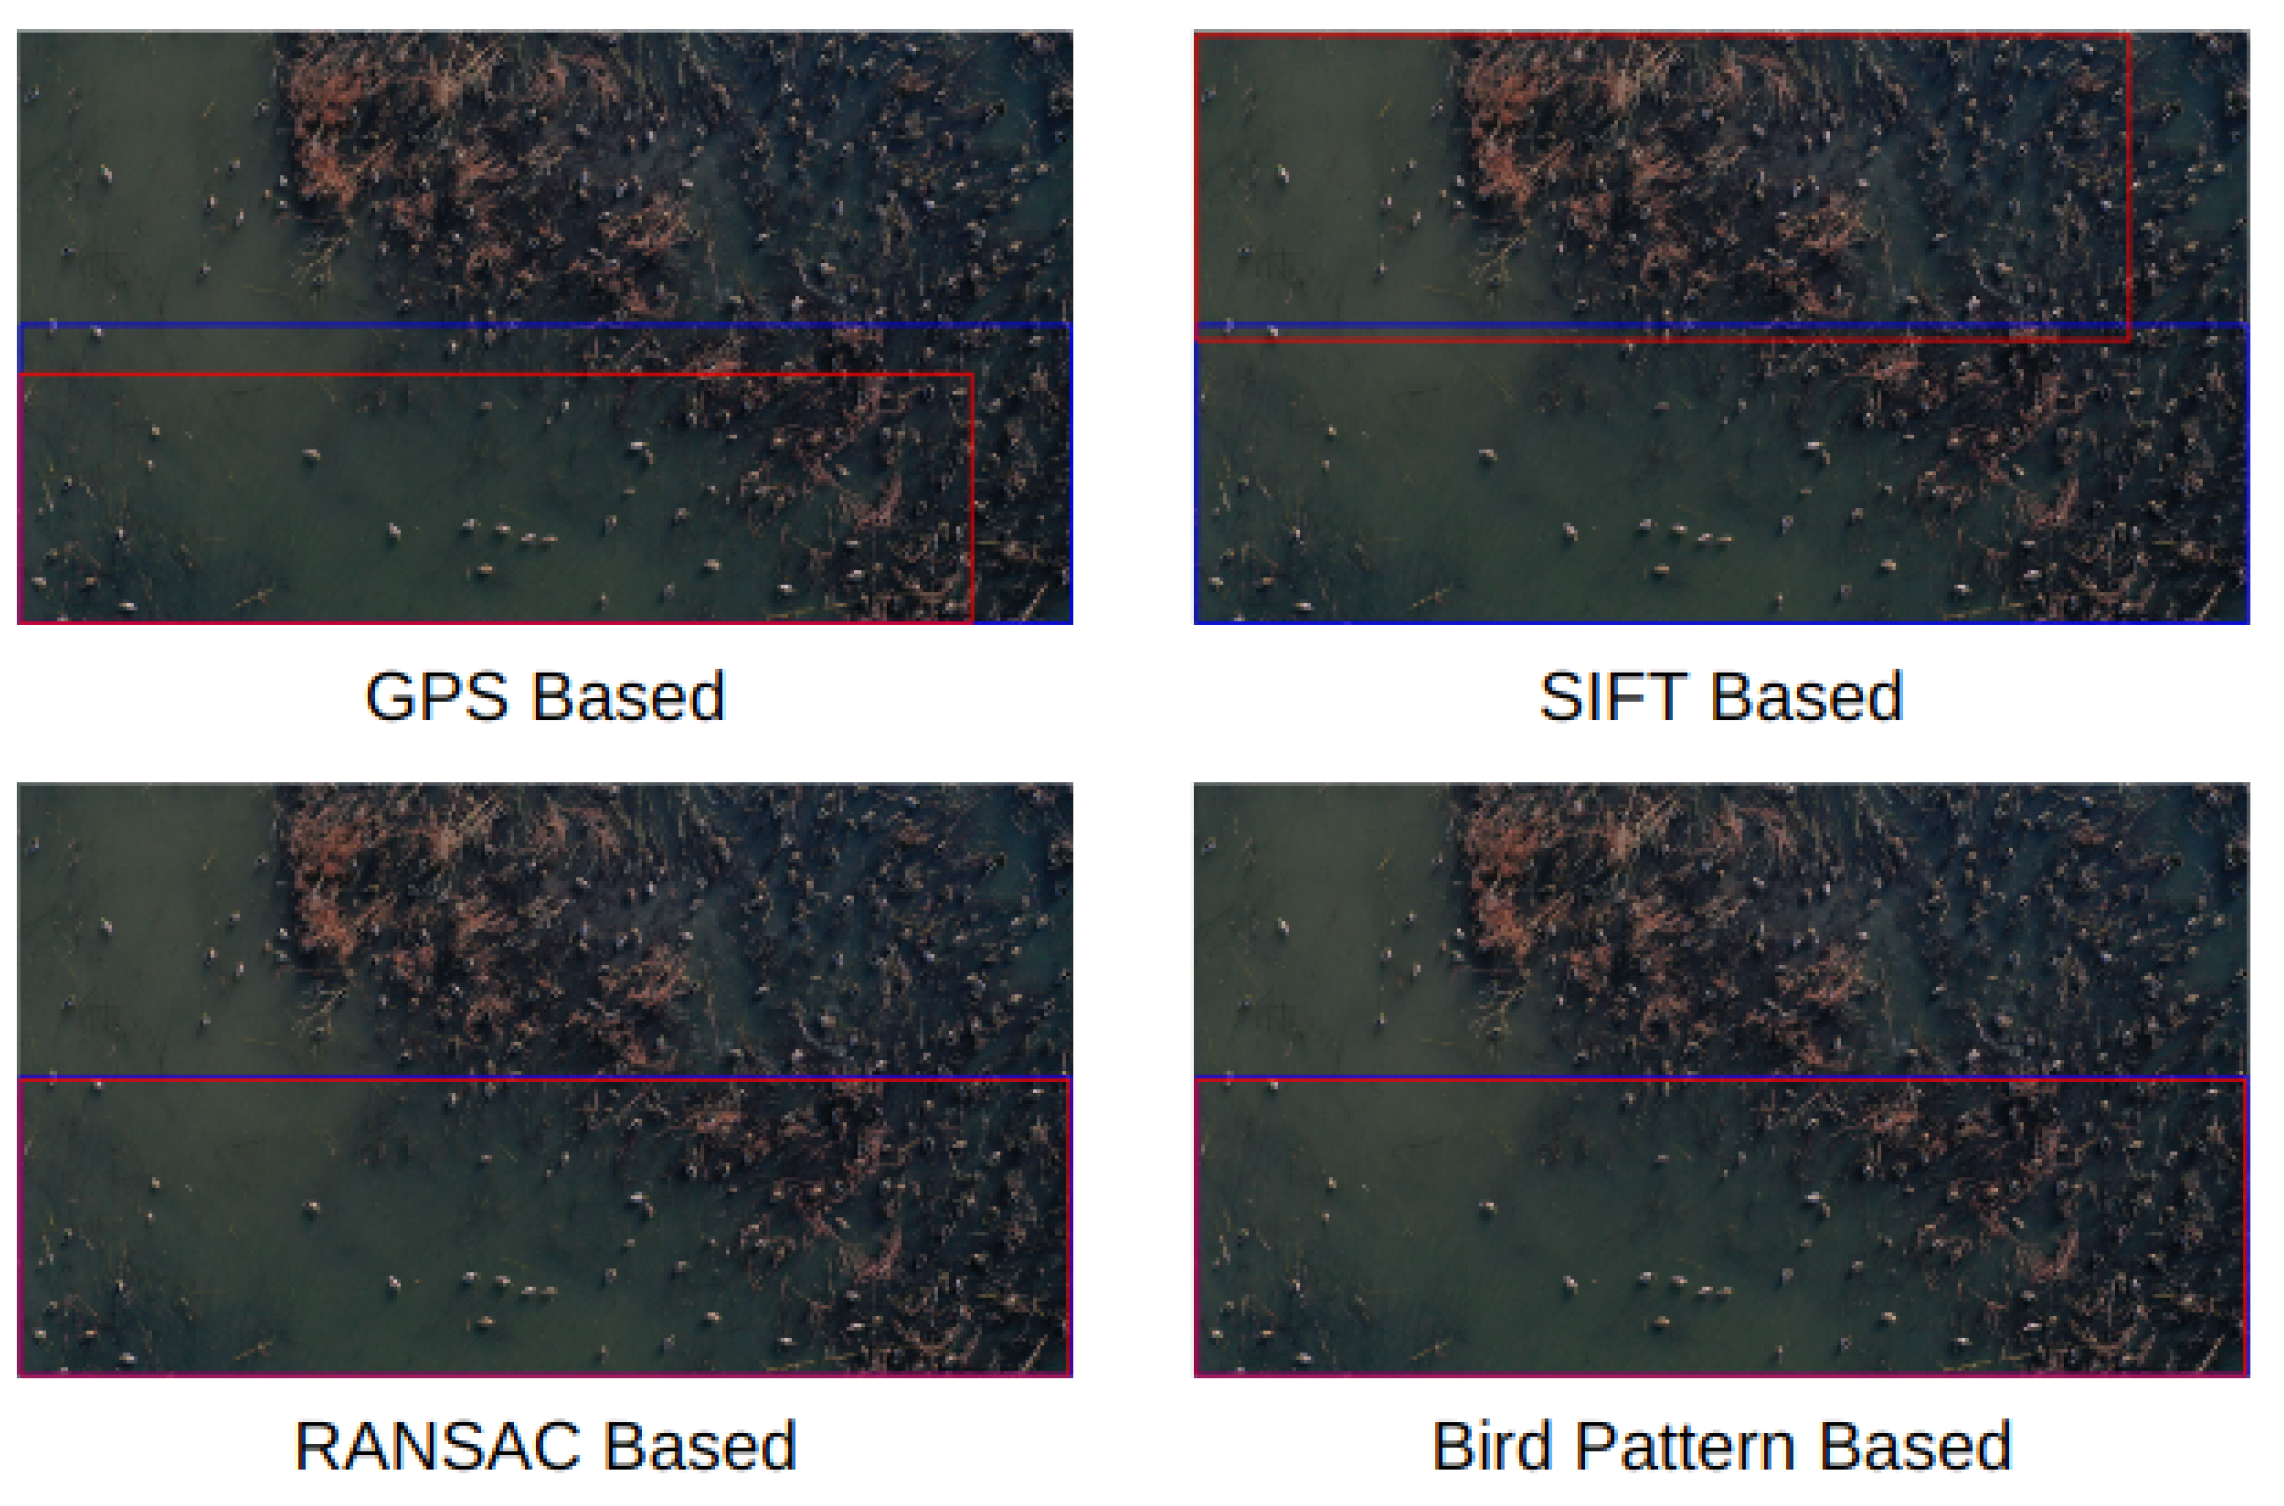
Overlap Detection: To avoid double-counting birds or habitats in overlapping drone images, we developed four detection methods: a GPS-based method, a SIFT-based method, a RANSAC-based method, and a bird-location-based method. All four methods are built into our system, and users can choose which one to apply depending on their needs and image conditions.
Report Generation: Finally, we use OpenAI’s GPT-4o model to generate readable summaries of each drone flight. These reports include bird counts, habitat distributions, and flight metadata, helping both scientists and decision-makers understand the survey results.
4.1. Waterfowl Detection and Counting
We have adapted several state-of-the-art deep learning models for object detection in images to waterfowl detection in aerial images [
8]. Any of the bird detectors can be used in the proposed system. In our experiments, we used a generic bird detector trained using all bird images in our dataset, regardless of drone altitudes, habitat, and light conditions.
In this study, we evaluated three state-of-the-art object detection models for waterfowl detection: YOLOv5, RetinaNet, and Faster R-CNN. These models represent two primary categories of detectors: one-stage detectors (YOLOv5 and RetinaNet) and two-stage detectors (Faster R-CNN). YOLOv5 was selected for its fast inference speed and strong performance in general object detection tasks, while RetinaNet offers a good balance between speed and accuracy with its use of focal loss to address class imbalance. Faster R-CNN, a well-established two-stage detector, is known for high detection accuracy, particularly in complex scenes with small and overlapping objects. All three models were trained and evaluated on our aerial waterfowl datasets under various conditions, including different altitudes, habitats, and lighting scenarios [
8]. While YOLOv5 achieved the best overall accuracy across all datasets (mAP50 = 87.07%), Faster R-CNN achieved a comparable average mAP50 of 86.57% and consistently performed better in challenging scenarios, such as densely vegetated habitats (e.g., standing corn) and cloudy conditions, where YOLOv5’s performance dropped significantly [
8]. Additionally, Faster R-CNN exhibited more stable detection performance across varying drone altitudes (e.g., 90 m) and produced fewer false positives in cluttered scenes. This detection module directly builds upon prior work by Zhang et al. [
8], which systematically compared these models for waterfowl detection. Considering their findings alongside our domain-specific evaluations, Faster R-CNN was selected as the backbone for the proposed detection system due to its robustness and superior generalization across diverse ecological settings.
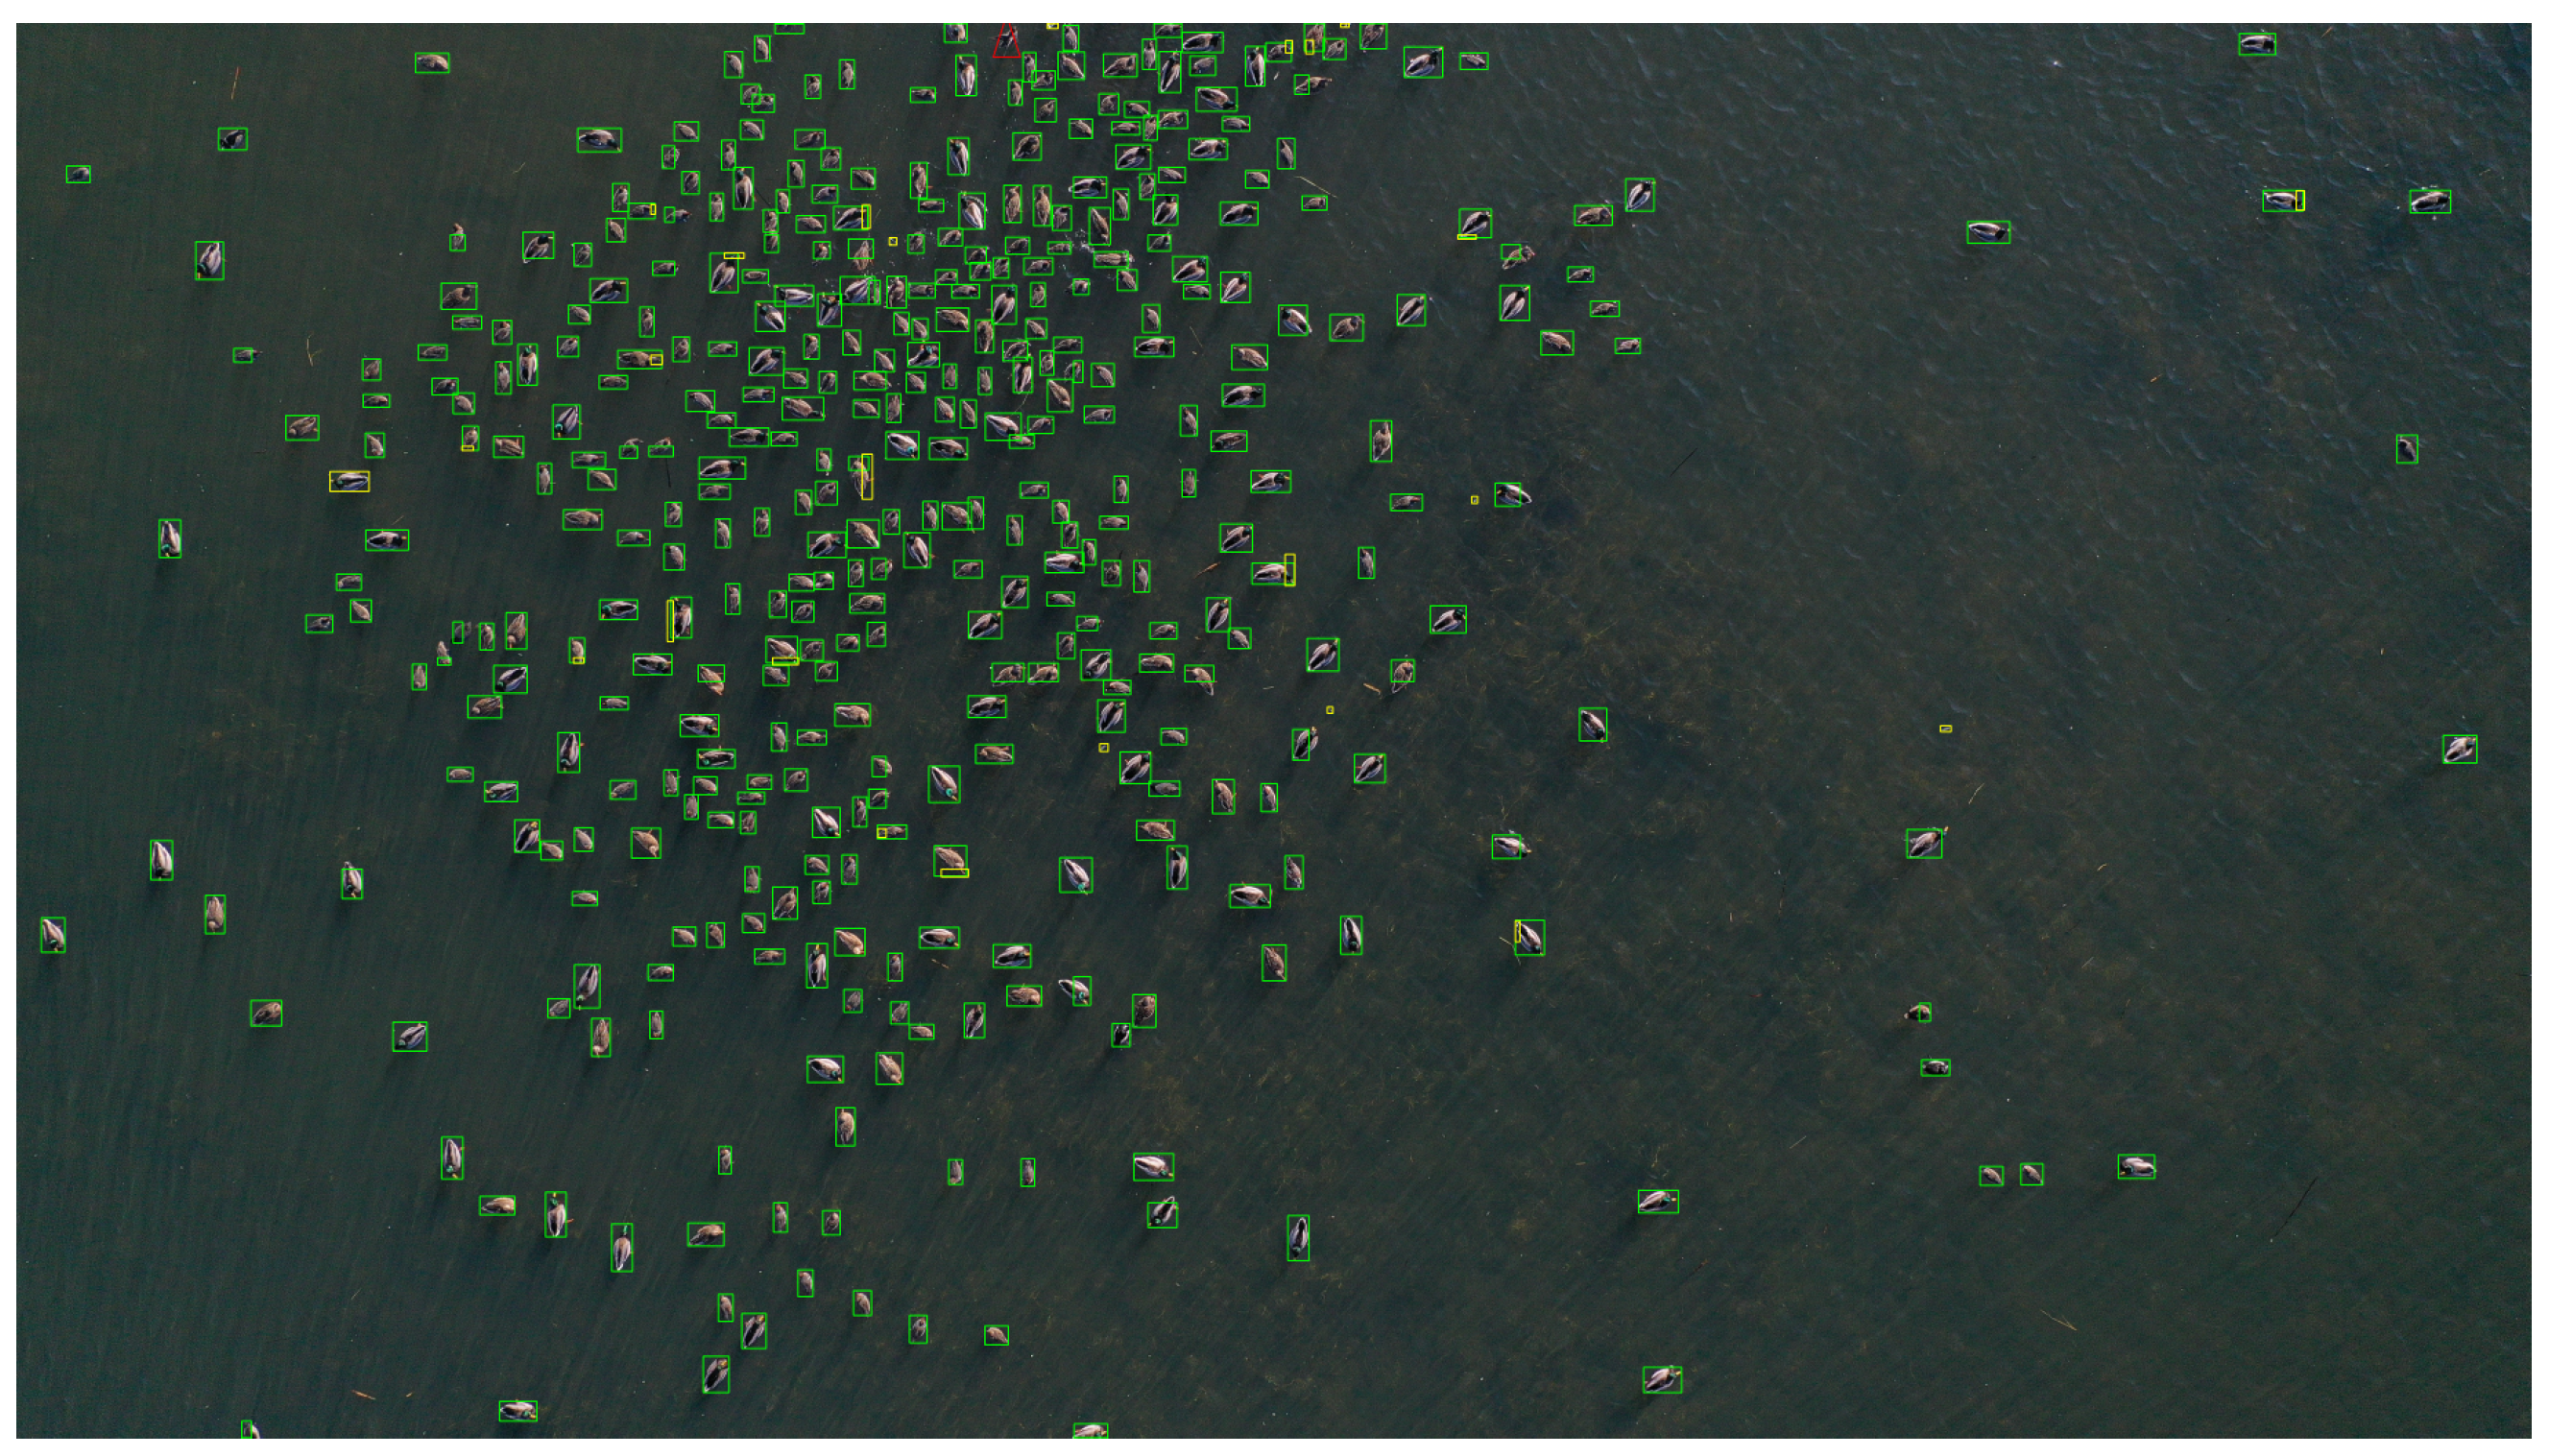
Figure 5 shows an example of detection results.
To adapt Faster R-CNN for bird detection, we made the following modifications:
We initialized Faster R-CNN with weights pretrained on the COCO dataset and further fine-tuned it on our domain-specific dataset to improve detection accuracy on small aerial objects.
The model was fine-tuned using our manually labeled dataset, where birds were annotated with bounding boxes. The training set included diverse conditions (altitudes, lighting variations, occlusions) to improve generalization.
Since birds in aerial images appear as small objects, we adjusted the anchor box sizes to better match the scale of birds observed in our dataset. This modification helped in reducing missed detections, especially for smaller birds.
4.2. Habitat Segmentation and Classification
4.2.1. Deep Learning Models for Semantic Segmentation
Using our real-world dataset, we trained a SegNet model to classify habitats. SegNet is a deep learning architecture designed for semantic image segmentation. This model predicts the class of each pixel in an image, providing a detailed interpretation of the scene. Different from image classification models, which typically assign a single label to an entire image, SegNet enables pixel-wise labeling.
Figure 6 shows an example of the segmentation result of our SegNet model.
4.2.2. A New SAM-Based Method Combining SAM and Classification Models
We propose a new method for habitat segmentation and classification that combines SAM [
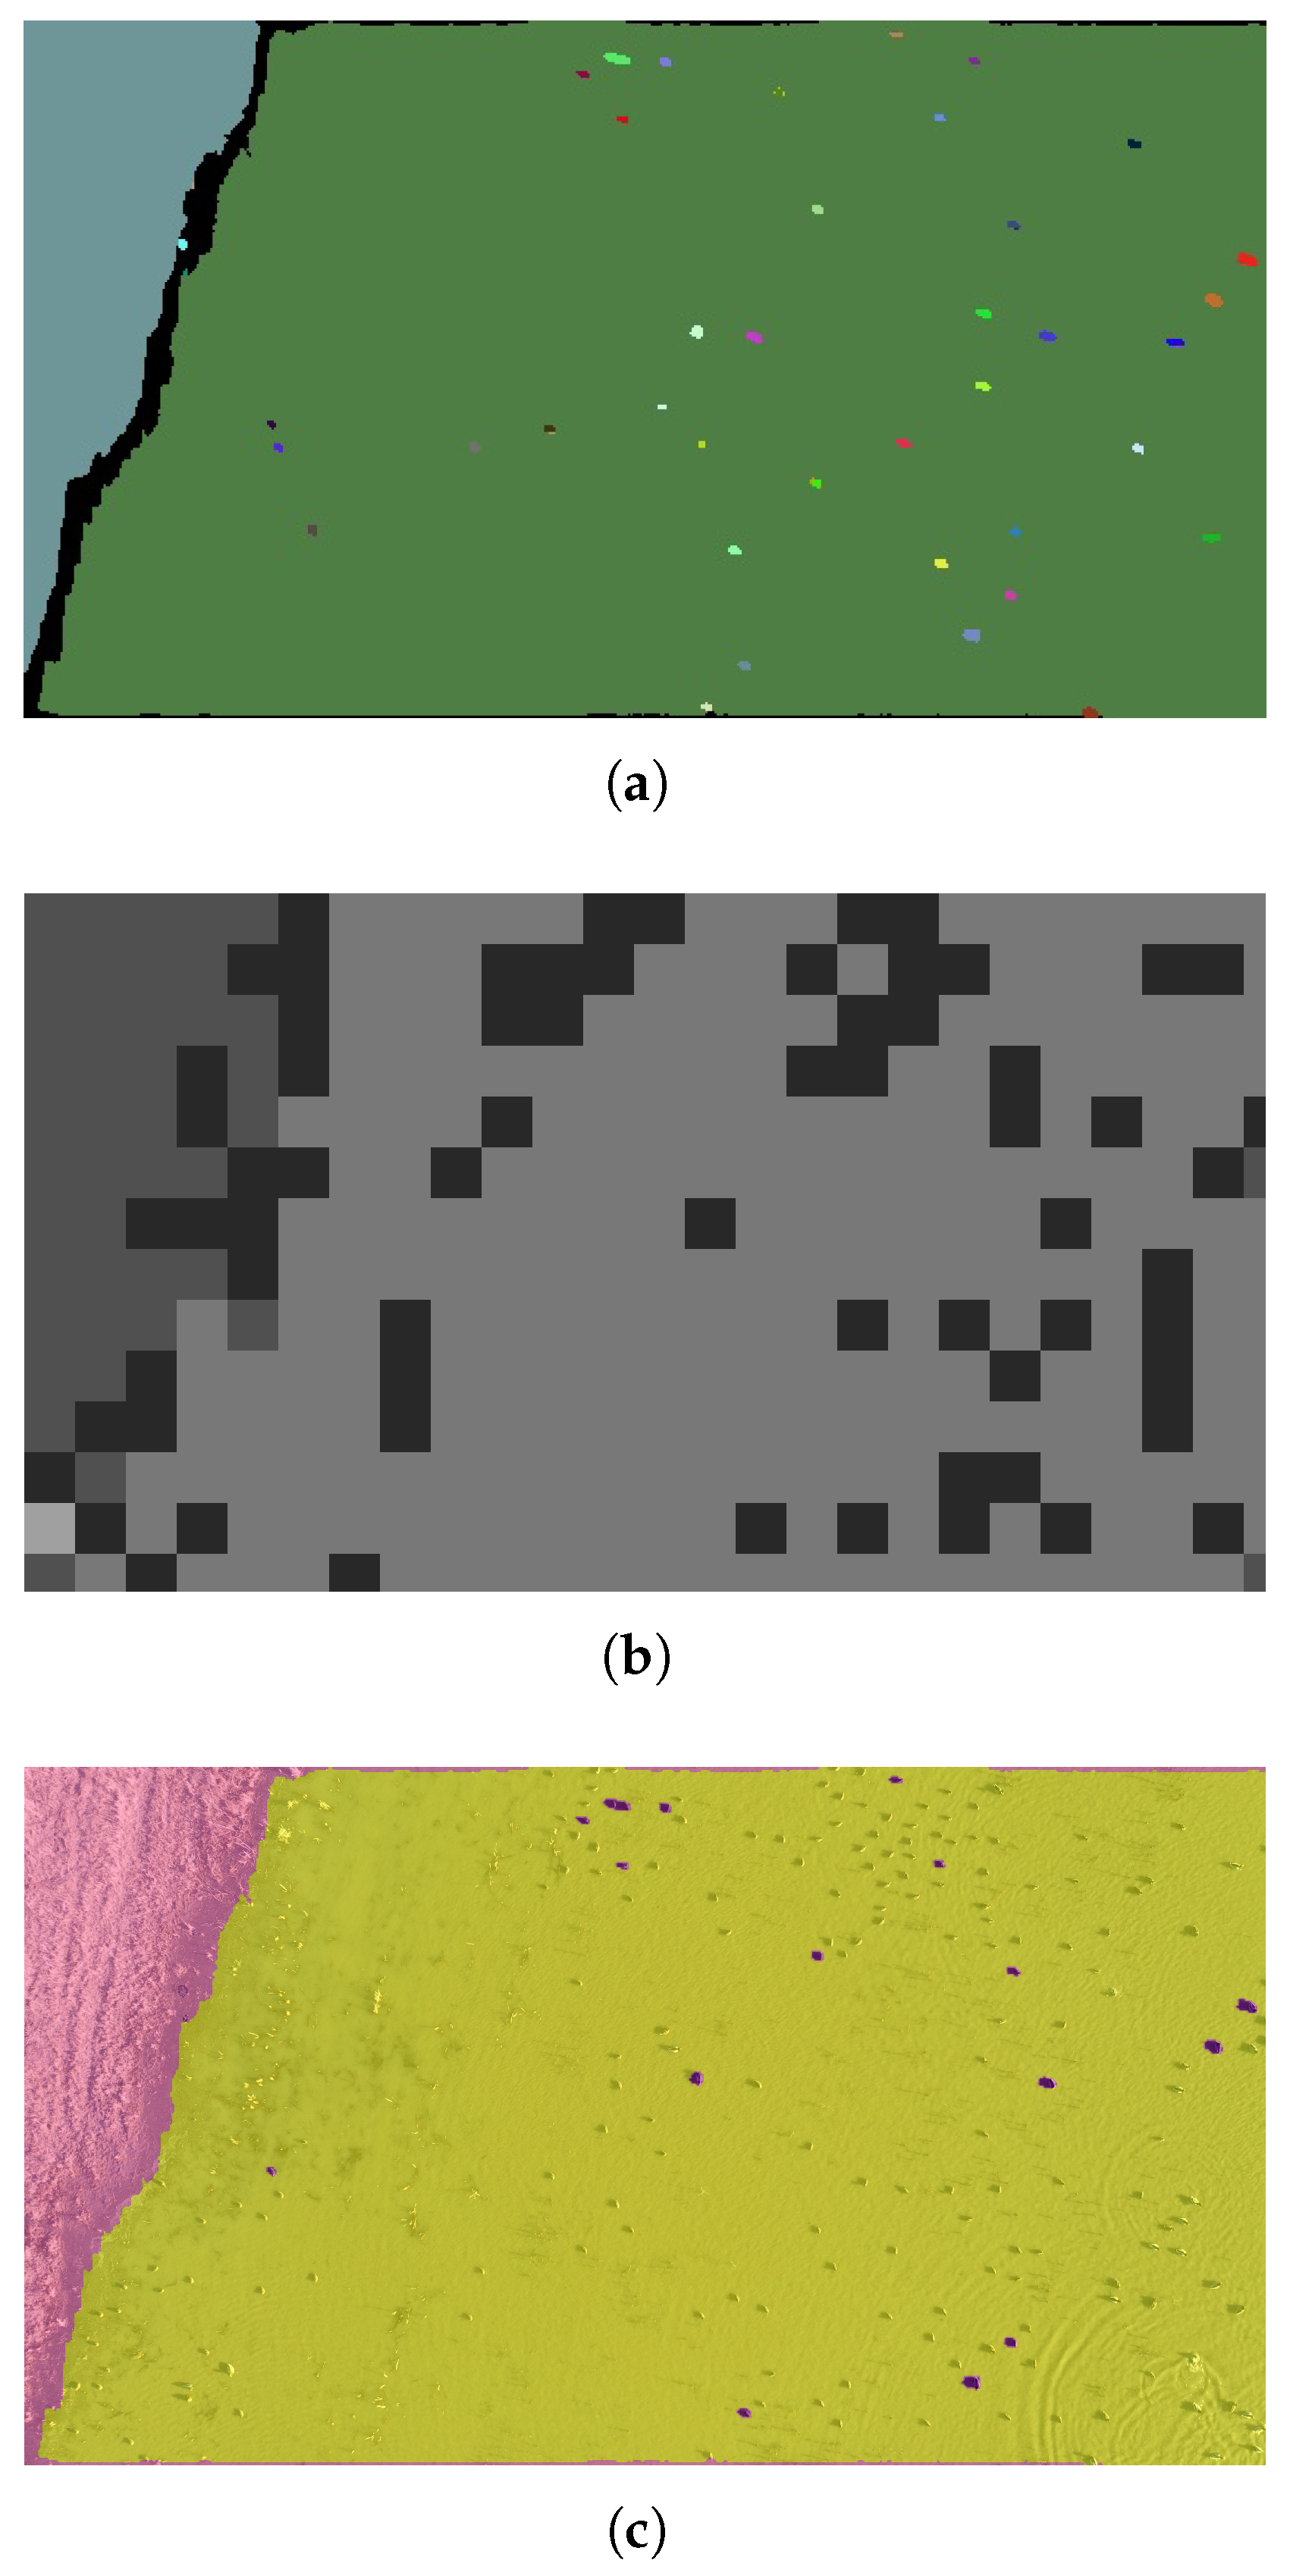
17] with deep learning-based habitat classification models. SAM generates pixel-by-pixel masks, delineating various regions within an image. Each region is then classified using our customized habitat classifiers based on deep learning models. The proposed method consists of the following three steps.
Downscale the original aerial image by a factor of F (e.g., 10) in both height and width dimensions. Then, run SAM on the image to obtain its segmentation output.
Figure 7a shows an example output of SAM. The image displays an overlay of the segmentation masks generated by SAM over the original image. Different colored masks indicate distinct segmented areas identified in the SAM segmentation results. In our experiments, we found that SAM did not perform well on high resolution aerial images and unnecessarily generated too many small segments. Thus, downscaling the original high-resolution aerial image led to better habitat segmentation results by SAM.
Divide the original image into non-overlapping small image crops (e.g., 224 × 224 pixel crops) and predict the habitat classes of these crops using a habitat classifier. We trained several representative deep learning models for image classification, including ResNet [
29], EfficientNet [
30], and VGG [
31] for habitat classification. We started with these models with ImageNet pretrained weights and finetuned them using our habitat dataset of six habitat categories. In experiments on our habitat dataset, ResNet50, EfficientNetB0, and VGG16 achieved accuracies of 85.05%, 82.73%, and 82.49%, respectively. ResNet50 performed the best and was selected as the classifier in our end-to-end image analysis system. In inference, given an original aerial image, we first divide it into 224 × 224 pixel image crops and then predict the habitat class of each image crop. All pixels in each image crop have the same habitat class.
Figure 7b shows an example of the classification result on an aerial image. The image is shown in greyscale, where varying pixel intensity values correspond to different habitat categories. Additionally, all pixels within the same 224 × 224 pixel image crop share the same intensity value, i.e., the same habitat category.
Once the image is segmented using the Segment Anything Model (SAM), each segment needs to be classified into one of the six habitat categories. To achieve this, we combine segmentation results with classification predictions as follows:
Each SAM-generated segment is mapped onto the original image.
Using a grid-based classification approach, the original image is divided into small patches (e.g., 224 × 224 pixels), and each patch is classified using a fine-tuned ResNet50 habitat classifier trained on our dataset.
For each segment, we assign it the most frequent class label found within its area using a majority voting approach. That is, the class occurring most frequently in the overlapping classified patches is selected as the final label for the segment.
This approach ensures that segmentation boundaries from SAM align with the classification outputs, leading to more accurate habitat classification results than using either method alone.
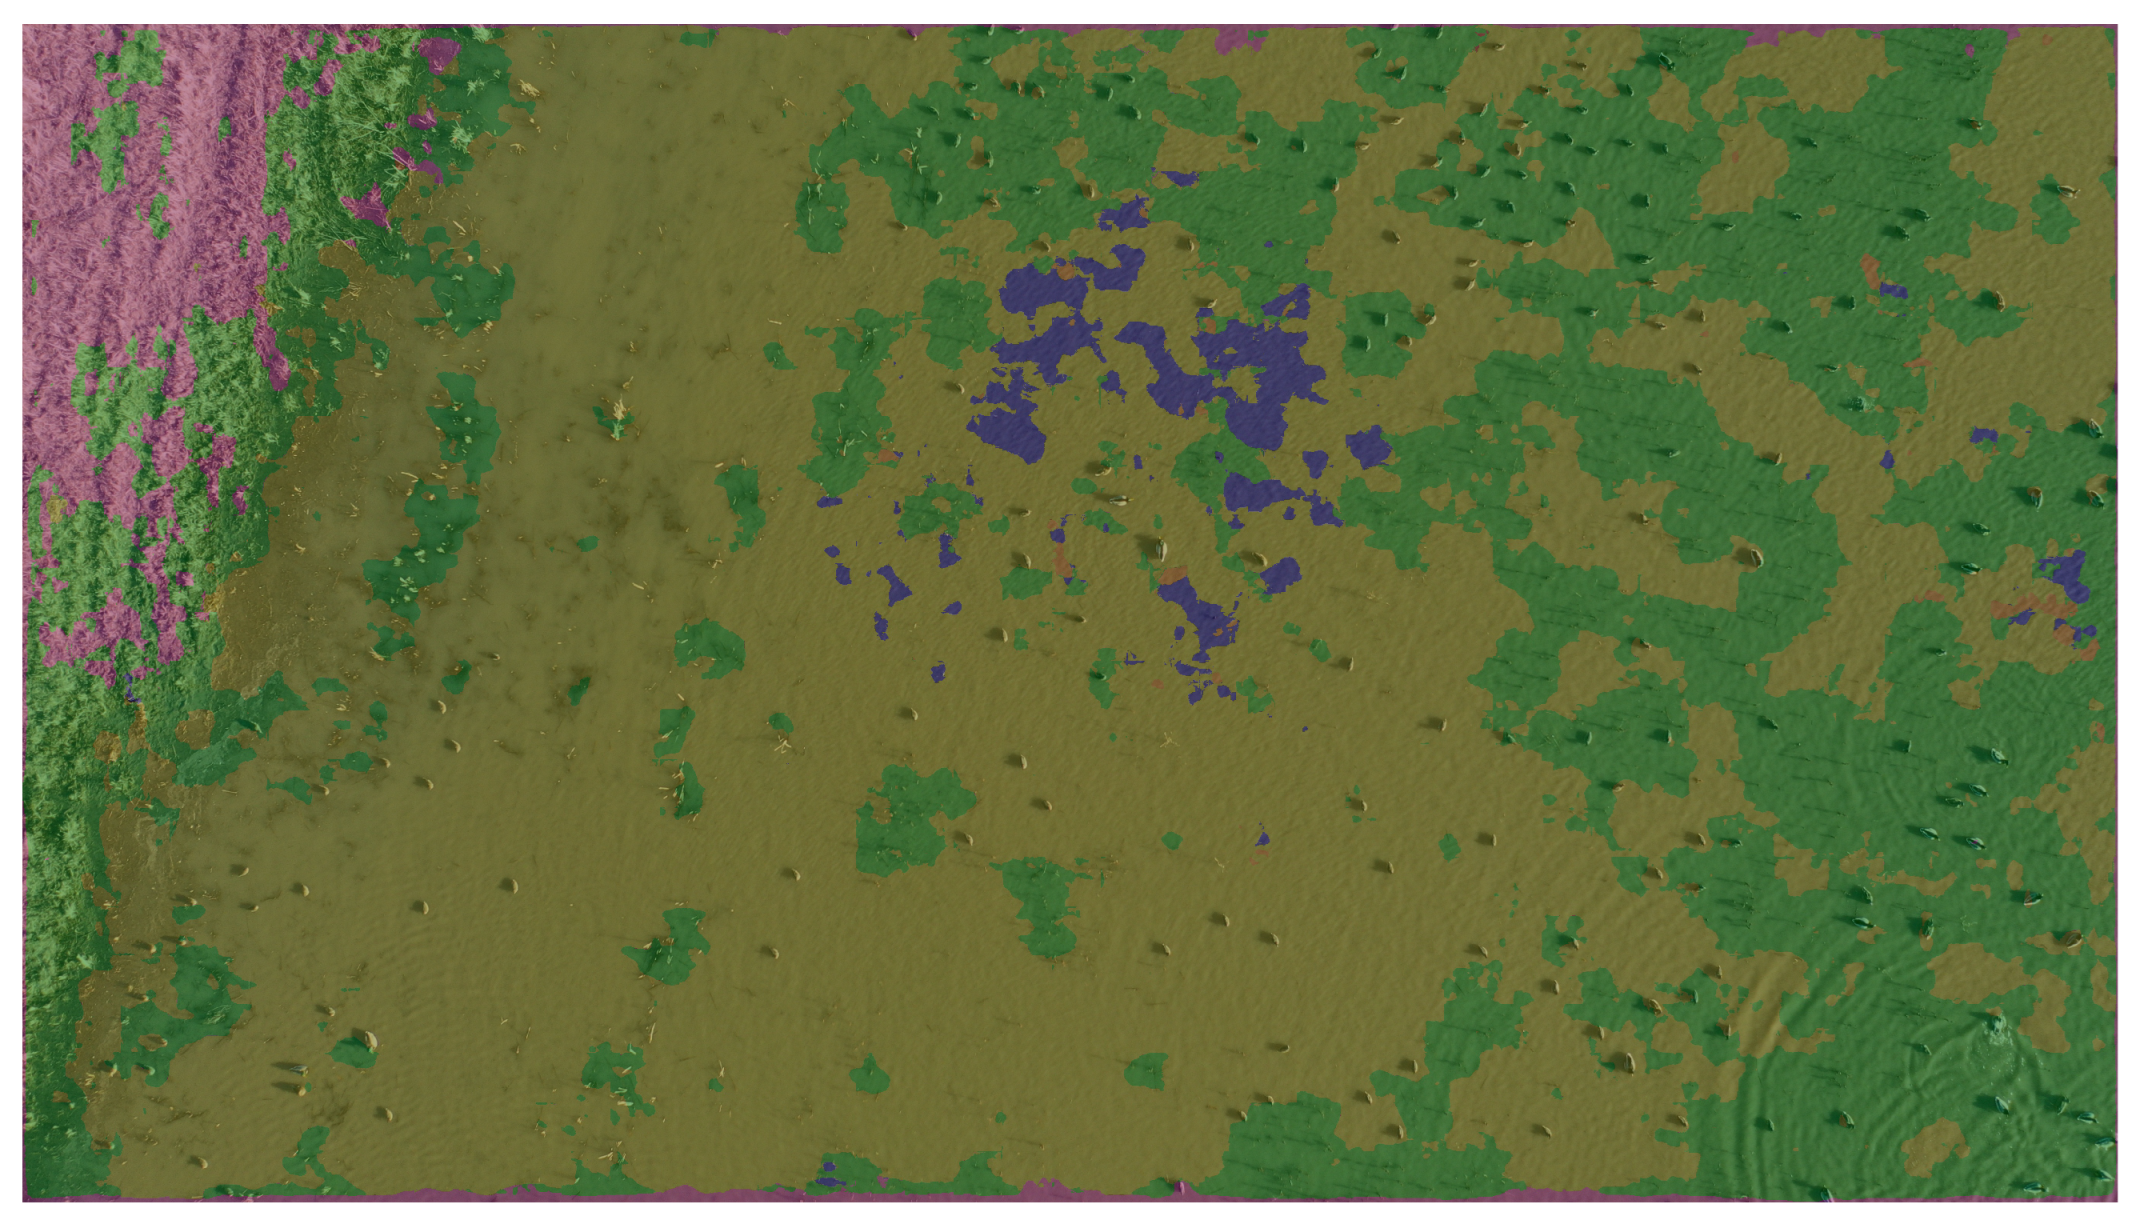
Figure 7c shows an example of habitat prediction result of this SAM-based segmentation and classification method on an aerial image. The image overlays color masks onto the original image, with each color representing a different habitat class. The two primary areas in the original, open water and herbaceous, are well segmented by the proposed segmentation model.
4.3. Detection of Overlap Region Between Sequential Images
To avoid double-counting of birds and habitats in overlapping regions of consecutive aerial images, we propose four methods for estimating the overlapping region between consecutive images. All four methods are built into our system, and users can choose which one to apply depending on their needs and image conditions.
4.3.1. GPS-Based Method
The GPS-based method employs a geometric approach, using GPS coordinates and drone camera information to estimate image overlaps. From the metadata of aerial images, we obtain information on GPS location, altitude, flight direction, camera properties, and time, among other details. Assuming the drone camera is oriented straight downward, we can calculate the physical distance between consecutive images. Furthermore, we can determine the land surface area covered by each image.
Using a drone camera’s focal length, make, and model, we can determine the Ground Sampling Distance (GSD) of an image and the ground distance from the image center to its edges. The GSD formula is
S is the camera’s sensor width.
F is the camera’s focal length.
H is the height of the camera from the ground.
w is the width of the taken image in pixels.
Utilizing both GPS coordinates and Ground Sampling Distance (GSD), we can calculate the distance between the centers of consecutive images and the distances from the center of each image to its edges.
Under the assumption that the drone maintains a constant altitude during its flight and moving forward in the direction of the short edges of the aerial images, the overlapping area of two consecutive images is a rectangle. The width of this rectangle is the difference between the distance from the center of one image to its edge and the distance between the centers of consecutive images, while its length is the long edge of an image.
This method is simple and fast, but not very accurate. It assumes fixed and known camera orientation throughout the flight and the formulas are subject to variations and noises of flight and camera parameters.
4.3.2. SIFT-Based Method
The SIFT-based method uses the well-known Scale-Invariant Feature Transform (SIFT) [
32] algorithm to estimate the overlap region between a pair of images. SIFT is a prominent feature matching method in computer vision, designed to detect and align local features. For an image sequence
, we use SIFT as a module to detect the overlap region:
where
are key point locations in image
, and
is the feature descriptor of keypoint
i in image
. Using matched descriptors from adjacent images, a homography transformation
can be estimated, mapping corresponding keypoints from image
to image
:
The overlap area between consecutive images is then determined by applying the homography
to the boundary coordinates of
, calculating the intersection area with
:
Thus, we use the SIFT algorithm to detect the overlapArea of the sequence
.
4.3.3. RANSAC-Based Method
The RANSAC-based method is similar to the SIFT method but utilizes RANSAC to refine the results obtained by SIFT [
33]. Initially, SIFT extracts and matches keypoints between two images. These matched points serve as input to RANSAC, which robustly estimates a homography transformation by iteratively sampling subsets of keypoints, and selecting the best-fitting homography by maximizing inliers:
Once the homography
is obtained, the refined overlap region between images
and
is computed by
Similar to what we carried out in SIFT, we detect the overlapArea of the sequence
via RANSAC algorithm.
4.3.4. Bird-Location-Based Method
In this method, the identification of overlapping regions is based on the spatial distribution of detected birds. Given a pair of downscaled images of width W and height H and bird detection results from the previous step in the pipeline, the bird positions in each image form its bird mask, and . Then, assuming the flight direction is from to along the vertical direction, we search along the vertical direction by increasingly shifting the top of onto the bottom of , with an increment of one pixel in each iteration.
Finally, we identify the iteration K that gives the maximal matching between the bird distribution pattern in a top region of and those in the corresponding bottom region of . A bird position in one mask is considered matched with a bird position in another mask if their distance is within a predefined threshold.
The maximal matching is determined based on two conditions: (1) average distance between all pairs of matched bird positions, and (2) relative ratio of bird location match number over the average of number of bird locations in the two masks. The relative ratio is used to avoid situations where a region of a mask has few birds, while the corresponding region of the other mask has many birds, and although the number of bird location matches could be large, it is not a good match. This is the intersection over union idea.The overlap region is outputted as a rectangle with width W and height K.
The pseudocode of the bird-location-based method is shown in Algorithm 1. The parameters and symbols in the pseudocode are defined below.
—matching distance threshold, e.g., 3.
—ratio between match number and total bird number threshold, e.g., 0.8.
H, W—height and width of and .
, —number of bird positions found from candidate areas of and during shifting. Both are initialized to 0.
, —total birds number of and .
[,2], [,2]—matrix initialized to 0 used to record the bird position.
N—number of matched bird positions, initially set to 0.
R—ratio of bird location match number over the average number of bird locations, initially set to 0.
—average distance between all pairs of matched bird positions.
—minimum average distance between all pairs of matched bird positions during shifting.
d[, , 2]—matrix initialized to 0 used to record the vertical and horizontal distance between bird positions.
, —perceptual hashes of candidate area of and .
—Hamming distance between and .
—minimum perceptual hash distance during shifting.
| Algorithm 1 Bird-Location-Based Overlap Detector |
Input: : Consecutive aerial images of size : Binary masks indicating bird locations in and Output: K: Row index indicating the overlapping region found, Initialize , , , , for to do for to do if then end if end for for to do if then end if end for if and then end if end for if
then return K else for to do if then end if end for return K end if
|
The time complexity of the algorithm is . To optimize the algorithm’s performance, we use a distance matrix, d[, , 2], which records the horizontal and vertical distances between bird positions from and . Here, and represent the total number of birds in and , respectively. During each iteration of the search process, the matrix is incrementally updated by 1. That approach simplifies the process of calculating the distance between the bird positions found at previous iterations during shifting. Additionally, we maintain [,2] and [,2] to store the bird positions encountered throughout the search process. Leveraging these matrices enables efficient distance calculations for new bird positions found at current iteration using fast array subtraction operations provided by the NumPy library of Python (Python 3.8.18, NumPy 1.23.5).
When
and
contain few or no birds, the output of the method may be no overlap. For this case, we perform a vertical search by incrementally shifting the top of
over the bottom of
. For each shift, we calculate the Hamming distance between the perceptual hashes [
34] of the two candidate regions. The pair of regions with the lowest perceptual hash distance is outputted as the overlap area. The bird-location-based method is fast, accurate, and robust. It can achieve high accuracy even when there are some moving birds in the images.
Figure 8 shows examples of the results of the four overlap detection methods presented in this section on an image in our dataset. The overlap regions are rectangles, where the red ones are predictions by the proposed methods and the blue ones are the ground truth.
4.4. Using ChatGPT to Generate Flight Report
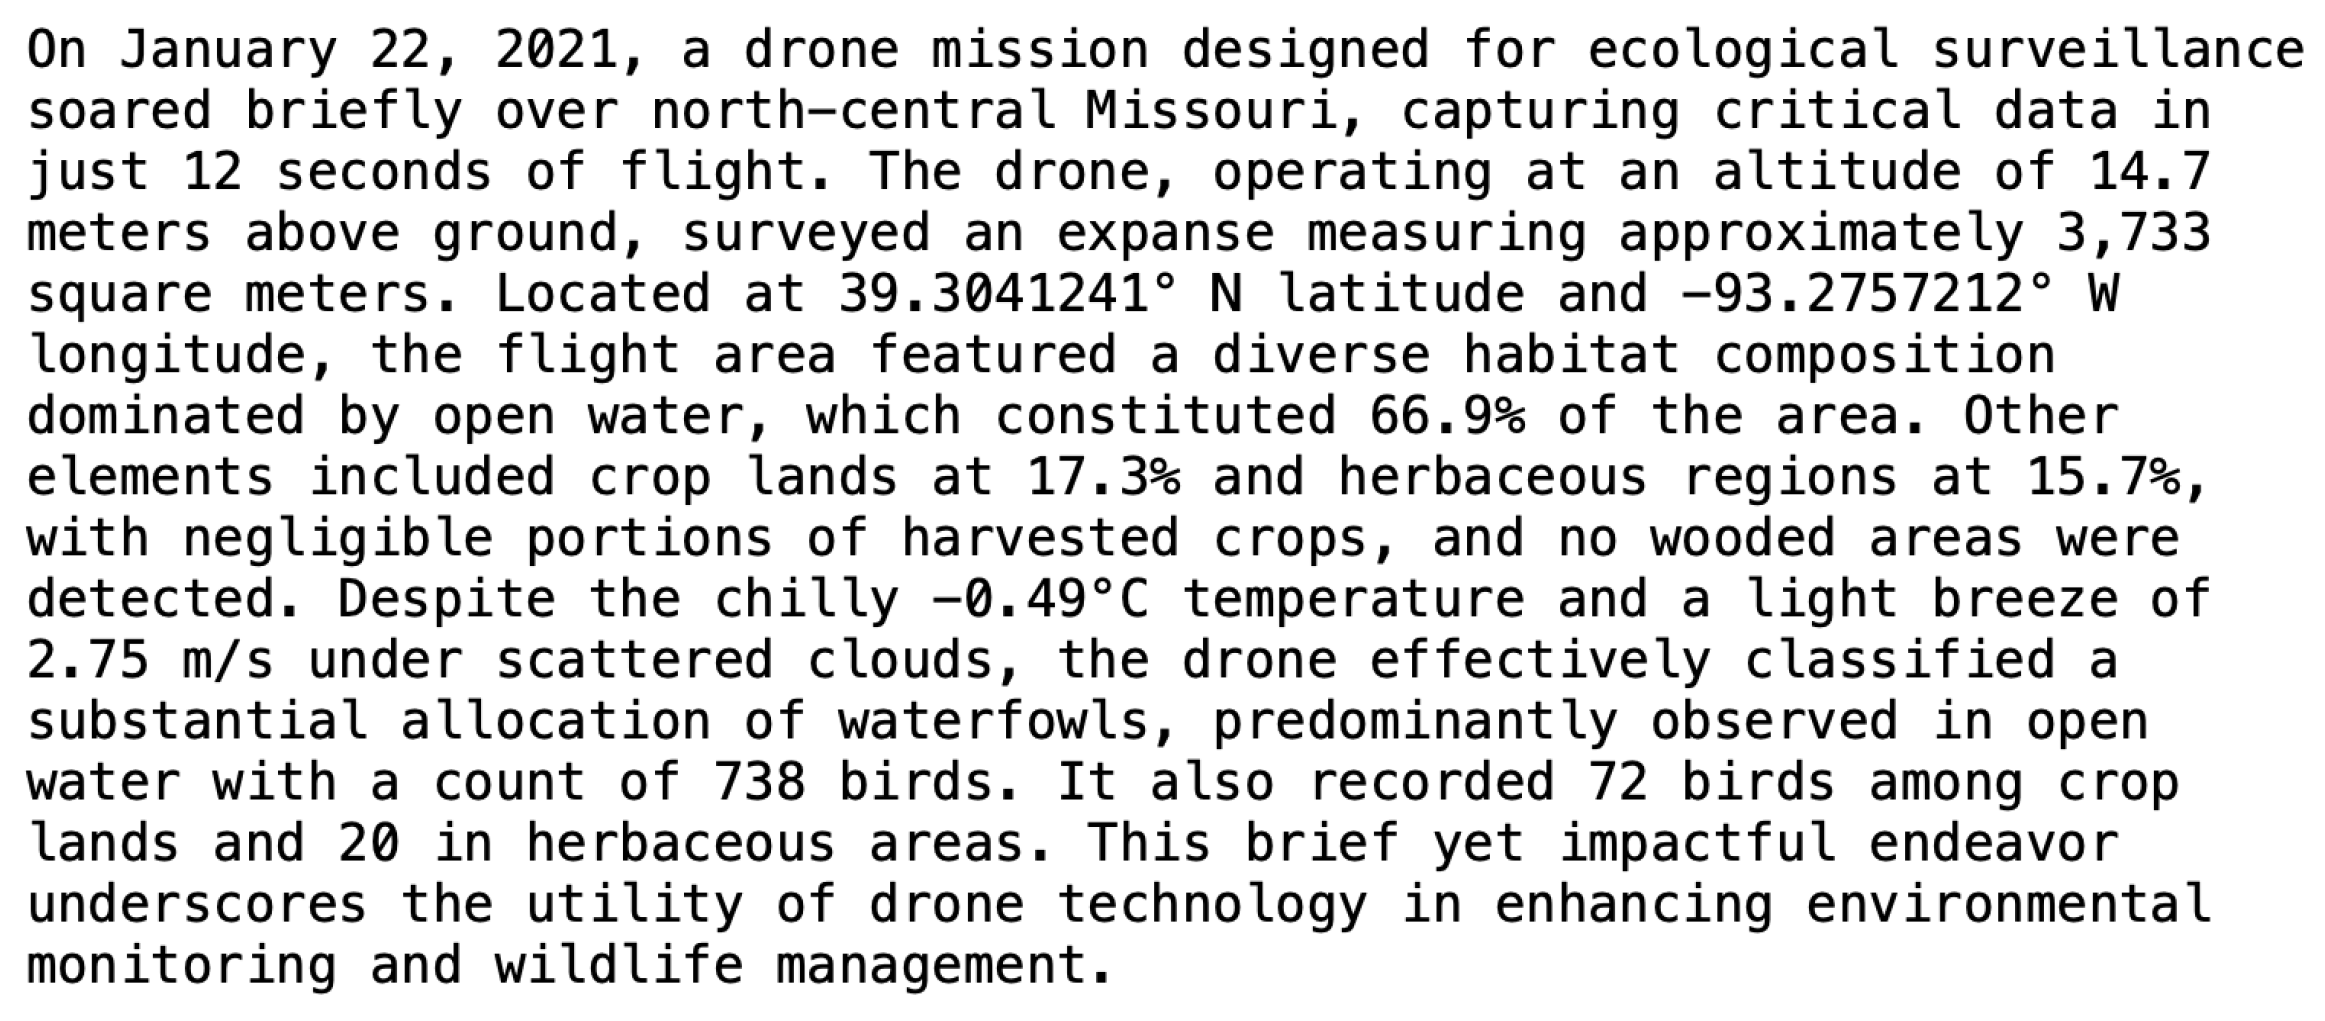
The last phase of our system is to use ChatGPT-4o, an OpenAI conversational assistant powered by the GPT-4o model to generate an informative and comprehensive report detailing the results of the drone flight. This report consolidates various flight information and waterfowl and habitat detection results, including the count and locations of birds within images, classifications of different habitat regions, distributions of waterfowl across different habitats, the total area surveyed as calculated using Ground Sampling Distance (GSD), the proportional area occupied by each habitat class, etc. Flight information include metadata from the images, such as date, start time and duration of the flight, GPS coordinates of the flight’s commencement and conclusion, flight altitude, etc. Moreover, using flight date, time, and GPS coordinates, we acquired weather-related data pertinent to the time of the flight via the OpenWeatherMap API. While conventional report generation methods could be used, GPT-4o enables dynamic summarization, flexible formatting, and accessibility improvements by converting complex detection results into human-readable text, catering to both technical and non-technical audiences.
We experimented with various prompts when using GPT-4o to generate a flight report and came up with some data template and prompts that works well. The prompts range from generating a brief summary or a detailed scientific report in typical technical report format. In our system, we first populate a predefined text template using flight information and waterfowl and habitat detection results. The prompt and template are then sent to GPT-4o model using an API call via the openai Python package (Python 3.8.18, openai 1.9.0). The model responds with a narrative paragraph, which is saved to a text file in the results directory. To minimize hallucination and ensure accuracy, we structured input data as key–value pairs or predefined templates, ensuring GPT-4o only reformats existing verified results rather than generating new information. Additionally, all generated reports were cross-checked against the original dataset. This process, implemented as a Python program (Python 3.8.18), is fully automated and is triggered at the end of the pipeline, requiring an internet connection only for the API call. The process is adaptable to other ecological contexts by modifying the input prompt template or including additional output fields.
Figure 9 shows an example of a brief report generated by GPT-4o. The primary motivation for integrating GPT-4o into our system is to facilitate automated and user-friendly reporting of complex ecological data derived from drone imagery analysis. GPT-4o is used strictly to reformat validated quantitative results into human-readable text, without generating new scientific content.
5. Experimental Results
In this section, we present our experimental results of the proposed methods and the whole system using real-world images we collected with a DJI Mavic Pro 2 drone in various Missouri conservation areas. A test set of image sequences was selected that consists of five image sequences captured at a height of 30 m and another five sequences taken at 60 m.
5.1. Habitat Segmentation and Classification Results
In this experiment, we evaluate the performance of our new SAM-based habitat segmentation and classification method. The dataset contains aerial images captured by a DJI Mavic Pro 2 drone at 30 to 60 m altitudes. We manually labeled each aerial image by assigning habitats class labels to grid points in an image. Thus, habitat detection accuracy is the accuracy of classifying test points. There are six habitat classes: herbaceous, open water, harvested crop, wooded, crop, and other. To evaluate the performance of our new SAM-based segmentation followed by the image classification method, we compare the predicted classes of the test points with their class label and calculate the prediction accuracy as the percentage of correctly predicted test points, which is called overall accuracy. We also calculate the F1 score for each class. The formula of F1 score calculation is as follows.
TP represents true positives, the correctly predicted positive cases;
FP represents false positives, the incorrectly predicted positive cases;
FN represents false negatives, the incorrectly predicted negative cases.
Table 1 shows the performance of our new SAM-based habitat detection method on six habitat classes. The classification confusion matrix, F1 scores of each class, and overall classification accuracy are shown. The results in
Table 2 demonstrate the effectiveness of different segmentation models across various habitat classes.
5.2. Results of Overlap Detection Between Consecutive Images
In this experiment, we evaluate the performance of the four methods we proposed for detecting the overlap regions of consecutive images along a drone flight path. The performance metric is normalized error in % between the ground truth overlapping rectangle in the vertical dimensions in pixel values and the predicted overlapping rectangle, normalized by images’ height. In other words, the error is the relative deviation in the vertical dimension between the ground truth and predicted overlap rectangles because the sequence of images captured by the drone is taken in the vertical direction.
Table 3 and
Table 4 show the prediction errors of the four overlap detection methods applied to test image sequences taken at 30 m and 60 m heights, respectively. The tables also compare the computational speeds of the four methods in terms of their average execution times.
5.3. Flight Report Generation Result
In our system, we use flight information extracted from image metadata and waterfowl and habitat detection results to populate predefined text templates. We tried two kinds of templates: one is key–value pairs, where the keys are the names of relevant statistics or factors, and the other is a manually designed template based on a basic simple flight report with blanks for filling in information or numbers. OpenAI’s GPT-4o can use both types of templates as input to generate reports of different styles quite well. Across the test set, the average generated report length was 179 words, and the generation time was 5.89 s per report on average. Manual inspection indicated that about 100% of the reports were fully accurate and required no manual editing.
6. Discussion
In this section, we discuss the key findings of the experiments.
6.1. Habitat Segmentation and Classification
According to
Table 1, the proposed SAM-based method accurately predicted five out of the six classes, particularly excelling in the “wooded”, “other”, and “crop” classes with F1 scores over 95%. On the other hand, the method did not perform well on the “harvested crop” class, mainly due to the visual similarities and proximity of harvested crop areas to open water with plantations and herbaceous regions in the images.
Table 2 shows that the SAM-based method achieves the highest average F1 score (81.8%) and overall accuracy (85.1%), outperforming UNet, FCN, and PSPNet in most habitat types. Notably, it excels in “open water” (92.1%) and “wooded” (87.0%), while FCN performs best in “herbaceous“ (90.5%) and “harvested crop” (30.0%). Although all models achieve 100% F1 score in the “other” class, their performance varies significantly in other habitat classes. These results highlight the robustness of the SAM-based method, particularly in complex environments, making it a strong candidate for habitat segmentation tasks.
The superior performance of our SAM-based segmentation method can be attributed to several key factors. First, the Segment Anything Model is pretrained on a very large and diverse open-world dataset [
17], which provides it with strong generalization capabilities across heterogeneous and complex habitat types, unlike traditional models such as UNet [
35] and FCN [
36] that rely on supervised learning on more limited datasets. Second, the Transformer-based architecture of SAM enables it to capture long-range dependencies and global contextual information [
17], which is particularly advantageous for segmenting large and variable habitat structures commonly observed in drone imagery. Our findings are consistent with prior studies showing that deep learning-based segmentation models outperform traditional machine learning approaches for habitat classification tasks [
16,
21,
23,
37].
6.2. Overlap Detection Between Consecutive Images
As shown in
Table 3, for the 30 m test cases, the bird-location-based method outperformed the other methods significantly overall, obtaining the best results in four of five cases. The low accuracy of the GPS-based method is due to inaccuracies in the height, latitude, and longitude information extracted from the raw images. SIFT and RANSAC methods rely on matching keypoints, which can sometimes be difficult in natural environments where different keypoints are very similar, which leads to wrong matches.
As shown in
Table 4, for the 60 m test cases, the RANSAC-based method and bird-location-based method are excellent, achieving almost perfect results with less than 1% errors in all cases. Notably, the RANSAC- and SIFT-based methods performed significantly better on 60 m image sequences than 30 m ones. This is due to the increased overlap of consecutive images in the image sequences captured at 60 m as compared to those at 30 m.
In addition, the GPS- and bird-location-based methods ran very fast, in seconds, whereas the SIFT-based and RANSAC-based methods are much slower, one to two orders of magnitudes slower. This increase in execution time for both the SIFT and RANSAC methods for 60 m images compared to 30 m images is due to the greater complexity and content volume in the images at higher altitude. Overall, the bird-location-based method is the most effective approach considering both speed and accuracy for both 30 m and 60 m situations.
7. Conclusions
In this paper, we present an end-to-end automatic system to process a sequence of drone images along a survey flight route that captures waterfowl in their natural habitats and generates an informative and comprehensive flight report. The report incorporates various related information, such as date, time, location, and weather, and waterfowl and habitat detection results, including the count and locations of waterfowl, distributions of waterfowl across different habitats, the total area surveyed, the proportional area occupied by each type of habitat, etc.
Our system integrates deep learning models for bird detection and habitat classification, a new SAM-based segmentation method, a new bird-location-based method for image overlap detection, and ChatGPT for report synthesis. For habitat segmentation, we present a new method combining Segment Anything Model (SAM) and a traditional ResNet50 classifier to improve traditional segmentation models. To detect the overlaps between consecutive images captured along a flight route to prevent double-counting of waterfowl and habitat regions, we present a new bird-location-based method that is fast and accurate, outperforming competing methods significantly. The proposed system has the potential to be extended and adapted for broader ecological survey applications beyond waterfowl monitoring. To promote open science and practical adoption, we will release the trained model and code via a public repository.
Author Contributions
Conceptualization, Y.S.; methodology, Y.S., Z.Z. and Z.L.; software, Z.Z., Y.Z. and A.Z.; validation, Z.L.; formal analysis, Z.Z.; investigation, Z.L. and A.Z.; resources, Y.Z.; data curation, Y.Z. and Z.Z.; writing—original draft preparation, Z.Z.; writing—review and editing, Y.S., Z.L. and Z.Z.; visualization, Z.Z.; supervision, Y.S.; project administration, Y.S.; funding acquisition, Y.S. All authors have read and agreed to the published version of the manuscript.
Funding
This work was supported by grants from the Missouri Department of Conservation and NSF grant CNS-2243619.
Data Availability Statement
The data that support the findings of this study are available from the corresponding author upon reasonable request.
Acknowledgments
The authors would like to thank Reid Viegut and Lisa Webb from the School of Natural Resources, University of Missouri, and Andy Raedeke from the Missouri Department of Conservation for their valuable help and support in this work.
Conflicts of Interest
The authors declare no conflict of interest.
References
- Nichols, J.D.; Reinecke, K.J.; Hines, J.E. Factors Affecting the Distribution of Mallards Wintering in the Mississippi Alluvial Valley; American Ornithological Society: Chicago, IL, USA, 1983. [Google Scholar]
- Pearse, A.; Reinecke, K.; Dinsmore, S.; Kaminski, R. Using simulation to improve wildlife surveys: Wintering mallards in Mississippi, USA. Wildl. Res. 2009, 36, 194–202. [Google Scholar] [CrossRef]
- Reinecke, K.J.; Brown, M.W.; Nassar, J.R. Evaluation of Aerial Transects for Counting Wintering Mallards. J. Wildl. Manag. 1992, 56, 515–525. [Google Scholar] [CrossRef]
- Ryckman, M.D.; Kemink, K.; Felege, C.J.; Darby, B.; Vandeberg, G.S.; Ellis-Felege, S.N. Behavioral responses of blue-winged teal and northern shoveler to unmanned aerial vehicle surveys. PLoS ONE 2022, 17, e0262393. [Google Scholar] [CrossRef]
- Viegut, R.A.; Webb, E.B.; Raedeke, A.H.; Tang, Z.; Zhang, Y.; Shang, Y. Nonbreeding waterfowl behavioral response to crewed and uncrewed aerial surveys on conservation areas in Missouri. J. Southeast. Assoc. Fish Wildl. Agencies 2024, 11, 127–136. [Google Scholar]
- Chabot, D.; Francis, C.M. Computer-automated bird detection and counts in high-resolution aerial images: A review. J. Field Ornithol. 2016, 87, 343–359. [Google Scholar] [CrossRef]
- Tang, Z.; Zhang, Y.; Wang, Y.; Shang, Y.; Viegut, R.; Webb, E.; Raedeke, A.; Sartwell, J. sUAS and Machine Learning Integration in Waterfowl Population Surveys. In Proceedings of the 2021 IEEE 33rd International Conference on Tools with Artificial Intelligence (ICTAI), Alexandria, VA, USA, 8–10 November 2021; pp. 517–521. [Google Scholar]
- Zhang, Y.; Wang, S.; Zhai, Z.; Shang, Y.; Viegut, R.; Webb, E.; Raedeke, A.; Sartwell, J. Development of New Aerial Image Datasets and Deep Learning Methods for Waterfowl Detection and Classification. In Proceedings of the 2022 IEEE 4th International Conference on Cognitive Machine Intelligence (CogMI), Miami, FL, USA, 26–28 October 2022; pp. 117–124. [Google Scholar] [CrossRef]
- Zhang, Y.; Feng, Y.; Wang, S.; Tang, Z.; Zhai, Z.; Viegut, R.; Webb, L.; Raedeke, A.; Shang, Y. Deep Learning Models for Waterfowl Detection and Classification in Aerial Images. Information 2024, 15, 157. [Google Scholar] [CrossRef]
- Roy, A.M.; Bhaduri, J.; Kumar, T.; Raj, K. WilDect-YOLO: An efficient and robust computer vision-based accurate object localization model for automated endangered wildlife detection. Ecol. Inform. 2023, 75, 101919. [Google Scholar] [CrossRef]
- Bakana, S.R.; Zhang, Y.; Twala, B. WildARe-YOLO: A lightweight and efficient wild animal recognition model. Ecol. Informatics 2024, 80, 102541. [Google Scholar] [CrossRef]
- Mpouziotas, D.; Karvelis, P.; Tsoulos, I.; Stylios, C. Automated Wildlife Bird Detection from Drone Footage Using Computer Vision Techniques. Appl. Sci. 2023, 13, 7787. [Google Scholar] [CrossRef]
- Li, Z.; Namiki, A.; Suzuki, S.; Wang, Q.; Zhang, T.; Wang, W. Application of Low-Altitude UAV Remote Sensing Image Object Detection Based on Improved YOLOv5. Appl. Sci. 2022, 12, 8314. [Google Scholar] [CrossRef]
- Dunn, E.H.; Bart, J.; Collins, B.; Craig, B.; Dale, B.; Downes, C.; Francis, C.; Woodley, S.; Zorn, P. Monitoring bird populations in small geographic areas. In Occasional Paper of the Canadian Wildlife Service; Canadian Wildlife Service: Gatineau, QC, Canada, 2006; pp. 1–59. [Google Scholar]
- Hong, S.J.; Han, Y.; Kim, S.Y.; Lee, A.Y.; Kim, G. Application of Deep-Learning Methods to Bird Detection Using Unmanned Aerial Vehicle Imagery. Sensors 2019, 19, 1651. [Google Scholar] [CrossRef] [PubMed]
- Bhatnagar, S.; Gill, L.; Ghosh, B. Drone Image Segmentation Using Machine and Deep Learning for Mapping Raised Bog Vegetation Communities. Remote Sens. 2020, 12, 2602. [Google Scholar] [CrossRef]
- Kirillov, A.; Mintun, E.; Ravi, N.; Mao, H.; Rolland, C.; Gustafson, L.; Xiao, T.; Whitehead, S.; Berg, A.; Lo, W.Y.; et al. Segment Anything. arXiv 2023, arXiv:2304.02643. [Google Scholar]
- Tait, L.W.; Orchard, S.; Schiel, D.R. Missing the Forest and the Trees: Utility, Limits and Caveats for Drone Imaging of Coastal Marine Ecosystems. Remote Sens. 2021, 13, 3136. [Google Scholar] [CrossRef]
- Wilkin, R.; Anderson, J.; Sahay, I.; Ong, M.; Broadley, S.; Gonse, M.; McClelland, G.T.W.; Joy, R. Vantage point photography and deep learning methods save time in monitoring seabird nesting colonies. Ornithol. Appl. 2025, 127, duaf013. [Google Scholar] [CrossRef]
- Cusick, A.; Fudala, K.; Storożenko, P.P.; Świeżewski, J.; Kaleta, J.; Oosthuizen, W.C.; Pfeifer, C.; Bialik, R.J. Using machine learning to count Antarctic shag (Leucocarbo bransfieldensis) nests on images captured by remotely piloted aircraft systems. Ecol. Inform. 2024, 82, 102707. [Google Scholar] [CrossRef]
- Sun, Z.; Jiang, W.; Ling, Z.; Zhong, S.; Zhang, Z.; Song, J.; Xiao, Z. Using Multisource High-Resolution Remote Sensing Data (2 m) with a Habitat–Tide–Semantic Segmentation Approach for Mangrove Mapping. Remote Sens. 2023, 15, 5271. [Google Scholar] [CrossRef]
- Diegues, A.; Pinto, J.; Ribeiro, P.; Frias, R.; Alegre, d.C. Automatic Habitat Mapping using Convolutional Neural Networks. In Proceedings of the 2018 IEEE/OES Autonomous Underwater Vehicle Workshop (AUV), Monterey, CA, USA, 24–26 September 2018; pp. 1–6. [Google Scholar] [CrossRef]
- Paul, S.; Pal, S. Mapping wetland habitat health in moribund deltaic India using machine learning and deep learning algorithms. Ecohydrol. Hydrobiol. 2024, 24, 667–680. [Google Scholar] [CrossRef]
- Tang, L.; Xiao, H.; Li, B. Can SAM Segment Anything? When SAM Meets Camouflaged Object Detection. arXiv 2023, arXiv:2304.04709. [Google Scholar]
- Wang, Y.; Zhao, Y.; Petzold, L. An Empirical Study on the Robustness of the Segment Anything Model (SAM). arXiv 2023, arXiv:2305.06422. [Google Scholar] [CrossRef]
- Lyu, Q.; Tan, J.; Zapadka, M.; Ponnatapura, J.; Niu, C.; Myers, K.; Wang, G.; Whitlow, C. Translating radiology reports into plain language using ChatGPT and GPT-4 with prompt learning: Results, limitations, and potential. Vis. Comput. Ind. Biomed. Art 2023, 6, 9. [Google Scholar] [CrossRef] [PubMed]
- Vas, E.; Lescroël, A.; Duriez, O.; Boguszewski, G.; Grémillet, D. Approaching birds with drones: First experiments and ethical guidelines. Biol. Lett. 2015, 11, 20140754. [Google Scholar] [CrossRef]
- Mulero-Pázmány, M.; Jenni-Eiermann, S.; Strebel, N.; Sattler, T.; Negro, J.J.; Tablado, Z. Unmanned aircraft systems as a new source of disturbance for wildlife: A systematic review. PLoS ONE 2021, 16, e0252477. [Google Scholar] [CrossRef]
- He, K.; Zhang, X.; Ren, S.; Sun, J. Deep residual learning for image recognition. In Proceedings of the IEEE Conference on Computer Vision and Pattern Recognition, Las Vegas, NV, USA, 27 June–2 July 2016; pp. 770–778. [Google Scholar]
- Tan, M.; Le, Q. EfficientNet: Rethinking Model Scaling for Convolutional Neural Networks. In Proceedings of the 36th International Conference on Machine Learning, Long Beach, CA, USA, 9–15 June 2019; pp. 6105–6114. [Google Scholar]
- Simonyan, K.; Zisserman, A. Very Deep Convolutional Networks for Large-Scale Image Recognition. arXiv 2014, arXiv:1409.1556. [Google Scholar]
- Lowe, D. Object recognition from local scale-invariant features. In Proceedings of the Seventh IEEE International Conference on Computer Vision, London, UK, 20–25 September 1999; Volume 2, pp. 1150–1157. [Google Scholar] [CrossRef]
- Fischler, M.A.; Bolles, R.C. Random Sample Consensus: A Paradigm for Model Fitting with Applications to Image Analysis and Automated Cartography. Commun. ACM 1981, 24, 381–395. [Google Scholar] [CrossRef]
- Sean McKeown, W.J.B. Hamming distributions of popular perceptual hashing techniques. Forensic Sci. Int. Digit. Investig. 2023, 44, 301509. [Google Scholar] [CrossRef]
- Ronneberger, O.; Fischer, P.; Brox, T. U-Net: Convolutional Networks for Biomedical Image Segmentation. arXiv 2015, arXiv:1505.04597. [Google Scholar] [CrossRef]
- Long, J.; Shelhamer, E.; Darrell, T. Fully Convolutional Networks for Semantic Segmentation. arXiv 2014, arXiv:1411.4038. [Google Scholar] [CrossRef]
- Li, M.; Zhang, H.; Gruen, A.; Li, D. A survey on underwater coral image segmentation based on deep learning. Geo-Spat. Inf. Sci. 2024, 27, 1–25. [Google Scholar] [CrossRef]
Figure 1.
Image examples of the six habitat categories.
Figure 1.
Image examples of the six habitat categories.
Figure 2.
Examples of the test image sequences used in our experiments. Each sequence contains three consecutive images captured along a drone flight path. The letters (a–c) denote the temporal order of image capture within each sequence. Left: two image sequences captured at an altitude of 30 m; right: two image sequences captured at an altitude of 60 m.
Figure 3.
(a) Input and output of the proposed system providing automated waterfowl detection, habitat segmentation, and report generation based on drone imagery. (b) Overview of the study process.
Figure 3.
(a) Input and output of the proposed system providing automated waterfowl detection, habitat segmentation, and report generation based on drone imagery. (b) Overview of the study process.
Figure 4.
Architecture of our proposed system for identification of waterfowl populations in their habitats using deep learning and LLMs based on sequences of overlapped drone images. The system processes a sequence of aerial images with overlaps by applying a habitat segmentation model to classify different habitat regions and a bird detector to localize waterfowl. To prevent double-counting of waterfowl and habitats, the overlap region detection module incorporates multiple methods, including GPS-based, SIFT-based, RANSAC-based, and bird-location-based approaches. Notably, the bird-location-based method requires bird detection results as one of its inputs to accurately identify overlapping regions in consecutive images. The extracted information is then compiled by a GPT-4o-based report generator, producing automated summaries of waterfowl distributions in different habitats.
Figure 5.
Example of bird detection result from our bird detector based on Faster R-CNN model on an aerial image. Green boxes represent true positive (TP) predictions; yellow boxes represent false positive (FP) predictions; and red boxes represents false negative (FN) predictions.
Figure 5.
Example of bird detection result from our bird detector based on Faster R-CNN model on an aerial image. Green boxes represent true positive (TP) predictions; yellow boxes represent false positive (FP) predictions; and red boxes represents false negative (FN) predictions.
Figure 6.
Example of habitat segmentation and classification result of our SegNet model on an aerial image. Habitats are represented by different colors: crop–blue, shrub–red, herbaceous–pink, open water–yellow, other–orange, wooded–green.
Figure 6.
Example of habitat segmentation and classification result of our SegNet model on an aerial image. Habitats are represented by different colors: crop–blue, shrub–red, herbaceous–pink, open water–yellow, other–orange, wooded–green.
Figure 7.
(a) Example of SAM segmentation result where different segmentation areas have different color masks. (b) Example of classification result where different pixel values represent different classes. (c) Example of habitat prediction result of our SAM-based segmentation and classification method on an aerial image. Meanings of the color masks are as follows: crop–blue, harvested crop–purple, herbaceous–pink, open water–yellow, other–orange, wooded–green.
Figure 8.
Examples of overlap detection results by the four proposed methods. The blue rectangles are the ground truth and the red rectangles are the detection results by the 4 methods, respectively.
Figure 8.
Examples of overlap detection results by the four proposed methods. The blue rectangles are the ground truth and the red rectangles are the detection results by the 4 methods, respectively.
Figure 9.
Example of a brief report generated by GPT-4o based on flight information and waterfowl and habitat detection results on a sequence of aerial images captured by a drone along a flight path.
Figure 9.
Example of a brief report generated by GPT-4o based on flight information and waterfowl and habitat detection results on a sequence of aerial images captured by a drone along a flight path.
Table 1.
Classification confusion matrix, F1 scores of each class, and overall classification accuracy are shown. Test performance of our new SAM-based habitat detection method on six habitat classes. Each row of the confusion matrix represents the instances of the actual class, while each column represents the instances of the predicted class.
| | Herbaceous | Open Water | Harvested Crop | Wooded | Other | Crop |
|---|
| herbaceous | 890 | 20 | 7 | 0 | 0 | 0 |
| open water | 29 | 424 | 0 | 0 | 0 | 0 |
| harvested crop | 165 | 24 | 32 | 0 | 0 | 0 |
| wooded | 12 | 0 | 0 | 40 | 0 | 0 |
| other | 0 | 0 | 4 | 0 | 39 | 0 |
| crop | 1 | 0 | 0 | 0 | 0 | 43 |
| Recall | 97.1% | 93.6% | 14.5% | 76.9% | 100% | 97.7% |
| Precision | 81.1% | 90.6% | 82.1% | 100% | 100% | 100% |
| F1 | 88.4% | 92.1% | 24.6% | 87.0% | 100% | 98.9% |
| Accuracy | 85.1% | | | | | |
Table 2.
F1 scores of different segmentation models across various habitat classes. The table compares the performance of the SAM-based method, UNet, FCN, and PSPNet on different habitat types. The average F1 score (Avg F1) and overall accuracy of each model are also included.
Table 2.
F1 scores of different segmentation models across various habitat classes. The table compares the performance of the SAM-based method, UNet, FCN, and PSPNet on different habitat types. The average F1 score (Avg F1) and overall accuracy of each model are also included.
| | SAM-Based Method | UNet | FCN | PSPNet |
|---|
| herbaceous | 88.4% | 80.2% | 90.5% | 85.5% |
| open water | 92.1% | 85.7% | 80.3% | 82.9% |
| harvested crop | 24.6% | 15.2% | 30.0% | 28.0% |
| wooded | 87.0% | 75.5% | 70.3% | 82.5% |
| other | 100% | 100% | 100% | 100% |
| crop | 98.9% | 80.1% | 75.2% | 88.9% |
| Avg F1 | 81.8% | 72.7% | 74.4% | 78.0% |
| Accuracy | 85.1% | 78.6% | 80.2% | 81.2% |
Table 3.
Prediction errors of the four proposed overlap detection methods on five 30 m test image sequences.
Table 3.
Prediction errors of the four proposed overlap detection methods on five 30 m test image sequences.
| Method | Seq. 1 | Seq. 2 | Seq. 3 | Seq. 4 | Seq. 5 | Avg. Time |
|---|
| GPS-based | 7.4% | 44.7% | 11.9% | 25.3% | 4.2% | 0.01 s |
| SIFT-based | 39.2% | 56.7% | 22.9% | 47.7% | 3.3% | 27.5 s |
| RANSAC-based | 0.2% | 10.4% | 15.8% | 15.8% | 2.1% | 42.3 s |
| Bird-location-based | 0.2% | 4.8% | 7.1% | 3.6% | 4.4% | 1.0 s |
Table 4.
Prediction errors of the four proposed overlap detection methods on five 60 m test image sequences.
Table 4.
Prediction errors of the four proposed overlap detection methods on five 60 m test image sequences.
| Method | Seq. 1 | Seq. 2 | Seq. 3 | Seq. 4 | Seq. 5 | Avg. Time |
|---|
| GPS-based | 3.7% | 23.2% | 10.0% | 6.7% | 20.2% | 0.02 s |
| SIFT-based | 2.0% | 2.0% | 0.2% | 2.9% | 9.6% | 94.6 s |
| RANSAC-based | 0.0% | 0.1% | 0.2% | 0.1% | 0.1% | 240.9 s |
| Bird-location-based | 0.6% | 0.7% | 0.8% | 0.1% | 0.7% | 1.6 s |
| Disclaimer/Publisher’s Note: The statements, opinions and data contained in all publications are solely those of the individual author(s) and contributor(s) and not of MDPI and/or the editor(s). MDPI and/or the editor(s) disclaim responsibility for any injury to people or property resulting from any ideas, methods, instructions or products referred to in the content. |
© 2025 by the authors. Licensee MDPI, Basel, Switzerland. This article is an open access article distributed under the terms and conditions of the Creative Commons Attribution (CC BY) license (https://creativecommons.org/licenses/by/4.0/).


