2.1. Environmental Performance
The environmental benefits of UAVs are promoted as the main motivation for their last-mile delivery applications [
31,
32]. Environmental assessment is introduced in the literature for utilization and production/disposal phases [
32,
33]. The utilization phase includes the generated emissions from two stages: generation-to-battery (GTB) and battery-to-propeller (BTP). The production/disposal phase includes emissions from components and battery manufacturing and recycling [
34].
Acknowledging the varied operational contexts and their impacts on the environmental performance of UAVs, the average GHG emissions synthesized from the literature include the utilization phase (representing ≈ 87.5% to 97.5%) and battery production/disposal (≈12.5% to 2.5) [
34,
35]. However, Koiwanit [
36] reported that the production/disposal phase represents 99.2% of the total delivery emissions. This discrepancy may be attributed to Koiwanit’s consideration of producing all UAV components rather than focusing solely on the battery.
Typically, GHG emissions are reported per vehicle (UAV) kilometre travelled (VKT) and range between 1.9 and 79 g Co2eq/km. In comparison, GHG emissions per parcel average between 0.6 and 1786 g Co2eq per parcel [
34,
36,
37,
38]. This wide range is attributed to several parameters. For example, regulation strictness increases emissions by up to 400% [
38], while a 50% reduction in demand density (e.g., 500 to 250 recipients/mile) reduces GHG emissions by up to 84% [
39]. Similarly, a higher electricity carbon intensity (399 to 900 g Co2eq/kWh) increases GHG emissions by up to 93% [
35,
40].
Compared to diesel and electric trucks (e-trucks), UAVs reduce emissions by up to 71% and 69%, respectively [
31], as detailed in
Table 2. Furthermore, truck-assisted UAVs reduce the number of trucks by up to 33%, resulting in 28.6% emission reductions compared to diesel trucks. This integration also reduces GHG emissions by up to 20% compared to e-trucks. Notably, the range of truck-assisted UAVs is between 539 and 2142 g Co2eq per delivery [
16,
33,
41].
Table 2 demonstrates a significant variation in the GHGs emitted by UAVs in last-mile delivery. The lowest emissions (0.6 g Co2eq/delivery) result from a UAV delivery in an urban area with lean flight regulations (Lean flight regulations permit greater operational freedom by allowing higher flight altitudes, reduced buffer zones around people and structures, and more flexible airspace usage.) [
11,
38], low carbon intensity (52.6 g Co2eq/kWh), and a payload capacity of 2.25 kg/UAV [
38]. In contrast, the highest emissions (1786 g Co2eq/delivery) result from a UAV delivery in an urban area with high carbon intensity (1000 g Co2eq/kWh) and a payload capacity of 8 kg/UAV [
34]. However, 87.5% to 97.5% of these emissions could be eliminated using renewable energy resources to power UAVs in last-mile delivery [
37].
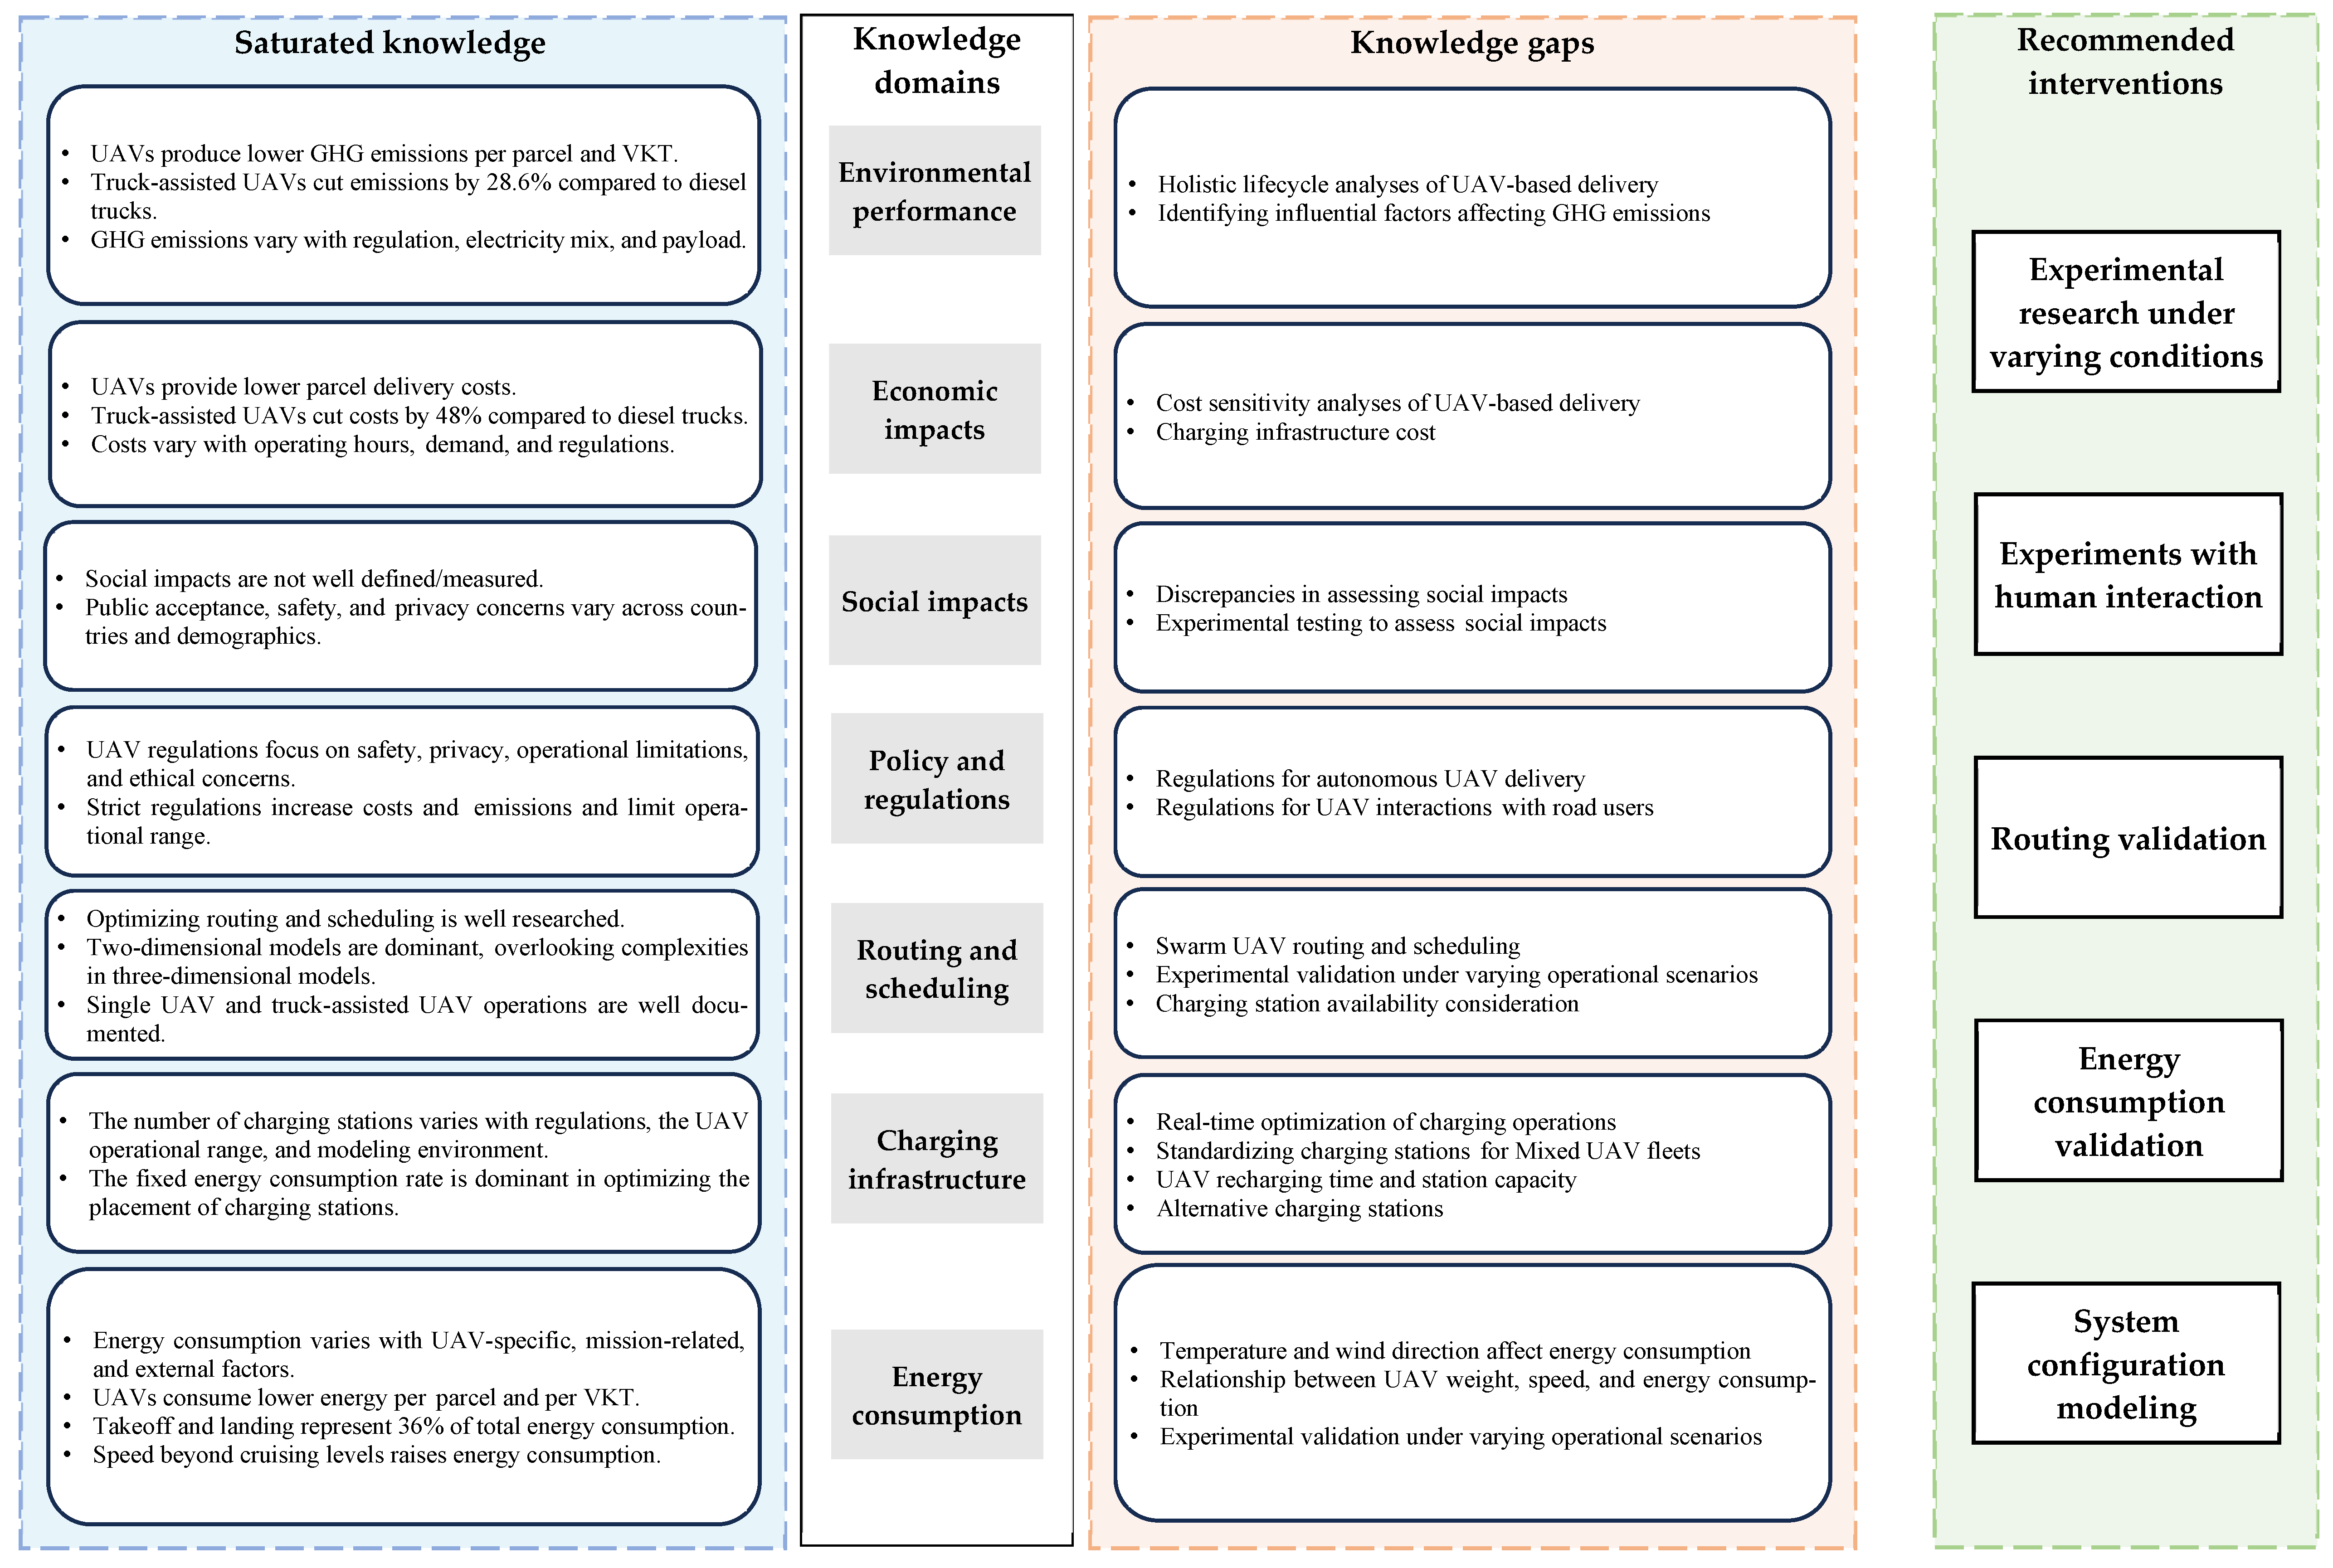
The wide variation in GHG emissions is attributed to the unique characteristics of each study, whereby external factors (e.g., payload, wind, speed, etc.) have a significant bearing on GHG emissions. However, based on the observed variation, there is a dire need for an accurate estimation of GHG emissions for the utilization and production/disposal phases of UAV delivery. In addition, a sensitivity analysis that quantifies the contributing factors to GHG emissions is needed. Comparisons between different delivery methods (e.g., UAVs, truck-assisted UAVs, and e-trucks) would be beneficial in comprehensively evaluating the environmental benefits of UAVs across various contexts.
2.2. Economic Impacts
Economic assessment in last-mile delivery is carried out in two phases: economic viability/return and delivery cost. It is reported that UAVs enhance economic return by up to 229% depending on the operational context [
15,
43], while the average delivery cost synthesized from the literature includes the fleet cost (≈32%), charging station cost (≈8%), and operational cost (≈60%) [
11] and is reported to be 96.5% lower than that of truck delivery [
44].
In non-business-to-consumer contexts, such as healthcare, UAVs have been found to significantly reduce transit times (e.g., 70% in health services logistics). However, they remain more expensive than trucks unless operation costs are cut by over 80% [
45]. This highlights the difficulty of achieving economic viability in small-scale, urgent logistics scenarios.
Overall, the cost per parcel delivered, often used as the cost unit, ranges between USD 0.03 and USD 0.67 (
Table 3). This wide range is attributed to several parameters. Extending UAV operating hours is reported to reduce the cost to USD 0.2 [
17,
40,
46]. Similarly, the cost per parcel in higher demand density (e.g., urban contexts) is reported as USD 0.07 compared to USD 0.67 in rural contexts [
44], as detailed in
Table 3. Compared to truck delivery, the cost reduction caused by UAVs in last-mile delivery is attributed to reducing human resource costs (44–70% of the total cost) compared to 6% for UAV last-mile delivery [
40,
44].
In truck-assisted UAV delivery, the cost per parcel ranges from USD 0.48 to USD 6.5 [
17,
41]. It is argued that truck-assisted UAV delivery is the most economically viable option [
17]. They also argue that UAVs must charge at the depot, significantly increasing the number of required UAVs to serve the demand, which increases the cost per parcel compared to a truck-assisted UAV system. However, this statement is not echoed in the literature.
Table 3.
UAVs’ economic performance.
Table 3.
UAVs’ economic performance.
| Studies | Cost per Parcel (USD) | Operation Parameters |
|---|
| UAVs | Diesel Trucks | Electric Trucks | Regulations | Operating Hours (hr) | Demand Density | Payload (kg) |
|---|
| Sudbury and Hutchinson [46] | 0.40 | 1.20 | NA | NA | 12 | Urban | 2.3 |
| Elsayed and Mohamed [44] | 0.03 | 2.00 | 1.30 | Lean regulations | 12 | Urban | 2.3 |
| 0.07 | Strict regulations |
| 0.47 | 15.00 | NA | Lean regulations | Rural |
| 0.67 | Strict regulations |
| Choi and Schonfeld [17] * | 0.55 | 0.57 | NA | NA | 12 | Urban | 5.5 |
| ElSayed [11] ** | 0.08 | NA | NA | Lean regulations | 6 | Urban and Rural | 2.0 |
| 0.09 | Strict regulations |
| Chiang [16] * | NA | 5.40 | NA | NA | 8 | Urban | 2.3 |
| 6.70 | Rural |
| Li [41] * | NA | 6.50 | NA | NA | 8 | Urban | 2.3 |
| 6.90 | Rural |
| Raghunatha [40] *** | 0.03 | 0.07 | 0.07 | NA | 8 | Urban | 544.3 |
| 0.07 | 0.18 | 0.16 | Rural |
| Borghetti [43] ** | 0.25 | 1.10 | NA | NA | 13 | Urban | 2.3 |
| Haidari [47] | 0.33 | 0.41 | NA | NA | NA | Urban | 3.0 |
From the literature, we synthesized the optimal economic utilization for UAV last-mile delivery.
Figure 3 indicates that the lowest cost (0.03 USD/parcel) occurs in urban areas with lean flight regulations, 12 operating hours, and a payload capacity of 2.25 kg/UAV. In contrast, the highest cost (0.67 USD/parcel) occurs in rural areas with strict flight regulations.
Reports from real-world UAV operations provide operational details that are not often captured in the academic literature. For example, the Zipline home delivers supplies within up to a 16 km delivery radius, typically with parcels weighing 3.5 kg [
48]. Similarly, Manna Aero reports delivering orders with UAVs with customer fees of around EUR 1.99 per trip, noting that each flight is currently profitable over a 3.4 km range [
49]. Wing recently introduced a UAV model capable of delivering parcels weighing up to 2.3 kg across a 19.3 km round trip [
50]. These services illustrate key operational parameters, such as payload capacity, range, and pricing, which are critical for evaluating UAV-based last-mile delivery systems.
Despite the growing interest and promising economic potential, significant variations in cost estimates limit the applicability of UAVs in last-mile delivery. Consequently, a comprehensive cost assessment is needed to clarify the significance of different cost elements. Additionally, sensitivity analyses quantifying the impact of cost variables across various delivery methods would provide valuable insights to evaluate the economic benefits of UAVs in different contexts. Considering indirect savings, such as reduced congestion from replacing truck deliveries, would enhance UAV system evaluations.
2.3. Social Impacts
The social impacts of UAV applications in last-mile delivery are yet to be fully defined. However, it is approximated using three integrated measures: (1) public acceptance, defined as the attitude towards the use of UAVs [
51]; (2) safety, which relates to the risk of accidents or harm resulting from UAV operation [
13]; and (3) privacy, defined as the lack of disruption and/or monitoring by others [
52].
The literature highlights public acceptance as essential in integrating UAVs [
29]. However, there is a significant variation in public acceptance of UAV applications across countries [
32,
53,
54,
55], socio-economic and demographic (SED) profiles [
53,
54], and geography (urban vs. rural) [
53,
54]. Moreover, there is evidence of contradictory expectations from business owners and end-users. While UAVs facilitate flexible delivery times and accessibility to distant locations for businesses, end-users are worried about additional delivery fees [
32]. Hence, they have a lower acceptance of using UAVs in delivery from an economic perspective.
The variation in public acceptance is interlinked with several factors; the most notable is UAV regulations. The permission to overflight is reported to enhance public acceptance and vice versa. In Germany, UAV overflight is not permitted, and public acceptance of UAVs is relatively low [
53]. However, in Canada and the USA, regulations guide overflight, and there is relatively higher public acceptance [
56]. Combined, these factors significantly impact the degree of public acceptance. For example, the USA [
54], Singapore [
55], and Portugal [
32] reported higher public acceptance, yet significant variation was observed between rural and urban contexts [
53,
54]. The latter is more open to UAV delivery. In contrast, results from Switzerland [
55] and Germany [
53] indicate lower public acceptance and highlight variations in different SED groups.
Furthermore, the literature indicates that UAV applications in last-mile delivery are perceived unsafe by the public. There are concerns about the misuse of UAVs in illegal applications, such as drug and weapon trafficking, and expected incidents (e.g., payload dropping) [
3,
53,
54,
55]. Safety perception varies with public knowledge of UAV operations [
53], their regulatory environment, and prior experience/exposure. Reacting to that, international institutions (e.g., the Federal Aviation Association (FAA) and European Commission) are actively developing safety-oriented bylaws and regulations [
53,
54] to enable applications of UAVs in delivery.
The literature shows that the public considers UAV applications in last-mile delivery to be a breach of privacy. Major concerns include the ability to collect, retain, use, and disclose personal information [
3,
52]. For instance, community opposition in Canberra (Australia) led to the termination of Google Wing’s UAV delivery trial, highlighting that technological solutions must align with social expectations [
57].
Public concerns vary across various aspects, including public knowledge, experience level, UAV speed, and data collection capabilities [
29,
54,
58]. Public concerns can vary significantly based on the extent of UAV adoption.
Table 4 summarizes findings and gaps associated with the social impacts of UAVs in last-mile delivery.
Previous research indicates that the public is ill-informed about using UAVs in delivery [
29]. In addition, research on assessing the social impacts of UAVs in last-mile delivery depends primarily on stated preferences data collected from surveys (examples of survey measures are detailed in
Appendix A.1). However, using different methodological approaches in UAV surveys causes discrepancies in the results [
29]. Also, survey participants did not observe UAV operation in action nor the associated noise, size, trajectory, and even colour.
Furthermore, the public has yet to consider the safety and privacy concerns of using UAVs on a large scale, given the limitations in current UAV operations [
59]. As such, the literature emphasizes the dire need to assess/validate social impacts through experimental research. We echo this argument and call for experimental research to identify the thresholds of UAVs’ social impacts.
2.4. Policy and Regulations
UAVs are relatively new, and concerns about possible risks to individuals, properties, and other airspace users necessitate the development of a comprehensive regulatory framework [
38]. Several countries are formulating UAV regulations, aiming to (1) regulate the use of airspace, ensuring the safe coexistence of UAVs and manned aircraft; (2) establish operational boundaries, guaranteeing responsible and safe operation of UAVs; And (3) establish administrative procedures, including flight permissions, pilot licencing, and data collection authorization [
24].
UAV last-mile delivery applications are regulated across four primary dimensions. Operational limitations involve constraints applied to UAV flights outlining essential flight parameters. Regulatory classifications involve a set of categories (e.g., weight and size) for UAVs. Administrative frameworks include policies regulating flight permissions and procedures. Ethical consideration involves rules managing privacy and data protection [
24,
60,
61]. Previous studies highlight five operational limitations.
Table 5 presents three regulatory classifications and the associated parameters across various operational indicators [
11,
24,
38,
62,
63].
The literature highlights that regulations substantially impact UAVs’ last-mile operations, especially in urban contexts. Choosing strict over lean regulations enhances safety but reduces routing efficiency, leading to increased energy consumption and 75% more failed delivery missions as sections of the urban volume become inaccessible. Addressing mission failures necessitates a 223% increase in charging stations compared to lean flight regulations.
In addition, strict flight regulations increase costs and GHG emissions by up to 10% and 400%, respectively [
11,
38]. Nevertheless, implementing lean flight regulations requires advanced technical prerequisites, including geofencing and collision avoidance features, to achieve the necessary level of safety [
60]. Additionally, many medical delivery items (e.g., vaccines, blood, and biological samples) are classified as dangerous goods (DGs) under air transport regulations. Grote et al. (2021) audit these dangerous goods rules and emphasize that they were developed for crewed aircraft and do not adequately cover UAV operations [
64]. They conclude that new governance frameworks will be required to allow for safe UAV delivery of DG-classified medical cargo.
Similarly, ElSayed [
11] cross-examined regulations for both horizontal proximity to buildings (H) and permissible flight altitude (A), with each categorized as lean (1), average (2), or strict (3), resulting in nine scenarios (e.g., H1A1 for lean horizontal proximity and flight altitude). The findings did not echo the same wide range of variation for GHG emissions’ sensitivity to regulations; however, more than a 10% increase in cost is reported, as illustrated in
Figure 4.
Several aspects of policy and regulation have yet to be discussed in the literature. Most notable is the lack of regulatory frameworks for autonomous UAV last-mile delivery [
11]. Furthermore, studies have identified noise as a critical constraint, yet there are no guidelines on acceptable UAV noise levels [
60,
66]. In addition, there is almost no mention of the interaction between UAVs and other road users, especially at the delivery/pick-up points, where UAVs will be flying at lower altitudes.
2.5. Routing and Scheduling
The routing and scheduling of UAVs are interconnected, and their definitions often overlap. Routing focuses on identifying optimal paths that meet UAV performance indicators within given constraints [
67]. Scheduling integrates time-related factors, such as time windows and arrival times, into the routing problem [
30,
68]. Scheduling is also viewed as a task assignment problem, where specific delivery tasks are assigned to UAVs, aiming to minimize the number of UAVs needed to complete deliveries, optimizing resource utilization [
25].
Routing and scheduling problems are based on the principles of the Travelling Salesman Problem (TSP) and Vehicle Routing Problem (VRP) [
5,
68,
69,
70]. TSP defines the shortest route that visits a set of locations once and returns to the origin point. At the same time, VRP extends this by considering multiple vehicles and additional constraints, such as delivery time windows and vehicle capacities [
71]. Variants of these problems are frequently used in UAV routing and scheduling, including the following:
Multi-Trip VRP (MTVRP): This reuses UAVs to overcome payload limitations [
71,
72].
Capacitated VRP (CVRP): This considers the UAV payload capacity [
16,
25,
26,
71,
73,
74].
Multi-Depot VRP (MDVRP): This involves multiple starting and ending points for UAVs [
26,
70].
Time Window VRP (VRPTW): Each delivery location must be visited in a time window [
26,
70].
Flying Sidekick TSP (FSTSP): UAVs and trucks deliver concurrently, with UAVs departing and returning to a truck following a TSP route [
5,
70,
71,
72,
73,
74,
75,
76,
77].
Parallel Drone Scheduling TSP (PDSTSP): UAVs and trucks simultaneously deliver along different paths from a common depot [
70,
72,
74,
75,
78,
79].
Optimal routing/scheduling also depends on the delivery method, number of UAVs, and parcel delivery volume [
16,
72,
73,
76,
77,
78,
80,
81]. Delivery methods include UAVs and assisted UAV systems, where UAVs work with trucks or public transport [
69,
82].
Furthermore, factors affecting routing and scheduling problems include the model environment (i.e., 2D and 3D) and UAV parameters (i.e., battery size, parcel weight, and flight altitude). Variants of 2D or 3D modelling coupled with static or dynamic obstacles significantly impact optimal routing [
12,
25,
83,
84,
85]. Modelling in a 2D environment represents 77% of the surveyed literature, where the altitude is fixed or not specified [
86,
87]. Static environments are used in 61% of the surveyed literature, with the assumption of predefined delivery points and a focus on optimizing the sequence of deliveries [
16]. Weather conditions are considered in 13% of the literature, while the impact of demand density on routing and scheduling is considered in 6% of the literature [
25,
26,
80,
88].
The performance of routing solutions is evaluated through metrics such as delivery cost, time, route distance, and emissions for path-planning problems [
67]. In task assignment problems, performance is measured by the number of UAVs and trucks required to complete the delivery [
25]. The objective of the two optimization problems is to maximize gains (i.e., UAV flight range) or minimize losses (i.e., parcel delivery time and costs).
Overall, routing and scheduling optimization problems are solved using several algorithms. Particularly, 65% of reviewed studies employ Heuristic and Genetic algorithms (e.g., A*, Dijkstra, Ant Colony Optimization (ACO), Genetic Algorithm, Simulated Annealing, and GRASP Metaheuristic).
Table 6 shows the modelling features (e.g., number of UAVs, trucks, and parcels), modelling environments, and optimization approaches.
Despite advances in UAV routing and scheduling optimization, several research gaps hinder practical implementation. The focus on 2D environments (77%) overlooks the complexities of 3D UAV flights, which are essential for realistic path planning [
89]. The interaction between multiple UAVs is not fully addressed, and experimental testing is mainly absent, limiting the validation of theoretical models. Also, only 13% of the surveyed studies consider weather conditions without considering the stochastic nature of wind and temperature.
Table 6.
The literature on UAVs’ last-mile delivery routing and scheduling problems.
Table 6.
The literature on UAVs’ last-mile delivery routing and scheduling problems.
| Studies | UAVs | Trucks | Parcels | Modelling Environment | Solution Algorithm |
|---|
| 2D | 3D | Obstacles |
|---|
| Dorling [71] | Multiple | | Multiple | | ✓ | | Simulated Annealing |
| Xu [90] | Multiple | | | | ✓ | ✓ | Gradient Descent |
| Rovira-Sugranes and Razi [91] | Multiple | | | ✓ | | | Dijkstra |
| Agatz [69] | Single | Single | Single | ✓ | | | CPLEX |
| Chang and Lee [70] | Multiple | Single | Single | ✓ | | ✓ | Clustering |
| Chen [82] | Single | | Single | ✓ | | | A* |
| Torabbeigi [68] | Multiple | | Multiple | ✓ | | | CPLEX |
| Kitjacharoenchai and Lee [73] | Multiple | Multiple | Multiple | ✓ | | | CPLEX |
| Chiang [16] | Multiple | Multiple | Single | ✓ | | | Genetic Algorithm |
| Dhulkefl and Durdu [86] | Single | | | ✓ | | ✓ | A* and Dijkstra |
| Thibbotuwawa [88] | Multiple | | Single | | ✓ | ✓ | Clustering |
| Kuru [83] | Multiple | | Multiple | | ✓ | | Hungarian and Cross-Entropy Monte Carlo |
| Wang [74] | Multiple | Multiple | Single | ✓ | | | Clustering |
| Cheng [72] | Multiple | | Multiple | ✓ | | | Branch and Cut |
| Kim [80] | Single | | Single | ✓ | | | Heuristic-Based |
| Huang [92] * | Single | | Single | ✓ | | | CPLEX |
| Karve and Kapadia [87] | Multiple | | | ✓ | | | Dijkstra |
| Hazama [75] | Multiple | Single | Single | ✓ | | | Genetic |
| Huang [93] * | Single | | Single | ✓ | | ✓ | Dijkstra |
| Ghelichi [81] | Multiple | | Single | ✓ | | | GUROBI |
| Sajid [76] | Multiple | | Multiple | ✓ | | | Hybrid Genetic and Simulated Annealing (HGSA) |
| Gómez-Lagos [78] | Multiple | | Single | ✓ | | | GRASP Metaheuristic |
| Li [85] | Single | | | | ✓ | ✓ | A* Plus |
| Escribano [84] | Multiple | | Multiple | ✓ | | ✓ | CPLEX |
| Wang and Bai [67] | Single | | | ✓ | | | A* |
| Li [89] | Single | | | | ✓ | ✓ | RJA* |
| Kumar [94] | Single | | | ✓ | | ✓ | Rapid-A* |
| Zhao [77] | Multiple | Single | Multiple | ✓ | | | Genetic Algorithm |
| Zhu [79] | Multiple | | Single | ✓ | | | Branch and Cut |
2.6. Charging Infrastructure
The use of UAVs for last-mile delivery is limited by their short delivery range [
95,
96,
97,
98,
99,
100]. This limitation is countered by deploying charging stations (both stationary and mobile), which extend the operational range and efficiency of UAVs in last-mile delivery [
99]. Stationary stations include those on rooftops or streetlights in urban areas or overhead power lines in rural areas [
101,
102]. Mobile stations utilize trucks or public transportation [
100]. Charging methods include battery swapping and wireless or laser-beam recharging [
102,
103,
104].
Some UAV warehouses incorporate charging capabilities as part of a broader infrastructure, including dispatch, weather shielding, and maintenance. This section focuses on charging infrastructure specifically, whether integrated within warehouses or implemented as standalone units.
The deployment of charging infrastructure is addressed through sophisticated optimization models that aim to determine optimal charging locations while maximizing coverage and minimizing the total cost [
95,
97,
100]. Key factors influencing the UAV system configuration include the UAV flight range, regulation strictness, and model environment, as detailed in
Table 7.
Overall, the literature indicates that doubling the flight range reduces the number of charging stations by up to 77% while maintaining coverage [
96]. More strict flight regulations lead to a 123% increase in the required number of charging stations to compensate for performance losses [
11]. Two-dimensional modelling of UAV delivery overestimates the UAV performance due to unaccounted elevation and obstacles. In contrast, modelling in a 3D environment increases the number of required stations by 56% compared to a 2D solution [
102]. Most reviewed studies assume fixed range and energy consumption [
95,
96,
97,
98,
99]. However, it is worth noting that Hong [
96] accounts for variable ranges according to the payload, and ElSayed [
11], Mishra and Tiwari [
100], and ElSayed [
102] employ energy consumption models while accounting for external environmental factors.
A sustainable solution to UAVs’ energy use is attainable by integrating renewable energy sources into the charging infrastructure, although it is rarely explored in the literature [
102]. Solar panels, for example, can be installed on rooftops and building facades, providing an eco-friendly energy source [
102]. Wind turbines can be used in rural areas to supplement power generation. Hybrid systems combining solar and wind energy can enhance reliability, ensuring continuous power availability even in varying weather conditions [
105]. However, challenges such as energy storage and variability in renewable energy generation must be addressed to ensure consistent charging station performance [
105].
Several gaps remain despite the current progress in optimizing UAV charging stations. The real-time optimization of charging operations also needs improvement, with current systems lacking the ability to efficiently manage energy use, flight paths, and schedules under dynamic conditions [
104]. Integrating mixed UAV fleets with varying battery capacities and sizes presents challenges in standardizing charging infrastructure. This requires optimizing the number of charging stations while ensuring compatibility across different UAV types [
103]. Another gap is the insufficient focus on the UAV charging time; combined with charging station capacity constraints, this can result in queuing, potentially leading to significant increases in delivery time and costs [
103]. Moreover, studies on alternative charging stations, such as streetlight-based charging, are limited, presenting another unexplored area.
2.7. Energy Consumption
The energy consumption of UAVs in parcel delivery is affected by several factors categorized into UAV-specific, mission-related, and external factors [
106,
107].
UAV-specific factors include weight, size, maximum takeoff weight (MTOW), the number and size of rotors, battery capacity, power efficiency, and flight speed [
34,
108]. For example, an unloaded octocopter is seven times heavier than a quadcopter, with six times higher energy consumption. However, their ranges are 4.2 km and 3.5 km, respectively [
34]. While increasing battery capacity extends this range, there is a point where the additional battery mass becomes counterproductive, as shown in
Figure 5 [
34,
71,
109].
Another critical factor is the variable power efficiency that depends on the battery's state of charge (SoC) and UAV speed [
34,
107]. Defining trips by their duration, Rodrigues [
35] claims that the total energy consumption during the trip remains constant as two opposite factors (trip distance and energy consumption per unit distance) are at play. Given a fixed time, a UAV travelling at a higher speed covers a greater distance while having lower energy consumption per kilometre, so the product between them remains constant. However, their conclusion is limited to the speed range investigated in their study (i.e., 4–12 m/s), and extrapolating these results reveals that energy consumption per km endlessly diminishes with an increasing speed.
This extrapolation is contradicted logically and through simulation results showing that energy consumption per unit distance increases with an increasing speed [
34,
108,
110]. Energy consumption also non-linearly increases with speed, with higher speeds leading to disproportionate energy consumption [
106]. Nevertheless, Rahmani [
109] shows that energy consumption for hovering decreases as the speed increases from zero to the transition speed between hovering and cruising. From this transition speed onwards, energy consumption per distance increases, implying that this transition speed is optimal. The optimal speed was also found to increase with parcel weight, as heavier UAVs, particularly during takeoff and ascent, require more energy to generate the necessary thrust to overcome gravity. Cruising at the optimal speed reduced the total energy consumption by 27.2% [
110].
Mission-related factors are flight segments, which include takeoff, landing, cruise, the number of parcels delivered per trip, and empty returns [
106]. Several studies model energy consumption either by considering only the cruise segment [
34,
42,
110] or all segments [
35,
108,
109]. Overall, takeoff and landing count for 36% of the total energy consumption [
35]; takeoff energy consumption is four times higher than landing [
109]. Weight reduction resulting from the delivery of multiple parcels is often overlooked as a critical factor in estimating accurate energy consumption [
34,
42,
110].
External factors are temperature, wind speed, and direction. Air density is directly related to atmospheric temperature and indirectly affects energy consumption. For instance, an increase in air density by 13.8% led to a rise in energy consumption by 3.6% [
108]. Wind speed and direction significantly affect UAV energy consumption as flying against strong winds increases resistance, while tailwinds can reduce energy usage [
107,
108]. Parcel-related factors are the weight and size, as parcel size affects the drag ratio and can contribute to 9% of the total delivery energy [
34]. Parcel weight changes the optimal velocity and can increase consumption by up to 100% [
34,
110]. Further operational challenges, such as infrastructure coordination, safety protocols, and integration with logistics systems, are highlighted in a recent study by Grote [
111], emphasizing the need for holistic planning strategies in UAV logistics [
111].
Table 8 summarizes the literature on energy consumption, the factors considered, and energy consumption rates.
Zhang [
106] thoroughly reviewed various approaches to model UAV energy consumption in parcel delivery, highlighting simple and complex methods. Integrated models, which rely on a single lift-to-drag ratio to estimate overall energy consumption, offer a broad assessment of UAV performance but often lack specificity regarding flight conditions or UAV configurations. In contrast, component-based models provide a more detailed analysis by breaking down flight dynamics into aerodynamic components such as drag, lift, and thrust. This method allows for the precise evaluation of energy consumption during different flight phases, including takeoff, cruising, and landing. Regression models, developed from field tests or simulations and calibrated with empirical data, establish predictive relationships between variables like weight, speed, and environmental conditions, delivering tailored energy consumption predictions for specific UAVs or missions.
Overall, the energy efficiency of UAVs diminishes with heavier parcels or in adverse weather conditions [
107]. UAVs reduce energy consumption by up to 94% compared to diesel trucks and by 31% compared to electric vans per parcel delivered [
34,
35].
That said, the literature on UAV energy consumption indicates several significant gaps. First, many existing studies fail to account for all stages of flight, including takeoff, landing, and cruise, which can impact overall energy consumption. Additionally, the relationship between UAV weight, speed, and energy consumption is often oversimplified despite evidence showing a non-linear relationship [
108]. The effects of environmental factors, such as wind and temperature, are also underexplored, particularly in adverse conditions like strong winds or extreme temperatures, which can drastically affect performance [
107]. Furthermore, experimental research is limited, and when conducted, it often shows significant discrepancies compared to theoretical models [
106]. The impact of parcel weight on energy consumption, especially when comparing inbound and outbound trips, lacks clear identification [
110]. These gaps highlight the need for more comprehensive experimental studies, particularly under real-world conditions, to ensure UAVs can be viable for critical delivery applications, especially in adverse weather.


