Article

Model-Based RL Decision-Making for UAVs Operating in GNSS-Denied, Degraded Visibility Conditions with Limited Sensor Capabilities

by
Sebastien Boiteau
1,2,*,
Fernando Vanegas
1,2,
Julian Galvez-Serna
1,2,3 and
Felipe Gonzalez
1,2
1
School of Electrical Engineering and Robotics, Queensland University of Technology (QUT), 2 George Street, Brisbane City, QLD 4000, Australia
2
QUT Centre for Robotics (QCR), Queensland University of Technology (QUT), Level 11, S Block, 2 George Street, Brisbane City, QLD 4000, Australia
3
Research Engineering Facility (REF), J2, Sports Lane, QUT Kelvin Grove Campus, Kelvin Grove, QLD 4059, Australia
*
Author to whom correspondence should be addressed.
Drones 2025, 9(6), 410; https://doi.org/10.3390/drones9060410
Submission received: 2 April 2025 / Revised: 23 May 2025 / Accepted: 2 June 2025 / Published: 4 June 2025

Abstract

Autonomy in Unmanned Aerial Vehicle (UAV) navigation has enabled applications in diverse fields such as mining, precision agriculture, and planetary exploration. However, challenging applications in complex environments complicate the interaction between the agent and its surroundings. Conditions such as the absence of a Global Navigation Satellite System (GNSS), low visibility, and cluttered environments significantly increase uncertainty levels and cause partial observability. These challenges grow when compact, low-cost, entry-level sensors are employed. This study proposes a model-based reinforcement learning (RL) approach to enable UAVs to navigate and make decisions autonomously in environments where the GNSS is unavailable and visibility is limited. Designed for search and rescue operations, the system enables UAVs to navigate cluttered indoor environments, detect targets, and avoid obstacles under low-visibility conditions. The architecture integrates onboard sensors, including a thermal camera to detect a collapsed person (target), a 2D LiDAR and an IMU for localization. The decision-making module employs the ABT solver for real-time policy computation. The framework presented in this work relies on low-cost, entry-level sensors, making it suitable for lightweight UAV platforms. Experimental results demonstrate high success rates in target detection and robust performance in obstacle avoidance and navigation despite uncertainties in pose estimation and detection. The framework was first assessed in simulation, compared with a baseline algorithm, and then through real-life testing across several scenarios. The proposed system represents a step forward in UAV autonomy for critical applications, with potential extensions to unknown and fully stochastic environments.

1. Introduction

The use of autonomous UAVs in critical applications can alleviate the need for human interventions, especially in situations where manual operations are often dangerous and unfeasible. Due to their reduced size and cost, high versatility and autonomous capabilities, UAVs are a popular solution in essential operations such as search and rescue [1] and mining [2]. For example, competitions such as the DARPA Subterranean Challenge (SubT), organized by the Defense Advanced Research Projects Agency (DARPA), focused on developing autonomous systems capable of navigating complex underground environments [3]. Some of the solutions presented included UAVs for underground exploration and mapping.
However, drones are restricted by their payload capacities, onboard computer processing power, and sensors. In addition, certain conditions such as restricted freedom of movement, lack of a GNSS, and degraded visibility are often present in critical missions. The limited sensor capabilities of UAVs coupled with difficult environmental conditions create challenges for autonomous navigation by increasing the level of uncertainty. Uncertainty can come from many factors, including the environment, which is often stochastic; the sensors, which are limited by their range and resolution; and the robot actuation, affected by control noise, wear and tear, and mechanical failure [4].
Therefore, modeling and accounting for uncertainty is a crucial component in the design of an autonomous solution for UAV navigation in challenging environments with limited sensor capacities. Model-based RL is a framework that allows an agent to make decisions under uncertainty and partial observability. Mathematical frameworks like the Markov Decision Process (MDP) and Partially Observable Markov Decision Process (POMDP) can model the RL process under uncertainty. The former models make decisions in an assumed fully observable environment with uncertainty in motion and action [4,5,6]. The MDP is used in stochastic environments, where sequential decisions are required for the agent to reach a desired state, assuming that there are no uncertainties in the perception of the agent’s environment. As stated previously, the presence of visual obscurants, the lack of a GNSS, and limited sensors will affect the agent’s observations. Thus, a POMDP approach, which is a sequential decision problem with state uncertainty, is a better option under the stated conditions.
The application of POMDP models in robotics has become a widely researched area [7,8,9], and a popular research topic for UAVs. The MDP and POMDP have, for example, been used to maintain safety and prevent high-risk system failures of an Unmanned Aircraft System (UAS) that executes a package delivery mission [10]. The POMDP is also an interesting choice when dealing with UAV path planning problems, with [11] using the Interactive Multiple Model (IMM) method to describe the POMDP for UAV path planning and target tracking. The authors of [12] modeled a strategy for the exploration and planning of informative UAV routes in forest monitoring by combining Bayesian optimization with the POMDP. POMDPs are a viable approach to enable UAVs to navigate autonomously [13,14,15,16,17]. Numerous studies have explored the use of the POMDP for UAV navigation and path planning, with simulation serving as the primary evaluation method. Although simulation provides a controlled environment for testing different policies, it often fails to capture real-world challenges such as sensor noise, computational constraints, and dynamic environmental factors. Many studies on the POMDP, including those on multi-UAV collaboration [18,19,20,21], remain entirely in simulation, limiting their applicability to real-world scenarios. Studies such as [22,23] first assessed the developed system in simulation to later integrate it on a real UAV platform for POMDP-based decision-making. However, their frameworks assumed reliable GNSS-based pose estimation using an accurate system such as VICON [24], and did not address degraded visibility scenarios such as smoke or low luminosity. Although their research explored partial observability in target detection, it did not fully investigate the challenges of GNSS-denied navigation on a computationally constrained UAV platform, leaving a gap in understanding how POMDP-based navigation performs under real-world uncertainties. Vanegas et al. [25] used POMDP to formulate a navigation problem for a small UAV with environmental uncertainty without GPS in a cluttered indoor environment. The system relied on Aruco markers to reduce pose estimation uncertainty and used accurate non-onboard sensors for localization, which are not present in real-world critical applications. Vanegas et al. [26] later proposed a full POMDP framework that allows UAVs to navigate in unknown and GPS-denied environments using SLAM and visual odometry. However, only simulation was used, minimizing real-world challenges. Despite these advances, there is still a critical gap in understanding how POMDP-based UAV navigation performs under real-world constraints such as the lack of a GNSS, onboard computational limitations, sensor constraints, and degraded visibility conditions. Addressing this gap requires real-world deployments that do not rely on external localization systems or idealized environments, ensuring robust UAV autonomy in complex and uncertain conditions.
Deploying UAVs in challenging environments requires multiple sensors to increase the drone’s capability to perceive its surroundings. Khattak et al. [27] developed and tested a solution for UAV navigation in subterranean environments with visual obscurants (smoke, dust, low visibility). The system uses an IMU, a 3D LiDAR, a thermal camera, and an RGB camera for Simultaneous Localization and Mapping (SLAM) [28,29,30]. The framework then applies a Multi-Sensor Fusion framework from [31] to fuse the data and obtain a robust pose estimation system. Exploration path planning is performed using the graph-based exploration planner of Dang et al. [32]. The same framework was used in [33], which focused on introducing a novel approach inspired by biological visual saliency models for object detection in visually degraded environments. Through the fusion of data from visible-light and thermal cameras, a saliency map is generated. The primary knowledge gap in these studies is the lack of probabilistic decision-making under uncertainty and the detailed modeling of environmental and measurement uncertainties.
This paper introduces a system that allows a UAV to navigate autonomously in challenging environments. Search and rescue is used as an inspiration for the navigation task, and complex navigation conditions are created by degraded visibility, lack of a GNSS, and obstacles. The system is further challenged by the limited sensor capabilities with entry-level onboard sensors. The model-based RL algorithm selected to allow the agent to make decisions under uncertainty is the POMDP. As the mission is inspired by search and rescue applications, the objective of the agent is to safely survey an indoor area with obstacles to detect and locate a person. This work follows previous research papers [34,35,36]. The first focused on the POMDP formulation and implementation of the experiments in a Software-in-the-Loop environment only, with simulated smoke, an Aruco marker as target, and an RGB camera. It highlighted the capability of the POMDP model to safely explore the environment and detect the target, but it showcased the limitation of using an RGB camera in low-visibility environments. The second improved this work by updating and testing the system under real-life conditions. A thermal camera replaced the RGB camera to detect a human being, and the system was evaluated through simulated and real-world tests. In both articles, the target’s position was modeled as a 2D point for both the state and observation vectors. This created some limitations for the agent to efficiently detect the target as a 2D point, which is insufficient for modeling a larger target such as a person. Furthermore, the pose was estimated via accurate external position capture systems such as Optitrack [37], rather than relying on onboard systems. The third research paper builds upon these two prior works by integrating a 2D LiDAR/Inertial odometry system for pose estimation and by enhancing the POMDP model through the incorporation of a bounding-box observation model, similar to those produced by deep learning-based object detectors. Only simulation was used to assess the performance of the system. The objective of this new research paper is to test the complete system in real life with limited pose estimation and a low-resolution thermal camera to assess the performance of the POMDP with greater uncertainty in position and detection. Simulation was first used to compare the performance of the POMDP solution with a baseline algorithm, highlighting the importance of further testing the system under real-world conditions. The framework was tested under different pose estimation uncertainties and different visibility conditions. This work contributes a novel framework for autonomous UAV navigation and target detection in environments with GNSS-denied and visually degraded environments, with a particular focus on real-world deployment. Innovation in methods lies in the integration of a POMDP-based reinforcement learning approach with a realistic observation model that reflects the output of modern object detection systems. By incorporating bounding box detections and camera field-of-view constraints, the framework enables autonomous altitude management depending on the target size, allowing the target to remain within the camera’s field of view. In addition, the model accounts for uncertainty in both target detection and UAV pose estimation, representing varying localization conditions within the belief space. The proposed approach was implemented on a fully autonomous UAV relying solely on onboard sensing and computation, and was validated through extensive real-world testing.

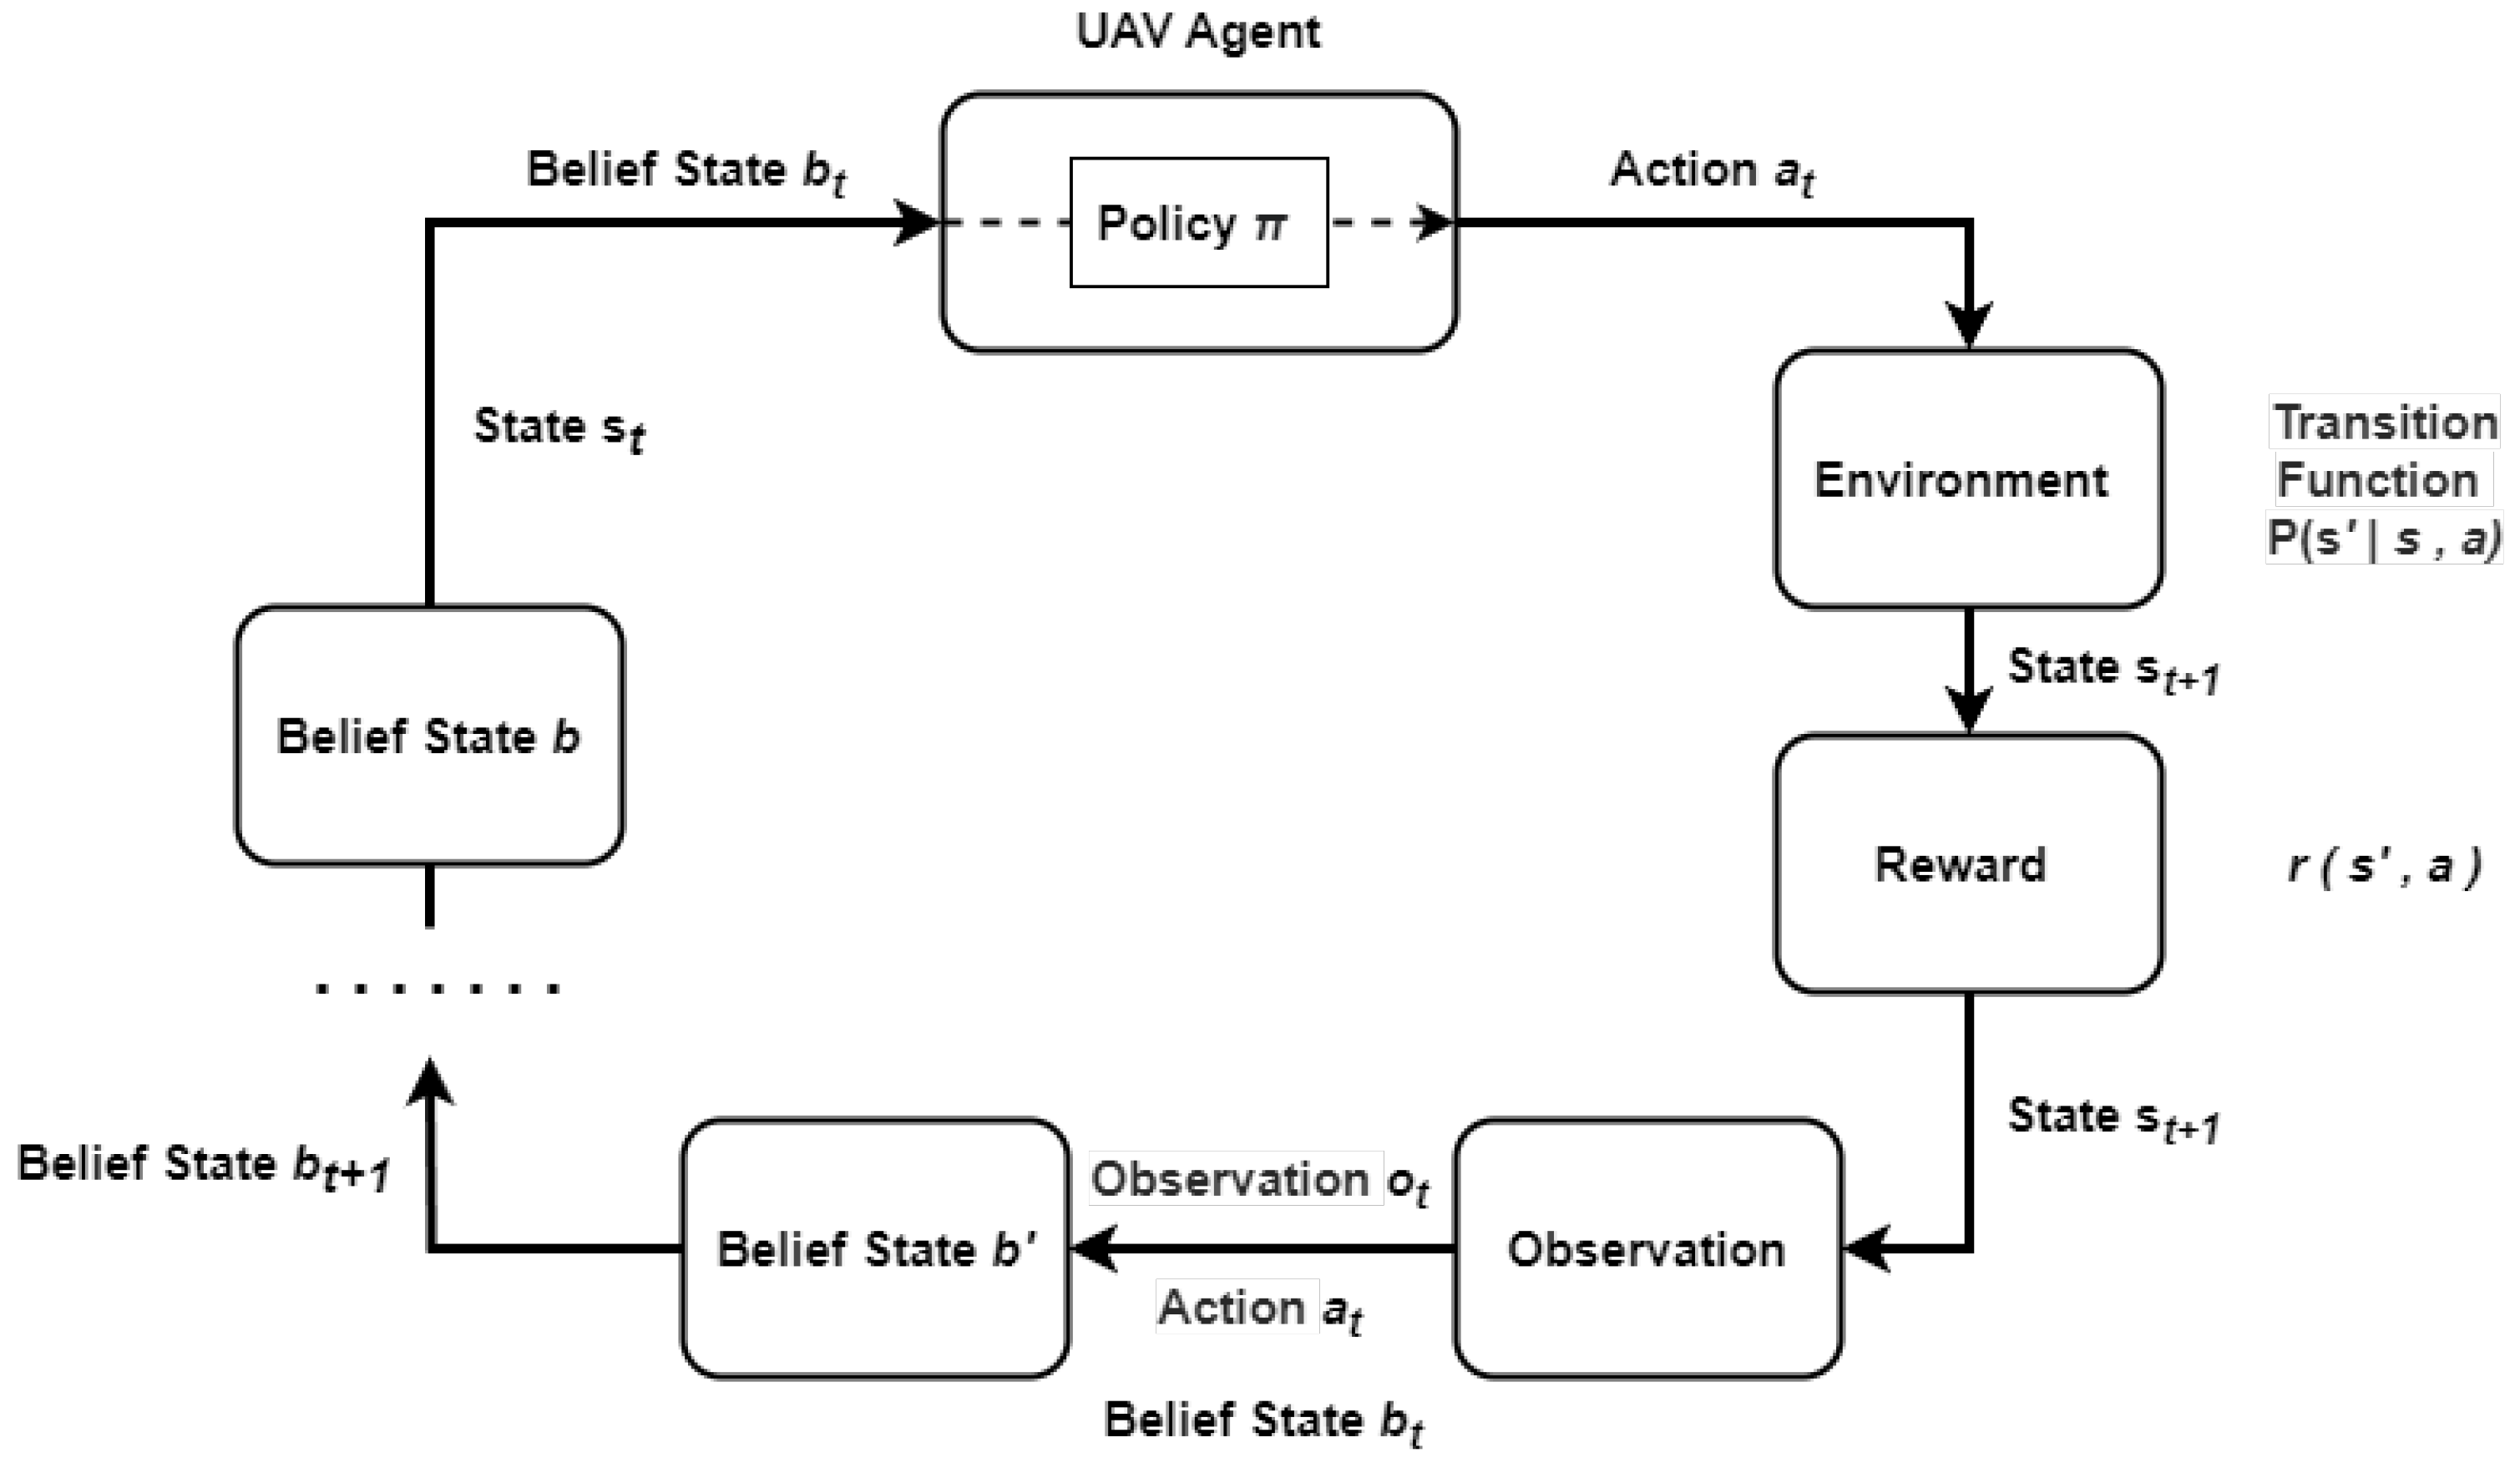
2. Problem Definition and POMDP Framework

UAVs are increasingly used for autonomous missions in complex environments where traditional navigation methods are insufficient. In particular, operating in GNSS-denied, visually degraded, and cluttered environments presents significant challenges due to limited environmental observations and freedom of movement. The ability to make intelligent decisions under uncertainty is crucial for UAVs performing critical tasks such as search and rescue.
The key challenges identified are the following:
  • Limited and noisy observations: Constrained UAV platforms often rely on limited onboard sensors such as thermal cameras, LIDARs, and IMUs, which provide incomplete and uncertain information about the environment.
  • Dynamic and cluttered environments: UAVs must operate in spaces where obstacles limit freedom of movement and visibility conditions constantly change.
  • Computational constraints: UAVs must process real-time sensor data and execute decision-making algorithms efficiently on embedded hardware.
  • Decision-making: UAVs need to plan sequences of actions that maximize mission success while handling uncertainty in perception and state estimation.
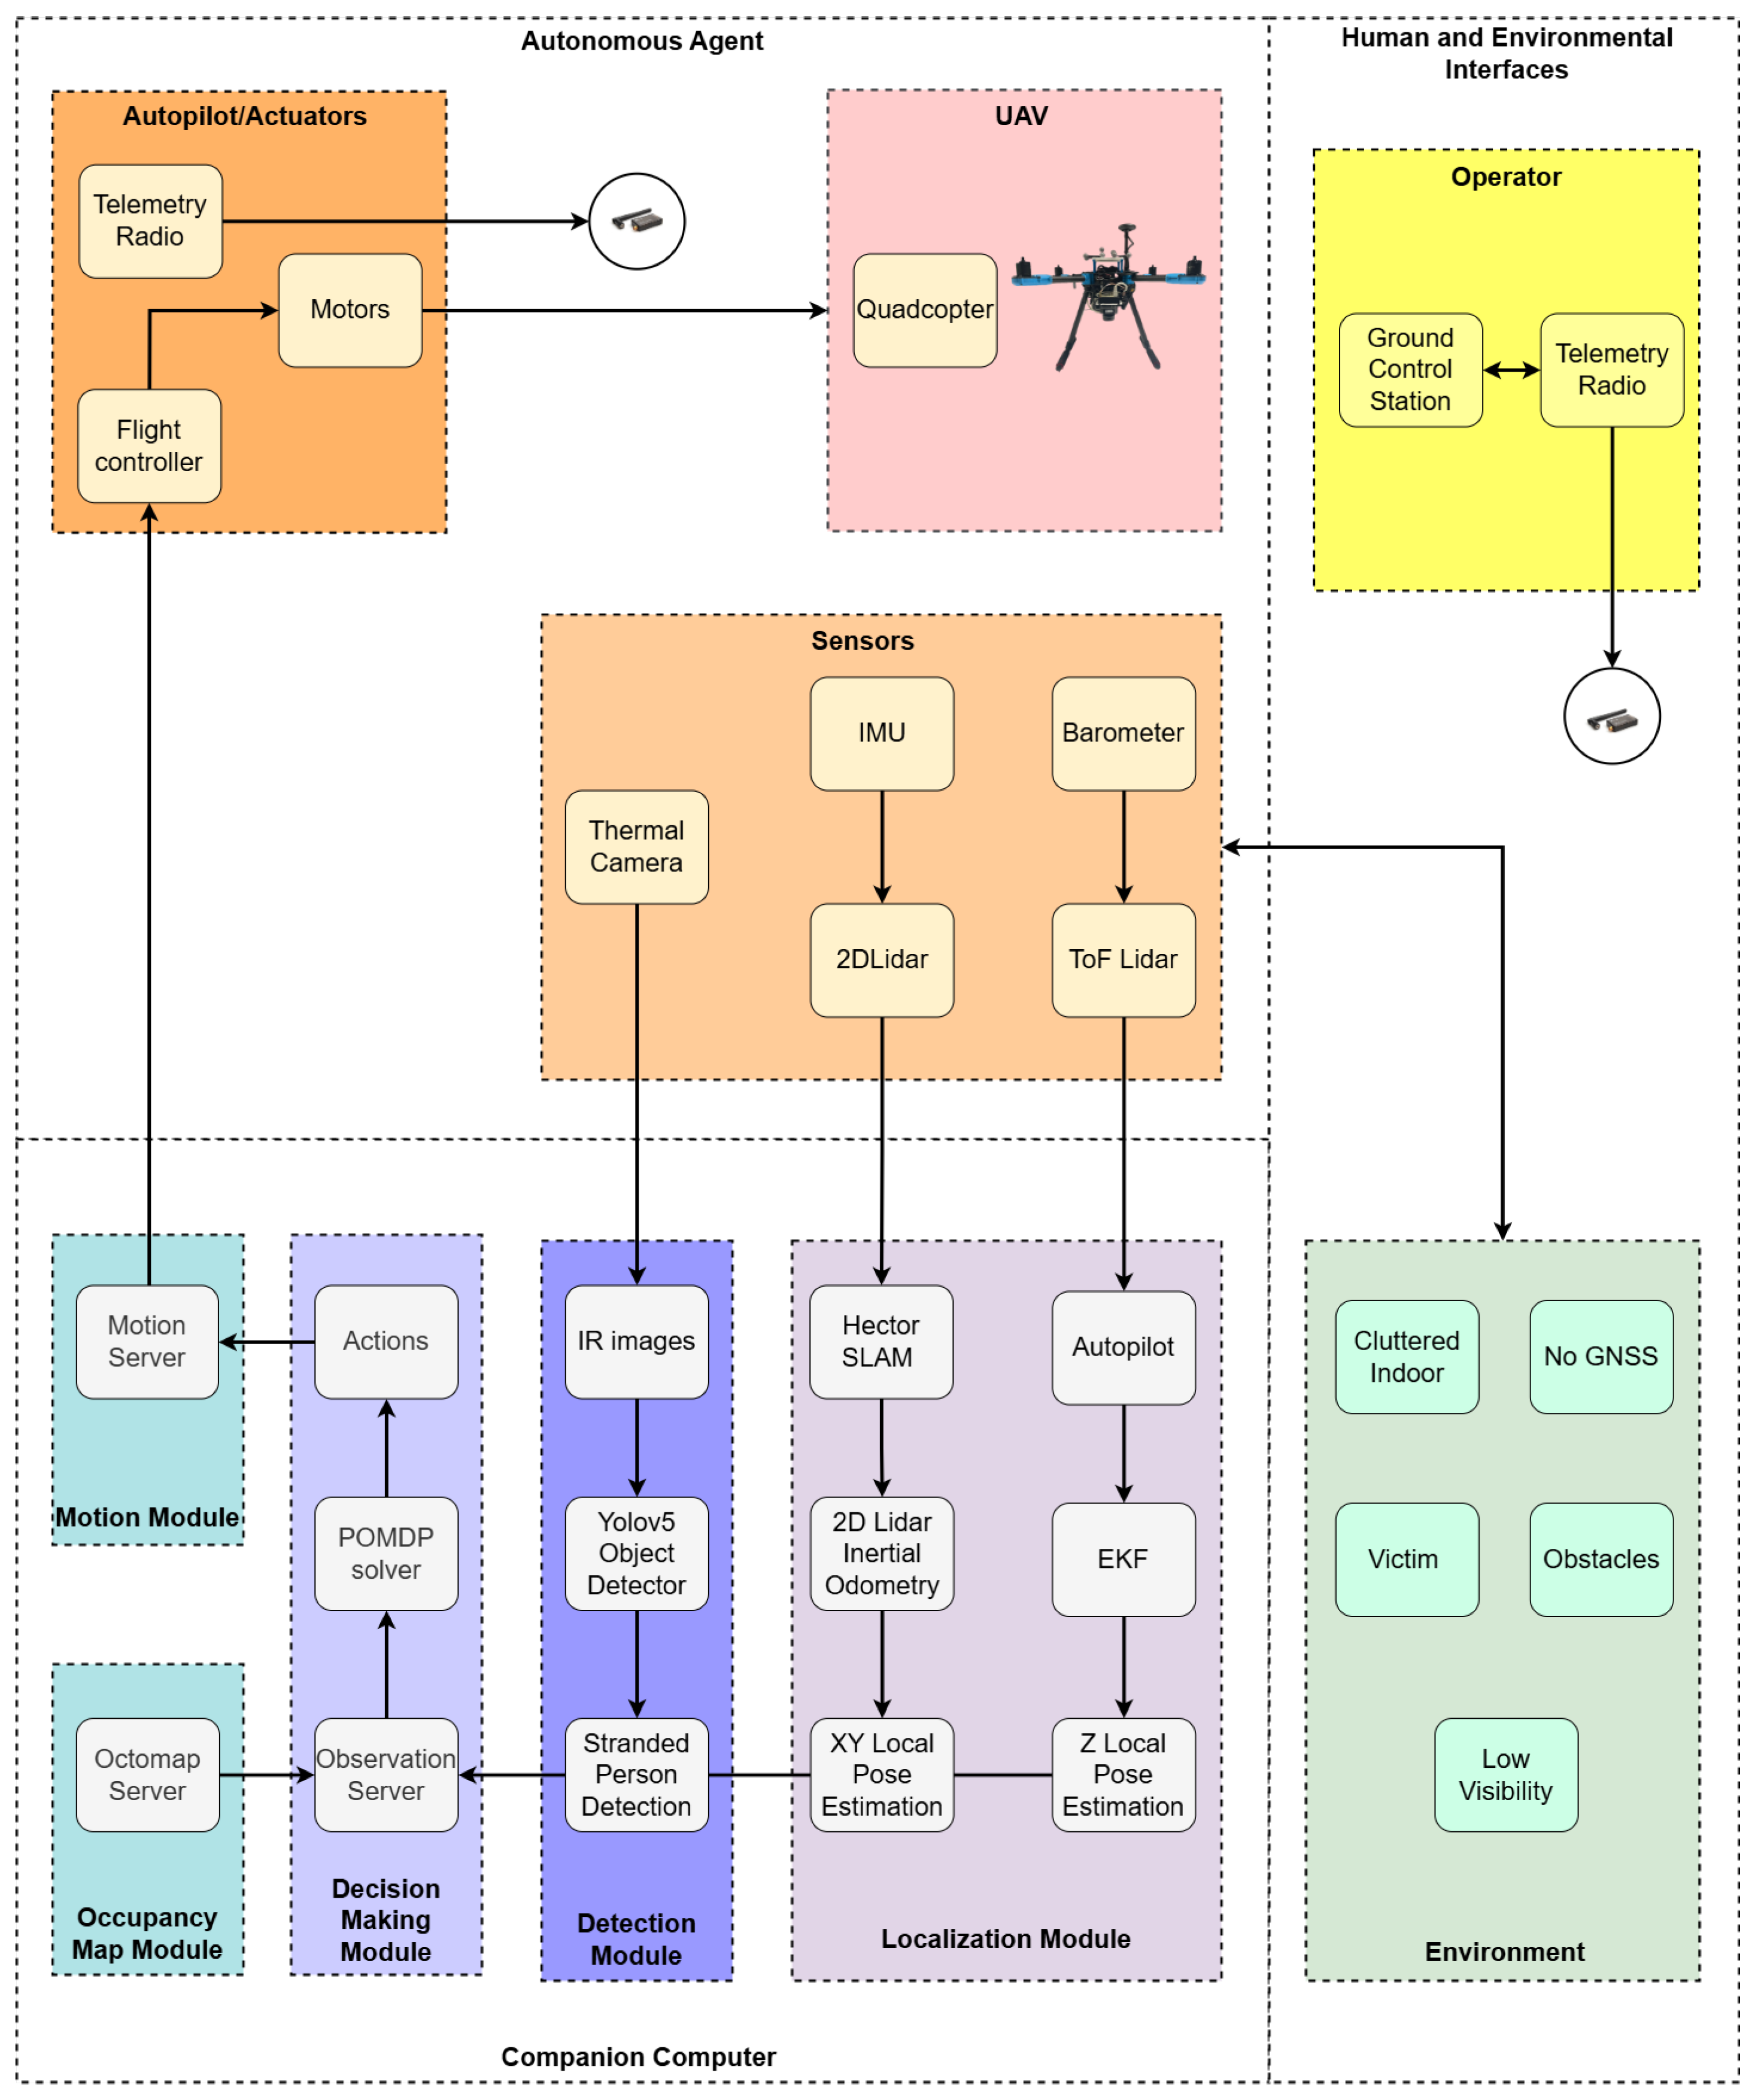
The goal of this work is to develop an autonomous UAV capable of making optimal decisions in partially observable environments. Sequential Decision Processes (SDPs) and RL are fundamental concepts in uncertainty-driven decision-making. An SDP involves an agent, in this case a drone, required to make a series of decisions over time from a series of observations, where each decision influences future states and actions. RL is a branch of machine learning in which the UAV learns what actions to take from interactions with the operational environment to maximize some notion of cumulative reward. However, the environment in which the system will operate is defined by an unavailable GNSS, degraded visibility, and obstacles, increasing uncertainty levels and causing partial observability.
In this context, the problem transforms into a POMDP, where the drone must make decisions based on incomplete observations and maintain a belief state. In fact, the POMDP models the uncertainty from its partially observed states using a probability distribution over the system states. To formulate a POMDP problem for autonomous navigation of UAVs, the set of actions A must be restricted to its functional capabilities within the environment. The set of states S should describe the possible states of the environment and drone. An action  a A  causes a state change from  s S  to  s S , and the change in state is quantified by a reward r. The reward system is a capital element, as it influences the behavior of the drone by rewarding certain states (e.g., finding the target, exploring new areas), and penalizing others (e.g., collision with an obstacle). An illustration of the interaction between the agent and the environment in a POMDP process is shown in Figure 1. The goal of a POMDP is to compute actions sequentially while maximizing the final sum of all discounted rewards. This is called a policy and is indicated by  π .
A POMDP is modeled using the following tuple:  ( S , A , O , T , Z , R , γ )  [4]. S is a finite set of states, A is a finite set of actions, and O is a finite set of observations that the UAV can perceive. The transition from one state to the other  s s  following an action a is modeled by the transition function  T ( s , a , s ) = P ( s | s , a ) . Because the POMDP has observation and state uncertainty, the distribution function Z is required to model the likelihood of observing o after each executed action from the set A. R is the set of rewards that encourage or discourage certain actions, and  γ  is the discount factor.  γ  determines the importance of future rewards in relation to immediate rewards, and  γ [ 0 , 1 ] . If  γ = 0 , the agent cares only for immediate rewards, and if  γ = 1 , the agent encourages long-term planning. Compared to an MDP, in which the robot is assumed to have perfect knowledge of its current state, the robot state is modeled as a distribution function. Consequently, a state is represented by a belief symbolized by b, with  b B .
To solve the problem and obtain the optimal sequence of actions, the POMDP initially plans from an initial belief  b 0  given by the initial conditions of the mission of the UAV. The belief probability distribution is updated for each observation made by the drone. The optimal sequence of actions in a POMDP is called optimal policy  π : B A , which maps belief states to actions and maximizes the total expected discounted return. Equation (1) represents the mathematical expression of the optimal policy.
π : a r g m a x π E r = 0 γ t r R S t r , π ( b t r ) | b t 0 , π

3. System Design

The framework developed in this research is described by the system architecture diagram shown in Figure 2. It allows a quadcopter to perform autonomous navigation in complex environments. This system architecture splits the developed framework into three categories: the companion computer, autonomous agent, and human and environmental interfaces. The companion computer is responsible for computing the decision-making, localization, and detection modules. Each sequential action is generated by the decision-making module, which is mainly made up of the POMDP solver and observation server. The latter manages all the information and data required by the former. In this case, the data include the local pose estimation generated by the localization module, detections from the detection module, and a 3D occupancy map used for obstacle avoidance. The motion module then receives the outputted actions from the POMDP solver, which are sent to the autonomous agent, and more precisely to the flight controller. The autonomous agent category consists of the autopilot and actuators, UAV, and sensor modules. After receiving the actions from the motion module, the flight controller processes the control signals to the motors, allowing the UAV to perform the decision made by the POMDP algorithm. The sensors in this framework consist of an IMU, barometer, and LIDARs used by the localization module, and a thermal camera used by the detection module. The indoor environment is characterized by low visibility conditions, several obstacles that limit the freedom of the agent, the lack of a GNSS, and the victim with a position unknown by the agent.

4. POMDP Formulation

The decision-making module will be covered in this section. It receives incomplete observations of the environment from sensors and outputs actions from these uncertain observations. Hence, the decision-making problem is formulated as a POMDP. The TAPIR software (commit e2c0da7) [38] enables one to model a POMDP problem using an online solver discussed in Section 4.1 and C++. To formulate the POMDP problem for the autonomous navigation of a quadcopter in GNSS-denied and visually degraded environments, the following assumptions are employed:
  • The POMDP algorithm starts outputting actions when the agent reaches a predefined initial waypoint.
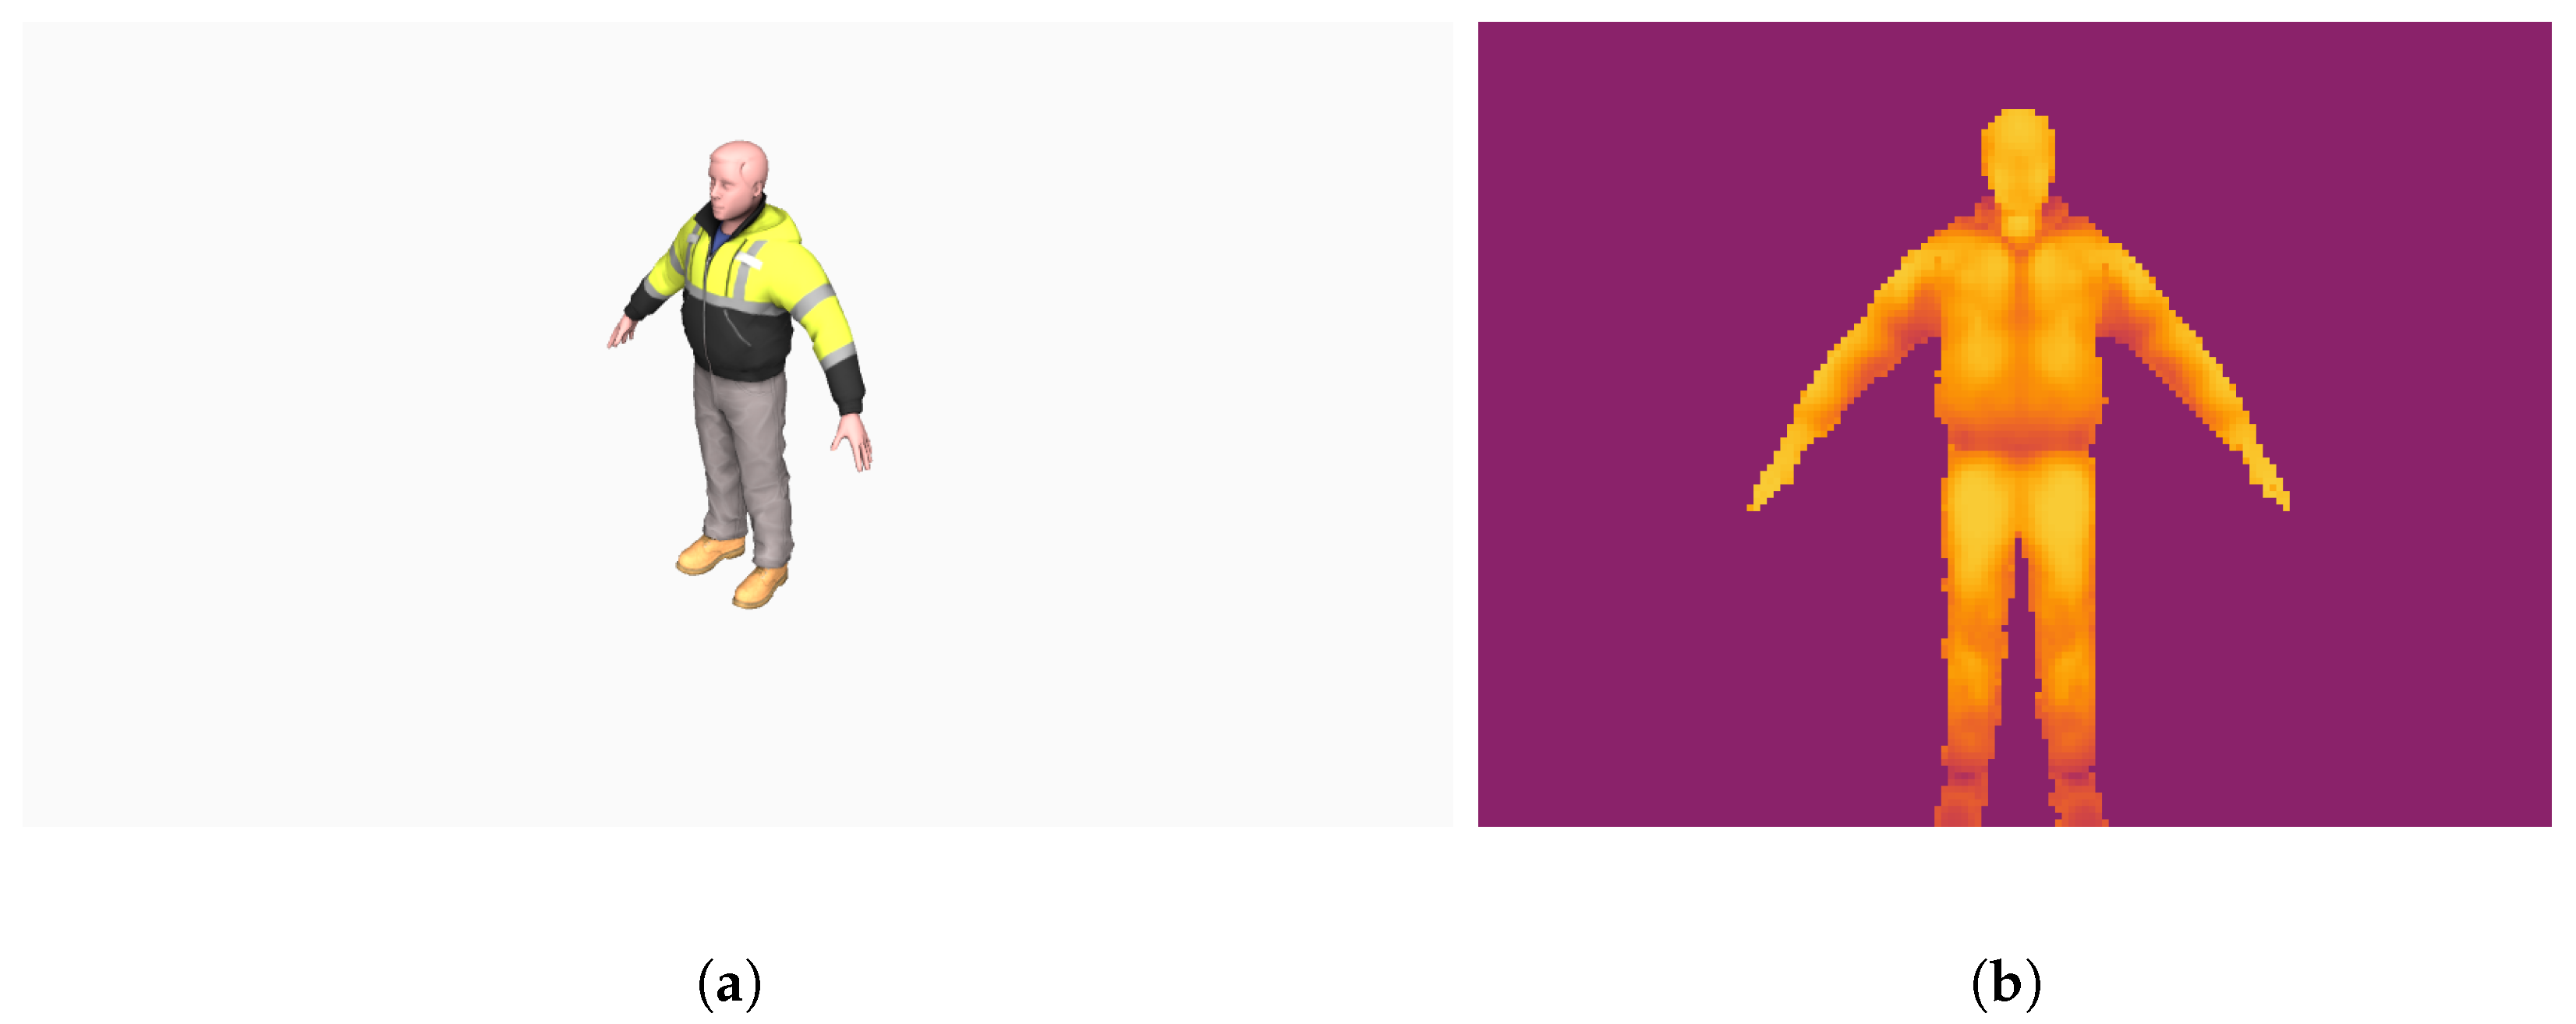
  • Observations consist of thermal imagery from the thermal camera and local pose estimation from the LIDARs, IMU, and barometer.
  • The POMDP problem is formulated to find and detect a single target.
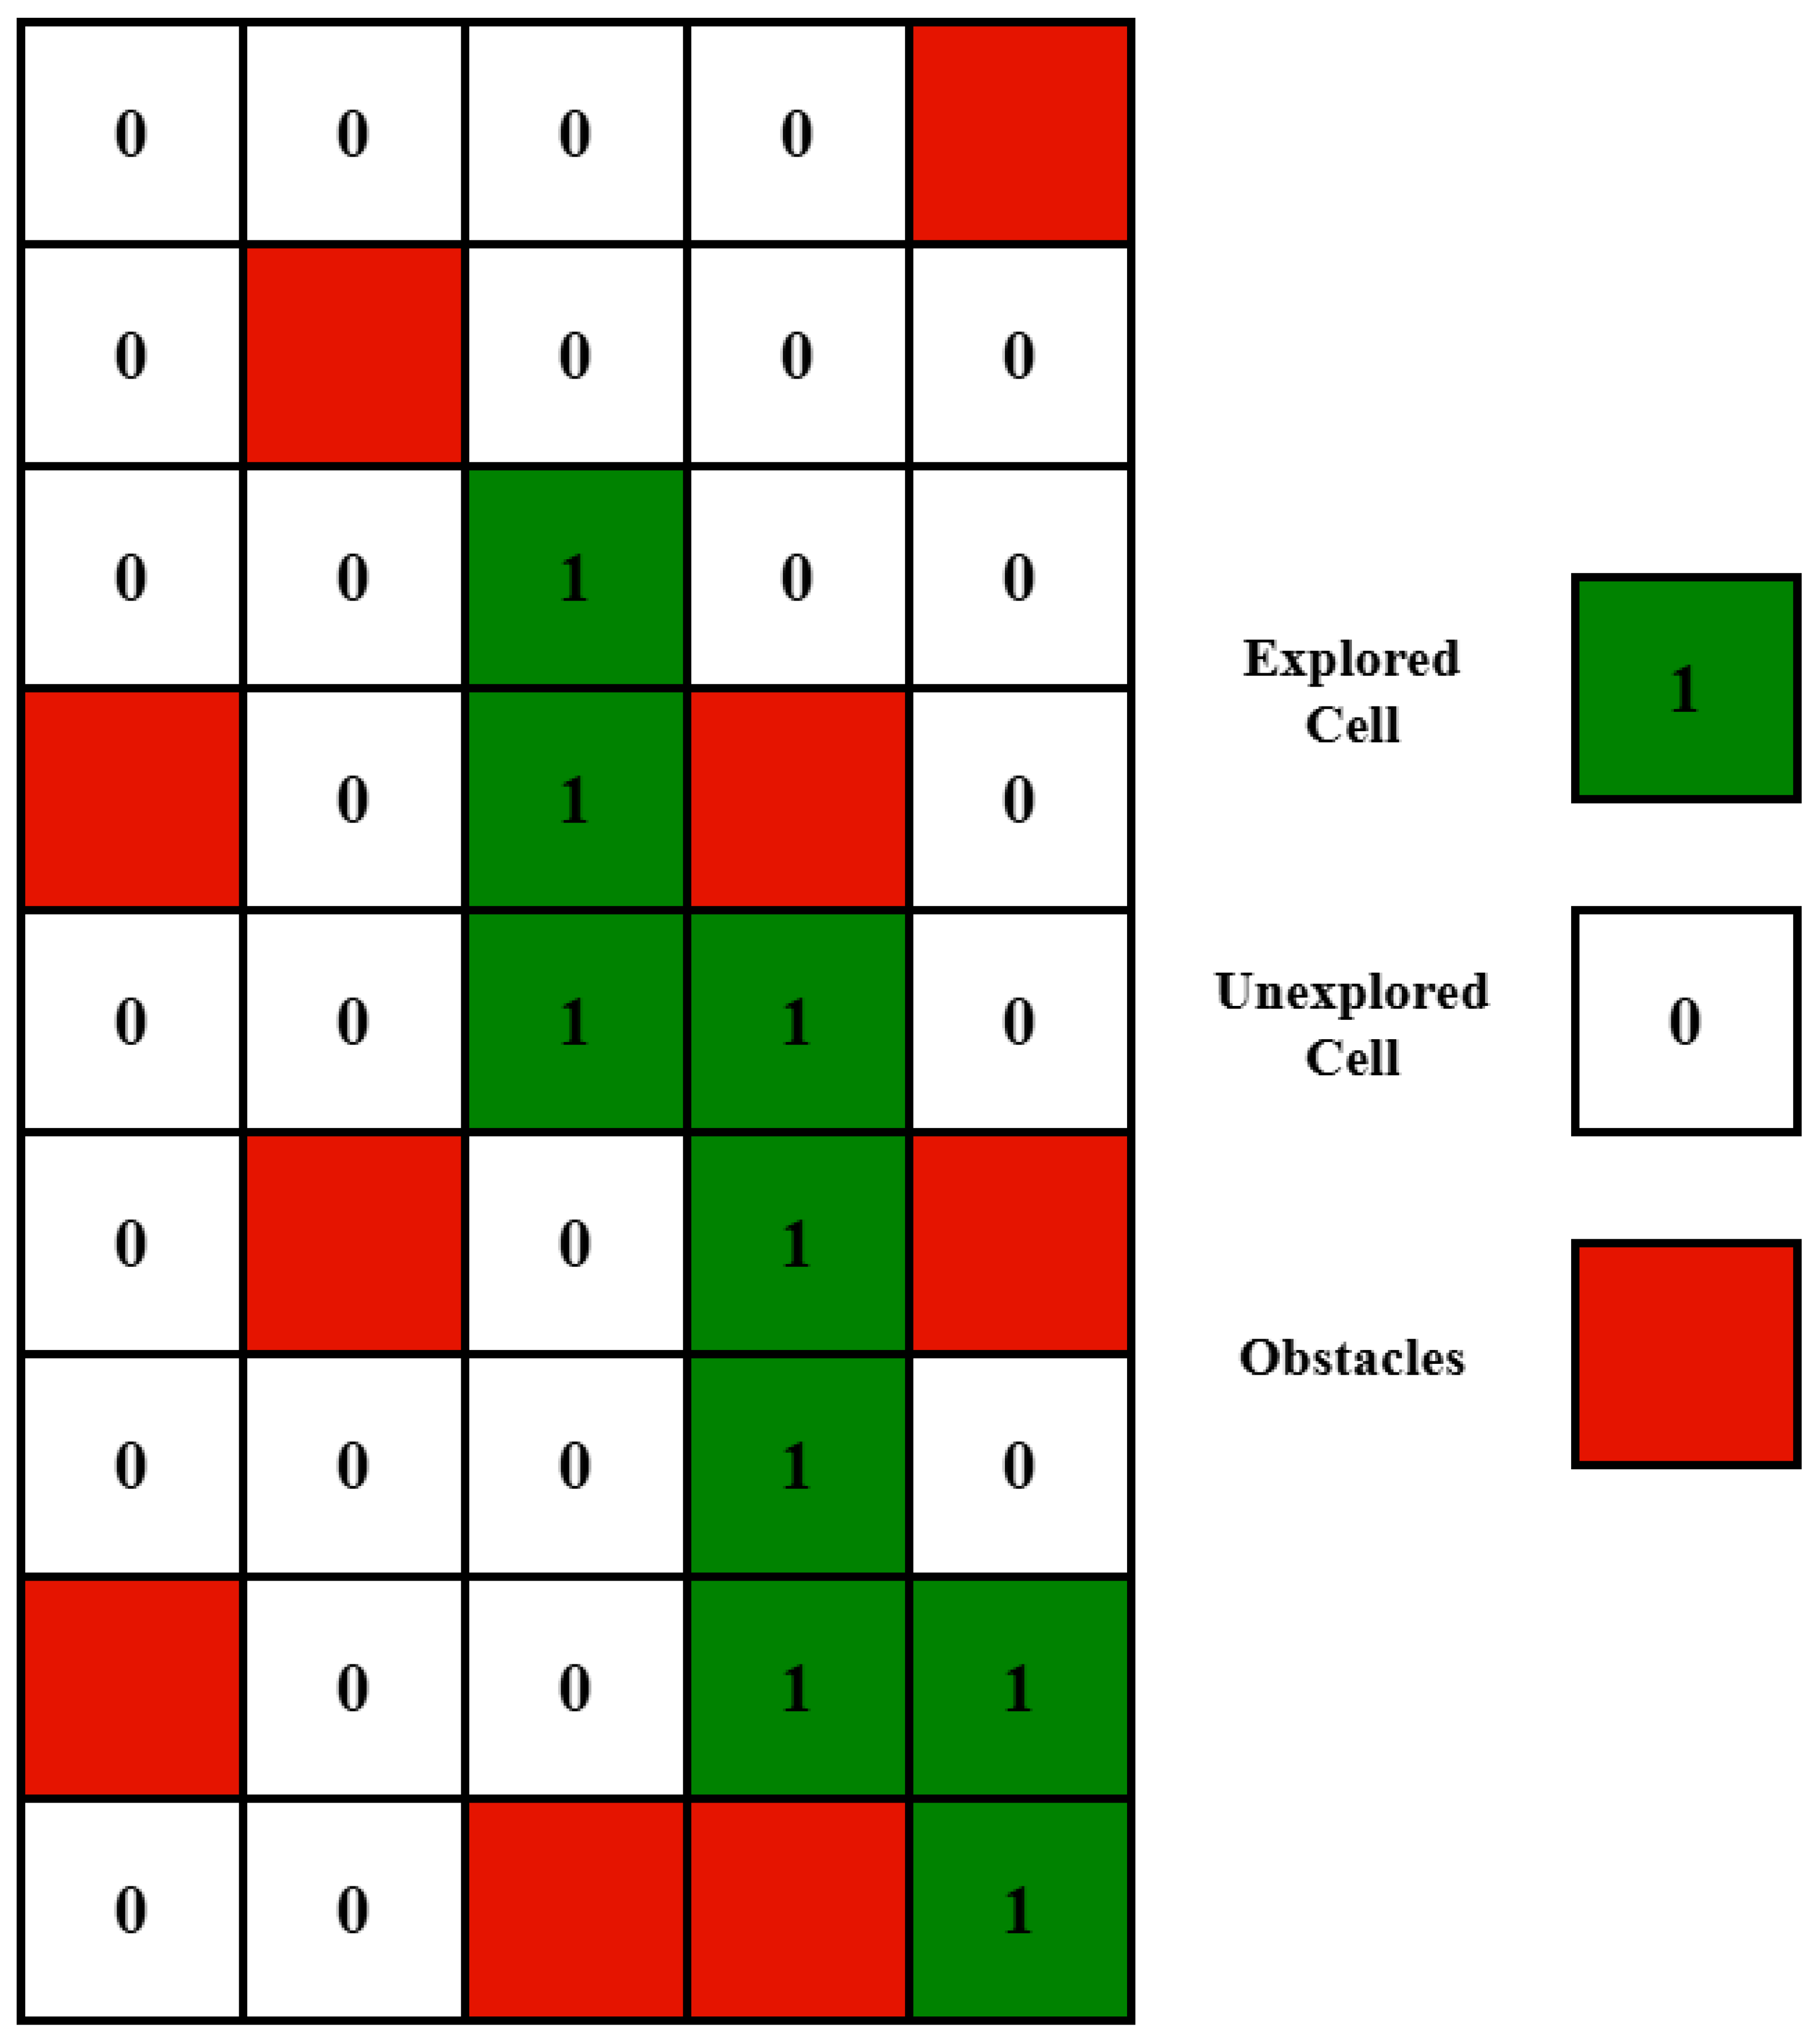
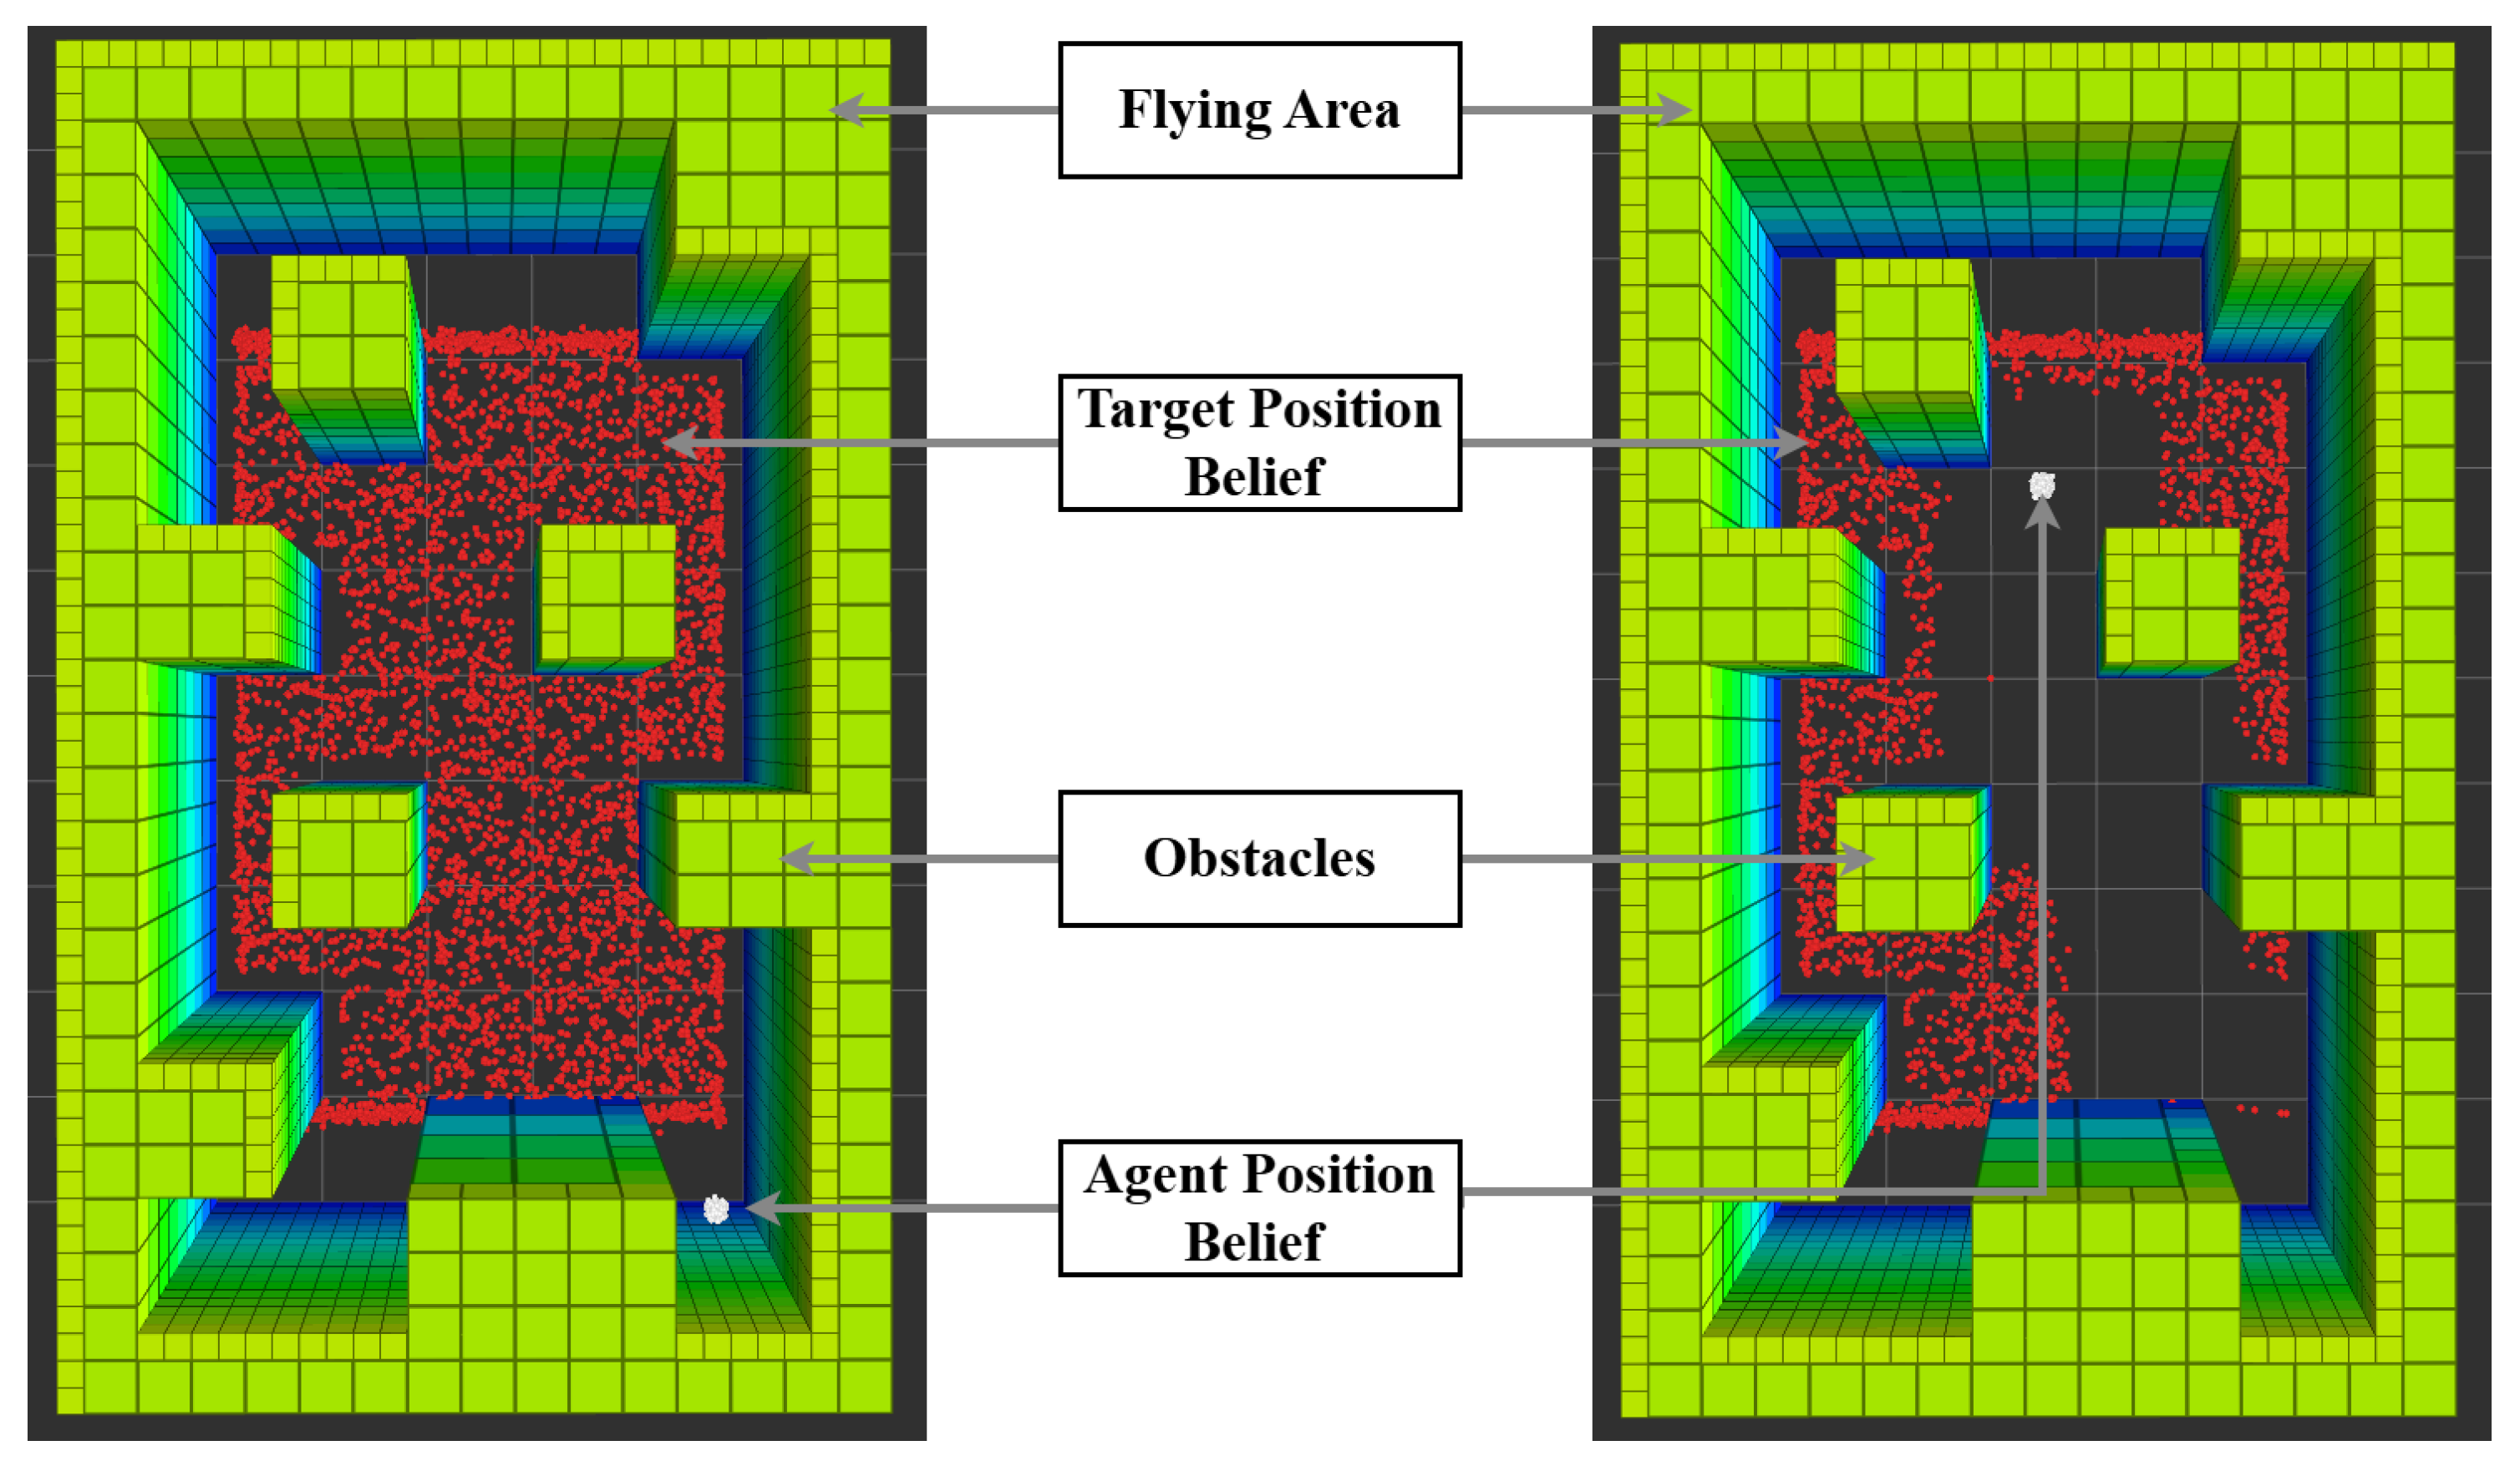
  • The map of the environment is assumed to be known to the agent, with a 3D occupancy map being preloaded and used in the decision-making process.
  • The detection of the target or the maximum flight time concludes the mission.
  • Obstacles and the victim are not dynamic and do not change position during the mission.
  • The drone’s set of actions is limited to translations with no rotations.
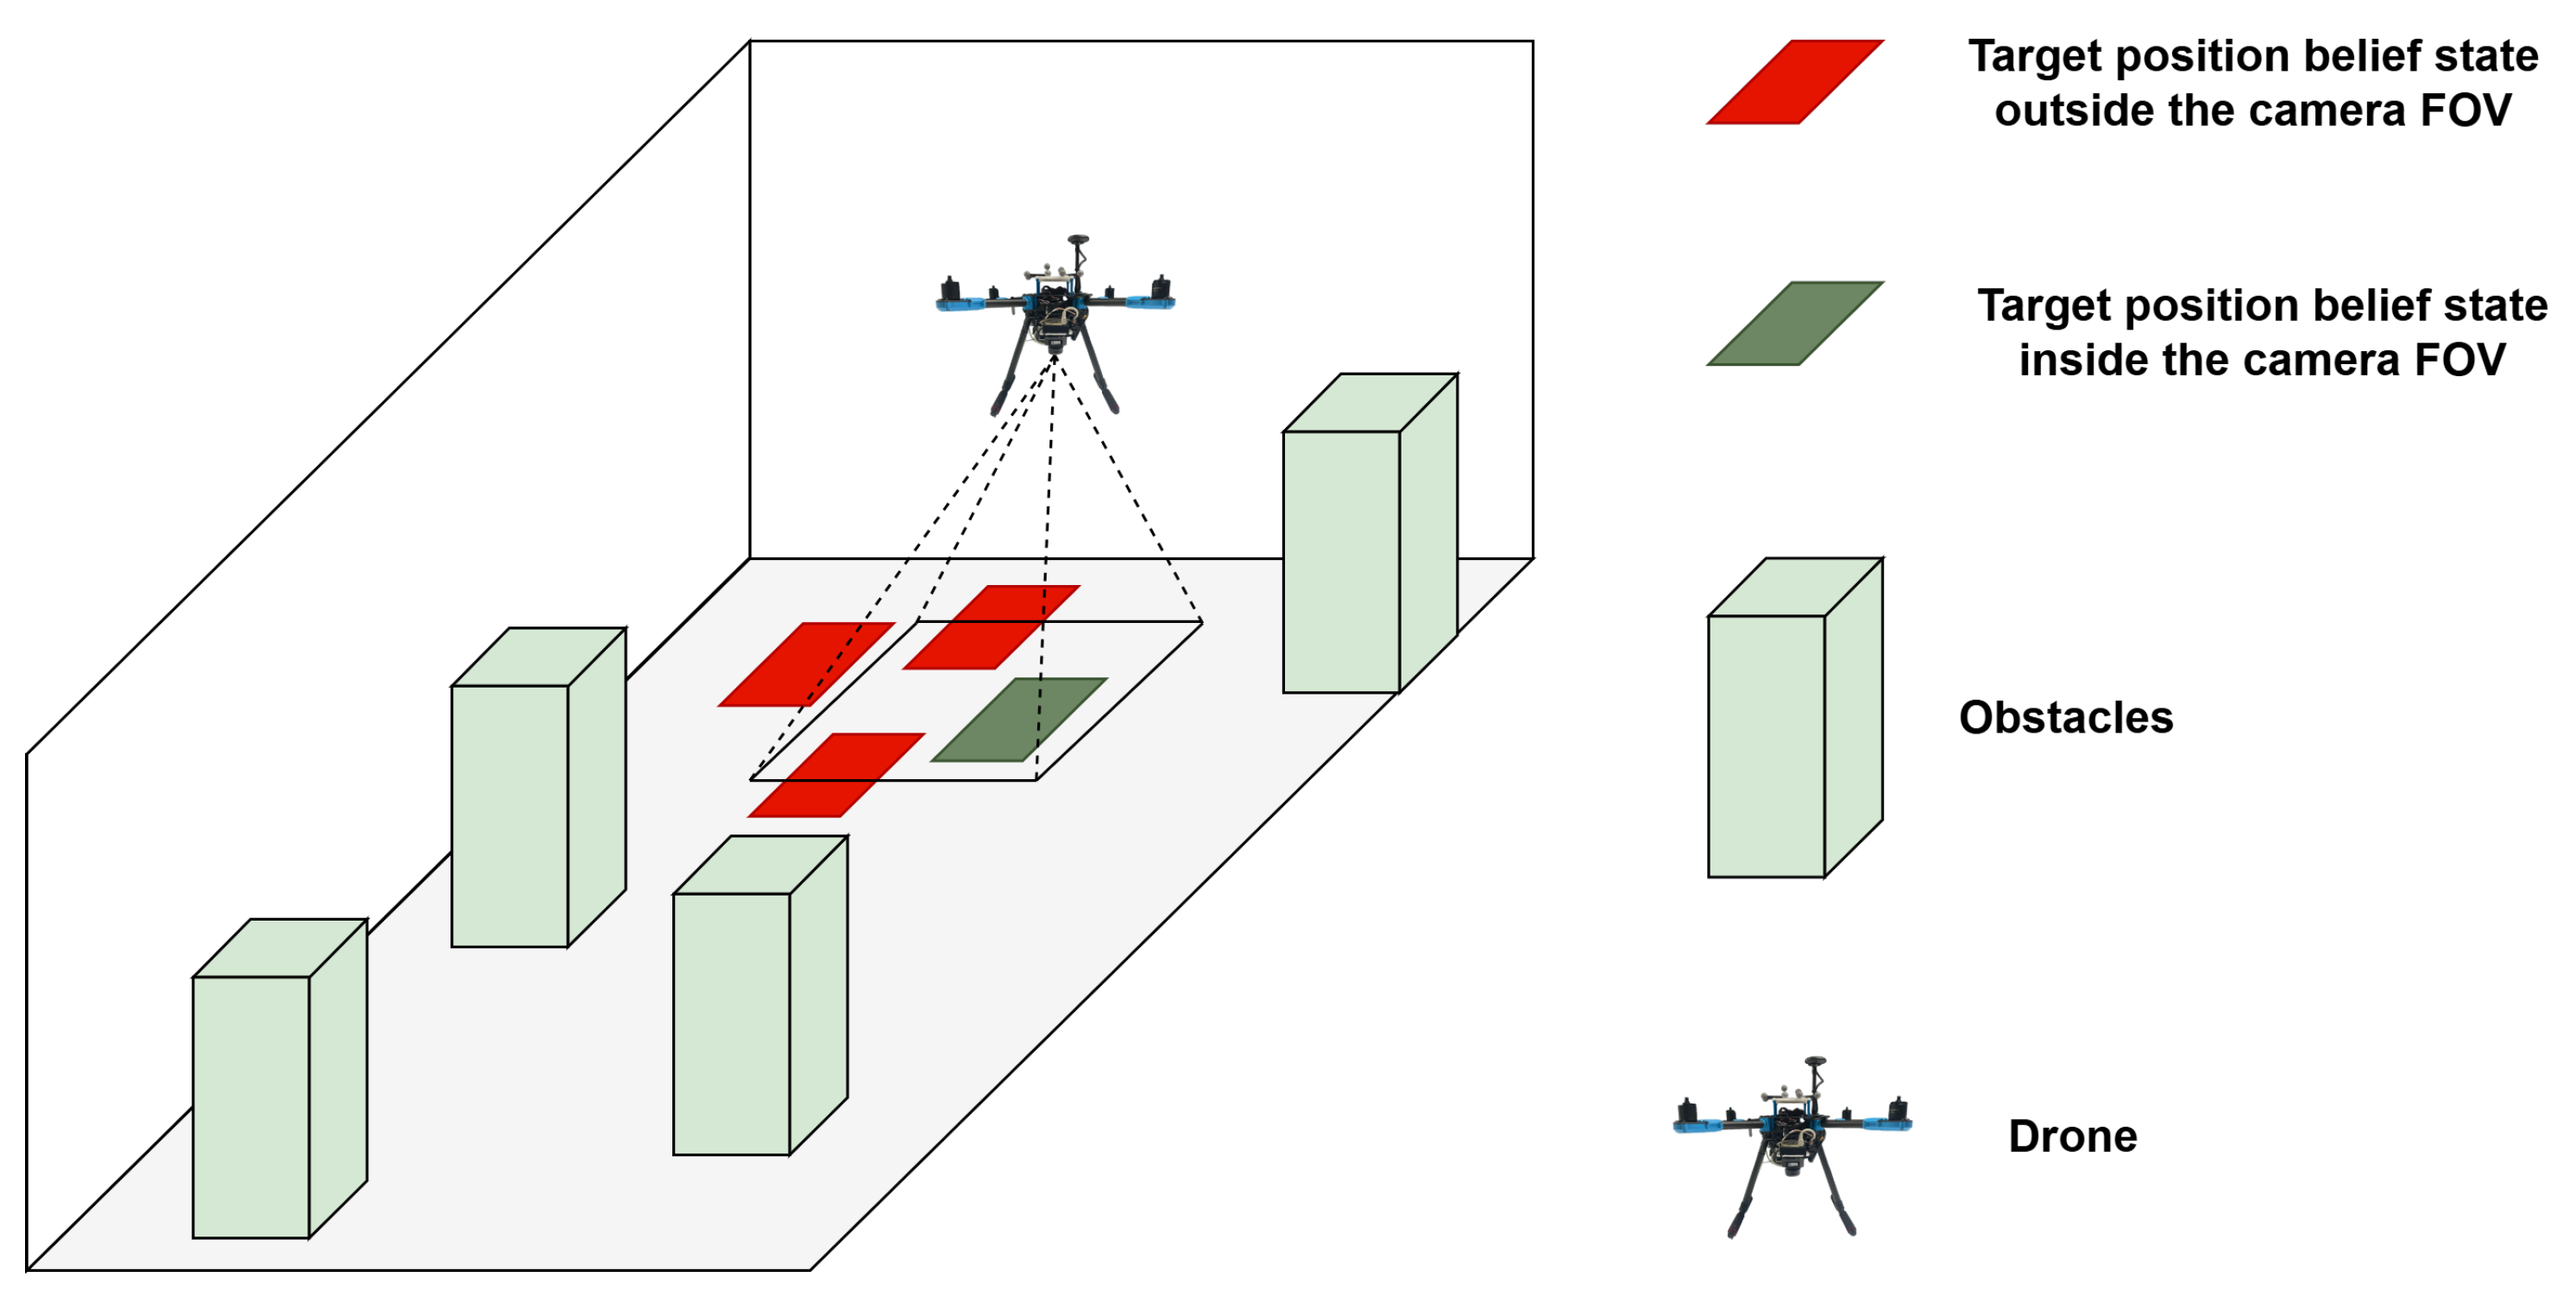
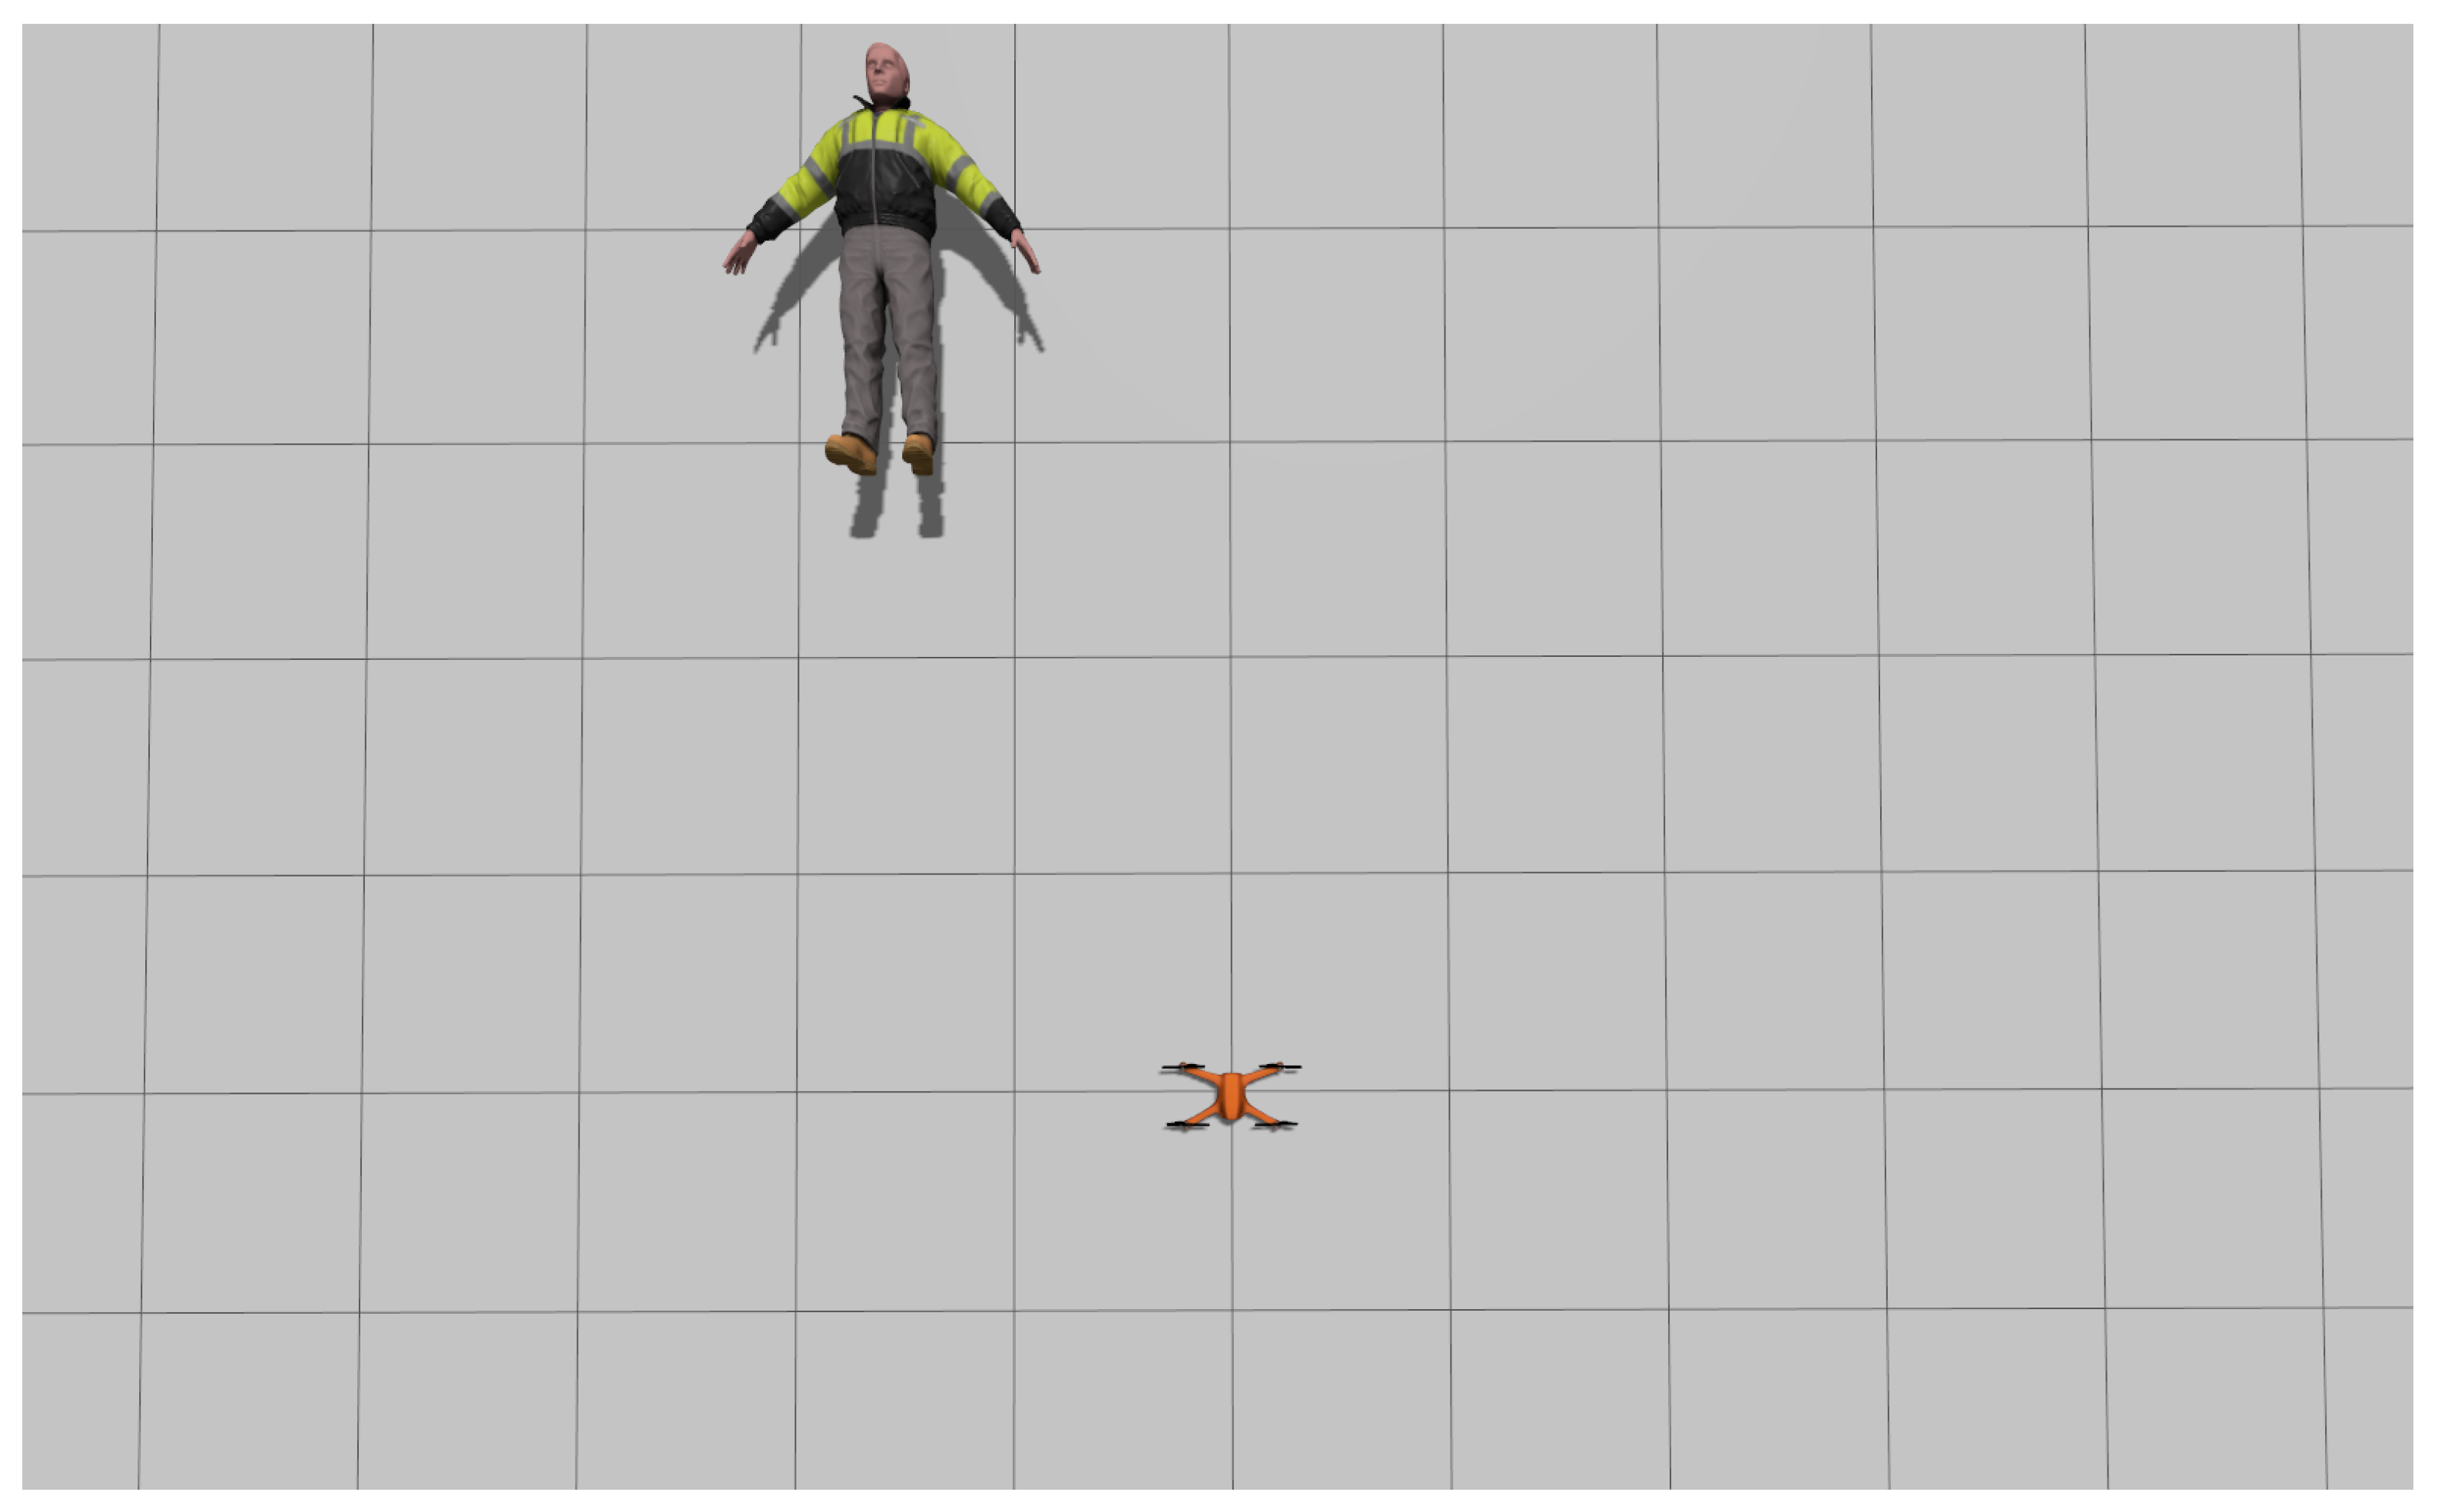
  • The thermal camera is assumed to be mounted facing downward.
  • The altitude of the UAV is assumed to be known with little to no uncertainty.

4.1. POMDP Solver

POMDP solvers can be divided into two categories: offline solvers, which compute the policy “offline” before execution without the ability to update it during the mission, and online solvers, which continuously calculate and update the optimal policy in real time during operation [5]. For this research, the ABT solver [39] was chosen as it allows the reuse and refinement of the existing policy in response to changes in the POMDP model. Online solvers were prioritized because they are more suitable for exploration tasks in fully stochastic and unknown environments, as this is the final objective of this research. Additionally, it can model states and actions as continuous through a generative model. The ABT algorithm consists of two main components: a pre-processing stage that computes an initial policy offline and a runtime process that updates the policy during the mission.

4.2. State–Action Transition Model

In this work, the general state space S is composed of the state spaces of the UAV (agent) and the victim (target), such that  S = ( S a , S t ) . The agent state space,  S a = ( p a , o a , f c , f r , f e ) , models the physical state of the UAV and key mission-related flags. The position  p a = ( x a , y a , z a )  defines the UAV’s coordinates in 3D within the map frame, while the orientation  o a = ψ a  denotes the UAV yaw (heading). The discrete flags  f c f r , and  f e , respectively, indicate if the agent has crashed into an obstacle, exited the predefined region of interest (ROI), or completed the exploration of the environment. These flags act as terminal conditions and influence the reward function and policy decisions accordingly. The target state,  S t = ( p t , b t , f t ) , represents the target as a bounding box to reflect the output of a real-time object detection algorithm. The position  p t = ( x t , y t , z t )  is the estimated center of the victim in 3D coordinates. The bounding box  b t = ( x t l , y t l , x b r , y b r )  describes the coordinates of the top left and bottom right pixels of the detected target. This allows the target’s representation to remain consistent with modern perception systems and is directly related to the camera’s field of view (FOV) and the observation model covered in Section 5. The Boolean flag  f t  indicates whether the victim has been detected and serves as a terminal flag when the task is completed. This formulation aligns both the spatial constraints of the agent and the perception capabilities of the system with the belief update process of the POMDP.
Seven low-level actions are proposed in this problem formulation, as highlighted in Table 1. The action set includes moving Forward, Backward, Left, Right, Up, and Down, as well as maintaining a stationary state with the Hover action. Each action updates the position of the UAV based on predefined step transient responses  Δ x Δ y , and  Δ z .
The dynamic model of a quadrotor defined in [40] was used to model the transition function used in this system. The ability of the drone to move from one position in time step t to another at  t + 1  is highlighted in Equations (2) and (3). In these equations,  Δ p r t  is the difference in location between two successive time steps. As the POMDP models the action uncertainty, an angle deviation  φ a  is also included in the rotation matrix. The agent dynamic is simplified with no rotations.
p a t + 1 = p a t + R a t Δ p a t
x a t + 1 y a t + 1 z a t + 1 = x a t y a t z a t + c o s ( φ a t ) s i n ( φ a t ) 0 s i n ( φ a t ) c o s ( φ a t ) 0 0 0 1 Δ x a t Δ y a t Δ z a t

4.3. Reward Function

After taking an action a in state s, the reward r is calculated using the reward function  R ( a , s ) . To guide the UAV toward safe, efficient, and purposeful exploration in a cluttered environment, the agent must balance exploration, safety, and mission objectives. Algorithm 1 provides a clear and modular implementation of the reward function, explicitly mapping observed events (e.g., crash, out-of-bounds, victim found) to corresponding rewards. This structure allows other researchers to easily modify, extend, or adapt the reward function to new mission scenarios. Algorithm 1 summarizes how  R ( a , s )  is implemented incorporating obstacle avoidance, safe exploration within ROI, and victim location. Table 2 shows the rewards and their corresponding values used in the POMDP formulation.
Algorithm 1 Reward function algorithm
  1:
0
  2:
if    c r a s h  then
  3:
  r  r + r c r a s h
  4:
end if
  5:
if    o u t  then
  6:
  r  r + r o u t
  7:
end if
  8:
if    a l t  then
  9:
  r  r + r a l t
10:
end if
11:
if    f o u n d  then
12:
  r  r + r f
13:
end if
14:
if    e x p l o r e d  then
15:
  r  r + r e x p l o r e d c o u n t
16:
else
17:
  r  r + r n e w
18:
end if
19:
return r
To avoid actions that force the agent into undesirable states, negative rewards are implemented. Both  r c r a s h  and  r o u t  have negative values.  r c r a s h  is used when a collision between the quadcopter and obstacles occurs, and  r o u t  when the agent leaves the ROI.  r e x p  is also a negative reward that discourages the agent from exploring areas of the environment already explored. This negative reward increases every time the agent re-explores areas. In contrast, positive rewards are used to encourage certain actions, such as  r f  to find the victim,  r n e w  to explore new areas, and  r a l t  to stay in the restricted altitude range.
Efficient exploration is critical in this problem, as the target location is initially unknown. To support this, the environment is discretized into a 2D occupancy grid where each cell covers a 1 × 1 m area. Each cell stores its corner coordinates, a Boolean value indicating whether it has been visited, and a counter that records how many times it has been observed by the UAV. A cell is marked as explored when the estimated position of the UAV falls within its limits. This grid-based memory enables the UAV to prioritize unexplored regions and avoid redundant paths. As shown in Figure 3, the environment is visually represented in white (unexplored), green (explored), and red (obstacle) cells, with the visit count displayed in the center of each explorable cell.

5. Observation Function

In previous work [34,36], challenges were found in the form of altitude management for target detection using POMDP. The solution used in these papers was to introduce an altitude reward, which encouraged the UAV to achieve a predefined altitude known to increase the detection rate. However, this reward was later identified to restrict the drone’s freedom of movement as it forces it to a fixed altitude. The failure of the drone to autonomously determine the optimal detection altitude resulted from the representation of the target in the POMDP. In fact, the victim and its observation were represented by a 2D point. The observation function described in this section incorporates a realistic representation of the target’s detection by augmenting the state and observation vectors to include the dimensions and coordinates of a bounding box that represents the target’s detection within the image frame. This enhancement enables the agent to maintain a sufficient altitude to detect the victim without restricting its freedom of movement and actions. This observation function was first developed in [35], but only in simulation. This section will also cover the localization and detection modules as they provide the observations used by the POMDP solver.
Equation (4) shows the observations used in this research, where  o p a  is the local pose estimation of the agent;  o p t , the local pose estimation of the center of the target bounding box; and  o p b , its corresponding bounding box.  o t f  and  o o d  are both discrete observations that describe if the target has been detected and if the drone is close to an obstacle.
O = o p a , o p t , o p b , o t f , o o d

5.1. Agent: Localization, Observations, and Belief State

The localization module in this work comprises two parts. The first includes a 2D LiDAR, an IMU, and a 2D LiDAR/Inertial odometry algorithm for 2D (X and Y) local pose estimation. The 2D odometry algorithm is run on the companion computer. The second consists of a ToF LiDAR, a barometer, and the autopilot running an Extended Kalman Filter to fuse both data sources. To perform pose estimation, the Hector SLAM package (commit f0f1eb2) [41] was chosen. It uses a 2D LiDAR and IMU to provide X and Y pose estimates at the sensor scan rate. More information about the 2D LiDAR used in this research will be covered in Section 6.4. The system estimates the pose X and Y by combining the 2D LiDAR and IMU data to create a map of the indoor environment, simultaneously localizing the quadcopter within it. In this research, the computed map is not used in the POMDP formulation and decision-making; only the pose estimation process is utilized. LiDAR provides range measurements and detects surrounding environmental features, which Hector SLAM uses to generate a 2D occupancy grid map through scan matching. The autopilot IMU provides orientation and acceleration data, improving the stability and accuracy of pose estimation. The Hector SLAM package ensures reliable X and Y position estimation in GNSS-denied environments via sensor fusion. For the estimation of the Z pose, a ToF LiDAR, a barometer, and the autopilot are used. The fusion of LiDAR and barometer data improves altitude estimation. LiDAR is accurate for indoor, low-altitude, and short-range measurements, and the barometer gives consistent altitude measurements over a broader altitude range but loses accuracy in indoor environments. Integrating the ToF LiDAR within the autopilot ensures constant and reliable Z pose estimation, even if communication with the companion computer is lost, increasing the safety of the overall system. More information about ToF LiDAR will be given in Section 6.4. To summarize the localization system, let us represent the pose of the UAV as the state vector s as shown in Equation (5) and the sensor measurements u as shown in Equation (6).  u x  and  u y  are from the fused 2D LiDAR and IMU data, and  u z  is from the ToF LiDAR and barometer.
s = X Y Z
u = u x u y u z
The system fuses the sensors’ input to update the state. Let A represent the dynamic model (how states evolve over time); B, the input vector of the sensors; and w, processing noise. Equations (7) and (8) model the pose estimation process, with coefficients  b i j  representing the contributions of each sensor to the corresponding pose component.
s t + 1 = A s t + B u t + w t
X t + 1 Y t + 1 Z t + 1 = 1 0 0 0 1 0 0 0 1 X t Y t Z t + b 11 b 12 0 b 21 b 22 0 0 0 b 33 u x u y u z + w x w y w z
The agent’s belief over its own state is represented as a Gaussian distribution centered at the estimated pose, with variance determined by the expected sensor noise. Therefore, the belief state  b a ( s )  models the estimated position of the UAV  ( x , y , z )  with a mean  μ  provided by the localization system and a standard deviation  σ  selected based on real-world and simulated test results. Observations of the agent are restricted to its own local pose, and these are used to update the belief at each time step.

5.2. Target: Detection, Observation Model, and Belief Update

YOLOv5 [42] was the deep learning model selected to detect the victim using the thermal camera. The selection was based on the relevant literature [43], where several YOLO models were compared for the detection of thermal objects of UAVs. Furthermore, YOLOv5 was not changed from previous work [36] to facilitate the complete integration of the framework. Two different models were used to test the framework, one for simulation and one for real-world testing. Two models were required as the differences between the simulation and the real world were too consequent, especially from the thermal camera and the mannequin. The data set used in the simulation consists of 284 images of the simulated victim collected using the simulated thermal camera. The data set used for real-world testing consists of 2047 thermal images of the mannequin. It was collected using two different drones equipped with thermal cameras. The metrics include precision and recall, as well as the mean average precision at the intersection over union (IoU) of 50% (mAP_0.5) and (mAP_0.95). After more than 300 training epochs, the model recorded 99.9% for precision, 99.1% for recall, 99.5% for mAP_0.5, and 92.1% for (mAP_0.95). These results indicate a strong performance in detecting the thermal mannequin. The risk of overfitting is minimized by the controlled operational environment, and the final model was carefully tested to verify its performance under real experimental conditions. The heated mannequin used in this investigation, as well as live detection using the YOLOv5 model onboard the drone, is shown in Figure 4.
To match the output of detection algorithms such as the one used, the target is represented as a bounding box. The target belief state is composed of its center, top-left, and bottom-right corner coordinates. The target position is unknown; therefore, its belief should be distributed equally in the ROI. To accomplish this, three distributions are used. The center of the bounding box is uniformly distributed, and its width and length are normally distributed based on the average human height and width. The objective was to represent the possible outputs given by a deep learning object detection model and thus model different possible sizes of bounding boxes. For visualization purposes, only the center of the bounding box is shown in the simulation. Figure 5 shows the visualization of the agent and the belief in the target position.
The target observation space includes the coordinates of the center of the bounding box  o p t , and the coordinates of the top-right and bottom-left corner,  o p t l  and  o p b r . For a bounding box from the target belief state to be considered inside the camera’s field of view (FOV), its top-left and bottom-right corners must be inside the calculated footprint area. This observation function assumes that the camera is facing downward with no inclination angle. Figure 6 illustrates how the observation function works. After each executed action, the POMDP solver updates the target belief state utilizing the observed position of the agent to determine the camera footprint area. A bounding box is removed from the target belief state if it is inside the calculated footprint area and if no detection is made. This is depicted in Figure 5, which shows the updated target position belief.

6. Experiments

6.1. Baseline Algorithm

To compare the performance of the POMDP framework, a baseline algorithm was implemented in simulation. A lawn mower pattern integrated with an A* path planner was tested for grid-based navigation. The Breadcrumb package (commit 324d6cc) [44] and the Spar package (commit cd4665e) [45] were used to implement the exploration strategy. The A* algorithm finds the shortest route from a start node to a destination node based on the sum of two costs:  g ( n )  and  h ( n ) . The former is the actual cost from the start node to the current node, and the latter is a heuristic estimate of the cost from the current node to the goal. In this case, the Manhattan distance between the node and the goal is used to estimate  h ( n ) . The A* algorithm then selects the paths with the lowest sum of  g ( n )  and  h ( n ) . The Breadcrumb package listens for an occupancy grid and will advertise a service that can be called to carry out path planning within this grid space. Waypoints forming a lawnmower pattern are provided to the Spar package, which then calls the service, and the A* will output a new list of waypoints that avoid obstacles. This baseline algorithm is computed offline before the mission. Some modifications were made to resemble the POMDP behavior as much as possible by matching the velocity and displacement of 1 m between the waypoints.

6.2. Experiment Setup

The general experiment of this study aimed to test a POMDP framework onboard a UAV for autonomous navigation and target detection in a cluttered indoor environment without a GNSS and under low visibility conditions. Simulation and real-world experiments were conducted to assess the system’s performance. Simulation was used to compare the performance of the framework with the baseline highlighted in Section 6.1. Real-world experiments further tested the system and assessed the feasibility of deploying such a solution under real-life conditions.
The baseline algorithm and the POMDP system were first tested in simulation using the SITL capabilities of the PX4 flight controller software [46], Gazebo, an open source robotics simulator, and ROS. This setup allows us to model sensors and physics with high fidelity and completely recreate the architecture that is used in real-life testing. The sensors were modeled following the specifications of the sensors used in the real-world tests shown in Section 6.4. A simulated victim from [47] was placed in the environment lying down, with its thermal signature captured with the thermal camera, as shown in Figure 7. Figure 8 shows the simulated environment.
Real-world experiments took place in the indoor flying area of QUT, located at O134, 2 George Street, Brisbane City, QLD, 4000. A net was used around the flying area, and the area was 9 m long, 5 m wide, and 4 m high. To recreate a human heat signature, several heat packs and heated clothing were placed on a mannequin of average human size. Normal visibility conditions were simulated with ambient lights, while low visibility was created by reducing light levels and making the room as dark as possible. Figure 9 shows the flying area under normal and low-light conditions. The target remained static during the experiments, and only lighting conditions were considered stochastic. Obstacles were only simulated and were not physically in the ROI.

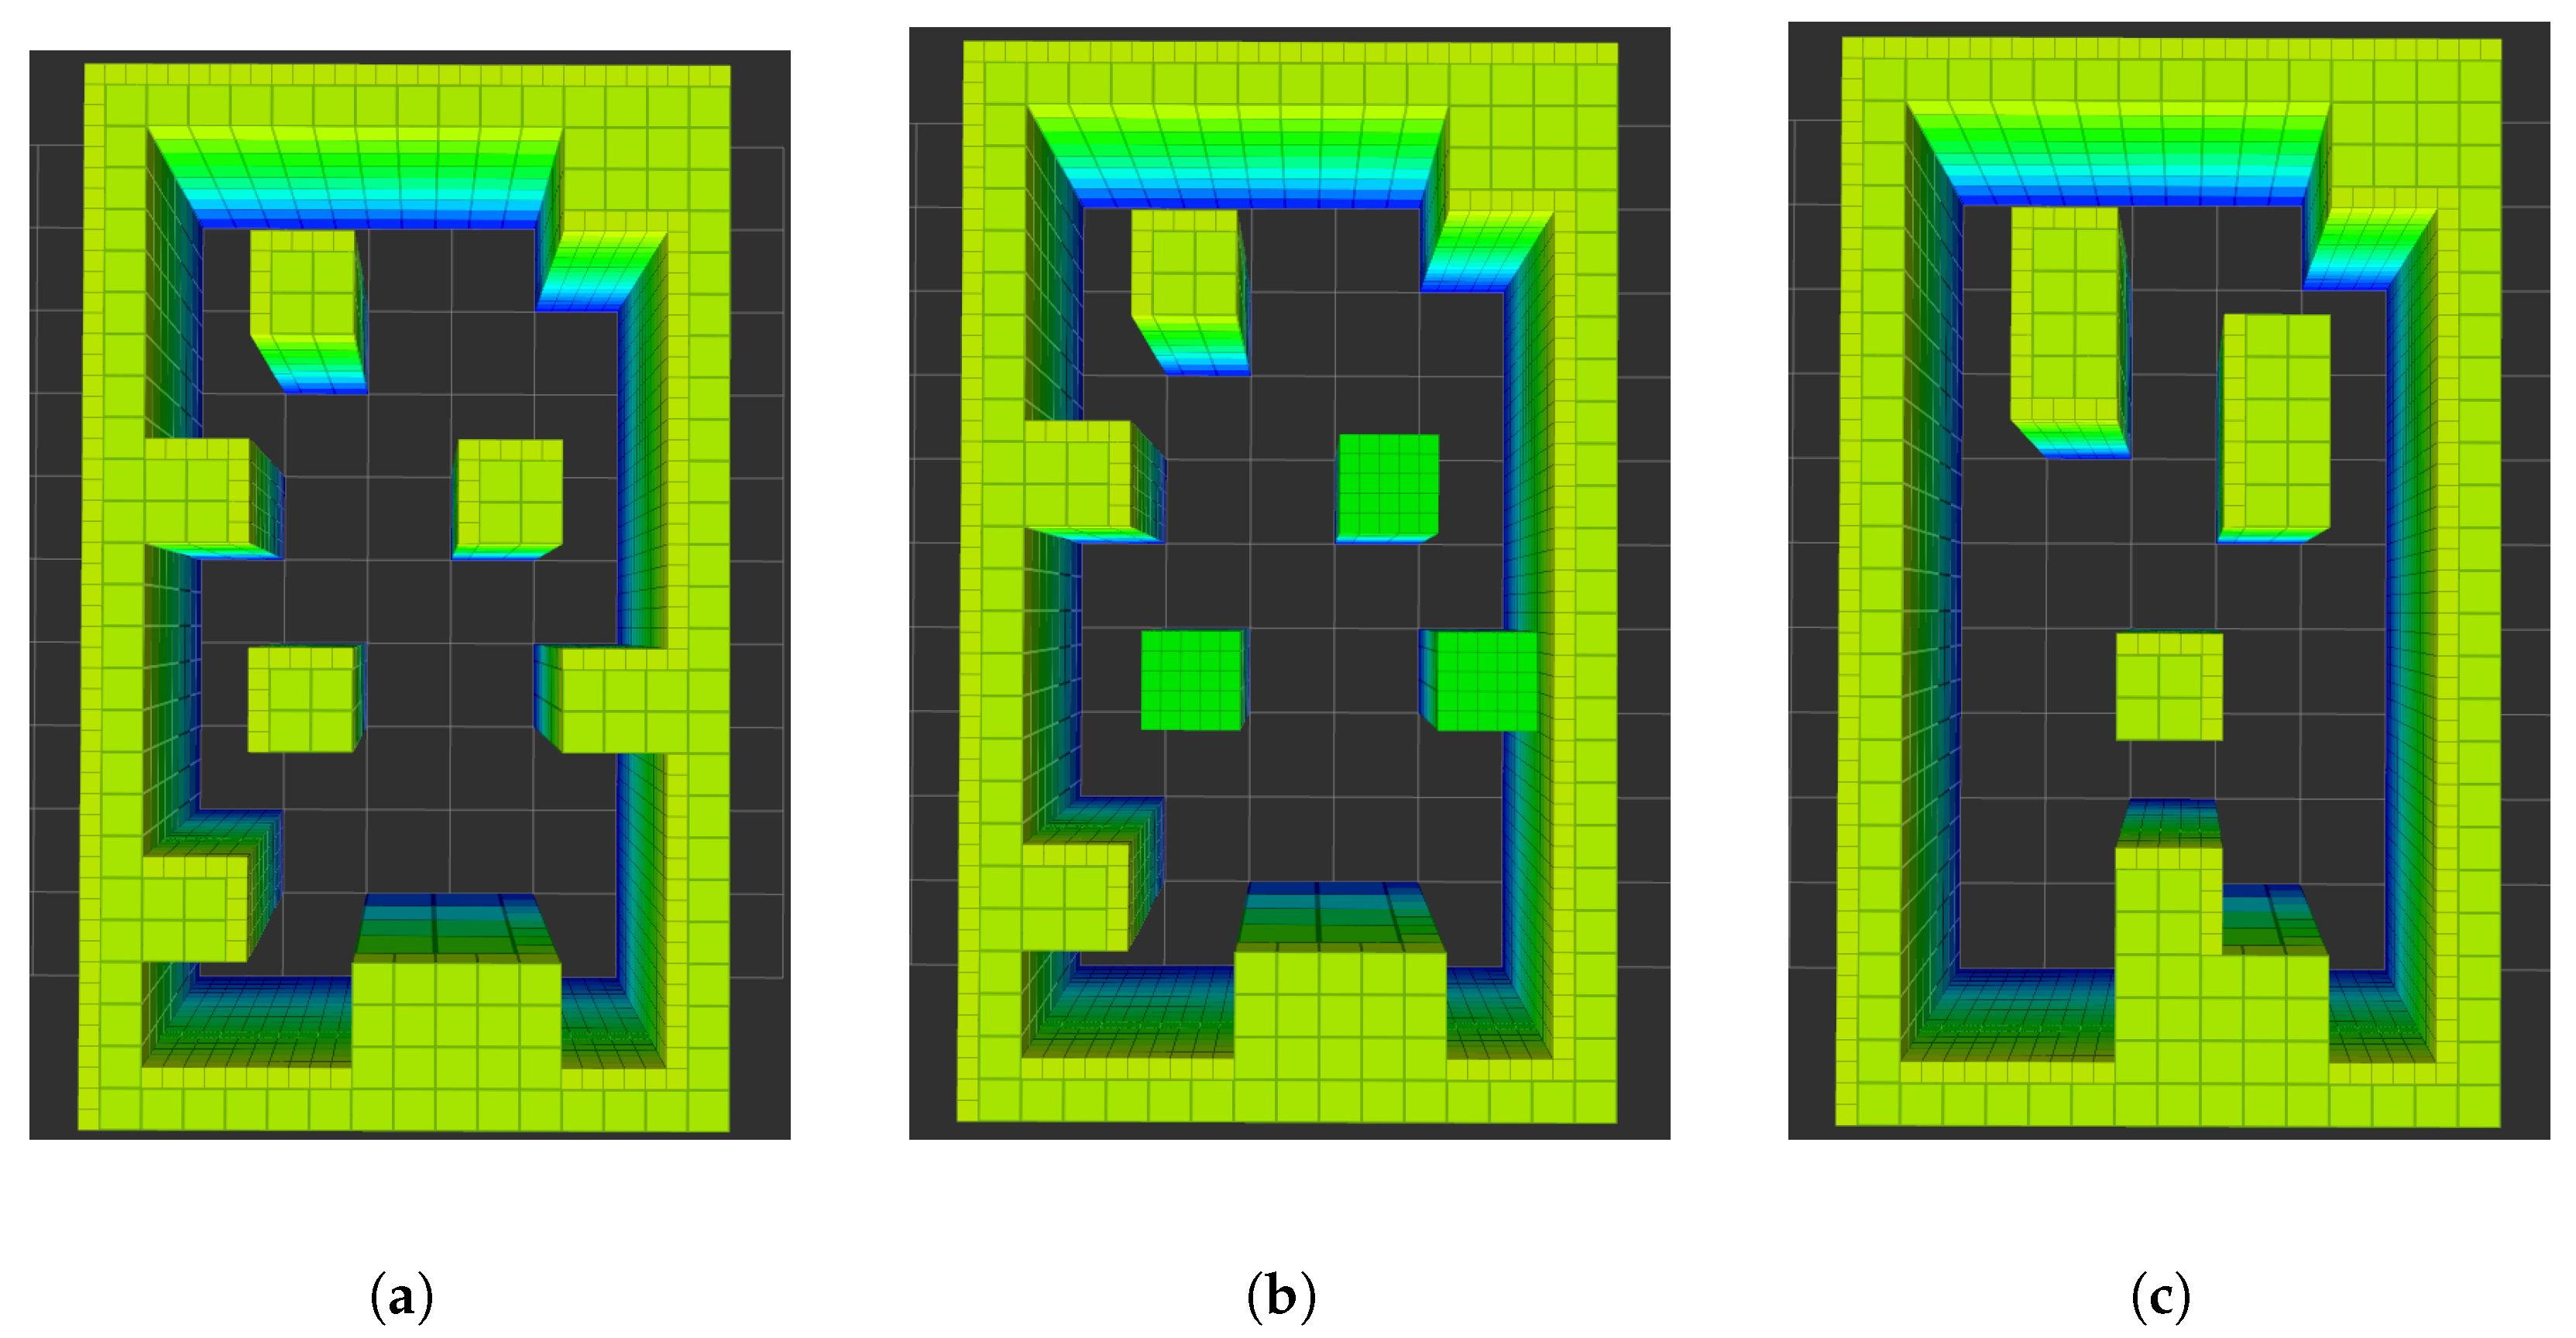
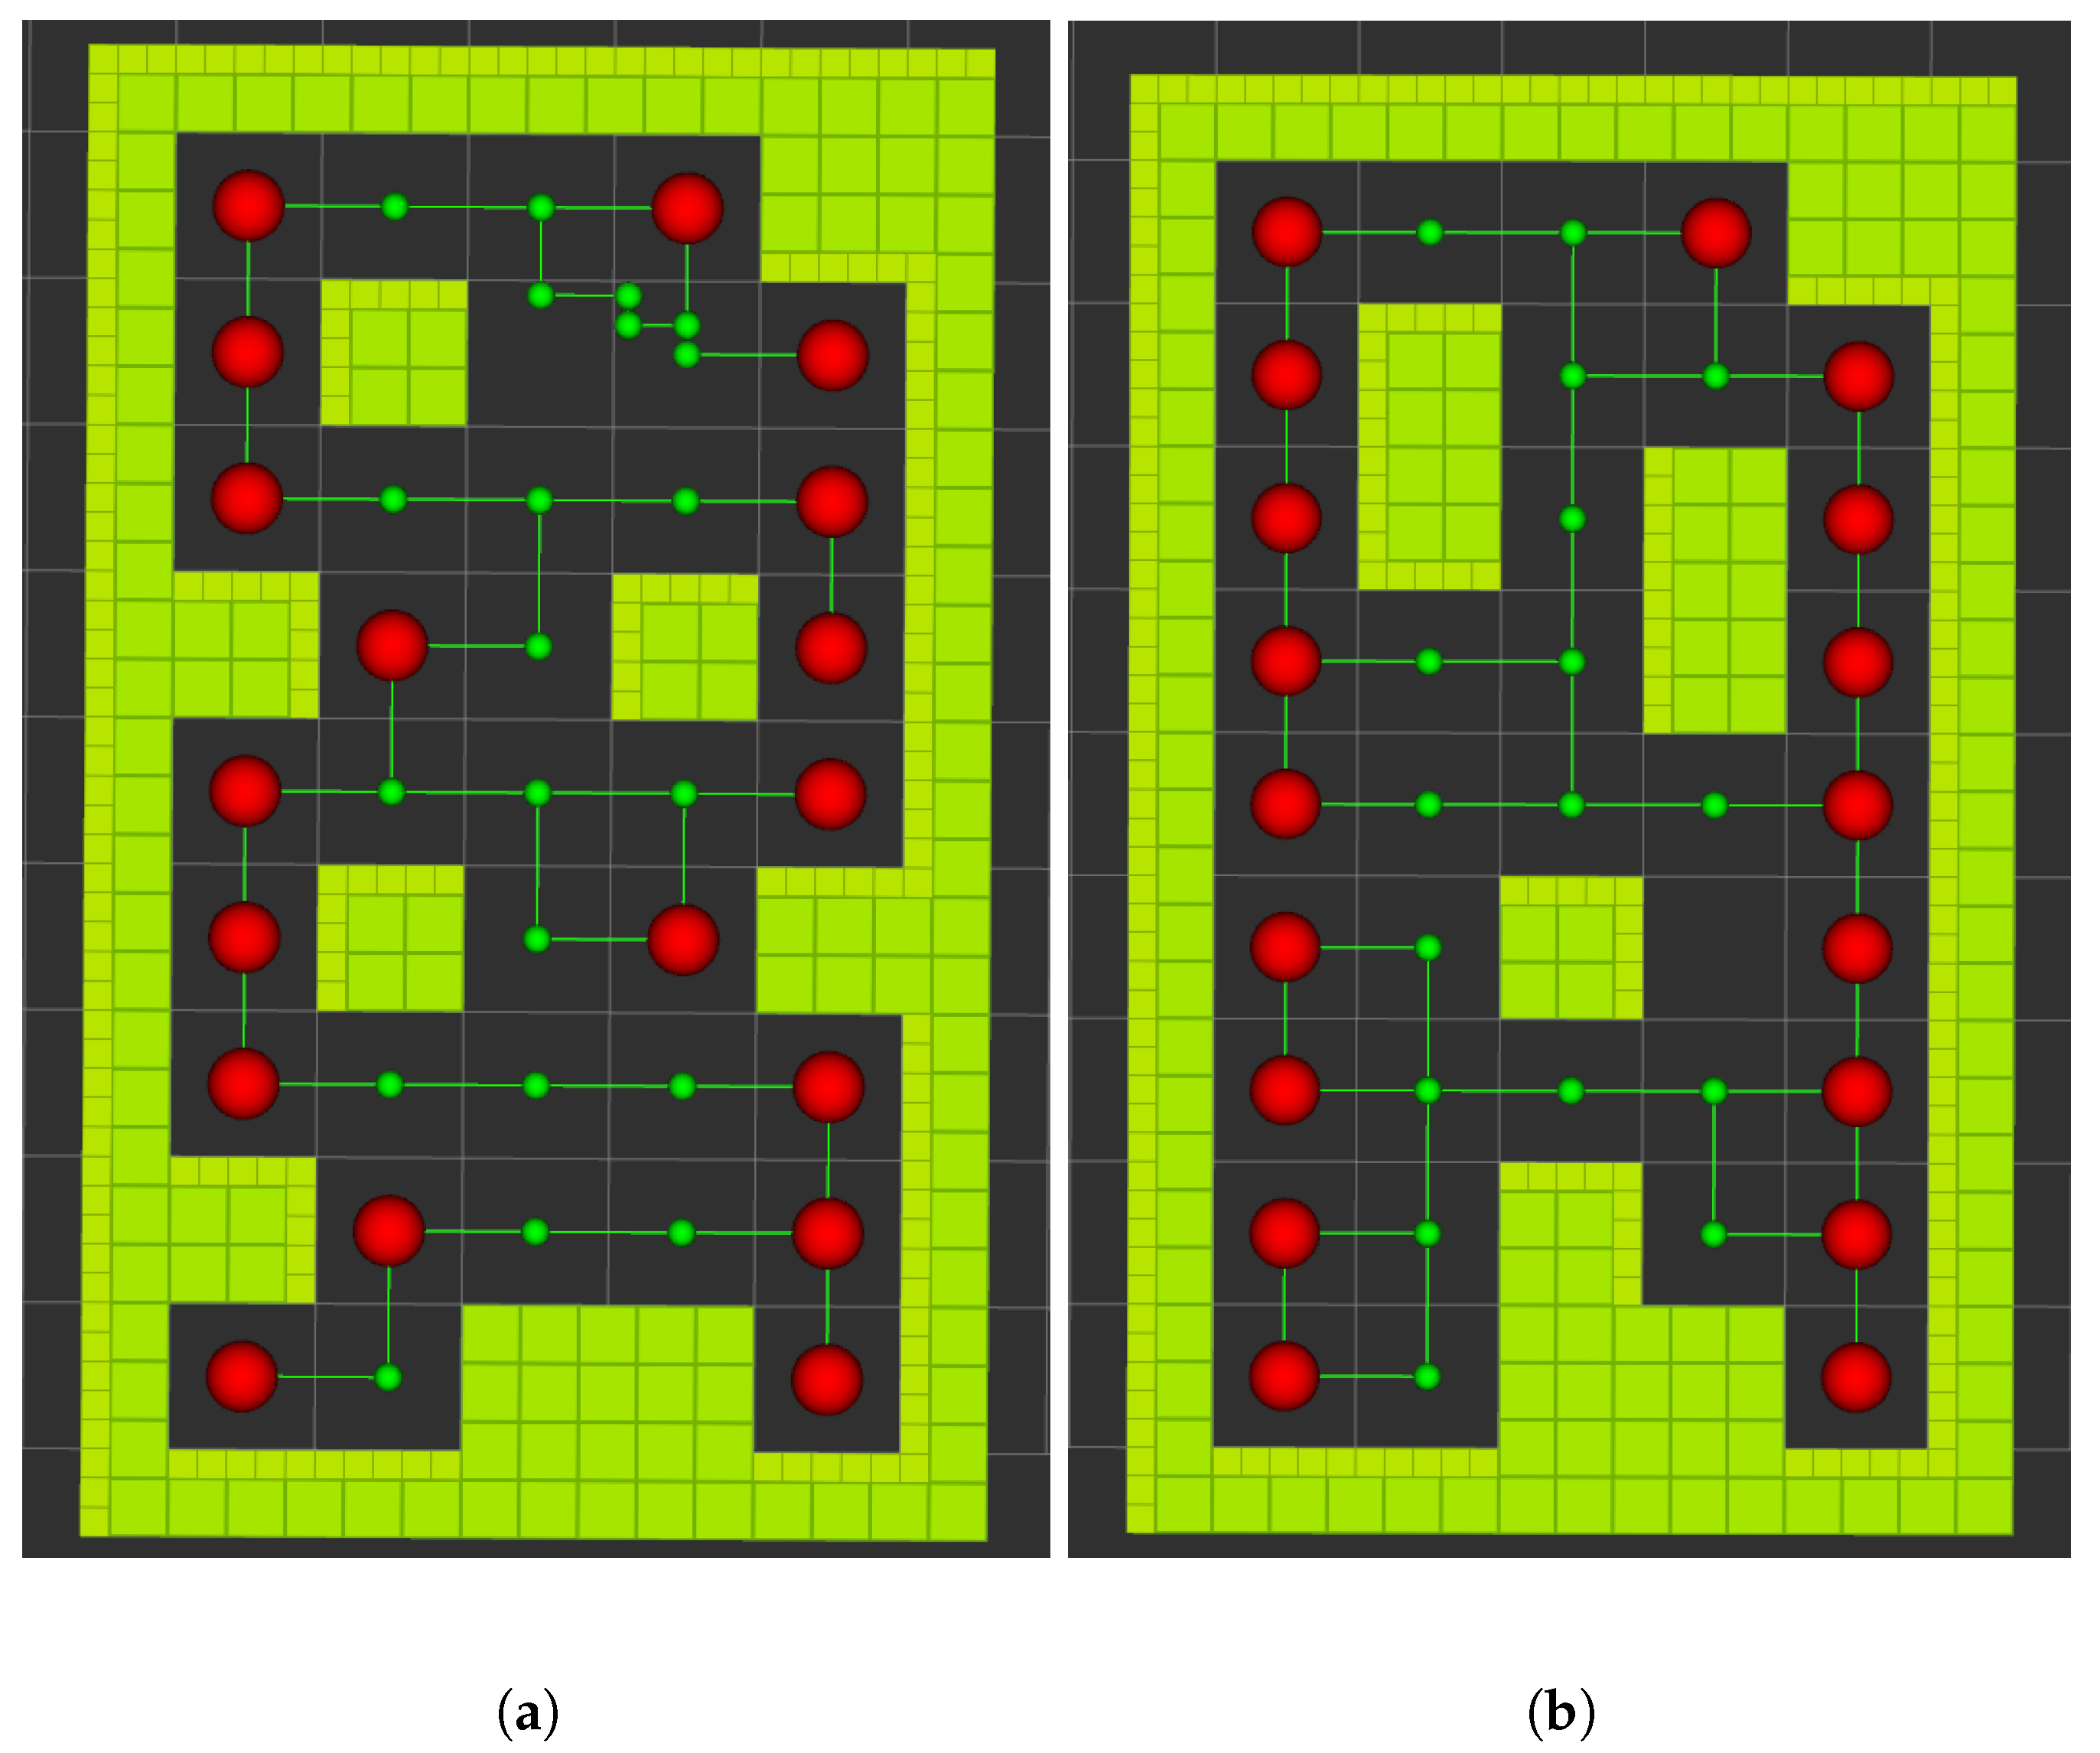
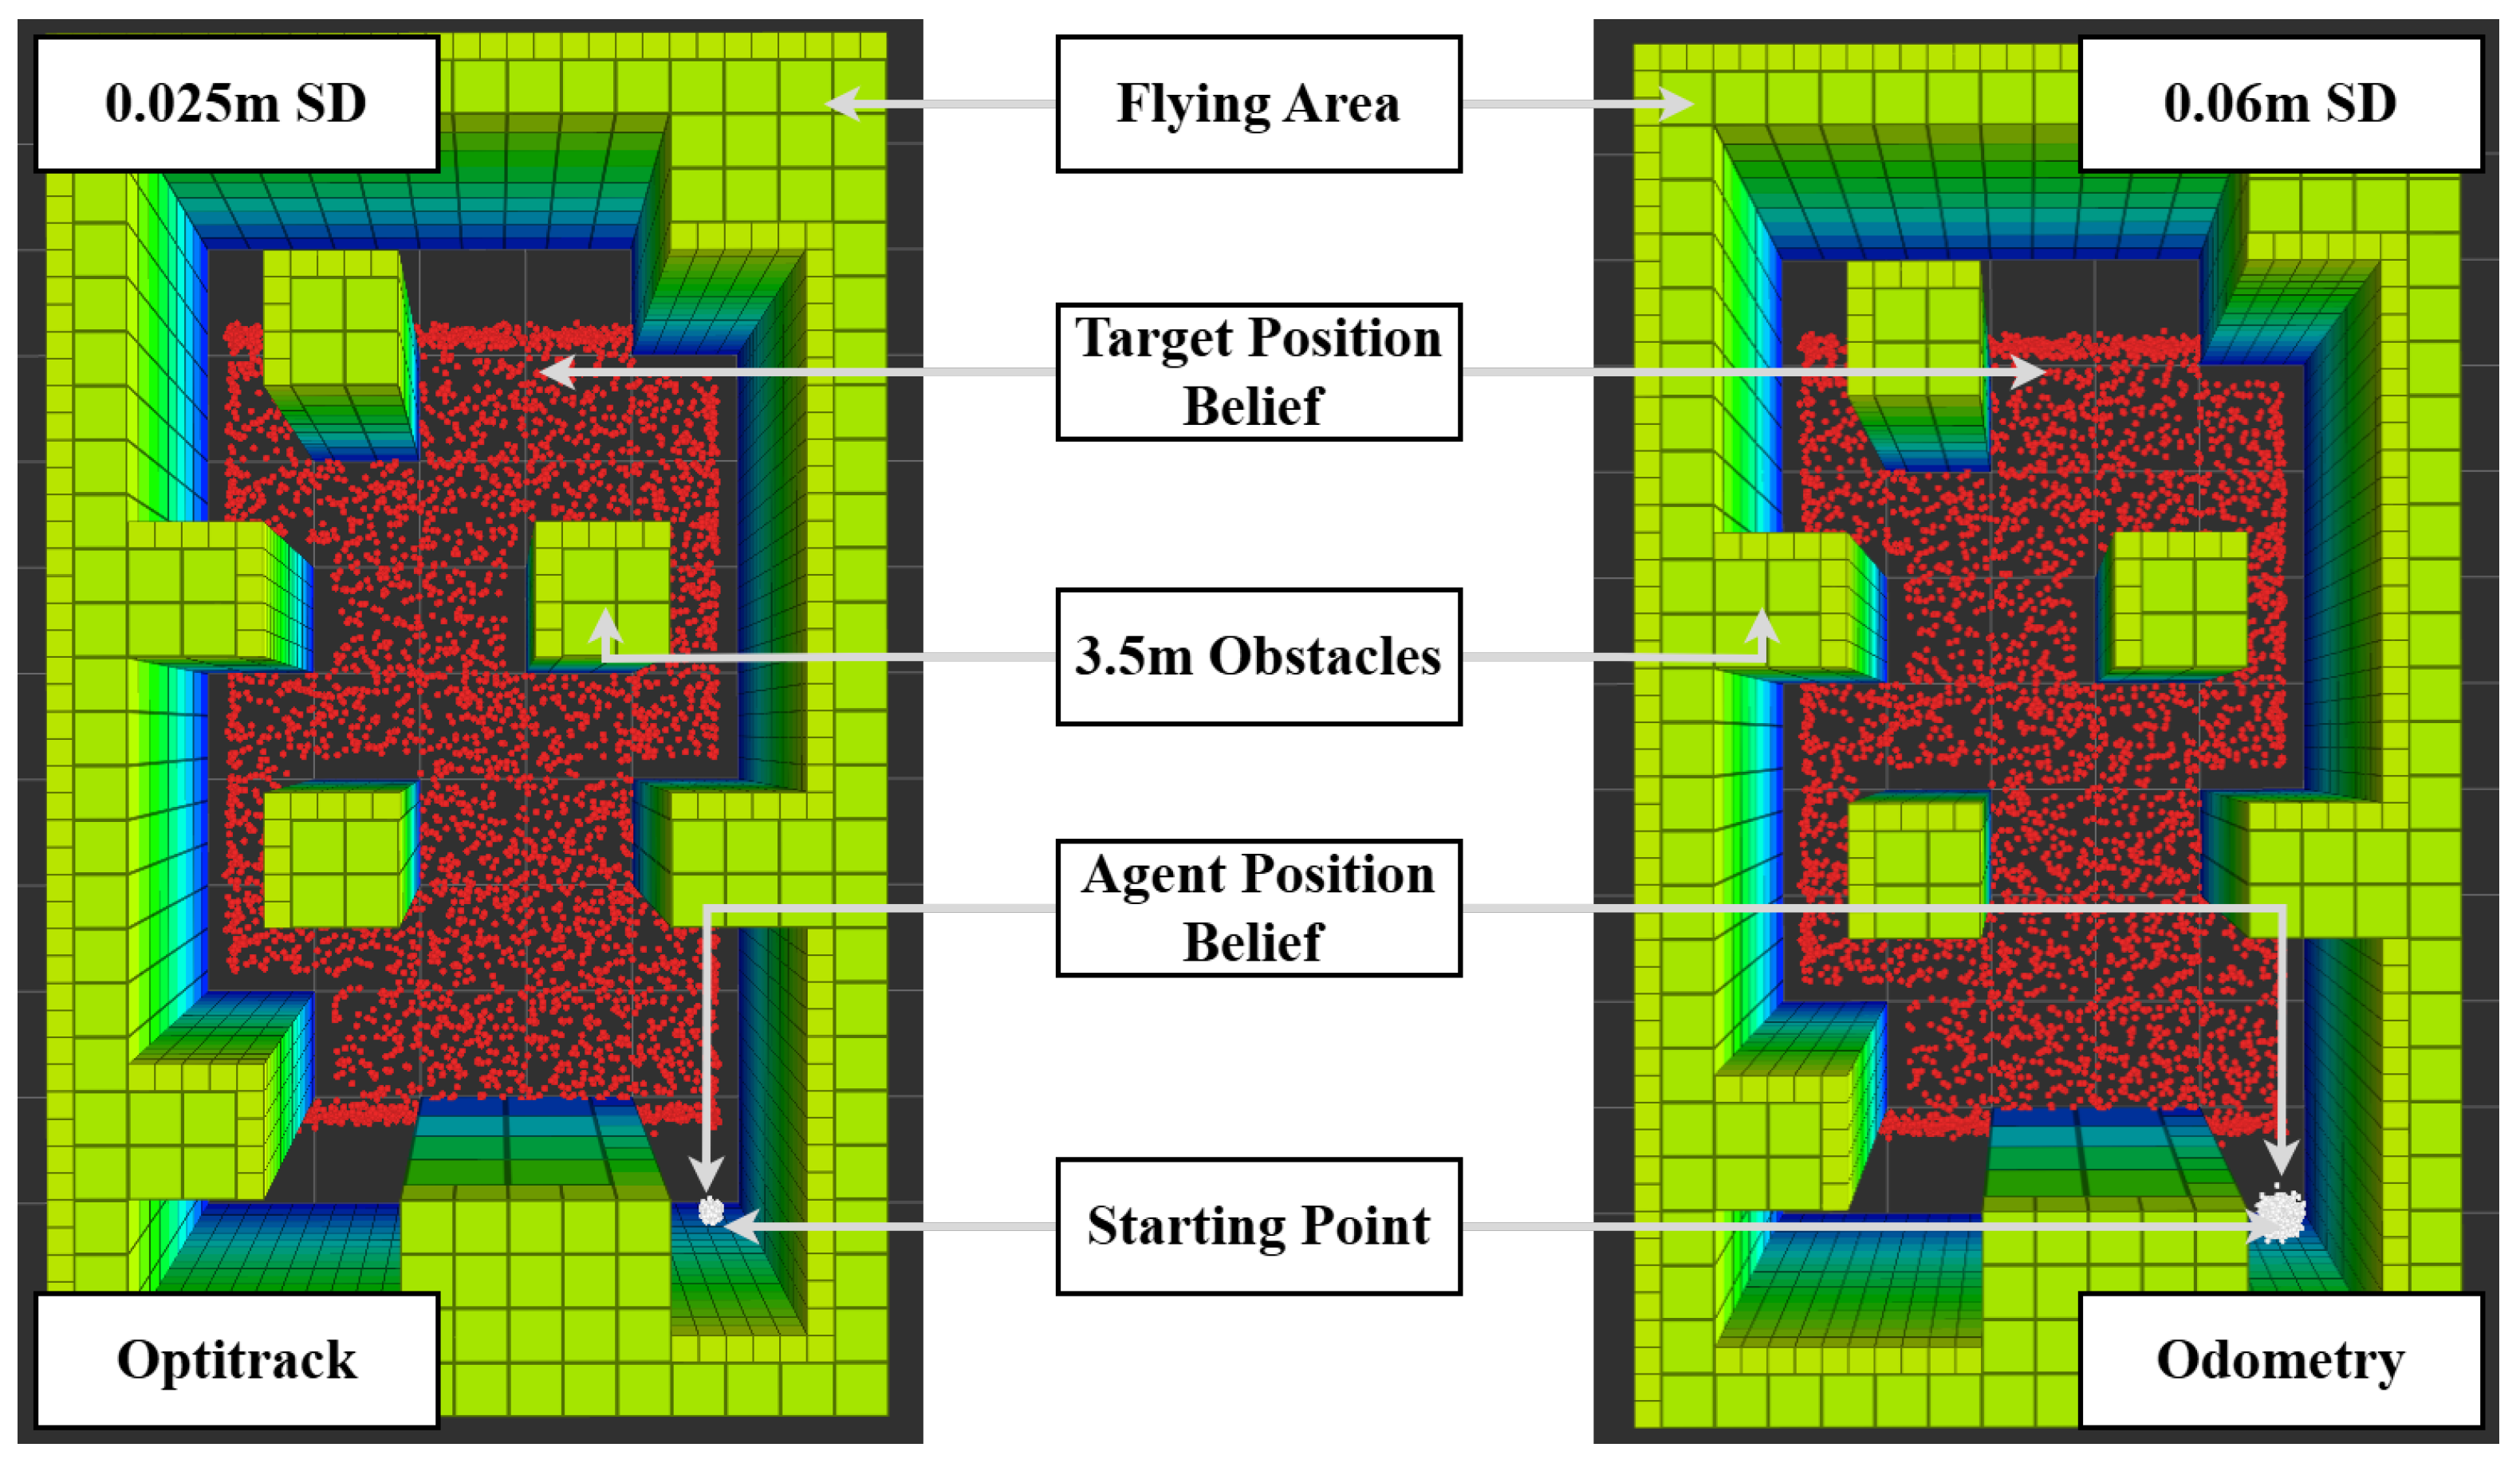
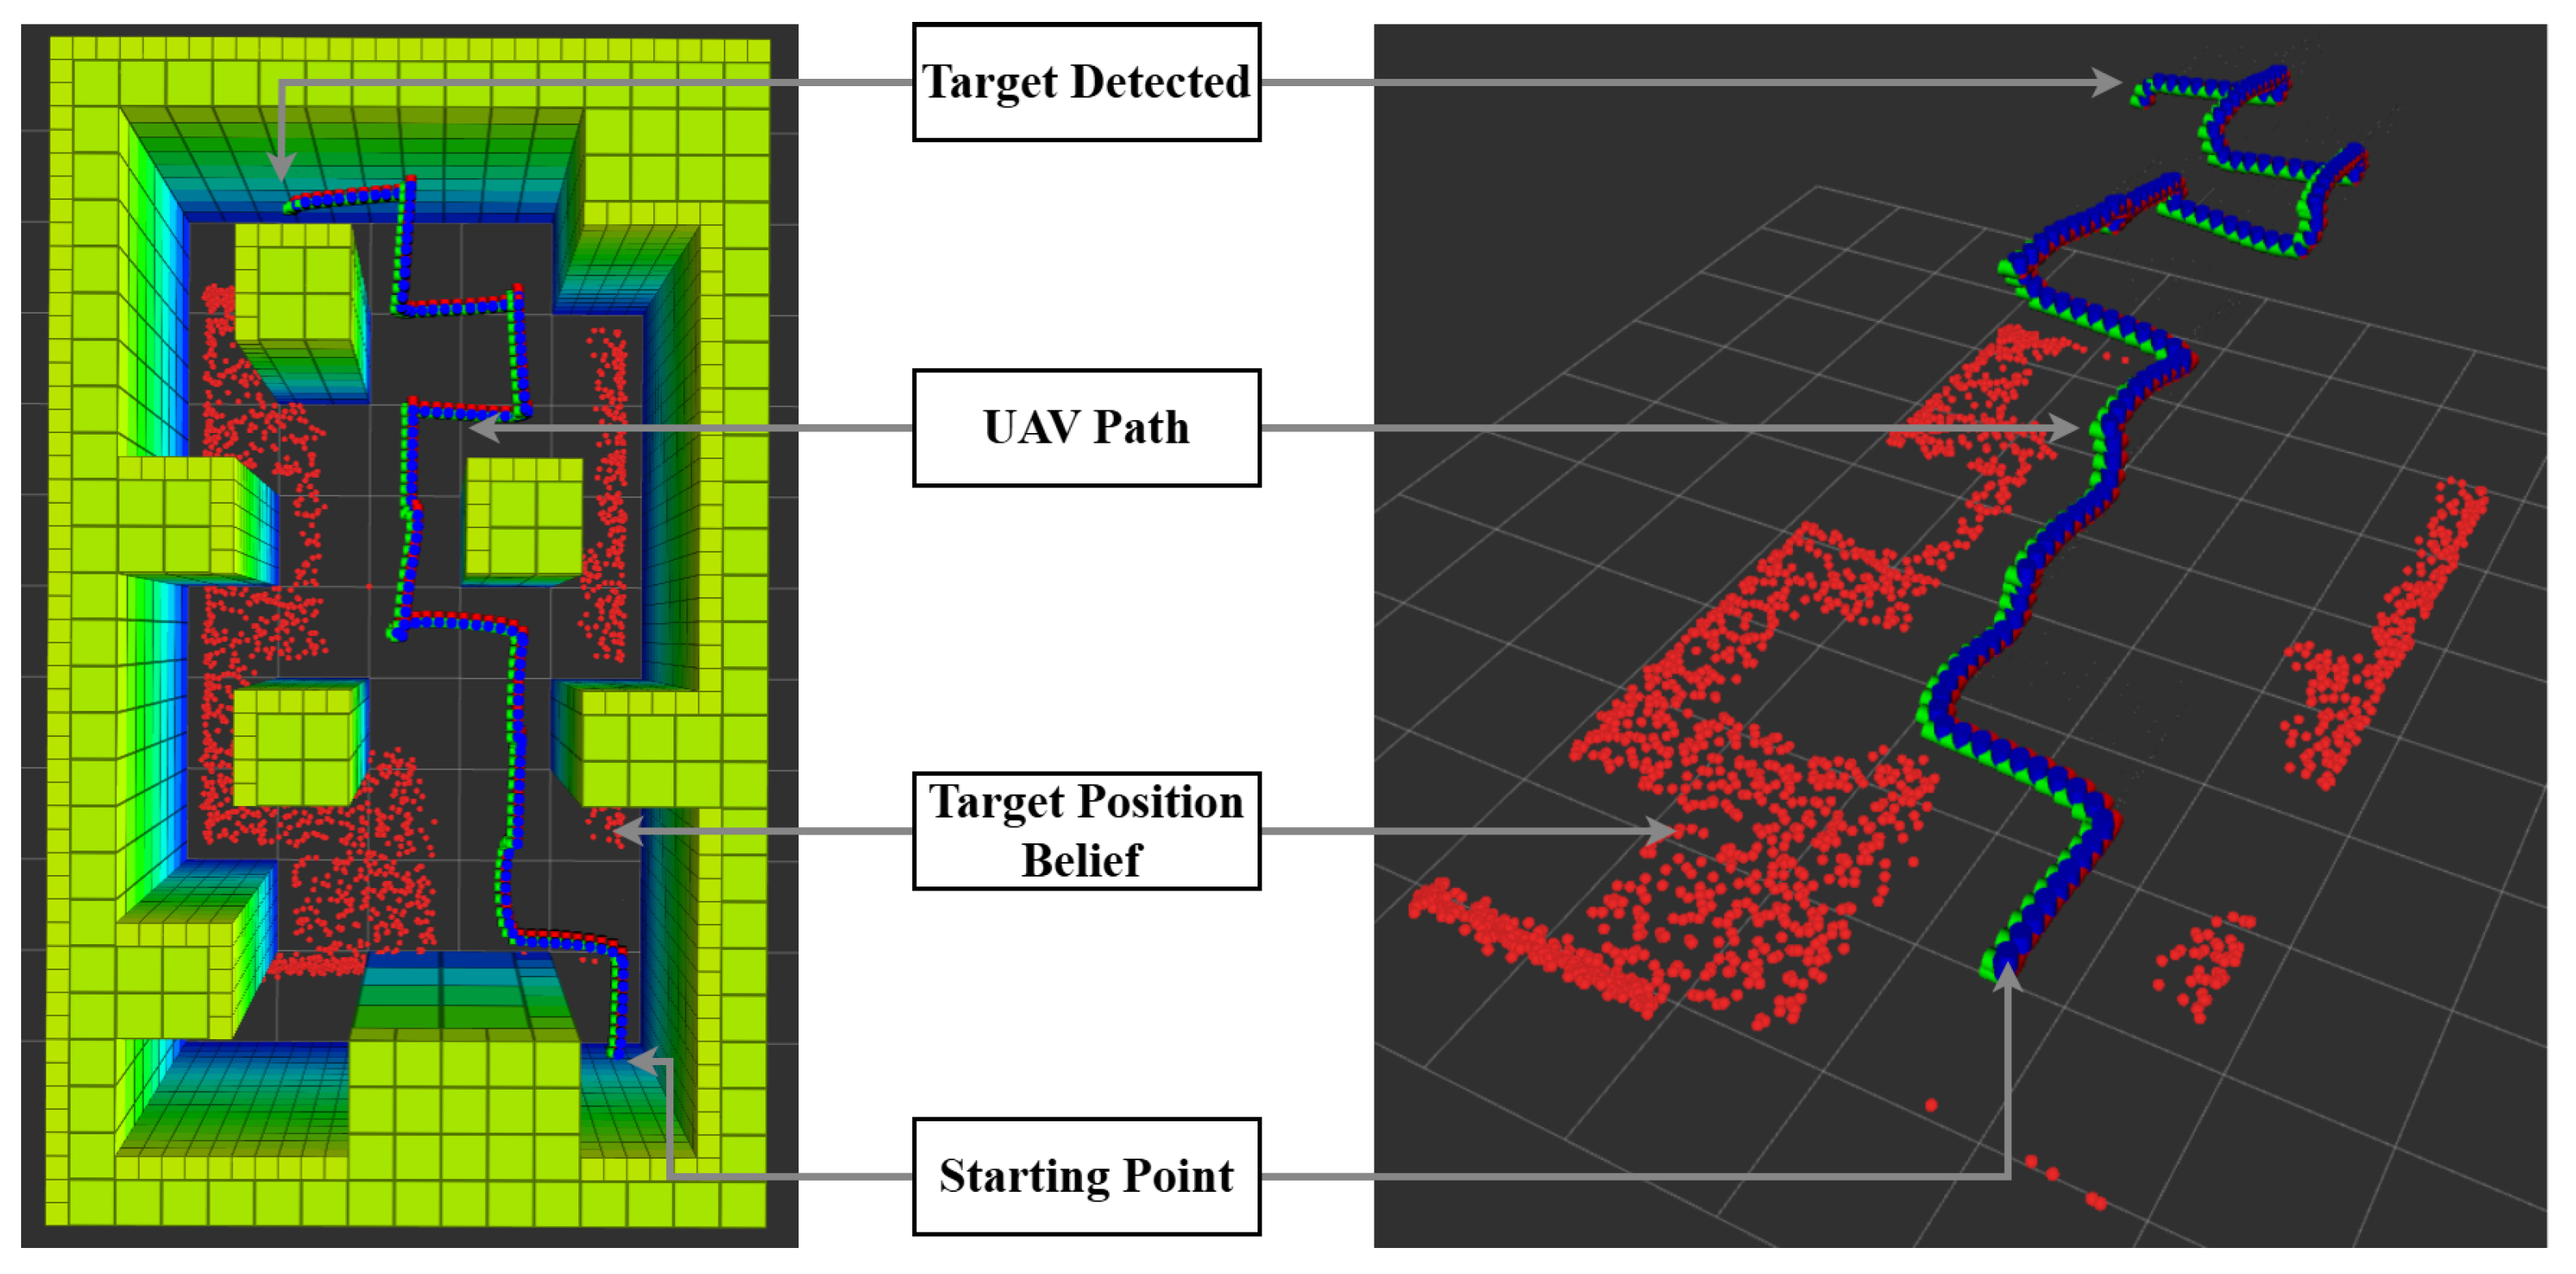
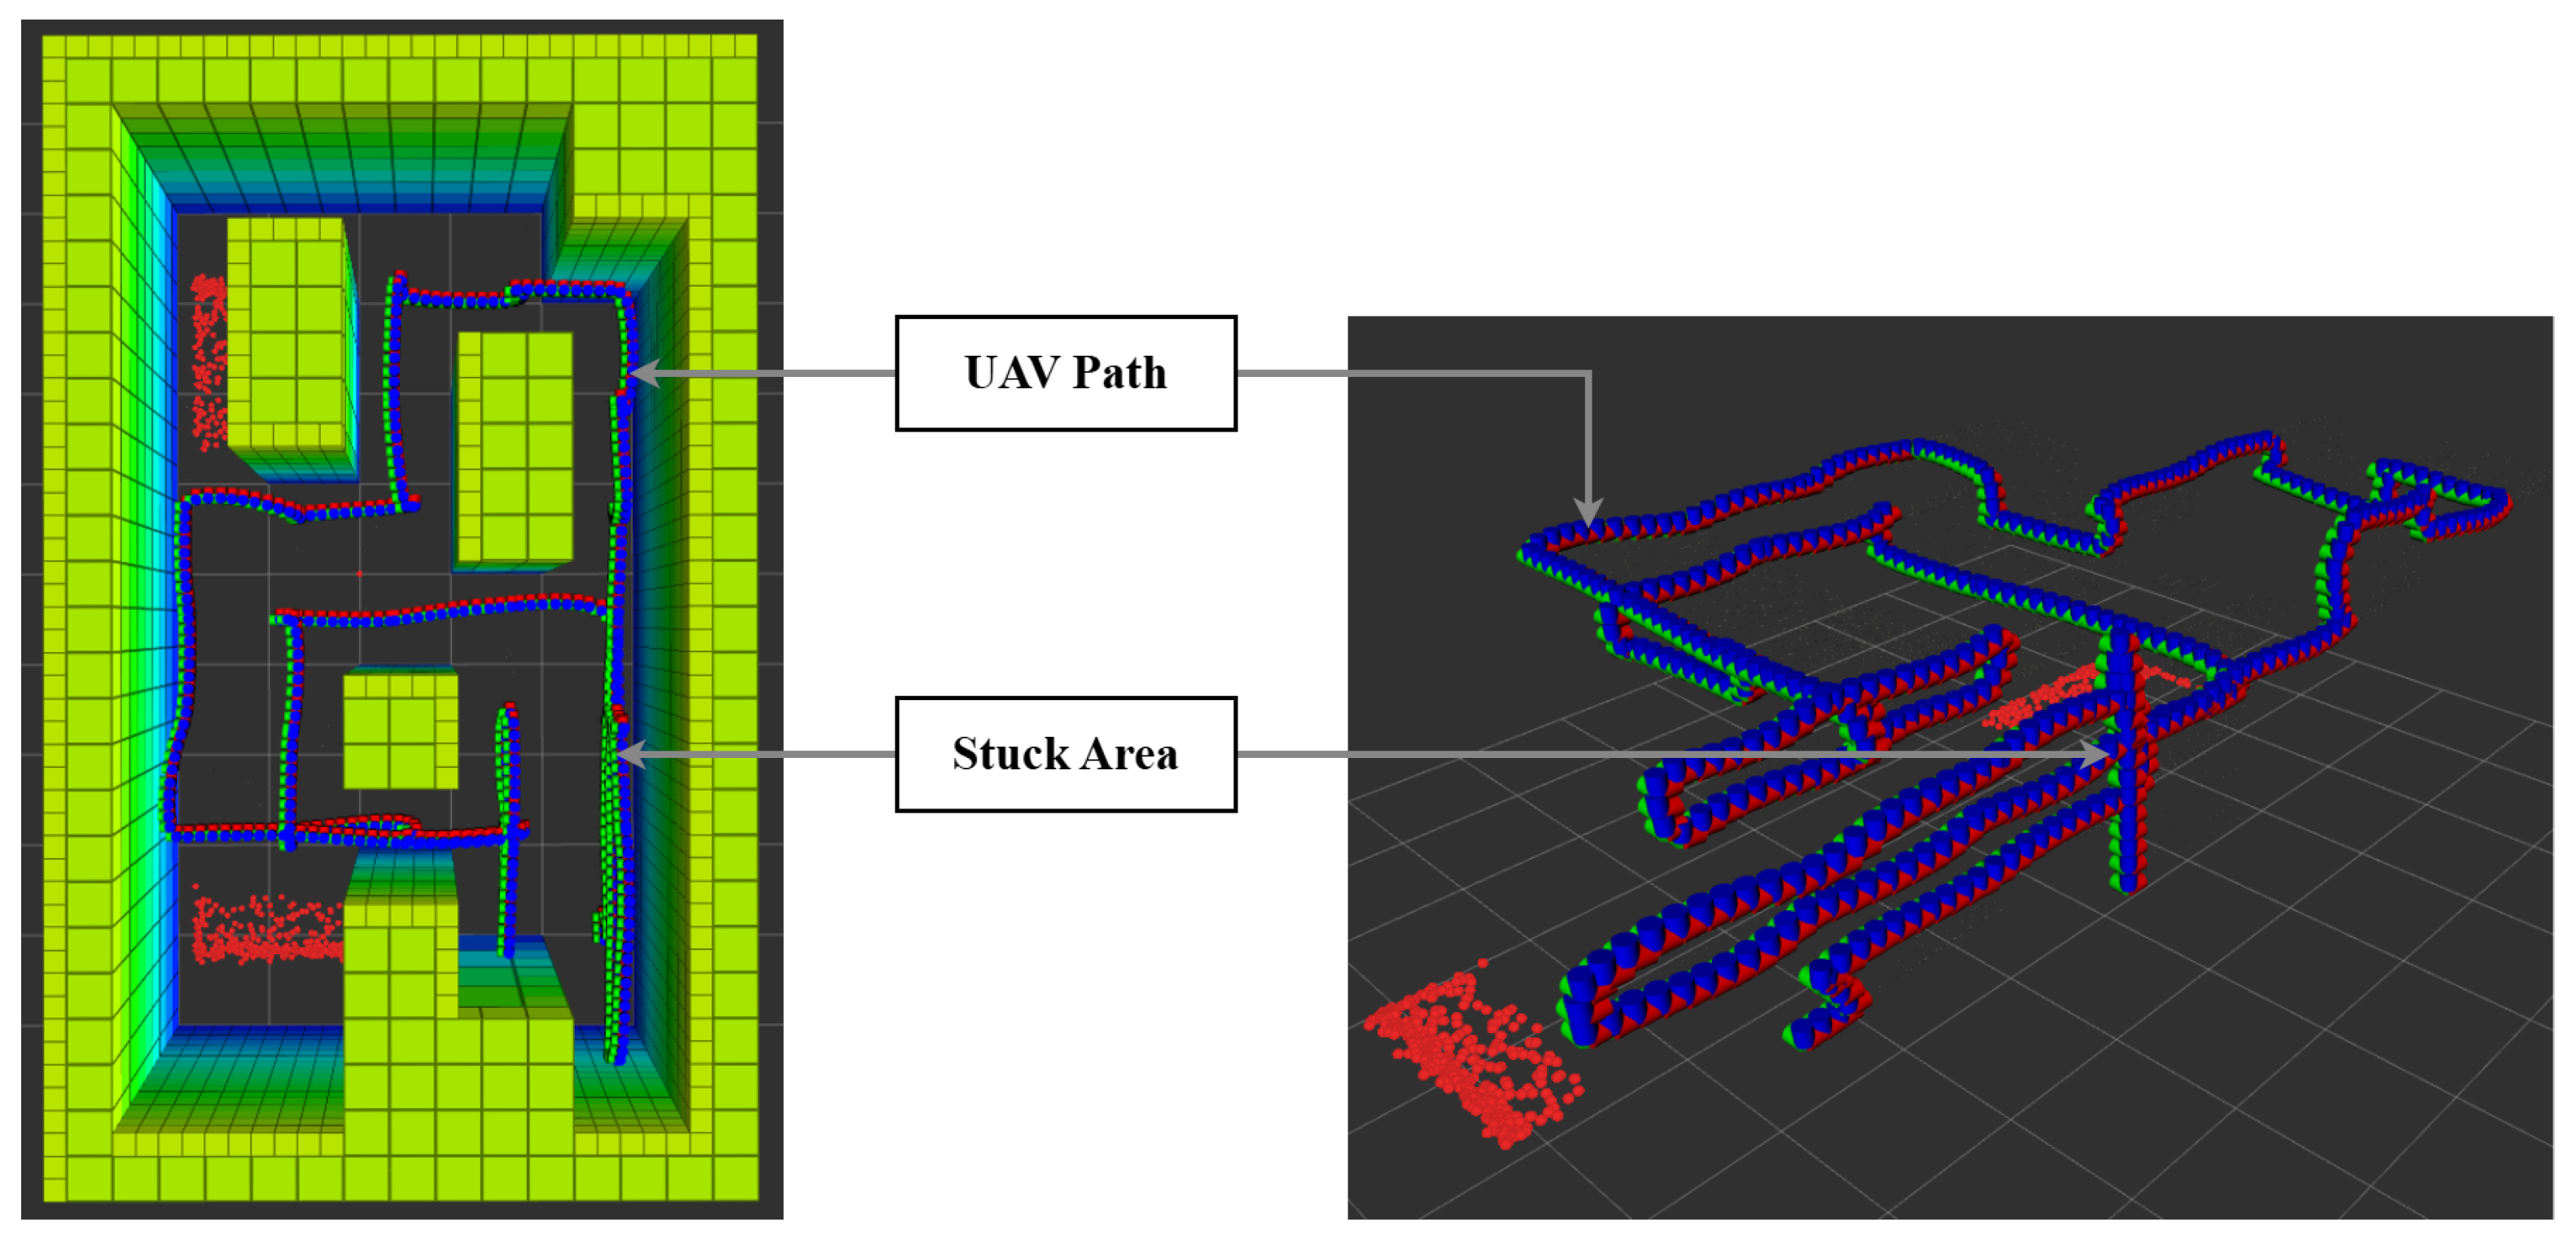
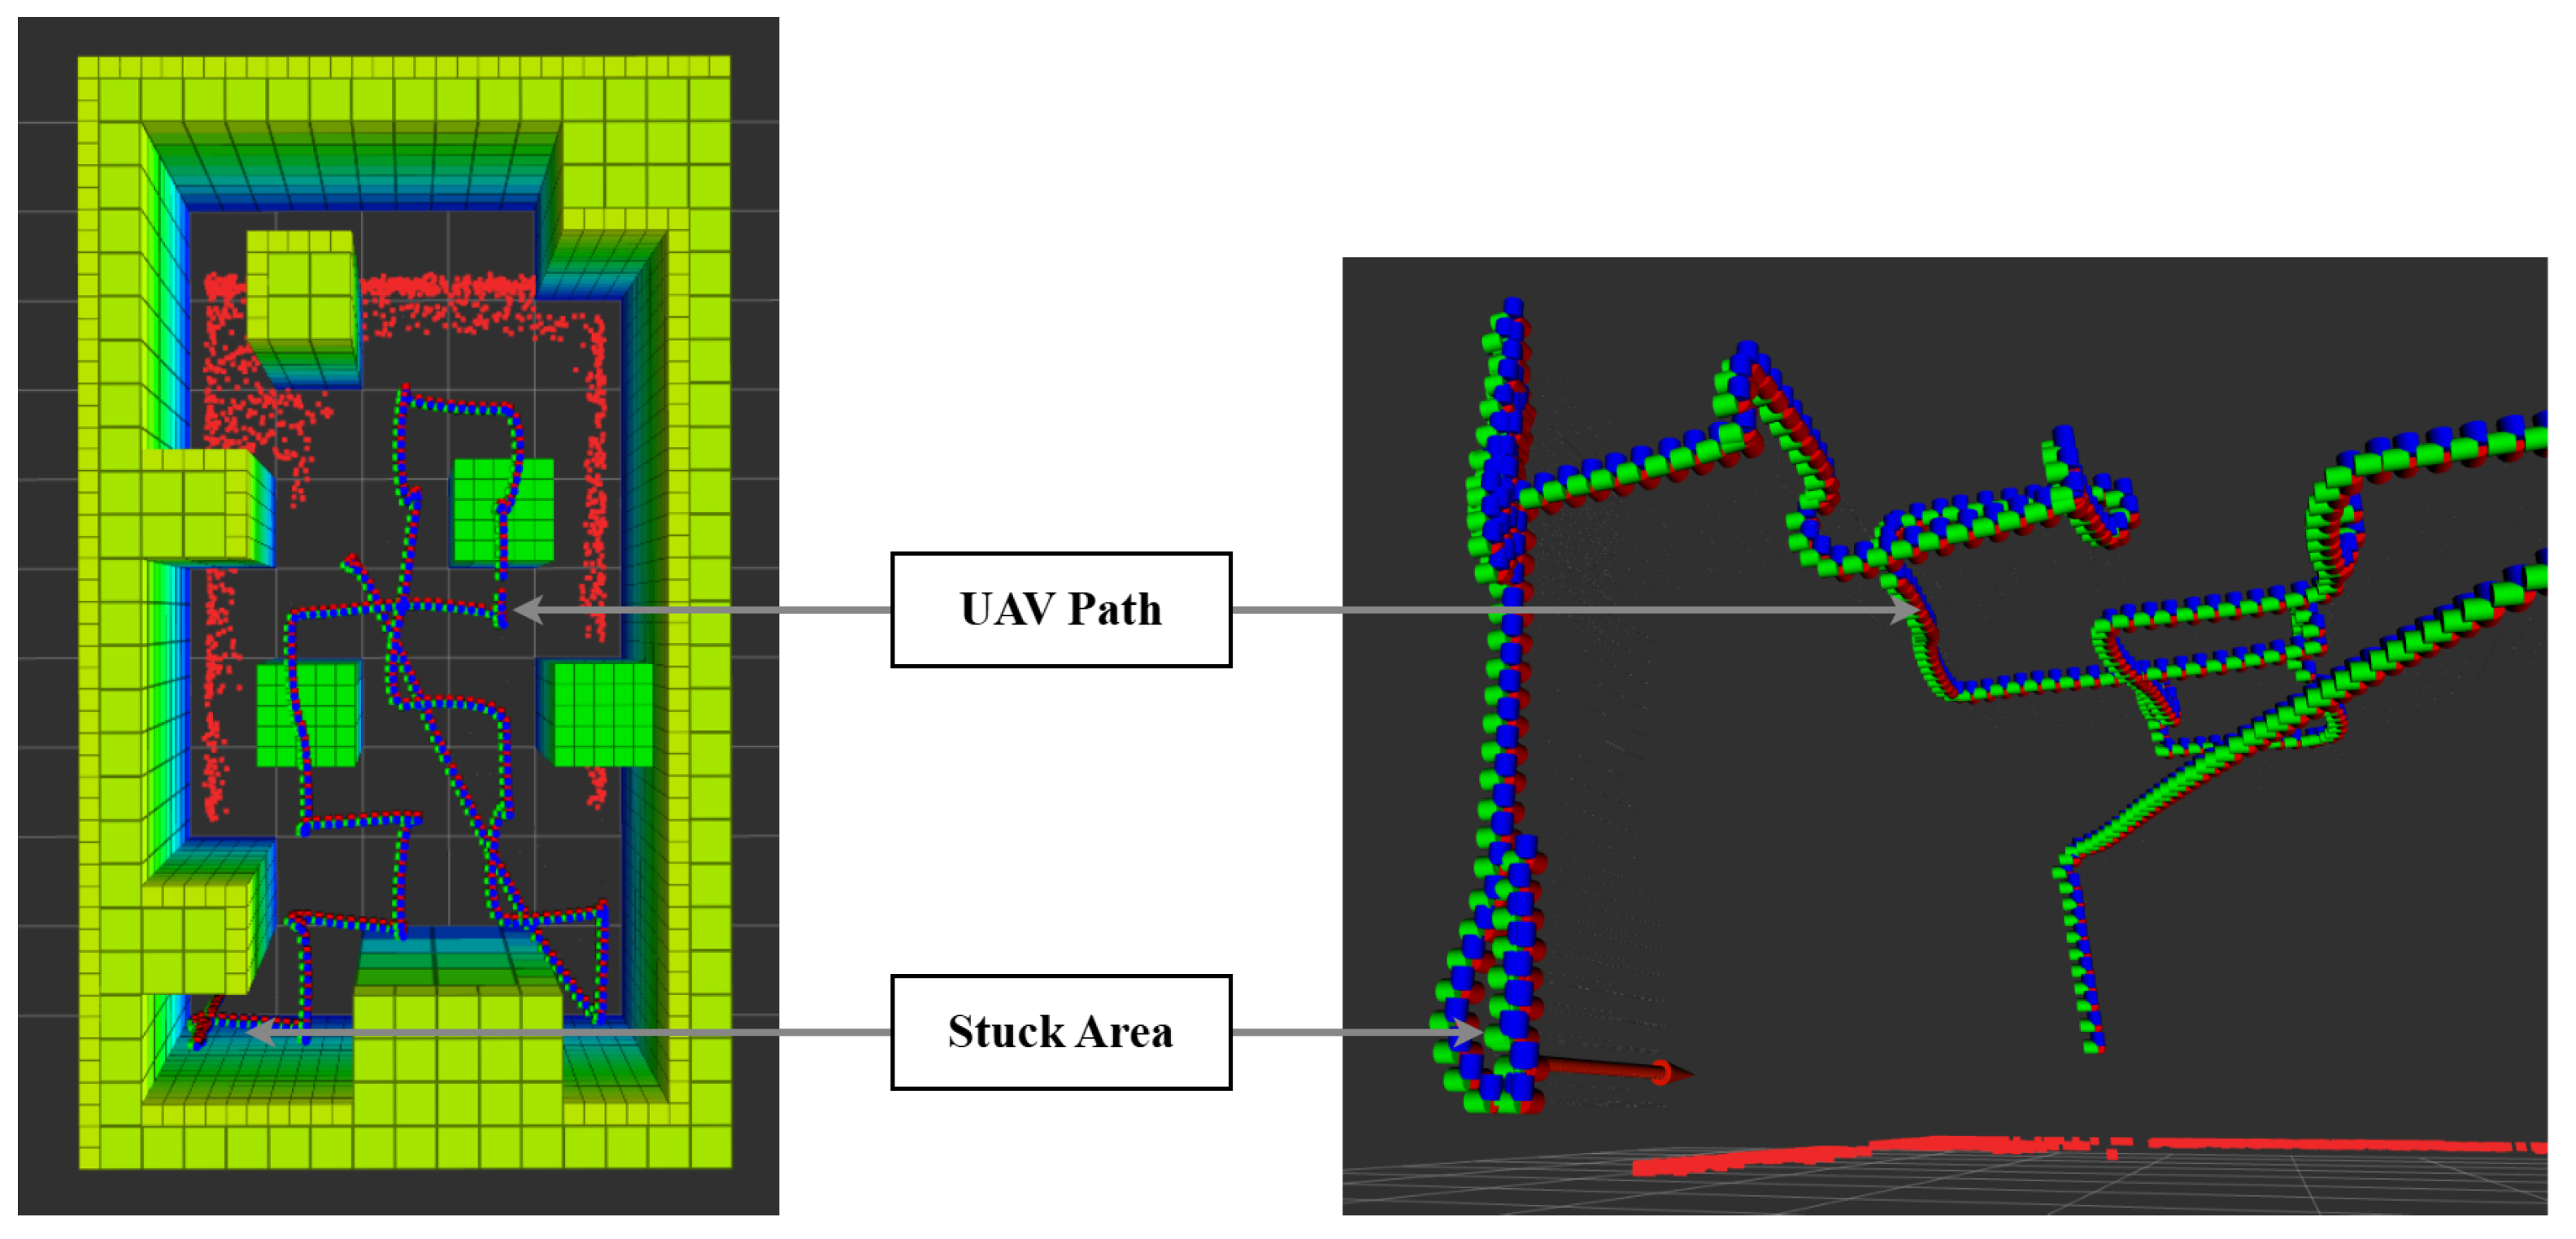
6.3. Flying Area and Maps

Three maps were designed to test the baseline algorithm and the system developed. The objective was to create cluttered environments with obstacles that limit the freedom of movement of the agent. The flying area and ROI are modeled following the size of the flying area in real-world experiments: 5 m wide and 9 m long, with a limited altitude of 3.5 m. Map 1 and Map 2 have eight identically placed obstacles; only their size changes. Map 1 only has obstacles of 3.5 m, while Map 2 has obstacles of 3.5 and 2.5 m. Map 3 has five obstacles of different shapes with a height of 3.5 m. All maps are highlighted in Figure 10.

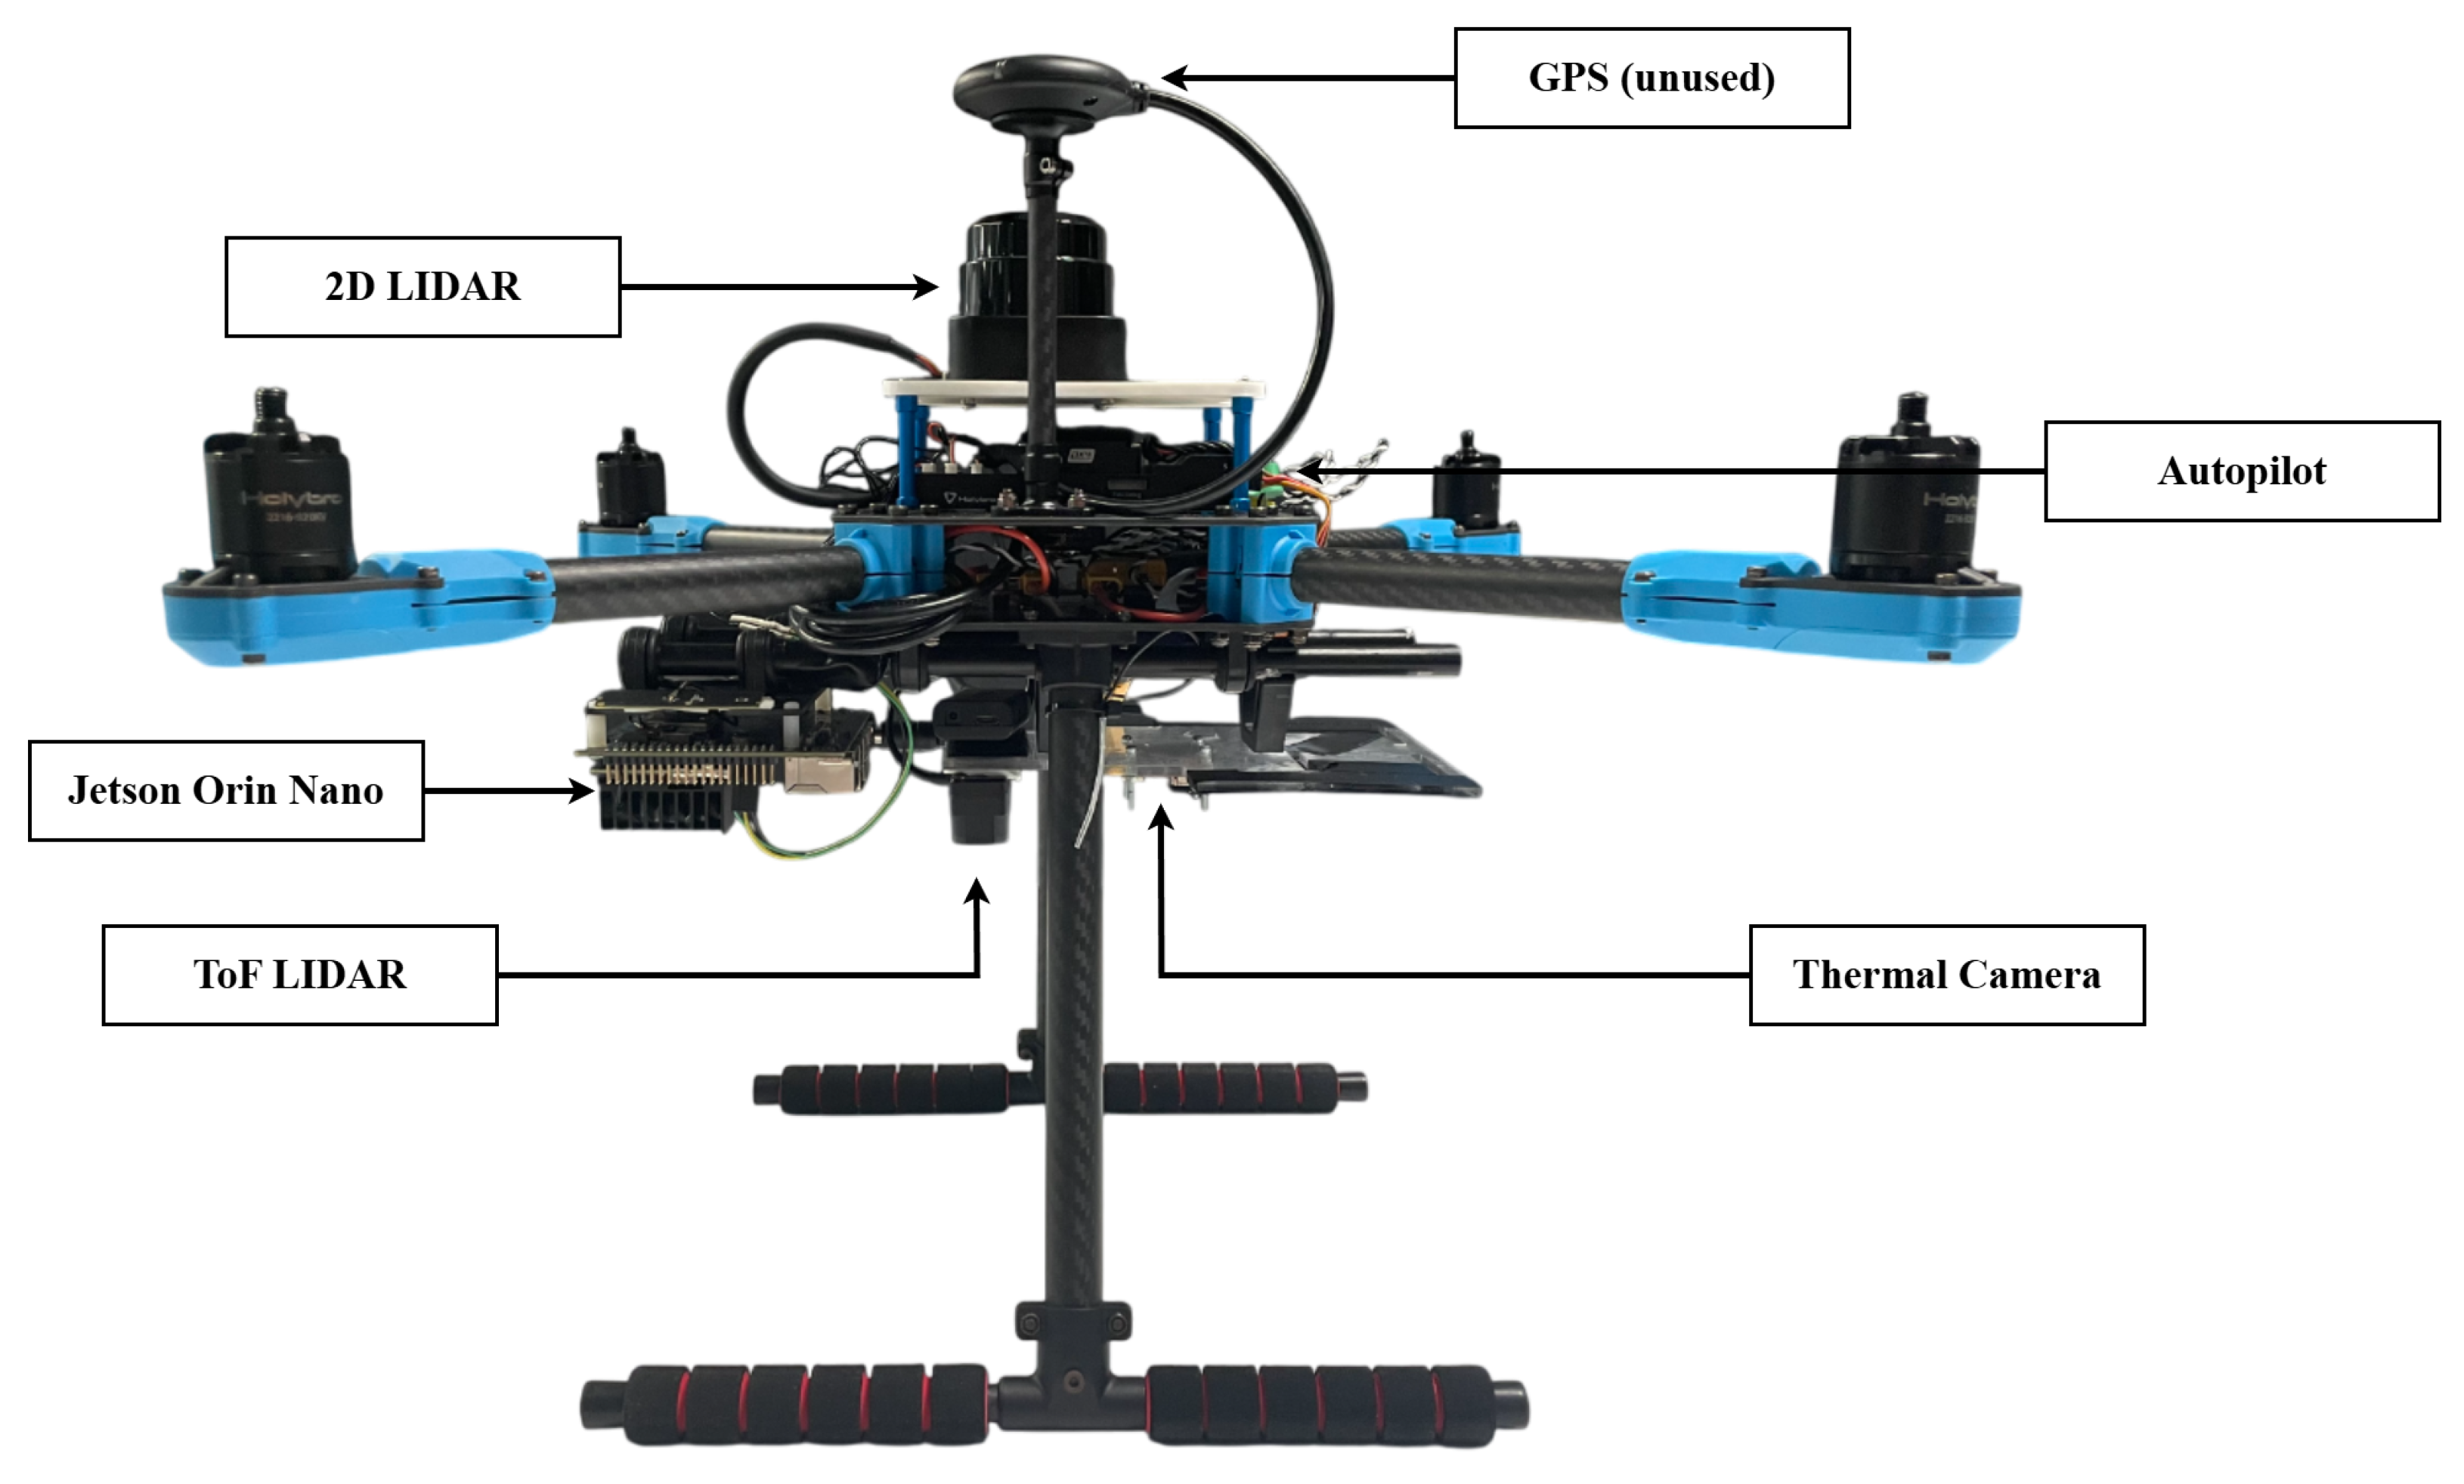
6.4. Hardware and Software for Real-World Experiments

The thermal camera used in this framework was a FLIR (Wilsonville, OR, USA) Lepton FS, which has a resolution of 160 × 120 pixels. It also has a frame rate of 9 Hz, and a FOV of 56° × 42°. The Lepton FS was mounted on the PureThermal 3 FLIR Lepton Smart I/O Board connected to the NVIDIA (Santa Clara, CA, USA) Jetson Orin Nano via USB-C. The 2D LiDAR used was the RPI S1 from SLAMTEC (Shanghai, China). It is a low-cost 360°LiDAR with up to a 40 m range, 10 Hz scanning frequency, 9.2 kHz sampling rate, and angular resolution of 0.391°. The Time-of-Flight LiDAR is the TFMini Plus Micro LiDAR Module by Benewake (Beijing, China). It has a measurement range of 0.1 m to 12 m indoors, a sampling rate of up to 1000 Hz, and an FOV of 3.6°. Table 3 summarizes all the hardware equipment used, and Figure 11 displays the quadcopter used in this research paper with the hardware mounted. The GPS module is mounted, but is not used for positioning. Only the integrated compass (magnetometer) is utilized for heading information in the autopilot system.
Ubuntu 20.04 (64 bits) was installed on the companion computer using Jetpack SDK 5.1.3. ROS Noetic [48] served as standard middleware, while PX4 firmware version 1.13.2 [46] controlled the UAV. MAVROS [49], an ROS wrapper for MAVLink [50], enabled communication between the decision-making module and the PX4 autopilot through UART interfaces. Communication between the PX4 autopilot and the GCS was realized through a 915 MHz telemetry radio, with QGroundControl (version 4.0) on the GCS.

6.5. POMDP Parameters
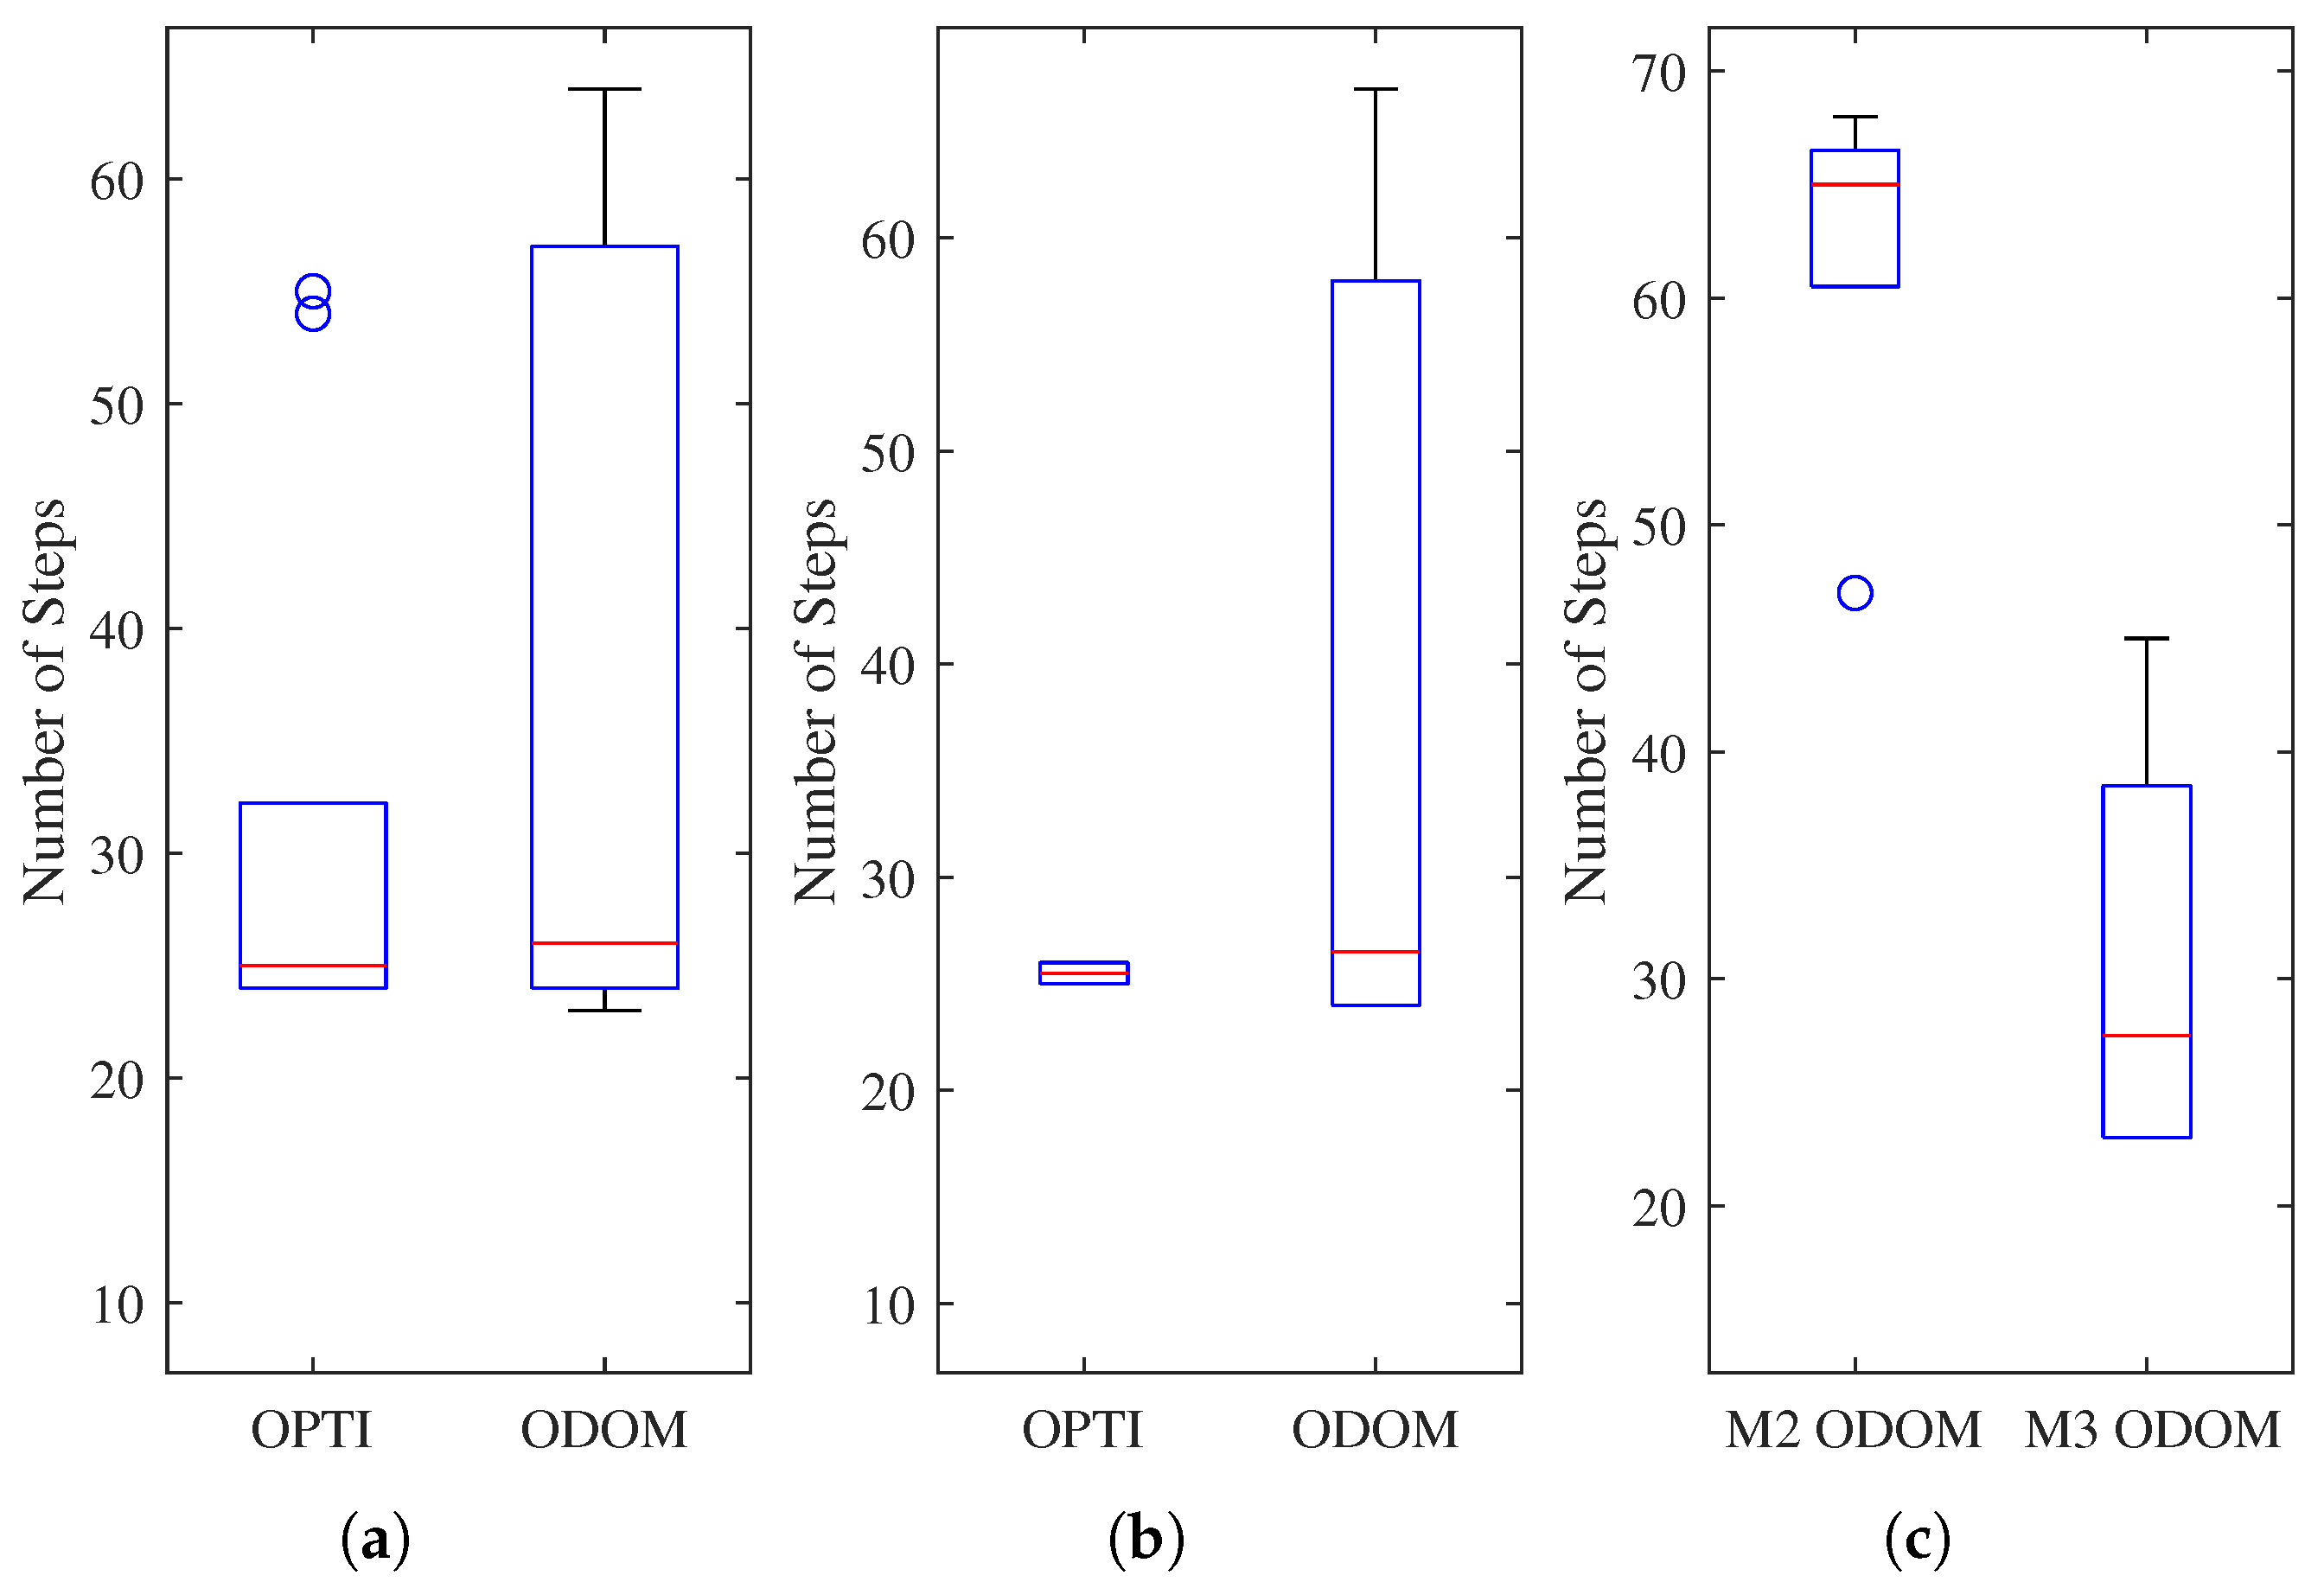
The values of the selected parameters of the POMDP formulation and the ABT solver are highlighted in Table 4. The discount factor  γ  determines how much importance future rewards are given relative to immediate rewards. In the case of this research, a value of 0.93 was assigned to  γ , prioritizing future rewards. To operate safely in the flying area, the minimum altitude of the UAV was specified in the POMDP as 2.0 m and 3.5 m for the maximum altitude. The left and right actions result in a displacement of 1 m, and up and down change the agent altitude by 0.3 m. The maximum flight time is reached after 100 time steps, corresponding to approximately 4 min.

7. Results

This section will first focus on the results of the POMDP system and the baseline in simulation and highlight the need for further experiments in the real world. Then, the results of the framework deployed in real life will be examined.

7.1. Simulation Results: POMDP vs. Baseline

The baseline was evaluated on Map 1 and Map 3. Map 2 was excluded since it is identical to Map 1 except for variations in obstacle heights, and the A* algorithm only allows 2D obstacle avoidance. The waypoints selected for each map form a lawn mower pattern, and the Breadcrumb package then outputs a list of waypoints avoiding the 2D obstacles. Figure 12 displays Map 1 and Map 2 with the provided waypoints in red circles, the calculated waypoints of the Breadcrumb package in green circles, and the corresponding path in green. The baseline was assessed with four test cases, two for each map, with two different altitudes of navigation: 2 m and 3 m. The POMDP framework was evaluated on all maps (Maps 1, 2, and 3), to compare its performance with the baseline algorithm. Table 5 summarizes all experiments conducted in simulation. The following performance metrics were used: (1) success, which includes detecting the target, staying in the ROI, and no collision with obstacles; (2) average time taken to complete the mission; (3) average time steps (waypoints) to succeed the mission. Each setup was iterated 10 times, creating a total of 70 simulated flight tests. In all tests, the target was placed with coordinates (4.5; 1.5) at the position opposite to the starting point of the UAV. Table 6 summarizes the results of the experiments conducted in simulation.
The baseline algorithm, when navigating at an altitude of 3 m, consistently detects the target while staying in the ROI and avoiding obstacles. However, when tested at a minimum altitude of 2 m, it does not detect the target due to the limited camera FOV, resulting in a general success rate of 50% for the baseline algorithm. This highlights a key limitation of the baseline: its inability to adapt altitude for effective target detection. On the other hand, the POMDP framework autonomously adjusts its altitude to avoid obstacles while maintaining an optimal camera FOV, leading to a significantly higher success rate of 93.3% over 30 iterations. Regarding the average time and waypoints required to detect the target, both approaches perform similarly on Maps 1 and 3. On Map 1, the POMDP framework approximately averages 87 s with 41 waypoints, while the baseline takes 88 s with 44 waypoints. On Map 3, the POMDP framework averages 109 s with 52 waypoints, compared to 106 s with 53 waypoints for the baseline. However, the key distinction is shown in environments with varying obstacle heights, such as Map 2. The A* algorithm used in the baseline is restricted to 2D path planning and cannot adjust its trajectory based on obstacle height. As a result, it would follow the same path as in Map 1, which may not be optimal. In fact, the POMDP system performed an average time of 70 s with 33 waypoints in Map 2, where it would have taken 88 s and 44 waypoints for the baseline algorithm. Table 7 summarizes and compares the capabilities and limitations of the baseline algorithm and the POMDP framework. In summary, the POMDP system demonstrates superior adaptability through probabilistic decision-making and dynamic altitude control. This allows the agent to perform 3D path planning, adjust its trajectory based on observations, and maintain a sufficiently large FOV for reliable target detection. These findings highlight the limitations of the baseline approach and justify further exploration of POMDP-based autonomy for UAV navigation in complex environments. Further analysis of selected paths, the number of waypoints and agent behavior will be covered in Section 7.2 with the implementation of the framework in the real world.

7.2. Real-World Results: POMDP

The following performance metrics were used to validate the system through the proposed search and rescue case study: (1) target found; (2) crash; (3) leave the region of interest (ROI); (4) over maximum altitude; (5) timeout. The proposed framework was tested under different setups. Map 1 was tested in normal- and low-visibility conditions. Furthermore, both Optitrack and onboard odometry were used to compare their respective impact on the system. Two additional maps, Map 2 and Map 3, were also tested to show some of the system’s capacities and limitations. In all tests, the target was placed with coordinates (4.5; 1.5) at the opposite position of the UAV’s starting point. Figure 13 displays Map 1 with the Optitrack and onboard sensor odometry, and Figure 14 shows Map 2 and Map 3. Both maps were tested with onboard sensor odometry. Table 8 summarizes the experiments conducted in real life, and Table 9 summarizes their results.
The proposed system, in all the scenarios presented, found and detected the target 96.08% of the time and never had any collision with obstacles or left the ROI. The drone found the target with three different obstacle configurations and two different visibility conditions while safely exploring the environment. The results demonstrate the ability of the decision-making module to generate a safe sequence of actions. They also highlight the reliability of the localization module integrated with pose estimation uncertainty and, finally, the capability of the observation function and detection module to detect the target. Of 51 flight tests, the agent went over the maximum altitude four times and got stuck in the environment two times. These metrics were obtained by processing the ground truth data from the Optitrack system.
To more deeply assess how the agent behaves, its time steps to detect the target were recorded for each test scenario. The results were summarized using box plots, as illustrated in Figure 15.
Similar results are shown in Map 1 for normal- and low-visibility conditions. When using the Optitrack system, and a consequent lower pose estimation uncertainty (0.025 m standard deviation), the agent has a median time step of 25 with an interquartile range of 8 and 1, respectively. When using the 2D LiDAR/IMU odometry and pose estimation uncertainty of 0.06 m, the interquartile range increases to 33 and 34, with a similar median of 26 time steps. For Map 1 and Map 2, in Figure 15c, the median time step is 65 and 28, respectively, and their interquartile range is 6 and 16.
Figure 16 and Figure 17 highlight the most frequent paths for Map 1. The POMDP solver always outputs the following sequence of actions: increase its altitude following the modeled observation function and going toward the center of the map. After reaching the center, the agent either decides to explore the upper part of the map, as highlighted in Figure 16 and Figure 17, or decides to explore the bottom part of the environment as shown in Figure 18. This figure highlights another possible path selected by the decision-making module, resulting in a longer mission time and more exploration. The paths shown in Figure 16 and Figure 17 represent the principal paths selected by the agent, which are consistent in both the Optitrack system and the 2D LiDAR/IMU odometry. This consistency is supported by the analysis presented in the boxplots in Figure 15a,b, which show similar medians. However, the longer path, depicted in Figure 18, occurs more frequently with the odometry system, as highlighted by the corresponding boxplot with a larger interquartile range.
Figure 19 illustrates the agent successfully navigating over an obstacle within Map 3. This highlights the integration of obstacle detection and avoidance strategies, ensuring safety while being able to follow the mission’s objectives.
Figure 20 and Figure 21 illustrate instances where the agent becomes stuck in specific areas of the map, in this case, Maps 2 and 3, resulting in repetitive actions such as UP-DOWN-UP-DOWN. These scenarios highlight a limitation of the system, where the decision-making module fails to escape local loops.
The root mean square deviation (RMSE) and standard deviation between ground truth were calculated to assess the performance of the Hector mapping package. The ground truth is given by the Optitrack system, and the pose estimation is given by the 2D LiDAR/IMU odometry. As shown in Table 10, the POMDP framework was able to perform efficiently with a maximum mean RMSE of 0.0627 m and a maximum mean standard deviation of 0.0308 m.

8. Discussion

The study presented in this research article provides a compelling system that enables a UAV to make decisions and navigate without human intervention in challenging contexts while addressing the constraints of limited sensor capabilities. The conditions considered in this research were the unavailability of GNSS signals, the presence of obstacles, and degraded visibility. This work is a continuation of [34,35,36] and first tests the POMDP system against a baseline algorithm in simulation. Then, it presents experiments that assess the performance of the fully integrated system in real-world experiments, including decision-making, target detection, and localization modules. Limited sensor capacities were simulated using entry-level sensors such as the 160 × 120 pixel resolution thermal camera PureThermal 3 FLIR and the two-dimensional LiDAR RPI S1. The system is flexible and scalable depending on mission goals and sensors used due to the modularity of the POMDP formulation and framework. It was originally designed for small UAVs due to the transition function being modeled based on the dynamics model of a quadrotor, but it can be easily modified to work with other multirotor UAVs of different sizes. Within the POMDP formulation, the actions were selected to simplify the model and work for multirotor UAVs, with actions such as hovering and simple traversal movements (right, left, up, and down).
The Max Altitude instances in real-world testings can be explained by the ToF lidar used to estimate the agent’s height. The TFMini Plus Micro LiDAR integrated with the Pixhawk 6X provides altitude measurements that are generally accurate during flight but can exhibit a slight offset, mainly when the drone is close to or on the ground. Once the drone ascends, the sensor provides accurate measurements, while maintaining the initial offset from the ground. This offset from the estimated altitude of the sensor and ground truth from the Optitrack system explains the rare instances where the agent ascended above the maximum altitude. The lower uncertainty of pose estimation when using the Optitrack system resulted in less variety in the paths, as shown in Section 7.2 and Figure 15, compared to the odometry of the sensors onboard. The reduced uncertainty in pose estimation enables the agent to more accurately determine its proximity to obstacles, which increases its confidence when selecting actions.
One limitation of the current framework is its unchanged reliance on a pre-provided occupancy map before the mission, as highlighted in [34,35,36]. The environment should be assumed to be static with respect to obstacle positions, and the map is not updated during flight. This framework uses the Hector SLAM package for pose estimation, but the SLAM map is not integrated with the POMDP formulation. Visibility conditions can be considered stochastic in this framework, as thermal cameras effectively detect heat signatures in both normal- and low-visibility scenarios. The non-integration of map updates within the POMDP forces a high dependency on the localization module and its reliability. However, as demonstrated in Section 7, an entry-level 2D LiDAR integrated with a simple SLAM algorithm offers largely enough accuracy and reliability for autonomous navigation in cluttered environments. Section 7 also highlighted some instances in which the agent becomes stuck in specific areas of the map, unable to break the repetitive loop of UP-DOWN-UP-DOWN actions. The probable cause of this random issue is either a default in the problem formulation, a problem during the execution and processing of the policy, or a limitation of the POMDP solver itself. The POMDP is a highly computational decision-making algorithm, and the problem formulated in this paper is complex with several mission objectives, such as exploration, obstacle avoidance, staying in the ROI, and target detection. However, even with this complexity, the agent never crashed in 30 simulated flight tests and 51 real-world flight tests.

9. Conclusions and Future Work

This research discussed a solution that allows an autonomous UAV to safely explore an environment without a GNSS, with obstacles, and with degraded visibility, and to locate a target. The system was further constrained by limited sensor capacities. To increase the cognitive abilities and autonomy of the drone, the problem was formulated as a Partially Observable Markov Decision Process. The system was evaluated in a search and rescue scenario in which the UAV had to autonomously avoid obstacles, explore an indoor environment with obstacles, and locate a victim whose position was unknown, under varying visibility conditions. The system was first tested in simulation and compared with a baseline algorithm consisting of a lawn mower pattern fused with an A* algorithm. Although the baseline relied on fixed-altitude 2D navigation with no uncertainty modeling, the POMDP framework enabled adaptive 3D path planning, improving obstacle avoidance and target detection. The results show that the ability of the POMDP to adjust altitude and react to observations led to a significantly higher success rate, justifying its further testing in real life. The framework was then evaluated with real-life experiments with entry-level sensors. The agent was able to localize itself while relying on onboard sensors only, with a 2D LiDAR/IMU odometry for (X, Y) pose estimation and a ToF LiDAR integrated with a PX4 autopilot for (Z) pose estimation. A small-resolution thermal camera was integrated into the system to detect the victim using a YOLO detector. The motion policy was computed using the ABT solver, and all computations were processed in real time on an onboard companion computer. Real-world experiments confirmed the practicality and performance of the proposed framework, even with entry-level sensors.
The primary contributions of this paper are as follows:
  • This paper validates the feasibility of deploying a POMDP-based reinforcement learning framework for autonomous UAV navigation and target detection in visually degraded, cluttered, and GNSS-denied environments. The complete framework was implemented and tested on a fully integrated UAV system that relies entirely on onboard sensing and computation, demonstrating its real-world applicability for critical missions such as search and rescue.
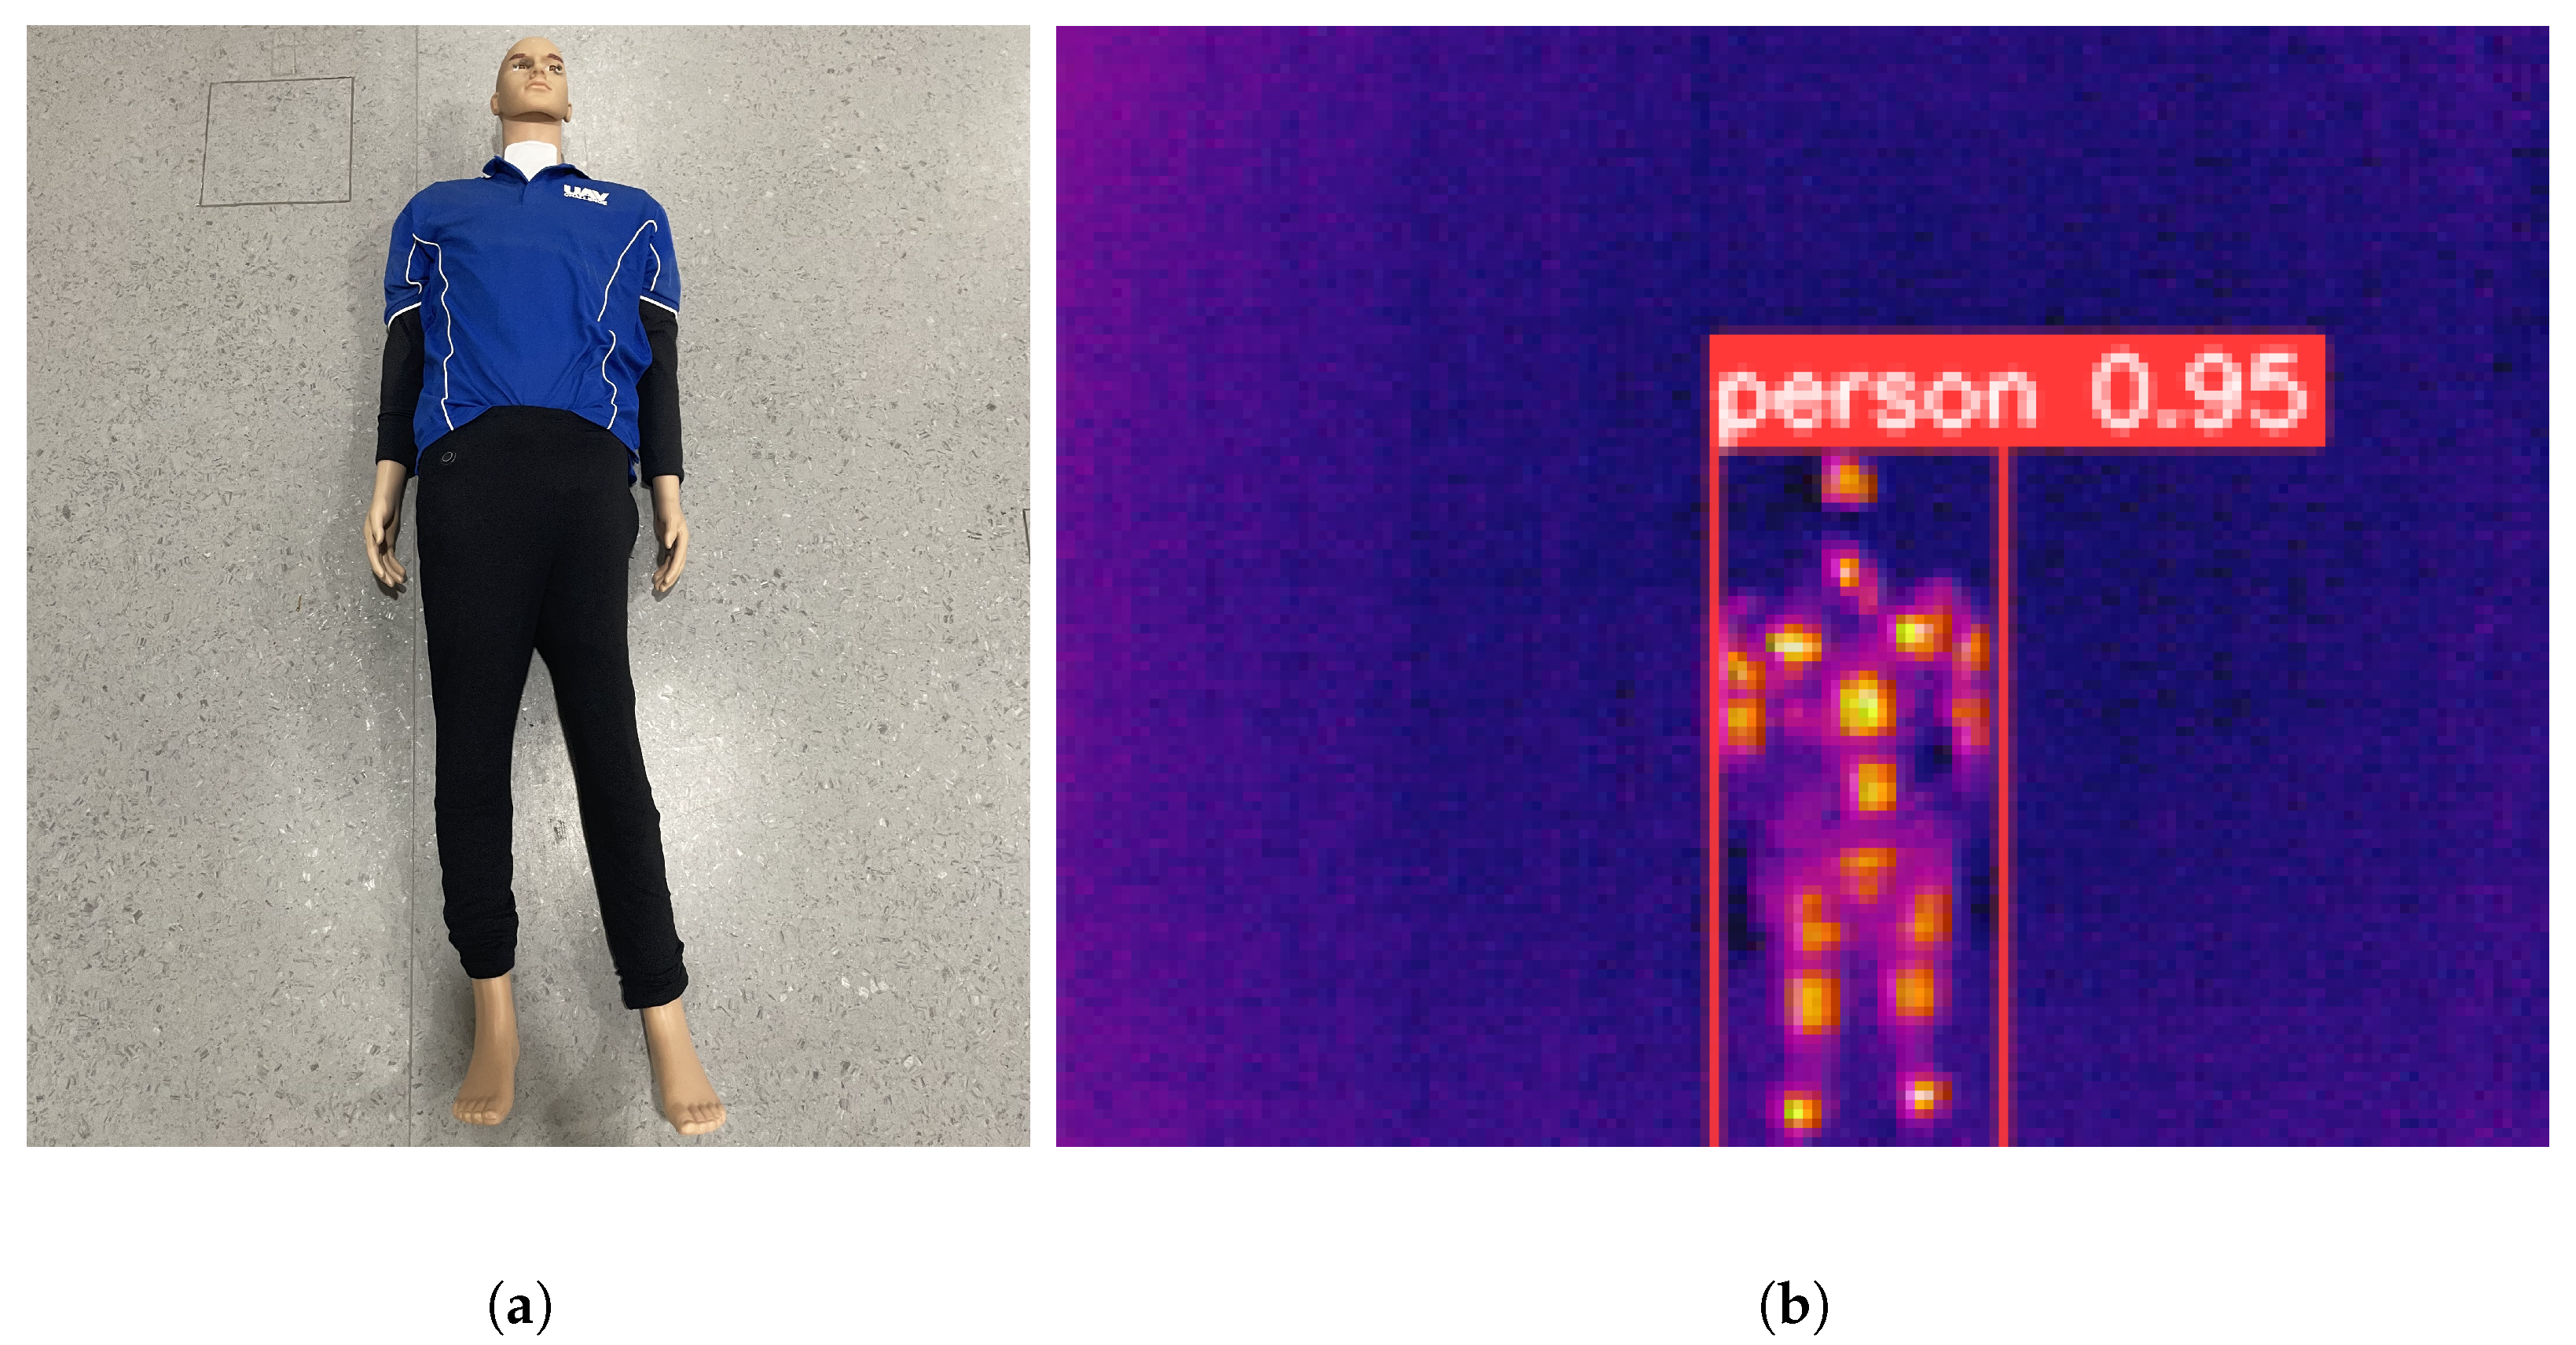
  • A realistic observation model was developed by integrating a modern onboard object detection system into the POMDP formulation. The target detection is modeled as a probabilistic observation aligned with the camera’s field of view and bounding box detection’s output, allowing the belief over the target’s location to be updated effectively during flight.
  • The framework explicitly incorporates sensor uncertainty into the belief space of the UAV’s pose, enabling robust navigation in GNSS-denied environments. Two levels of uncertainty are compared: low uncertainty using OptiTrack and high uncertainty using Hector SLAM, both represented within the POMDP formulation.
This study builds on and extends previous work [34,35,36] by enabling the agent to rely solely on onboard sensors for localization. The framework was evaluated in real-world scenarios using entry-level sensors, which introduced greater uncertainty in pose estimation and target detection. The objective was to assess the system’s performance under these increased uncertainties and realistic conditions. Furthermore, this study tested the improved POMDP model from [35] in real-life settings, incorporating a new observation function that represents the target as a bounding box rather than a single point.
Enabling UAVs to autonomously navigate under varying-visibility conditions and in challenging environments with entry-level sensors aims to increase the range of utilization of remote platforms in critical applications. Disaster scenarios often expose human operators to significant risks while attempting to locate and save stranded persons. Autonomous UAV solutions could significantly ease the detection of victims in these difficult contexts.
Future work will focus on integrating the computed map from the SLAM algorithm with the POMDP framework, eliminating the need for a precomputed occupancy map. This advancement would allow the system to operate effectively in unknown environments and address fully stochastic scenarios. The testing of different POMDP solvers, odometry algorithms, or deep learning object detectors could offer interesting results, as the framework enables the implementation of other tools. Incorporating real-time output from a deep learning detector, such as detection accuracy, with the observation function could make the framework more robust in more challenging missions. Finally, future work could include evaluating the system’s operational feasibility in larger, more complex areas and expanding its applications to broader applications.

Author Contributions

Conceptualization, S.B., F.V., J.G.-S. and F.G.; formal analysis, S.B.; investigation, S.B.; methodology, S.B., F.V., J.G.-S. and F.G.; project administration, F.G.; resources, F.G.; software and hardware, S.B., F.V. and J.G.-S.; validation, J.G.-S., F.V. and F.G.; writing—original draft, S.B.; writing—review and editing, S.B., F.V., J.G.-S. and F.G. All authors have read and agreed to the published version of the manuscript.

Funding

This research was funded by the Queensland University of Technology (QUT) through the Higher Degree Research (HDR) Tuition Fee Sponsorship and the QUT Postgraduate Research Award (QUTPRA).

Data Availability Statement

The data collected are available at https://1drv.ms/u/c/f3fe32f68b0e0465/EQlAvnrMbW1LpweN9-HGi7oBi688CkY4ndrVV_GyyoS3kw (accessed on 2 April 2025).

Acknowledgments

The authors gratefully acknowledge the ongoing support from QUT through the QUT Centre for Robotics (QCR) and the Faculty of Engineering. Special thanks are extended for providing access to facilities and supporting flight tests at O134, O Block, QUT.

Conflicts of Interest

The authors declare no conflicts of interest.

Abbreviations

The following abbreviations are sequentially used in this paper:
2DTwo-dimensional;
3DThree-dimensional;
ABTAugmented Belief Tree;
FOVField of View;
GNSSGlobal Navigation Satellite System;
GPSGlobal Positioning System;
HILHardware in the Loop;
IoUIntersection over Union;
IRInfrared;
LiDARLight Detection and Ranging;
mAPMean Average Precision;
MDPMarkov Decision Process;
ODOMOdometry;
OPTIOptitrack System;
OSOperating System;
POMDPPartially Observable Markov Decision Process;
RGBRed, Green, Blue;
RLReinforcement Learning;
RLTReal-Life Testing;
RMSERoot Mean Square Deviation;
ROIRegion of Interest;
ROSRobot Operating System;
SDPSequential Decision Process;
SITLSoftware in the Loop;
SLAMSimultaneous Localization and Mapping;
ToFTime of Flight;
UASUnmanned Aircraft System;
UAVUnmanned Aerial Vehicle.

References

  1. Zimroz, P.; Trybala, P.; Wroblewski, A.; Goralczyk, M.; Szrek, J.; Wojcik, A.; Zimroz, R. Application of UAV in search and rescue actions in underground mine a specific sound detection in noisy acoustic signal. Energies 2021, 14, 3725. [Google Scholar] [CrossRef]
  2. Zhou, D.; Qi, L.; Zhang, D.; Zhou, B.; Guo, L. Unmanned aerial Vehicle (UaV) Photogrammetry Technology for Dynamic Mining Subsidence Monitoring and Parameter Inversion: A Case Study in China. IEEE Access 2020, 8, 16372–16386. [Google Scholar]
  3. Ebadi, K.; Bernreiter, L.; Biggie, H.; Catt, G.; Chang, Y.; Chatterjee, A.; Denniston, C.E.; Deschênes, S.P.; Harlow, K.; Khattak, S.; et al. Present and Future of SLAM in Extreme Environments: The DARPA SubT Challenge. IEEE Trans. Robot. 2024, 40, 936–959. [Google Scholar] [CrossRef]
  4. Thrun, S.; Burgard, W.; Fox, D. Probabilistic Robotics; The MIT Press: Cambridge, MA, USA, 2006. [Google Scholar]
  5. Kochenderfer, M.J. Decision Making Under Uncertainty: Theory and Application; Lincoln Laboratory Series; MIT Press: Cambridge, MA, USA, 2015. [Google Scholar]
  6. Russell, S.J.S.J. Artificial Intelligence: A Modern Approach, 4th ed.; Pearson: London, UK, 2021. [Google Scholar]
  7. Deshpande, S.V.; R, H.; Walambe, R. POMDP-based probabilistic decision making for path planning in wheeled mobile robot. Cogn. Robot. 2024, 4, 104–115. [Google Scholar] [CrossRef]
  8. Martins, G.S.; Al Tair, H.; Santos, L.; Dias, J. POMDP-based user-adaptive decision-making for social robots. Pattern Recognit. Lett. 2019, 118, 94–103. [Google Scholar] [CrossRef]
  9. Bhattacharya, S.; Kailas, S.; Badyal, S.; Gil, S.; Bertsekas, D. Multiagent Reinforcement Learning: Rollout and Policy Iteration for POMDP with Application to Multirobot Problems. IEEE Trans. Robot. 2024, 40, 2003–2023. [Google Scholar] [CrossRef]
  10. Sharma, P.; Kraske, B.; Kim, J.; Laouar, Z.; Sunberg, Z.; Atkins, E. Investigation of risk-aware MDP and POMDP contingency management autonomy for UAS. arXiv 2023, arXiv:2304.01052. [Google Scholar]
  11. Yang, Q.; Zhang, J.; Shi, G. Modeling of UAV path planning based on IMM under POMDP framework. J. Syst. Eng. Electron. 2019, 30, 545–554. [Google Scholar] [CrossRef]
  12. dos Santos, M.A.A.; Vivaldini, K.C.T. A Modeling Strategy Using Bayesian Optimization with POMDP for Exploration and Informative Path Planning of UAVs in Monitoring of Forest. In Proceedings of the 2022 International Conference on Computational Science and Computational Intelligence (CSCI), Las Vegas, NV, USA, 14–16 December 2022; pp. 451–456. [Google Scholar] [CrossRef]
  13. Ragi, S.; Chong, E.K.P. UAV Path Planning in a Dynamic Environment via Partially Observable Markov Decision Process. IEEE Trans. Aerosp. Electron. Syst. 2013, 49, 2397–2412. [Google Scholar] [CrossRef]
  14. Eaton, C.M.; Chong, E.K.; Maciejewski, A.A. Robust UAV path planning using POMDP with limited FOV sensor. In Proceedings of the 2017 IEEE Conference on Control Technology and Applications (CCTA), Maui, HI, USA, 27–30 August 2017; pp. 1530–1535. [Google Scholar] [CrossRef]
  15. Trotti, F.; Farinelli, A.; Muradore, R. An online path planner based on POMDP for UAVs. In Proceedings of the 2023 European Control Conference (ECC), Bucharest, Romania, 13–16 June 2023; pp. 1–6. [Google Scholar] [CrossRef]
  16. Jiang, W.; Lyu, Y.; Li, Y.; Guo, Y.; Zhang, W. UAV path planning and collision avoidance in 3D environments based on POMPD and improved grey wolf optimizer. Aerosp. Sci. Technol. 2022, 121, 107314. [Google Scholar] [CrossRef]
  17. Zaninotti, M.; Lesire, C.; Watanabe, Y.; Chanel, C.P.C. Learning Path Constraints for UAV Autonomous Navigation under Uncertain GNSS Availability. In Proceedings of the Frontiers in Artificial Intelligence and Applications, Hangzhou, China, 29–30 October 2022; Volume 351, pp. 59–71. [Google Scholar]
  18. Guan, X.; Lu, Y.; Ruan, L. Joint Optimization Control Algorithm for Passive Multi-Sensors on Drones for Multi-Target Tracking. Drones 2024, 8, 627. [Google Scholar] [CrossRef]
  19. Zhang, B.; Jing, T.; Lin, X.; Cui, Y.; Zhu, Y.; Zhu, Z. Deep Reinforcement Learning-based Collaborative Multi-UAV Coverage Path Planning. J. Phys. Conf. Ser. 2024, 2833, 012017. [Google Scholar] [CrossRef]
  20. Wang, Y.; Zeng, W.; Li, G.; Xiong, C.; Wang, Z.; Mao, Y. An Energy-Aware UAVs Path Coverage for Critical Infrastructure Inspections. In Proceedings of the 2024 Twelfth International Conference on Advanced Cloud and Big Data (CBD), Brisbane, Australia, 28 November–2 December 2024; pp. 222–227. [Google Scholar] [CrossRef]
  21. Floriano, B.; Borges, G.A.; Ferreira, H. Planning for Decentralized Formation Flight of UAV fleets in Uncertain Environments with Dec-POMDP. In Proceedings of the 2019 International Conference on Unmanned Aircraft Systems (ICUAS), Atlanta, GA, USA, 11–14 June 2019; pp. 563–568. [Google Scholar] [CrossRef]
  22. Sandino, J.; Vanegas, F.; Maire, F.; Caccetta, P.; Sanderson, C.; Gonzalez, F. UAV Framework for Autonomous Onboard Navigation and People/Object Detection in Cluttered Indoor Environments. Remote Sens. 2020, 12, 3386. [Google Scholar] [CrossRef]
  23. Sandino, J.; Caccetta, P.A.; Sanderson, C.; Maire, F.; Gonzalez, F. Reducing Object Detection Uncertainty from RGB and Thermal Data for UAV Outdoor Surveillance. In Proceedings of the IEEE Aerospace Conference Proceedings, Big Sky, MT, USA, 5–12 March 2022. [Google Scholar]
  24. Systems, V.M. Vicon: Award Winning Motion Capture Systems. Available online: https://www.vicon.com/ (accessed on 21 January 2025).
  25. Vanegas, F.; Gonzalez, F. Enabling UAV navigation with sensor and environmental uncertainty in cluttered and GPS-denied environments. Sensors 2016, 16, 666. [Google Scholar] [CrossRef] [PubMed]
  26. Vanegas, F.; Gaston, K.J.; Roberts, J.; Gonzalez, F. A Framework for UAV Navigation and Exploration in GPS-Denied Environments. In Proceedings of the 2019 IEEE Aerospace Conference, Big Sky, MT, USA, 2–9 March 2019; pp. 1–6. [Google Scholar]
  27. Khattak, S.; Nguyen, H.; Mascarich, F.; Dang, T.; Alexis, K. Complementary Multi–Modal Sensor Fusion for Resilient Robot Pose Estimation in Subterranean Environments. In Proceedings of the 2020 International Conference on Unmanned Aircraft Systems (ICUAS), Athens, Greece, 1–4 September 2020; pp. 1024–1029. [Google Scholar] [CrossRef]
  28. Zhang, J.; Singh, S. LOAM: Lidar Odometry and Mapping in real-time. Robot. Sci. Syst. Conf. 2014, 2, 109–111. [Google Scholar]
  29. Khattak, S.; Papachristos, C.; Alexis, K. Keyframe-based Direct Thermal—Inertial Odometry. In Proceedings of the 2019 International Conference on Robotics and Automation (ICRA), Montreal, QC, Canada, 20–24 May 2019; pp. 3563–3569. [Google Scholar] [CrossRef]
  30. Bloesch, M.; Omari, S.; Hutter, M.; Siegwart, R. Robust visual inertial odometry using a direct EKF-based approach. In Proceedings of the 2015 IEEE/RSJ International Conference on Intelligent Robots and Systems (IROS), Hamburg, Germany, 28 September–2 October 2015; pp. 298–304. [Google Scholar] [CrossRef]
  31. Lynen, S.; Achtelik, M.W.; Weiss, S.; Chli, M.; Siegwart, R. A robust and modular multi-sensor fusion approach applied to MAV navigation. In Proceedings of the 2013 IEEE/RSJ International Conference on Intelligent Robots and Systems, Tokyo, Japan, 3–7 November 2013; pp. 3923–3929. [Google Scholar] [CrossRef]
  32. Dang, T.; Mascarich, F.; Khattak, S.; Papachristos, C.; Alexis, K. Graph-based Path Planning for Autonomous Robotic Exploration in Subterranean Environments. In Proceedings of the 2019 IEEE/RSJ International Conference on Intelligent Robots and Systems (IROS), Macau, China, 3–8 November 2019; pp. 3105–3112. [Google Scholar] [CrossRef]
  33. Tsiourva, M.; Papachristos, C. Multi-modal Visual-Thermal Saliency-based Object Detection in Visually-degraded Environments. In Proceedings of the 2020 IEEE Aerospace Conference, Big Sky, MT, USA, 7–14 March 2020; pp. 1–9. [Google Scholar] [CrossRef]
  34. Boiteau, S.; Vanegas, F.; Sandino, J.; Gonzalez, F.; Galvez-Serna, J. Autonomous UAV Navigation for Target Detection in Visually Degraded and GPS Denied Environments. In Proceedings of the 2023 IEEE Aerospace Conference, Big Sky, MT, USA, 4–11 March 2023; pp. 1–10. [Google Scholar] [CrossRef]
  35. Boiteau, S.; Vanegas, F.; Gonzalez, F. A Comprehensive Framework for UAV-Based Autonomous Target Finding in Environments with Limited Global Navigation Satellite Systems and Reduced Visibility. In Proceedings of the 2024 International Conference on Unmanned Aircraft Systems (ICUAS), Chania-Crete, Greece, 4–7 June 2024; pp. 160–167. [Google Scholar] [CrossRef]
  36. Boiteau, S.; Vanegas, F.; Gonzalez, F. Framework for Autonomous UAV Navigation and Target Detection in Global-Navigation-Satellite-System-Denied and Visually Degraded Environments. Remote Sens. 2024, 16, 471. [Google Scholar] [CrossRef]
  37. Optitrack. OptiTrack for Robotics. Available online: https://optitrack.com/applications/robotics/ (accessed on 5 May 2023).
  38. Klimenko, D.; Song, J.; Kurniawati, H. TAPIR: A Software Toolkit for Approximating and Adapting POMDP Solutions Online. In Proceedings of the Proc. Australasian Conference on Robotics and Automation, Melbourne, Australia, 2–4 December 2014. [Google Scholar]
  39. Kurniawati, H.; Yadav, V. An Online POMDP Solver for Uncertainty Planning in Dynamic Environment; Springer International Publishing: Cham, Switzerland, 2016; pp. 611–629. [Google Scholar] [CrossRef]
  40. Chovancová, A.; Fico, T.; Chovanec, Ľ.; Hubinsk, P. Mathematical Modelling and Parameter Identification of Quadrotor (a survey). Modelling of Mechanical and Mechatronic Systems. Procedia Eng. 2014, 96, 172–181. [Google Scholar] [CrossRef]
  41. Kohlbrecher, S.; von Stryk, O.; Meyer, J.; Klingauf, U. A flexible and scalable SLAM system with full 3D motion estimation. In Proceedings of the 2011 IEEE International Symposium on Safety, Security, and Rescue Robotics, Kyoto, Japan, 1–5 November 2011; pp. 155–160. [Google Scholar] [CrossRef]
  42. Ultralytics. yolov5. Available online: https://github.com/ultralytics/yolov5 (accessed on 15 May 2023).
  43. Jiang, C.; Ren, H.; Ye, X.; Zhu, J.; Zeng, H.; Nan, Y.; Sun, M.; Ren, X.; Huo, H. Object detection from UAV thermal infrared images and videos using YOLO models. Int. J. Appl. Earth Obs. Geoinf. 2022, 112, 102912. [Google Scholar] [CrossRef]
  44. Qutas. Breadcrumb (baselineTest Branch). 2025. Available online: https://github.com/qutas/breadcrumb/tree/baselineTest (accessed on 24 March 2025).
  45. Qutas. Spar (breadcrumbTest Branch). 2025. Available online: https://github.com/qutas/spar/tree/breadcrumbTest (accessed on 24 March 2025).
  46. Meier, L.; Honegger, D.; Pollefeys, M. PX4: A node-based multithreaded open source robotics framework for deeply embedded platforms. In Proceedings of the 2015 IEEE International Conference on Robotics and Automation (ICRA), Seattle, WA, USA, 26–30 May 2015; pp. 6235–6240. [Google Scholar] [CrossRef]
  47. Open Robotics. Rescue Randy—Gazebo Model. 2025. Available online: https://app.gazebosim.org/OpenRobotics/fuel/models/Rescue%20Randy (accessed on 24 March 2025).
  48. Foundation, O.S.R. Robot Operating System. Available online: https://www.ros.org/ (accessed on 5 May 2023).
  49. Ermakov, V. Mavros. Available online: http://wiki.ros.org/mavros (accessed on 5 May 2023).
  50. Koubâa, A.; Allouch, A.; Alajlan, M.; Javed, Y.; Belghith, A.; Khalgui, M. Micro Air Vehicle Link (MAVlink) in a Nutshell: A Survey. IEEE Access 2019, 7, 87658–87680. [Google Scholar] [CrossRef]
Figure 1. Cycle of a POMDP process: Starting from an initial belief state, the UAV agent chooses actions based on a policy. Each action results in a new state, a reward, and an observation, which are then used to update the belief state.
Drones 09 00410 g001
Figure 2. System architecture for the proposed framework. The detection module processes infrared raw frames taken with a thermal camera. LiDAR inertial odometry is used by the localization module to estimate the pose of the drone. A sequence of actions is sent to the flight controller by the decision-making and motion modules.
Drones 09 00410 g002
Figure 3. Grid-map representation of the testing environment during the flight with the updated cells.
Drones 09 00410 g003
Figure 4. Mannequin and its corresponding detection during flight. (a) Mannequin with a heat signature resembling a human being. (b) Detection with a 95% confidence during a mission.
Drones 09 00410 g004
Figure 5. Visualization of target position belief in red point cloud and agent position belief in white point cloud. Obstacles are in green. On the left is the initialization of the belief states, and on the right is the updated belief states after a few time steps.
Drones 09 00410 g005
Figure 6. Visualization of how the observation function works. The area footprint of the camera is represented by the four dotted lines and quadrilateral. The target belief states are shown as bounding boxes, with red representing being out of the camera footprint and green being inside. Obstacles are represented in light green.
Drones 09 00410 g006
Figure 7. Simulated victim (a) and its thermal signature from simulated thermal camera (b).
Drones 09 00410 g007
Figure 8. Environment setup in Gazebo with the drone in orange and the victim lying down.
Drones 09 00410 g008
Figure 9. Environment setup at QUT O134 with normal-visibility condition (a) and low-visibility condition (b).
Drones 09 00410 g009
Figure 10. Maps used to test the system and baseline. Light green boxes are for obstacles of 3.5 m, and deeper green for obstacles of 2.5 m. (a) Map 1; (b) Map 2; (c) Map 3.
Drones 09 00410 g010
Figure 11. Quadcopter side view with hardware labeled.
Drones 09 00410 g011
Figure 12. The Map 1 and Map 3 baseline waypoints are shown in green circles, the corresponding path in green, and lawn mower pattern waypoints in red circles. (a) Map 1 baseline waypoints; (b) Map 3 baseline waypoints.
Drones 09 00410 g012
Figure 13. Environment in Rviz for Map 1 when the mission starts. On the left is the Optitrack system with 0.025 m standard deviation for the agent position belief. On the right is the onboard sensors odometry with 0.06 m standard deviation for the agent position belief.
Drones 09 00410 g013
Figure 14. Environment in Rviz for both Map 2 (on the left) and Map 3 (on the right) when the mission starts. Both are tested with the onboard sensor’s odometry and 0.06 m standard deviation for the agent position belief.
Drones 09 00410 g014
Figure 15. Number of steps required to find the target for Map 1, Map 2, and Map 3. In the boxplots, the blue boxes represent the interquartile range, the red lines indicate the median, the black whiskers extend to the minimum and maximum values within 1.5 times the interquartile range, and the blue circles denote outliers. The outliers are defined as points that lie beyond 1.5 times the interquartile range. (a) Exp-1 and Exp-2; (b) Exp-3 and Exp-4; (c) Exp-5 and Exp-6.
Drones 09 00410 g015
Figure 16. Map 1. One of the most frequent trajectories with the probable target position as a red point cloud. This was recorded one time step before target detection. The green boxes are the obstacles, and the flying area is green as well.
Drones 09 00410 g016
Figure 17. Map 1. Other most frequent trajectories with the probable target position as a red point cloud. This was recorded one time step before target detection. The green boxes are the obstacles, and the flying area is green as well.
Drones 09 00410 g017
Figure 18. Map 1. Long drone’s trajectory with the probable target position as a red point cloud. This was recorded one time step before target detection. The green boxes are the obstacles, and the flying area is green as well.
Drones 09 00410 g018
Figure 19. Drone ability to fly over obstacles of smaller size in darker green. The probable target position is represented by a red point cloud. The other obstacles and flying area are in green.
Drones 09 00410 g019
Figure 20. The agent becoming stuck in Map 2. The green boxes are the obstacles, and the flying area is green as well. The probable target position is represented by a red point cloud.
Drones 09 00410 g020
Figure 21. The agent becoming stuck in Map 3. The green boxes are the obstacles, and the flying area is green as well. The probable target position is represented by a red point cloud.
Drones 09 00410 g021
Table 1. Actions selected in the POMDP formulation.
Actionxa(t + 1)ya(t + 1)za(t + 1)
Forward   x a ( t ) + Δ x   y a ( t )   z a ( t )
Backward   x a ( t ) Δ x   y a ( t )   z a ( t )
Left   x a ( t )   y a ( t ) + Δ y   z a ( t )
Right   x a ( t )   y a ( t ) Δ y   z a ( t )
Up   x a ( t )   y a ( t )   z a ( t ) + Δ z
Down   x a ( t )   y a ( t )   z a ( t ) Δ z
Hover   x a ( t )   y a ( t )   z a ( t )
Table 2. Rewards and their corresponding values used in the POMDP formulation.
RewardValueDescription
rcrash−110Crashing
rout−110Out of ROI
rf200Victim located
rexp−5Explored area
rnew20Explore new area
ralt−75Leaving altitude range
Table 3. Hardware and equipment.
EquipmentOriginDescription
X500 V2 multirotor kitShenzhen City, ChinaQuadcopter
Pixhawk 6XShenzhen City, ChinaAutopilot
FLIR Lepton FSWilsonville, U.S.Thermal camera
PureThermal 3 Lepton
Board
Wilsonville, U.S.Thermal camera board
Jetson Orin NanoSanta Clara, U.S.Onboard computer
RPI S1 2D LiDARShanghai, China2D LiDAR
TFMini Plus Micro LiDARBeijing, ChinaToF LiDAR
Table 4. Parameters of the POMDP formulation.
VariableValueDescription
  γ 0.93Discount factor
  z m i n 2.0 mMinimum altitude
  z m a x 3.5 mMaximum altitude
  Δ x 1 mx displacement
  Δ y 1 my displacement
  Δ z 0.3 mz displacement
  p a 0 (−4.5; −2.5; 2.0)Intial agent position
  t s t e p m a x 100Number of time steps
  Δ t 2 sTime step
v0.5 m/sVelocity
  μ θ 1 radAngle uncertainty
Table 5. Summary of experiments in simulation comparing the baseline lawnn mower A* algorithm against the POMDP algorithm.
ExperimentEnvironmentAltitudeAlgorithm
Baseline-1Map 1Fixed: 3 mLawn mower A*
Baseline-2Map 1Fixed: 2 mLawn mower A*
Baseline-3Map 3Fixed: 3 mLawn mower A*
Baseline-4Map 3Fixed: 2 mLawn mower A*
POMDP-1Map 1DynamicPOMDP
POMDP-2Map 2DynamicPOMDP
POMDP-3Map 3DynamicPOMDP
Table 6. Performance metrics of simulation testing.
SetupIterationsSuccessAverage Time (s)Average Time
Steps
Baseline-110100%8844
Baseline-2100%N/AN/A
Baseline-310100%10653
Baseline-4100%N/AN/A
POMDP-110100%87.141.1
POMDP-21080%70.133
POMDP-210100%109.552.2
Baseline4050%9770.5
POMDP3093.3%88.942.1
Table 7. Comparison of baseline algorithm and POMDP framework.
CategoryBaseline AlgorithmPOMDP Framework
Algorithm TypeLawn-mower + A*Decision-making under uncertainty
Altitude ControlFixed (2D navigation)Adaptive (3D navigation)
Uncertainty HandlingNoneProbabilistic modeling
Obstacle AvoidanceA* (2D)Adaptive 3D path planning
Target Detection Rate50% (FOV limitation)93.3% (altitude adjustment)
Environmental AdaptabilityFollows set pathsAdjusts to observations
Performance on TerrainNo adaptation to obstacle heightAdjusts path based on terrain
Table 8. Summary of Experiments in real-life testing.
ExperimentEnvironmentVisibility ConditionsLocalization
Exp-1Map 1NormalOptitrack
Exp-2Map 1NormalOdometry
Exp-3Map 1Low visibiltyOptitrack
Exp-4Map 1Low visibiltyOdometry
Exp-5Map 2NormalOdometry
Exp-6Map 3NormalOdometry
Table 9. Performance metrics of the conducted expertiments.
SetupIterationsTarget
Found
Crash
Rate
ROI OutMax
Altitude
Timeout
Rate
Exp-110100%0%0%0%0%
Exp-210100%0%0%20%0%
Exp-310100%0%0%0%0%
Exp-410100%0%0%20%0%
Exp-5580%0%0%0%20%
Exp-6683.3%0%0%0%16.7%
Total5196.08%0%0%7.84%3.92%
Table 10. RMSE and standard deviation (SD).
Test CaseRMSE x (m)RMSE y (m)SD x (m)SD y (m)
Exp-20.04000.05090.02540.0254
Exp-40.04400.05850.02760.0276
Exp-50.04760.06270.03080.0308
Exp-60.05360.05460.02650.0265
Disclaimer/Publisher’s Note: The statements, opinions and data contained in all publications are solely those of the individual author(s) and contributor(s) and not of MDPI and/or the editor(s). MDPI and/or the editor(s) disclaim responsibility for any injury to people or property resulting from any ideas, methods, instructions or products referred to in the content.

