1. Introduction
The exponential increase in the estimated global population, projected to reach 9.7 billion by 2050, increases the probability of food shortages. This scenario presents a significant opportunity for the agricultural sector, particularly in developing countries where it contributes significantly to GDP, as noted in report [
1]. An illustrative case is Ecuador, where agriculture contributes 8% to the national GDP [
2]. Consequently, the agricultural sector must improve both its efficiency and environmental sustainability [
3]. Achieving this requires the adoption of technological advancements such as precision agriculture (PA), agrivoltaics, and other innovative approaches.
This work focuses on contributing to the field of PA in the future, specifically by obtaining digital crop maps to facilitate agricultural decision-making. The ultimate goal is to analyze and manage various agronomic parameters’ spatial and temporal variability under specific field conditions. Several studies on PA have shown that remote sensing is often used as an information source [
4,
5,
6,
7,
8,
9]. However, remote sensing limitations—such as low resolution (15–30 cm), limited periodicity, and high operating costs—have posed significant barriers to widespread adoption [
5]. To overcome these challenges, unmanned aerial vehicles (UAVs) paired with optical sensors offer a promising alternative, providing high-resolution (3–5 cm) data at a much lower cost, making them accessible for use by most farmers [
9].
UAVs have become increasingly common, as highlighted in [
10,
11], owing to the availability of diverse commercial models that cater to various tasks [
12]. Optical sensors, such as RGB, multispectral, and thermal cameras, complement UAVs in PF (Precision Farming) applications [
13]. These cameras enable the collection of topographic data and facilitate the creation of orthomosaics with high spatial resolution, crucial for studies on soil, crop management, and resource allocation [
14,
15]. Several studies have used UAVs to generate orthomosaics and extract valuable information to improve crop efficiency [
11,
13,
16,
17,
18]. Nonetheless, optimizing the entire process from data collection to post-processing remains a challenge to minimize high operational costs [
19].
A promising strategy to optimize these processes involves the use of digital twins (DT)s. Through virtual simulations, UAV models can be tested to refine critical design aspects, including control systems and aerodynamics [
12,
20]. The concept of DTs was initially proposed by NASA and the U.S. Air Force to test aircraft in extreme conditions [
21]. More recent contributions [
12,
19,
22,
23,
24,
25,
26] have applied DTs to improve UAV route planning, navigability, fault diagnosis, and integration with the Internet of Things (IoT). While these studies have contributed to various UAV applications, there remains a gap in optimizing flight missions for PA, specifically for evaluating and improving fieldwork and post-processing time.
Further research [
27,
28,
29,
30,
31,
32,
33] has explored how large volumes of data can increase processing time. These studies focus on optimizing flight height (30–100 m), image overlap (30%), and flight parameters to obtain the best crop images. Such research has led to valuable insights into how to maintain data quality while reducing flight time and processing costs.
One of the major challenges highlighted in these studies is the high cost associated with real UAV missions. To address this issue, digital twin (DT) and software-in-the-loop (SITL) technologies offer a cost-effective solution. SITL allows for virtual testing of UAV systems, which helps to detect errors and refine designs before physical deployment [
12,
34]. This work uses SITL to configure and simulate a UAV’s flight plan in virtual environments for aerial photogrammetry tasks that can aid in AP. The goal is to generate high-resolution orthomosaics, considering environmental factors such as overlay configurations, flight altitude, and wind conditions [
35,
36].
2. Context and Materials
This section presents the study site as well as the hardware and software tools employed in the simulation framework developed for this work.
2.1. Autopilot
The autopilot, or flight controller, is the physical system that interacts with the UAV hardware through control code. It monitors the status of the UAV’s sensors and generates signals for the actuators, controlling the aircraft’s behavior during flight. In this study, the PX4 autopilot (v1.14.0) is selected due to its open-source nature, widespread community support, and the ability to implement the software-in-the-loop (SITL) simulation scheme with various vehicle configurations (air, land, and submersible) as outlined in [
12].
2.2. Ground Control Station (GCS)
A Ground Control Station (GCS) is a computer application that enables communication and control of a UAV via a ground-based computer, typically using a standard protocol such as Mavlink. This allows for monitoring the UAV’s status, controlling the flight, and generating flight missions. For this work, we chose the open-source application QGroundControl (v4.0) as it is compatible with PX4 and supports the SITL simulation framework. QGroundControl provides full flight control, mission planning capabilities, and supports any UAV that adheres to the Mavlink protocol, making it an ideal tool for this simulation-based study.
2.3. Simulation Platform
A critical requirement for this work was the use of software that allows for the simulation of a UAV’s physical and dynamic behavior within a virtual environment. This enables modification of parameters and testing of various scenarios. Among the available simulators for physical objects and environments, such as Unity, FlightGear, X-Plane, and Gazebo, the latter (Gazebo v11.13.0) was selected. Gazebo is open-source software that is compatible with PX4, supports the SITL simulation framework, and meets the specific requirements for this study.
Gazebo is known for its realistic 3D simulation of a wide variety of robots, objects, and sensors within complex environments. It enables precise simulations of the kinematics and dynamics of rigid bodies, along with interactions between objects. This allows for customizing dynamic characteristics and their interactions, as noted in [
37].
The simulation environment is built upon a model of the terrain of interest (DSM) and the UAV with its camera. Gazebo’s support for the SITL framework and PX4 allows for the integration of various vehicle types, including Quads (Iris and Solo), Hex (Typhoon H480), and other configurations such as VTOL, airplanes, and more [
38]. In this work, the Typhoon H480 model was selected due to its customizable configuration and suitability for fieldwork. It is equipped with an integrated camera that can capture orthomosaics which are then used to generate high-resolution orthomosaics—a crucial element for PA.
This simulation framework allows the PX4 flight code to control the behavior of a virtual UAV within a simulated environment. The GCS provides an interface to interact with the virtual UAV in a manner similar to interacting with a real aircraft, allowing the PX4 code to be tested quickly and safely before deployment in the real world. This framework is particularly valuable in situations where access to physical UAVs is limited or to avoid potential risks due to inexperience.
2.4. Study Site
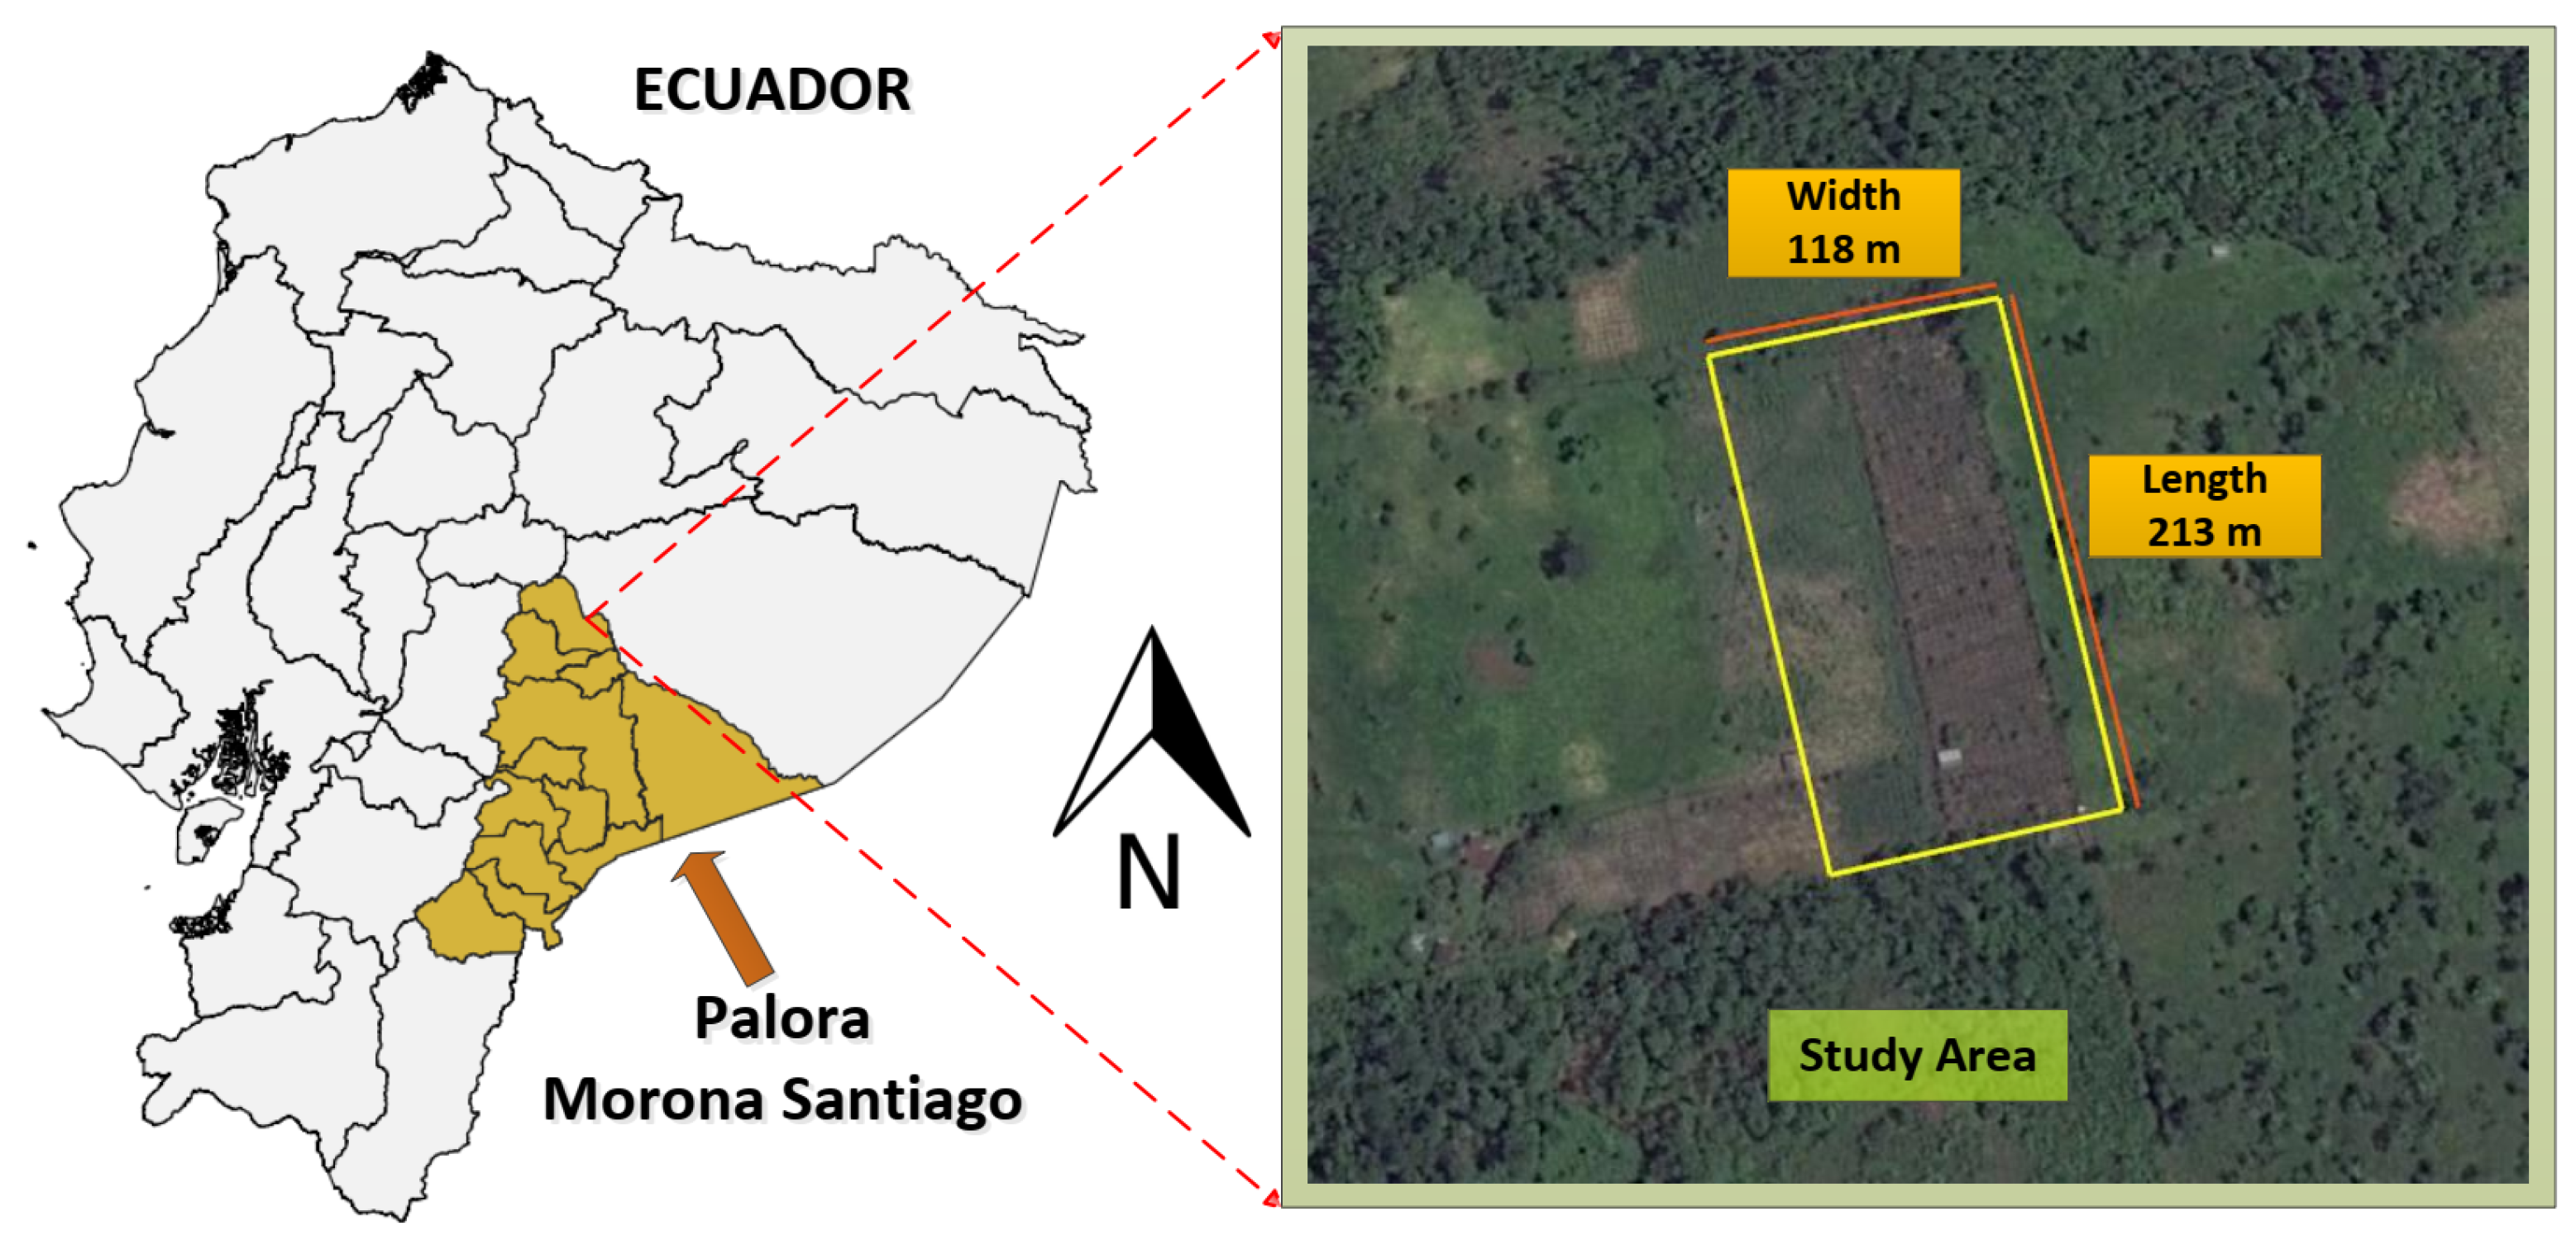
The study site covers an area of approximately 2.5 hectares (118 × 213 m) and is located in the Palora canton in the province of Morona Santiago, Ecuador (latitude: −1.6816°, longitude: −77.9730°) (
Figure 1). This region, part of the Ecuadorian Amazon, is rich in biodiversity and is the largest producer of dragon fruit in Ecuador, making it an ideal location for this study, which focuses on the experimental production of this crop [
39].
The study area is situated at an altitude of 1000 m above sea level (masl) and has favorable meteorological conditions for UAV operations. Meteorological data from 2021 indicate an average temperature of 16.2 °C, relative humidity of 86.2%, atmospheric pressure of 0.81 atm, an average annual wind speed of 1.95 m/s, and a maximum wind speed of 5.23 m/s (data obtained from
https://power.larc.nasa.gov/data-access-viewer/, accessed on 1 October 2023). Based on these conditions, an operational limit of 10 m/s wind speed was established for this study.
2.5. Computer
The simulations were run on a computer equipped with an Intel Core i7-7500U processor (2.7 GHz, 4 cores, 16 GB of RAM). The computer was manufactured by ASUSTeK COMPUTER INC, and assembled in China. The processor was produced by Intel Corporation. It runs the GNU/Linux operating system with the Ubuntu 20.04.6 distribution. This version of Ubuntu is the one recommended for the SITL simulation framework, as indicated in [
38].
3. Methodology
In the field of precision agriculture (PA), the generation of digital maps is crucial for decision-making processes. This study implements a software-in-the-loop (SITL) simulation scheme based on digital twins of a multirotor UAV and its operational environment. The methodology allows for evaluating flight missions in the Gazebo simulator under various configurations.
3.1. UAV Digital Twin
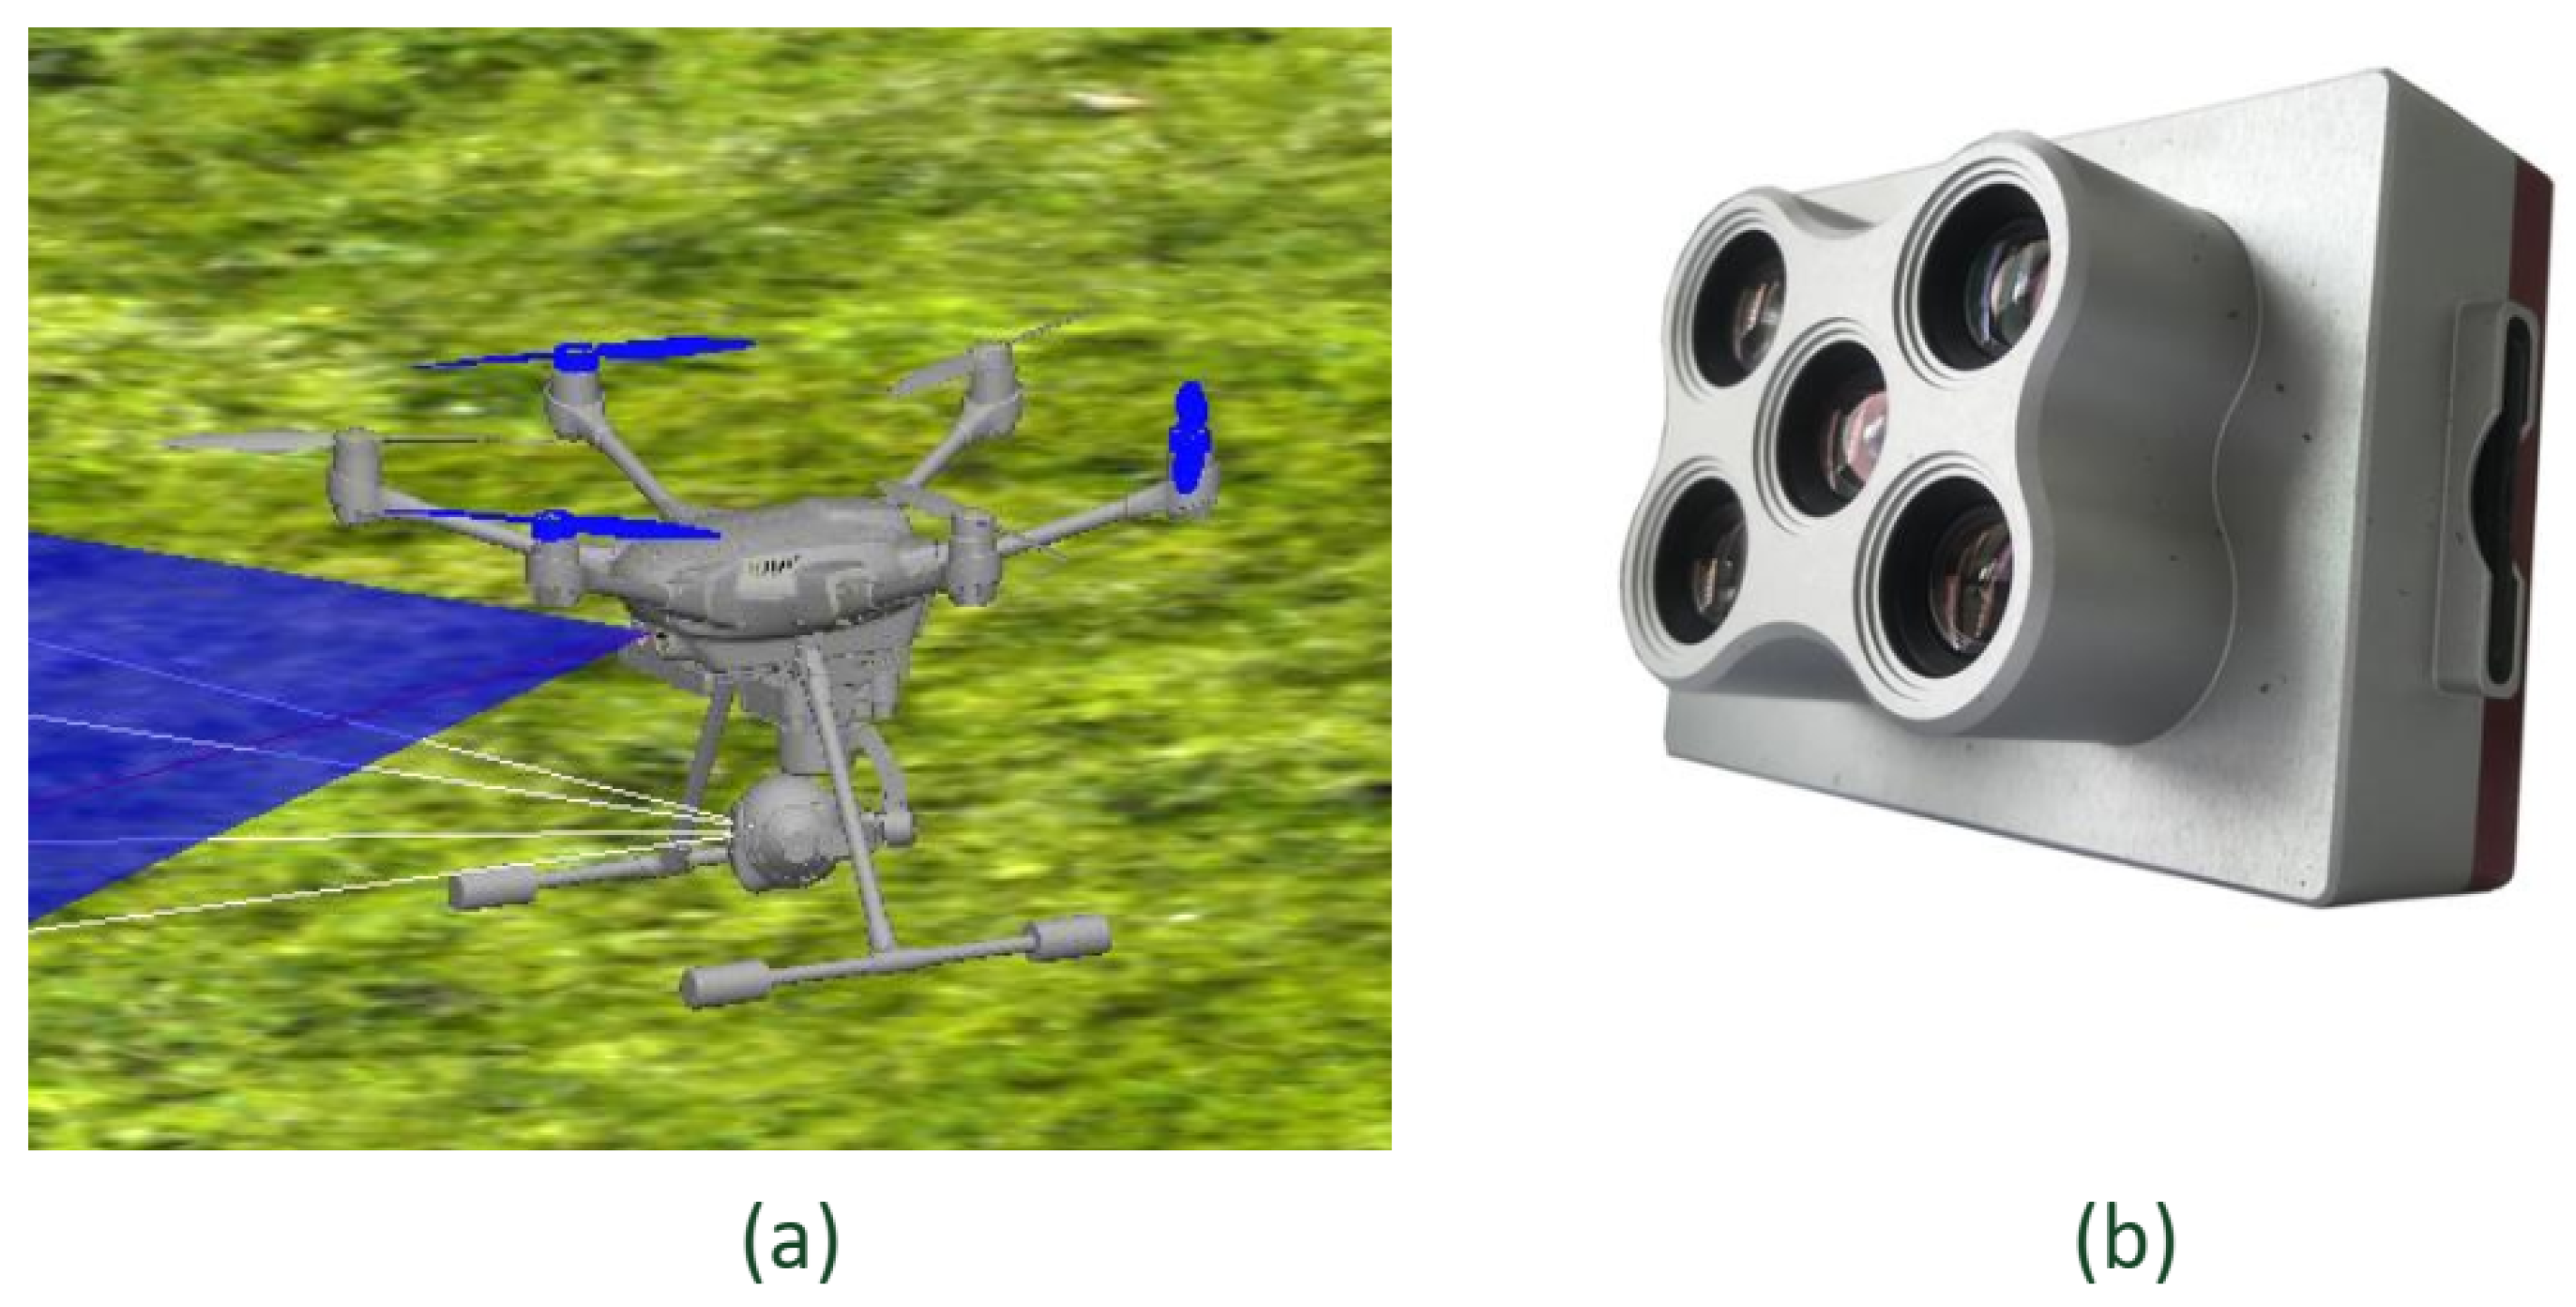
The UAV model selected for the study is the Typhoon H480 shown in
Figure 2, whose physical and aerodynamic parameters are predefined in PX4.
Since the PX4 code for the Typhoon is not modifiable, calibration efforts focus on fine-tuning simulation parameters in Gazebo to align with real-world flight characteristics. The UAV is equipped with a simulated camera to capture aerial imagery for photogrammetry. For the study carried out, a MicaSense multispectral camera model RedEdge-Mx is considered (
Figure 2b), which has the following characteristics:
Sensor size: 4.8 × 3.6 (mm),
Resolution: 1280 × 960 (pixels),
Focal length: 5.4 (mm).
These values are used in the calculations and in the simulation setup.
3.2. Digital Twin of the Environment
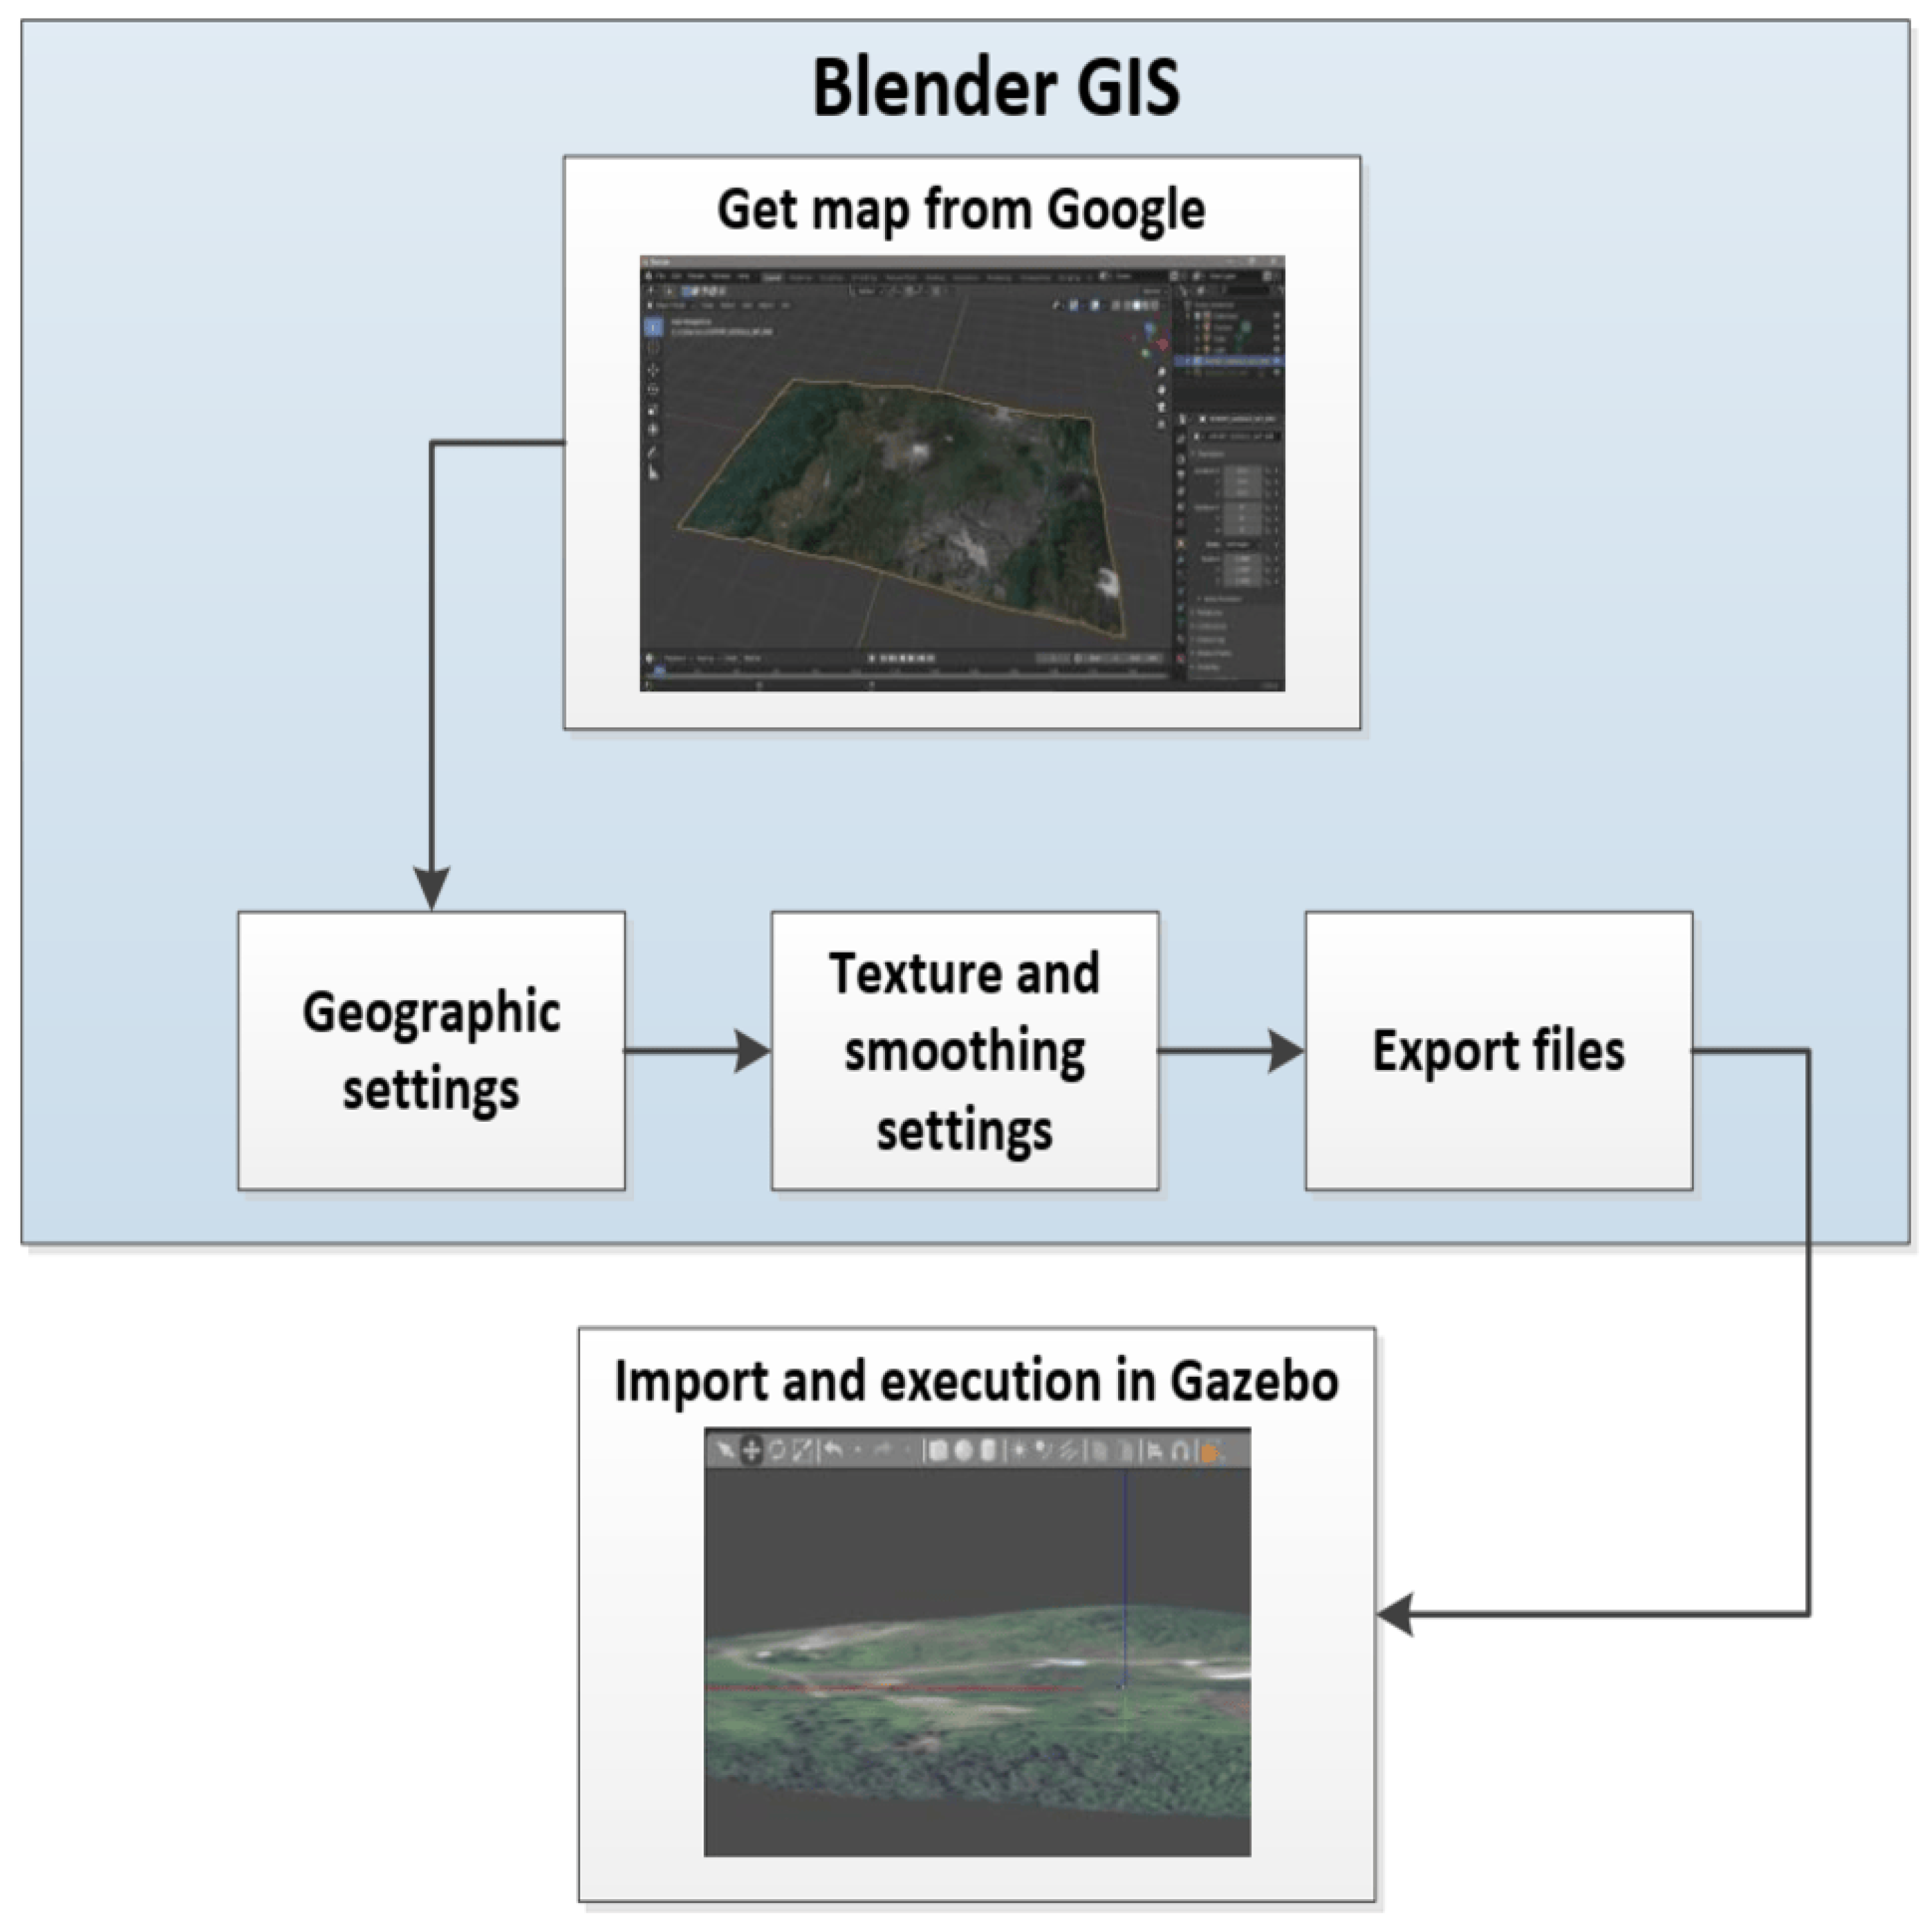
The simulated environment is generated using Digital Surface Models (DSMs) obtained from Google services. The proposed workflow can be seen in
Figure 3. The DSM is processed and integrated into the Gazebo simulator to replicate real-world terrain. Lighting control can be adjusted, and solar lighting is configured to simulate real outdoor conditions. This setup ensures that the UAV’s flight planning and photogrammetric mapping are conducted under conditions that closely resemble actual field deployments.
The Blender GIS tool is used to construct the 3D model of the area of interest based on its geographical information, for which, through its compatibility with web services and software tools, it is accessed from the Google database in real time and the area of interest is selected. In addition, for the terrain of interest and with the same process mentioned, we can access elevation information (level curves). The model can be modified in its texture, smoothing, and details according to requirements. The model obtained can be used in Gazebo by executing the command in a terminal, make px4_sitl gazebo-classic_typhoon_h480__palora.
3.3. Simulation of Environmental Conditions
To enhance realism, environmental conditions such as wind disturbances are incorporated into the simulation using wind_plugin. This plugin allows defining wind speed and direction profiles, enabling the assessment of UAV stability and navigation performance under variable weather conditions. These effects represent the external interaction forces that can change the motion state of the UAV, allowing the digital twin to be closer to reality.
Wind Plugin
The
wind_plugin plugin offers several wind configuration parameters within the virtual world in gazebo, such as minimum, maximum and average values, wind direction, among others, according to [
38]. The parameters used for the simulation are the following:
windDirectionMean: by means of a vector of 3 values, it allows establishing the direction of the wind in the three directions X-Y-Z for which, depending on what is required, “1” or “0” is set, where 1 is to activate the wind in the direction of the corresponding axis. For the tests carried out in this work, <1 1 0> is used, which generates a wind in the X-Y direction.
windVelocityMean: through a value, the wind speed is indirectly established since the plugin is designed so that a force is applied to the object (vehicle) within the Gazebo environment, which is a simplification valid for multirotors, so the value should be given is in terms of force (N).
For the simulation, it is considered to convert the wind speed in terms of drag force on the object (UAV). An equation proposed in [
40] is as follows:
where
is the air density (kg/m
3),
is the cross-sectional area of the attack front towards the wind (m
2),
is the drag coefficient, and
V is the wind speed (m/s).
To estimate
, web tools are used (Example:
https://www.calctool.org/, accessed on 23 September 2023), and through the average meteorological conditions (temperature, humidity, pressure, height) of the site of interest, the density of air is estimated at approximately 0.98 kg/m
3.
For , the front section of the UAV is considered since it has the camera and the stabilizer and they interact directly with the air, generating resistance to movement. For simplification purposes, this section is considered rectangular, the corresponding dimensions obtained from the file “typhoon_h480.sdf.jinja” in the PX4-Autopilot folder (length is 67 cm and height is 15 cm).
On the other hand, as indicated in [
40],
is affected by the inclination of the aircraft and in the case of multirotors it can take values between
and
for angles from 0 to
. For the study of this work, an intermediate value of
is considered because only the effect on the horizontal displacement of the UAV is taken into account since it is used for plane mapping.
3.4. SITL Scheme
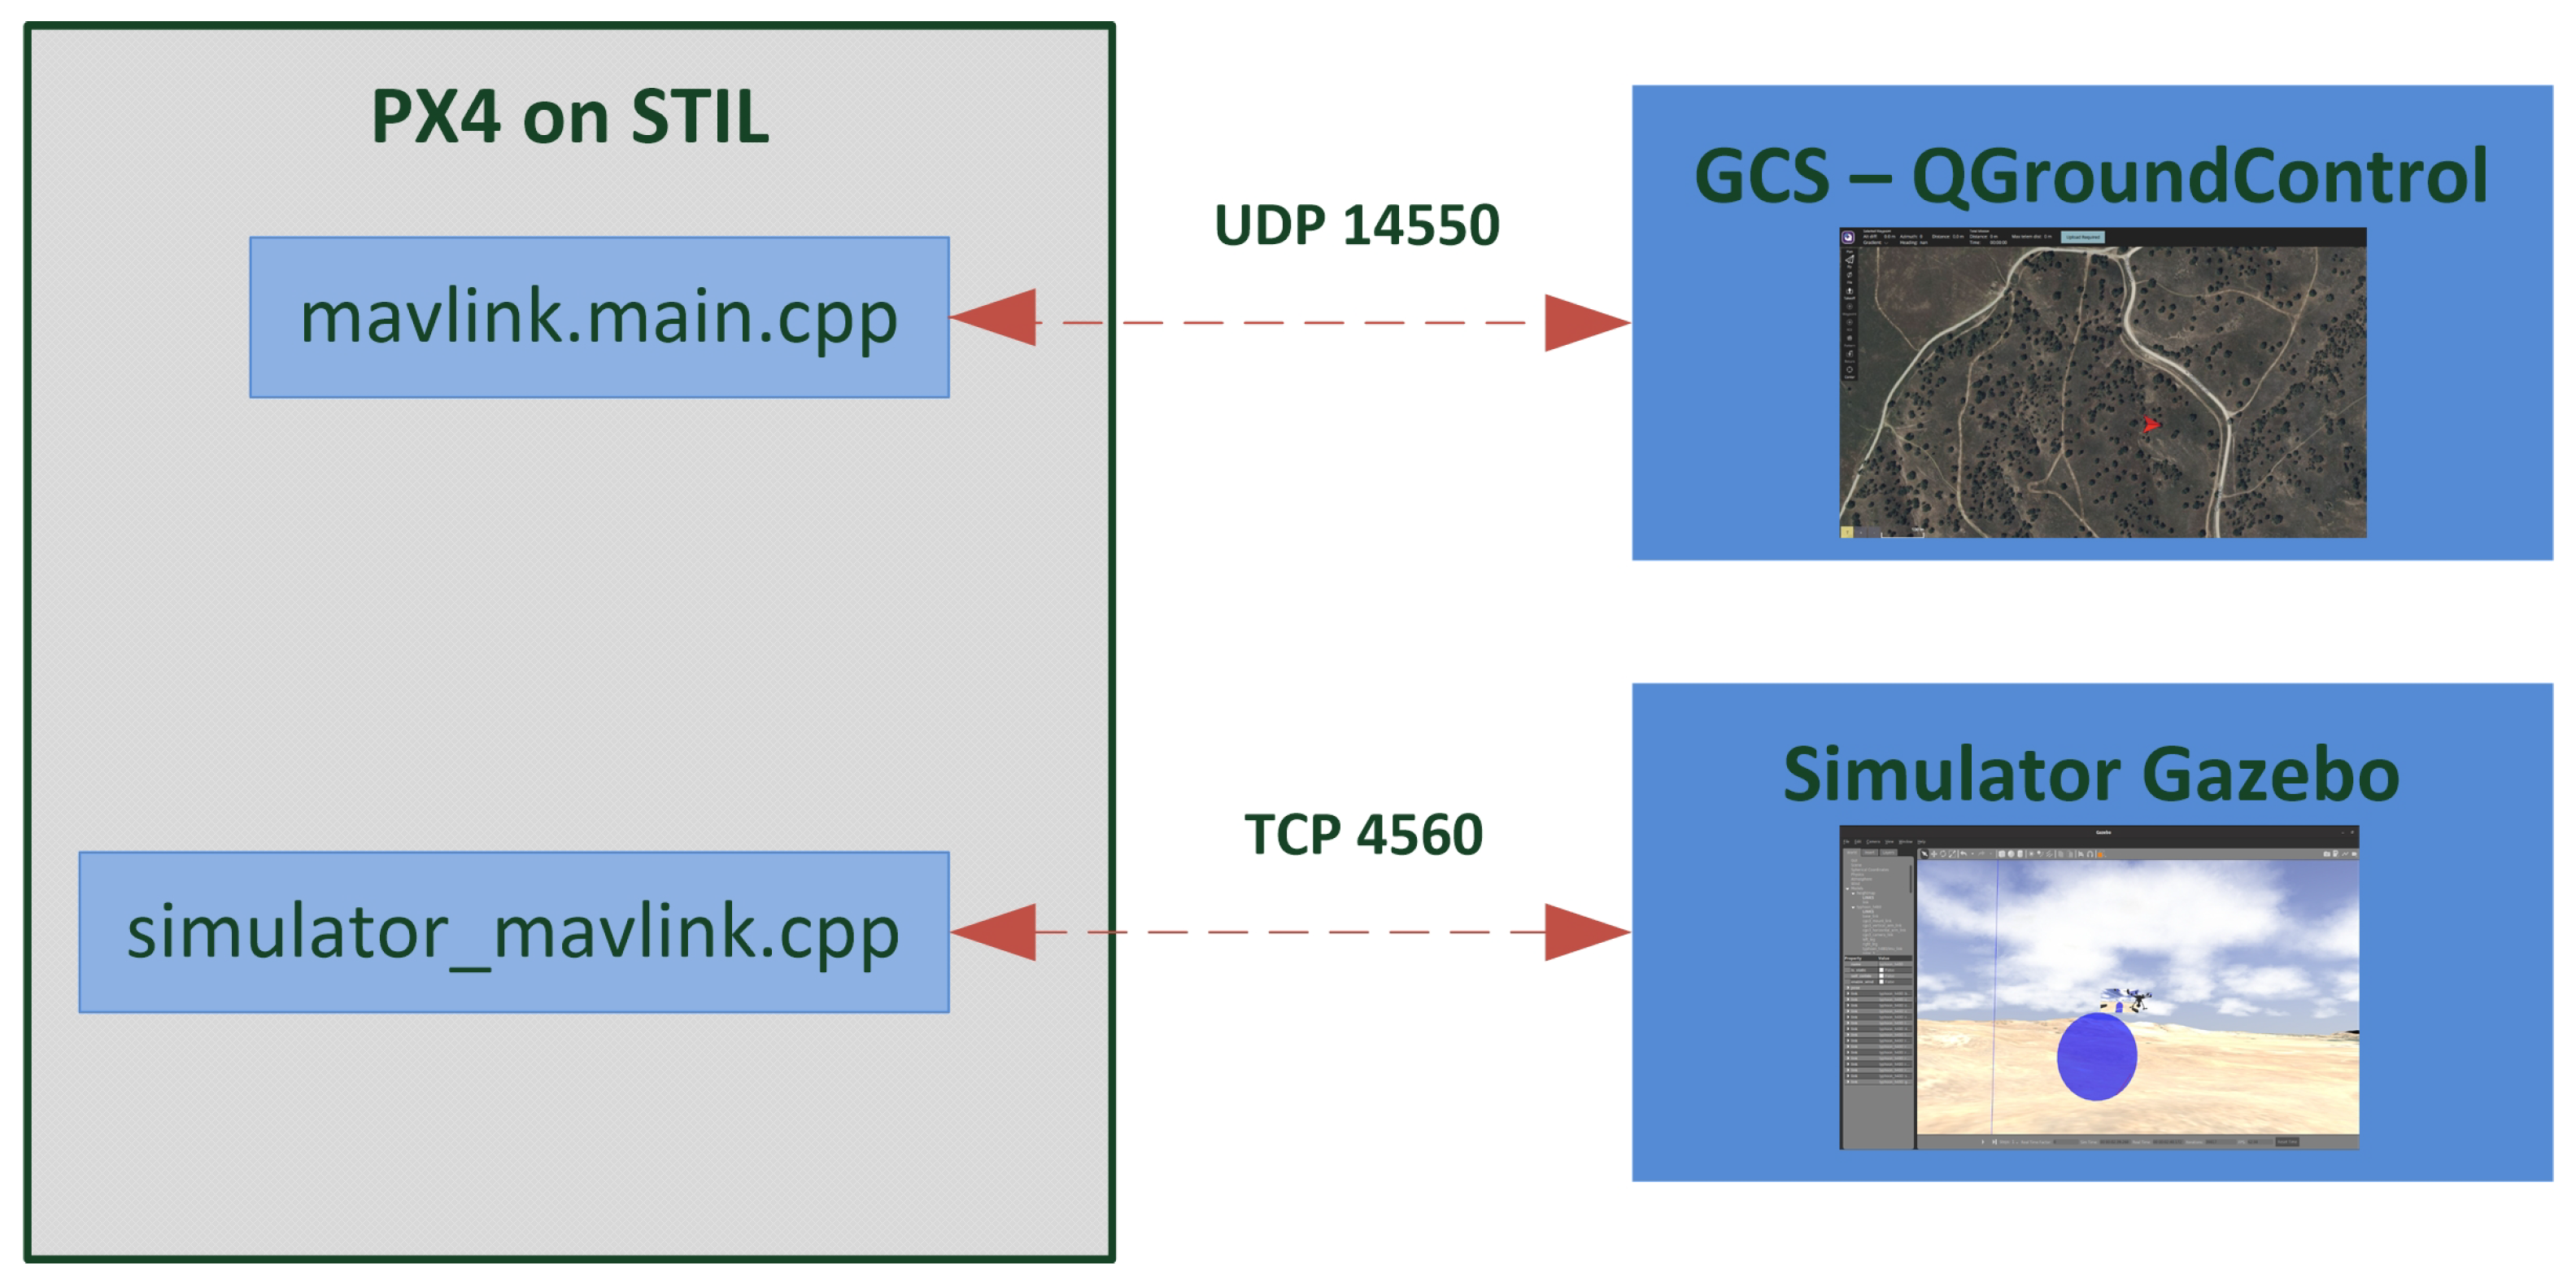
The SITL simulation employs a multirotor UAV running the PX4 autopilot in a virtual environment. The connection between PX4 and the Gazebo simulator is established using the Mavlink communication protocol, enabling realistic simulation of UAV dynamics and control responses.
For communication with the GCS, PX4 uses a remote UDP port, while for communication with Gazebo, it uses a local TCP port. For the study, all instances are executed on the specified computer and the SITL simulation environment used is presented in
Figure 4.
To launch the SITL simulation scheme, in the first terminal, it must be positioned in the PX4 root folder and command
make px4_sitl gazebo-classic_typhoon_h480 __palora must be executed. In the same way, the QGroundControl file is executed in a second terminal, and the scheme is ready for the simulation of flight plans (
Figure 5). For more details on the installation process and use of the tools used, it is suggested to visit [
38] or consult “SITL PX4 Gazebo”.
3.5. Aerial Photogrammetry
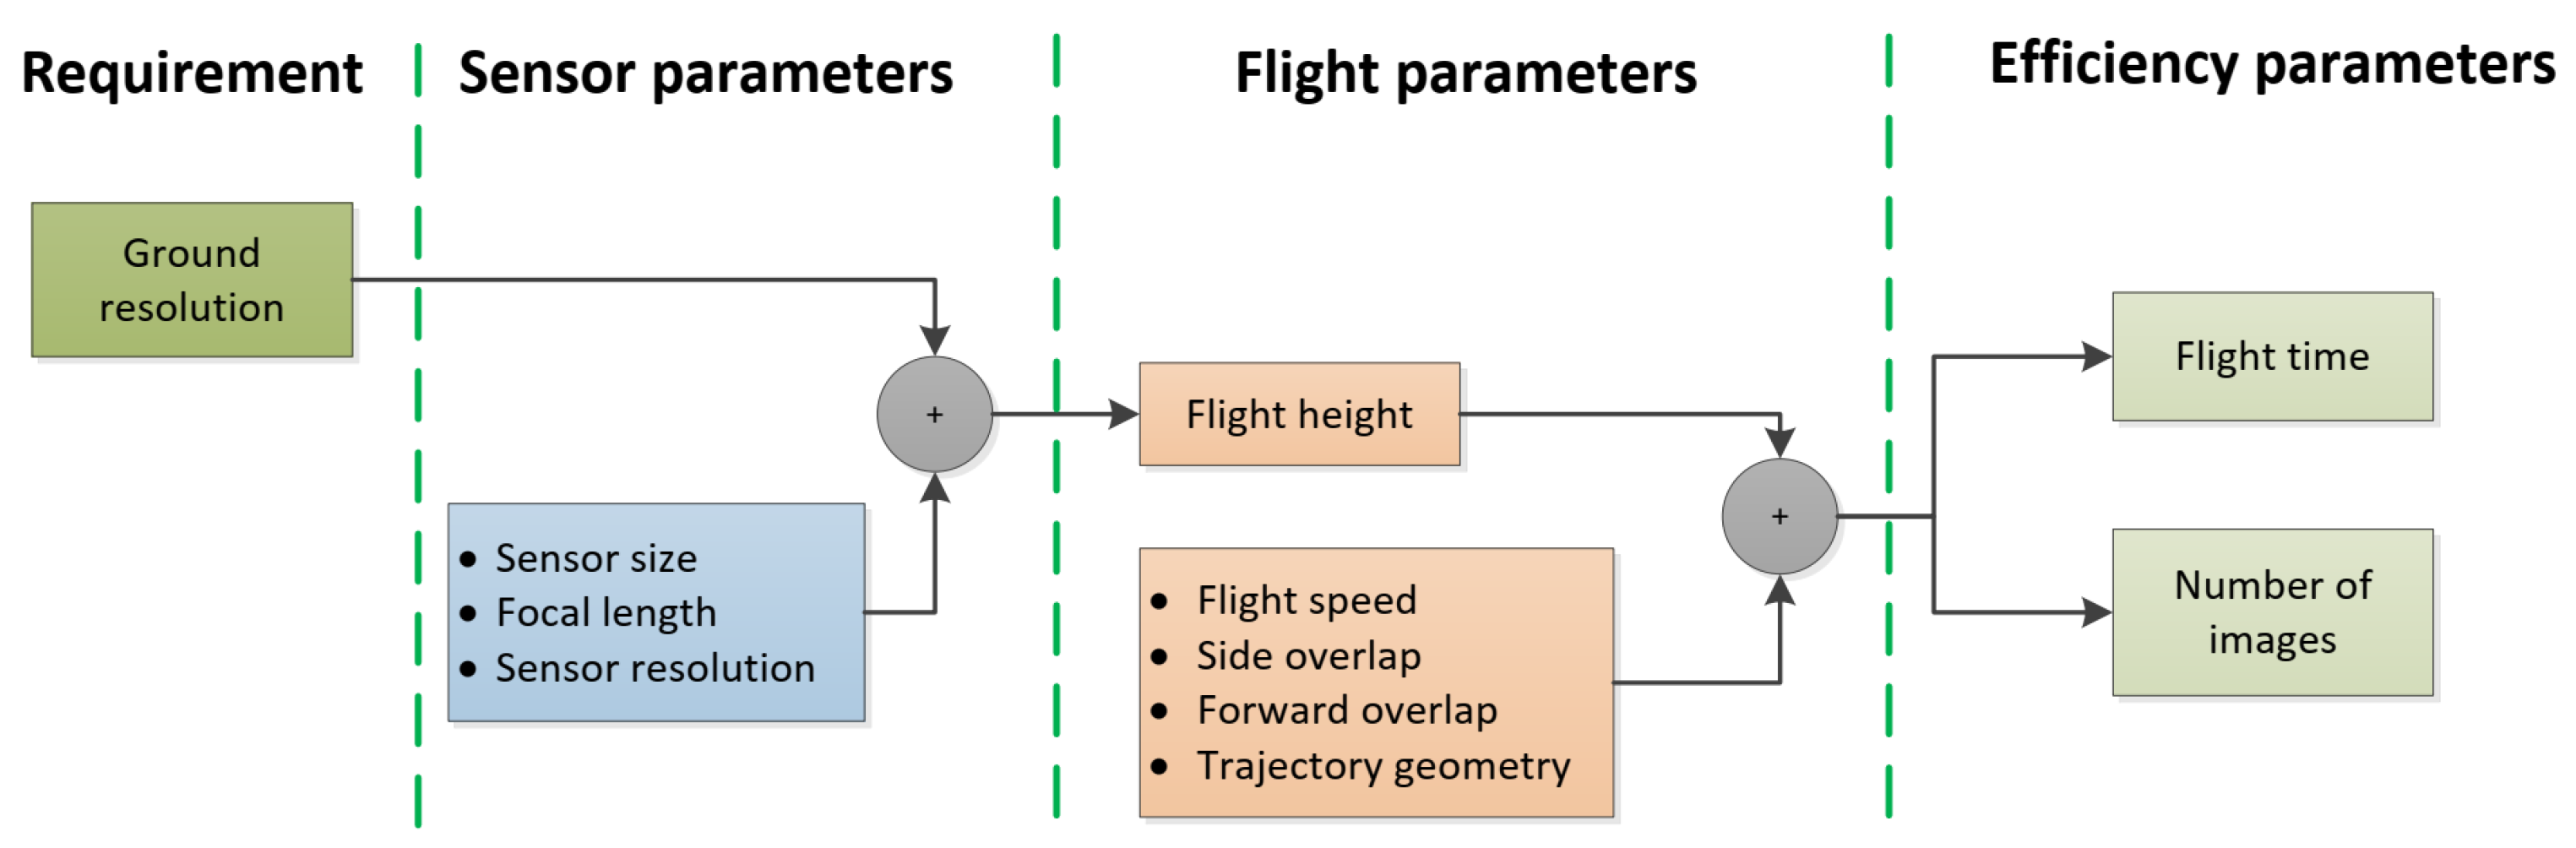
For appropriate decisions to be made in PA, it is important to ensure that orthomosaics are generated correctly in the shortest possible time. Therefore, this work proposes the collection of images with a UAV considering the parameters indicated in
Table 1.
Furthermore, according to Torres et al. [
27], the generation of DSMs generates a bottleneck due to the high processing time, which directly depends on the number of orthomosaics. Hence the importance of seeking a proportionate configuration of flight parameters to optimize time both in fieldwork and in data post-processing. In this sense,
Figure 6 presents the proposed workflow to establish the parameters of the flight mission.
3.5.1. Ground Spatial Resolution
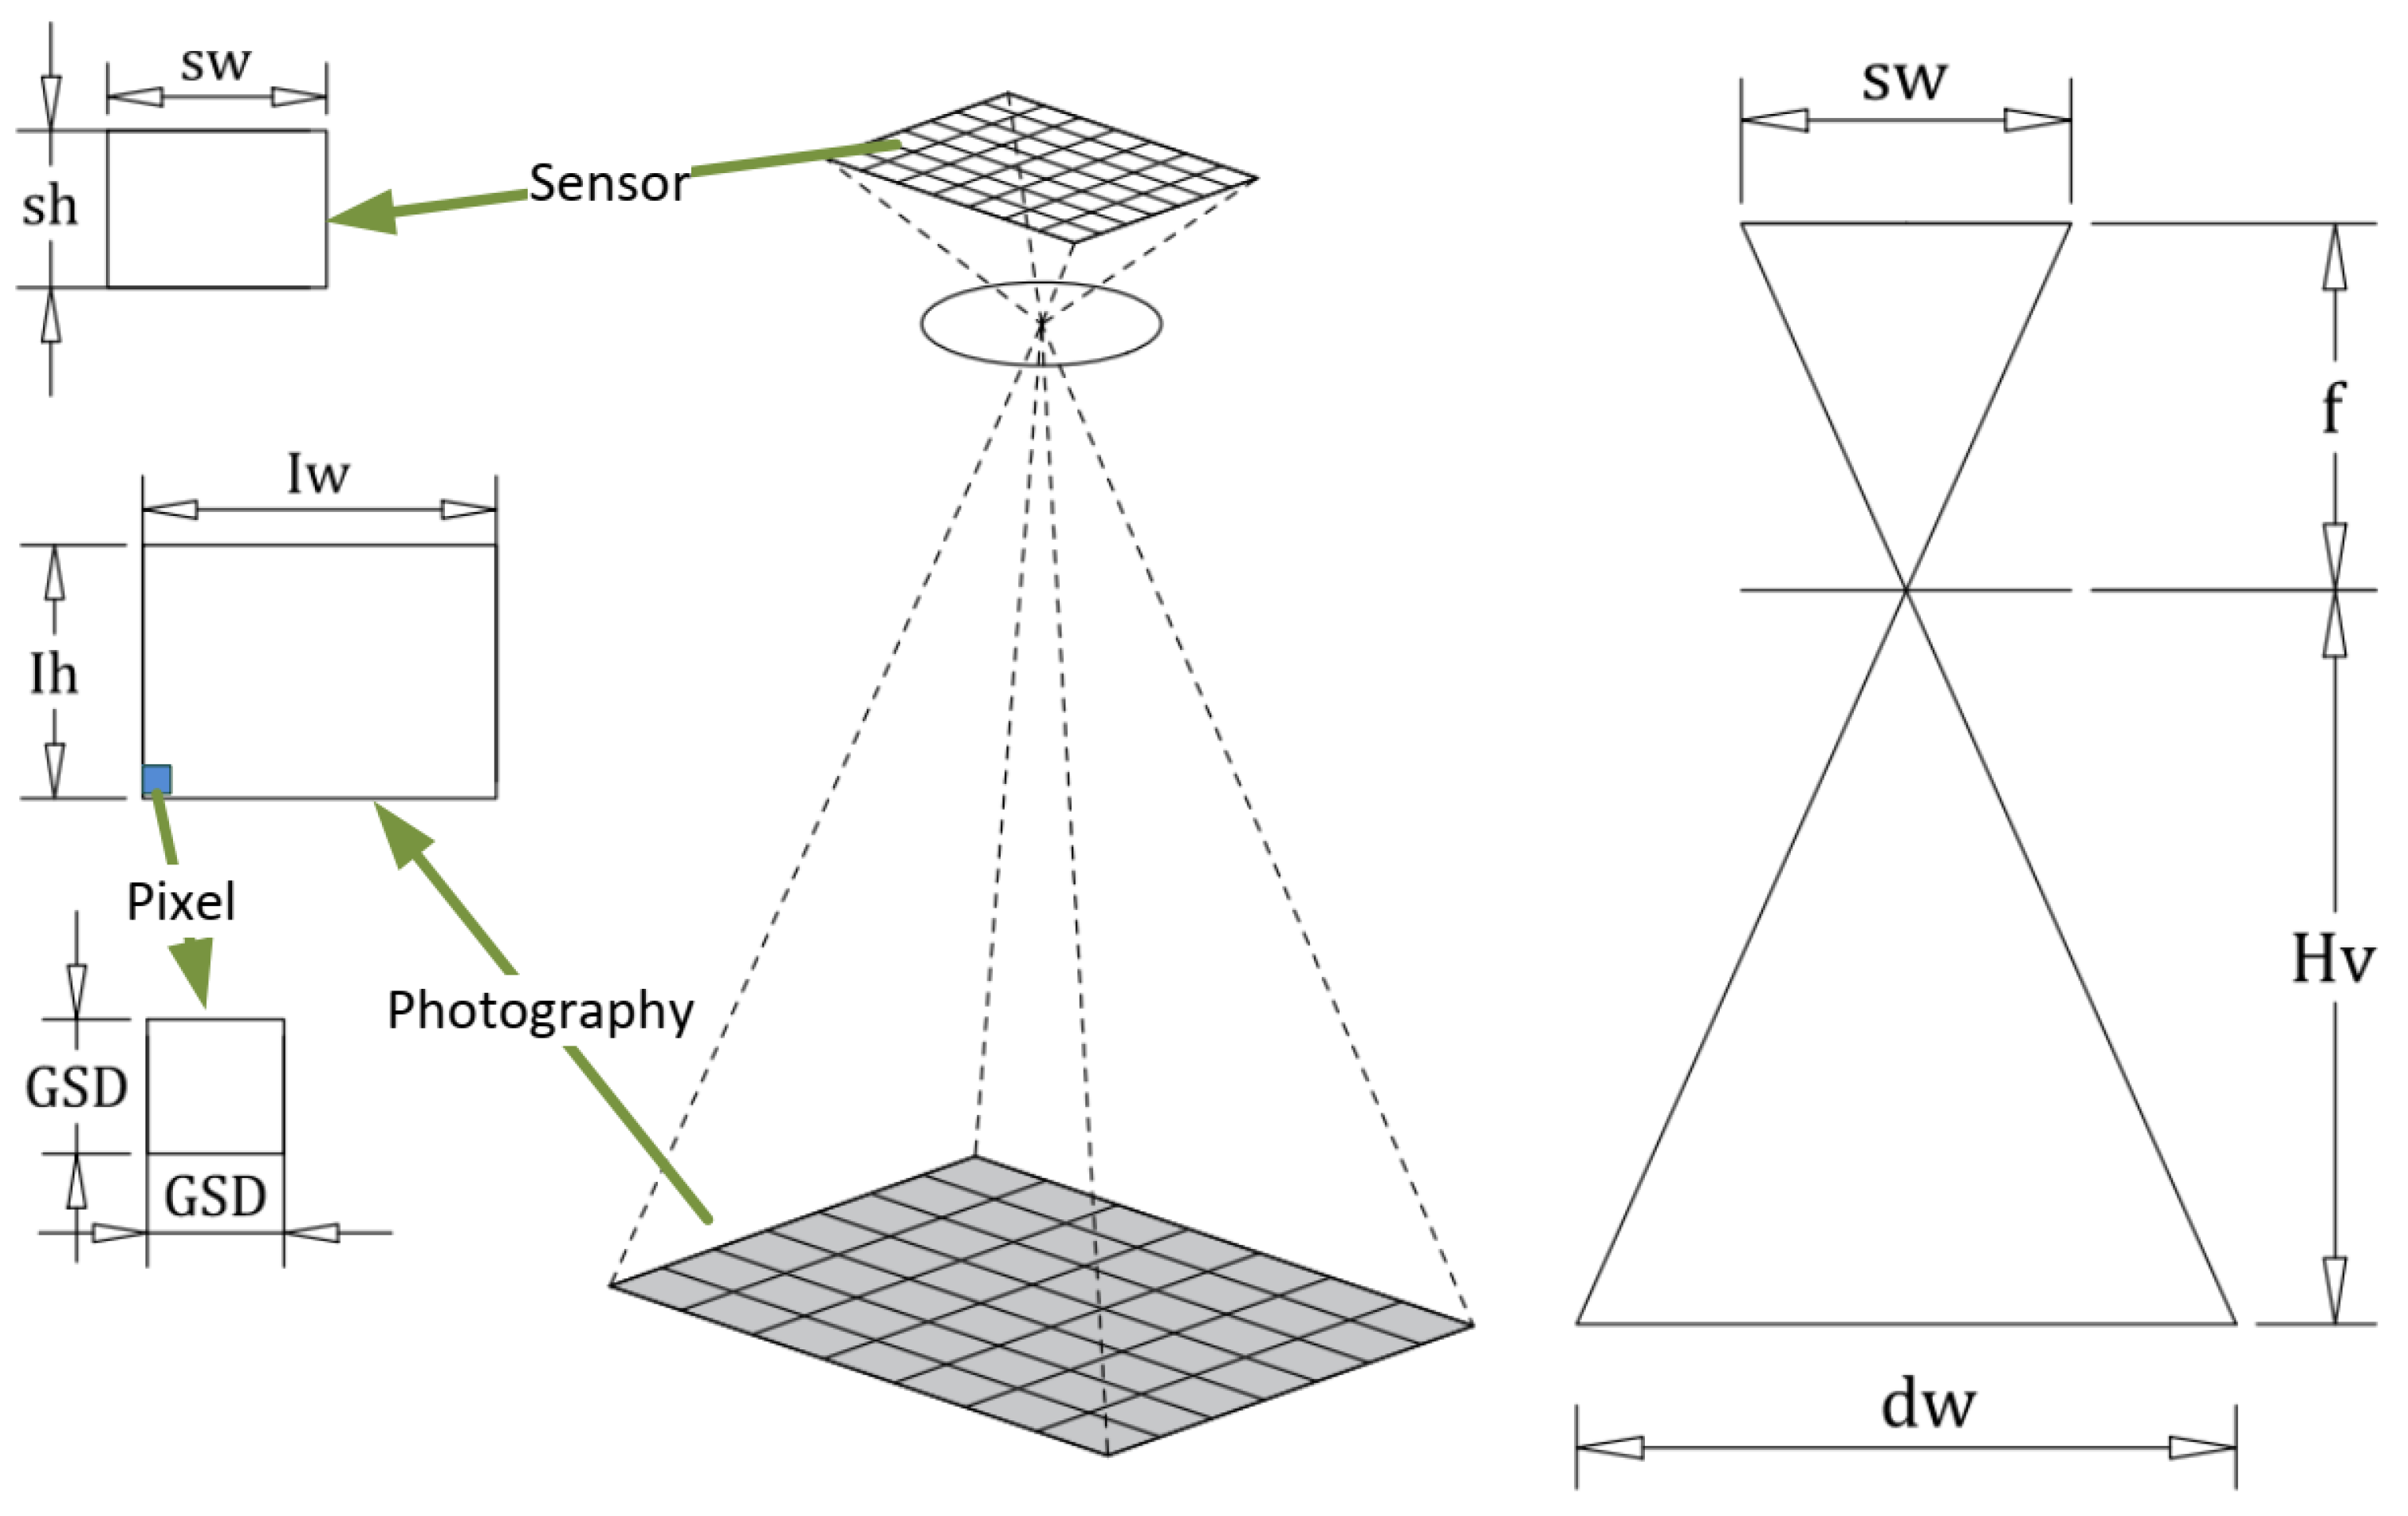
The spatial resolution for each pixel or the Ground Sample Distance (GSD) describes the distance between the central point of two consecutive pixels projected on the Earth’s surface; that is, it represents the size of a pixel with which we can estimate the dimensions and scale of the photograph on the ground.
The GSD is a requirement that is established according to the application to be carried out, and with the camera’s characteristics they establish the flight height. As illustrated in
Figure 7, the focal projection of the camera sensor on the Earth’s surface has the appearance of a regular prism and generates a rectangular image on the ground of height (
) and width (
). In units of length and in units of pixels, they have a height of
and a width of
.
A geometric analysis of the plane generated on one of the faces of the prism (right side of
Figure 7) is considered. The expression is obtained to determine the measurement of the height or width of the image on the ground:
where
is the flight height (m),
is the sensor height (mm),
is the sensor width (mm), and
f is the focal length (mm).
Since the pixel is considered square, the GSD can be expressed as the relation between any of the image dimensions and the size in pixels in the corresponding dimension (cm/pixel). Finally, the flight height can be established based on the GSD requirement as
3.5.2. Flight Time
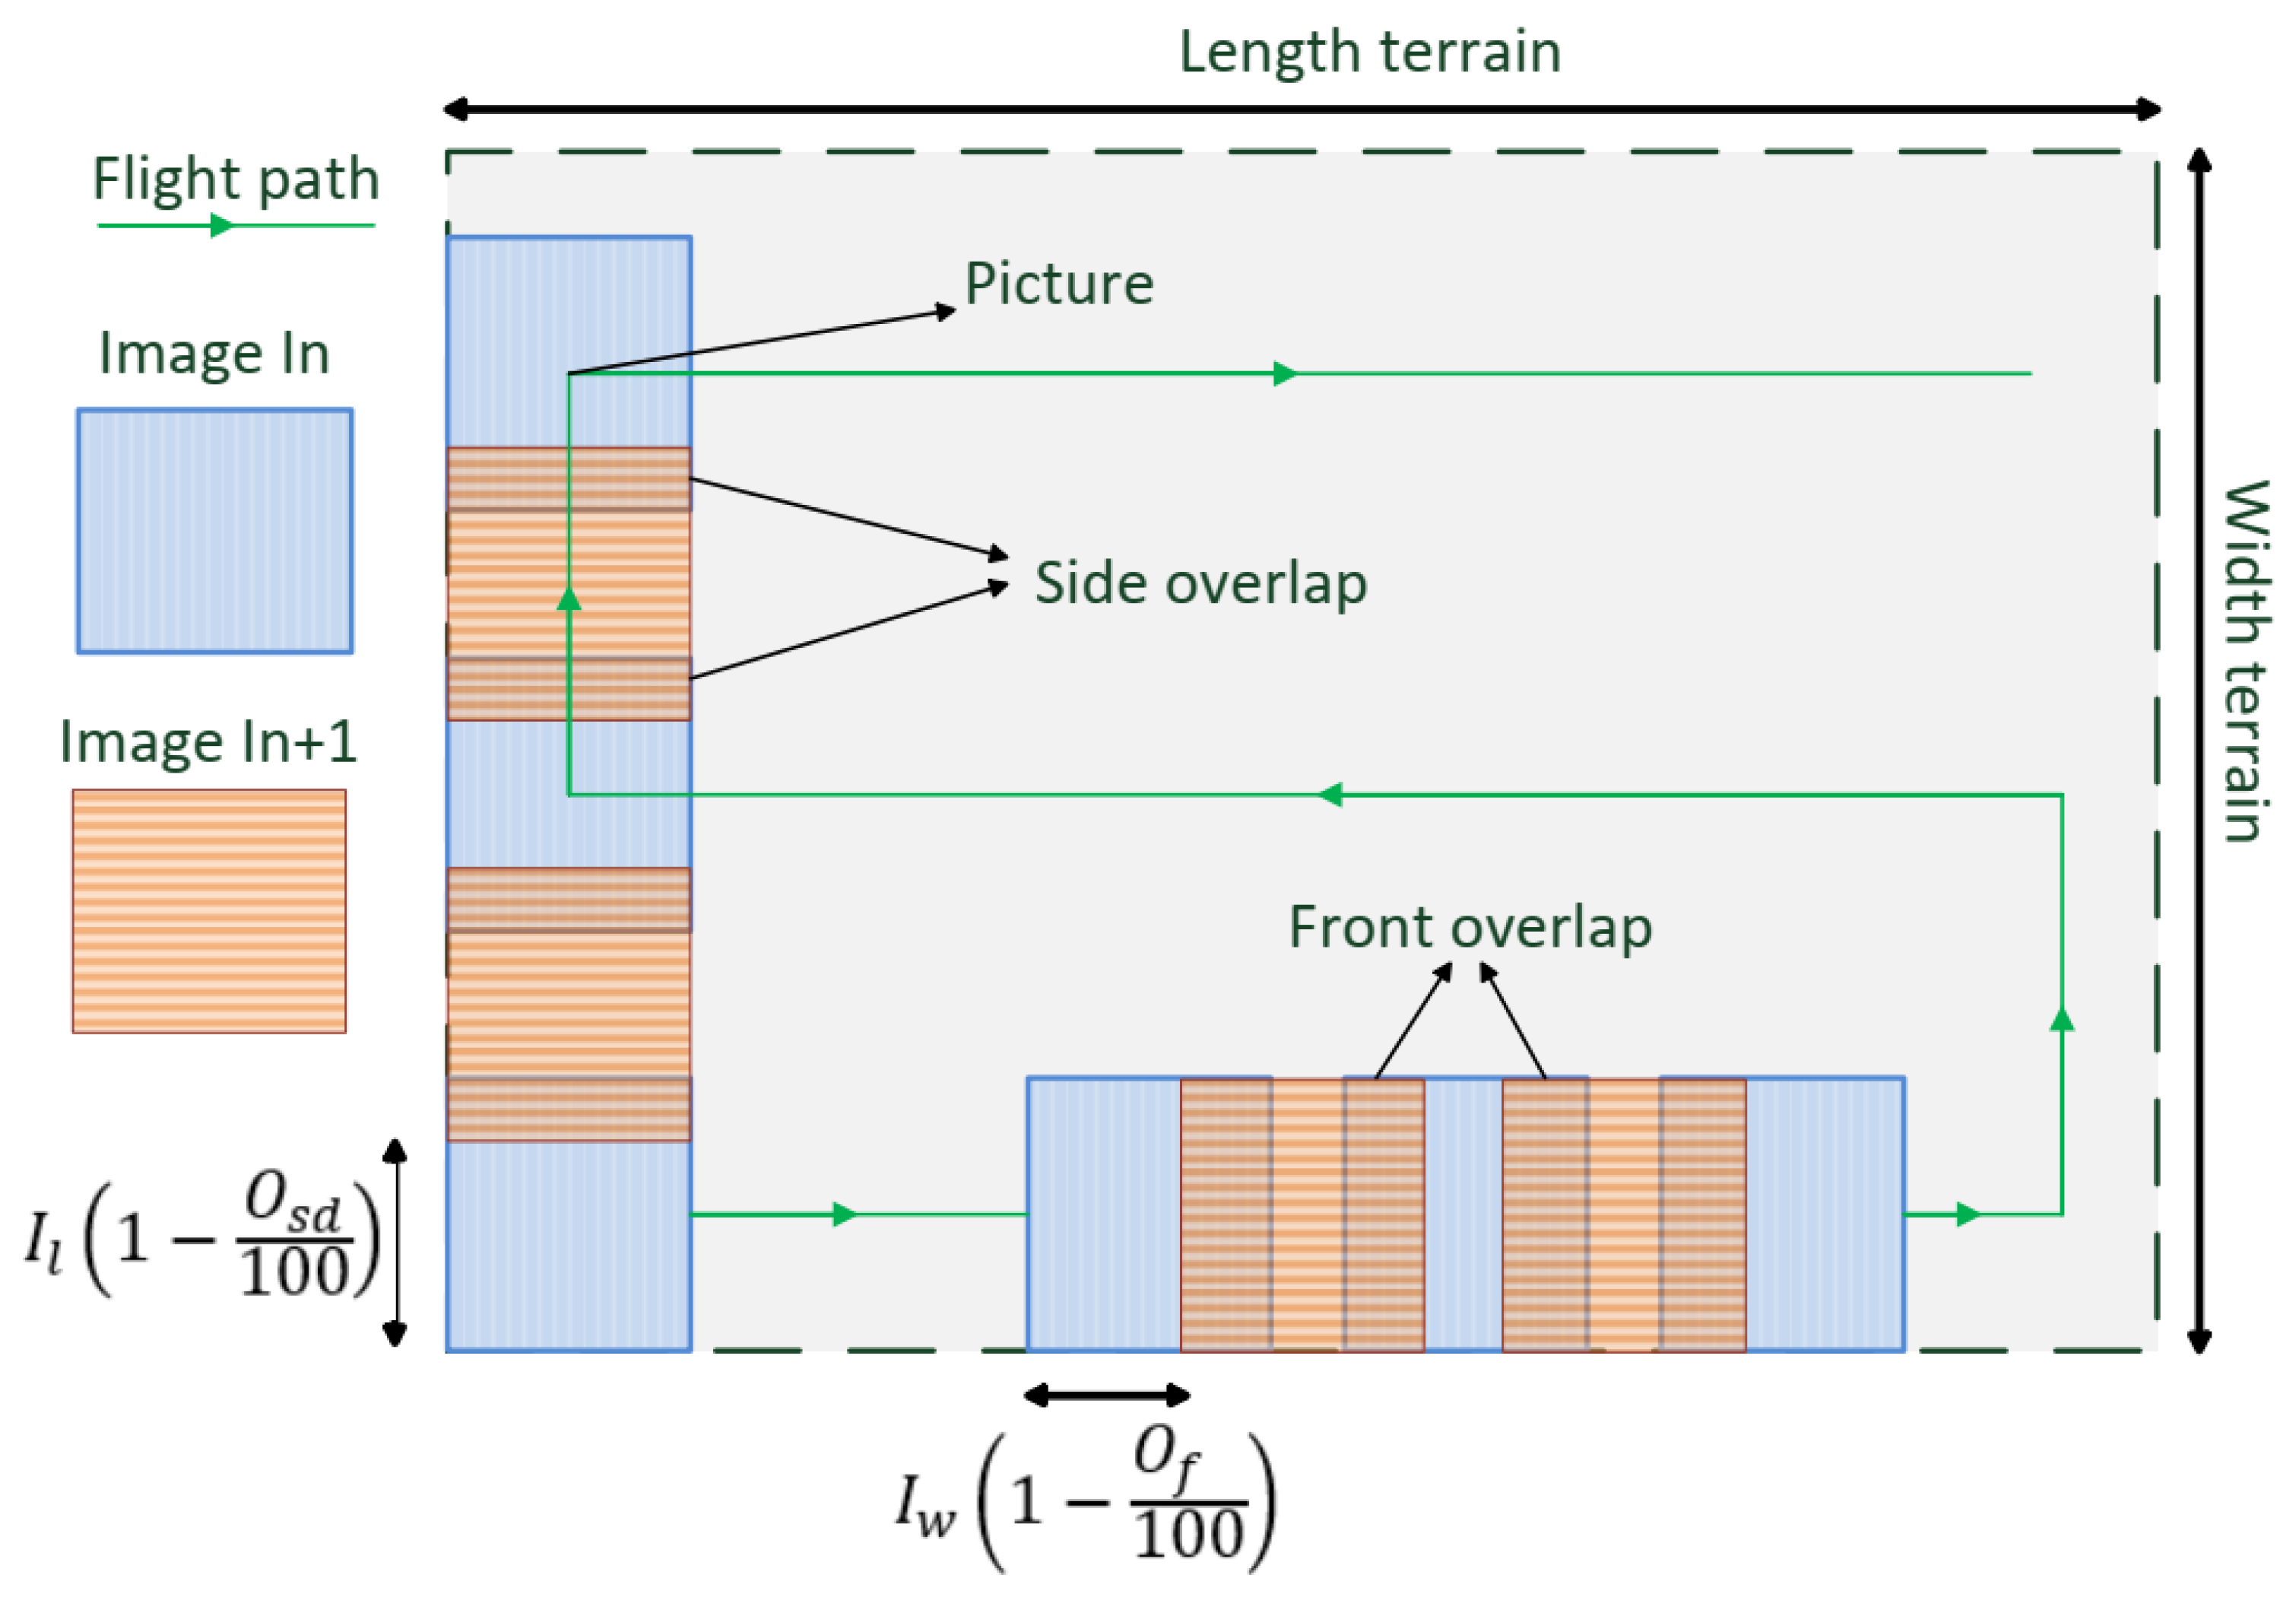
The time required for the UAV to complete a flight mission of an area to be mapped depends on parameters such as the flight height , the flight speed V, the geometry of the trajectories, and the overlap between images. The latter refers to the fact that the photographs must be taken in a way that contains elements (pixels) that also appear in the previous, posterior, and neighboring lateral photographs. These data are used by computer algorithms to join the photographs and generate orthomosaics.
In the generation of DSM with UAVs, parallel trajectories are preferred with the objective that the aircraft flies in a straight line over the greatest length of the terrain, thus obtaining fewer trajectories and therefore requiring less flight time. For this study, a rectangular terrain of length
(m) and width
(m) is considered. To calculate the flight time, it is divided into two parts: first, the time required to travel each trajectory (flight line) is determined, and subsequently the number of parallel trajectories is estimated (
Figure 8).
For practical purposes, a constant flight speed
V (m/s) is considered, so the time traveled on each trajectory is determinated as
To determine the number of trajectories
, both the terrain width
and the lateral overlap are considered:
where
is the lateral overlap in percentages.
It must be considered that the number of trajectories also represents the number of photographs to be taken across the width of the terrain, a value that is used to determine the total number of images required to fulfill the mission.
Finally, an additional term is considered that has to do with the time that the UAV requires to move between trajectories, so the flight time is calculated as
The flight time corresponds to the time required for the UAV to comply with the terrain mapping; therefore, the takeoff and landing times are not considered, since they depend on random parameters such as the location of the initial position with respect to the starting point of the flight plan, manual or automatic control and takeoff, and landing speeds.
3.5.3. Number of Images
The UAV in each trajectory must take photographs, so it is necessary to consider the frontal overlap. Thus, based on Equation (
6), the number of photos in each trajectory
is determined as
where
is the frontal overlap in percentages. Then, the number of photographs would be given by
4. Case Study Simulation
The application of the simulation scheme is presented to carry out the study of the parameters in
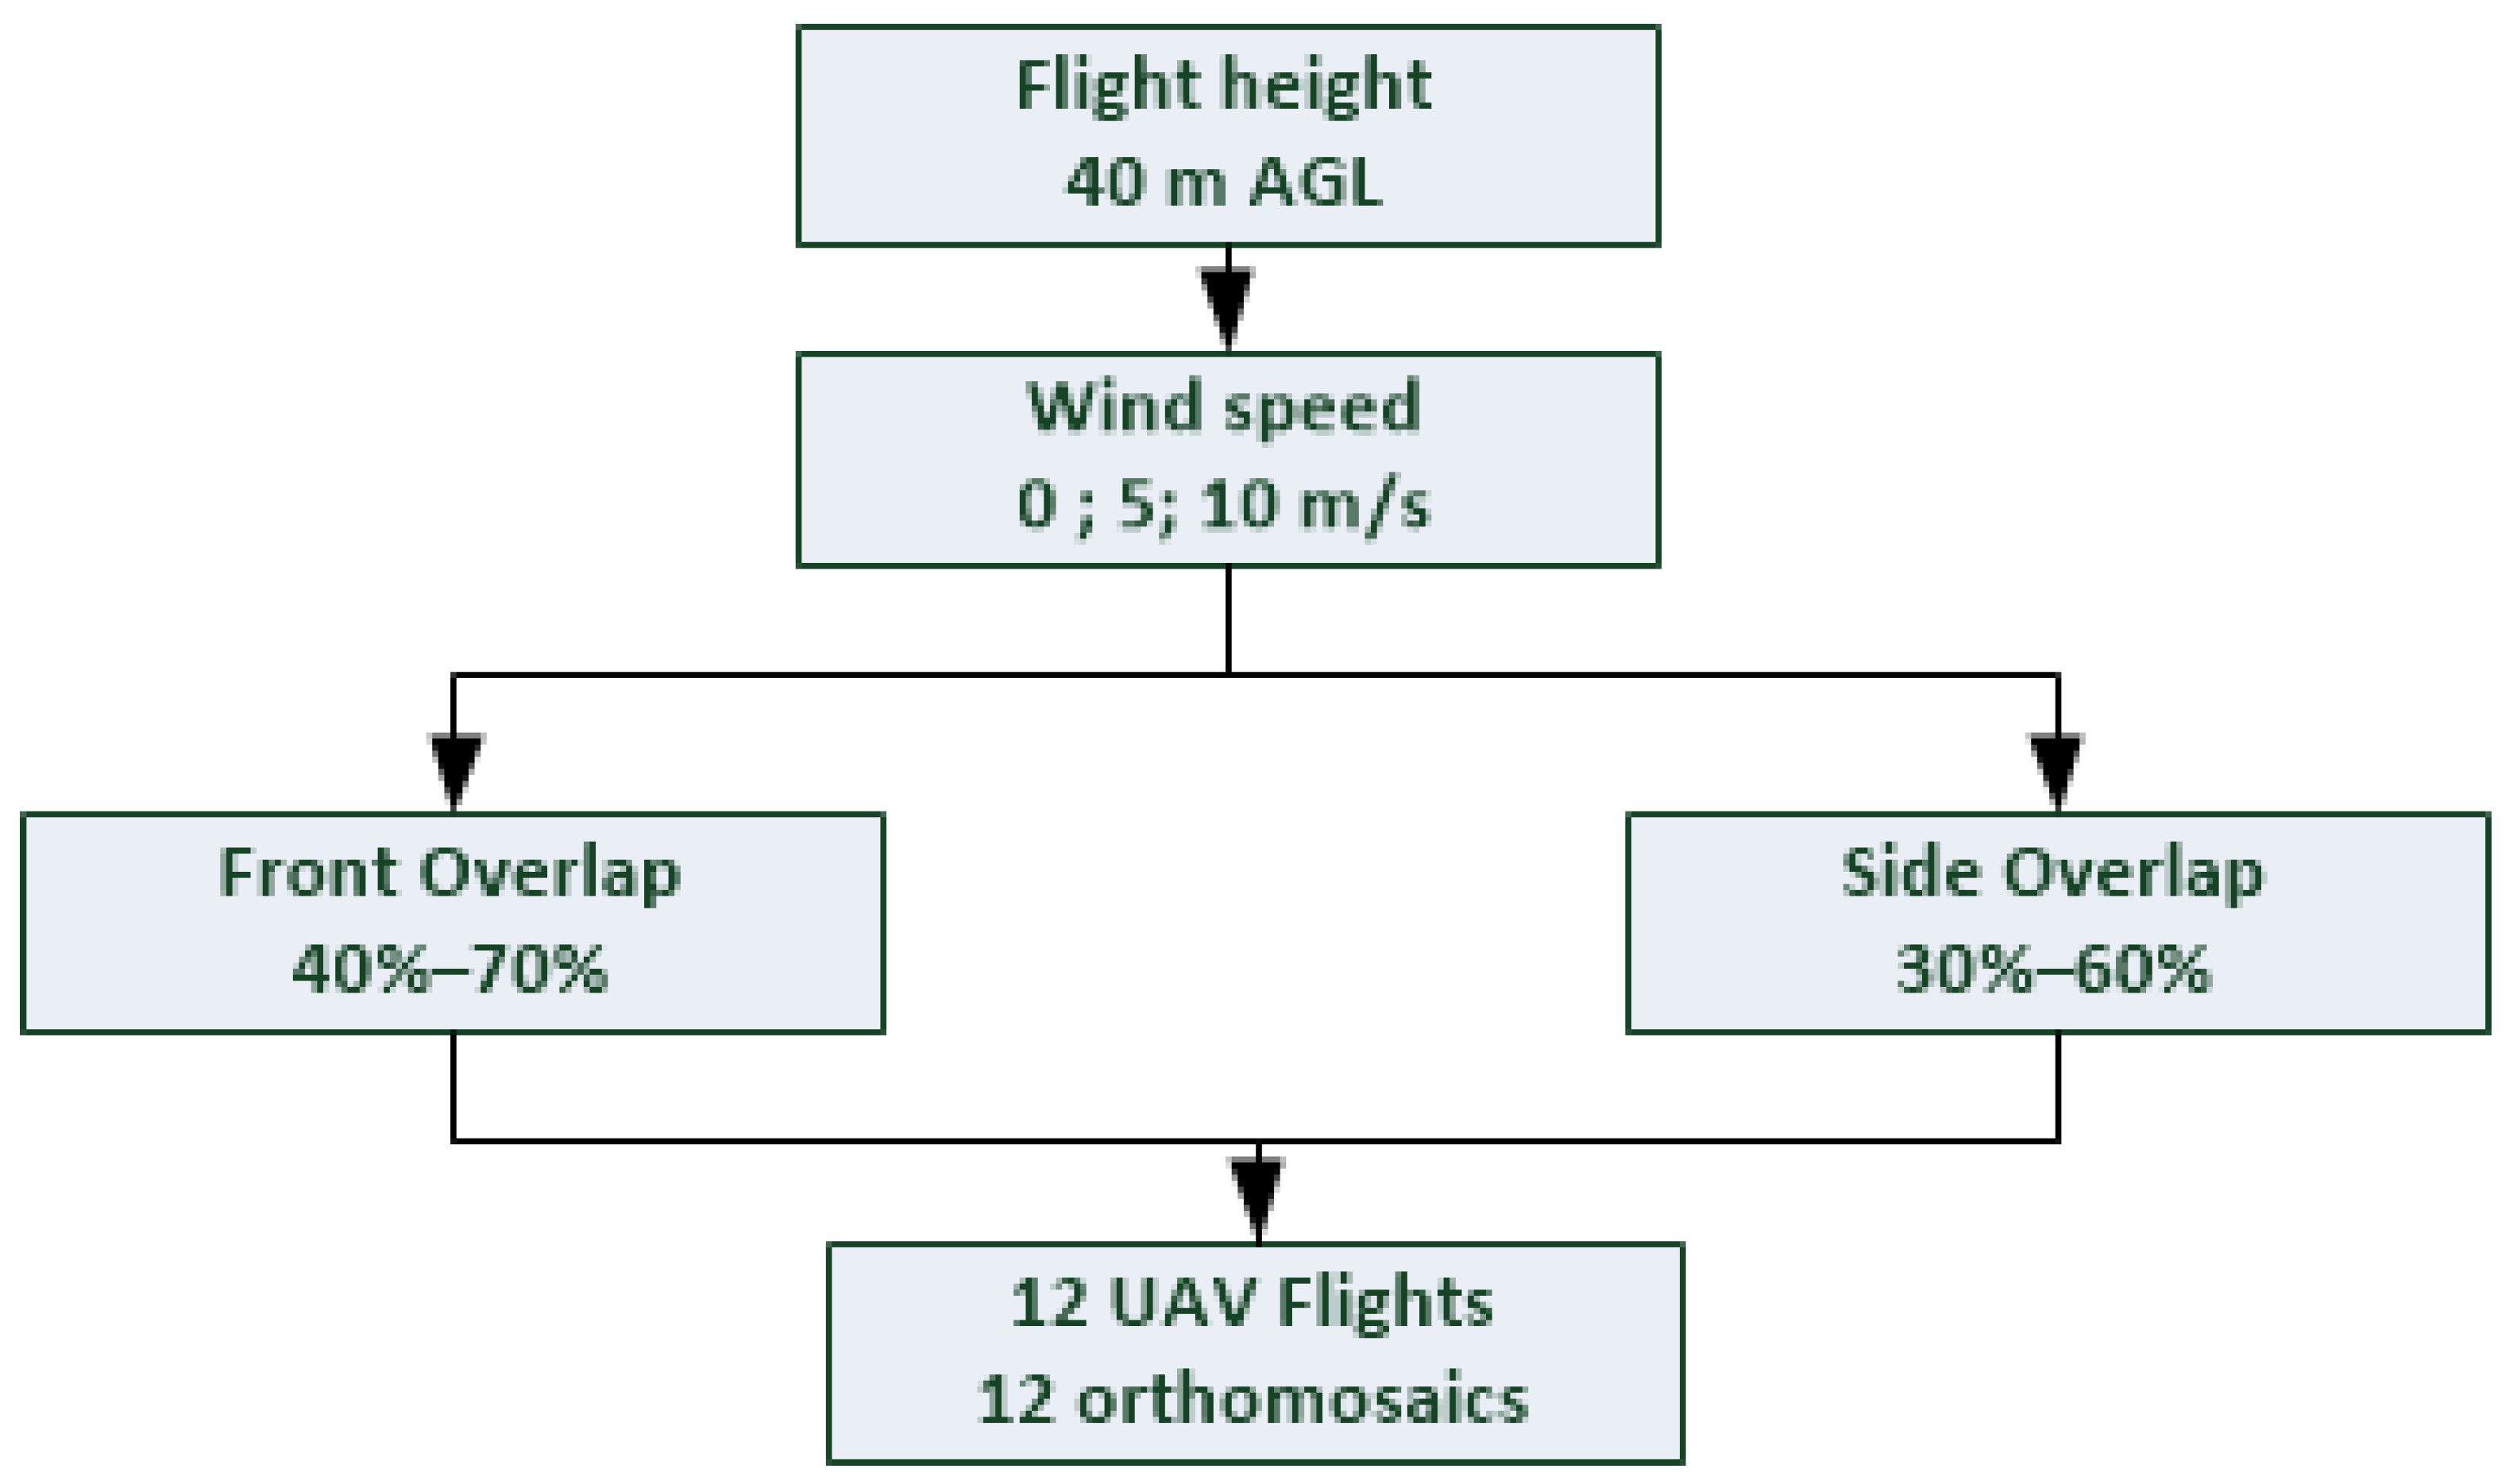
Table 1, specifically considering the influence of wind and overlap, and thus determine an appropriate parameter configuration to obtain acceptable DSM.
For this work, several flights are planned over the described study area based on the scheme in
Figure 9, in which three different values of wind speed and four overlapping configurations are considered.
The procedure carried out in this study consists of four setps: (1) Flight plan design, (2) Data collection, (3) Data processing, and (4) Orthomosaics evaluation.
4.1. Flight Plan Design
At this stage, the flight plan and image acquisition parameters are defined. Proper flight planning is crucial for a successful photogrammetric process, as it determines the area of interest, flight trajectories, and duration to ensure high-quality images. Additionally, external factors such as environmental and geographical conditions must be considered due to their impact on final results.
A key parameter in flight planning is the altitude above ground level (AGL), which is determined based on the Ground Sampling Distance (GSD). For crop evaluation, an acceptable GSD ranges from 2.5 to 4 (cm/pixel). In this study, a GSD of 3 (cm/pixel) is chosen, leading to a calculated flight altitude of 43.2 (m) using Equation (
4) and the camera parameters. Consequently, an altitude of
(m) AGL is selected.
Frontal and lateral overlaps of 40–30%, 50–40%, 60–40%, and 70–60% are tested to evaluate the impact of wind on orthomosaic quality. Three wind speeds are considered:
(m/s),
(m/s), and
(m/s), which are transformed into force values using Equation (
1). In total, twelve flight missions are conducted, all at a constant UAV speed of 5 m/s.
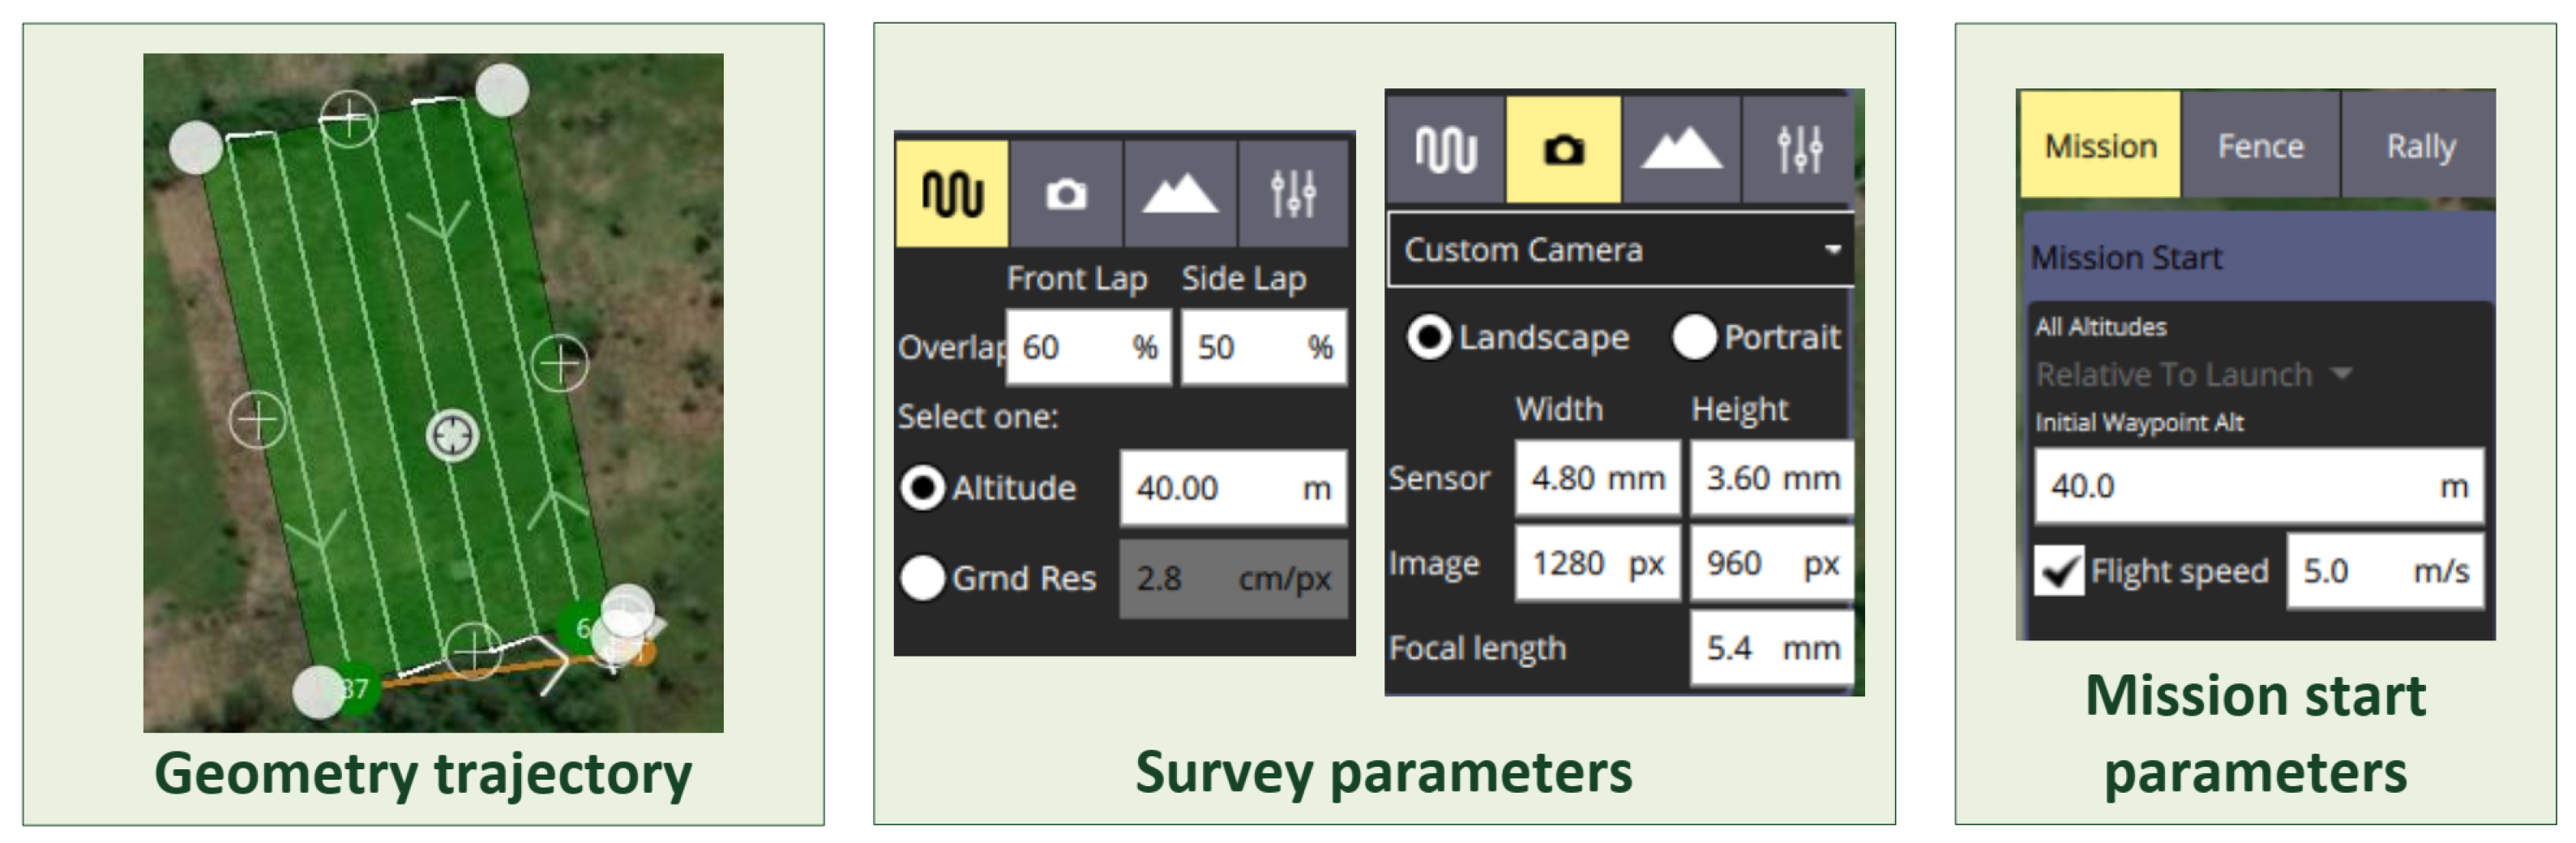
A parallel flight pattern is implemented, as shown in
Figure 10, along with the configured parameters in the QGroundControl application.
For the exposed case study, it is evident that overlaps greater than those presented generate large quantities of images. As an example, with an overlap of 90–80% and the expressions detailed above, we determine a total of approximately 1360 photos, which requires long processing time. Therefore, they are unnecessary scenarios in the study, since for the small area of interest and the low flight height, it is verified that the selected overlaps are sufficient to generate good-quality products and shorter processing times, as detailed in
Section 5.
4.2. Data Collection
Each of the flight configurations considered was simulated independently using the proposed virtual scheme, and for each one, parameters used for the efficiency study were recorded, such as the flight distance traveled by the UAV, the number of images collected, and flight time (
Table 1). Furthermore, in order to validate the estimates of the QGroundControl program,
Table 1 shows the values of the number of images and flight time calculated with the equations previously explained.
In the simulations, flight time was measured from the moment the UAV began executing the first flight line of the flight plan. Takeoff and landing times were not considered, as they largely depend on the UAV’s resting position, which is arbitrary. In practice, the UAV should be placed as close as possible to the starting point of the first flight line.
4.3. Data Processing
For the processing of the images collected with the UAV, the Agisoft Metashape 1.5.2 software was used, since it provides good results in terms of quality and photogrammetric products [
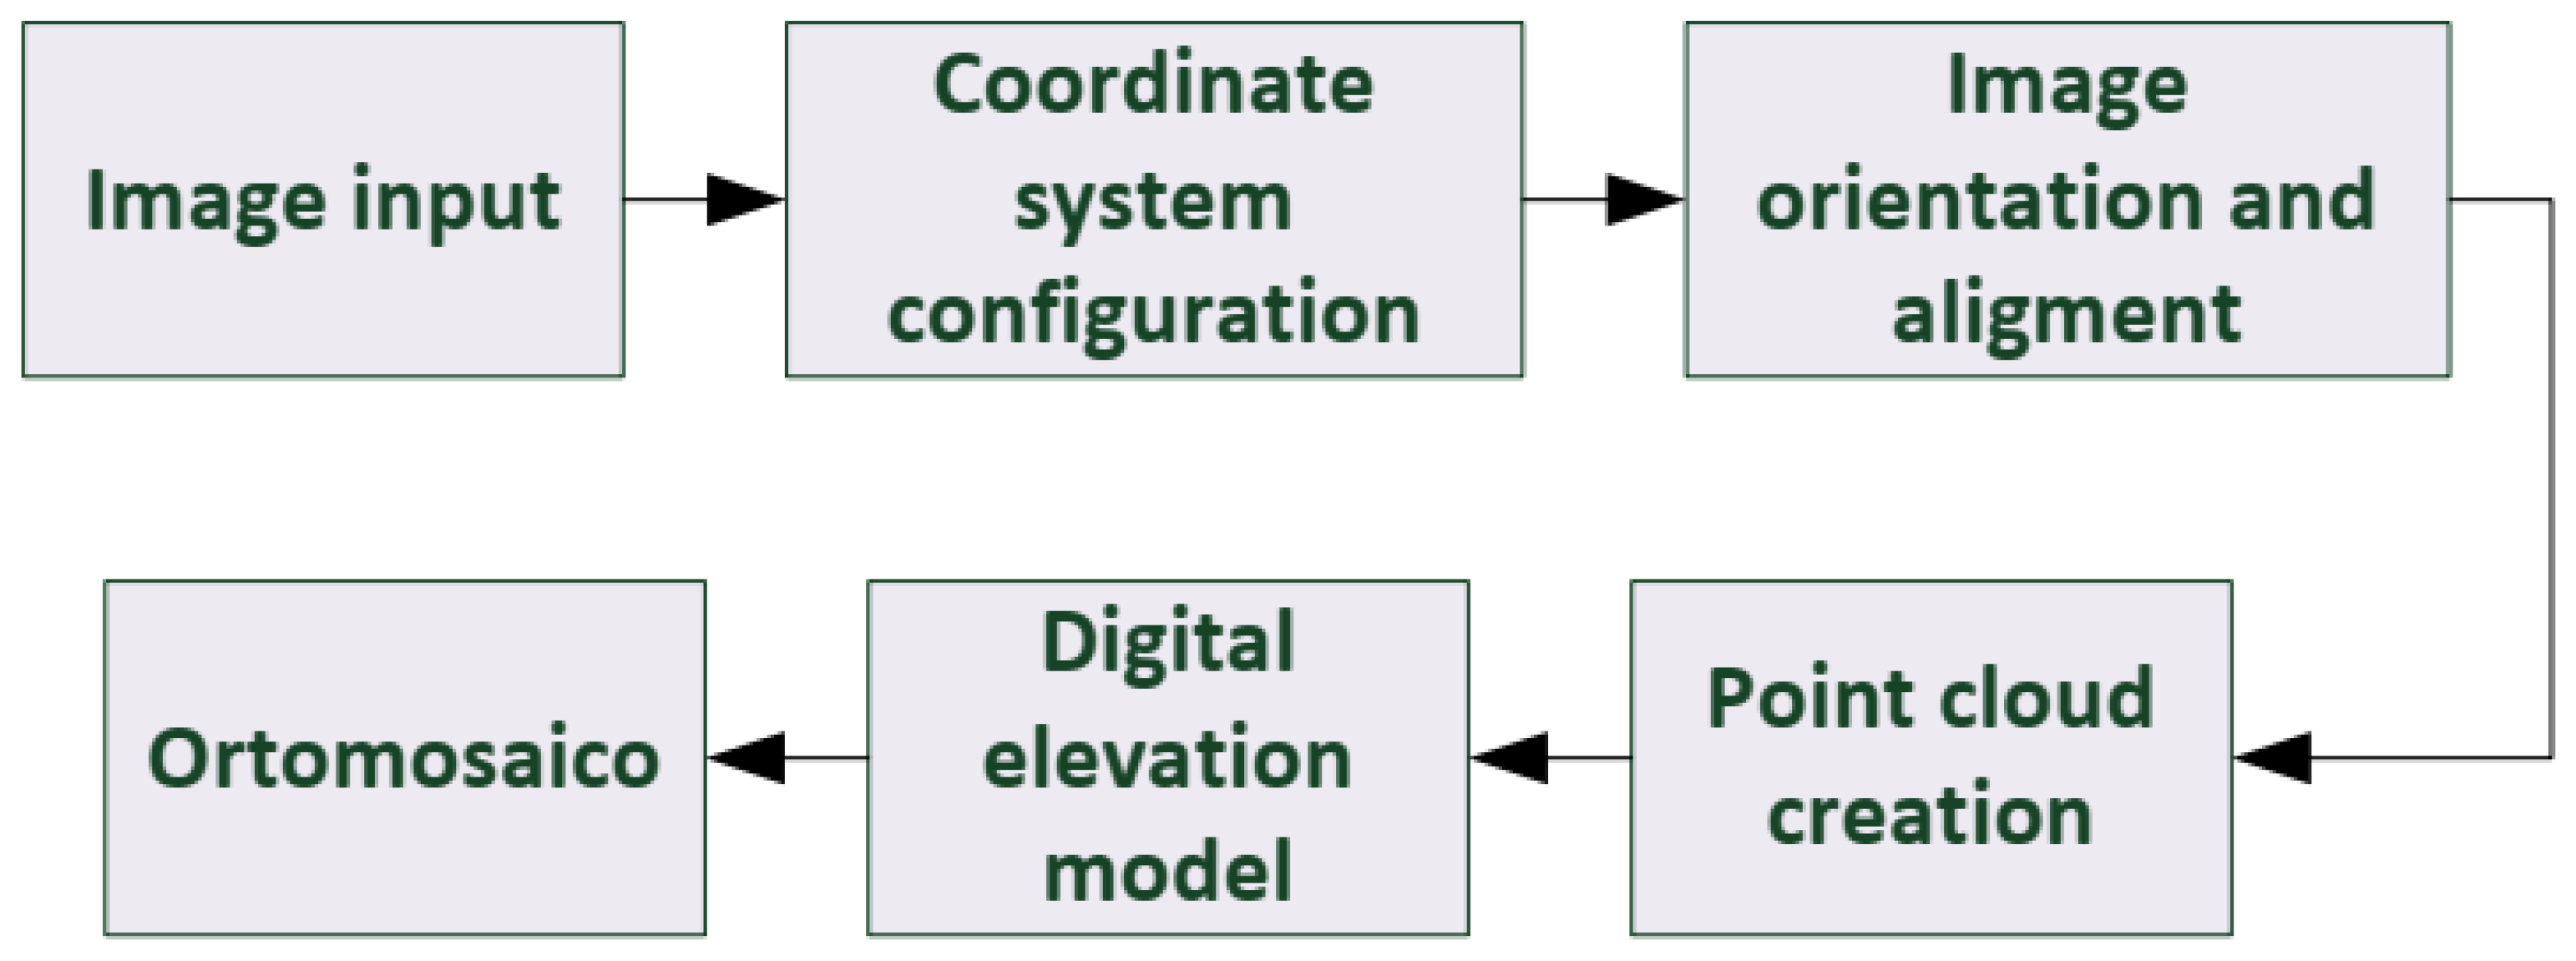
33]. With this software, a total of 12 orthomosaics were obtained, following the workflow in
Figure 11.
For greater precision, the coordinate system for the study area was established in UTM zone 18S. The orientation and alignment of the photos was carried out according to their common points; in this case, “high” quality was considered. For the generation of the point cloud, the “medium” quality was chosen. Finally, the settings for the digital elevation model and the orthomosaic were left as default.
Table 2 shows the records of image processing time and obtaining orthomosaics in the 12 experiments. In addition, data on the resolution obtained in the orthomosaics are presented, as well as their pixel size (
and
).
For this study, it was not necessary to generate a mesh since it was not the objective to obtain 3D models. Likewise, no control points were used, only the data from the UAV.
5. Results
5.1. Analysis of Efficiency Parameters
According to the data in
Table 3, it can be understood that the software flight time estimate for each scenario is similar to the value calculated with the proposed expressions. Considering the same comparison for the number of images per flight mission, it can be verified that the number of images collected by the software is greater than calculated. This is mainly because, in the execution of the flight plan, it was evident that the autopilot performs the taking photographs in the movement between the flight lines. Iikewise, the software takes redundant photos; however, the proposed expressions mathematically determine the necessary values and references to estimate the processing times and memory capacity required for storage of photographs.
5.1.1. Flight Time and Distance Traveled
The data in
Table 3 demonstrate that increases in overlap imply an increase in the distance the UAV must travel, the flight time, and the number of images collected.
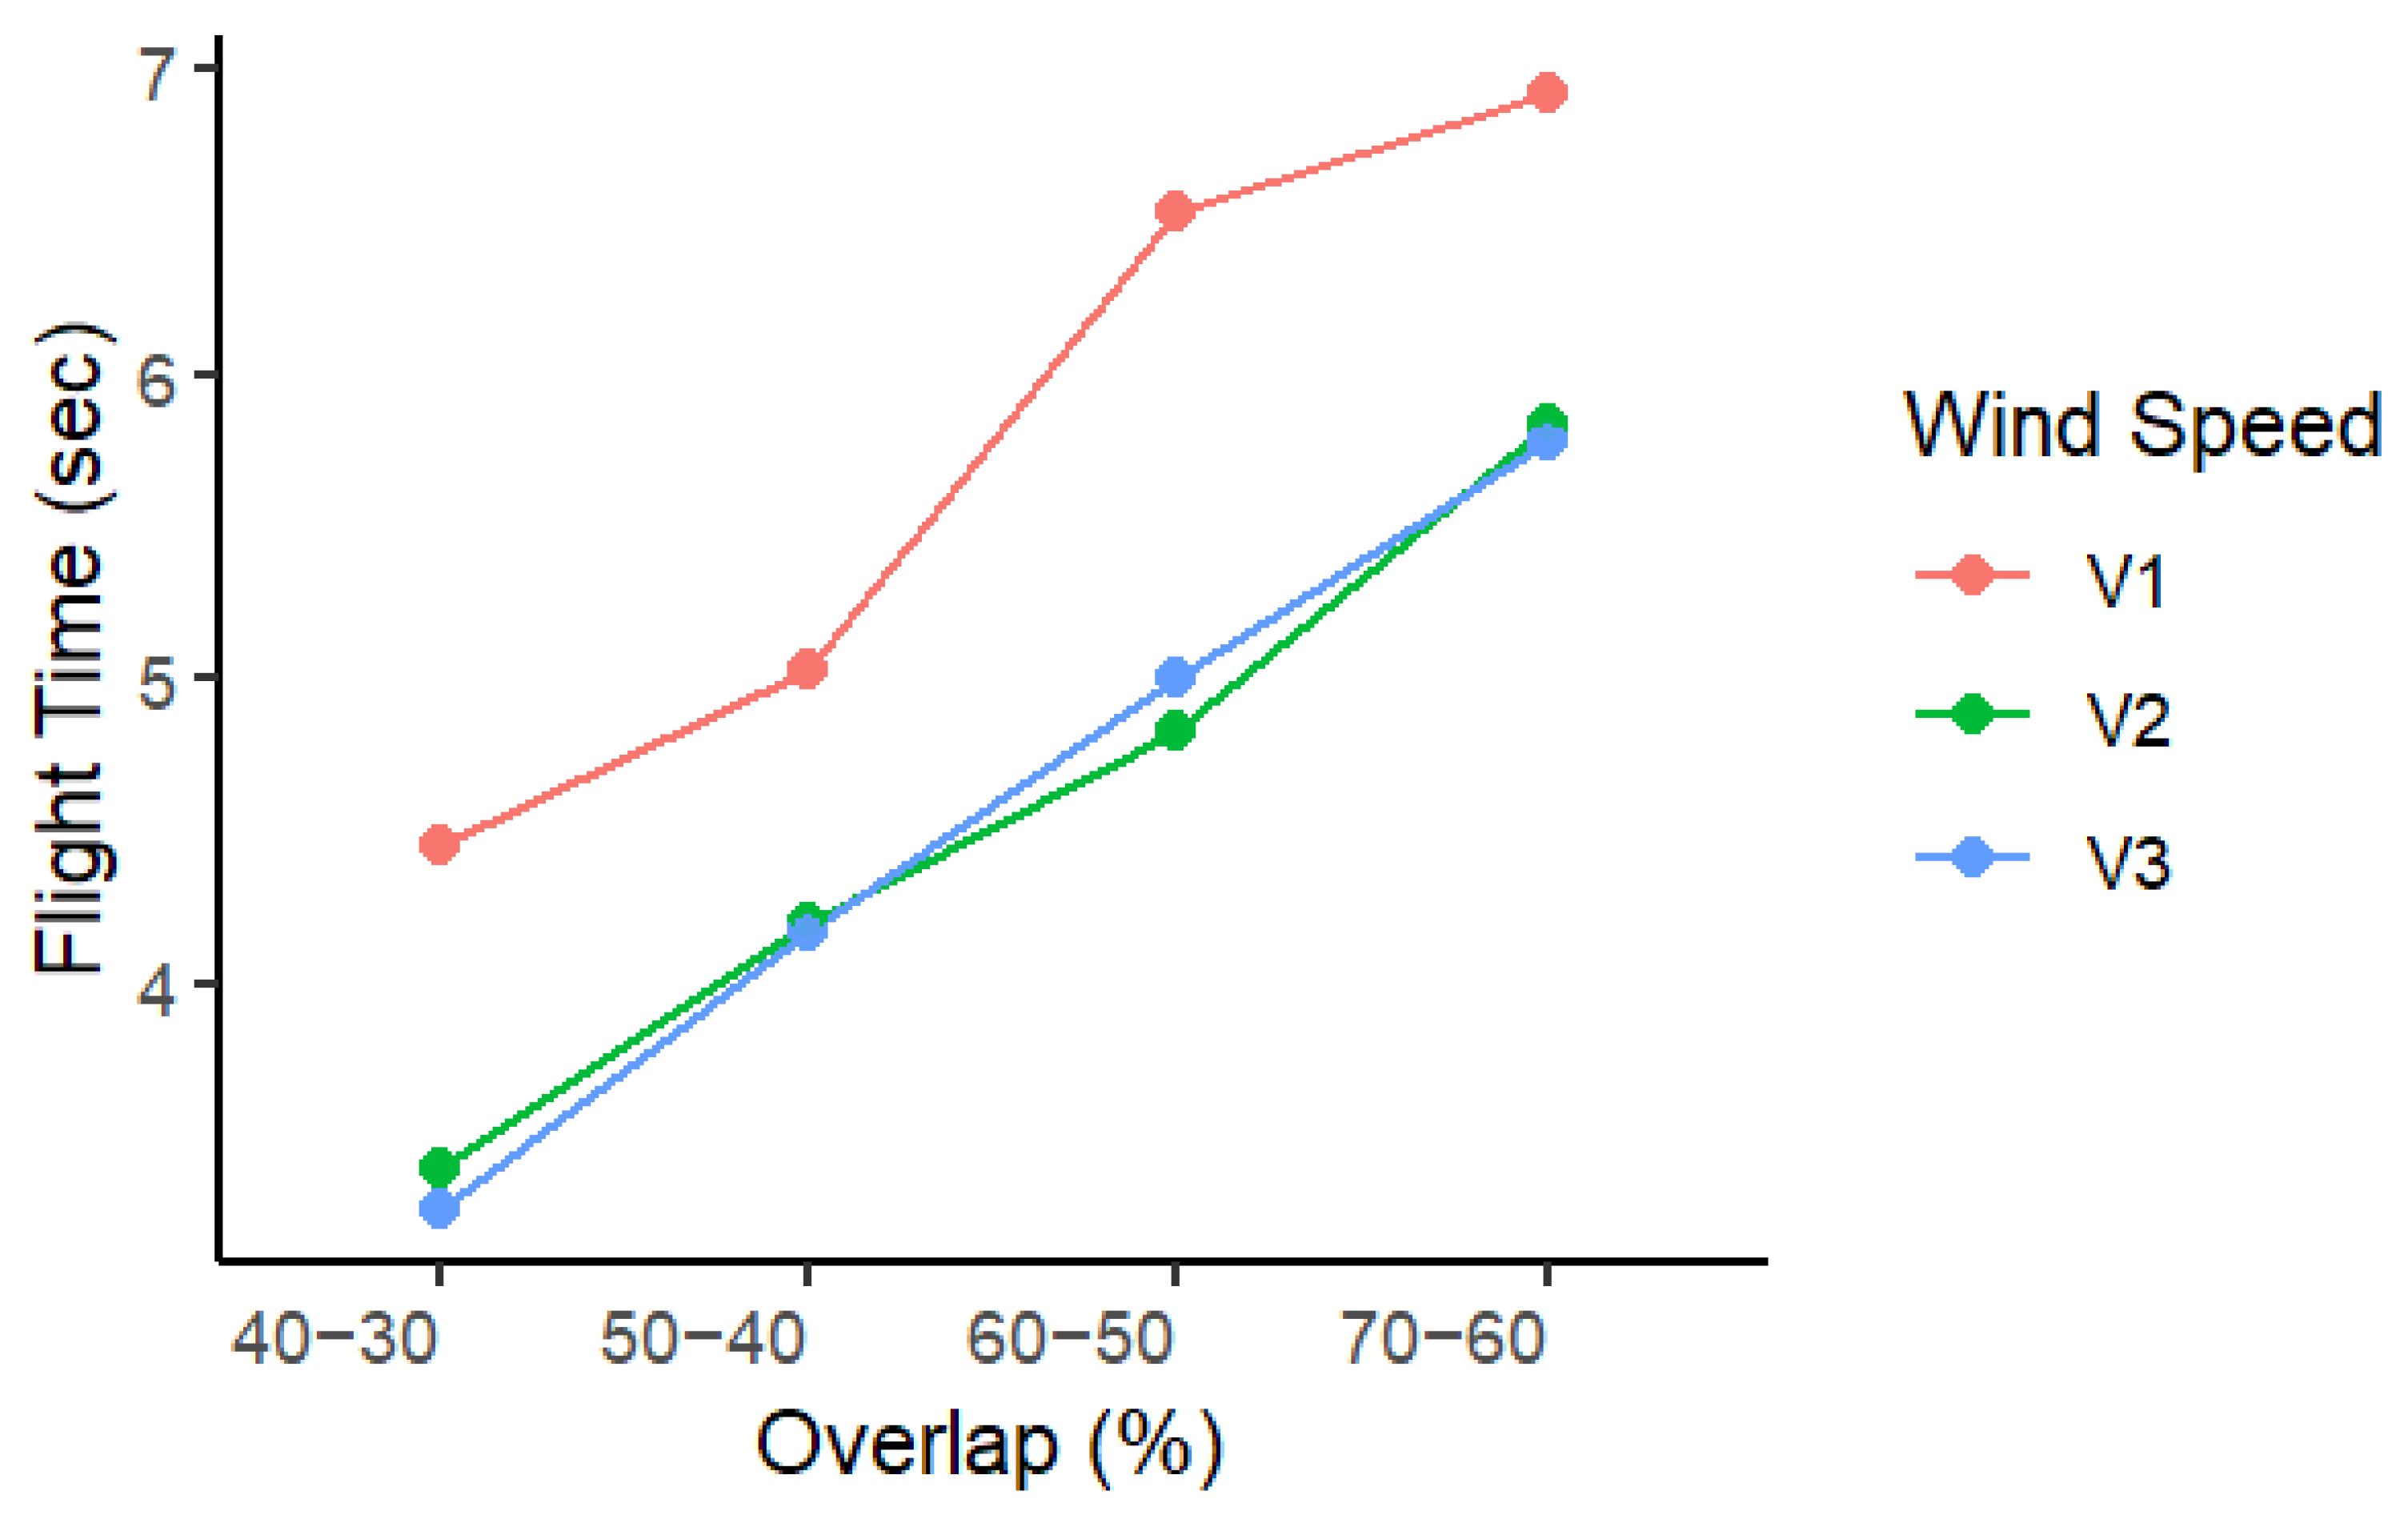
In
Figure 12, the flight time presents a constant positive trend for different values of overlap and grouped by the three wind speed scenarios. The percentage of frontal and lateral overlap is verified and directly affects the duration of the UAV flights. In this sense, fewer flight lines were needed to cover the study area at 40–30%. On the contrary, at 70–60%, more flight lines were required, so flight time increased. Specifically, it was noted that the longest flight of the UAV was 6 min and 33 s with a wind speed of 0 (m/s) and an overlap of 70–60%, while the shortest was 3 min and 9 s with a wind speed of 10 (m/s) and an overlap of 40–30%. These values comply with the flight autonomy of the UAV model used, which guarantees the fulfillment of the mission with a single flight plan.
On the other hand, with the different wind scenarios, the influence of this on the flight time was evident, specifically for the experiments carried out, with V2 and V3 the flight time decreases. This is a consequence of the force of the wind on the UAV, since it accelerated in the direction of said force, causing faster movements.
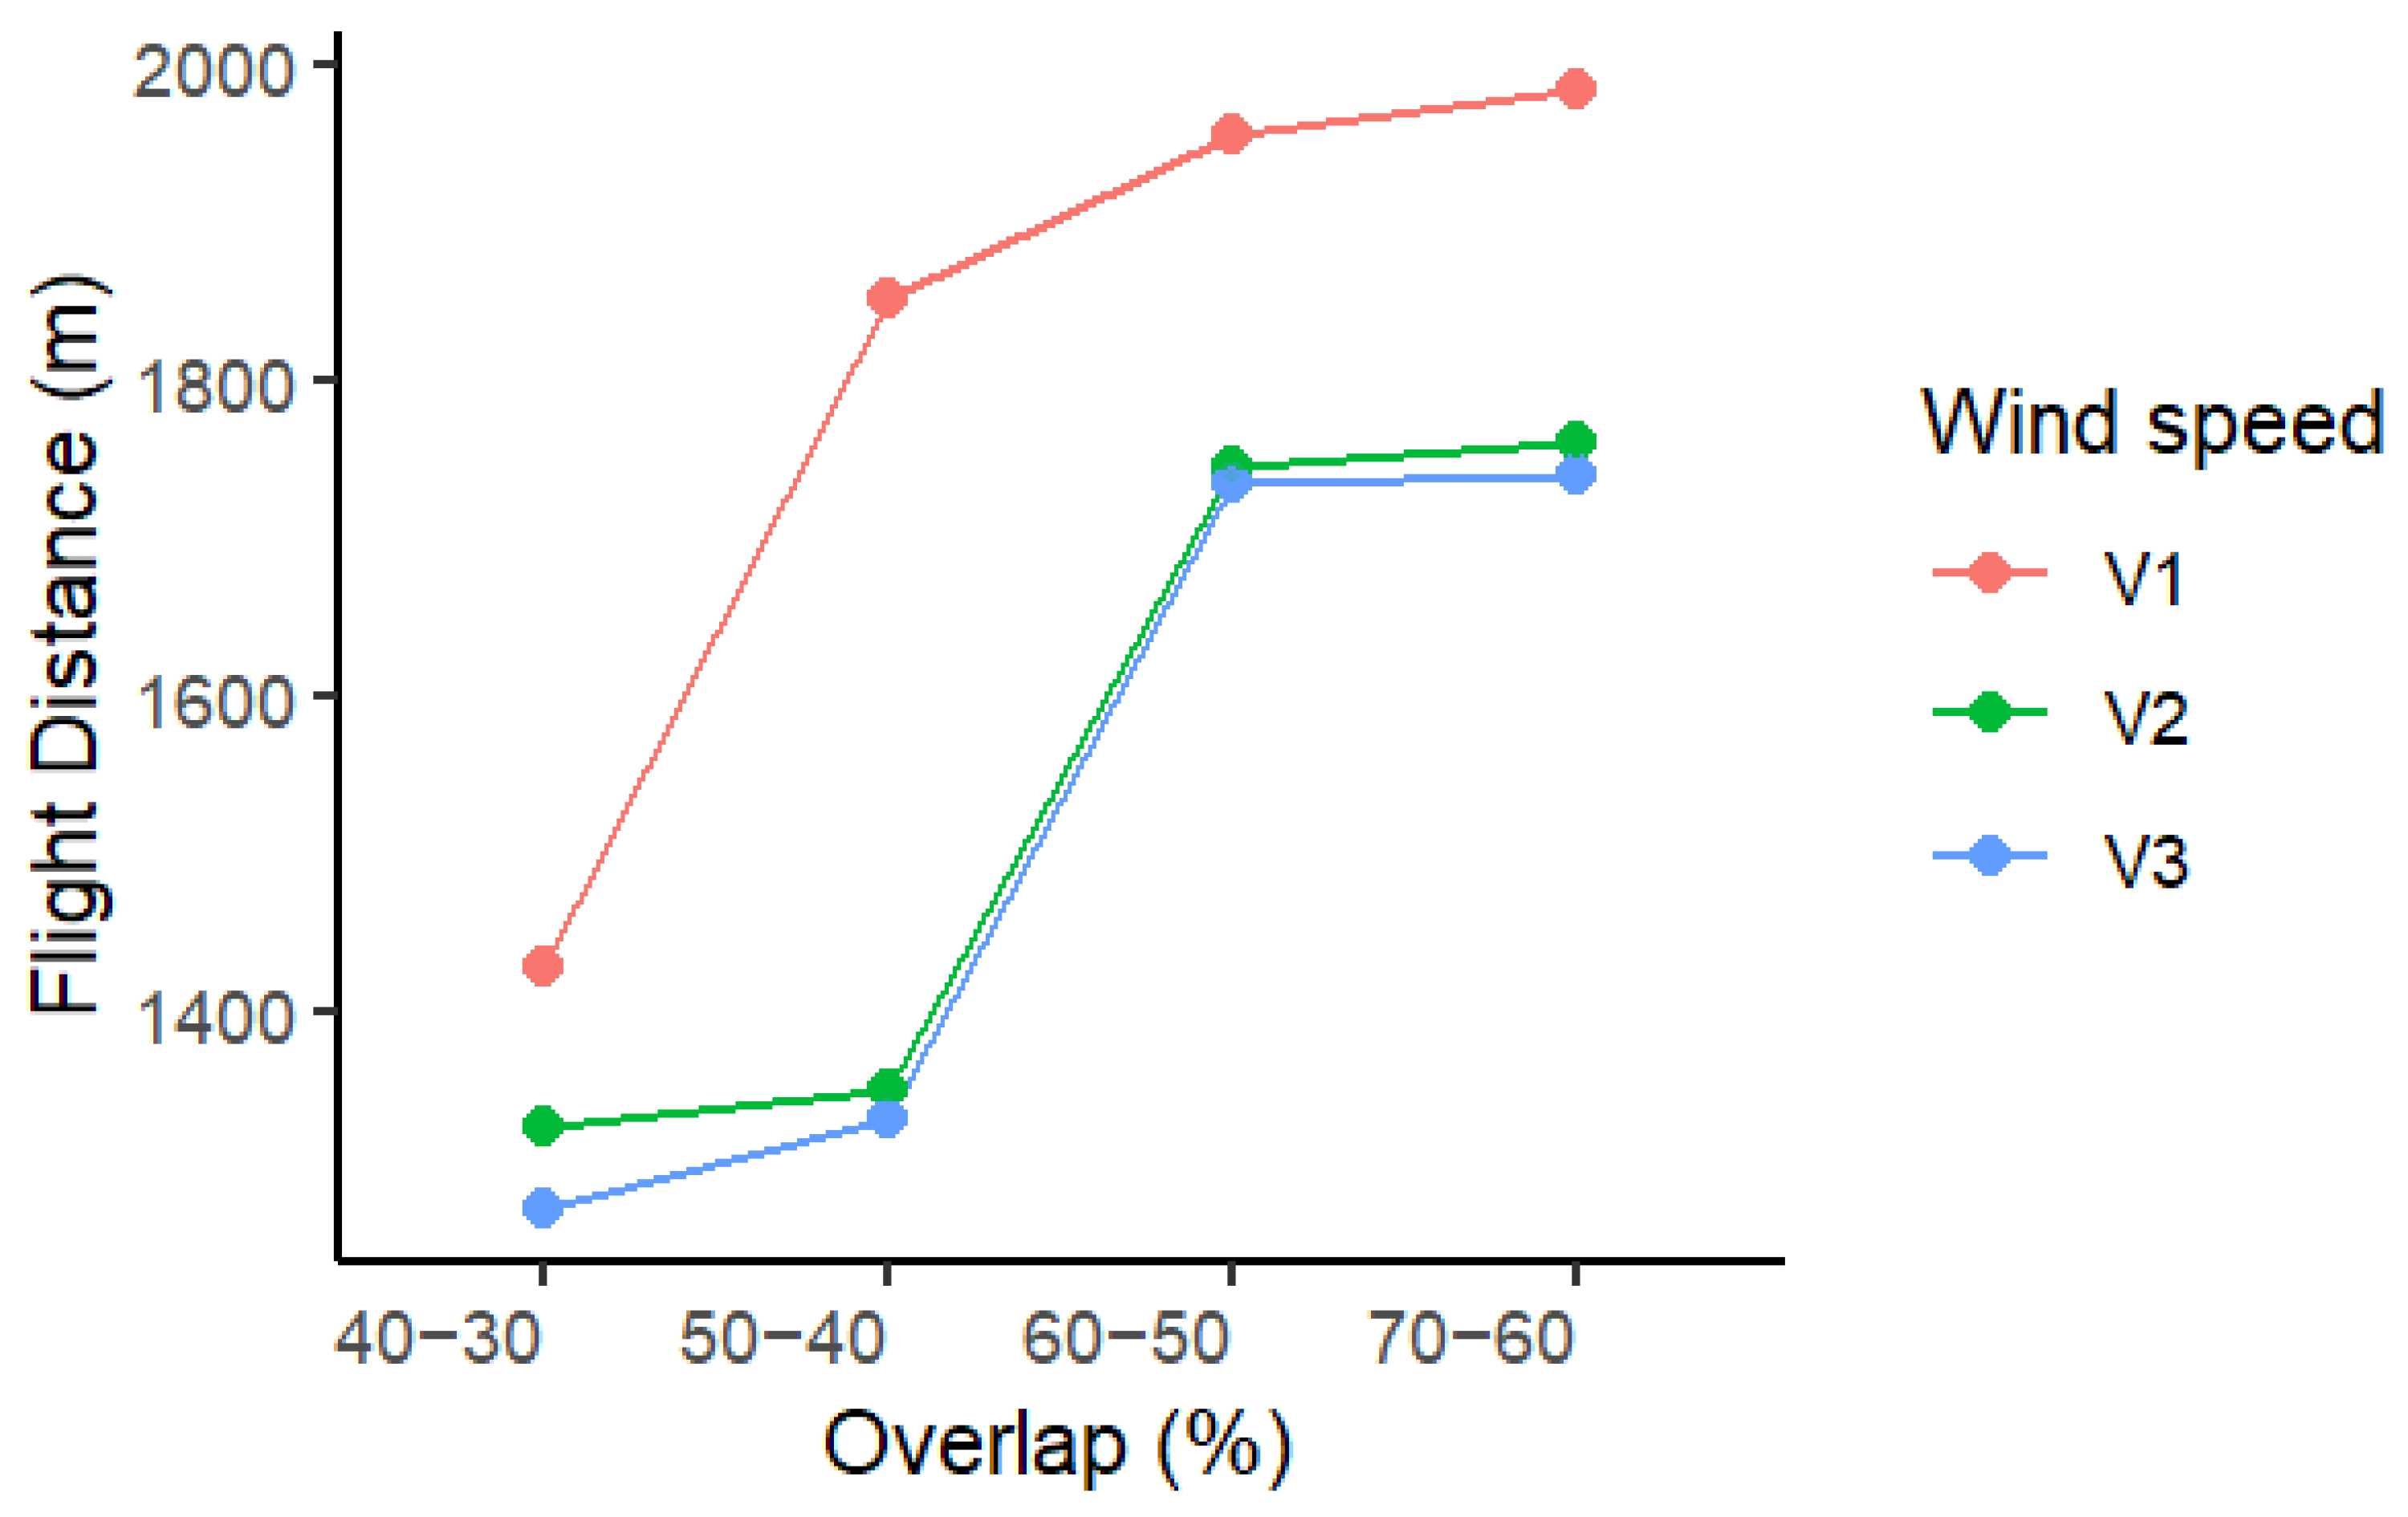
In the case of the distance traveled in flight, the trend had a direct relationship with the overlap values;
Figure 13. As indicated, increasing the overlap increases the number of flight lines, which is therefore reflected in the same way in the increase in the distance to be traveled by the UAV. Likewise, the influence of the wind is verified, as it is more evident that the UAV tends to move in the direction of the force, directly affecting the tracking of the flight lines, so the plan is affected.
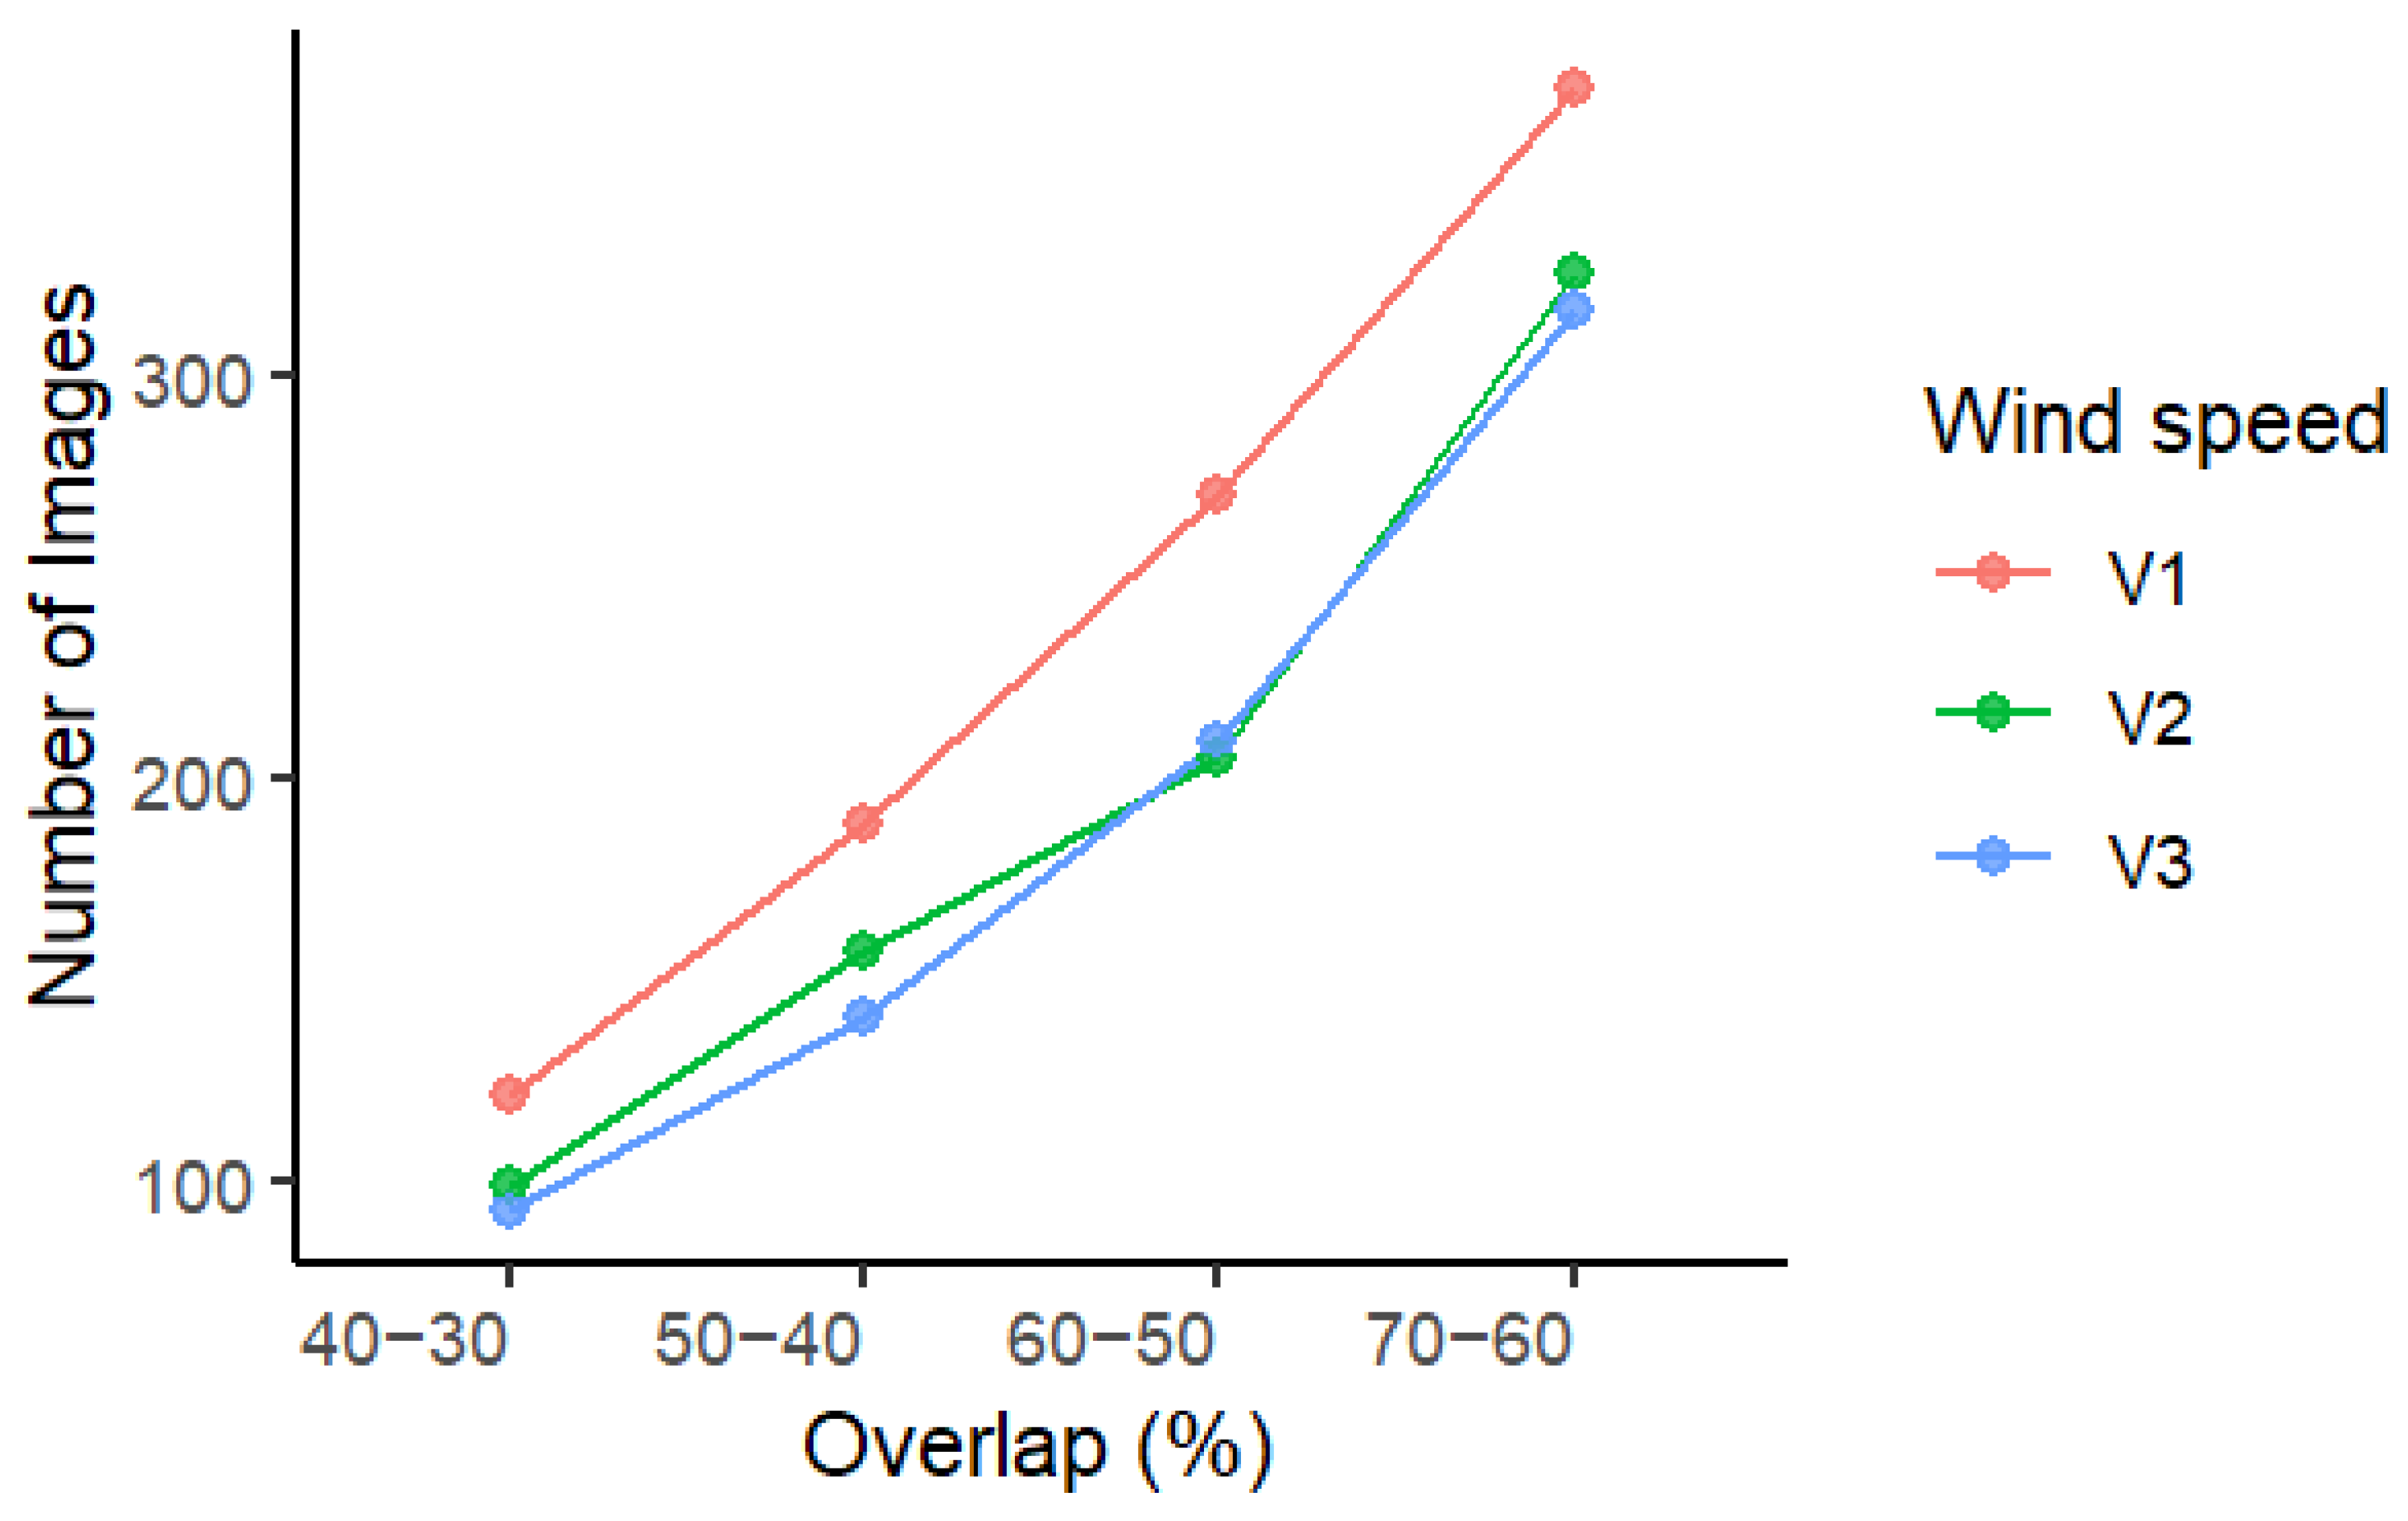
5.1.2. Number of Images
In
Figure 14, a positive linear trend is verified in the number of images for each flight mission with respect to overlap, so when using a higher percentage of overlap, the number of images increases.
With respect to the wind scenarios, for V2 and V3, there are fewer images, again a consequence of the force of the wind on the UAV. In this sense, as the flight plan is affected, it is possible that image-taking points will be lost, which means loss of information.
The effect of height has not been analyzed as it is determined by the GSD requirement, which establishes a specific flight altitude. However, Ref. [
38] indicates that at higher AGL altitudes, such as 70 or 80 m, differences in flight duration and the number of images decrease because the UAV’s trajectory is shortened. Additionally, at greater altitudes, spatial resolution and edge definition deteriorate, making it more challenging to distinguish individual elements. Conversely, lower AGL flights provide better detail analysis at the cost of longer flight durations. Nevertheless, image quality and resolution remain suitable for PF studies. Furthermore, smaller overlaps generally reduce flight time, flight distance, and the number of images, making them a key factor in optimizing mission planning. While wind presence decreases these parameters, it increases the likelihood of data loss, ultimately affecting the generation of orthomosaics, as discussed in the following paragraphs.
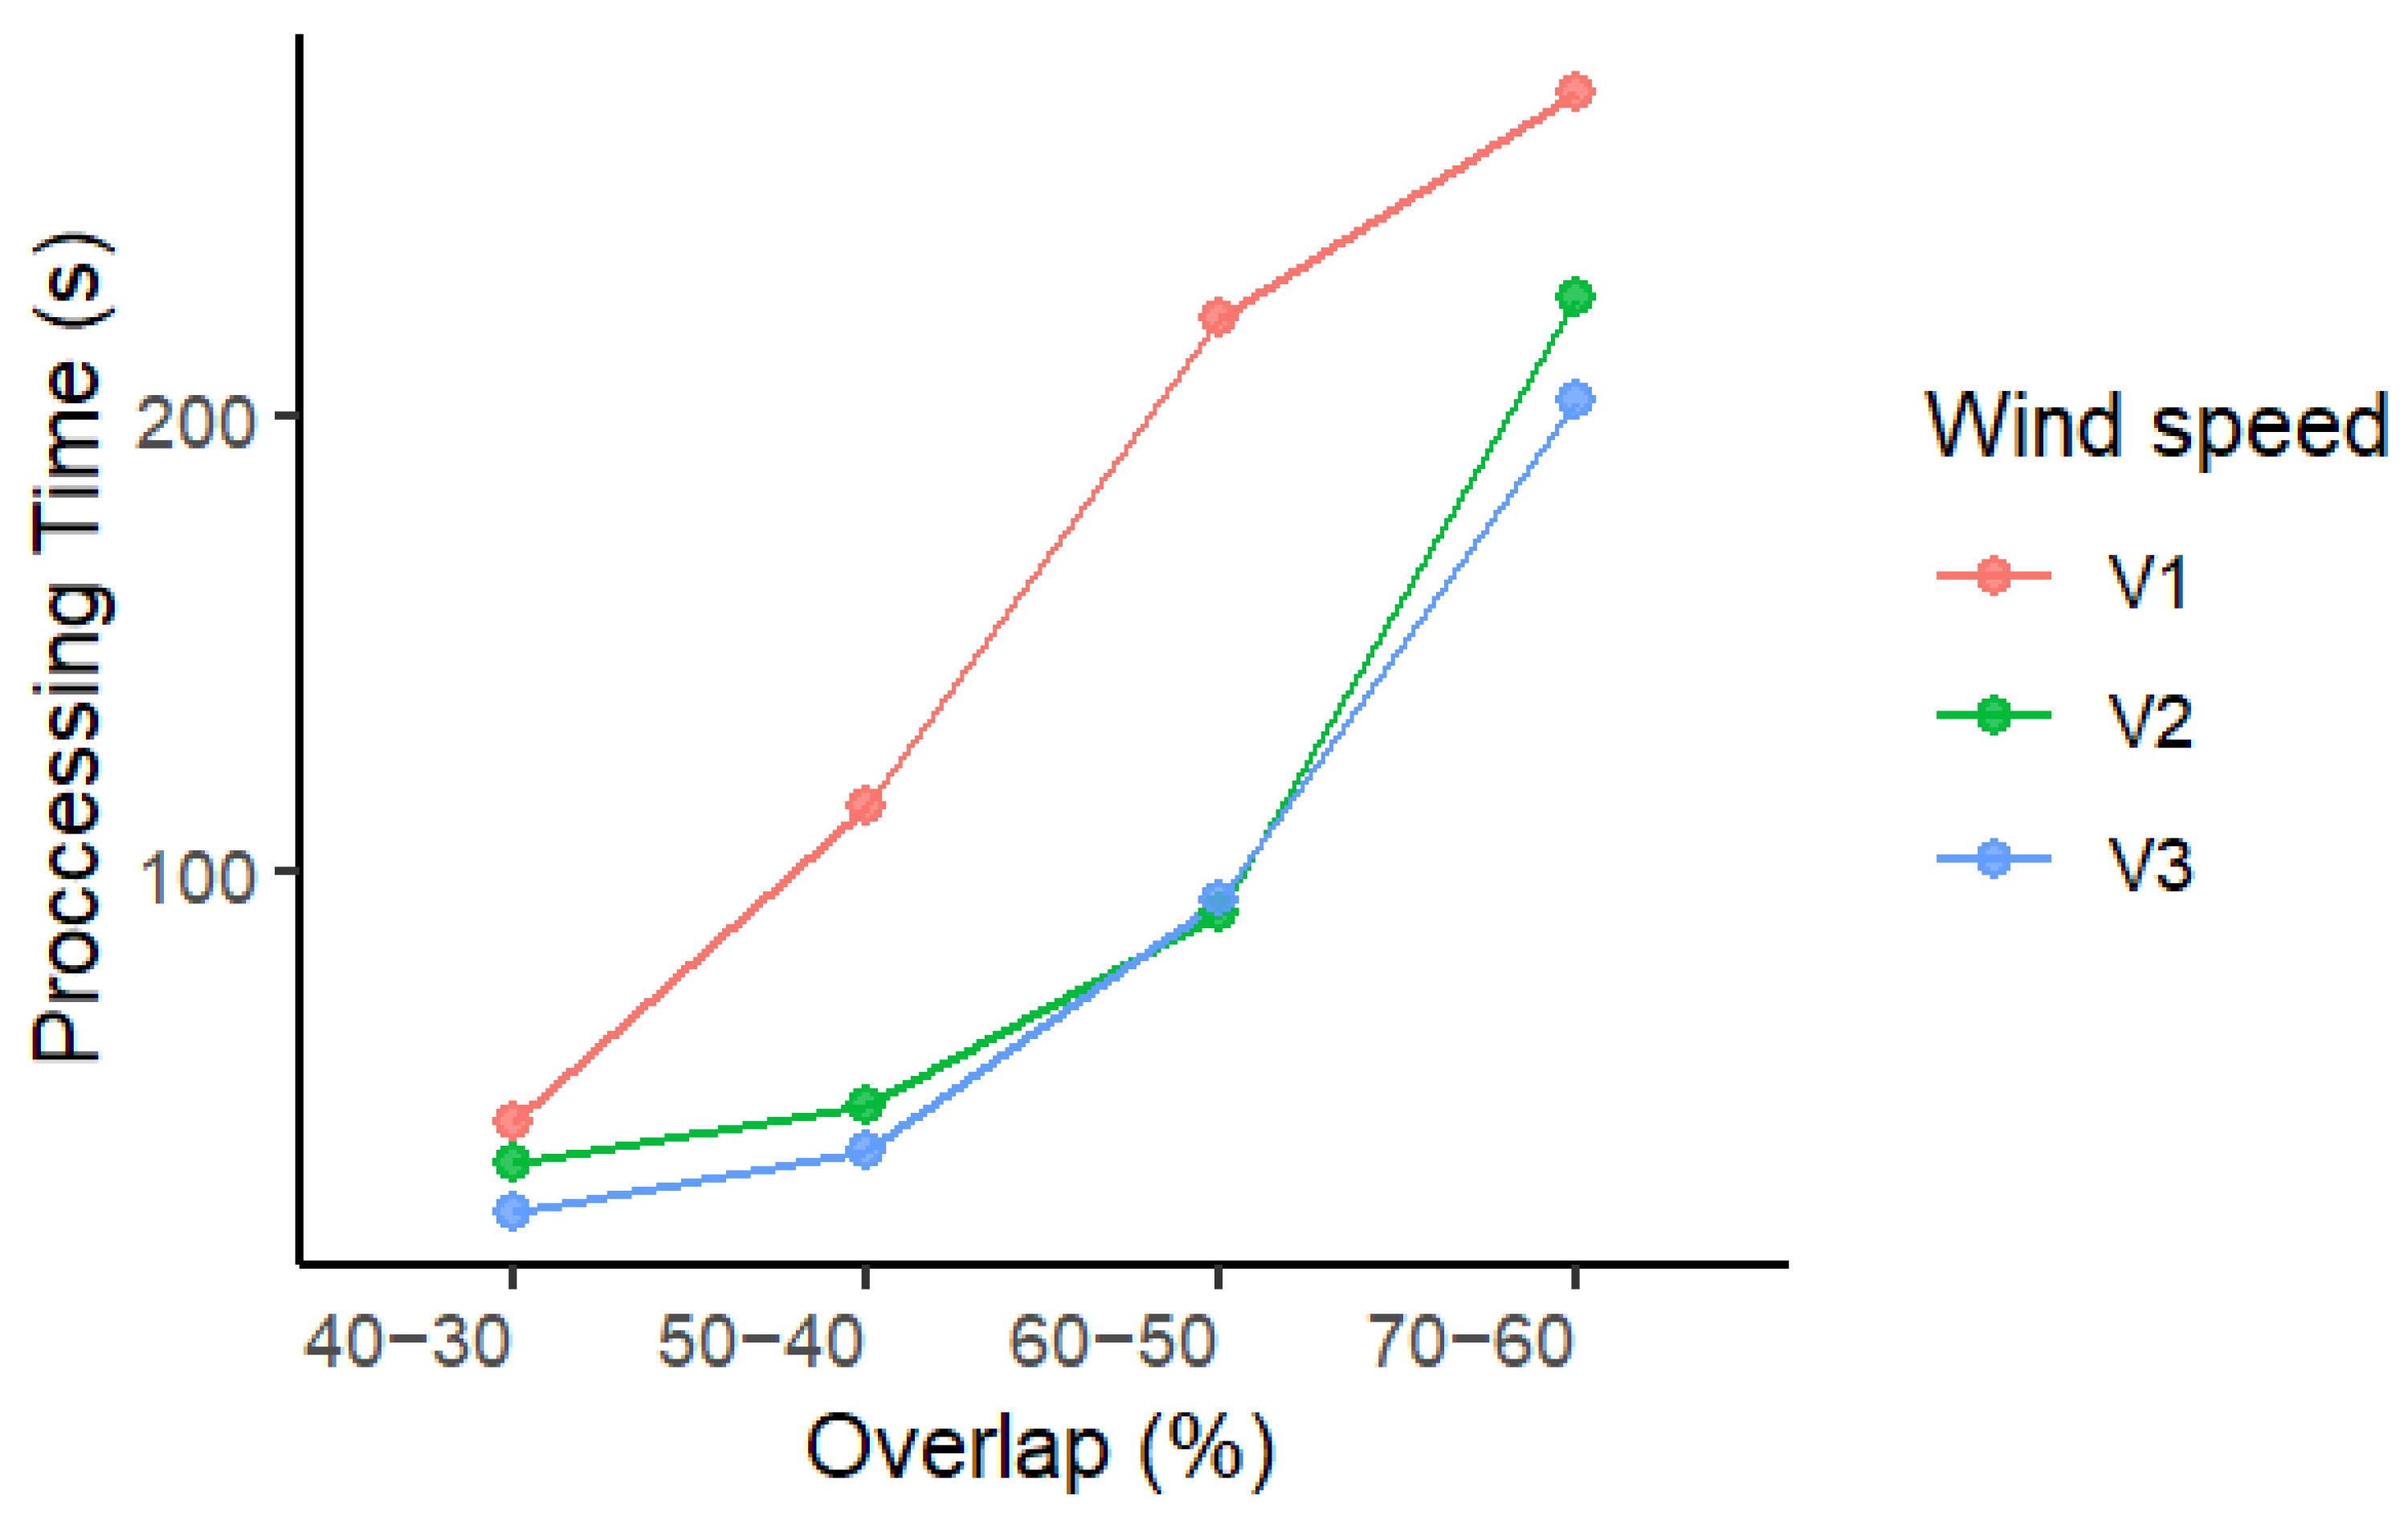
5.1.3. Image Processing Time
Figure 15 presents the relationship between the processing time and the overlap configuration in the three wind scenarios considered. As expected, processing time increases almost exponentially with larger amounts of images. Specifically, it is verified that the most time-consuming processing was approximately 271 min for an overlap of 70–60% and V1, while the least durable was 26 min for an overlap of 40–30% and V3.
In general terms, it is verified that the processing time becomes exponential with image overlaps of more than 60–50%. Regarding the Agisoft Metashape software (version 1.5.2) options for processing quality, it is expected that processing times increase for the “High” and “Maximum” categories with respect to the “Medium” quality used in the experiments. In this context, with the configurations established in the software, it is able to reconstruct the image without problem, and they are considered suitable for the generation of 2D orthomosaics. Furthermore, as expected, the effect of the wind is also reflected in the processing time, since in the cases of V2 and V3 the number of images is fewer and therefore the processing time is also shorter compared to V1.
5.2. Analysis of Quality Parameters
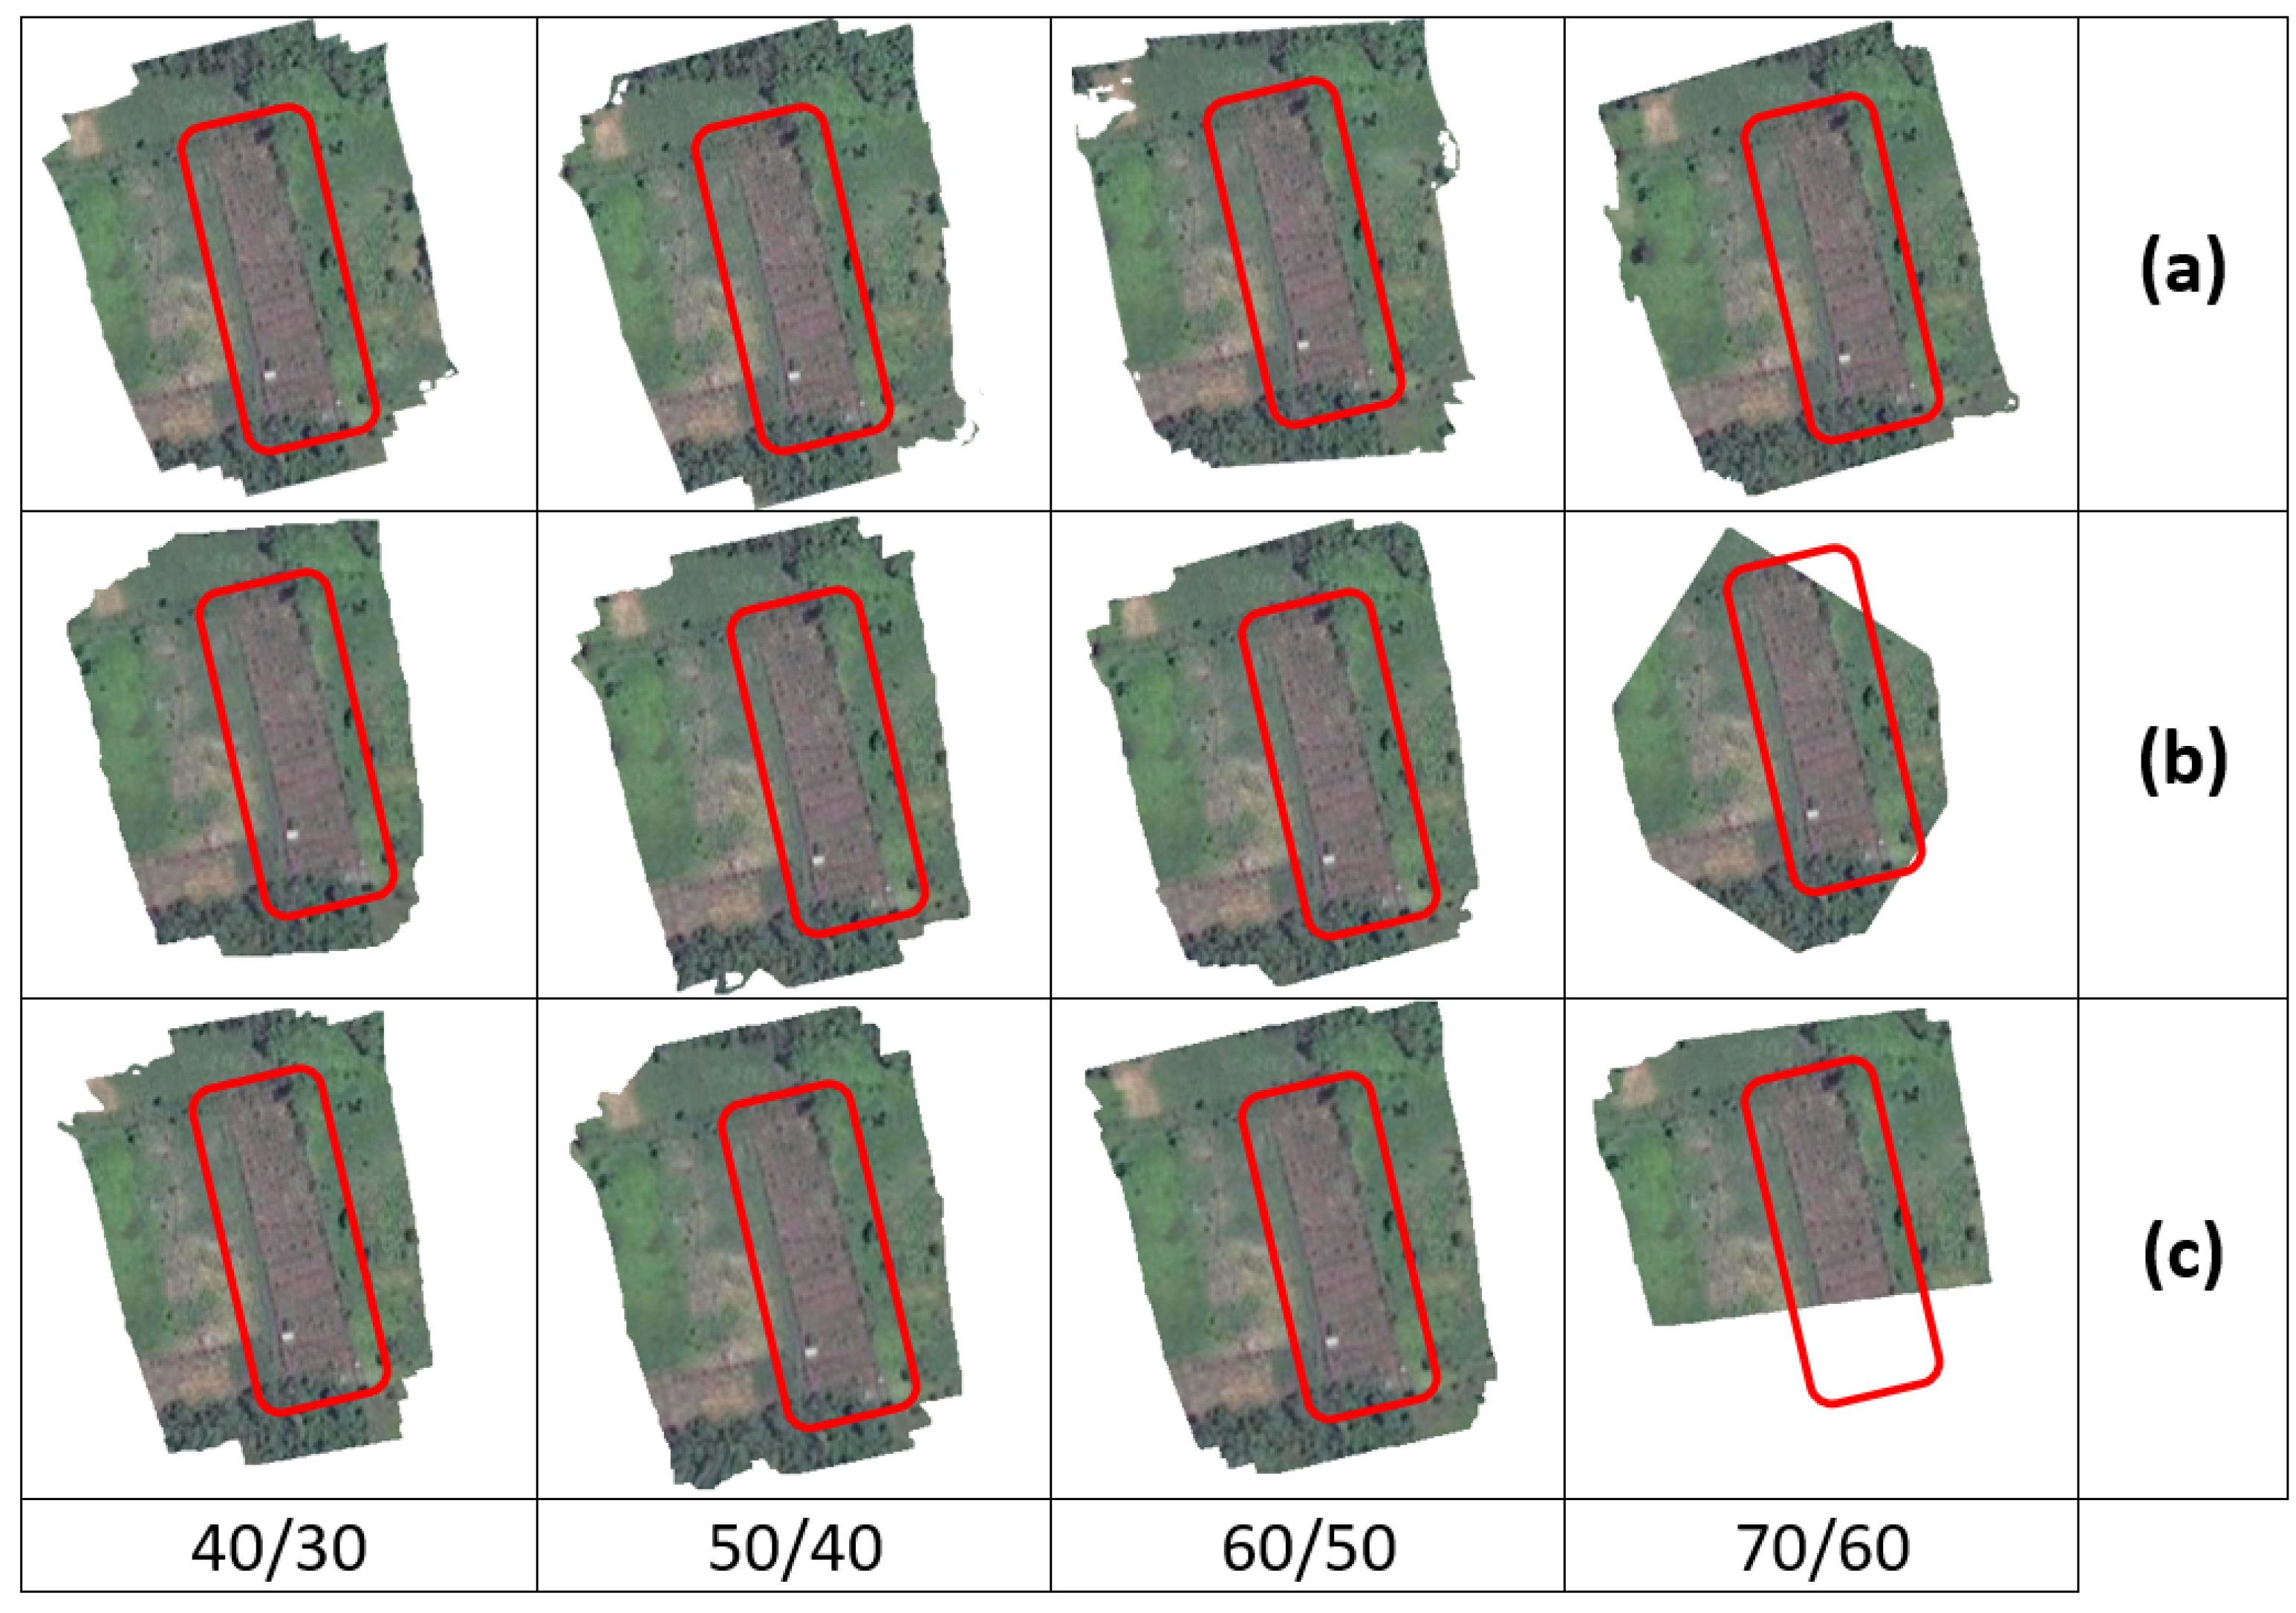
5.2.1. Visual Details
A qualitative visual inspection was conducted on the 12 orthomosaics generated (
Figure 16) using different overlap configurations and three wind scenarios for the same area of interest. In the first scenario (V1), the area of interest (red box) is perfectly reconstructed across all overlap configurations. In the other two scenarios, reconstruction remains satisfactory for the first three overlap configurations; however, in the last configuration, cuts in the area of interest (loss of information) are observed. This may result from the UAV’s forced movement due to wind forces. Additionally, the high overlap value could lead to an accumulation of redundant images and points, causing data loss during the orthomosaic construction process in Agisoft Metashape. Visually, no distortions are observed in the landforms distinguishable on the plane, indicating that maps where the area of interest was fully reconstructed remain valid for further study.
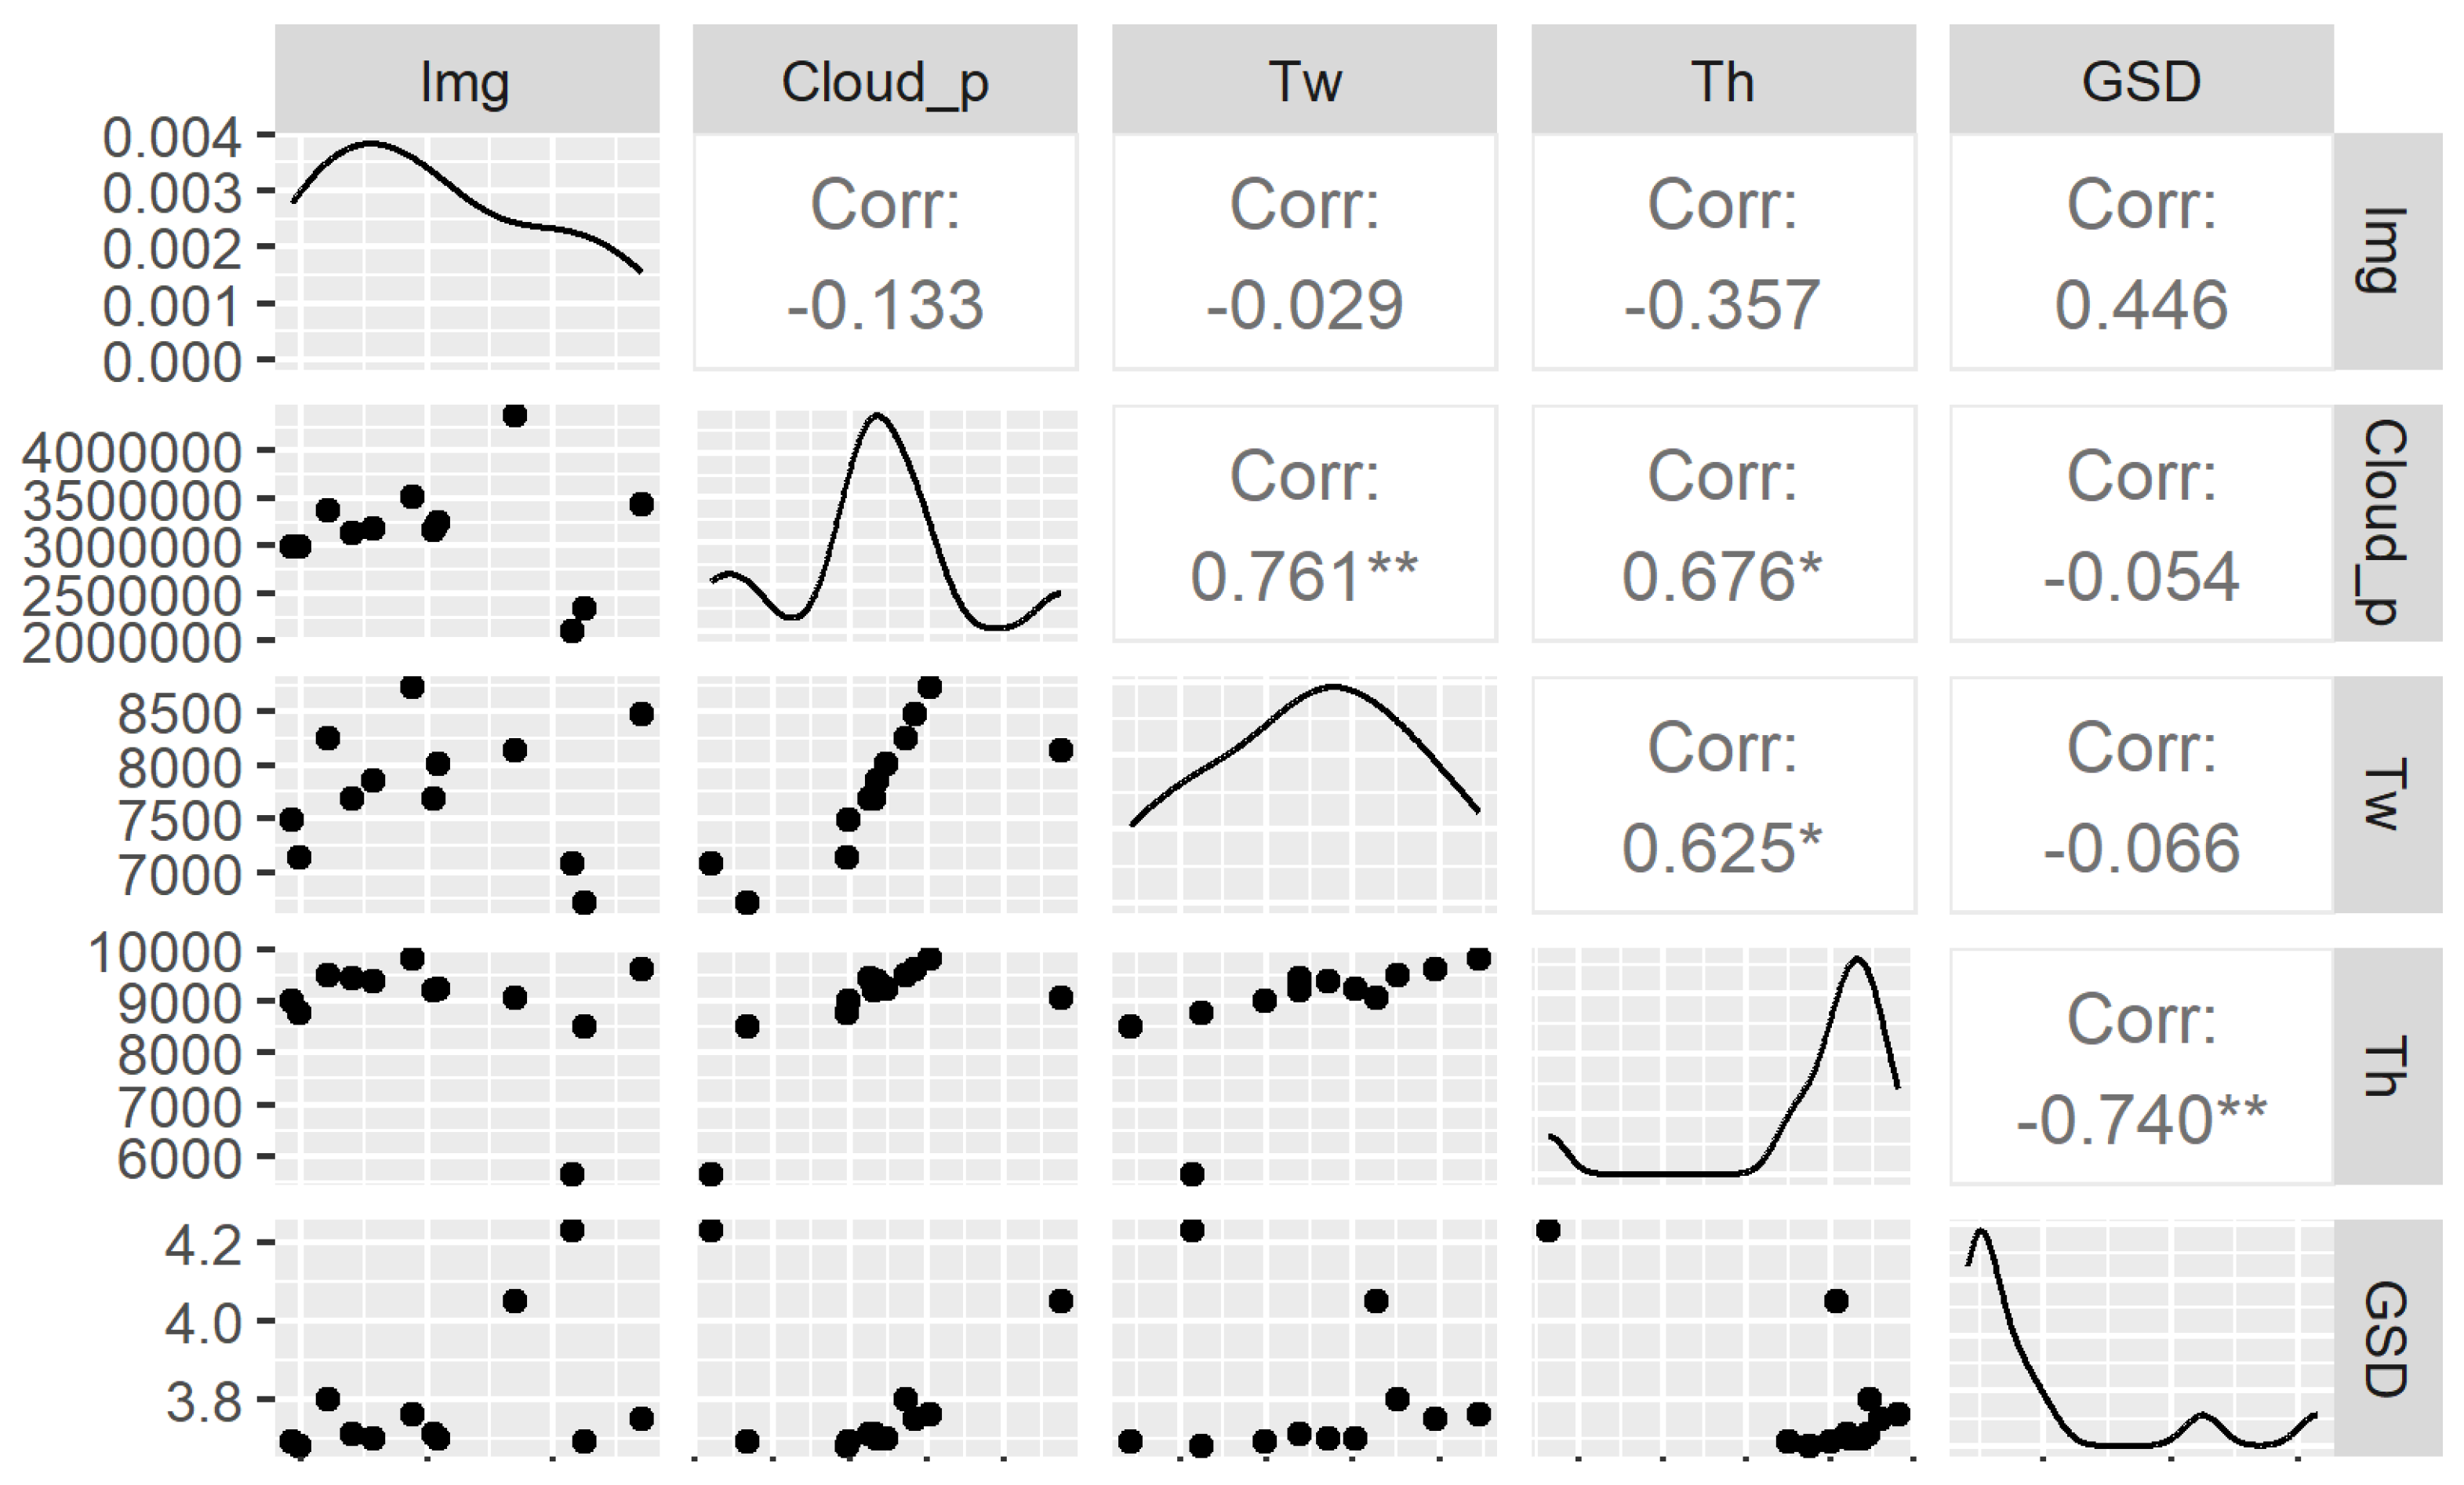
5.2.2. Precision Analysis
Figure 17 shows the correlation of the GSD parameters, size of the orthomosaics, point cloud, and number of images. Specifically, it can be verified that there is a regular correlation between the value of the quantity of the point cloud and the size of the orthomosaic, which shows a dependence on the quality in terms of the size of the orthomosaic of the point cloud.
As expected, the GSD does not have a direct relationship with the number of images or the point cloud, since as mentioned it is a parameter that depends on the flight height. According to the data in
Table 2, there is a mean of 3.79 (cm/pixel) and a standard deviation of +/−0.17 (cm/pixel), which gives us an acceptable precision according to the acceptable interval in the PF.
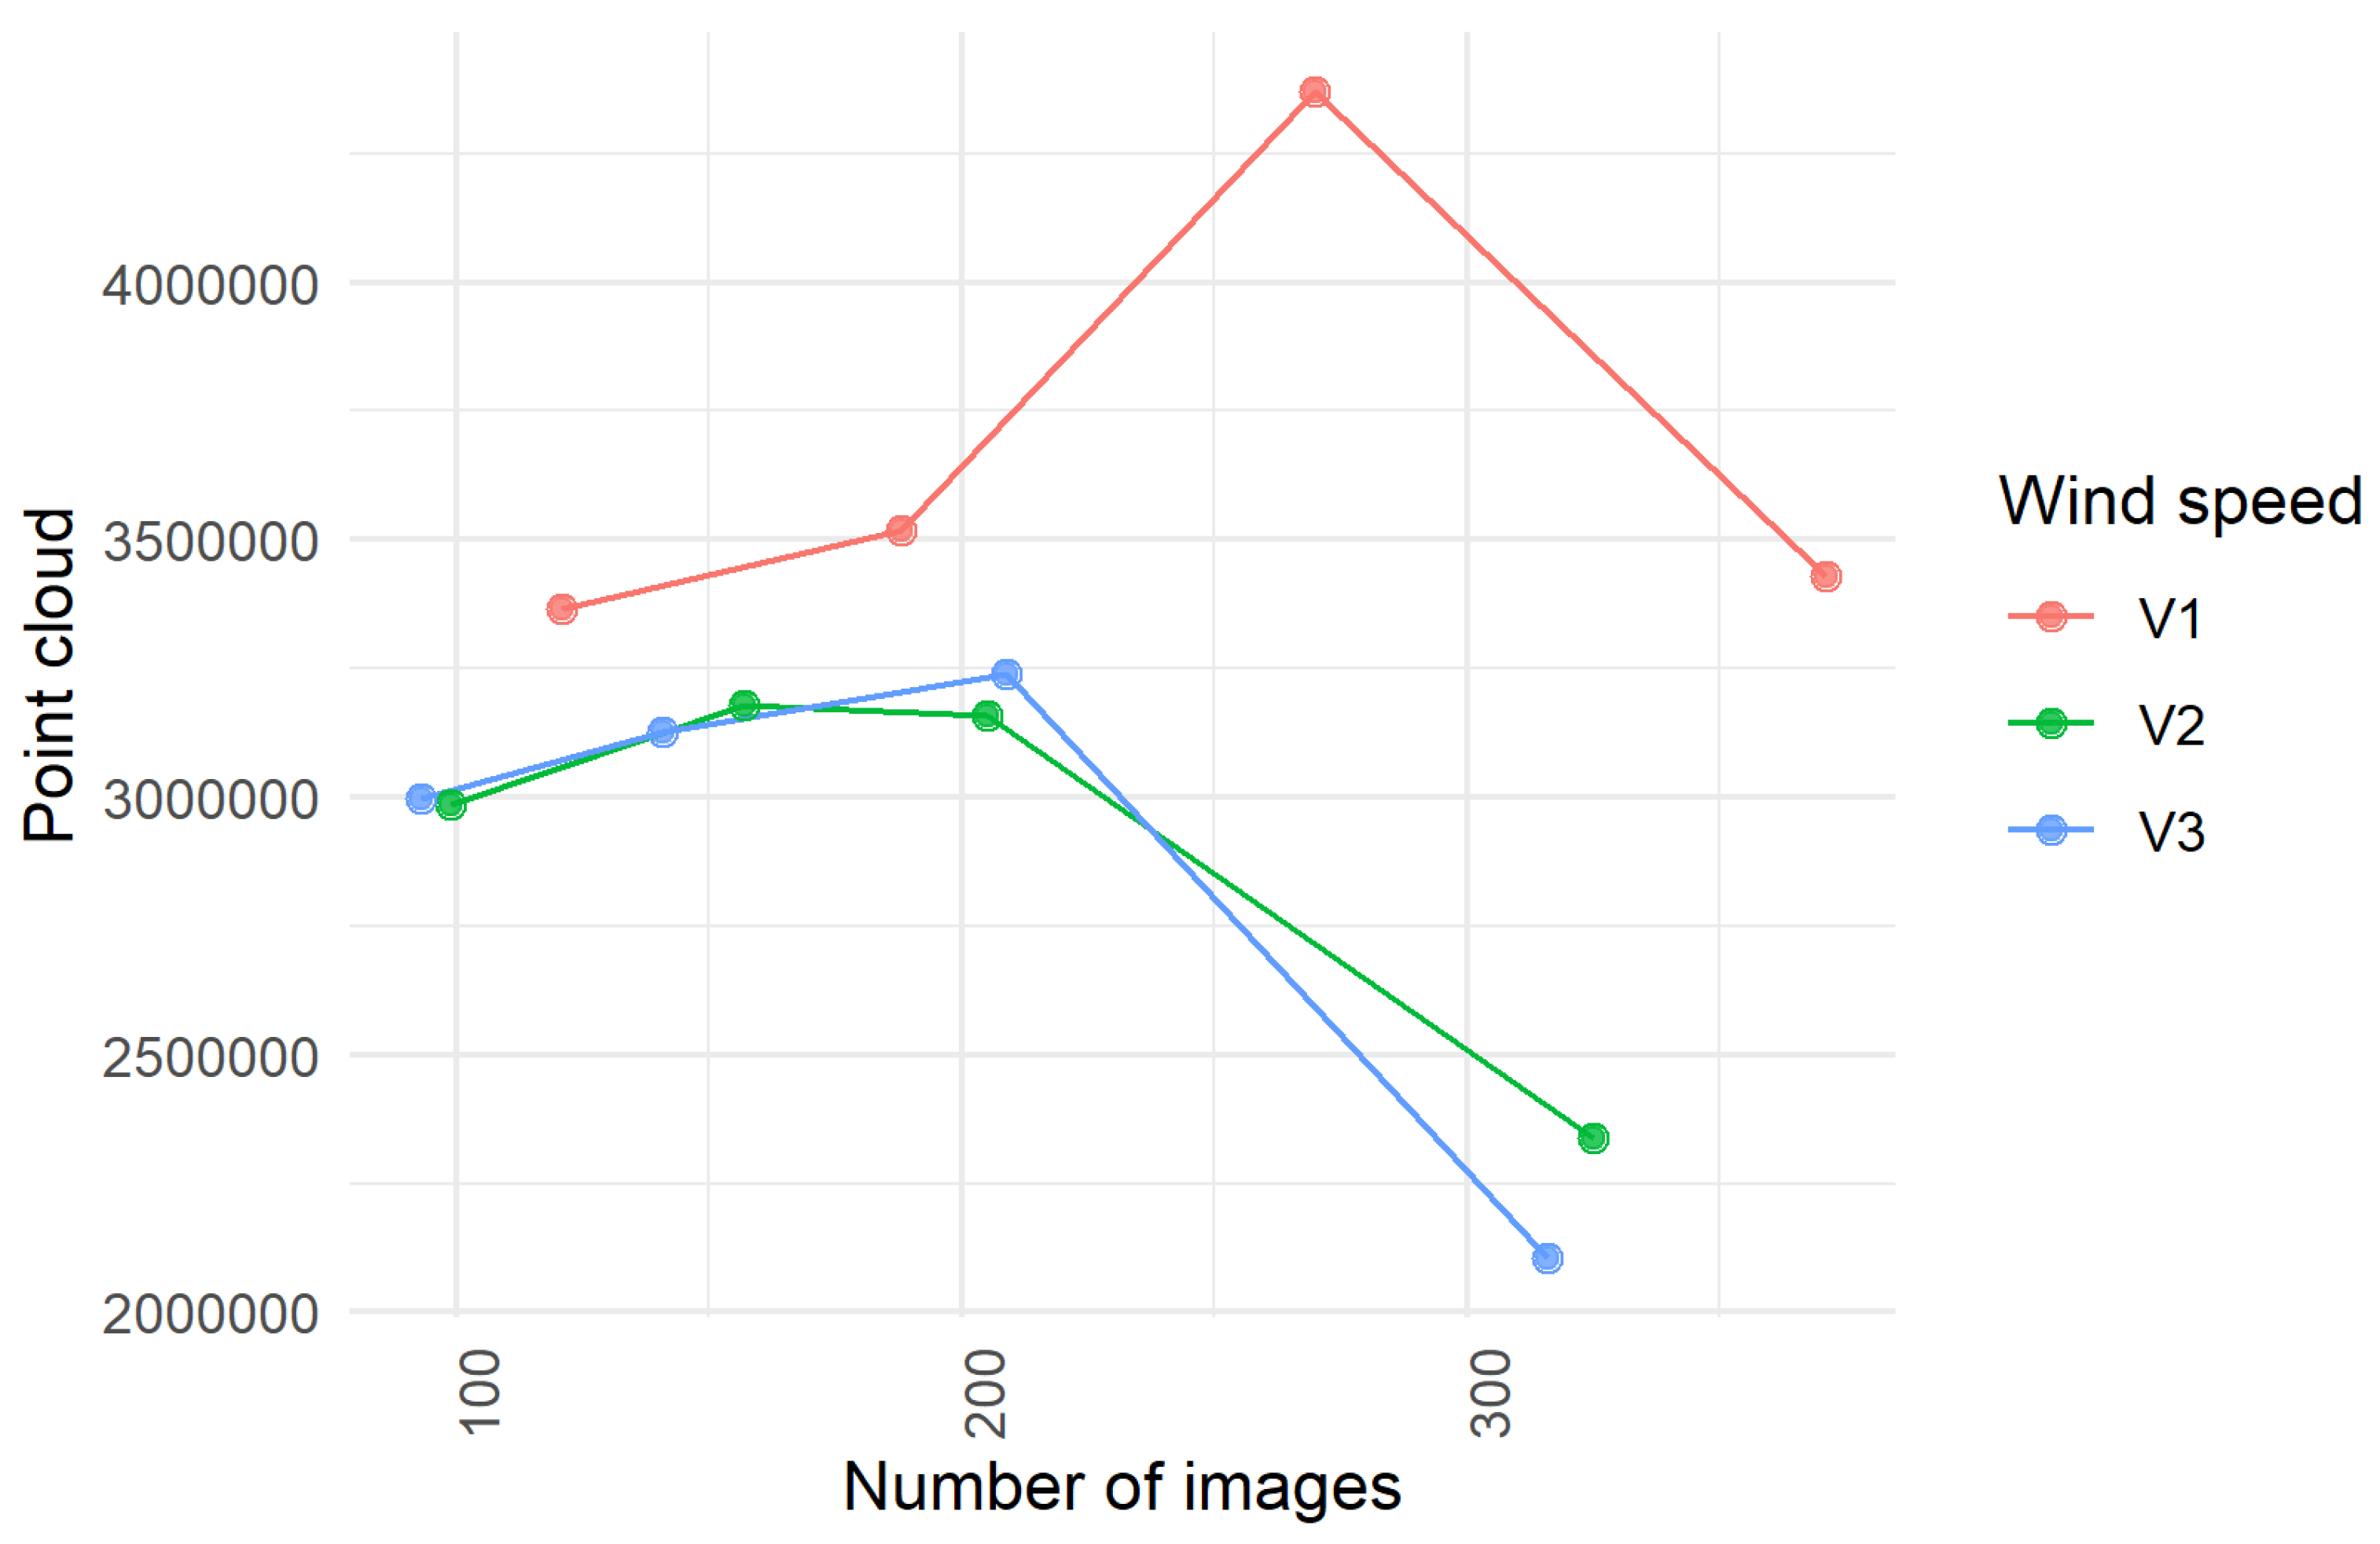
On the other hand, an inverse correlation is observed between the point cloud and the number of images. This is confirmed with
Figure 18, as it is evident that, for a greater number of images, the point cloud decreases. As verified, in this study, the largest number of images is obtained for high overlaps, which confirms that high overlap values generate redundant points that cause a decrease in the point cloud and therefore can cause loss of information such as cuts in the maps, as verified in
Figure 16.
6. Discussion
As indicated, in PF, UAVs have been adopted as support tools to improve agricultural management, mainly due to the advantages of these platforms, in terms of rapid, accurate, and frequent spatial data acquisition. However, the consequences due to poor planning imply low efficiency of field work on a specific project.
Planning a flight mission for a region of interest can be a complex task due to the vast number of possible configurations, including different altitudes, image overlaps, and weather conditions, making it challenging to select an optimal setup that meets project objectives. Moreover, a configuration with high overlaps does not necessarily guarantee optimal results, as it increases the number of trajectories, leading to longer flight and processing times, higher energy consumption, and greater storage requirements.
Therefore, this simulation option is presented in which, without the need to conduct field work, an optimal condition for PF work can be studied that can be accessible to small- and medium-sized farmers, even for the purpose of applying it to larger fields. It can have the potential for rapid mapping in crops. In addition, this scheme allows us to determine whether or not it is possible to carry out mapping under certain wind conditions that can be accessed in real time from the meteorological stations, achieving better planning and optimization in the use of resources.
The balance between point cloud density and processing time is a key consideration in photogrammetry applications. A high overlap value can improve the model, but redundancy significantly increases processing time and storage requirements. This study has shown that even low overlap values achieve good results. Therefore, future work may consider optimization suggestions such as dynamically adjusting the degree of overlap, for example, using high values in complex areas and low values in flat areas.
Finally, based on the results presented in any of the three scenarios, the 40–30% overlap configuration is chosen since for the flight height of 40 (m), obtaining orthomosaics requires the least flight and processing time, as well as a smaller number of photographs, and the maps obtained have acceptable quality in terms of high resolution and details on the map.
7. Conclusions
In precision agriculture, it is important to consider the heterogeneity of crops for decision making. In this sense, orthomosaics are key inputs, so the quality and efficiency in obtaining them must be studied in order to optimize resources and minimize costs. As could be verified, the simulation tool proposed in this article contributes a new way to analyze and find an appropriate parameter configuration for the UAV flight mission, as well as anticipating wind conditions that increase the risk in a real mission and the time of field work, since, if there is loss of information, new flight plans are required.
To motivate the widespread use of these platforms, a detailed photogrammetric study is presented in which several parameters such as the resolution requirement, equipment characteristics, and flight plan variables are mathematically related, with the objective of demonstrating its effect on obtaining orthomosaics in quality and efficiency terms. This analysis allows us to establish the parameters that have the greatest effect on obtaining orthomosaics for a particular case, and through these, the different experimental configurations tested are established.
In agricultural applications, GSD is an important factor in guaranteeing precision in crops, so high-resolution values imply low flight heights, hence the reason why this study is carried out. And, in contrast to studies carried out at higher heights, when working with a lower height, the number of images increases, so low overlap values are sufficient to generate quality orthomosaics with reduced work times.
Regarding the processing time, it is verified that it is closely related to the number of images and the percentage of overlap; therefore, the greater the overlap, the greater the number of images, and the greater the time required (it increased exponentially). In addition, it is evident that for high overlap values at a height of 40 (m), there is less density in the point cloud due to the existence of redundant images, so the generation of orthomosaics is less efficient and in certain cases there may be loss of information.
Finally, in relation to the orthomosaics obtained for the three scenarios of wind conditions, it is shown that the 40–30% overlap configuration is sufficient to generate acceptable DSMs, with a GSD that is within the PF requirements and with minimal flight and processing time. In contrast to other studies, the conclusion is reached that for lower flight heights (in this case, 40 m), low overlap percentages generate good quality maps with greater efficiency. These results highlight the usefulness of the proposed simulation scheme to estimate the results to be obtained in the field and thus perform better planning by optimizing resources.
As future work, it is expected that real flight tests will be carried out under the same experimental configurations used in this work, with the aim of contrasting and corroborating the results obtained. Likewise, it is expected that the global digital twin will be improved and test considering other variables such as the variation in flight speed, ground control points, lighting conditions, and 3D reconstruction of crops.
Author Contributions
Conceptualization, A.O., L.O., A.C. and E.V.; methodology, A.O. and A.C.; validation, A.C., L.O. and E.V.; formal analysis, A.O., L.O. and E.V.; investigation, A.C. and L.O.; resources, E.V.; writing—original draft preparation, A.O. and A.C.; writing—review and editing, L.O. and E.V.; visualization, A.O. and A.C.; supervision, A.O. and E.V.; project administration, E.V.; funding acquisition, E.V. All authors have read and agreed to the published version of the manuscript.
Funding
This research was funded by Escuela Politécnica Nacional through the following grants: PIGR 23-07 and PIM 21-01 and PIEX-DIM-VLIR-2023 (EC2023SIN381A101) and PIEX-DIM-VLIR-2025 (EC2024TEA547A101), and PIEX-CEDIA-24-99.
Data Availability Statement
The data presented in this study are not publicly available due to privacy and ethical restrictions.
Acknowledgments
The authors of this article thank the funding of Escuela Politécnica Nacional through the projects: PIGR 23-07 and PIM 21-01 and PIEX-DIM-VLIR-2023 (EC2023SIN381A101) and PIEX-DIM-VLIR-2025 (EC2024TEA547A101), and PIEX-CEDIA-24-99.
Conflicts of Interest
The authors declare no conflicts of interest.
Abbreviations
The following abbreviations are used in this manuscript:
| SDG | Sustainable Development Goals |
| PF | Precision Farming |
| DT | Digital Twin |
| SITL | Software in the Loop |
| MDS | Mission Data System |
| GCS | Ground Control Station |
| DSM | Digital Surface Model |
References
- Bank, W. Agriculture and Food. 2023. Available online: https://www.worldbank.org/en/topic/agriculture/overview#3 (accessed on 27 May 2023).
- MAGAP. Agricultura, la Base de la Economía y la Alimentación. 2019. Available online: https://www.agricultura.gob.ec/agricultura-la-base-de-la-economia-y-la-alimentacion/ (accessed on 30 May 2023).
- Cepal, N. La Agenda 2030 y los Objetivos de Desarrollo Sostenible: Una oportunidad para América Latina y el Caribe. Objetivos, metas e indicadores mundiales. 2019. Available online: https://repositorio.cepal.org/server/api/core/bitstreams/cb30a4de-7d87-4e79-8e7a-ad5279038718/content (accessed on 20 May 2023).
- Godwin, R.; Wood, G.; Taylor, J.; Knight, S.; Welsh, J. Precision farming of cereal crops: A review of a six year experiment to develop management guidelines. Biosyst. Eng. 2003, 84, 375–391. [Google Scholar] [CrossRef]
- Tanriverdi, C. A review of remote sensing and vegetation indices in precision farming. J. Sci. Eng 2006, 9, 69–76. [Google Scholar]
- Pinaki, M.; Tewari, V.K. Present status of precision farming: A review. Int. J. Agric. Res. 2010, 5, 1124–1133. [Google Scholar]
- Njoroge, B.M.; Fei, T.K.; Thiruchelvam, V. A research review of precision farming techniques and technology. J. Appl. Technol. Innov. 2018, 2. [Google Scholar]
- Ardiansah, I.; Bafdal, N.; Suryadi, E.; Bono, A. Greenhouse monitoring and automation using Arduino: A review on precision farming and internet of things (IoT). Int. J. Adv. Sci. Eng. Inf. Technol. 2020, 10, 703–709. [Google Scholar] [CrossRef]
- Mizik, T. How can precision farming work on a small scale? A systematic literature review. Precis. Agric. 2023, 24, 384–406. [Google Scholar] [CrossRef]
- Srivastava, A.; Prakash, J. Techniques, Answers, and Real-World UAV Implementations for Precision Farming. Wirel. Pers. Commun. 2023, 131, 2715–2746. [Google Scholar] [CrossRef]
- Nguyen, K.V.; Nguyen, C.H.; Van Do, T.; Rotter, C. Efficient Multi-UAV Assisted Data Gathering Schemes for Maximizing the Operation Time of Wireless Sensor Networks in Precision Farming. IEEE Trans. Ind. Inform. 2023, 19, 11664–11674. [Google Scholar] [CrossRef]
- Aláez, D.; Olaz, X.; Prieto, M.; Villadangos, J.; Astrain, J. VTOL UAV digital twin for take-off, hovering and landing in different wind conditions. Simul. Model. Pract. Theory 2023, 123, 102703. [Google Scholar] [CrossRef]
- Sona, G.; Passoni, D.; Pinto, L.; Pagliari, D.; Masseroni, D.; Ortuani, B.; Facchi, A. UAV multispectral survey to map soil and crop for precision farming applications. Int. Arch. Photogramm. Remote Sens. Spat. Inf. Sci. 2016, 41, 1023–1029. [Google Scholar] [CrossRef]
- Candiago, S.; Remondino, F.; De Giglio, M.; Dubbini, M.; Gattelli, M. Evaluating multispectral images and vegetation indices for precision farming applications from UAV images. Remote Sens. 2015, 7, 4026–4047. [Google Scholar] [CrossRef]
- Pathak, S.V.; Mohod, A.G.; Sawant, A.A. Review on effective role of UAV in precision farming. J. Pharmacogn. Phytochem. 2020, 9, 463–467. [Google Scholar]
- Bălăceanu, C.M.; Streche, R.A.; Roşcăneanu, R.; Osiac, F.E.; Hanganu, E.N.; Marcu, I.; Drăgulinescu, A.M.; Suciu, G., Jr. Advanced precision farming techniques employing WSN and UAV. In Proceedings of the Advanced Topics in Optoelectronics, Microelectronics, and Nanotechnologies XI, Constanta, Romania, 25–28 August 2022; Volume 12493, pp. 175–180. [Google Scholar]
- Castineira, S.; Delwar, T.; Duran, R.; Pala, N. UAV-based agricultural monitoring and data acquisition system for precision farming. In Proceedings of the Sensing for agriculture and food quality and safety XIII, Online, 12–16 April 2021; Volume 11754, pp. 55–65. [Google Scholar]
- Awais, M.; Li, W.; Yang, Y.; Ji, L. Detection of Plant Water Stress Using Uav Thermal Images for Precision Farming Application. Appl. Ecol. Environ. Res. 2020, 18, 4087–4102. [Google Scholar] [CrossRef]
- Soliman, A.; Al-Ali, A.; Mohamed, A.; Gedawy, H.; Izham, D.; Bahri, M.; Erbad, A.; Guizani, M. AI-based UAV navigation framework with digital twin technology for mobile target visitation. Eng. Appl. Artif. Intell. 2023, 123, 106318. [Google Scholar] [CrossRef]
- Miao, J.; Zhang, P. UAV Visual Navigation System based on Digital Twin. In Proceedings of the 2022 18th International Conference on Mobility, Sensing and Networking (MSN), Guangzhou, China, 14–16 December 2022; pp. 865–870. [Google Scholar]
- Allen, B.D. Digital twins and living models at NASA. In Proceedings of the Digital Twin Summit, Virtual, 3–4 November 2021. [Google Scholar]
- Song, J.; Wang, D.; Chen, Z.; Zhao, K. Digital Twin System for VTOL UAV Fault Diagnosis Based on PX4. In Proceedings of the International Conference on Autonomous Unmanned Systems, Xi’an, China, 23–25 September 2022; pp. 2389–2401. [Google Scholar]
- Sun, Y.; Fesenko, H.; Kharchenko, V.; Zhong, L.; Kliushnikov, I.; Illiashenko, O.; Morozova, O.; Sachenko, A. UAV and IoT-based systems for the monitoring of industrial facilities using digital twins: Methodology, reliability models, and application. Sensors 2022, 22, 6444. [Google Scholar] [CrossRef]
- Edemetti, F.; Maiale, A.; Carlini, C.; D’Auria, O.; Llorca, J.; Tulino, A.M. Vineyard Digital Twin: Construction and characterization via UAV images–DIWINE Proof of Concept. In Proceedings of the 2022 IEEE 23rd International Symposium on a World of Wireless, Mobile and Multimedia Networks (WoWMoM), Belfast, UK, 14–17 June 2022; pp. 601–606. [Google Scholar]
- Yang, Y.; Meng, W.; Zhu, S. A digital twin simulation platform for multi-rotor UAV. In Proceedings of the 2020 7th International Conference on Information, Cybernetics, and Computational Social Systems (ICCSS), Guangzhou, China, 13–15 November 2020; pp. 591–596. [Google Scholar]
- Bae, C.H.; Jeong, J.W.; Lee, S. Automatic Flight Plan Creation Tool with Digital Twin for Monitoring Forest Fire on Mountain Trail through UAV. 2022. Available online: https://ceur-ws.org/Vol-3362/ISE2022_short12_Bae_Automatic.pdf (accessed on 16 May 2023).
- Torres-Sánchez, J.; López-Granados, F.; Borra-Serrano, I.; Peña, J.M. Assessing UAV-collected image overlap influence on computation time and digital surface model accuracy in olive orchards. Precis. Agric. 2017, 19, 115–133. [Google Scholar] [CrossRef]
- Zhao, J.; Zhang, X.; Gao, C.; Qiu, X.; Tian, Y.; Zhu, Y.; Cao, W. Rapid Mosaicking of Unmanned Aerial Vehicle (UAV) Images for Crop Growth Monitoring Using the SIFT Algorithm. Remote Sens. 2019, 11, 1226. [Google Scholar] [CrossRef]
- Mesas-Carrascosa, F.J.; Rumbao, I.C.; Torres-Sánchez, J.; García-Ferrer, A.; Peña, J.M.; Granados, F.L. Accurate ortho-mosaicked six-band multispectral UAV images as affected by mission planning for precision agriculture proposes. Int. J. Remote Sens. 2016, 38, 2161–2176. [Google Scholar] [CrossRef]
- Mesas-Carrascosa, F.J.; García, M.N.; de Larriva, J.M.; García-Ferrer, A. An Analysis of the Influence of Flight Parameters in the Generation of Unmanned Aerial Vehicle (UAV) Orthomosaicks to Survey Archaeological Areas. Sensors 2016, 16, 1838. [Google Scholar] [CrossRef]
- Tu, Y.H.; Phinn, S.; Johansen, K.; Robson, A.; Wu, D. Optimising drone flight planning for measuring horticultural tree crop structure. ISPRS J. Photogramm. Remote Sens. 2020, 160, 83–96. [Google Scholar] [CrossRef]
- Domingo, D.; Ørka, H.O.; Næsset, E.; Kachamba, D.; Gobakken, T. Effects of UAV Image Resolution, Camera Type, and Image Overlap on Accuracy of Biomass Predictions in a Tropical Woodland. Remote Sens. 2019, 11, 948. [Google Scholar] [CrossRef]
- Flores de Santiago, F.F.; Valderrama-Landeros, L.; Rodríguez-Sobreyra, R.; Flores-Verdugo, F. Assessing the effect of flight altitude and overlap on orthoimage generation for UAV estimates of coastal wetlands. J. Coast. Conserv. 2020, 24, 35. [Google Scholar] [CrossRef]
- Hiba, A.; Bauer, P.; Nagy, M.; Simonyi, E.; Kisari, A.; Kuna, G.I.; Drotar, I. Software-in-the-loop simulation of the forerunner UAV system. IFAC-PapersOnLine 2022, 55, 139–144. [Google Scholar] [CrossRef]
- Li, J.; Huang, D.; Yang, P. Inspection method of images’ overlap of UAV photogrammetry based on features matching. In Proceedings of the 2018 International Conference on Smart Materials, Intelligent Manufacturing and Automation (SMIMA 2018), Nanjing, China, 24–26 May 2018; Volume 173, p. 02022. [Google Scholar]
- Wang, F.; Zou, Y.; Castillo, E.D.R.; Lim, J. Optimal UAV Image Overlap for Photogrammetric 3D Reconstruction of Bridges. IOP Conf. Ser. Earth Environ. Sci. 2022, 1101, 022052. [Google Scholar] [CrossRef]
- Gazebo. Gazebo Tutorial. 2014. Available online: https://classic.gazebosim.org/tutorials/browse (accessed on 30 June 2023).
- Autopilot, P. PX4 Autopilot Tutorial. 2023. Available online: https://docs.px4.io/v1.12/en/simulation/gazebo.html (accessed on 15 July 2023).
- Agila, G.R. Pitahaya: Un Cultivo «De Oro» que Impacta en la Pérdida de Bosques Nativos en la Amazonía Ecuatoriana. 2025. Available online: https://planv.com.ec/historias/pitahaya-un-cultivo-oro-que-impacta-la-perdida-bosques-nativos-la-amazonia/ (accessed on 22 April 2025).
- Kugelberg, E.; Andersson, O. Wind Vector Estimation by Drone. 2020. Available online: https://www.diva-portal.org/smash/get/diva2:1464433/FULLTEXT01.pdf (accessed on 15 May 2023).
Figure 1.
Overview of the study site.
Figure 1.
Overview of the study site.
Figure 2.
(a) UAV Typhoon 480; (b) Multiespectral camera MicaSense.
Figure 2.
(a) UAV Typhoon 480; (b) Multiespectral camera MicaSense.
Figure 3.
Proposed workflow to obtain the DSM of study area.
Figure 3.
Proposed workflow to obtain the DSM of study area.
Figure 4.
SITL simulation environment.
Figure 4.
SITL simulation environment.
Figure 5.
SITL simulation on computer.
Figure 5.
SITL simulation on computer.
Figure 6.
Proposed workflow for flight mission generation.
Figure 6.
Proposed workflow for flight mission generation.
Figure 7.
Three-dimensional and two-dimensional models of the camera’s visual field projection.
Figure 7.
Three-dimensional and two-dimensional models of the camera’s visual field projection.
Figure 8.
Schematic diagram of image capture by means of a UAV.
Figure 8.
Schematic diagram of image capture by means of a UAV.
Figure 9.
Scheme of UAV flight configurations.
Figure 9.
Scheme of UAV flight configurations.
Figure 10.
Parameters configured for the flight plan in the QGroundControl application.
Figure 10.
Parameters configured for the flight plan in the QGroundControl application.
Figure 11.
Workflow of data processing.
Figure 11.
Workflow of data processing.
Figure 12.
Relationship between flight time and overlap under different wind scenarios.
Figure 12.
Relationship between flight time and overlap under different wind scenarios.
Figure 13.
Relationship between flight distance and overlap under different wind scenarios.
Figure 13.
Relationship between flight distance and overlap under different wind scenarios.
Figure 14.
Relationship between number of images and overlap under different wind scenarios.
Figure 14.
Relationship between number of images and overlap under different wind scenarios.
Figure 15.
Relationship between computational processing time and overlap under different wind scenarios.
Figure 15.
Relationship between computational processing time and overlap under different wind scenarios.
Figure 16.
Orthomosaics from studio site. Front/side overlap is depicted at the bottom. (a) v = 0 m/s; (b) v = 5 m/s, (c) v = 10 m/s.
Figure 16.
Orthomosaics from studio site. Front/side overlap is depicted at the bottom. (a) v = 0 m/s; (b) v = 5 m/s, (c) v = 10 m/s.
Figure 17.
Correlation between quality parameters.
Figure 17.
Correlation between quality parameters.
Figure 18.
Inverse relation between point cloud vs number of images.
Figure 18.
Inverse relation between point cloud vs number of images.
Table 1.
Parameters considered for obtaining and evaluating orthomosaics.
Table 1.
Parameters considered for obtaining and evaluating orthomosaics.
| Requirements Parameters | Sensor Parameters | Flight Parameters | Efficiency Parameters | Quality Parameters |
|---|
| | Sensor size | Flight height | Flight time | |
| Ground | Sensor resolution | Flight speed | Number of images | Precision |
| resolution | Focal length | Overlap | Image processing times | Detail |
| | | Trajectory geometry | | |
Table 2.
Image processing data.
Table 2.
Image processing data.
| Wind Speed (m/s) | Front Overlap | Side Overlap | Processing Time (s) | Point Cloud | | | GSD (cm/pix) |
|---|
| 0 | 40 | 30 | 45 | 3,365,758 | 8255 | 9479 | 3.8 |
| 0 | 50 | 40 | 115 | 3,518,813 | 8731 | 9811 | 3.76 |
| 0 | 60 | 50 | 222 | 4,370,820 | 8136 | 9068 | 4.05 |
| 0 | 70 | 60 | 271 | 3,427,976 | 8479 | 9595 | 3.75 |
| 5 | 40 | 30 | 36 | 2,985,598 | 7128 | 8752 | 3.68 |
| 5 | 50 | 40 | 49 | 3,179,720 | 7855 | 9379 | 3.7 |
| 5 | 60 | 50 | 91 | 3,158,113 | 7692 | 9200 | 3.71 |
| 5 | 70 | 60 | 226 | 2,338,529 | 6712 | 8496 | 3.69 |
| 10 | 40 | 30 | 26 | 2,997,889 | 7487 | 9007 | 3.69 |
| 10 | 50 | 40 | 39 | 3,127,826 | 7692 | 9444 | 3.71 |
| 10 | 60 | 50 | 94 | 3,238,760 | 8012 | 9232 | 3.7 |
| 10 | 70 | 60 | 204 | 2,103,896 | 7076 | 5648 | 4.23 |
Table 3.
Simulated and calculated efficiency parameters.
Table 3.
Simulated and calculated efficiency parameters.
| Wind Speed (m/s) | Front Overlap | Side Overlap | Flight Distance UAV (m) | Number of Images | Flight Time (min) | Calculated Number of Images | Calculated Flight Time (min) |
|---|
| 0 | 40 | 30 | 1426.5 | 121 | 4.45 | 70 | 3.94 |
| 0 | 50 | 40 | 1850.1 | 188 | 5.03 | 96 | 4.65 |
| 0 | 60 | 50 | 1956.2 | 270 | 6.53 | 140 | 5.36 |
| 0 | 70 | 60 | 1983.7 | 371 | 6.92 | 243 | 6.78 |
| 5 | 40 | 30 | 1325.6 | 99 | 3.40 | 70 | 3.94 |
| 5 | 50 | 40 | 1348.7 | 157 | 4.20 | 96 | 4.65 |
| 5 | 60 | 50 | 1744.7 | 205 | 4.83 | 140 | 5.36 |
| 5 | 70 | 60 | 1759.4 | 325 | 5.83 | 243 | 6.78 |
| 10 | 40 | 30 | 1275.4 | 93 | 3.27 | 70 | 3.94 |
| 10 | 50 | 40 | 1331.4 | 141 | 4.17 | 96 | 4.65 |
| 10 | 60 | 50 | 1733.8 | 209 | 5.00 | 140 | 5.36 |
| 10 | 70 | 60 | 1740.6 | 316 | 5.78 | 243 | 6.78 |
| Disclaimer/Publisher’s Note: The statements, opinions and data contained in all publications are solely those of the individual author(s) and contributor(s) and not of MDPI and/or the editor(s). MDPI and/or the editor(s) disclaim responsibility for any injury to people or property resulting from any ideas, methods, instructions or products referred to in the content. |
© 2025 by the authors. Licensee MDPI, Basel, Switzerland. This article is an open access article distributed under the terms and conditions of the Creative Commons Attribution (CC BY) license (https://creativecommons.org/licenses/by/4.0/).


