1. Introduction
Unmanned Aerial Vehicles (UAVs) are being explored for their potential applications in various fields. Their uses include telecommunications, military and security activities, and entertainment [
1]. UAVs are becoming more practical, dependable, and economical, which makes UAV-based solutions competitive in new markets. The telecommunications industry is expected to have the highest drone value in 2021, with an estimated 6.3 billion USD according to [
2]. Along with providing network programmability, orchestration, and edge cloud capabilities, UAVs can also be used to establish line-of-sight (LoS) connections, provide scalable proximity services, and hold these functions on demand. As a result, the integration of unmanned aerial platforms into the mobile network ecosystem is gaining traction in both industry and academia.
UAVs are among the flying platforms whose applications are expanding quickly. Specifically, due to their intrinsic qualities, like mobility, adaptability, and altitude adaptation, UAVs have a number of important potential uses in wireless systems. UAVs have the potential to improve wireless network coverage, capacity, dependability, and energy-efficiency by serving as airborne base stations. UAVs can also function inside a cellular network as flying mobile terminals. These cellular-connected UAVs can be used for a variety of tasks, such as item delivery and real-time video broadcasting [
3]. To overcome some of the limitations of current technologies, we see flying base stations carried by UAVs as an essential addition to a heterogeneous 5G ecosystem. In areas of the world without reliable cellular infrastructure, UAVs are starting to show promise as an economically viable method of delivering wireless access. Moreover, UAV base station deployment makes the most sense when considering events that require wireless services for a short amount of time. This is particularly true for temporary events, when it is evident that creating permanent small cell networks for short-term demands is financially unfeasible, such as sporting events and festivals [
4]. For longer-term, more sustainable coverage in such rural areas, High-Altitude Platform (HAP) UAVs can be of assistance. During transitory events like football tournaments or presidential inaugurations, as well as in hotspots, mobile UAVs can offer on-demand connectivity, a high-data-rate wireless service, and traffic offloading opportunities [
5,
6]. With reference to this, AT&T and Verizon previously declared their intention to employ drones in flight to temporarily enhance internet coverage during the Super Bowl and college football national championships [
7]. In addition to ultra-dense tiny cell networks, flying base stations can undoubtedly be a valuable resource. UAVs have the potential to save lives as well because of their quick and adaptable deployment. This makes them a great option in disaster and search and rescue situations, as well as other situations when stationary infrastructures, such as communication networks, are damaged or unavailable. This may occur when an earthquake or other natural disaster damages cell towers, and drones serve as flying base stations (BSs) to allow first responders to reestablish contact [
8]. It is obvious that all UAVs need to have well-designed communication capabilities or be able to provide communication services in order to realize their full potential and contribute to the civilization of the future. Additionally, flying UAVs have the ability to travel continually in order to cover a particular region completely in the shortest amount of time. Thus, in public safety scenarios, using UAV-mounted base stations can be a suitable alternative for quick and pervasive communication.
Connecting UAVs to cellular networks provides a number of advantages. With cellular command and control links, autonomous UAVs can be remotely piloted or monitored from thousands of kilometers away because of the widespread availability of mobile networks. It can also facilitate information-sharing with air traffic control or allow UAV-to-UAV communication. Cellular networks can also offer increased dependability and throughput, as well as improved privacy and security, in comparison to conventional direct ground-to-UAV communication. A significant financial benefit of using existing cellular networks is that it may be more affordable to do so than to build new, different infrastructure configurations [
9].
There are several distinct design and research problems associated with UAV-aided communication as compared to fixed terrestrial networks [
10]. In the first place, compared to the conventional two-dimensional (2D) deployment of terrestrial base stations, the deployment of aerial base stations in three-dimensional (3D) space offers an extra degree of freedom (DoF). The diverse context of propagation is another significant obstacle [
11]. In addition, restricted flight time and inherent flight dynamics are two more complications associated with aerial BSs and relays that affect the communication performance or quality of service (QoS). In order to address these issues and direct the study toward UAV-assisted communications, scheduling, research allocation, and multiple access protocols must be modified. UAV BS placement optimization or comprehensive end-to-end trajectory optimization can both account for mobility. Because of the extra DoF, even placing UAVs is a more difficult task than placing stationary base stations.
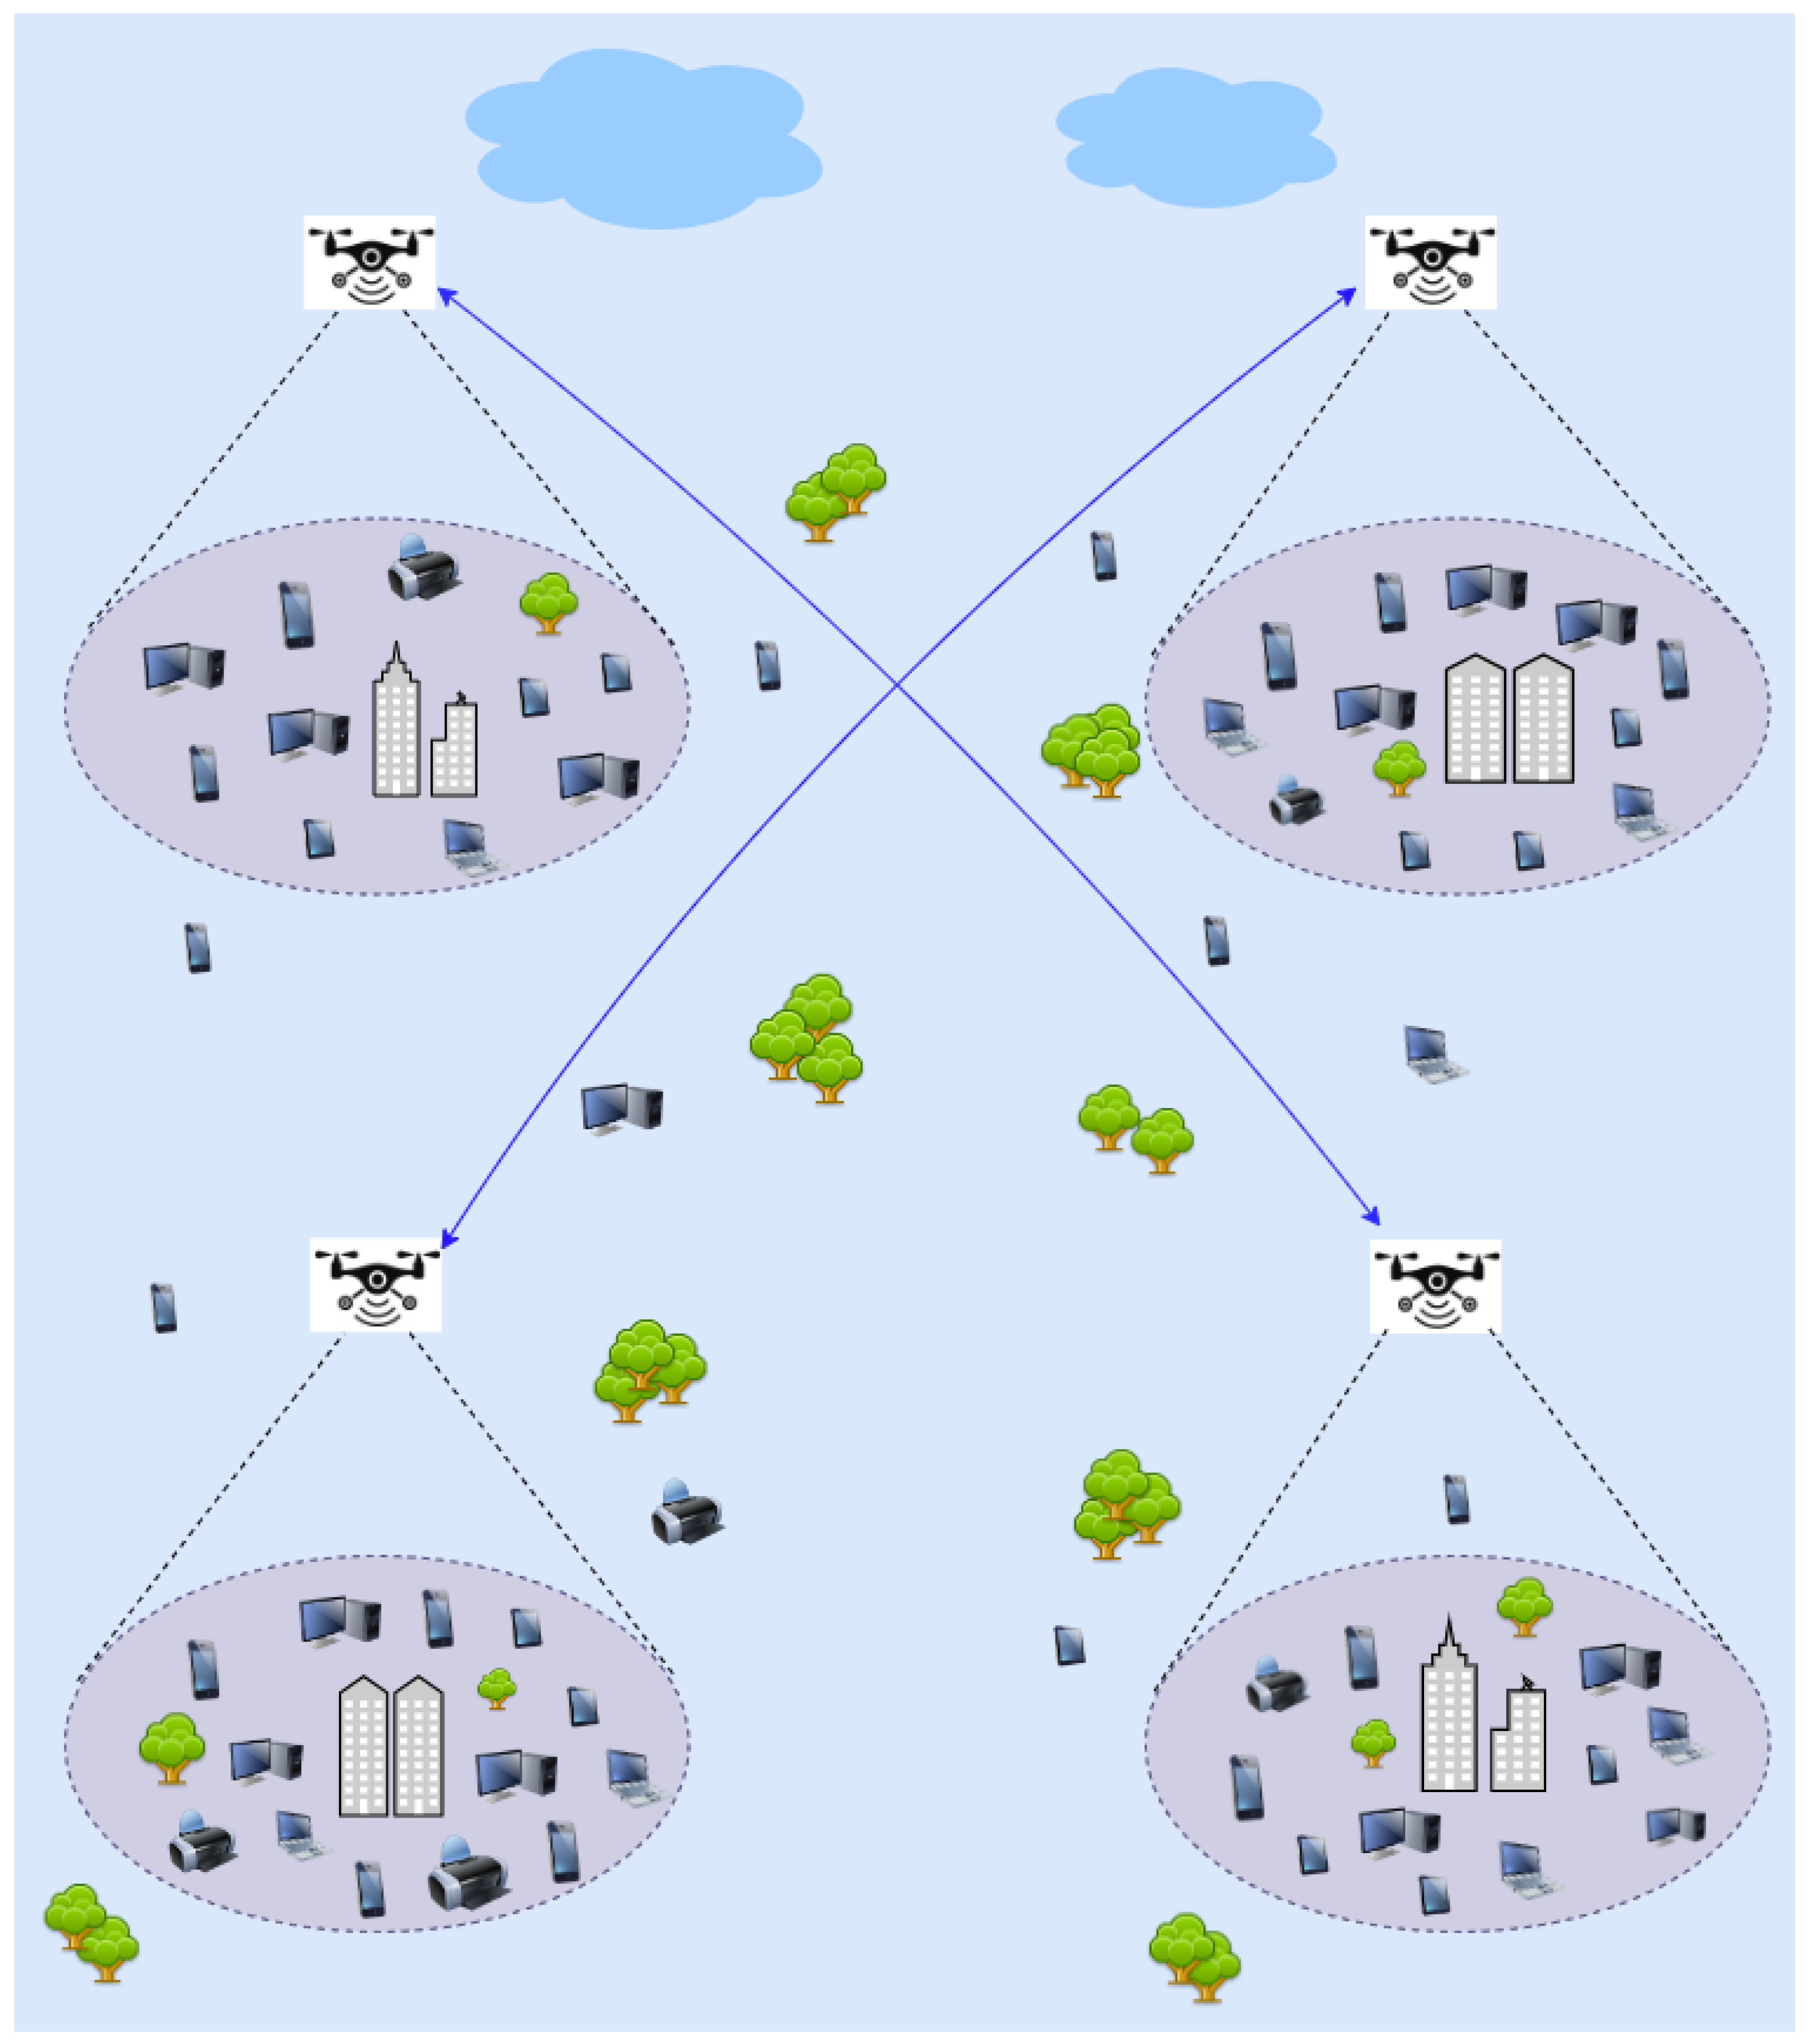
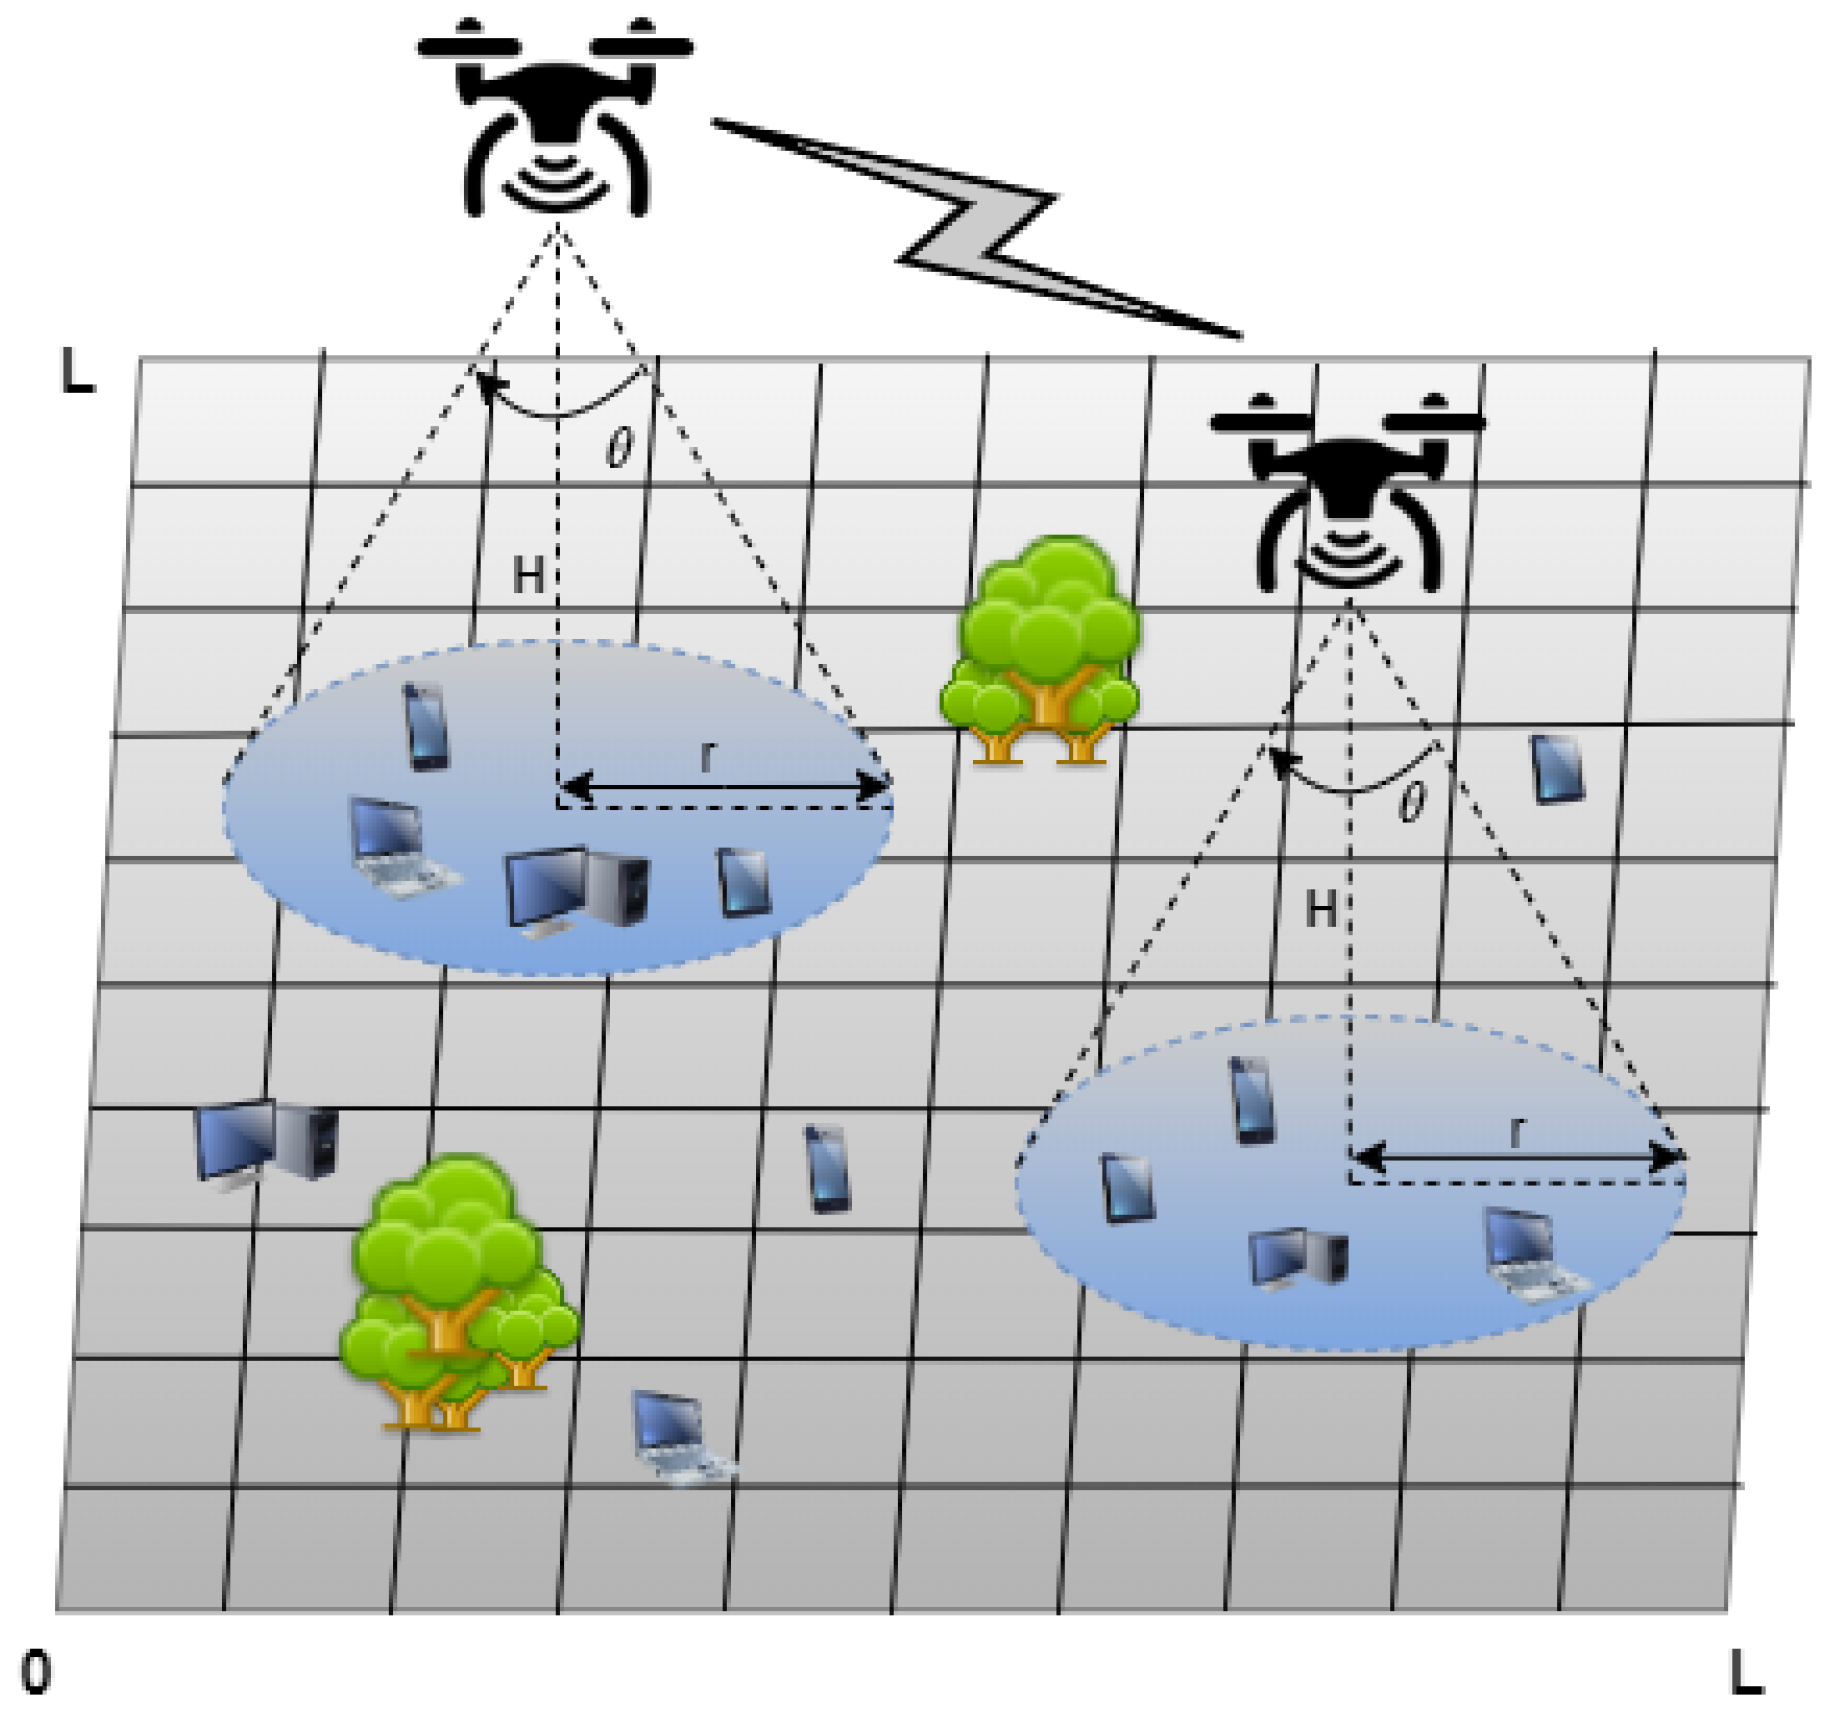
Figure 1 shows an example of UAV based wireless communication.
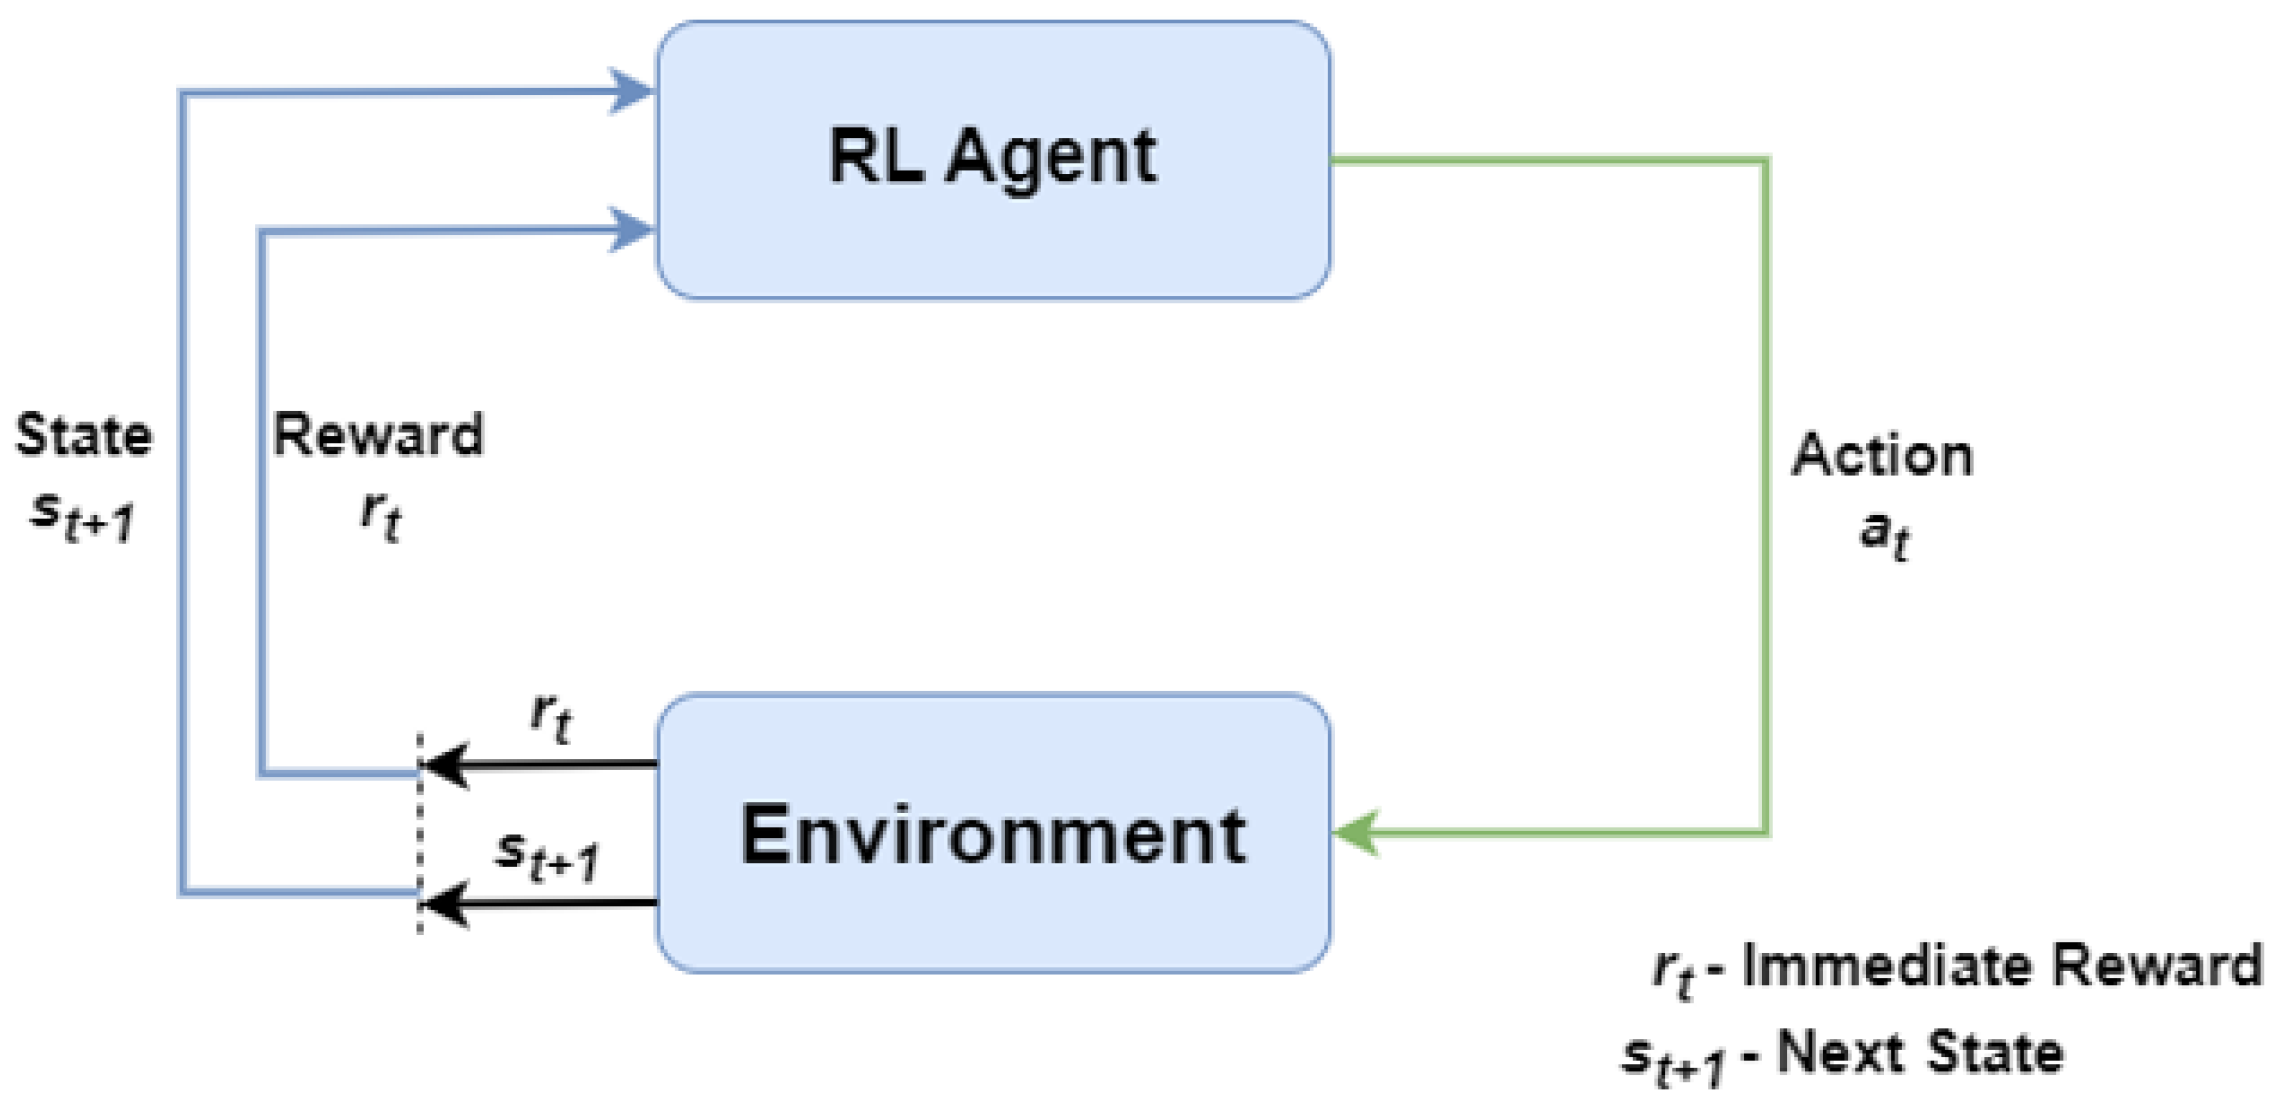
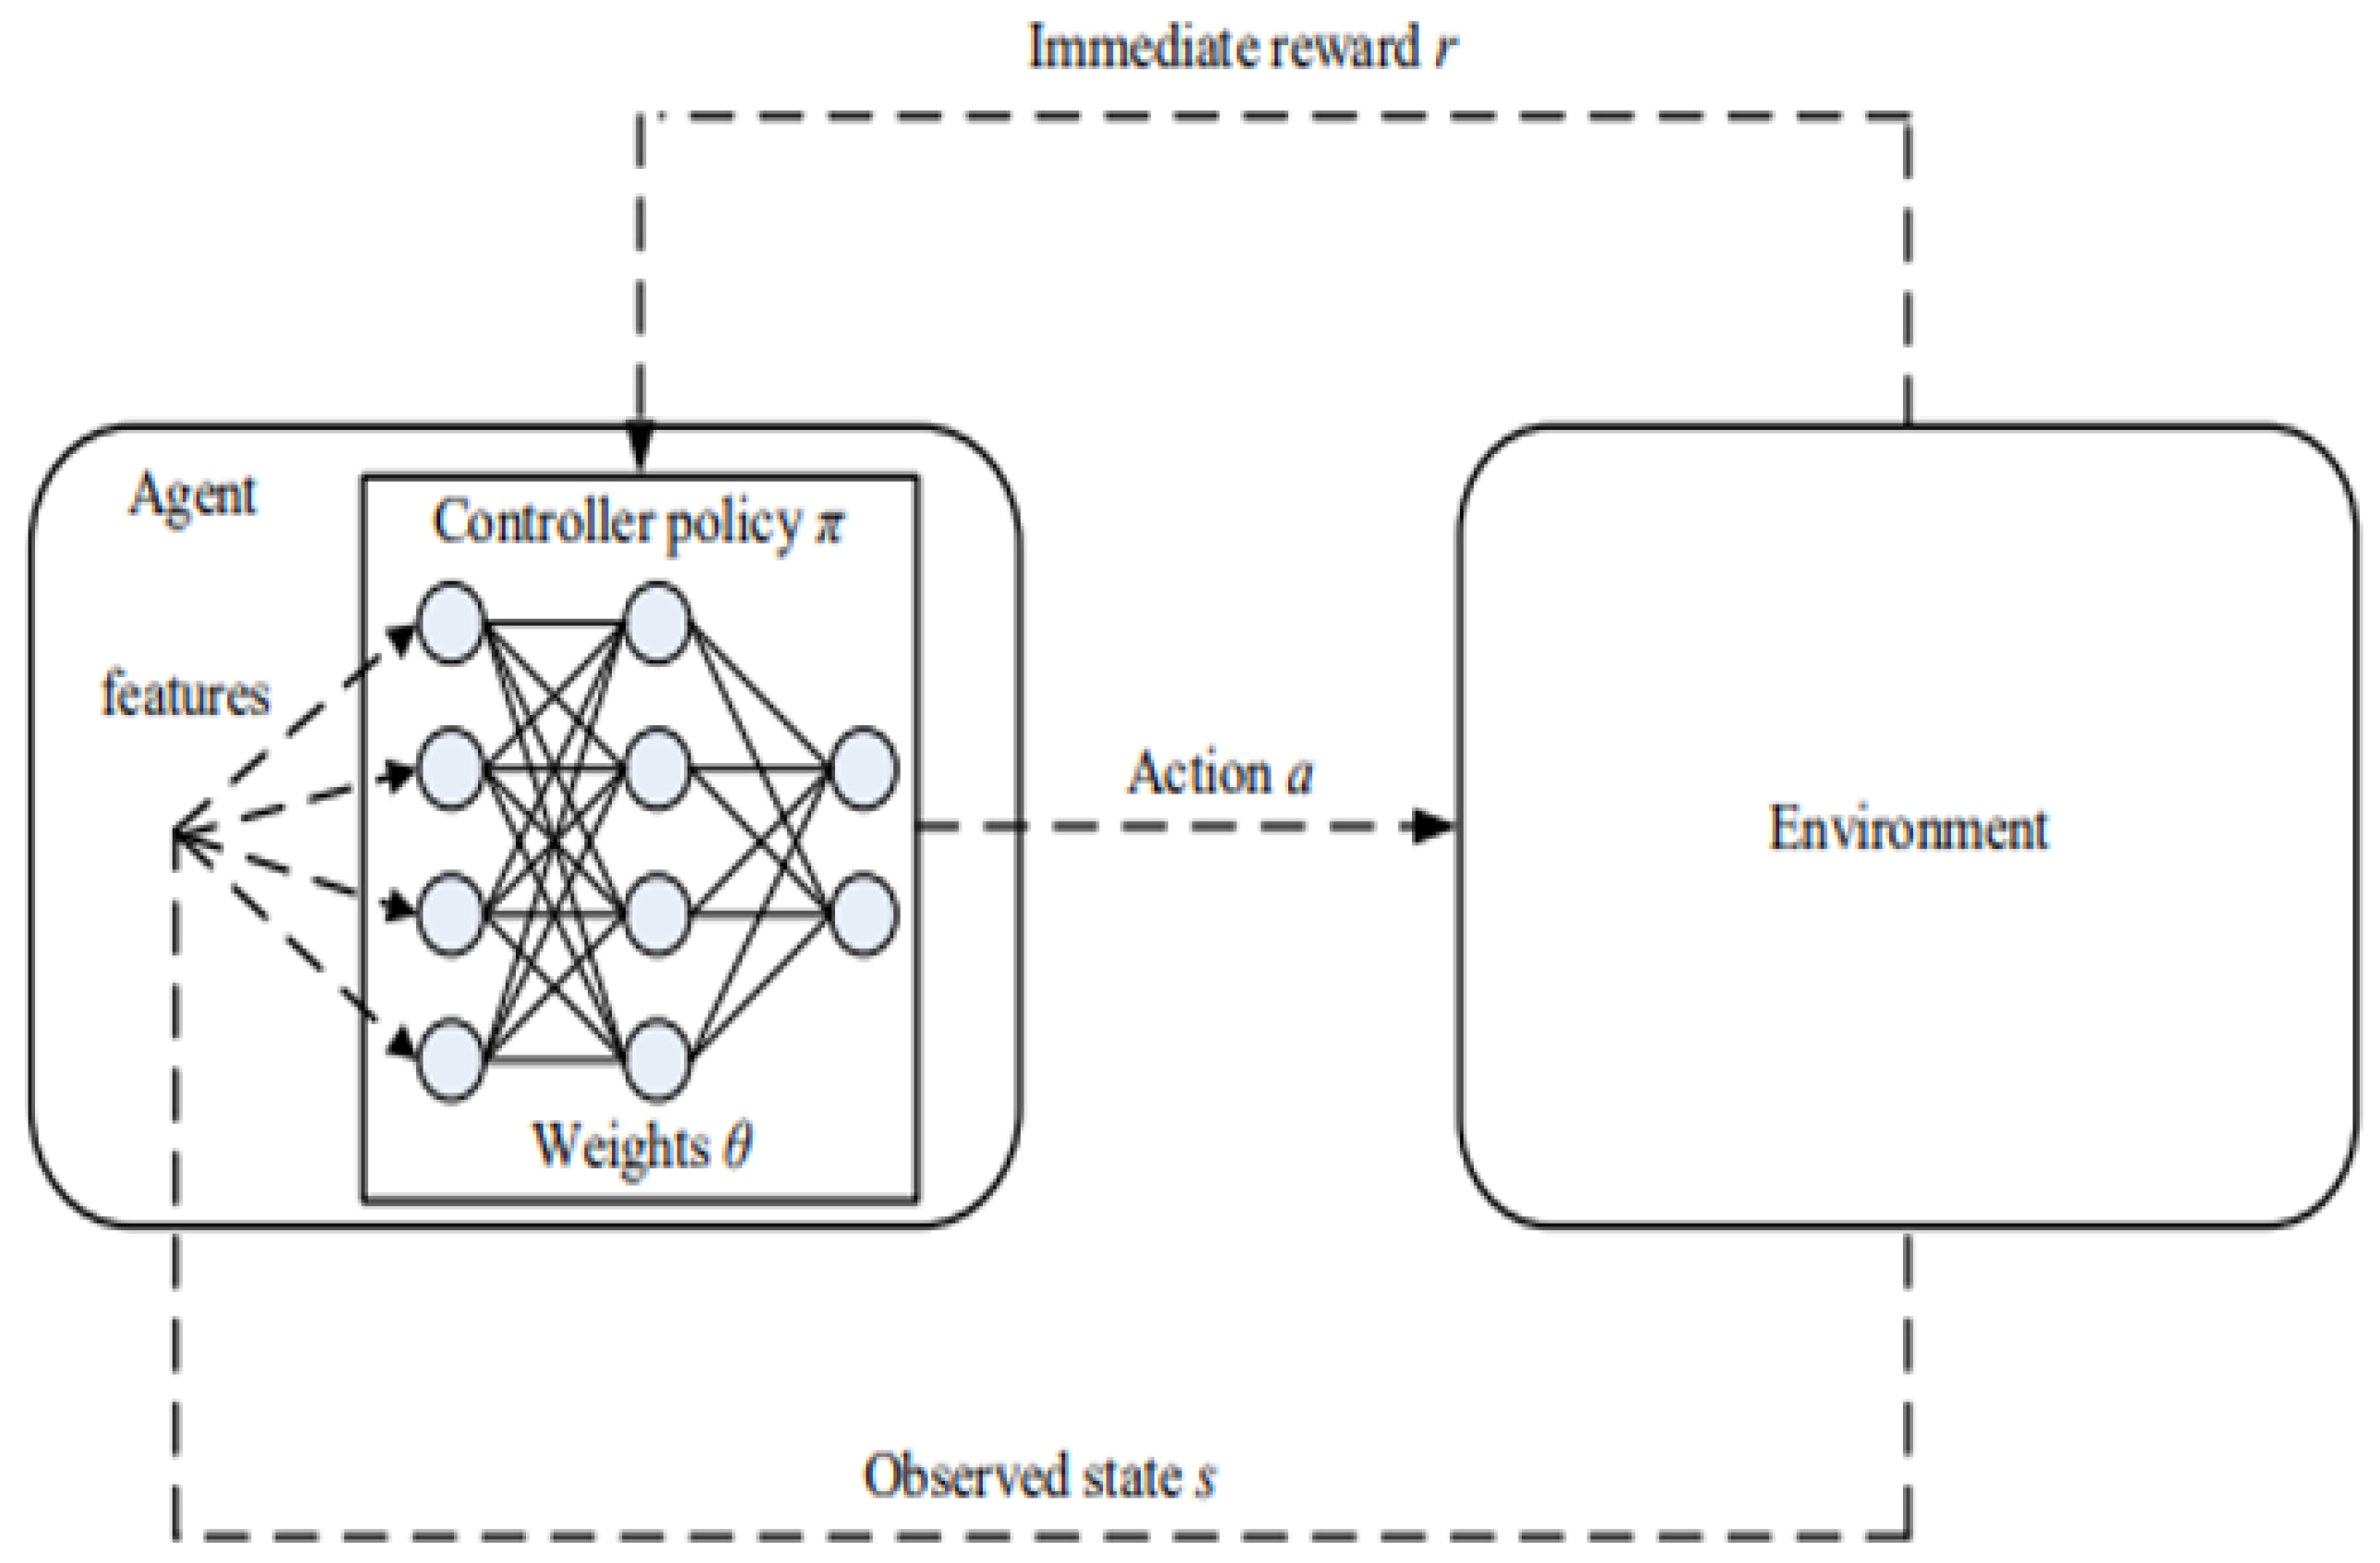
The foundation of reinforcement learning is particularly well-suited to the problems associated with the deployment of autonomous UAVs in communication networks, since its main idea involves an autonomous agent making choices (like trajectory planning) in order to maximize a goal (like QoS for an aerial BS) in an uncharted area. Many of the applications of UAV placement and trajectory planning, including interference-aware multi-UAV path planning [
12], data collection in the context of mobile crowdsensing [
13], and maximizing communications coverage in UAV-aided networks [
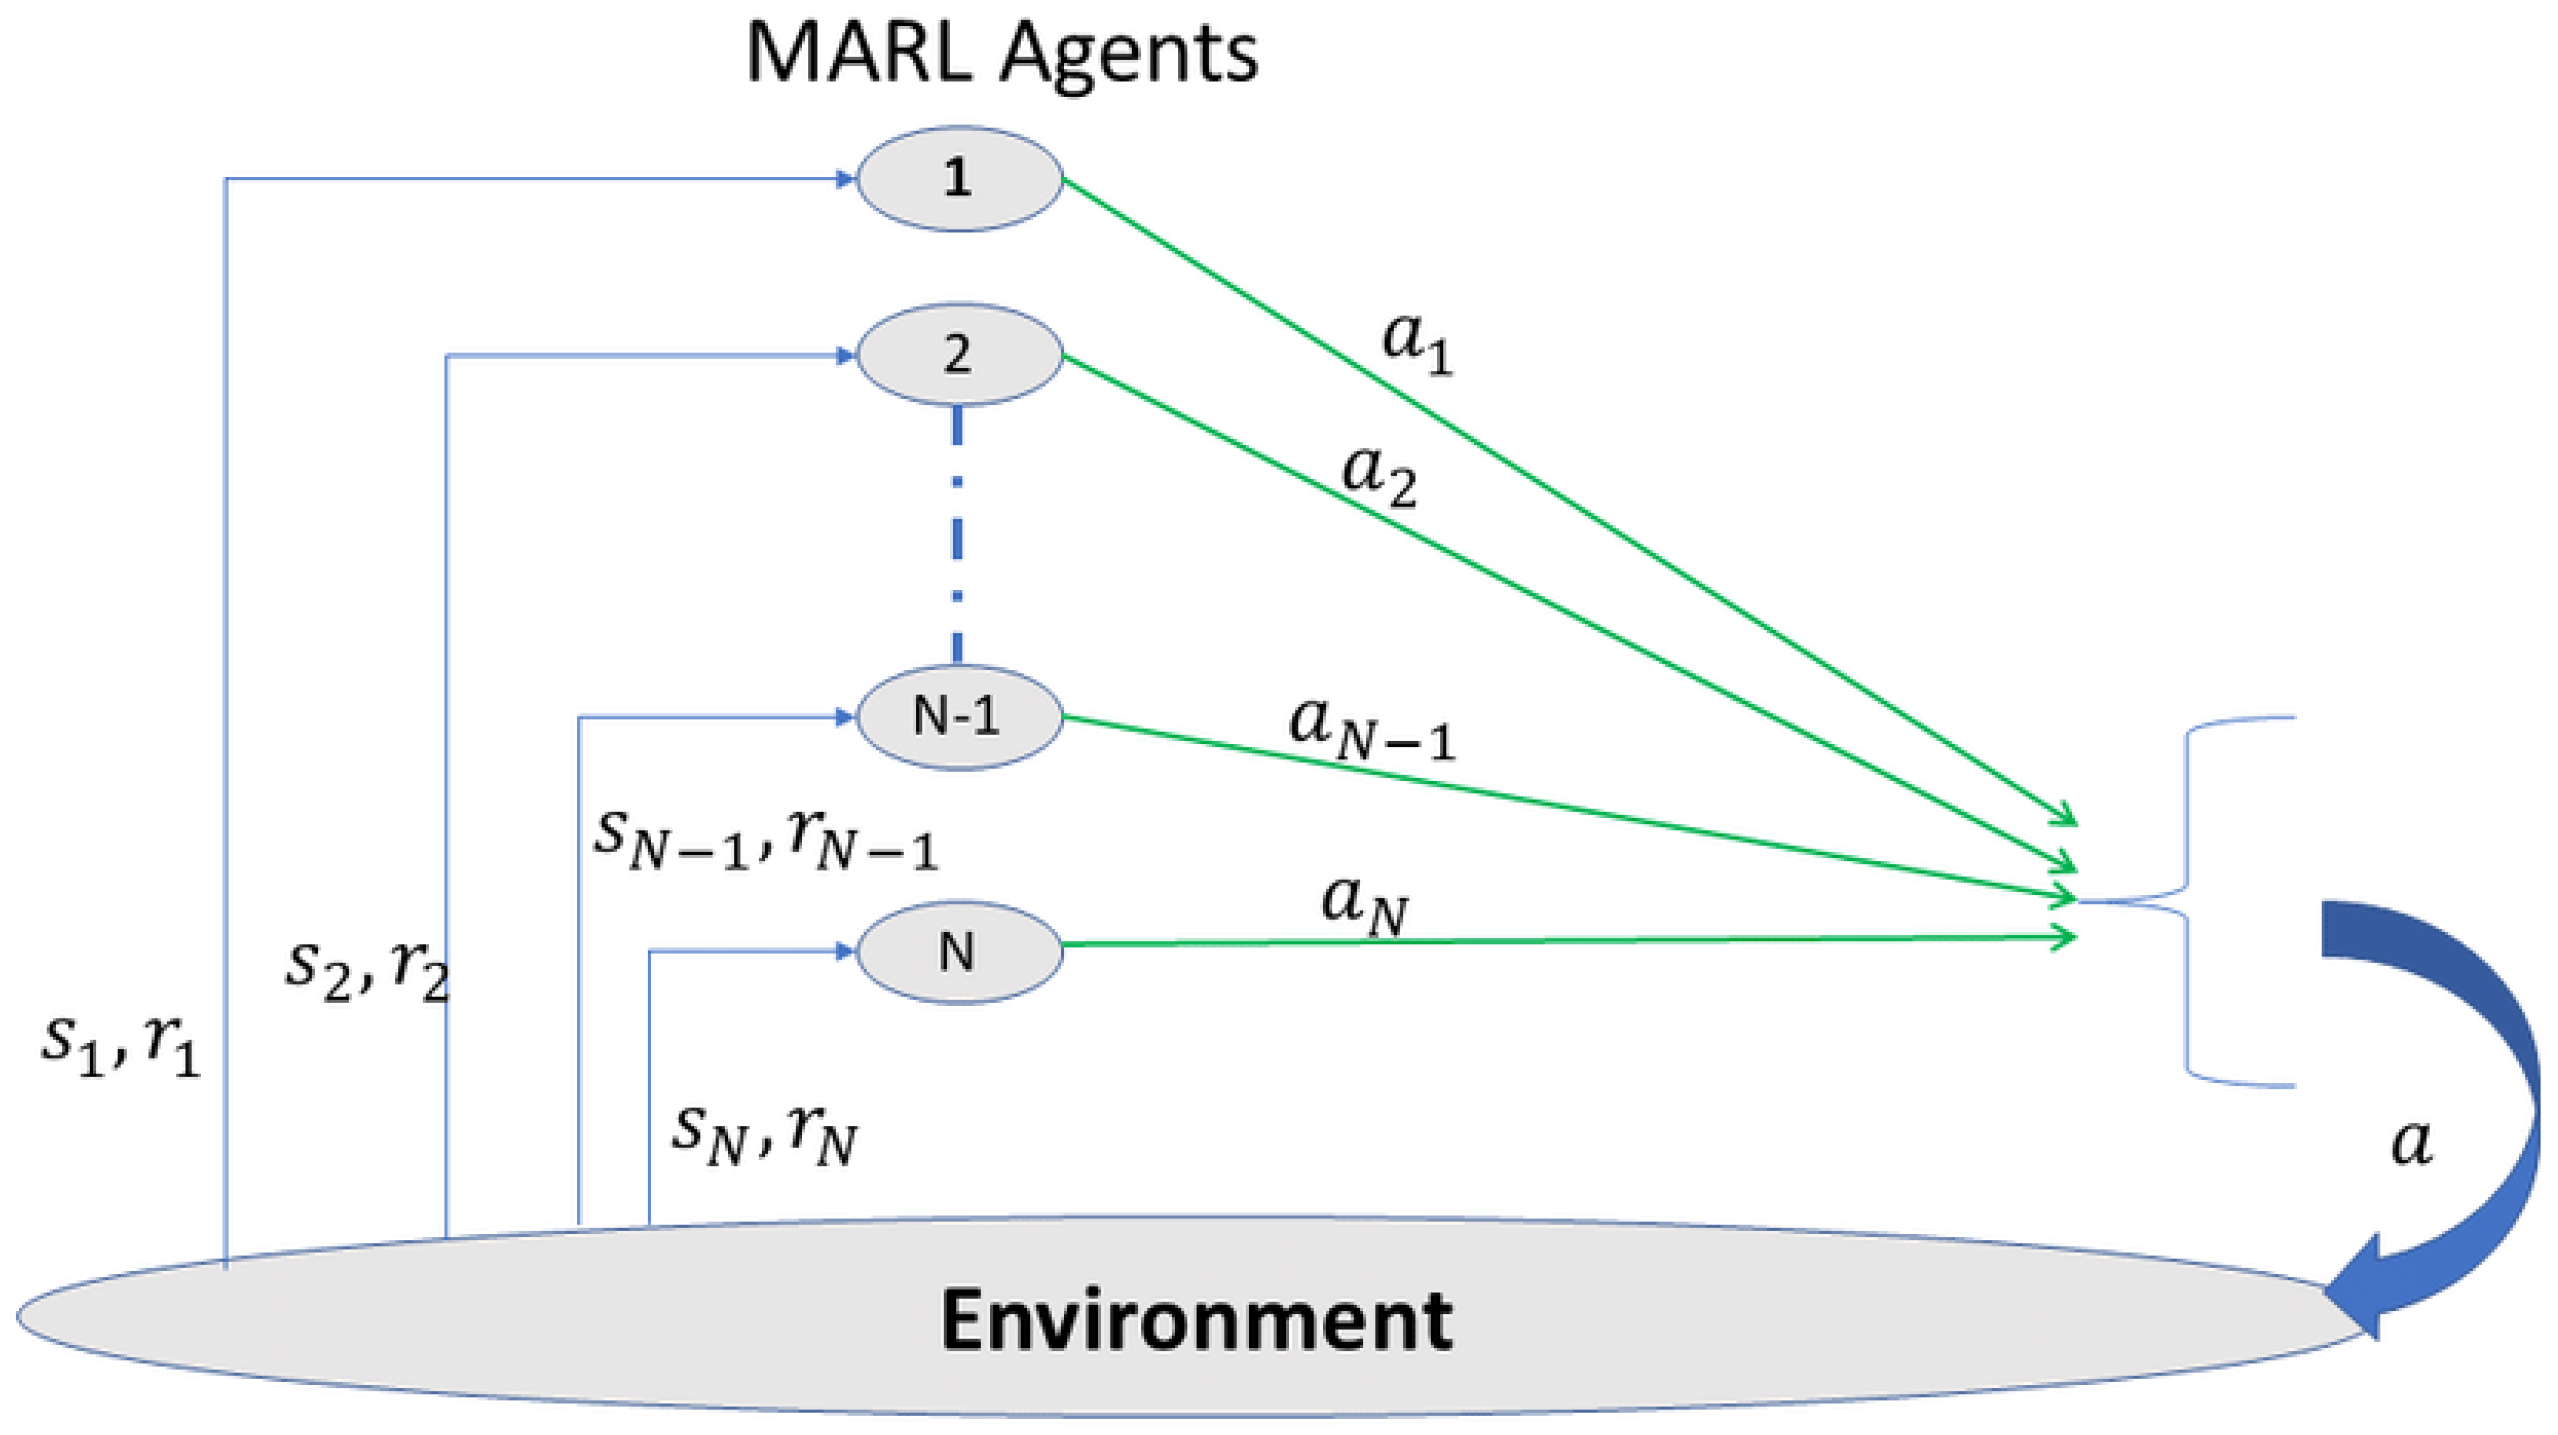
14], could benefit from the application of deep reinforcement learning (DRL). Another application of UAV networks is resource allocation, in addition to path planning. Multi-agent reinforcement learning (MARL) is employed in [
15] to choose the communicative user of each UAV automatically, whether or not the UAVs communicate information. The integration of intelligent reflecting surfaces with UAVs in the context of 6G presents a number of issues that RL can address [
16].
1.1. Research Gaps
Most existing research focuses solely on either centralized or decentralized approaches for user coverage, without a comprehensive comparison of both. Our work addresses this gap by evaluating and contrasting both methods (
Section 4 and
Section 7). Additionally, while most reinforcement learning studies train and test their models on the same user distribution, we deliberately use a stochastic environment during training to ensure that our model performs well under varied user distribution scenarios (
Section 5). Finally, we also consider jamming attacks during the operation of dynamic base stations—a topic with limited prior research (
Section 6). We further review the relevant literature in
Section 2.
1.2. Contributions
The main contributions of this paper are as follows:
We use both centralized and decentralized multi-agent deep Q-learning to determine the positions for a set of UAVs that maximize user connectivity in an ad-hoc communication network problem.
We develop a simple algorithm to train a policy for a stochastic environment, such as when users are distributed according to a known probability distribution. Moreover, we empirically explore how well a policy designed for one distribution of environments performs when applied to environments sampled from a different distribution.
We develop a model in which a UAV is jammed and loses connection with other UAVs after reaching its optimal position, and investigate how this affects user coverage and network connectivity.
2. Literature Review
The field of wireless communication has advanced significantly with the introduction of UAVs as enablers of expanded communication services, especially in situations requiring quick deployment and great flexibility. UAVs can function as BSs or relays, providing on-demand communication services that are essential for Internet of Things (IoT) applications, post-disaster recovery networks, and reducing abrupt traffic congestion in cellular networks [
17]. UAV-enabled small cells have been optimized through research into the strategic deployment of UAVs with regard to altitude and inter-UAV distances, offering a way to reduce UAV deployment while guaranteeing coverage for all ground users [
18]. The methods used to deploy UAVs are critical, particularly when considering UAV-enabled small cells, as the effective and efficient operation of the network is greatly impacted by the placement of UAVs. Past research has demonstrated the ability to reduce the number of UAVs needed by using a sequential UAV placement technique with set heights, improving network coverage and cutting down on wasteful spending [
19]. However, this tactic might also add processing latency, which could negatively affect network throughput [
20]. We now discuss various techniques to solve this problem, which are summarized in
Table 1.
2.1. Conventional Method
Enhancing network efficiency and lowering energy usage would provide major contributions to the developing field of UAV-assisted multi-access edge computing (MEC). In order to address the need for energy-efficient resource allocation, ref. [
21] presented a system that utilized MEC-enabled UAVs and ground-based base stations. The system used the Block Successive Upperbound Minimization (BSUM) method, which represents a novel approach to resource allocation. A different study [
22] demonstrated how non-orthogonal multiple access (NOMA) may be integrated with UAV flying base stations. It achieved this by using a path-following algorithm to solve a non-convex optimization problem, thereby demonstrating the advantages of NOMA in improving wireless communication. Wu et al. created an effective iterative technique to optimize user scheduling, UAV trajectory, and power control in order to maximize throughput in multi-UAV enabled systems [
23]. This method showed improvements, optimizing user performance while navigating the intricacies of optimization. In order to dramatically lower latency and increase spectral efficiency in 3D wireless networks, the author [
24] presented a novel framework for 3D cellular network planning and cell association. This framework uses kernel density estimation and optimal transport theory, providing a ground-breaking approach to 3D cellular architecture. In contrast to most previous research that focuses on homogeneous UAV fleets, ref. [
25] proposes a deployment approach for a heterogeneous UAV network. UAVs with different service capabilities, transmission powers, and battery lifetimes are used in this network. In this heterogeneous UAV network, user coverage is optimized using a traditional approximation algorithm.
2.2. Optimization Approach
The problem of controlling and deploying UAVs in communication contexts can also be formulated as a non-convex optimization problem [
26]. These issues are inherently complicated and frequently categorized as NP-hard [
27], which highlights how challenging it is to solve them using traditional optimization techniques. This difficulty helps to explain why RL is becoming more and more popular as a substitute method for handling certain optimization problems. With regard to UAV-based communication systems, reinforcement learning’s flexibility and learning-based approach present viable ways to move beyond the conceptual and computational obstacles that come with more conventional optimization methods.
2.3. Machine Learning Approach
Intelligent machine learning-based UAV control is necessary to improve the efficiency of UAV-enabled communication networks. With consideration of the UAVs’ structural designs, neural network architectures have been examined for UAV trajectories. For relay placement intended to maximize flow rate, ref. [
28] presented a Riemannian multi-armed bandit (RMAB) reinforcement learning model. In order to support as many ground devices as feasible, a single UAV was explored by Fahim et al. [
29]. The main emphasis of this study was the trade-off between the UAVs’ increased coverage area and continued connectivity. Nevertheless, the study in [
30] did not include the employment of UAVs as stationary base stations. A distributed Q-learning method was provided by Klaine et al. [
31] to identify the optimal UAV deployment sites that maximize ground user coverage in the presence of time-varying user distributions. Liu et al. [
32] employed double Q-learning to design routes that would optimize customer satisfaction for users with time-constrained service requirements. By jointly optimizing the multiuser communication scheduling, user association, UAV trajectory, and power control, a combined trajectory and communication design for multi-UAV enabled wireless networks was developed in [
23]. The issue of flying trajectory planning for many UAVs in order to provide ground personnel with emergency communication services was examined by Yang et al. [
33]. In order to monitor a catastrophe area, Xu et al. [
34] investigated the problem of deploying a network of connected unmanned aerial vehicles (UAVs) that consists of K homogeneous UAVs in the air while maximizing the total data rates of all users. The downlink of a UAV-assisted cellular network, whereby several collaborating UAVs service various ground user equipment (UE) under the supervision of a central ground controller via wireless fronthaul links, is highlighted in [
35]. Deep Q-learning is used to find the UAVs positions. In order to optimize resource allocation in UAV networks, the author in [
36] presented a MARL technique that allows UAVs to autonomously choose communication techniques that maximize long-term rewards with the least amount of inter-UAV communication. In order to enhance user connectivity in UAV networks, a distinct study [
37] proposed a fully decentralized deep Q-learning method. The study demonstrated increased performance through differential levels of UAV information sharing and customized reward functions.
2.4. Jamming
Due to the broadcasting nature of wireless communications, UAV-assisted wireless communication networks are particularly vulnerable to spectrum jamming assaults, which pose a serious threat to network operation. Malicious users exploit this vulnerability by launching three forms of jammer attacks: constant, intermittent, and reactive. Constant jamming occurs when jamming signals are continuously sent, intermittent jamming involves sending signals periodically, and reactive jamming occurs when jamming signals target the region of the spectrum inhabited by legitimate users while monitoring their transmission [
38]. In this study [
39], a hidden Markov model (HMM)-based jamming detection technique is suggested, with the goal of detecting reactive short-period jamming for UAV-assisted wireless communications without requiring prior knowledge of thesignal or channel characteristics.
2.5. Motivation
Recent advances in drone technology have created new prospects for UAV deployment in wireless communication networks. UAVs, which range from drones to small airplanes and airships, represent an innovative approach to delivering dependable and cost-effective wireless communication options in a variety of real-world circumstances. UAVs can revolutionize traditional terrestrial networks by operating as aerial BSs and providing on-demand wireless communications to specific areas. This trend of using UAVs for wireless communication indicates the importance of rethinking research issues, prioritizing networking and the handling of resources over control and positioning difficulties [
40,
41]. Machine learning (ML) has emerged as a significant method for improving UAV-enabled communication networks, providing autonomous and intelligent solutions. While most of the existing research focuses on UAV deployment and trajectory designs, the optimization of resource allocation strategies such as transmit power and subchannels has mainly occurred in time-independent settings. Furthermore, the rapid movement of UAVs hinders the collection of accurate dynamic environmental information, making the design of dependable UAV-enabled wireless communications difficult. Furthermore, as network size increases, the centralized methodologies presented in prior research face computing issues [
3,
42,
43,
44]. MARL provides a distributed approach to intelligent resource management in UAV-enabled communication networks, particularly when UAVs only have local information. MARL allows agents to consider particular application-specific requirements while modeling local interactions, addressing distributed modeling and computation problems. While MARL applications in cognitive radio networks and wireless regional area networks have demonstrated promise, its potential in multi-UAV networks remains untapped, notably in resource allocation [
36,
45,
46]. Thus, applying MARL to UAV-enabled communication networks offers a viable approach for intelligent resource management.
4. Problem Setup
We consider a target region
A with
M number of users located on the ground, as shown in
Figure 5. All users on the ground are stationary. The target area measures
L by
L squares. The
K number of users congregate near the four hotspots. The remaining
users are uniformly distributed across the entire target area
A. To ensure LoS for communication with ground users,
N UAVs fly horizontally inside the target region at a constant altitude
H. Two-dimensional Cartesian coordinates are used to identify the UAV and user positions inside the designated target region. Each UAV is identical and has a single directional antenna that concentrates the transmission energy inside an aperture angle
. A UAV’s ground coverage is considered to be a disk with radius
. The UAV does not cover users who are outside of its coverage disk. One UAV may cover up to the number of users assigned to it at once. Bandwidth is not provided uniformly among UAVs; it is allotted based on user demand and a UAV’s available bandwidth. UAVs operate independently, observing individual states and communicating little information, primarily sharing rewards. The time of the UAV movement is separated into discrete time stages, allowing the UAVs to make sequential decisions.
Table 2 represent the default values of the parameters.
4.1. User Distribution Framework
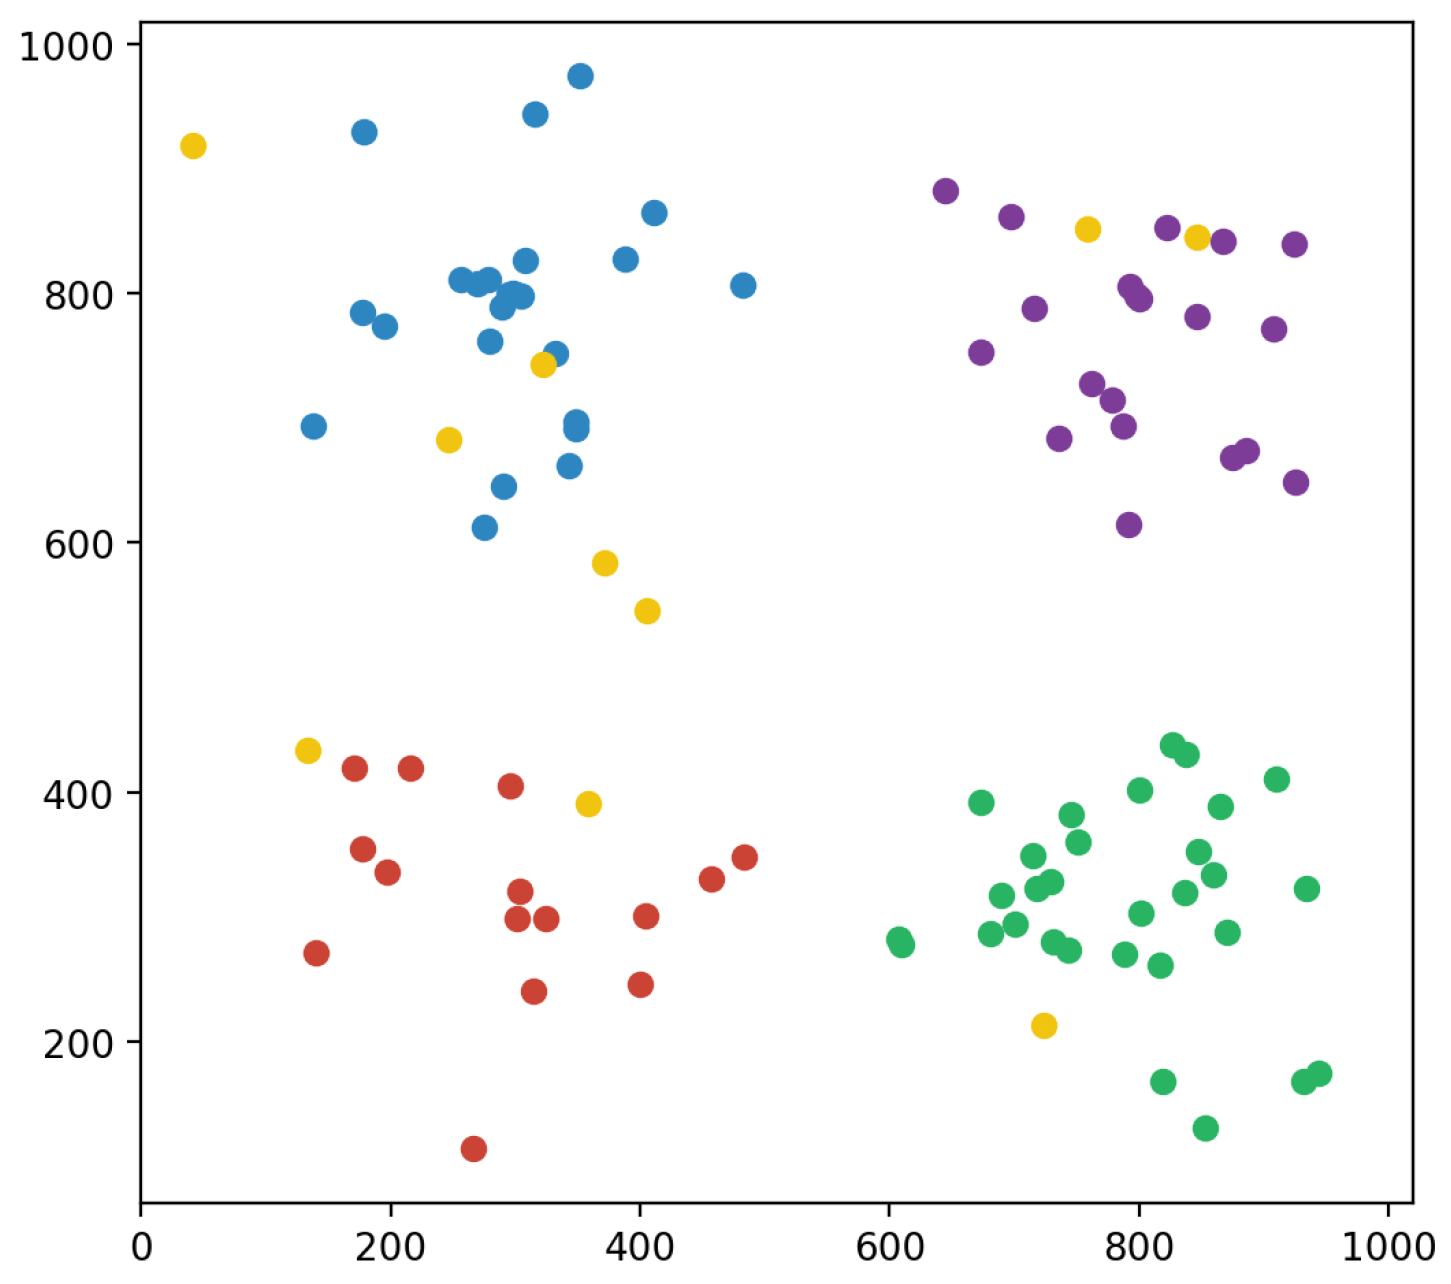
The user distribution approach simulates how users are distributed throughout distinct places within a defined coverage area. In the system, the target area is
L by
L square meters and there are
M users. We consider all the ground users to be stationary. To make the model simpler and facilitate easier calculation and analysis, the target region is discretized, and UAVs execute discrete actions. Each grid space size is 100. The system designates four primary hotspots. It then loops through each hotspot, providing random coordinates for users within a predetermined radius from the hotspot. These coordinates are initially created in polar form and then transformed to Cartesian coordinates for convenience of representation. The
K users are in those hotspots. The remaining
users are distributed uniformly within the entire target area, including the hotspot positions. The goal of this technique is to construct a realistic simulation of the user distribution among various regions within the defined coverage area, providing geographical dynamics and insights into user behaviors. The user distribution framework is depicted in
Figure 6.
4.2. Initialization of UAVs
In this system, M users are covered by N UAVs. The standard height for all UAVS is fixed at H meters. All of the UAVs are initially positioned at the grid’s origin .
4.3. User Coverage Method
To cover as many users as possible, we use the two-sweep method described in Algorithm 1. In wireless communication systems, the user association problem is frequently solved using the two-sweep method [
37]. In order to assign users to access points in the most effective way, two independent stages of operation are carried out. During the first sweep, which occurs in a 2D environment with the UAVs and users, each individual user included in the set
U of all users makes a connection request to the closest UAV in the set
I of all UAVs. One user is able to send a single request at a time, preventing many UAVs from serving the same user. Once the UAVs have received the connection requests
, they can identify which users are inside their coverage radius (i.e., within a Euclidean distance
that is less than or equal to the coverage radius
r). The distance between user
j and UAV
i is the Euclidean distance
Here, UAV
i coordinates are represented by
and
, whereas user
j coordinates are indicated by
and
. The users inside each UAV’s service area are then sorted according to their distance from the UAV. As the UAV fills to capacity
C, users are admitted in order of increasing distance. If a user is not connected to any UAVs in the initial sweep, a second sweep is performed to find the closest UAV that can cover the user. The user cannot access the network if there is no UAV nearby to cover them.
| Algorithm 1 User Association algorithm of decentralized DQN |
| 1: | Initialization: |
| 2: | Input: Connection request , User association q for , |
| 3: | User count for a UAV C for , Coverage radius for UAV r, Distance between UAV and user d, Closest UAV Closest-UAV, Maximum capacity of a UAV |
| 4: | for each user do |
| 5: | Closest-UAV ← argsort(d) for all |
| 6: | if then |
| 7: | |
| 8: | end if |
| 9: | end for |
| 10: | for each UAV do |
| 11: | Closest-user ← argsort(d) for all and |
| 12: | for each user do |
| 13: | if then |
| 14: | Set |
| 15: | Set |
| 16: | end if |
| 17: | end for |
| 18: | end for |
| 19: | for each user do |
| 20: | if any user is not associated with any UAV then |
| 21: | Closest-UAV ← argsort(d) for all |
| 22: | for each do |
| 23: | if and then |
| 24: | Set |
| 25: | Set |
| 26: | end if |
| 27: | end for |
| 28: | end if |
| 29: | end for |
4.4. Design
For a UAV mesh network, we developed a decentralized multi-agent deep Q-learning framework in which each UAV is autonomous and accountable for its subsequent actions in order to maximize the total user connectivity. The state space, action space, and reward function of UAV design will be covered in this section.
4.5. State Space
Since the state of the environment provides the basis for the agent behavior and is also used to represent and map the environment, its design is very significant. The placements of UAVs directly determine how many users are covered in each epoch, and this has a major effect on the goal of maximization. For simplicity, we discretize the whole area into equal small grid cells, where each cell indicates a possible UAV agent location. Each UAV agent’s state is defined at each time step using its unique position coordinates within this grid. While the UAVs fly horizontally, we simply take into account the 2D coordinates ; the epoch duration is 100 steps in the grid. The movements of UAVs are limited to within the target region. During training, the DQN uses agents local states as an input, as well as the individual and overall coverage rate of agents.
4.6. Action Space
Actions include both an agent’s output and the environmental input. Each drone has five different possible actions. These motions include moving one step in any direction (left, right, forward, backward), or remaining still. We do not consider the velocity of the UAV movement in the dynamics, which allows us to have better control over the UAV movement inside the state space. This reduces the complexity of directing their paths and interactions in the environment. In addition, there is a border condition in the target area. Any UAV will return to its initial state if it takes any action to leave the grid from a border state. When calculating the reward, a flag is utilized to track the UAVs that attempt to leave the grid and penalize them. Each UAV’s available actions can be expressed as follows:
where
denotes the action of UAV
i.
4.7. Reward Function
Reward is the feedback given to the agent after they have acted in response to specific environmental conditions. The reward
R is determined by the number of users covered by a UAV because the objective is to maximize the number of covered users. The reward function has multiple additional rewards and negative reward conditions. Any attempt by a UAV to cross the border will result in a penalty. The UAV will receive a further reward if the overall coverage rate exceeds a threshold value; if the overall coverage rate falls below the threshold value, the UAV will be penalized. The UAVs attempt to maximize their own reward by sharing reward information among themselves. This is called the average reward. The average reward
R is given by the following:
where
is the reward for the
i-th agent,
p is the penalty value for the
ith agent who is tried to go out of bounds,
r is the penalty value for the
i-th agent when the overall coverage rate is below the threshold level,
q is the additional reward value for the
i-th agent when overall coverage rate is below the threshold level,
x is the threshold value of the overall coverage rate, and
N is the total number of agents.
4.8. Training
To train agents to make decisions in complicated environments, we propose utilizing the DQN architecture. Using the Rectified Linear Unit (ReLU) activation functions to introduce non-linearity, the neural network model consists of two fully linked hidden layers with 400 neurons each. Given the current states and the individual and total coverage rate of the environment’s agents, this architecture enables the network to approximate Q-values for various actions. We train all the agents in a decentralized manner using a single neural network model.
The reinforcement learning agent facilitates the process of learning by coordinating its interactions with its environment and gradually improving its ability to make decisions. The main goal of the agent is to optimize its actions in order to maximize the cumulative rewards. This is accomplished by carefully balancing exploration and exploitation. In order to learn more about the environment and the rewards associated with different activities, the agent is frequently encouraged to experiment with a range of actions and behaviors during the exploration phase. This exploration is often guided by a policy known as an epsilon greedy policy, described in Algorithm 2, which finds a balance between the exploration process and the exploitation of activities that were shown to be effective. Once the agent has completed the exploration phase, they enter the planning phase. In this phase, the agent updates its policy or plan to maximize its expected reward using the knowledge it gathered during the exploration phase.
| Algorithm 2 Epsilon-greedy policy |
| 1: | Input: Random variable ; epsilon value ; Q-function; state |
| 2: | if
then |
| 3: | action ← random available action |
| 4: | else |
| 5: | action ← maximum Q-value in Q[state]; |
| 6: | end if |
To improve sample efficiency and stabilize learning, experiences are stored in a replay buffer during training. These experiences comprise state–action pairings, accompanying rewards, future states, and terminal flags. Using an MSE loss function that was optimized using the Adam optimizer, the agent’s primary goal is to reduce the difference between the target and forecast Q-values. Multiple epochs of environmental interactions are combined into each iterative episode that makes up the training process. To stabilize training and reduce overestimation bias, the target network is frequently updated to reflect the parameters of the main network. Optimizing the learning dynamics and convergence speed involves fine-tuning hyperparameters including target network update rate, epsilon, batch size, discount factor, and learning rate. In order to analyze the agent’s performance and track its learning progress, episode rewards and other pertinent metrics are tracked during the training process. Through iteratively updating the neural network parameters with experiences taken from the replay buffer, the agent progressively discovers the most optimal policies to maximize the cumulative rewards in the given environment.
Agent–environment interaction can be divided into sub-sequences whenever the RL algorithms provide a concept of time steps. Until a terminal state or a stopping criterion has been attained, these subsequences, which are referred to as episodes, consist of recurring interactions between the agent and the environment. The current episode ends when all UAVs have moved and are in their ideal places for that particular episode. A maximum of 750 episodes, each with up to 100 epochs, make up the training. The tested agent goes through 100 epochs of testing. The training is carried out on a Windows 11 server with an Intel Core i7-7700 CPU (Intel Corporation, Santa Clara, CA, USA) running at 3.60 GHz and 16 GB of RAM using Python 3.11. The MADQL algorithm was built using the PyTorch library.
Table 3 summarizes the key parameters, which are set according to the UAV simulation requirements for optimal performance. In addition, the
Figure 7 illustrates the entire methodology used to position the UAVs within the environment to maximize user coverage.
4.9. Example Simulation Result
This study explores the findings, in which each UAV maximizes its individual reward while also sharing rewards with others to maximize the global reward and cover the maximum number of distributed users, as the reward is based on the number of users covered.
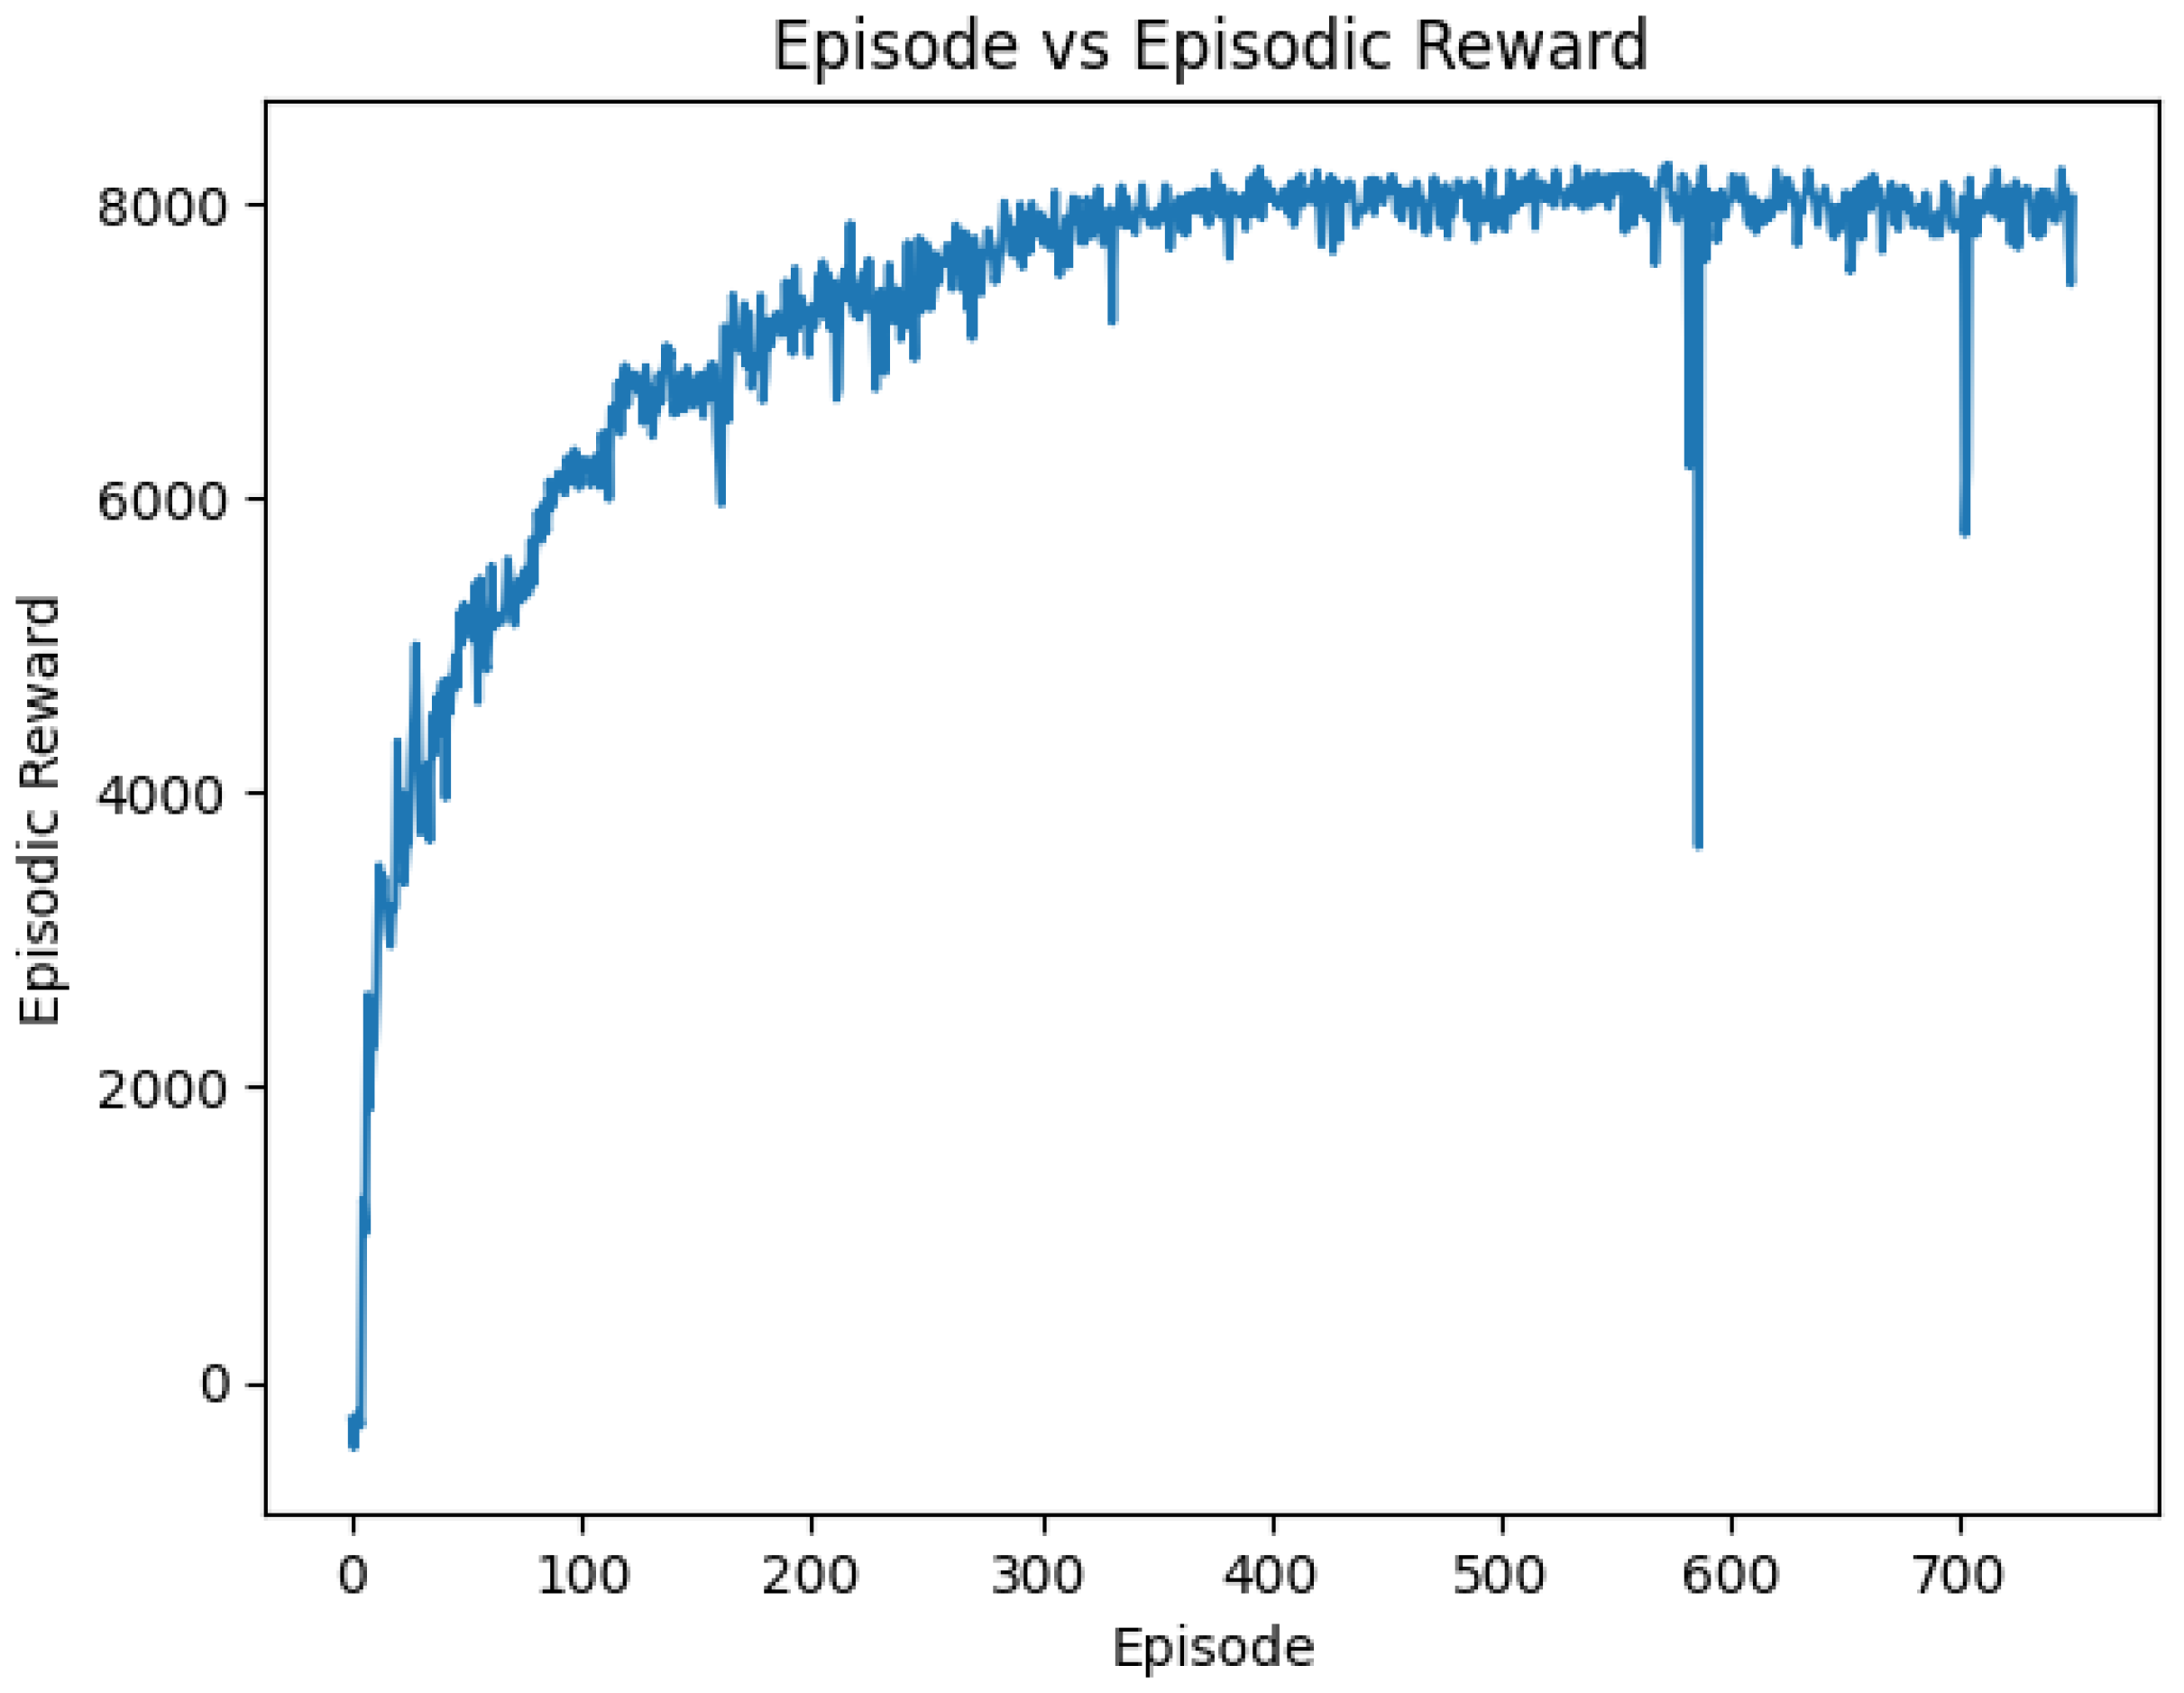
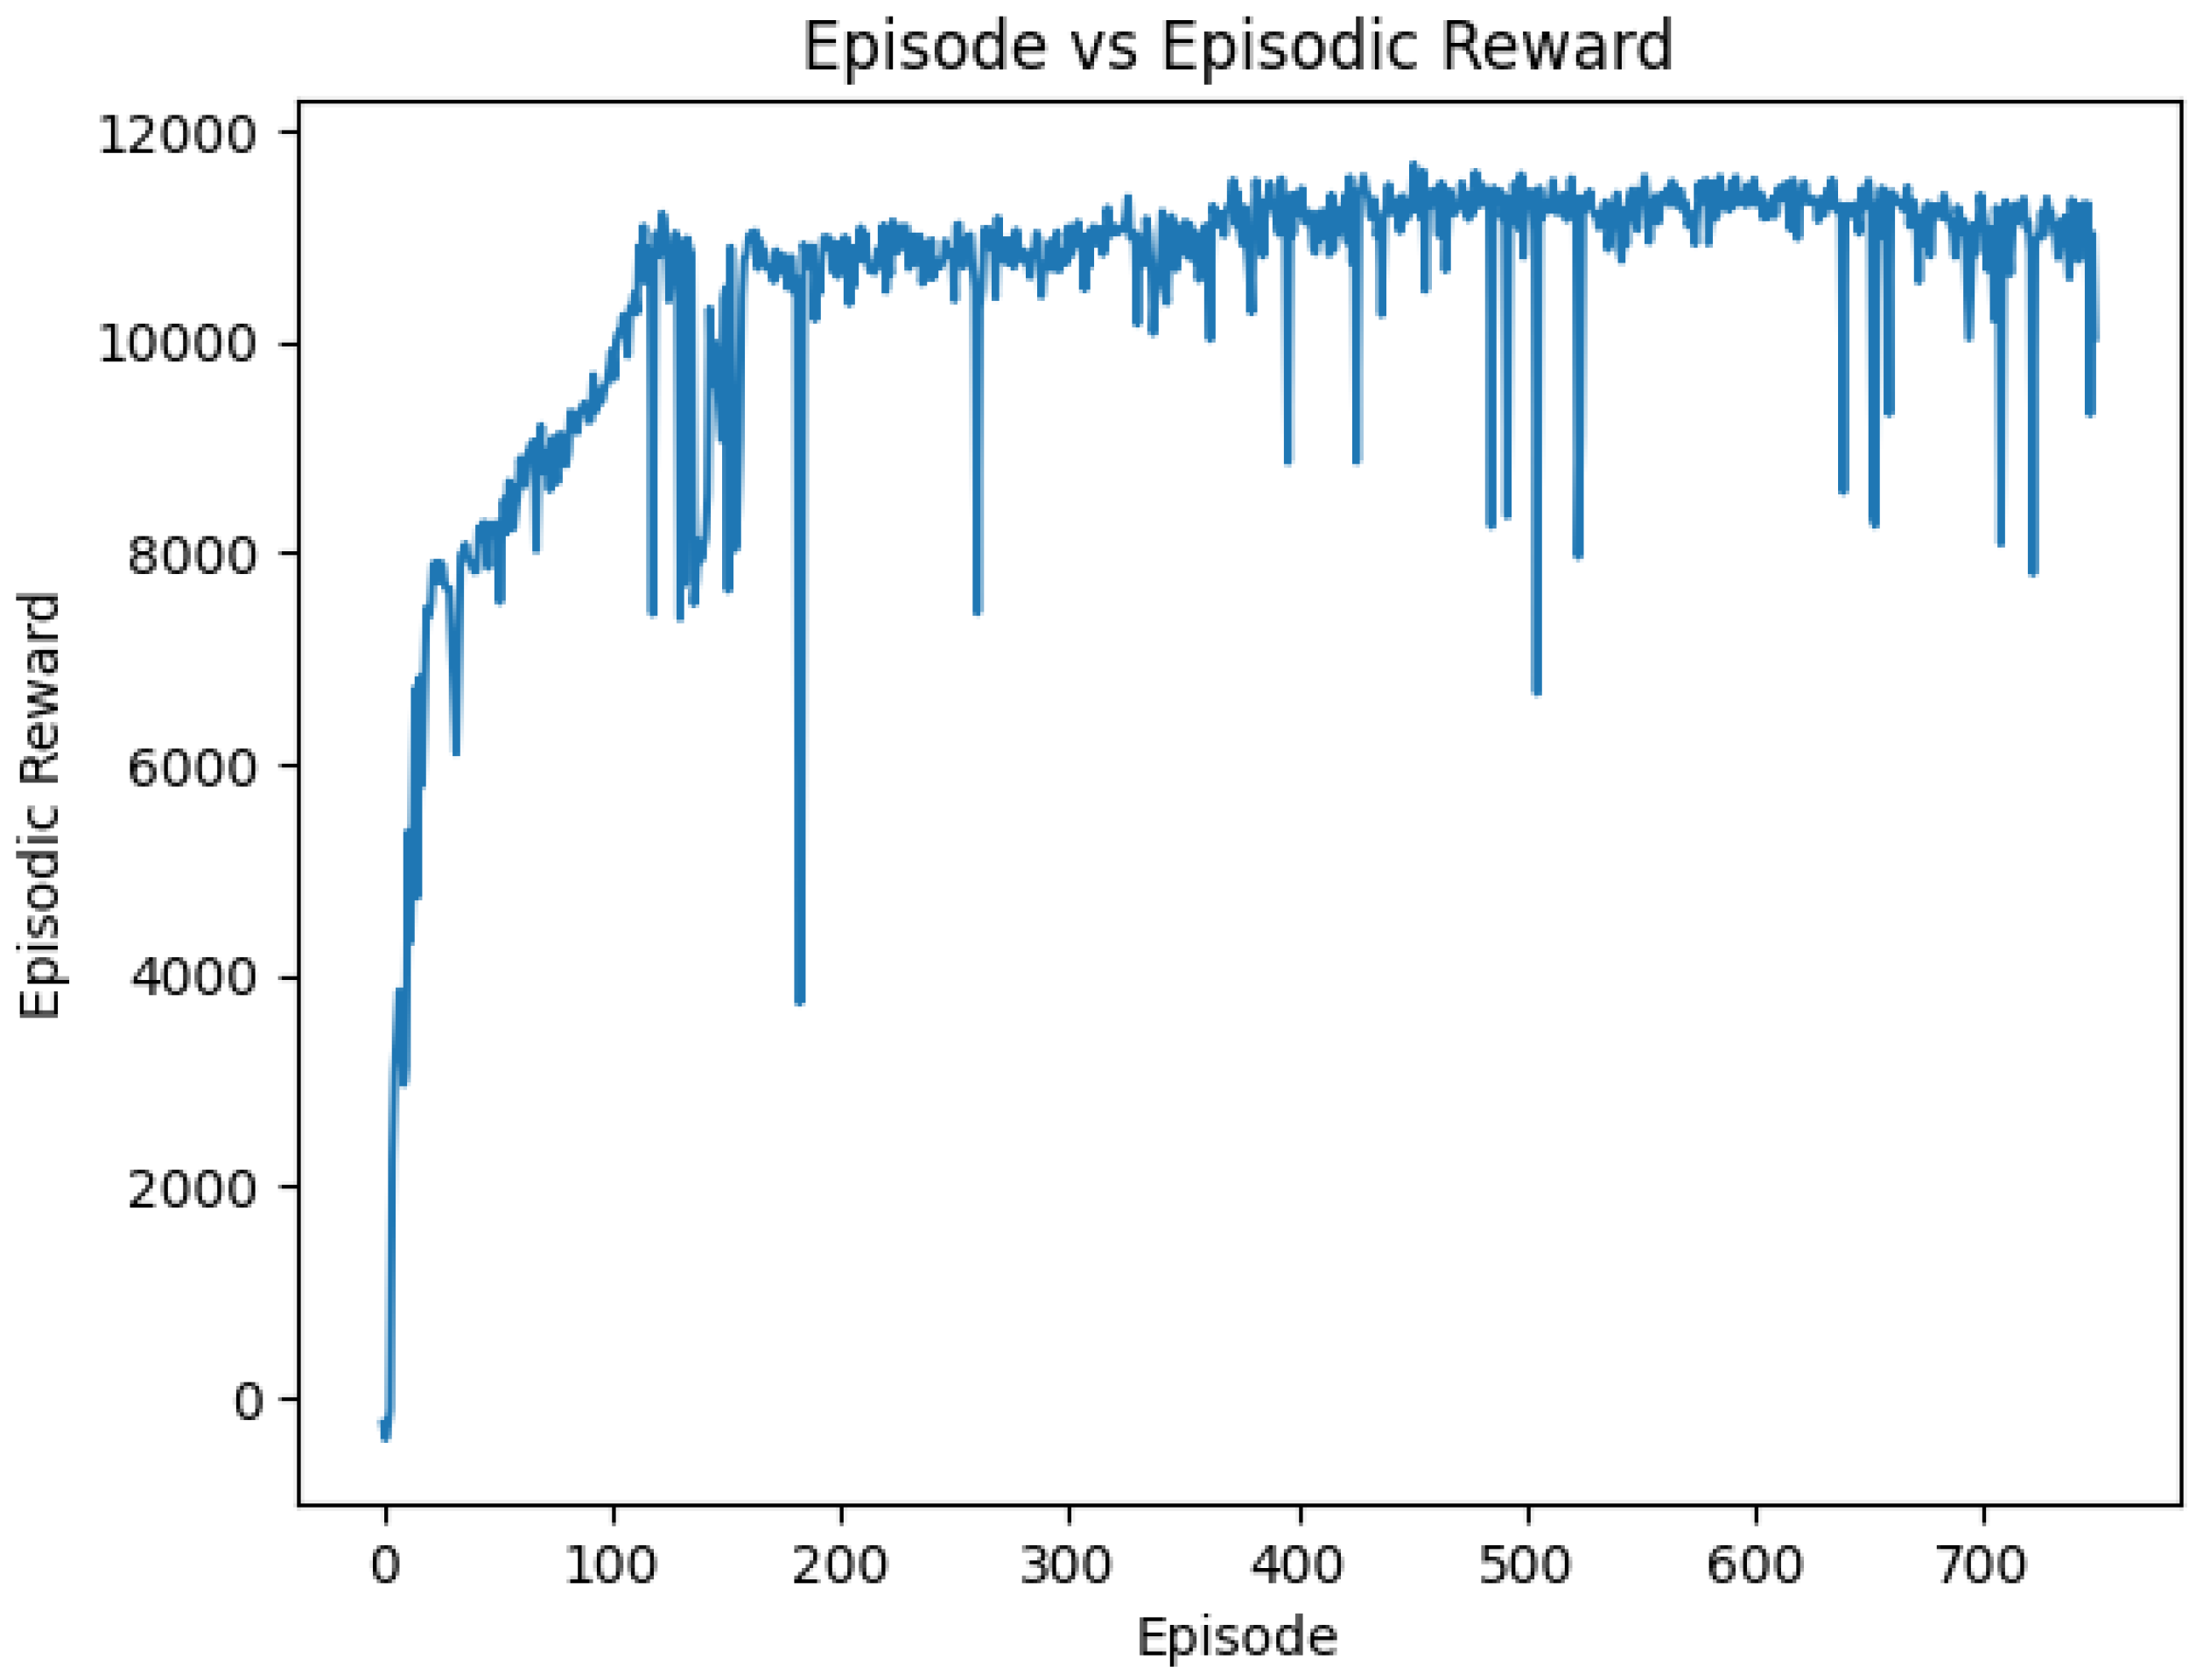
In
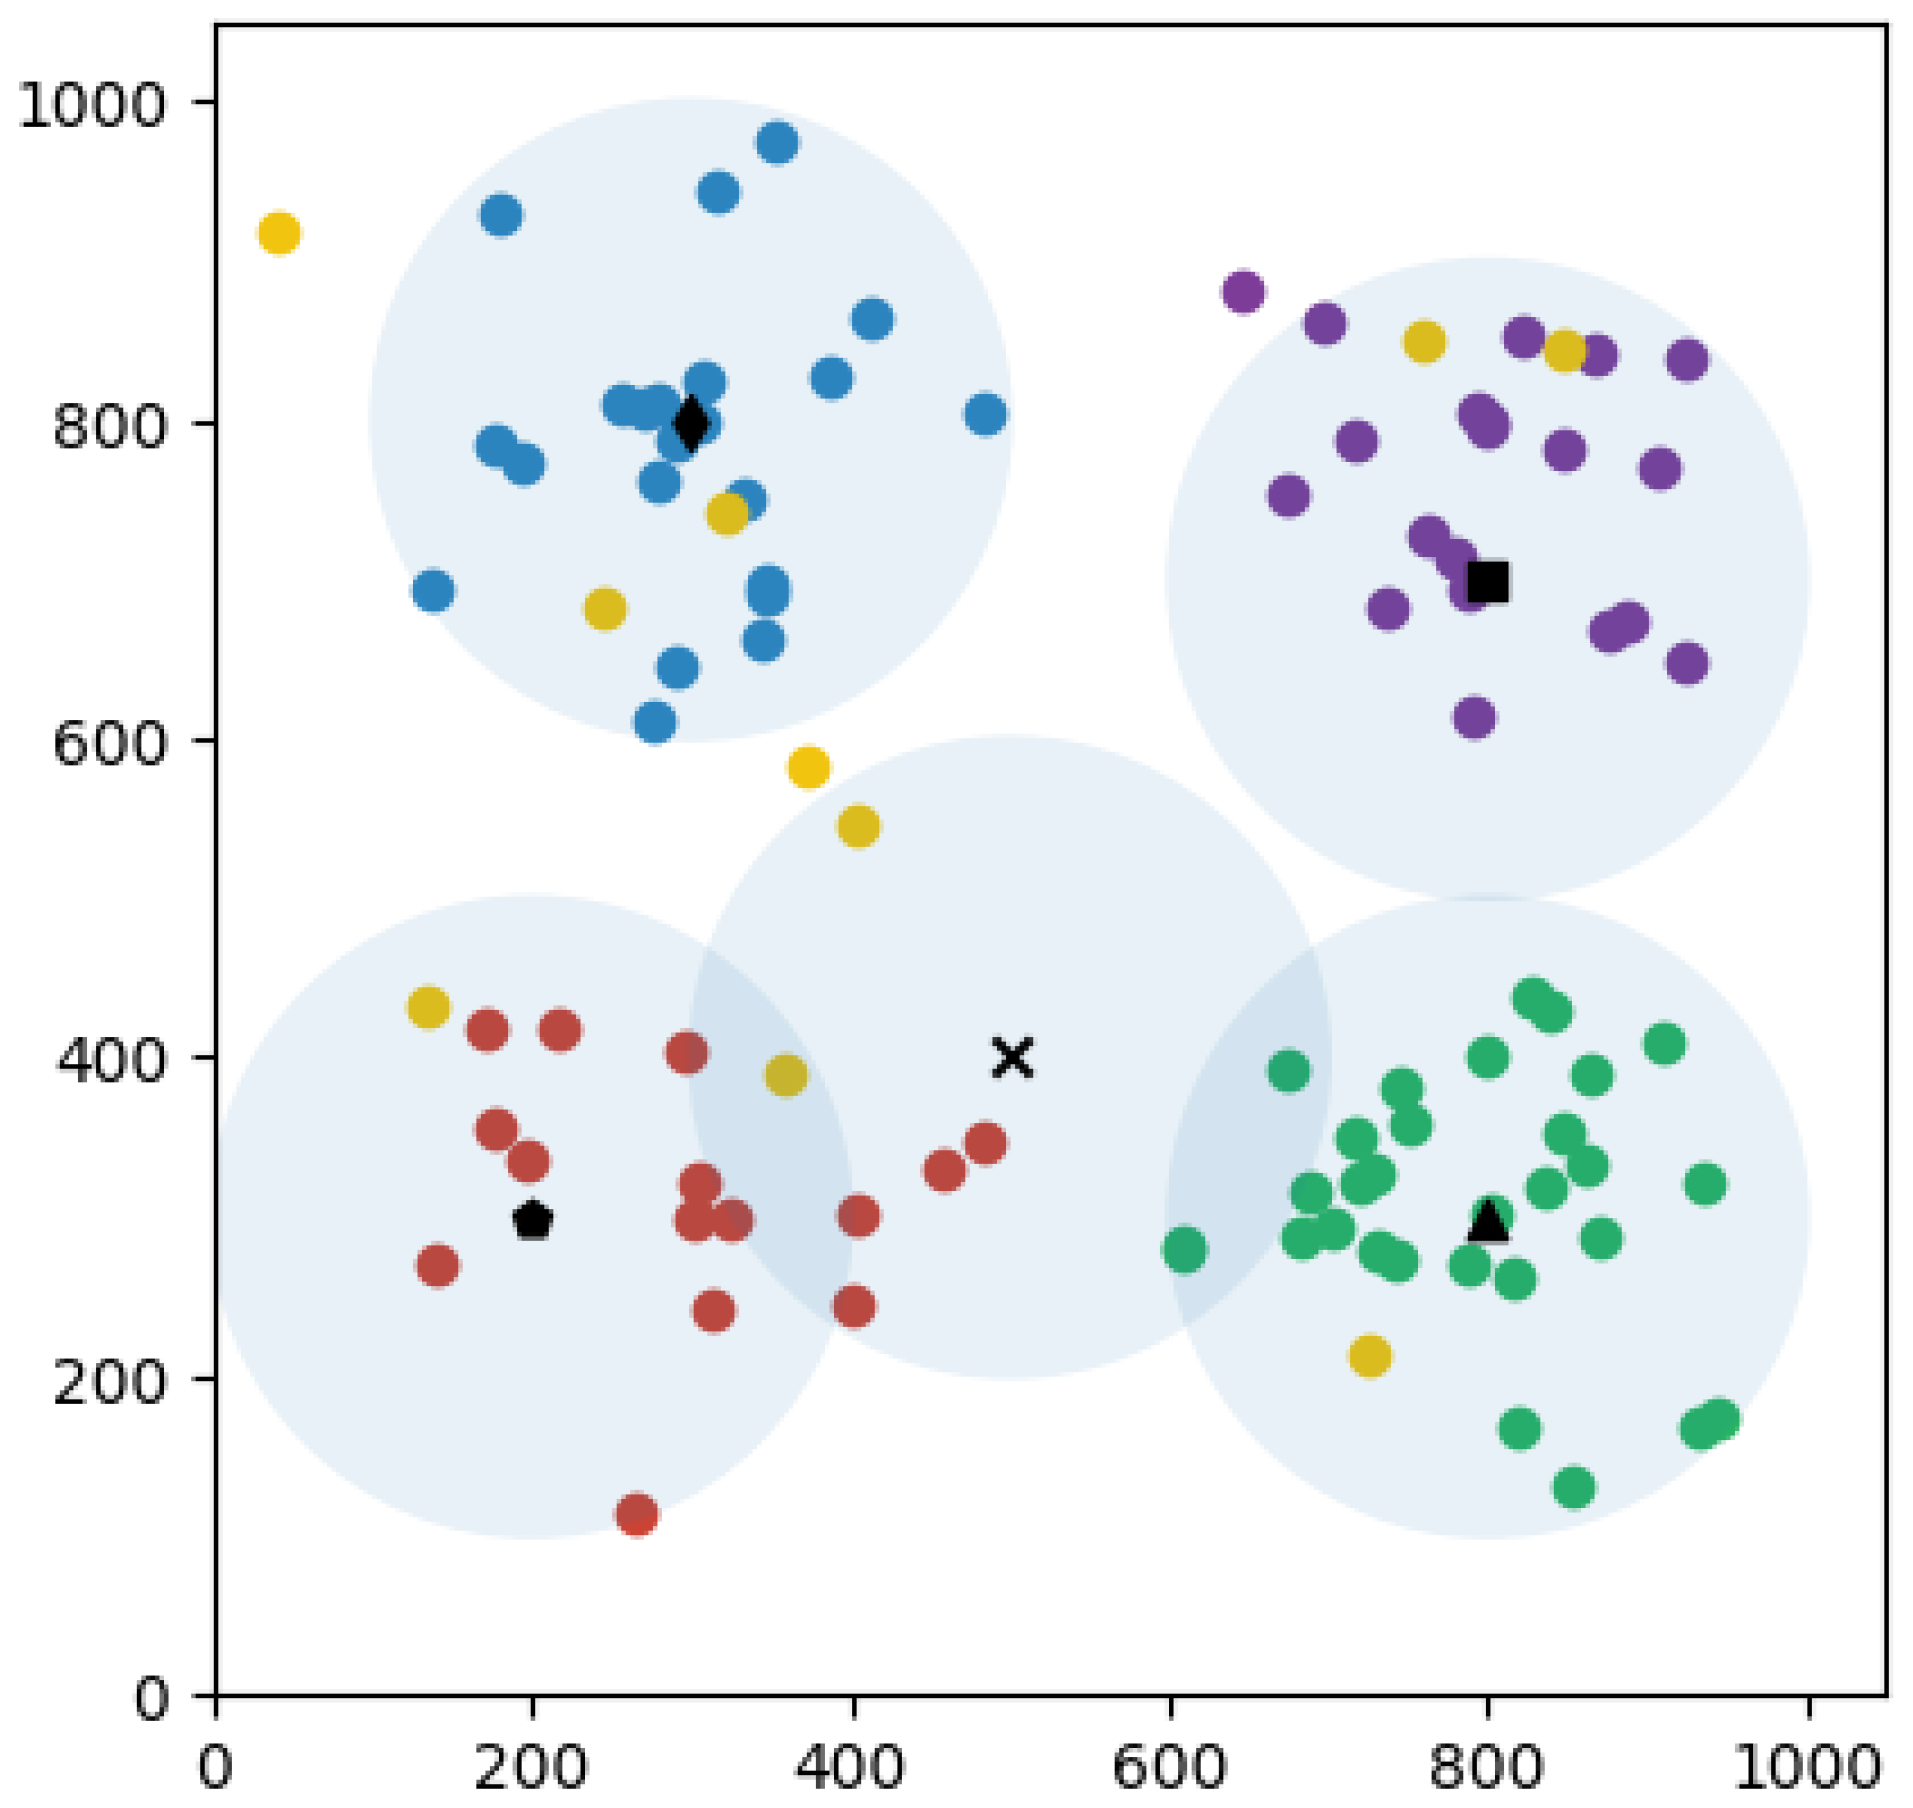
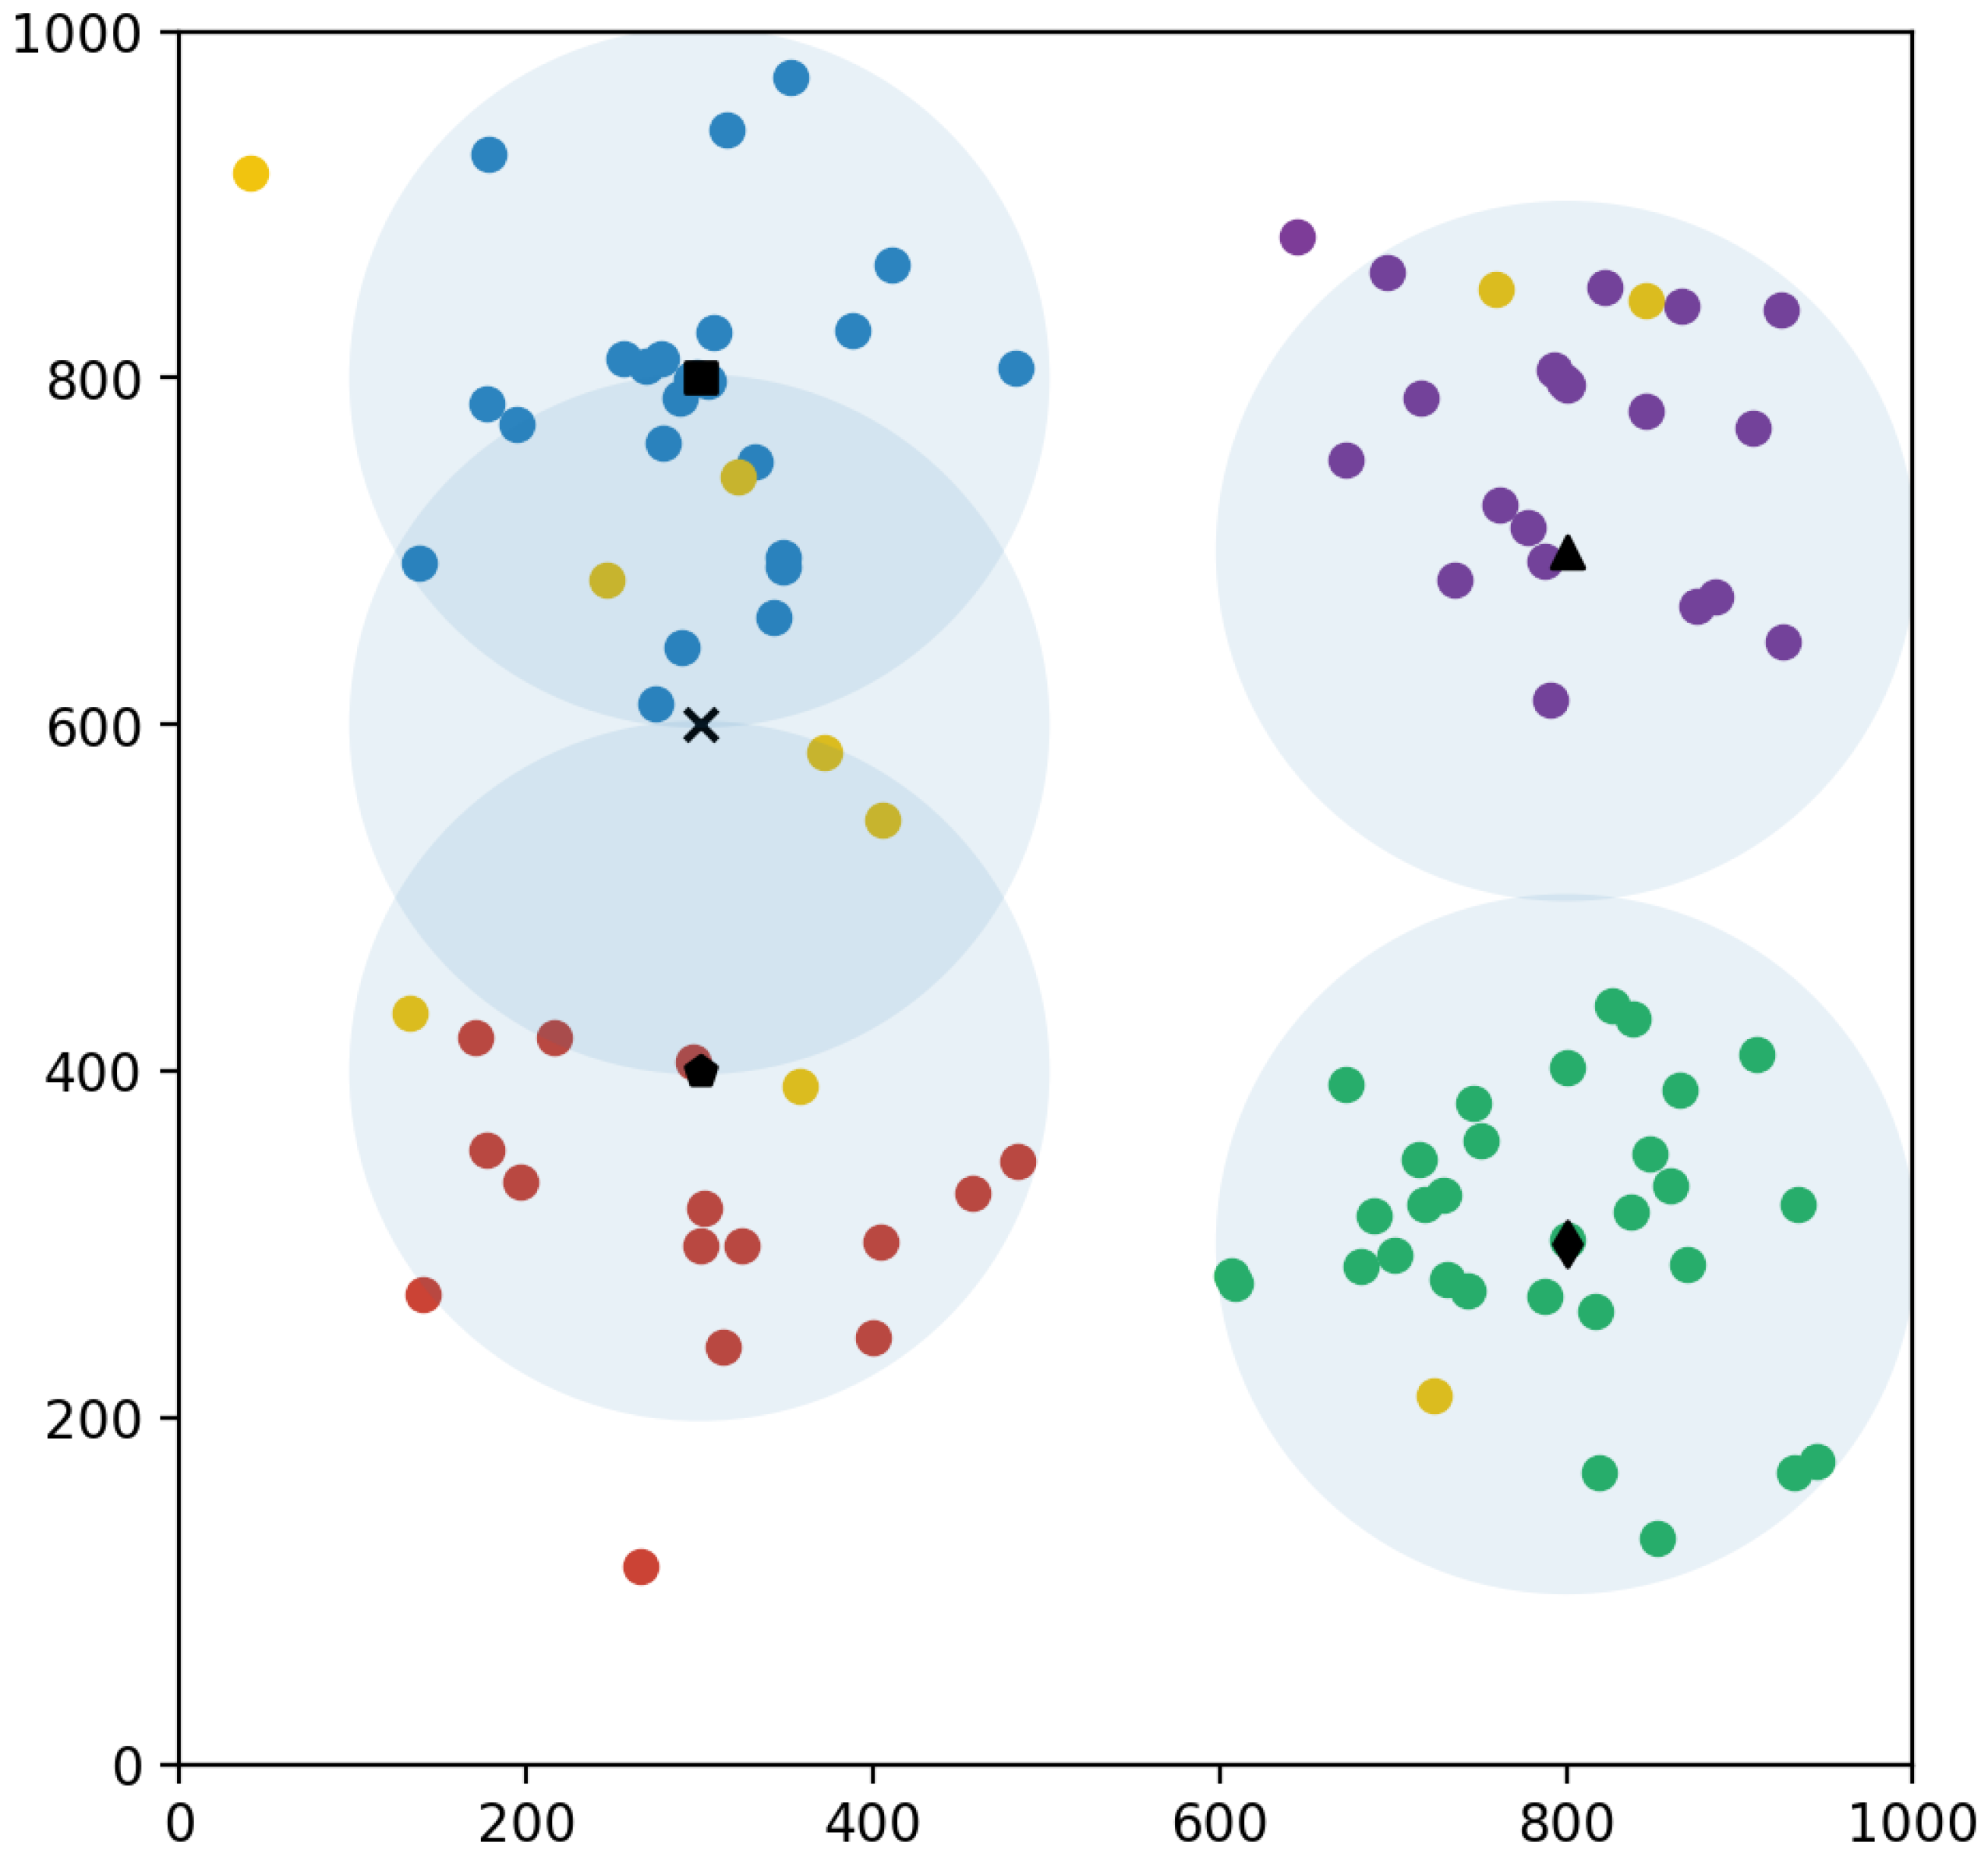
Figure 8, the convergence curve is shown. The optimal state of the UAVs is displayed in
Figure 9, showing their successful collaboration in maximizing the reward function and enabling the UAVs to cover up to 93 users.
To improve positional accuracy, we reduced the grid resolution from 100 m to 50 m in our most recent UAV simulation update. The updated technique involves the UAV taking 100 m steps for the first 60 steps before switching to 50 m steps for the final 80 steps.
Figure 10 depicts the convergence plot for this approach. This change enables the UAV to make more precise movements as it approaches the optimal position, increasing user coverage from 93 to 95.
Figure 11 shows the optimal position of the UAVs. Despite this development, the improved grid resolution and smaller step sizes cause a substantial increase in simulation time. The previous setup took roughly 200 min, whereas the current configuration takes around 300 min. As a result, achieving more exact optimal positioning requires longer simulation times, emphasizing the importance of balancing precision and computational efficiency.
In summary, achieving more precise optimal positioning necessitates longer simulation times, highlighting the need to balance precision with computational efficiency.
5. Training Methods and Policy Adaptability in Different Environmental Settings
In this section, we focus on the stochastic environment and investigate various user distributions inside a specific target area, with the goal of improving our model’s adaptability and robustness [
62]. To accurately imitate real-world settings, we purposely add diversity in user distribution across different episodes when training our model. This deliberate variation is critical, providing our model with the capacity to handle the many user distribution circumstances seen in practical applications. By exposing our model to a variety of user distributions during training, we hope to foster resilience and improve its capacity to be generalized across different types of user distributions. We hope to gain a thorough understanding of how our model responds to changing levels of uncertainty and adapts to a variety of environmental conditions, ultimately improving its performance in real-world applications characterized by stochastic dynamics.
We expand our investigation by applying the training data from one setting to another and analyzing the results using histograms. Our goal is to evaluate the performance of the model learned in one environment when applied to a different, but comparable, environment. By displaying the results with histograms, we can see how well the model generalizes across settings and responds to changes in environmental conditions. This research allows for us to assess the model’s resilience and transferability, providing information on its ability to manage stochastic environments.
5.1. Motivation
Our approach is motivated by the computational expenses associated with training reinforcement learning models. Given the computational resources necessary for training, we intend to accelerate the process by training the model in a given environment and then evaluating it in similar scenarios. This method allows us to use the knowledge learned during training to similar situations, lowering the computational overhead required when building numerous models from scratch for each environment. By focusing on training the model in one environment and testing it in others, we hope to increase efficiency while maintaining the model’s effectiveness and flexibility across multiple related scenarios. This strategy not only minimizes computational resources, but it also makes it easier to use reinforcement learning techniques in real-world circumstances.
5.2. Stochastic User Distribution
In
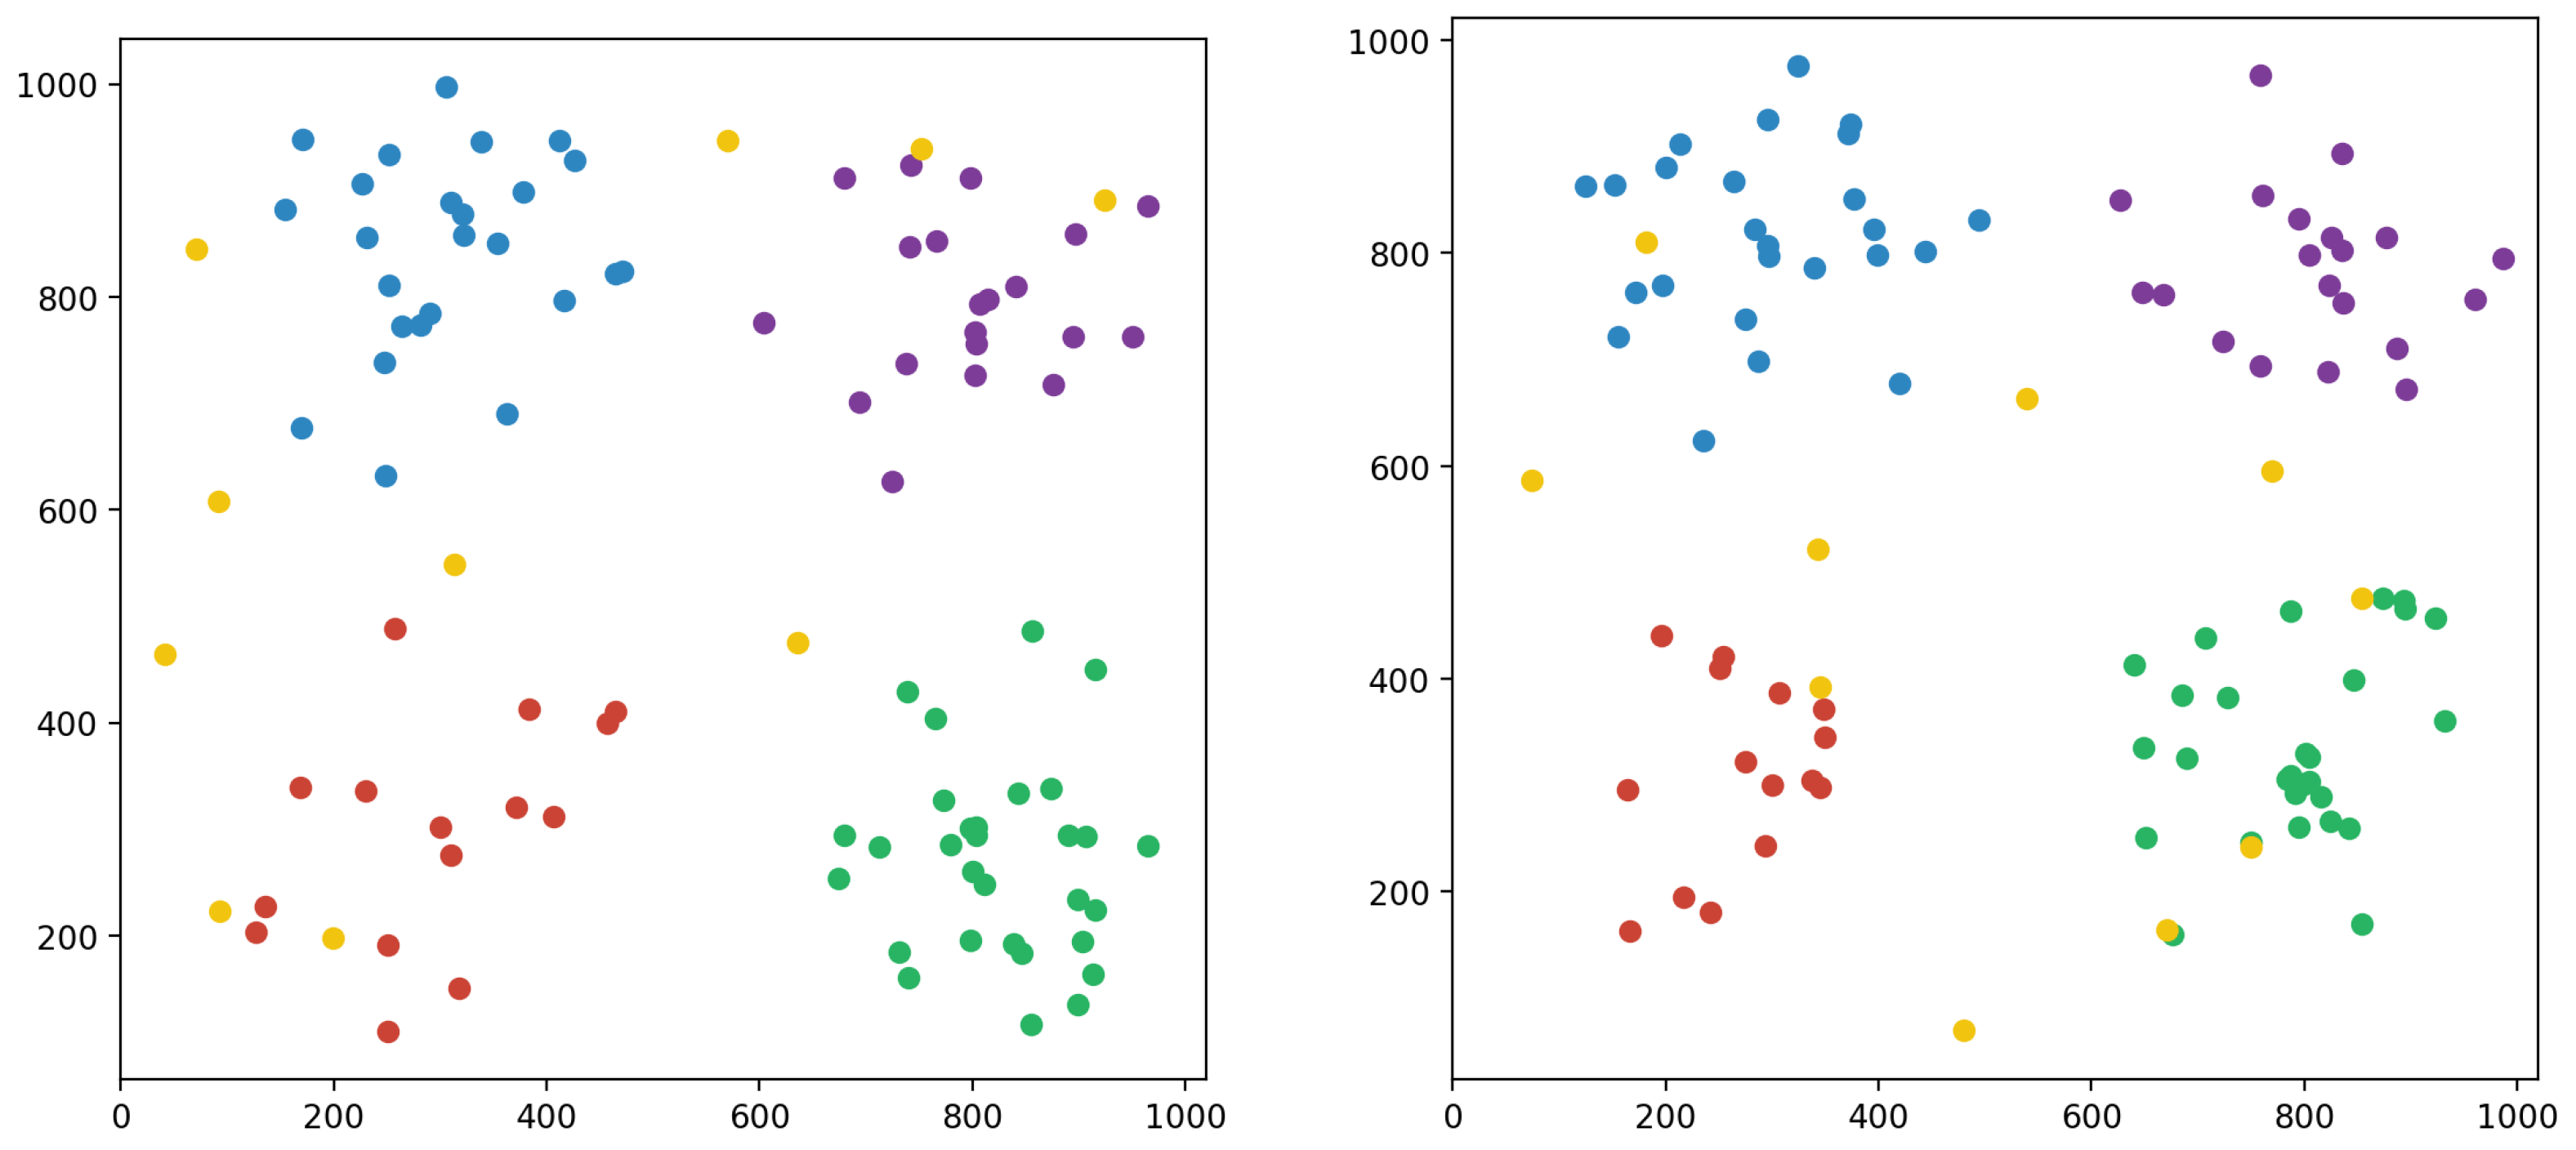
Section 4, user positions remained consistent across all episodes of training. In this section, we consider two additional distribution scenarios. To distinguish the various user distributions, we refer to the user distribution from
Section 4, in which the user positions remain constant as a type I distribution.
Figure 12 provides a sample of a type II user distribution in which user positions are randomly sampled in each episode while hotspot coordinates and user counts remain unchanged. This design enables an investigation of how user distribution patterns change over numerous episodes while the overall structure of the hotspots remains unchanged. In contrast,
Figure 13 displays a sample of a type III user distribution scenario in which both the placements and the number of user counts are randomly sampled in each episode but the hotspot coordinates remain constant. This dynamic design allows for research on how changes in user counts and positions affect the overall distribution landscape while keeping hotspot locations consistent across episodes. These different distribution techniques provide useful insights into the dynamic nature of user distribution and its consequences for system efficiency.
5.3. Training
To optimize the UAV’s decision-making within the network, we employed the same training procedure as in
Section 4. The strategy used for user distribution during the training phase, however, differs significantly. In contrast to the fixed user distribution employed in the earlier training cycles, we introduced dynamic adjustments to the user distribution following each episode. This adaptable approach is in line with real-world situations, in which user populations may fluctuate over time as a result of events, shifting mobility patterns, or modifications to the surrounding environment. As they were trained under a variety of user distribution scenarios, the UAV agents are exposed to a broad range of working environments, which improves their ability to adapt to changing user environments. After conducting a thorough experiment and analyzing the simulation results, we evaluate how well the training framework performs in enabling UAV agents to navigate and serve users in a variety of distribution patterns, which helps to optimize network performance in dynamic and unpredictable environments.
5.4. Simulation Results
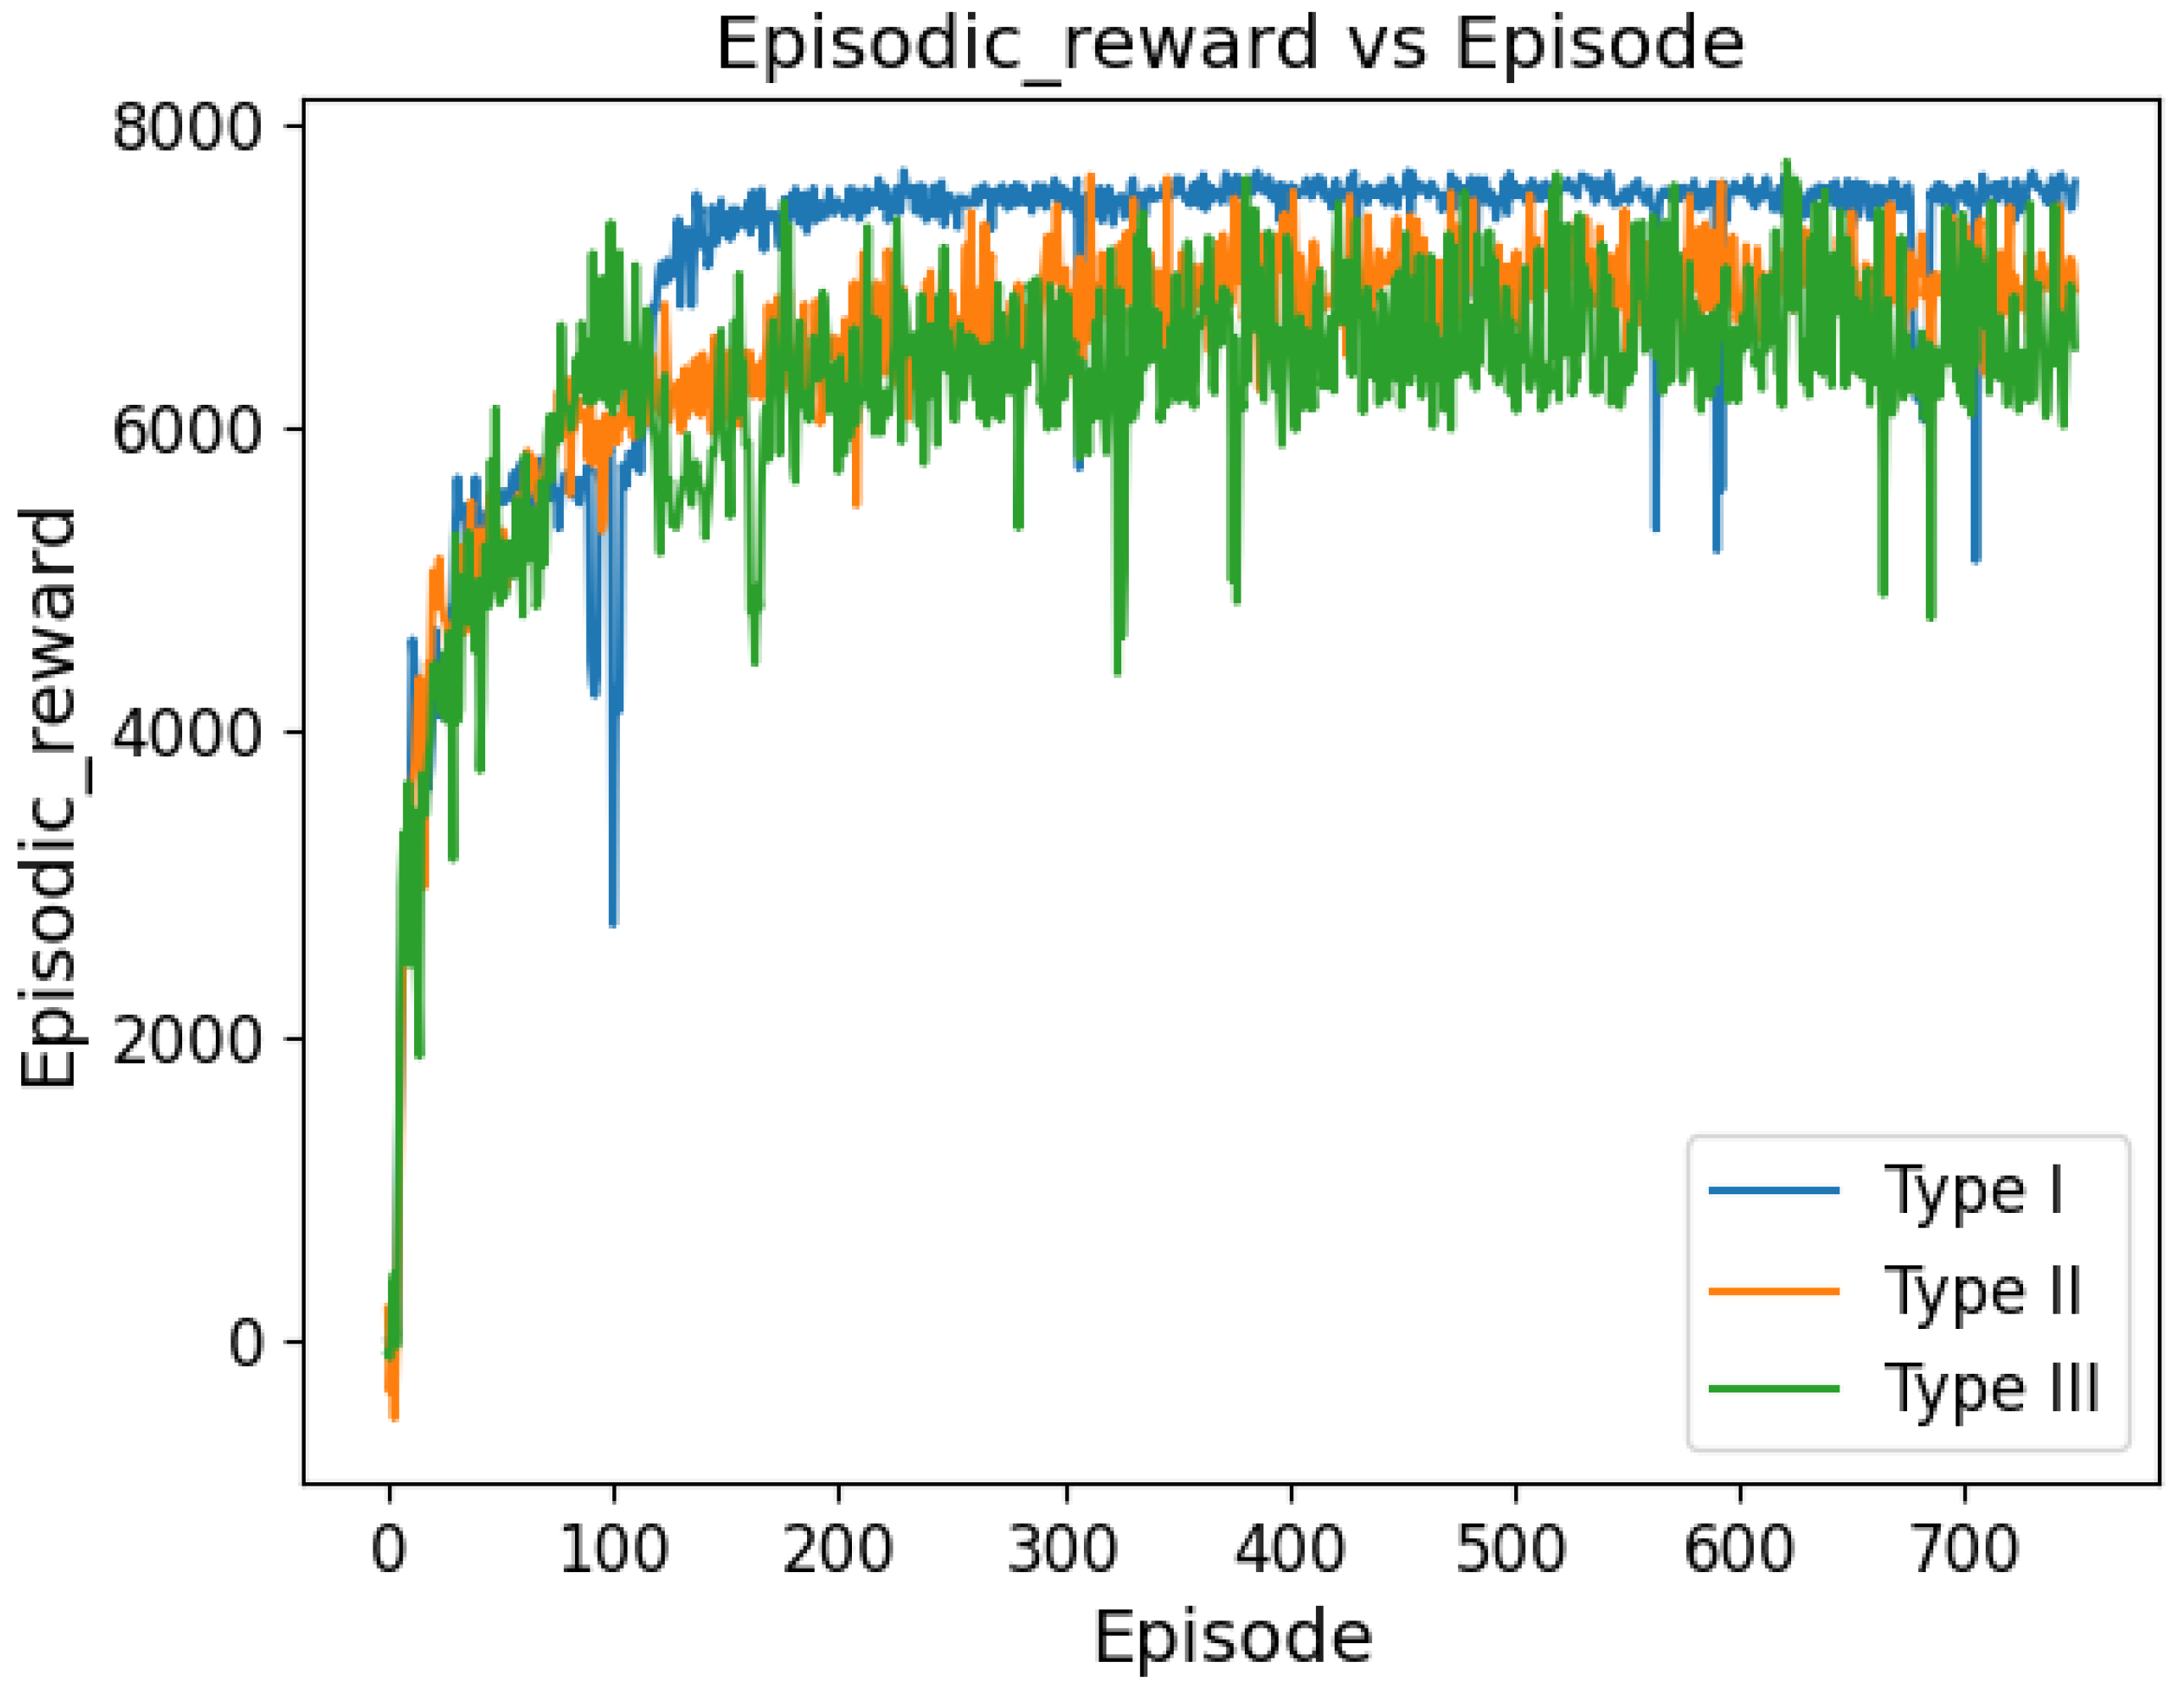
For three learning algorithms in a UAV-assisted network,
Figure 14 shows a comparative study of the episodic rewards received across 750 episodes. Because the user distribution remained constant throughout every training event, Type I exhibits a rapid learning efficiency that is typified by a swift ascent to a stable high-reward plateau. As seen by the longer progress to equivalent reward levels with larger fluctuations, Type II, which has a user sample that varies with each training event, shows a more measured learning curve and moderate stability. With the highest degree of variety, Type III exhibits comparable reward attainment but a more intricate learning environment. Type III introduces variability in both user samples and the number of users per hotspot during training. In spite of these variations, all three kinds show convergence, highlighting how well the learning algorithms adapt to different training scenarios.
The variable spread of and peaks in the distributions in the histograms presented below show how the number of users connected per episode varied among the simulation settings. The red dashed line, which represents the mean number of users connected, moves around the charts to show the various average connectivity in each case.
We conducted an empirical study to examine the effectiveness of a policy designed for one distribution of environments on environments taken from a different distribution. This investigation was essential for evaluating the training policy’s robustness and adaptability in a variety of environmental circumstances.
The test results obtained for a policy that was learned on a Type I user distribution and then applied to the same training distribution are shown in
Figure 15 (top left). Applying the taught policy to a similar user distribution situation resulted in the policy connecting 86 users in each testing episode. When the same policy was applied to a Type II user distribution, as shown in
Figure 15 (top center), a broader frequency distribution with a lower mean of about 82 users connected is revealed. This suggests that the user sampling variability may have somewhat lowered performance. Lastly, due to changes in both user sampling and the number of users per hotspot,
Figure 15 (top right) shows an even greater decline in user connectivity when the policy was applied to the Type III user distribution, with the mean connecting to around 76 users.
Test results are shown in
Figure 15 (middle left) for a policy learned on a Type II user distribution that, when applied to a Type I distribution, achieved connectivity for 83 users. The performance of the identical Type II-trained strategy with its native Type II distribution is shown in
Figure 15 (middle center), where the mean connectivity decreased to about 82 users and the distribution is more dispersed. When evaluated under Type III conditions, the Type II-trained strategy in
Figure 15 (middle right) shows an even broader spread, with the mean number of people linked falling to about 80. These outcomes demonstrate how flexible the strategy is, preserving a high level of user connectivity in a range of distributions.
After training with a Type III user distribution, the policy connected an average of 84 users per episode in a Type I scenario. The test results are shown in
Figure 15 (bottom left). Under Type II conditions, the identical technique shows a greater dispersion in connectivity with a mean of about 81 users in
Figure 15 (bottom middle). After additional testing under Type III settings, the number of connected users showed the widest range, with the mean falling to roughly 79, as illustrated in
Figure 15 (bottom right).
The testing results show that the user connectivity policy was robust when applied to different user distributions; in all circumstances, the policy covered about 80 percent of users. The policy was able to maintain a high degree of consistency every time. This performance consistency, which accounts for a significant majority of the users, irrespective of the distribution method, highlights the algorithm’s resilience and potential utility in a range of operational environments.
6. Robustness Against Jamming Attacks
Unmanned aerial vehicles (UAVs) have shown great promise in addressing a variety of communication network difficulties [
62]. Jamming attacks remain one of the main problems in wireless networks, despite the significant technological advancements in this field. The widespread occurrence of wireless networks based on UAVs has made jamming assaults a significant obstacle to the effective implementation of these technologies [
63]. The term “jamming attack” describes the illegal creation of interference to an ongoing communication in order to cause disruptions or deceive users of wireless networks. In order to interfere with the wireless networks’ regular operation, the jammer sends out jamming signals. Wireless networks are therefore still susceptible to a variety of jamming attack methods. Because of the UAV’s great degree of adaptability, it is possible to mitigate the jamming attack or perhaps completely prevent its detrimental effects. Nonetheless, the jammer may target the UAV itself in an attempt to impede the regular operation of UAV-based communication networks [
64].
The authors of [
65] presented a UAV-aided anti-jamming system for cellular networks. Reinforcement learning algorithms are used by the UAV to select relay policies for users in cellular networks. To counteract the jamming attack, the UAV routes traffic from the jammed base station to a backup base station. In [
66], the authors examined an anti-jamming communication within a UAV swarm when jamming was present. The UAV maximizes its data reception by taking use of the degree of freedom in frequency, velocity, antenna, and regional domain while a jammer targets the network. In [
67,
68] suggested a combined optimization for the UAV trajectory and transmission power in anti-jamming communication networks. The optimization problems are solved using a Q-learning-based anti-jamming approach and a stackelberg framework.
6.1. Problem Setup
In our current system model, any UAV can be jammed by malicious entities while providing services to users, resulting in a drop in overall coverage because the jammed UAV can no longer serve users. When a UAV is jammed, it loses its capacity to communicate with other UAVs, which means it cannot send or receive information or signals from the remaining UAVs. The jammed UAV can only hover indefinitely, with no further activity. In this approach, jamming occurs after the UAV has taken 30 steps within the grid from the origin, allowing it to achieve its optimal location before being jammed.
Our key objective is to enable the UAV to quickly react, reposition itself, and take the optimal position to cover the maximum number of users.
6.2. Methodology
To optimize user coverage in the event of UAV jamming, we incorporated a straightforward yet efficient heuristic into our proposed strategy, as described in Algorithm 3. Any UAV that becomes jammed instantly experiences a zero percent individual coverage rate. As soon as one of the UAVs becomes jammed, the other UAVs will identify its location. Then, the individual coverage rate of each remaining UAV will be determined. The UAV with the lowest coverage rate will travel in the direction of the jammed UAV if any of these serving UAVs have individual coverage rates that are lower than the jammed UAV’s initial coverage rate. The UAVs take one step at a time toward the jammed UAV. The UAV with the lowest coverage rate applies vector calculations to precisely navigate to the jammed UAV’s location. The UAV that goes to the jammed UAV’s location resumes normal operation, seeking to restore coverage to the previously served area. If the jammed UAV’s coverage rate prior to jamming was less than or equal to the remaining UAVs’ coverage rates, no UAV will approach the jammed UAV’s position. This is because the overall goal is to maintain or increase user coverage across the network.
This technique was included in the main algorithm to assist in the dynamic relocation of UAVs when one is jammed. Its integration prevents the main algorithm from getting stuck in the local minima, allowing for UAVs to continuously adjust their positions to optimize user coverage, which is the primary goal.
| Algorithm 3 UAV Handling in Jammed UAV Scenario |
| 1: | Input: Number of UAVs N, Index of jammed UAV j, User count per UAV for , Current and target positions for UAVs. |
| 2: | if
then |
| 3: | Determine Valid UAV Indices: |
| 4: | |
| 5: | Compare User Counts: |
| 6: | ▹ Number of users for the jammed UAV |
| 7: | ▹ Minimum number of users among valid UAVs |
| 8: | if then |
| 9: | if then |
| 10: | Select UAV with Minimum Users: |
| 11: | |
| 12: | |
| 13: | else |
| 14: | |
| 15: | end if |
| 16: | Obtain Current and Target Positions: |
| 17: | |
| 18: | |
| 19: | if then |
| 20: | Calculate Movement Direction: |
| 21: | |
| 22: | |
| 23: | |
| 24: | Update UAV Position: |
| 25: | |
| 26: | |
| 27: | else State Reset Assigned UAV: |
| 28: | |
| 29: | end if |
| 30: | end if |
| 31: | end if |
6.3. Simulation Results
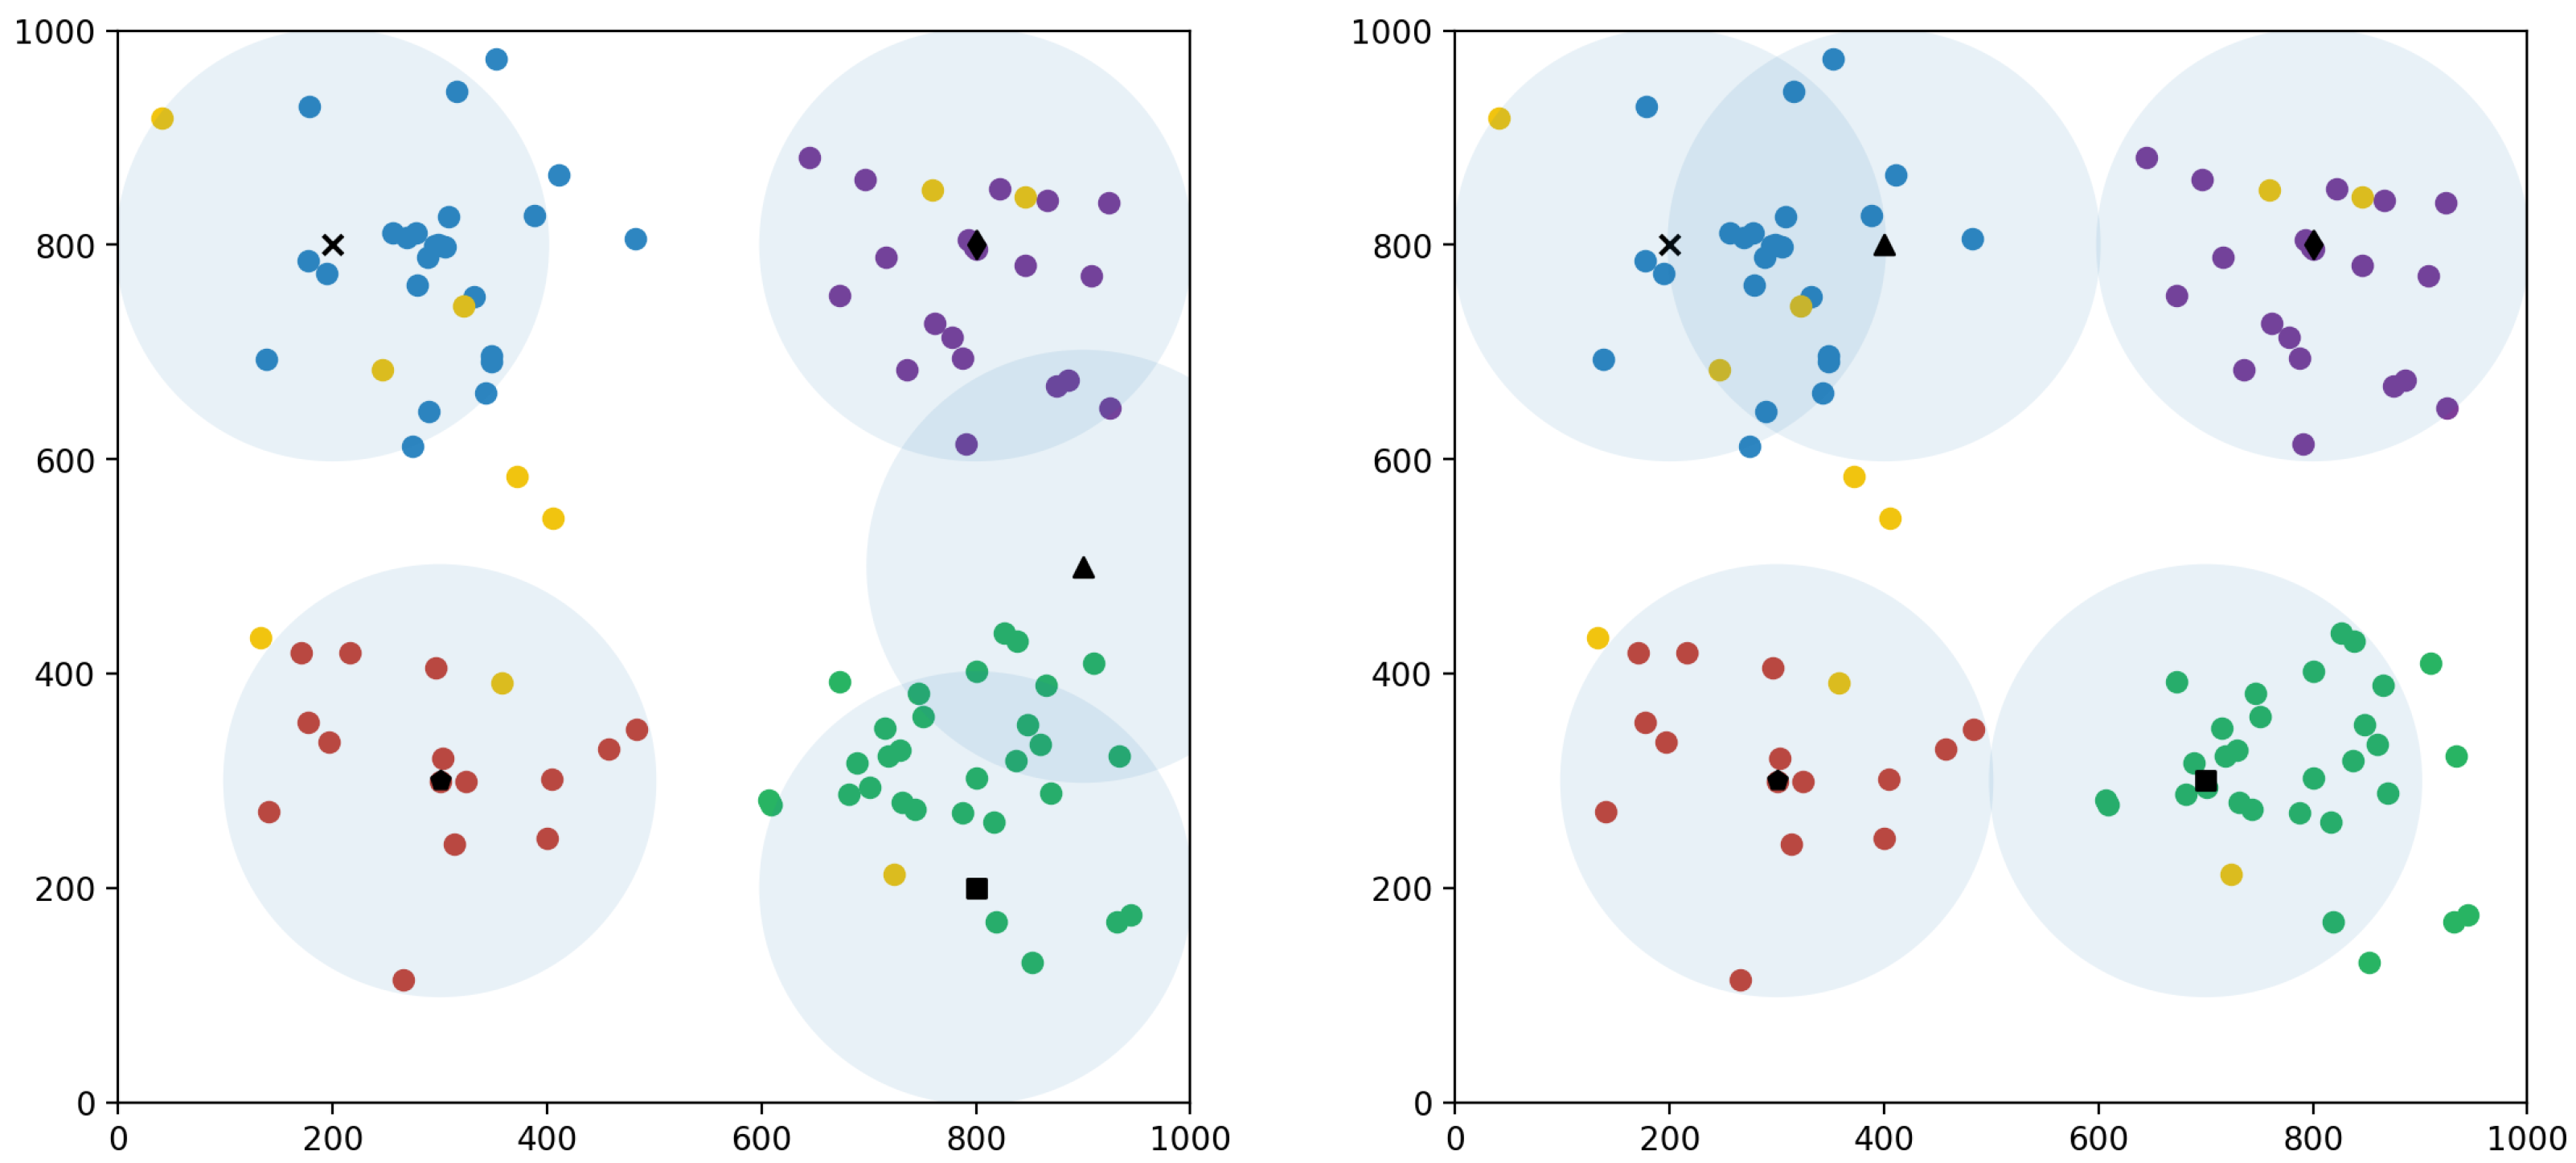
The simulation outcomes illustrate the positions of UAVs before and after a jamming event, providing a visual representation of both UAVs and users in
Figure 16. Here, we present one specific case, while similar figures and their numerical data will be provided for other cases. In the left figure, the UAVs are initially positioned optimally, covering a total of 86 users. However, after UAV 1, marked with a star, is jammed, its individual coverage rate drops to zero, leading to a significant decrease in overall user coverage, as shown in
Figure 16, dropping to 45 users. In response, the remaining UAVs adjust their positions within a few time steps, following the relocation strategy outlined by our algorithm. The figure on the right depicts the new positions after the relocation, where the UAV marked with a triangle moves to the location of the jammed star-marked UAV to cover the affected users. This adaptive response enables the network to recover, achieving a new coverage level of 68 users, as indicated in
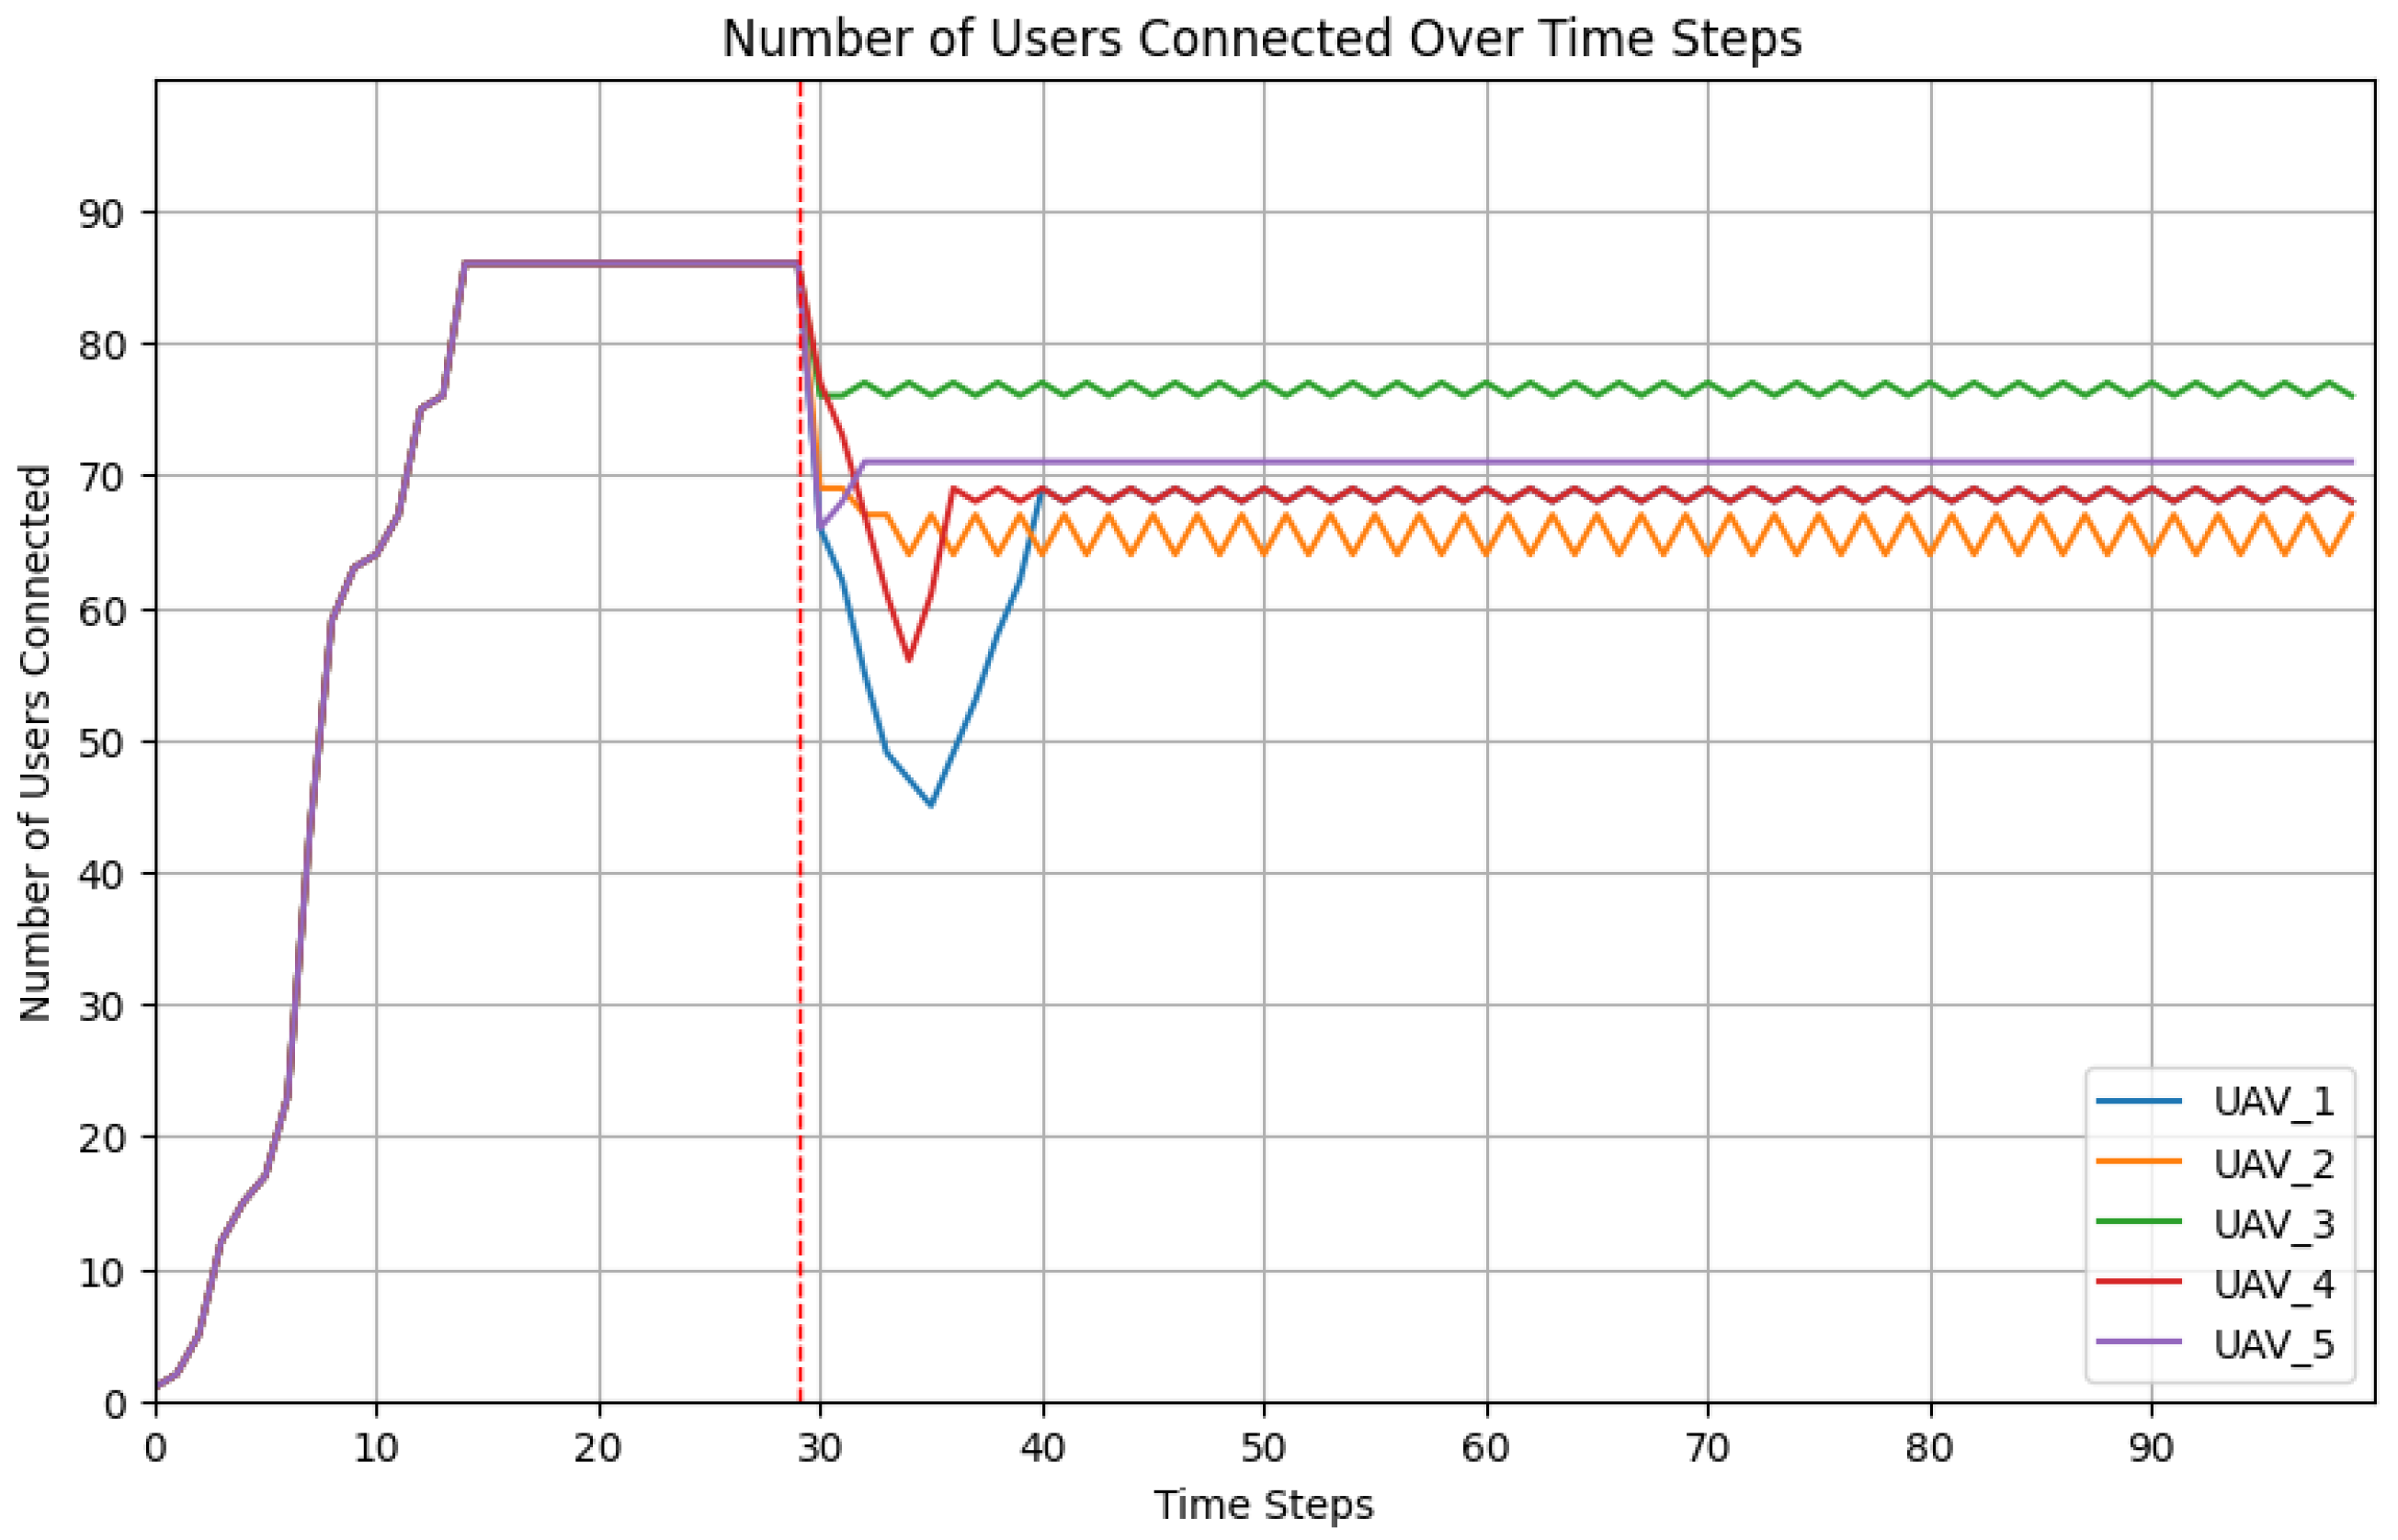
Figure 17.
Figure 18 depicts the dynamic behavior of five UAVs in reaction to jamming events, with each UAV jammed independently after a time step of 30. The plot depicts how the number of users connected to each UAV varies before and after the jamming, showing the overall network coverage rate and the subsequent recovery process. Initially, all UAVs performed optimally, and the total network coverage rate reached a maximum of 86 users. However, when a jamming event occurred that targeted one UAV at a time (as represented by the red dashed line at time step 30), the coverage rate quickly declined, indicating that the jammed UAV was unable to provide service. When the first UAV (blue line) was jammed, its coverage rate decreased from around 86 users to 45, resulting in a considerable decrease in overall coverage. However, due to the algorithm’s relocation method, the remaining UAVs modified their placements, resulting in a steady recovery of overall coverage that stabilized at around 68 users. For the second UAV (orange line), the remaining UAVs shifted their coverage, settling at around 68 users. The third UAV (green line) maintained a relatively consistent coverage, starting at roughly 76 users, with minimal influence from jamming due to its ideal placement. When UAV four was jammed, its coverage decreased from roughly 86 to around 57 users. After the jamming occurred, the relocation mechanism allowed the remaining UAVs to shift their positions, gradually restoring the overall coverage to around 68 users. Similarly, when UAV five was jammed, the coverage rate dropped dramatically, to roughly 66 users, before returning to 71 users following relocation. These findings show that the algorithm is effective at dynamically reallocating UAVs to enhance user coverage, even in the face of severe disruptions such as jamming attempts.
After each jamming incident, the network eventually settled on a new equilibrium coverage level that iwa somewhat lower than the initial peak but much greater than the immediate post-jamming condition. This result demonstrates the relocation strategy’s effectiveness in maintaining a strong network performance and maximizing user connectivity under adverse conditions.
7. Centralized Problem Approach
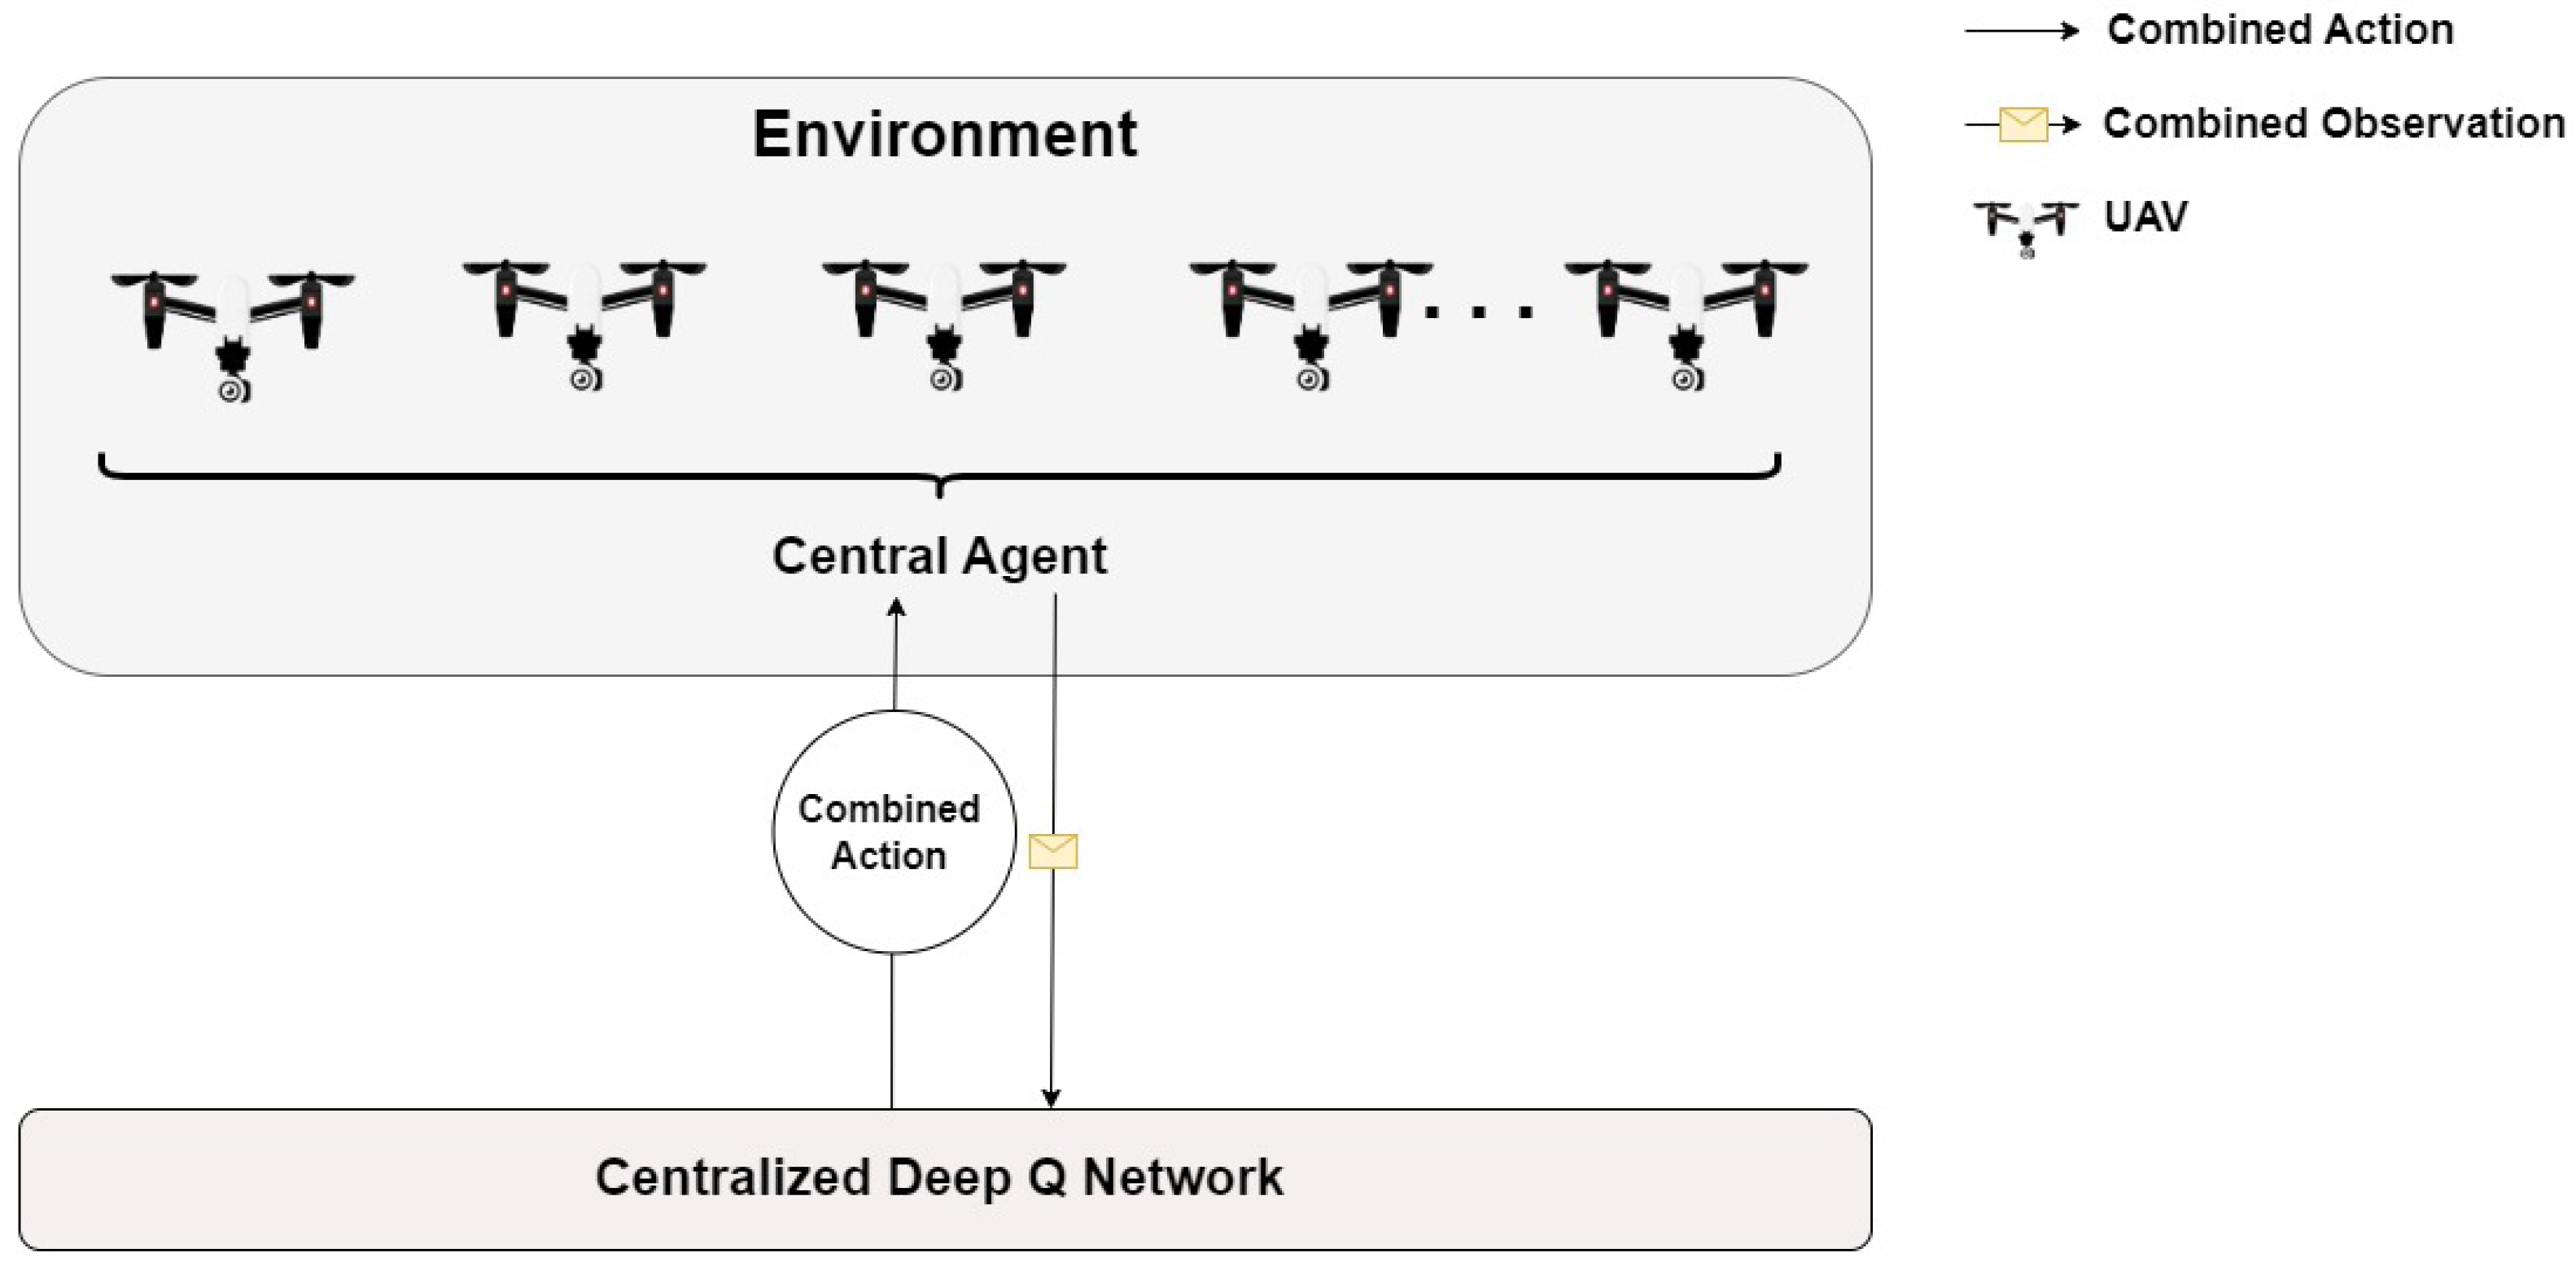
In contrast to the distributed approach shown in the previous section, we now consider the use of a centralized algorithm to place the UAVs in order to maximize the number of connected users. Here, a centralized controller computes the actions of all UAVs. This approach is illustrated in
Figure 19.
7.1. Centralized Algorithm Workflow
The centralized approach consists of a central neural network that can control the actions of all the UAVs [
26,
69]. The global state of all the UAVs,
, provides the inputs to the main network. The main deep Q network approximates the optimal Q values for all the possible joint actions of the UAVs and the Q values for the current state are predicted. The target network, in parallel, provides the target Q values that are used in the computation of the loss function and the main network weights are adjusted based on this. The best set of joint actions that holds the maximum Q value is chosen, and this action is considered for all the UAVs in the environment. The epsilon greedy policy acts as the deciding factor and the trade-off between exploration and exploitation is determined using the
parameter.
After choosing the best joint action, it is sent to the environment and the actions are implemented. The environment, in return, provides the combined reward/penalty for the collective action taken, the next transitioned state information, and information regarding whether the terminal state was reached. This collective information is stored in the replay buffer from which the sample of memories that contains these information is taken and used to train the neural network.This iterative process is carried out in each step for several episodes, more than the multi-agent algorithm, as a large amount of data need to be handled. The calculation of the optimal value takes time since the network has to find the optimal joint actions in a combined fashion for all the UAVs. This strategy is used in optimal UAV position placement to obtain the maximum user coverage using a single controller. The total runtime of this algorithm is longer than that of the multi-agent algorithm, as a large amount of data are handled by the neural network. The centralized algorithm flow is shown in Algorithm 4.
| Algorithm 4 Centralized DQL Approach to UAV position optimization |
| 1: | Initialization: |
| 2: | Initialize the centralized main DQN ; |
| 3: | Initialize the centralized target DQN with weights ; |
| 4: | Initialize the centralized experience replay buffer ; |
| 5: | Learning Process: |
| 6: | for each episode do |
| 7: | Initialize the global state for all UAVs to starting state ; |
| 8: | for each timestep do |
| 9: | Execute centralized -greedy policy to select joint action ; |
| 10: | Take joint action , observe joint reward , and next global state ; |
| 11: | Store transition in ; |
| 12: | if enough data in then |
| 13: | Sample minibatch and perform a gradient descent step on Q; |
| 14: | Periodically update with weights from Q; |
| 15: | end if |
| 16: | end for |
| 17: | end for |
7.2. Centralized Deep Neural Network
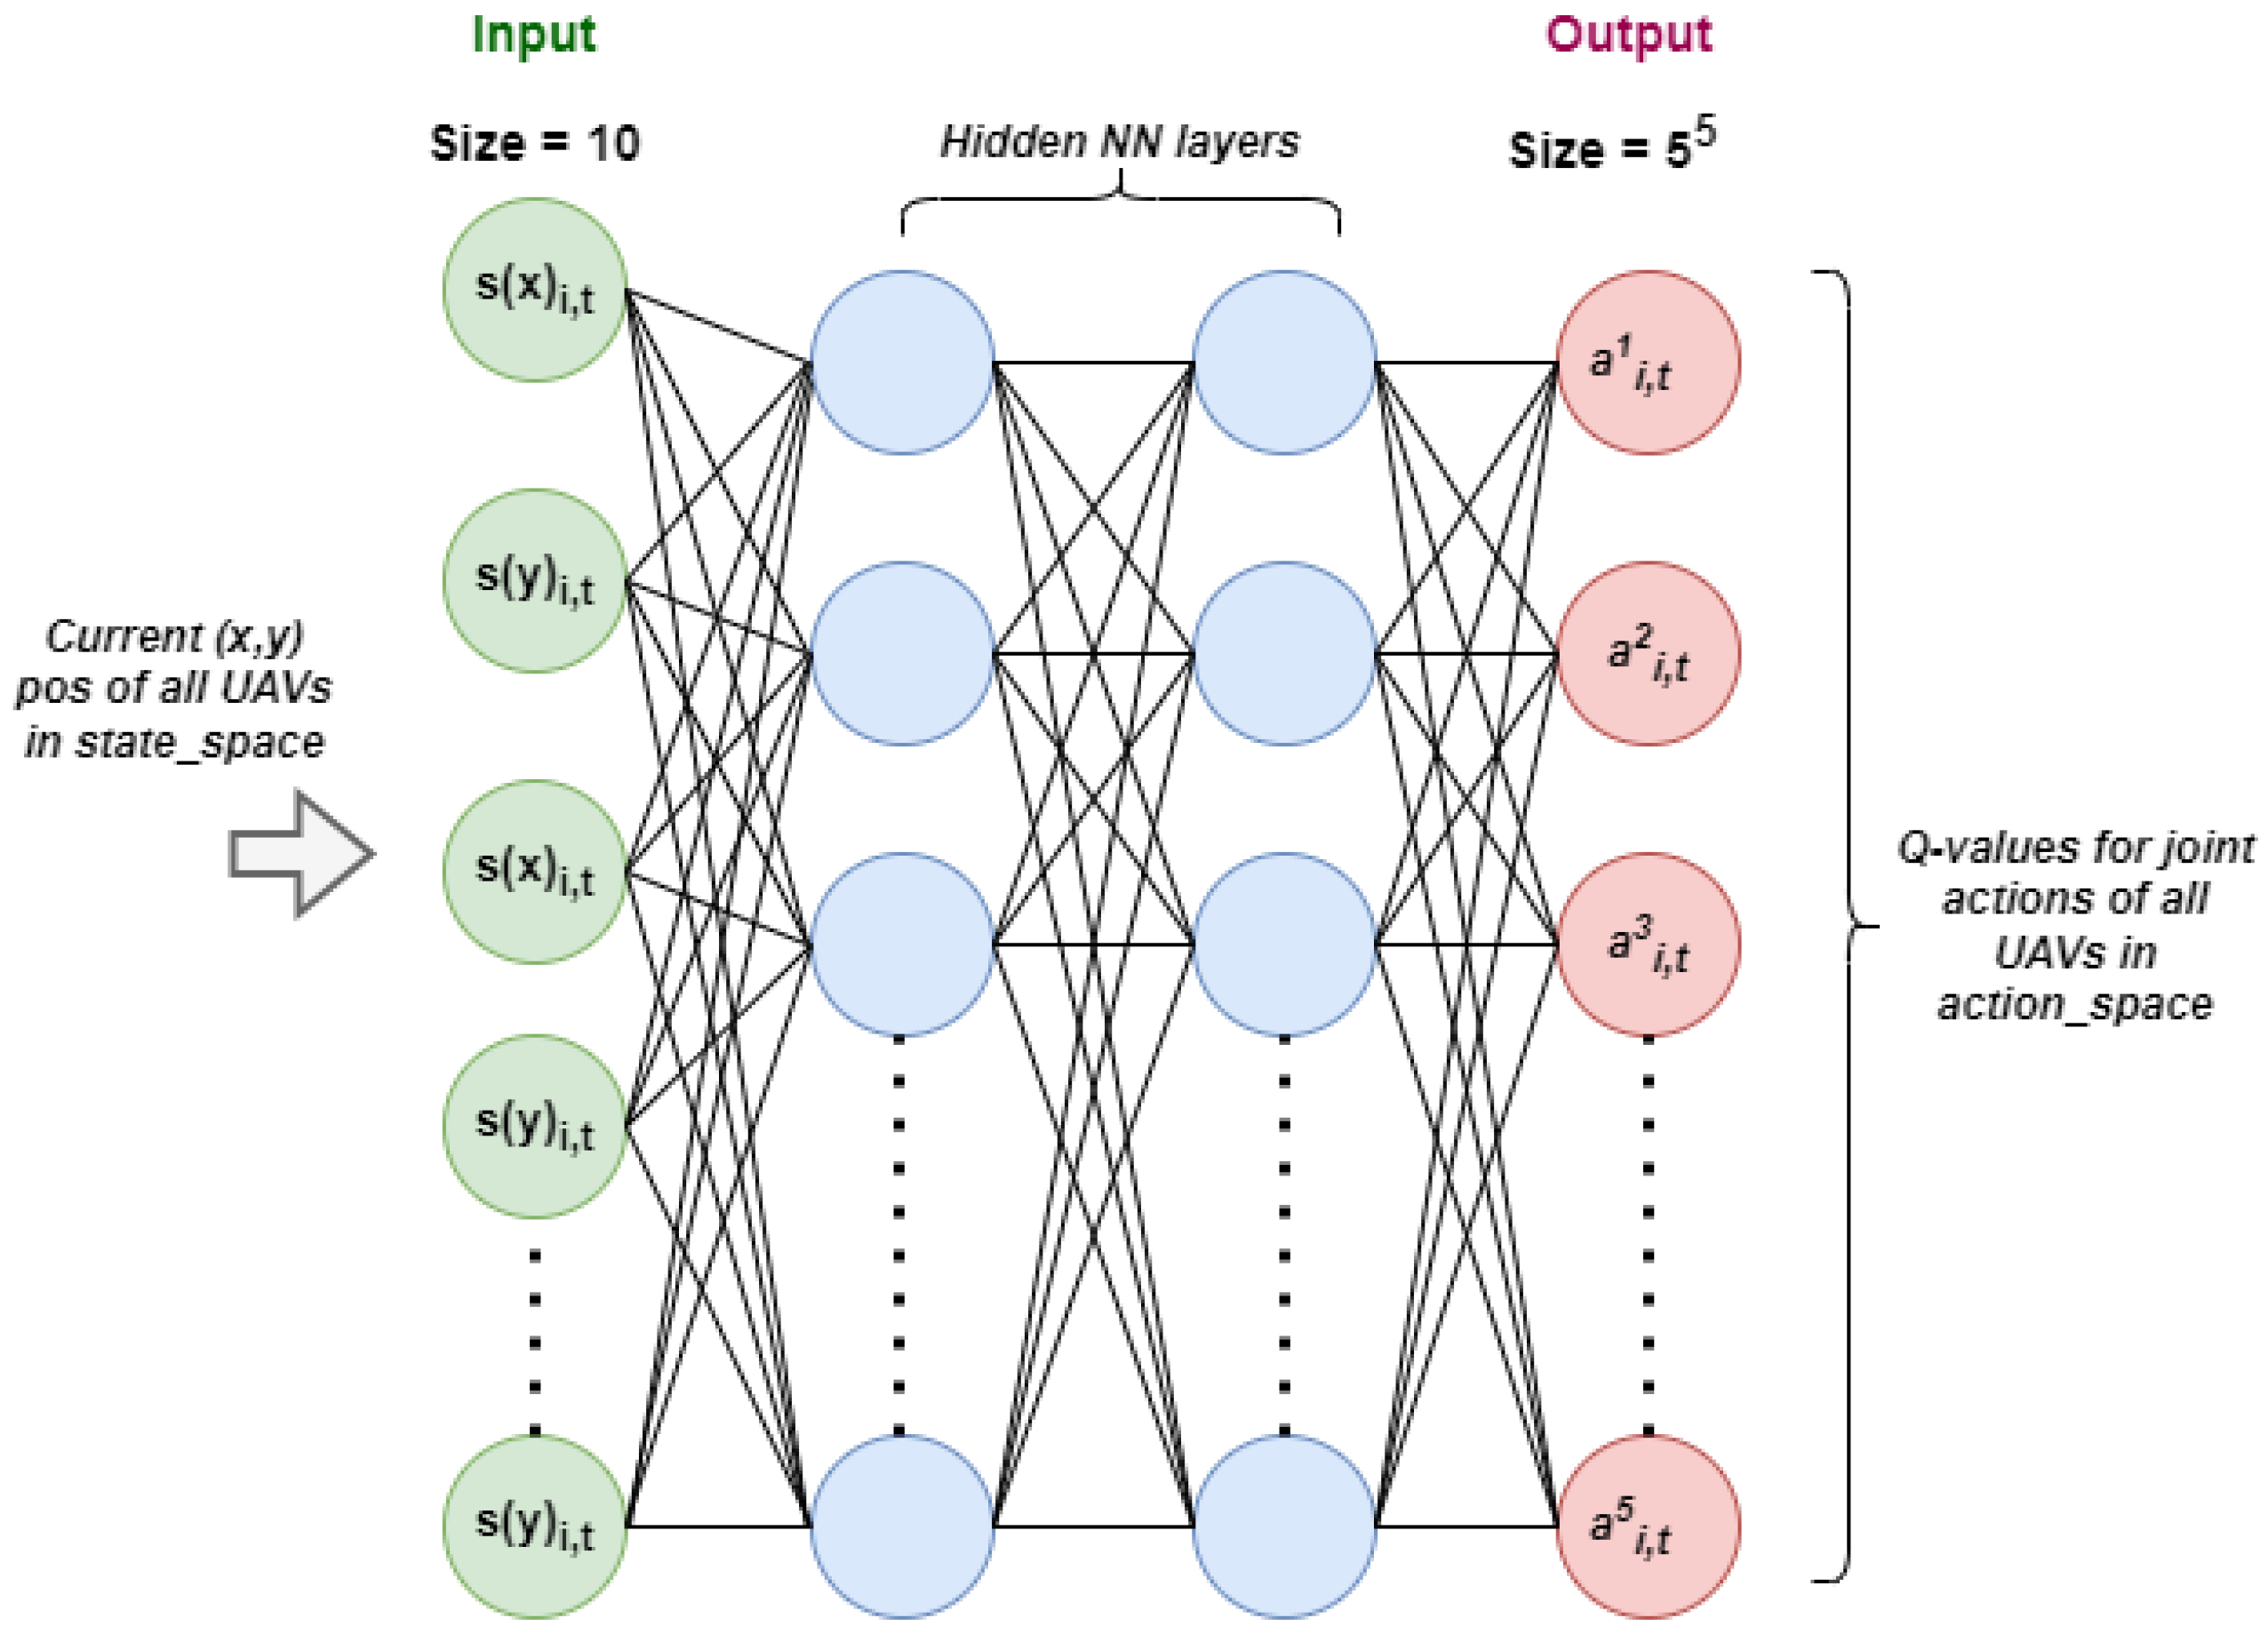
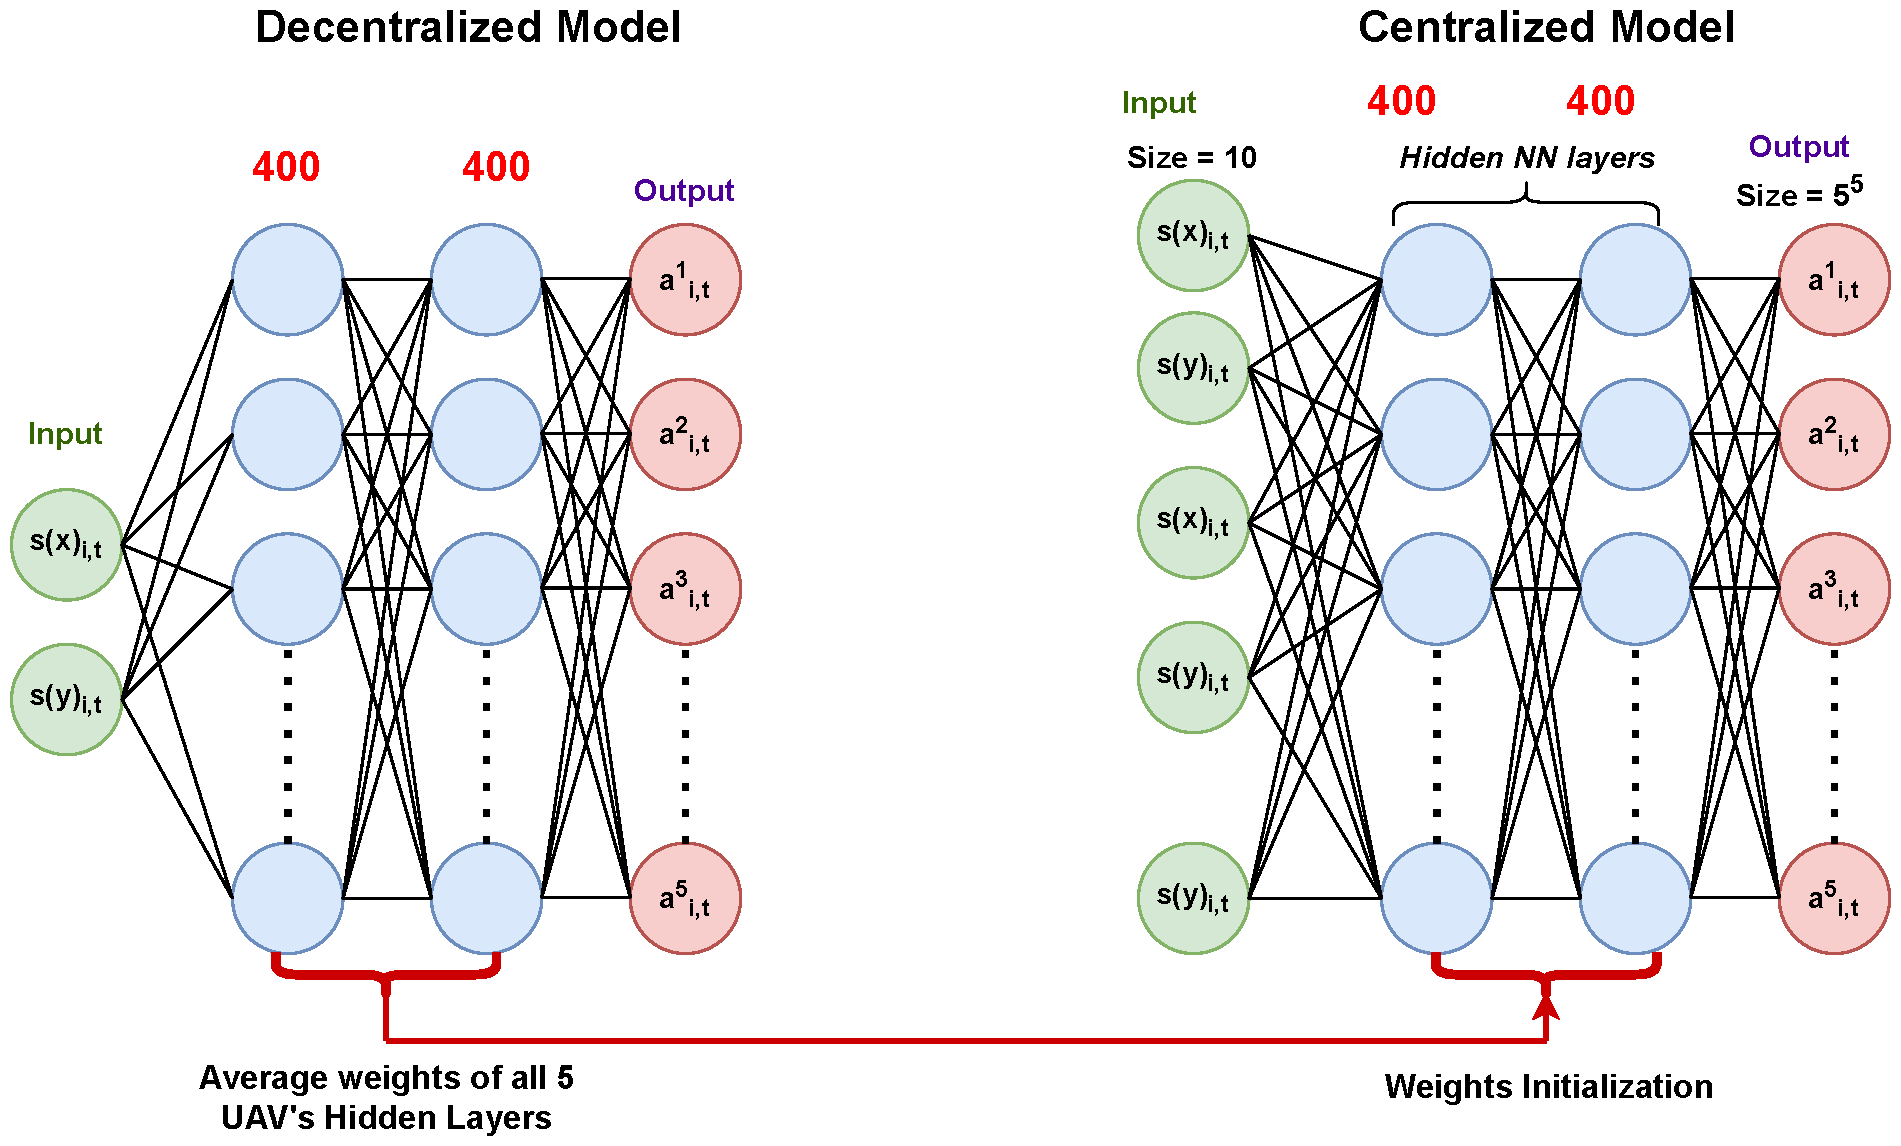
The centralized deep neural network is responsible for the calculation of the Q values for the joint action. This is shown in Algorithm 5. The neural network in the multi-agent approach is computationally easy as the input dimension and output dimension of the neural network are not large. However, in the centralized approach, the input dimension of the neural network depends on the total number of UAVs employed in the environment. The output dimension of both the network grows larger in accordance with the number of actions and number of added UAVs. This neural network structure is used in both the main network and the target network of the centralized algorithm. The centralized neural network structure is shown in
Figure 20.
| Algorithm 5 Training centralized DQN for UAV |
| 1: | Initialize replay buffer , centralized action-value function Q with weights , and target action-value function with weights |
| 2: | for each training iteration do |
| 3: | Sample minibatch of transitions from |
| 4: | Set |
| 5: | Perform a gradient descent step on with respect to |
| 6: | Every C steps reset to Q: |
| 7: | end for |
7.3. Main Network
The main network is responsible for decision-making using the Q values, which determine the best joint action to take. The dimension of the input layer corresponds to the state space. For example, if there are five UAVs in the environment and each UAV has two coordinates, then the dimension of the state space would be , which is 10. This would provide the input dimension of the main network and output the Q values for the joint action. If there are k different actions, then the dimensions of the output layer would be . That means if there were five UAVs and five actions for each UAV, then the output dimension of the neural network would be . This is a very large value compared to the output of the multi-agent network.
7.4. Target Network
The target network has the same architecture as the main network. The target network is used in the calculation of the target Q values for combined joint action for the next state. This sets a target value for the main network, which is used in the calculation of loss function. The error is the measure of the difference between the expected cumulative reward for the joint action and the current cumulative reward after taking the current joint action. The target Q value is calculated as
where
is the current global state,
is the joint action taken by all UAVs,
is the immediate reward received after taking action
in state
,
is the next global state resulting from action
,
is the discount factor, and
is the Q value predicted by the target network for the next state and all possible joint actions. The training of the centralized neural network is shown in Algorithm 5.
7.5. Epsilon Greedy Policy
Similar to multi-agent deep Q learning, the centralized approach uses an epsilon greedy policy to determine the joint action to be taken. The difference here is that the central controller uses a single epsilon greedy policy to determine whether the exploration or exploitation strategy is to be used at each time step. If the epsilon value is greater than the generated random number, then the agent chooses exploration; if the value of is lower, the agent is prompted to choose the action with the highest Q value, as shown in Algorithm 2.
7.6. Reward Function
In centralized algorithm the reward is based on the total number of users covered by all the UAVs. Instead of assigning a reward and penalty to each individual UAV, we assign a cumulative reward combining all the UAVs, and the penalties are assigned based on the violation conditions. The centralized reward function is shown in Algorithm 6.
| Algorithm 6 Reward calculation for the centralized approach |
| 1: | Input: , number of UAVs M, penalty_flag |
| 2: | |
| 3: | for k from 0 to do |
| 4: | if = 1 then |
| 5: | ▹ Penalty for boundary exceedance |
| 6: | end if |
| 7: | end for |
| 8: | Output: reward |
7.7. Training of the Decentralized Model
The five decentralized models in the multi-agent deep Q network are first trained separately, with a separate neural network controlling each model. The decentralized model architecture has an input layer of size 2, two hidden layers with 400 neurons each and ReLU activation functions, and an output layer of size 5.
After training the decentralized models, neural network weights are saved individually and the averages of the saved decentralized model weights for each compatible layer are computed. In this case, the compatible layers are the hidden layers of the neural network. As their dimensions are different from the centralized models, the input and output layers of the neural network are incompatible.
7.8. Initialization of the Centralized Model
In the centralized model, the weights of each individual decentralized neural network are initialized into a central neural network, which then trains the neural network. This is shown in
Figure 21. The centralized neural network architecture has an input layer of size 10, two hidden layers with 400 neurons each and ReLU activation functions, and an output layer of size 3125.
In order to initialize the centralized model, we updated the state dictionary containing the weights of the centralized neural network with the average weights of the decentralized neural network. The centralized neural network’s hidden layer structure contains similarities to the decentralized neural network’s weight structure. Therefore, these layers were compatible. We calculated and set the weights of the various decentralized neural networks as the average for the centralized model. After training the decentralized models, each weight of the neural network was saved. The averages of the saved decentralized model weights for the compatible layers were then computed. The layers of the neural network that were compatible in this case were its hidden layers. As the dimensions of the input and output layers of neural networks are different from those of the centralized model, they cannot be initialized.
7.9. Centralized DQL Results
Table 4 describes the simulation parameters used in the centralized approach.
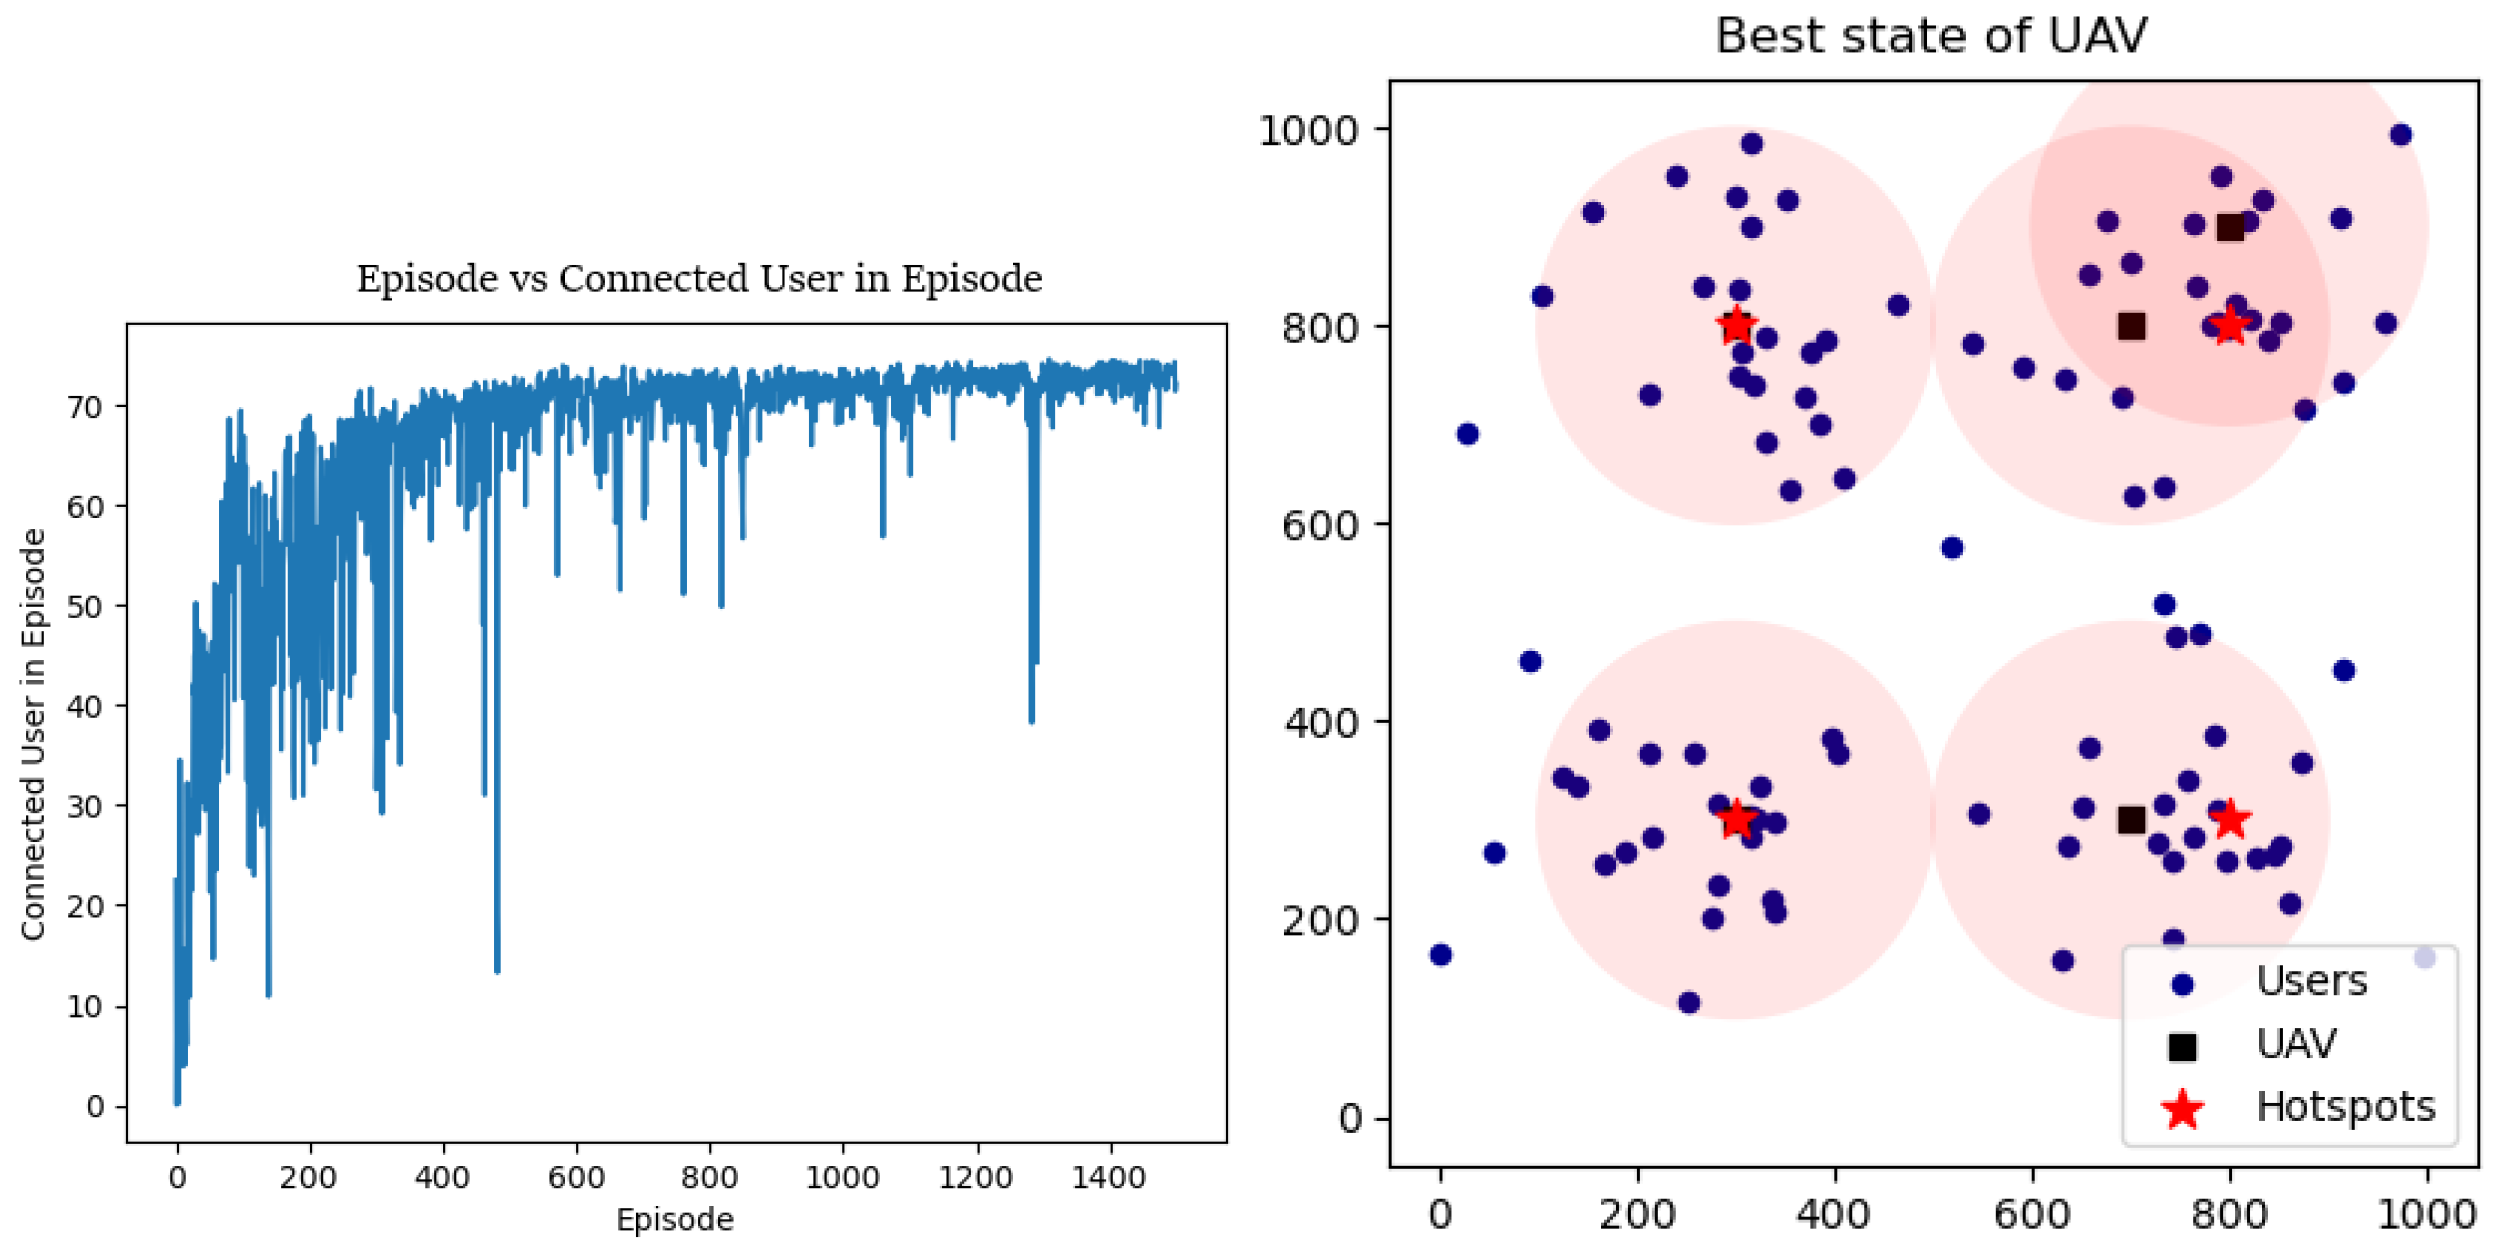
Figure 22 (left) presents the trend of episode vs. the connected user in episodes obtained from the centralized learning algorithm. This graph highlights the smoothed short-term fluctuations and highlights the long-term trends. Initially, the learning graph increases rapidly, representing the learning process, and after approximately 600 episodes, the algorithm stabilizes and shows convergence towards the optimal policy. This depicts the trial-and-error nature of the learning process where, despite these fluctuations, the algorithm shows an upward trend and convergence.
Figure 22 (right) shows the best state of all the UAVs in the centralized approach. Here, the red circles denote the coverage radius of each UAV and the users that fall under the coverage radius of an UAV are considered for connection with that particular UAV depending upon the constraints of the UAV.
7.10. Neural Network Initialization
The performance of the centralized algorithm with the hidden neural network layers initialized using the weights of decentralized network is similar to that of the centralized algorithm. A major difference, however, is the time required for the model to learn the policy. As the centralized neural network is large, it requires extensive training and tuning of the hyper-parameters. The layers of the neural network and the learning rate are directly related to the improved outcomes obtained by the model. Therefore, both the centralized and the decentralized neural network layers must be compatible in order to initialize the weights. In the current case, we have hidden neural network layers of the same size with a similar number of nodes. If we change any one of the neural network layers during the tuning process, it would be not compatible for the initialization, and this approach would not be effective. The previous centralized algorithm had a runtime of 157 min, while the initialization approach took 63 min to run the centralized algorithm with the initialized weights. If we consider the total runtime, including the decentralized network training, the combined runtime is 125 min. The results show that the initialization of the hidden layers in the centralized neural network was helpful and did not degrade the performance; instead, the learning process stabilized faster even if the learning rate was increased.
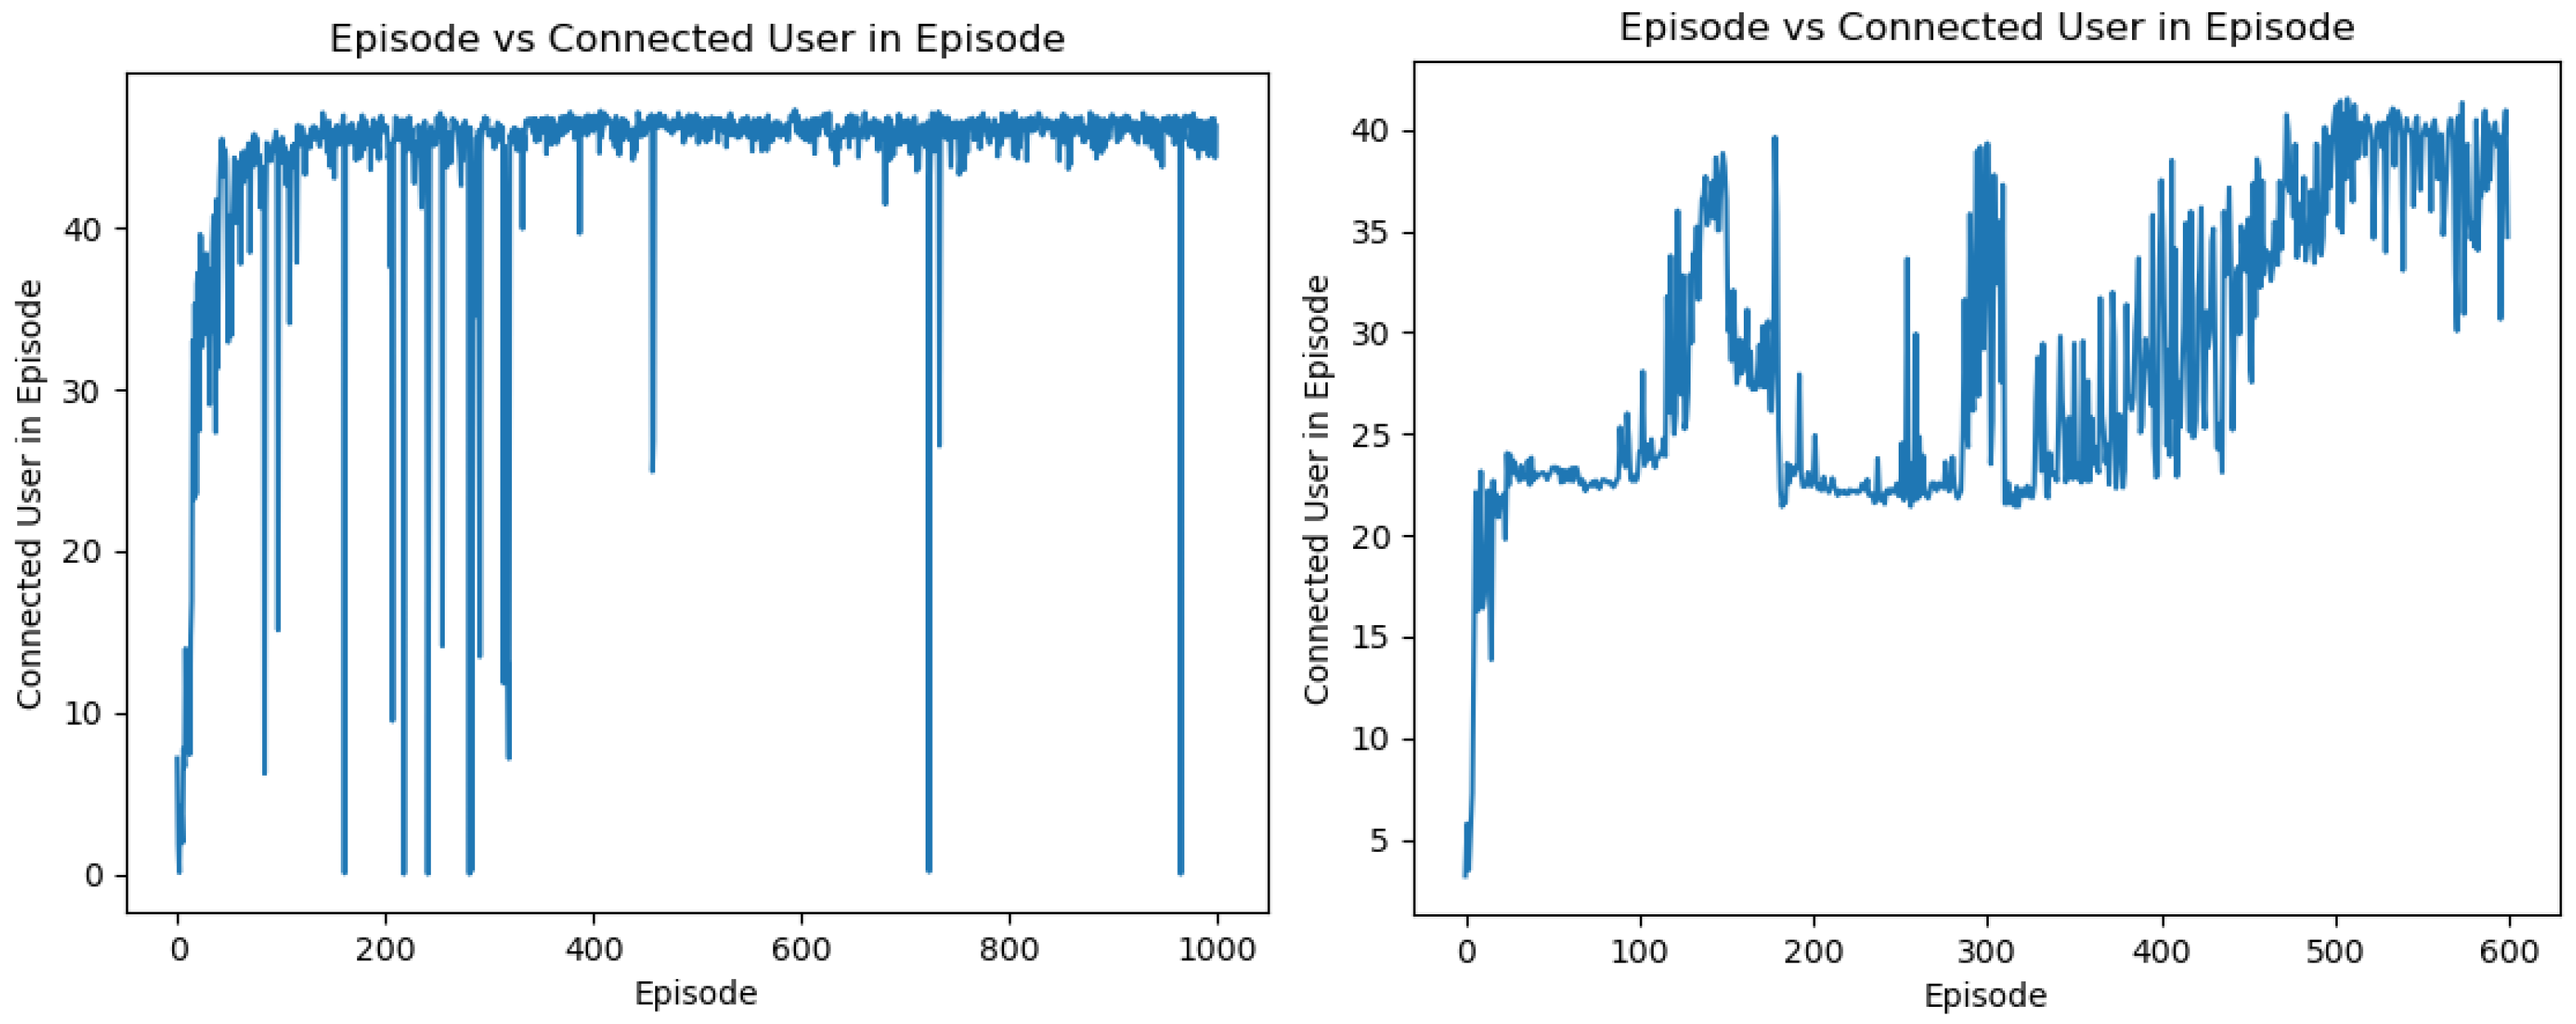
Figure 23 shows the output of the centralized and decentralized neural network in a small-scale problem. This particular output shows that the centralized UAV algorithm performs better when the problem is not large. As the problem becomes larger, the data involved increase and this causes the algorithm to learn slower and take a longer time to achieve a better performance. Here, the output of the centralized algorithm shows a smooth learning process, whereas the decentralized algorithm shows a rough learning curve. One of the main reasons for this is because the learning rate employed in the decentralized network is updating faster. Compared to the five-UAV scenario, three UAVs provide a better outcome, with a higher learning rate. Due to this, even if there were some initial spikes in the learning, after a few episodes, the learning stabilizes. The final best outcome of the centralized algorithm covers 54 users of a total user count of 60, and the outcome of the decentralized algorithm was 48 covered users. This shows that the centralized algorithm performs better than the decentralized algorithm for smaller-scale scenarios.
7.11. Comparison with Decentralized Approach
The centralized approach, while effective for smaller networks, faces increasing computational complexity as the number of UAVs and users grows due to the exponential expansion of the joint state and action spaces. In contrast, the decentralized approach distributes the computational load across individual UAVs, which allows it to scale more gracefully in larger networks. Although decentralized systems may encounter challenges with inter-agent coordination as the network size increases, our simulation results demonstrate that they maintain a robust performance and adaptability even with higher numbers of UAVs and users. Thus, our work provides a clear trade-off: centralized methods can offer optimal coordination in limited scenarios, whereas decentralized methods are more suitable for large-scale, dynamic environments.
8. Conclusions
To summarize, this paper advanced the cause of improving user connectivity in ad hoc communication networks by strategically deploying UAVs under the control of a multi-agent and centralized deep Q-learning framework. The robustness of the suggested approach is demonstrated through the creation of a simple algorithm for policy-training in stochastic settings and the thorough testing of that algorithm over a range of environmental distributions. Furthermore, the empirical analysis of policy adaptation under various distributions confirms the taught policy’s adaptability and robustness. This paper also focused on instances in which jamming attacks result in a considerable reduction in total user coverage rate. Under such adverse conditions, we created an algorithm that adjusts the placements of UAVs that are not impacted by jamming while in service. The main goal of this algorithm is to optimize user coverage by reallocating UAVs to keep as many ground users connected as is feasible during instances of jamming. This method significantly mitigates the negative consequences of jamming assaults by guaranteeing that the network can adapt and respond to disturbances, hence increasing the overall system’s resilience and reliability. This work establishes a baseline for the flexibility of UAV network rules in the dynamic conditions of real-world situations, laying the groundwork for further research in this field. The practical implementation of multi-agent reinforcement learning algorithms for UAV base stations presents a variety of additional challenges. UAV flight time, for instance, is limited by battery capacity, making efficient energy management and optimized trajectory planning essential in real-world deployments. Moreover, limited memory and computational abilities present practical challenges in UAV base station deployment, which are interesting challenges for future work.
