Article

AI-Driven UAV and IoT Traffic Optimization: Large Language Models for Congestion and Emission Reduction in Smart Cities

1
Escuela Técnica Superior de Ingeniería (ICAI), Universidad Pontificia Comillas, 28015 Madrid, Spain
2
Shiley-Marcos School of Engineering, University of San Diego, San Diego, CA 92110, USA
3
Department of Computer Applications in Science & Engineering, BARCELONA Supercomputing Center, 08034 Barcelona, Spain
4
Estudis d’Informàtica, Multimèdia i Telecomunicació, Universitat Oberta de Catalunya, 08018 Barcelona, Spain
5
Departamento de Informática e Ingeniería de Sistemas, Universidad de Zaragoza, 50009 Zaragoza, Spain
6
Departamento de Informática de Sistemas y Computadores, Universitat Politècnica de València, 46022 València, Spain
*
Author to whom correspondence should be addressed.
Drones 2025, 9(4), 248; https://doi.org/10.3390/drones9040248
Submission received: 3 March 2025 / Revised: 21 March 2025 / Accepted: 25 March 2025 / Published: 26 March 2025

Abstract

:
Traffic congestion and carbon emissions remain pressing challenges in urban mobility. This study explores the integration of UAV (drone)-based monitoring systems and IoT sensors, modeled as induction loops, with Large Language Models (LLMs) to optimize traffic flow. Using the SUMO simulator, we conducted experiments in three urban scenarios: Pacific Beach and Coronado in San Diego, and Argüelles in Madrid. A Gemini-2.0-Flash experimental LLM was interfaced with the simulation to dynamically adjust vehicle speeds based on real-time traffic conditions. Comparative results indicate that the AI-assisted approach significantly reduces congestion and CO2 emissions compared to a baseline simulation without AI intervention. This research highlights the potential of UAV-enhanced IoT frameworks for adaptive, scalable traffic management, aligning with the future of drone-assisted urban mobility solutions.

1. Introduction

Urban mobility faces increasing challenges due to rising traffic congestion and environmental concerns. As cities expand, the demand for efficient transportation systems has led researchers to explore novel approaches to traffic management [1,2]. Traditional traffic control systems rely on pre-programmed signal timings and rule-based approaches that struggle to adapt to dynamic, high-density urban environments. In contrast, Artificial-Intelligence (AI)-driven traffic optimization has emerged as a promising alternative, leveraging real-time data to make intelligent decisions that improve traffic flow and reduce emissions [3,4].
A critical component of modern traffic management is the integration of Internet of Things (IoT) sensors, including induction loops and drone-based monitoring systems. These sensors provide continuous, high-resolution data on vehicle movement, congestion levels, and environmental conditions, enabling real-time intervention strategies. However, effectively processing and utilizing this vast stream of data remains a significant challenge. Large Language Models (LLMs) [5] have demonstrated remarkable capabilities in pattern recognition, predictive modeling, and decision-making in complex environments. By interfacing LLMs with IoT-enabled traffic control systems [6], urban planners can implement dynamic, AI-driven traffic management strategies that optimize vehicle flow and minimize environmental impact.
This study explores the potential of LLM-assisted traffic optimization using the SUMO (Simulation of Urban MObility) simulator. We model IoT sensors—specifically induction-loop detectors—as either stationary roadside devices or, as an illustration, simplified aerial drone-based monitors operating within a designated perimeter. The AI model, implemented through the Gemini-2.0-Flash experimental LLM, processes real-time traffic data to generate adaptive speed recommendations, which are then applied dynamically to optimize traffic flow. The effectiveness of this approach is evaluated across three distinct urban scenarios: Pacific Beach and Coronado in San Diego, and Argüelles in Madrid.
Our experimental results demonstrate that the AI-driven approach significantly reduces both congestion and CO2 emissions compared to traditional, non-AI traffic control methods. These findings highlight the potential of LLM-enhanced IoT frameworks for scalable and adaptive traffic management, offering a viable solution for modern smart cities. Furthermore, the inclusion of drone-based monitoring systems presents a promising avenue for autonomous traffic surveillance and control, aligning with future advancements in intelligent transportation networks.
Traditional traffic monitoring relies on ground-based IoT sensors. However, these systems have inherent limitations, including fixed coverage areas, data latency, and infrastructure constraints. Recent advancements in Unmanned Aerial Vehicles (UAVs) [7,8,9] provide a promising alternative for real-time, high-resolution traffic monitoring.
UAV-based traffic monitoring offers the following advantages:
  • Wide-area coverage: Unlike ground-based sensors, UAVs can monitor multiple road segments simultaneously.
  • Real-time congestion assessment: UAVs capture dynamic traffic patterns, including bottlenecks and queue formations.
  • Enhanced AI input: Aerial imagery provides additional traffic state variables (e.g., lane density, vehicle trajectory prediction), which can be fused with IoT sensor data in the LLM prompt.
In this study, we model UAV-based monitoring as an extension of induction-loop data. While the simulation primarily incorporates sensor data as a proof of concept, the methodology is designed to be directly applicable to UAV-based traffic surveillance systems. Future extensions could incorporate real-world drone footage processed through the extended vision capabilities of LLMs, adding camera data in addition to the textual sensor information in the prompt, or with on-device Visual Language Models (VLMs) [10,11] for AI-assisted congestion management.
The remainder of this paper is structured as follows: Section 2 reviews related work in AI-driven traffic optimization and IoT-based monitoring. Section 3 describes the simulation setup, AI integration, and experimental scenarios. Section 4 presents the results, comparing AI-assisted and conventional traffic management. In Section 5, we provide computational costs and scalability analysis of the proposed method. Finally, Section 6 and Section 7 discuss implications, limitations, and potential future research directions.

2. Related Work

Traffic optimization has been a long-standing research focus in urban planning and Intelligent Transportation Systems (ITSs). Traditional approaches rely on rule-based traffic signal control, adaptive signal timing [12], and vehicle-actuated traffic lights [13]. However, these methods often fail to adapt effectively to dynamic and high-density environments, leading to congestion and increased fuel consumption.
Recent advancements in Artificial Intelligence (AI) have facilitated data-driven traffic control strategies. Reinforcement Learning (RL) has been extensively explored for optimizing traffic light control [14,15], with models learning to adapt signal timings based on real-time traffic flow. Additionally, deep-learning techniques have been employed, among a wide range of applications [1], to predict traffic congestion patterns [16], allowing for preemptive interventions.
The use of Large Language Models (LLMs) [5,17] for traffic optimization is an emerging field. While traditional AI models require structured numerical input, LLMs can process heterogeneous data sources, including real-time traffic reports, sensor data, and external environmental conditions. Prior studies have shown that AI-enhanced decision-making can lead to reduced congestion and improved traffic flow [18,19]. However, their direct application in large-scale urban simulations, particularly in the context of IoT-integrated traffic control, is being developed.
The integration of Internet of Things (IoT) sensors in traffic management has gained traction, with induction-loop detectors, CCTV cameras, and GPS-based tracking being widely utilized for data collection [20,21]. Recent research has investigated the deployment of drone-assisted traffic monitoring [22,23], leveraging aerial perspectives to gather real-time congestion metrics and detect anomalies [2].
IoT-based traffic monitoring has been successfully implemented in smart city initiatives [24,25], such as connected vehicle networks and adaptive road infrastructure [26]. However, despite their advantages, these systems generate vast amounts of data that require efficient real-time processing. Traditional processing frameworks struggle with high-latency decision-making, making AI-powered solutions—such as LLMs—critical for scalable and efficient traffic management [27,28].
The Simulation of Urban MObility (SUMO) is a widely used open-source tool for microscopic and macroscopic traffic simulations [29,30,31]. It allows for accurate modeling of vehicular behavior, congestion patterns, and environmental impacts. Several studies have incorporated AI-based optimization models within SUMO, demonstrating their effectiveness in traffic signal coordination [32] and autonomous vehicle interactions [33,34].
Speed adaptation is a critical aspect of traffic optimization, particularly in autonomous and connected vehicle systems. Early models focused on rule-based speed adaptation strategies [35,36], where vehicles adjust speed based on predefined conditions such as traffic signals, speed limits, and inter-vehicle spacing. These methods, while computationally efficient, lack the flexibility to handle complex and dynamic traffic conditions.
Optimization-based approaches have been explored in the literature, including Model Predictive Control (MPC) [37], which formulates speed control as a constrained optimization problem solved in real time. Such methods allow vehicles to predict and adjust speed based on expected traffic conditions while minimizing fuel consumption and travel time.
AI techniques have also been applied to adaptive speed control. Reinforcement-Learning (RL) models have demonstrated the ability to optimize speed decisions dynamically based on real-time traffic data [38], reducing congestion and emissions. Specifically, deep RL methods [39] have shown promising results in optimizing vehicle speed in mixed traffic environments involving both autonomous and human-driven vehicles.
The emergence of Connected and Autonomous Vehicles (CAVs) [40] has introduced new paradigms in speed control through Vehicle-to-Everything (V2X) communication. Studies have shown that speed harmonization using CAVs can improve traffic flow efficiency and safety [41,42], particularly in highway scenarios. However, real-world deployment faces challenges such as latency in V2X communication and mixed-fleet interactions with non-autonomous vehicles.
Drone-based monitoring [26,43] offers advantages such as real-time adaptability and high spatial resolution. However, it introduces unique challenges compared to conventional speed adaptation methods:
  • Image Processing Complexity: Extracting congestion metrics from UAV imagery requires object detection and computer-vision techniques.
  • Measurement Error and Environmental Constraints: UAV observations may be affected by occlusion (e.g., buildings obstructing vehicle visibility), lighting conditions, and camera resolution.
  • Real-time Data Transmission: Unlike induction loops that provide direct occupancy values, UAVs require high-bandwidth data links for real-time image processing.
  • Battery and Flight Time Limitations: Most UAVs have limited operational endurance, requiring frequent battery replacements or recharging.
Despite these limitations, UAV-based monitoring can complement IoT sensors by providing instantaneous congestion snapshots, which traditional ground-based sensors may not capture. Several studies have highlighted the potential for multi-modal sensor fusion, where UAV imagery and IoT sensor data are integrated to improve real-time traffic control [44,45].
However, the combination of LLMs, IoT sensors, and SUMO-based simulations remains relatively underexplored [4,6]. Existing previous works have primarily focused on rule-based interventions [46] or reinforcement-learning models [3,47,48], whereas our study introduces an innovative framework where an LLM interfaces with SUMO in real-time programmatically to generate adaptive speed recommendations [49]. This novel integration bridges the gap between AI-driven decision-making and real-world traffic monitoring technologies, also referred to as the Artificial Intelligence of Things (AIoT) [50,51,52].

Contributions of This Study

While previous studies have investigated AI-based traffic optimization, IoT-enabled monitoring, and SUMO simulations separately, our study uniquely combines these elements into a unified framework. The key contributions of this work are as follows:
  • A novel AI-driven traffic optimization framework integrating Large Language Models (LLMs) with IoT-based monitoring (induction loops and drones).
  • Implementation of real-time AI intervention in SUMO, where the LLM dynamically adjusts vehicle speeds based on congestion levels.
  • Experimental evaluation across three urban scenarios: Pacific Beach and Coronado (San Diego) and Argüelles (Madrid).
  • Demonstration of significant congestion and CO2 emission reductions, highlighting the potential of AI-enhanced urban mobility systems.
Our research paves the way for the development of scalable, autonomous traffic control frameworks that integrate LLMs, IoT devices, and drone-based traffic monitoring into real-world smart city applications.

3. Methodology

This section describes the proposed framework for AI-driven traffic optimization, including the integration of Large Language Models (LLMs) with IoT sensors in a SUMO-based traffic simulation. The methodology consists of three main components: (i) traffic data collection using IoT sensors, (ii) real-time AI-based traffic intervention, and (iii) performance evaluation across multiple urban scenarios.

3.1. Traffic Model and IoT Sensor Representation

The traffic system is represented as a directed graph G = ( V , E ) , where:
  • V is the set of intersections (nodes) in the network.
  • E is the set of roads (edges) connecting intersections.
Each road segment e E is characterized by:
e = ( l e , c e , v e )
where:
  • l e is the length of the road segment.
  • c e is the lane capacity, representing the maximum number of vehicles that can be accommodated per unit length.
  • v e ( t ) is the mean vehicle speed at time t for all vehicles traveling along the segment e. Unless stated otherwise, this average is computed as the harmonic mean speed, defined as:
    v e ( t ) = N e ( t ) o = 1 N e ( t ) 1 v o ( t )
    where N e ( t ) is the number of vehicles on segment e at time t, and v o ( t ) is the instantaneous speed of the o-th vehicle. The harmonic mean is chosen as it more accurately represents traffic flow conditions, particularly in congested scenarios.
In the more general case, traffic monitoring can be performed using a combination of ground-based IoT sensors and UAV-based aerial surveillance.
Each UAV-equipped sensor s u reports a congestion metric:
ρ u ( t ) = f ( v u , d u , θ )
where:
  • v u is the mean vehicle velocity measured at the UAV’s observation point or over the designated section u of given length.
  • d u is the vehicle density per lane, calculated as:
    d u ( t ) = N u ( t ) L u
    where N u ( t ) is the number of vehicles observed within the UAV’s coverage area at time t, and L u is the length of the observed road section.
  • θ represents the UAV’s camera angle and resolution, which both influence the precision of vehicle detection.
IoT sensors (such as induction loops or UAV-based monitoring) are deployed at intersections and along road segments to measure real-time congestion. In our experimentation, congestion is computed based on occupancy values reported by induction-loop detectors. These detectors, strategically placed along main roads and intersections, provide real-time vehicle density estimates. The AI model processes these data and generates adaptive speed adjustments to optimize traffic flow in the monitored areas. Each ground-based sensor s o reports the occupancy rate:
ρ o ( t ) = n o ( t ) c o
where:
  • n o ( t ) is the number of vehicles detected at sensor s o at time t.
  • c o is the road capacity at the sensor location, defined as the maximum number of vehicles that can be simultaneously present at the sensor’s detection zone.
Equation (5) serves as a specific implementation of the more general congestion function in Equation (3), where the congestion metric ρ o ( t ) is derived from local sensor occupancy instead of aerial UAV observations. In particular, v u , d u , and θ intervene in Equation (5) implicitly through the estimated occupancy levels, which serve as an alternative congestion representation. If an integrated multi-sensor approach is used, both Equations (3) and (5) can be combined to create a hybrid congestion estimate.
It is important to note that different types of IoT sensors provide varying levels of temporal and spatial granularity. Induction loops, which are widely deployed in urban networks and are used in this work as an illustration of IoT sensors or drone-based monitoring systems, typically report aggregated vehicle counts over fixed time intervals (e.g., 15 min or 1 h) rather than instantaneous snapshots of vehicle presence. This means that, while they are effective for measuring flow trends and estimating average congestion, they do not provide a direct “photo” of real-time road occupancy at any given moment.
To address this limitation, aerial drone-based monitoring systems can complement induction loops by capturing high-resolution, instantaneous traffic states. Drones can provide a more detailed view of vehicle density, detect real-time bottlenecks, and offer richer input data for AI-driven optimizations. By integrating drone imagery analysis with induction-loop data, our framework would enhance the real-time adaptability of traffic control strategies, leveraging both historical flow trends and live vehicle distributions. Future extensions of this work could explore the fusion of these sensor modalities to further improve congestion estimation accuracy and responsiveness.
To effectively integrate the large language model with the SUMO traffic simulation, we designed a comprehensive system architecture that enables real-time data flow and intervention. Figure 1 illustrates the components of our AI-driven traffic optimization framework and their interactions. The architecture consists of six main components: the SUMO traffic simulator that models vehicle movement and emissions; IoT sensors (induction loops serving as proxies for drone-based monitoring) that collect real-time traffic data; the TraCI interface enabling bidirectional communication; the Python control module managing multi-threaded operations; the Gemini-2.0-Flash LLM generating speed recommendations; and the analytics module processing congestion and emission metrics. This integrated approach allows for dynamic speed adjustments based on real-time traffic conditions, with the LLM serving as the decision-making core of the system.
One fundamental aspect of any traffic simulation is defining the vehicle routes and overall traffic demand. In our study, vehicle routes are generated using the DUAROUTER module in SUMO, which assigns routes based on predefined Origin–Destination (OD) matrices and traffic assignment algorithms. The OD matrices represent realistic traffic demand by specifying how many vehicles travel between different entry and exit points in the road network.
To ensure realism, the following methodology was applied:
  • Real-world data sources: Traffic flow data from OpenStreetMap (OSM) and empirical studies were used to define major road usage patterns.
  • Randomized route assignment: Vehicles were assigned routes stochastically based on probability distributions that reflect expected traffic conditions in each scenario. The source of randomness arises from multiple factors:
    User perception of route costs: Drivers may select routes based on subjective assessments of travel time, congestion risk, or familiarity.
    Variability in congestion conditions: Since congestion evolves dynamically, vehicles entering the network at different times may experience different levels of congestion, leading to probabilistic route selection.
    Heterogeneous driver behavior: Individual vehicles may have different routing preferences, including shortest-path, fastest-path, or traffic-avoidance strategies.
    Traffic assignment models: The simulation incorporates stochastic traffic assignment, where vehicles probabilistically choose between multiple feasible routes rather than always selecting the single shortest or fastest path.
  • Dynamic demand variations: The total number of vehicles per simulation step was adjusted dynamically to simulate peak and off-peak conditions, ensuring that the network reflects real-world traffic fluctuations.
The vehicle load at each moment is thus not derived solely from sensor counts but is also influenced by the route generation algorithm. This distinction is critical: while induction loops provide congestion data at specific locations, they do not provide complete vehicle trajectories. Instead, SUMO’s internal routing algorithms, informed by OD matrices and calibrated demand models, ensure that vehicle movements follow plausible traffic patterns across the network.
Additionally, vehicles are classified into different categories (e.g., private cars, buses, and trucks), each with distinct acceleration, deceleration, and lane-changing behaviors. This heterogeneous traffic modeling enhances the realism of the simulation and allows for a more precise evaluation of AI-driven optimizations.
Under the proposed framework, vehicle classification is determined at two levels:
  • Simulation-level classification: In SUMO, vehicles are explicitly assigned categories based on predefined vehicle type definitions. These include parameters such as length, maximum speed, acceleration profile, and emission characteristics. The assignment of vehicle types follows real-world proportions, ensuring a realistic traffic composition.
  • Sensor-based classification: The IoT sensors (induction loops or UAV-based surveillance) provide indirect classification by measuring vehicle length, speed, and occupancy patterns. Induction loops can differentiate between light and heavy vehicles based on their presence duration in the sensor area, while UAV imagery could enhance classification accuracy using computer-vision techniques, detecting vehicle dimensions and shapes in real-time. Future extensions of this work could integrate deep-learning-based vehicle classification models for improved accuracy in drone-assisted monitoring.
By combining data-driven route generation with real-time sensor updates, our framework ensures a realistic yet adaptive representation of urban traffic conditions.

3.2. Scenario Selection and Network Editing in SUMO

To evaluate the effectiveness of AI-driven traffic optimization, we selected three urban scenarios: Pacific Beach and Coronado in San Diego, and Argüelles in Madrid. The selection process involved extracting road network data from OpenStreetMap (OSM) and refining the network using SUMO’s netedit tool.
OpenStreetMap provides detailed road network data, which can be used to simulate realistic traffic conditions in SUMO. The selection process involved the following steps:
  • Location Selection: We identified high-traffic areas in each city where congestion is a known issue.
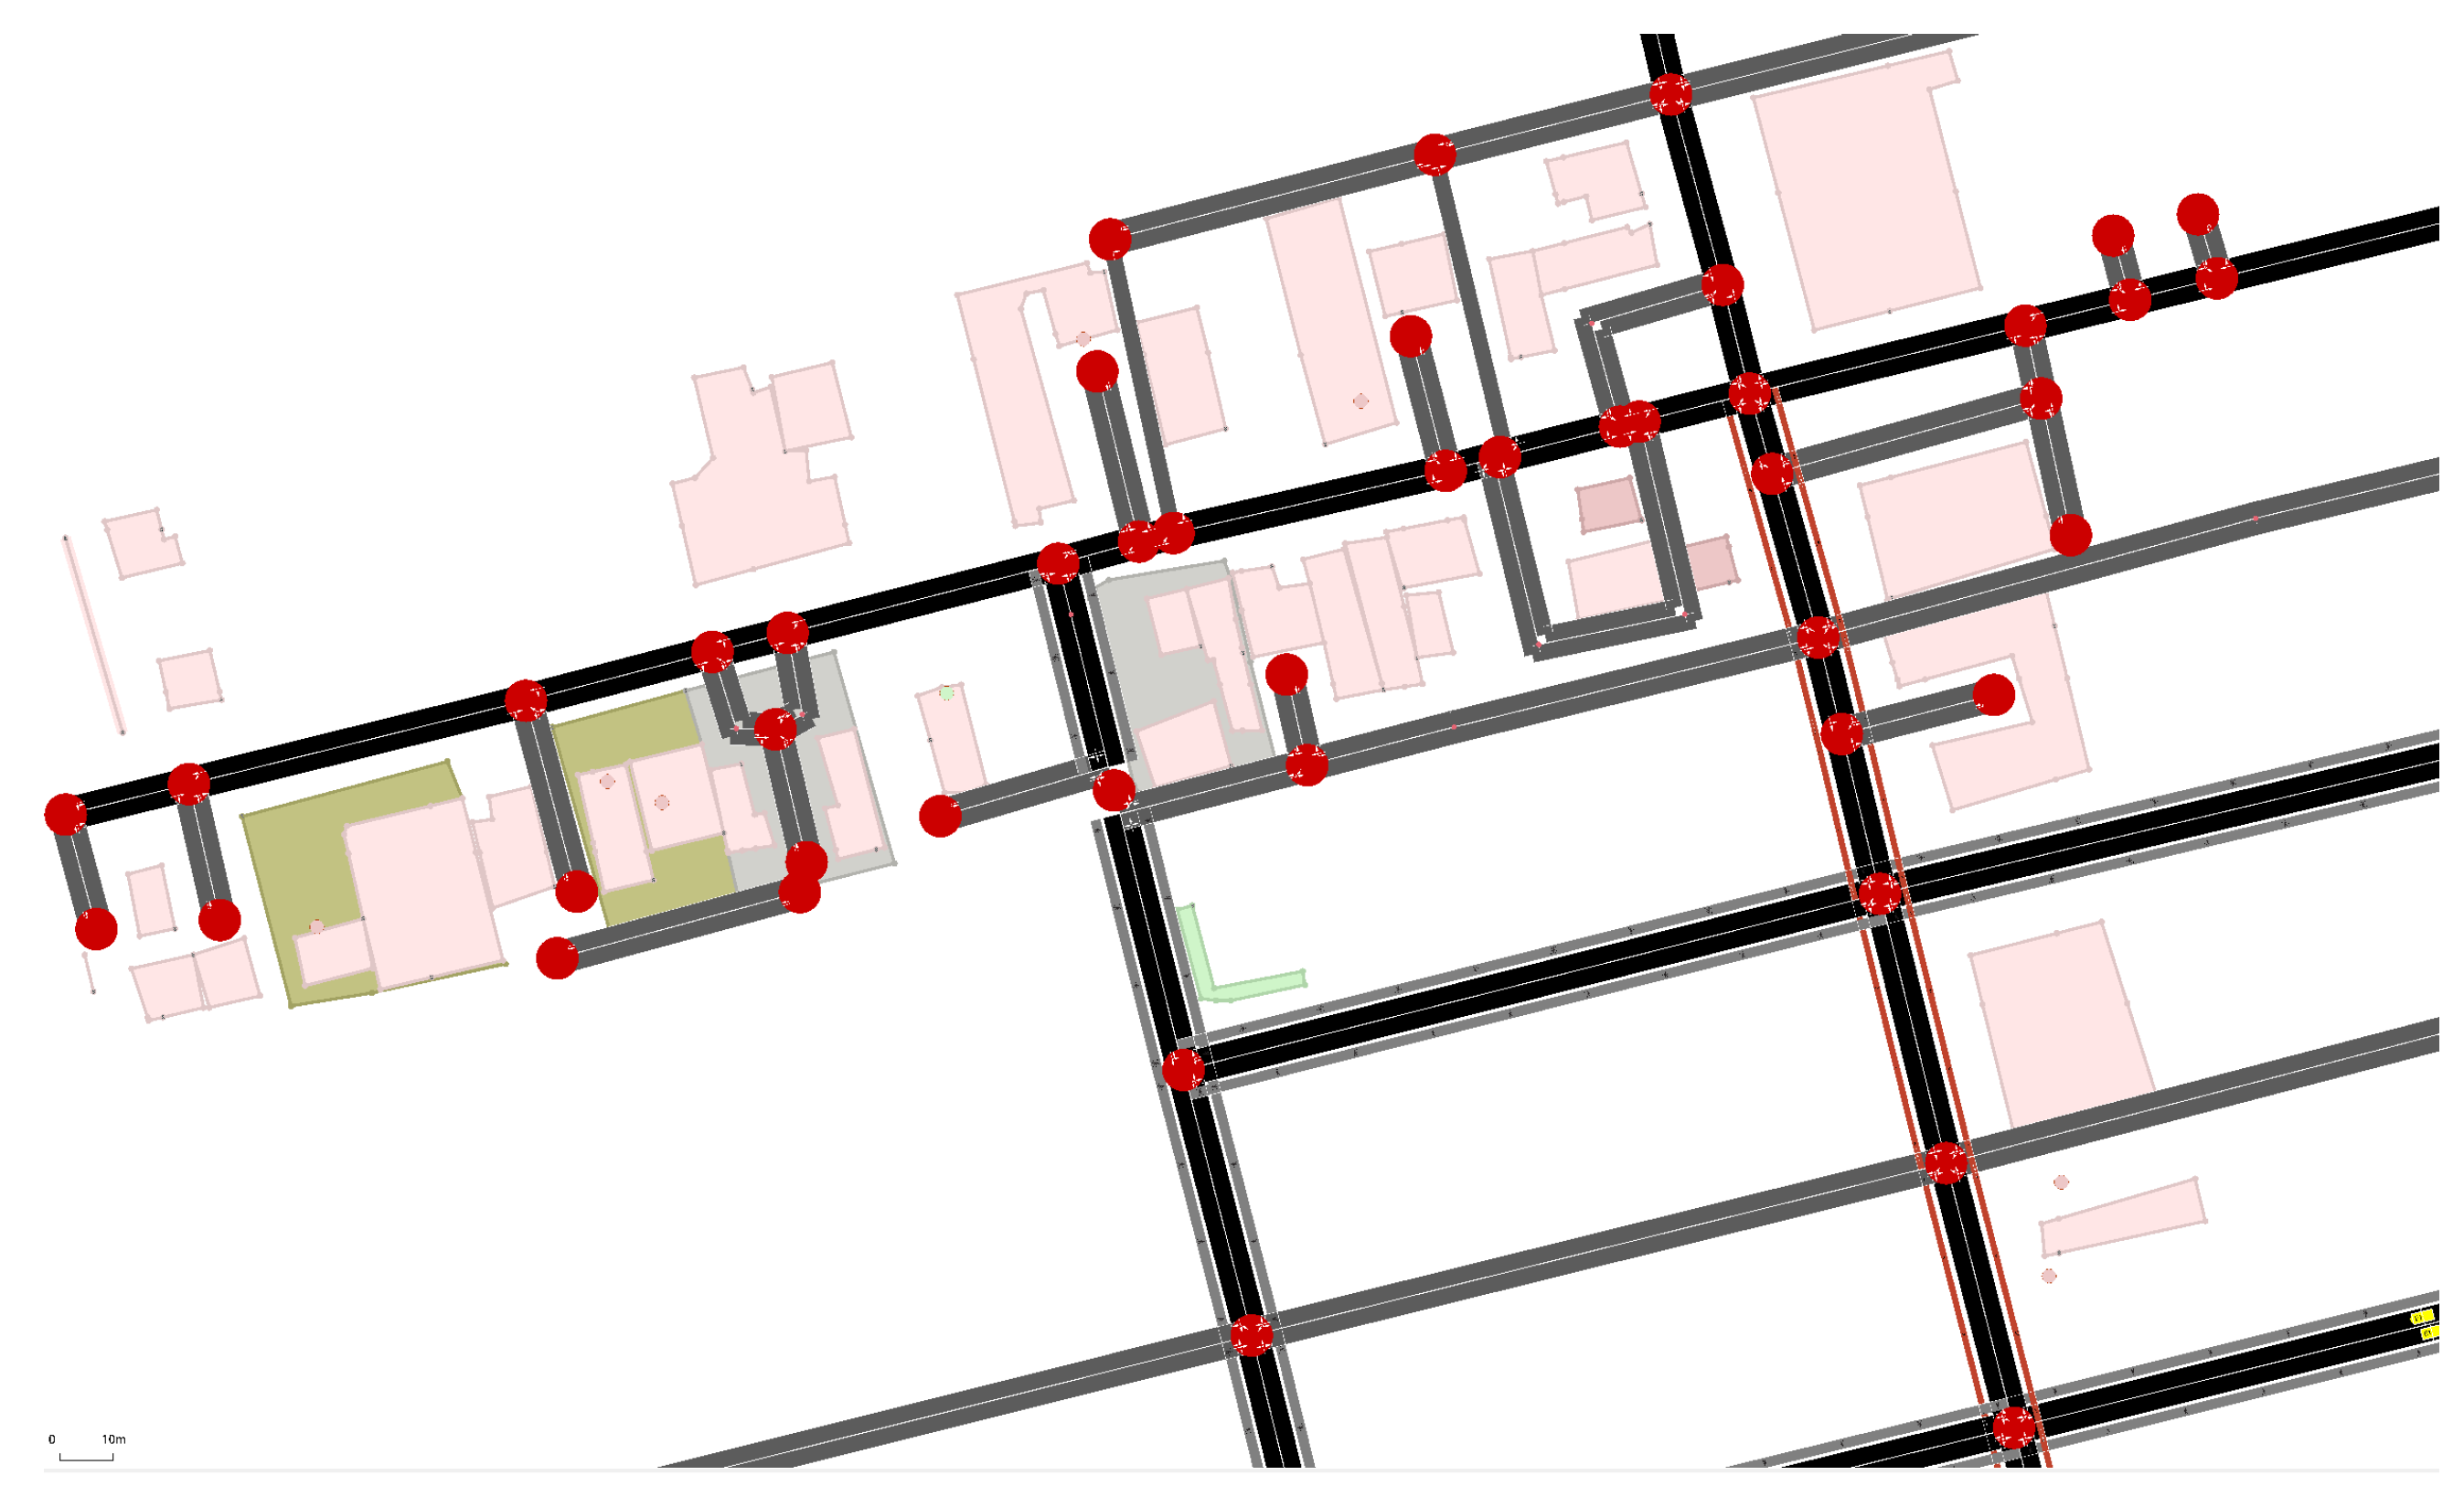
  • Data Extraction: Using SUMO’s osmWebWizard, see Figure 2, we downloaded road network data from OpenStreetMap. This tool allows users to specify a geographic region and automatically converts OSM data into a SUMO-compatible network.
  • Conversion to SUMO Format: The extracted OSM data are converted into an XML-based SUMO network file (.net.xml), which includes information on road types, intersections, lane configurations, and traffic signals.
Once the raw network data are obtained from OpenStreetMap, further modifications are necessary to optimize the traffic simulation. We used netedit, SUMO’s built-in graphical network editor, see Figure 3, to refine and customize the network:
  • Intersection Editing: Adjusting traffic light placements and modifying lane configurations to reflect real-world conditions.
  • Road Modifications: Fine-tuning speed limits, lane connections, and vehicle flow dynamics to match observed traffic behavior.
  • Sensor Placement: Adding induction-loop detectors and defining areas for drone-based monitoring to collect real-time traffic data.
After editing the network, the finalized SUMO configuration was stored in a .net.xml file, ready for use in the simulation environment. The prepared network allows for AI-driven interventions, where real-time traffic data are collected via IoT sensors and processed by the LLM to dynamically adjust vehicle speeds.
The combination of OpenStreetMap data and SUMO’s network editing capabilities enables the creation of highly realistic traffic simulations, providing an effective testbed for evaluating AI-driven urban mobility solutions.

3.3. AI-Driven Traffic Control

The system integrates an LLM to provide adaptive speed recommendations. At every time step t, a traffic state vector x ( t ) is constructed from sensor data:
x ( t ) = [ ρ 1 ( t ) , ρ 2 ( t ) , , ρ N ( t ) , v 1 ( t ) , v 2 ( t ) , , v N ( t ) ]
where N is the total number of sensors.
The state vector x ( t ) represents the global traffic state of the monitored network, aggregating data from multiple road segments rather than a single segment. Each density component ρ o ( t ) corresponds to the real-time congestion level measured by sensor s o , which could be located at intersections or along road segments. Similarly, each speed component v o ( t ) represents the average vehicle speed detected at sensor location s o . Since IoT sensors provide localized measurements, the AI model constructs an aggregated representation of the traffic state by integrating these independent observations across multiple locations in the network.
By structuring the input in this form, the LLM can infer congestion patterns over the entire monitored area and generate adaptive speed adjustments that optimize traffic flow across the network rather than at isolated points. Future extensions of this work could explore a finer-grained state representation by incorporating additional traffic attributes such as lane-level occupancy and vehicle classification.
The LLM-based control policy is formulated as a mapping function:
π θ : x ( t ) v * ( t + 1 )
where π θ represents the LLM parameterized by θ , and v * ( t + 1 ) is the vector of optimal speed adjustments. The control objective is to minimize total congestion:
L ( θ ) = e E ρ e ( t ) + λ e E ( v e * ( t + 1 ) v e ( t ) ) 2
where λ is a regularization term to avoid excessive speed fluctuations.
The relationship between vehicle velocity and traffic density follows fundamental traffic flow dynamics. The density ρ e ( t ) of a given road segment e at time t is influenced by vehicle speeds due to the continuity equation in traffic flow theory:
ρ e ( t ) = q e ( t ) v e ( t )
where q e ( t ) represents the traffic flow rate (vehicles per unit time).
Velocity control directly influences density by modulating the space available per vehicle on a road segment. Increasing vehicle speed v e generally leads to lower density ρ e , as vehicles spread out over a longer distance. Conversely, reducing vehicle speed can increase density when flow remains constant. However, overly aggressive speed reductions can lead to shockwaves, causing instability and stop-and-go congestion.
Thus, in the control formulation, the LLM adjusts v * ( t + 1 ) to balance speed and density, minimizing congestion while ensuring smooth flow. The regularization term λ in L ( θ ) prevents excessive speed fluctuations, which could lead to abrupt density changes that disrupt flow stability.
A fundamental assumption in this study is that vehicles can dynamically adjust their speeds based on external control inputs. While autonomous vehicles would allow for direct speed adjustments via onboard systems, the proposed AI-driven traffic control framework does not strictly require autonomy. Instead, speed recommendations can also be implemented via infrastructure-based enforcement mechanisms, such as adaptive speed limits, variable message signs, or intelligent traffic signals.
This assumption simplifies the implementation of AI-driven traffic control, as speed adjustments can be applied seamlessly across the network, either through direct communication with autonomous vehicles or through centralized infrastructure. In a real-world deployment, such a system would likely integrate Vehicle-to-Everything (V2X) communication, allowing the central controller to broadcast speed recommendations to connected vehicles while simultaneously influencing non-autonomous vehicles through regulatory enforcement. Additionally, compliance with traffic laws and safety constraints would be necessary for deployment at scale.
The AI-based intervention is structured as follows:
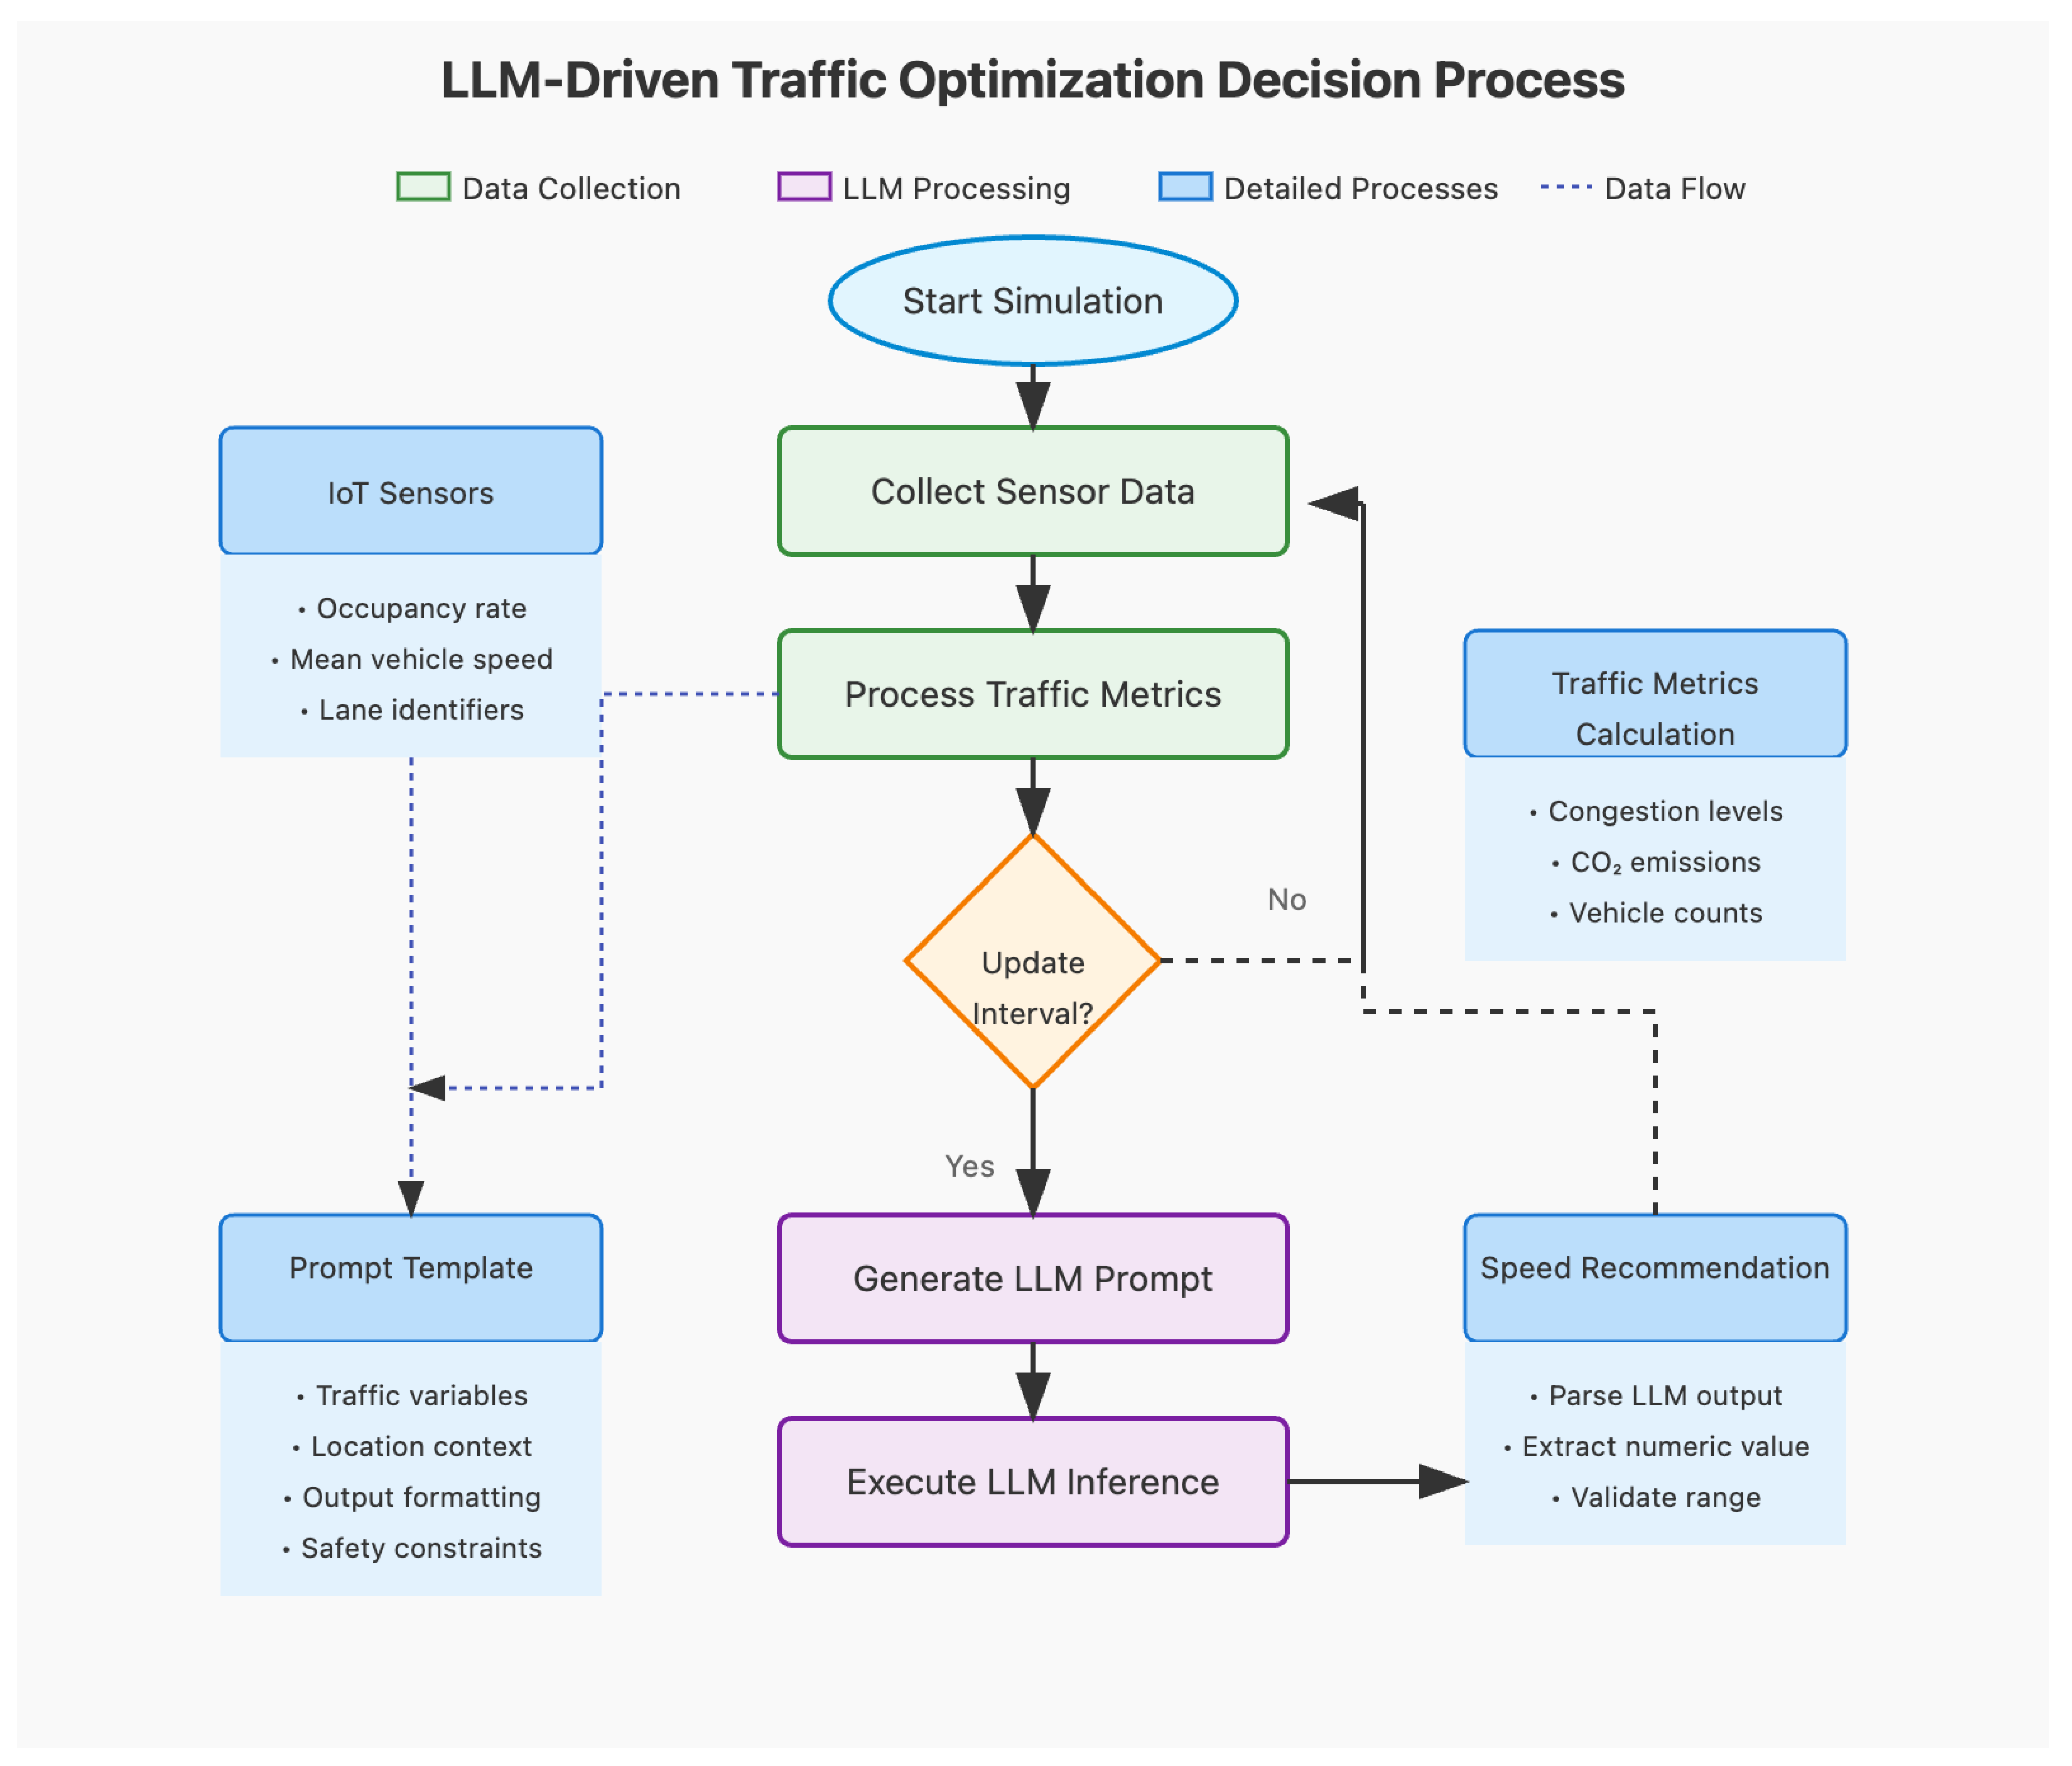
  • Real-time congestion data are collected from loop detectors every simulation step.
  • The traffic state vector x ( t ) is constructed, aggregating congestion and speed measurements.
  • The LLM processes the traffic state vector and generates optimal speed adjustments:
    π θ : x ( t ) v * ( t + 1 )
  • The recommended speeds are applied to the respective road segments, adjusting vehicle flow dynamically.
  • The process repeats at fixed intervals, ensuring real-time adaptation to changing traffic conditions.
The application of speed adjustments can also consider the continuity of flow across contiguous road segments for a more sophisticated treatment. To prevent abrupt speed transitions at segment boundaries, a smoothing mechanism can be implemented. Specifically, the velocity of vehicles transitioning from segment e to segment e can be adjusted using a weighted interpolation:
v e * ( t + 1 ) = α v e * ( t + 1 ) + ( 1 α ) v e ( t )
where:
  • v e * ( t + 1 ) is the adjusted speed for the next segment.
  • v e * ( t + 1 ) is the recommended speed for the current segment.
  • v e ( t ) is the original speed of the next segment before adjustment.
  • α is a continuity factor (typically between 0.7 and 0.9) that controls the balance between maintaining previous speeds and applying the new AI-driven recommendation.
This approach would ensure gradual transitions in velocity between segments, preventing sudden speed jumps that could induce braking waves or acceleration spikes. Additionally, a vehicle-following constraint can also be enforced:
v o ( t + 1 ) v leader ( t + 1 ) + Δ v safe
where v o ( t + 1 ) is the velocity of a given vehicle, v leader ( t + 1 ) is the speed of the leading vehicle in the adjacent segment, and Δ v safe is a buffer ensuring safe headway.
By incorporating these mechanisms, the AI-based velocity control can preserve the natural flow of traffic, reduces abrupt accelerations or decelerations at segment boundaries, and ensures a coordinated, smooth transition across the entire road network.

3.4. LLM Prompt Example

To effectively integrate the LLM into the traffic optimization framework, the system communicates with the model using structured prompts. The following example illustrates a typical prompt used to generate speed adjustments for traffic optimization.
Drones 09 00248 i001
The LLM responds with a recommended speed value, which is then extracted from the response text and applied to the respective lanes and vehicles in the SUMO simulation. The system ensures that only existing vehicles are modified to prevent errors.
The extracted speed recommendation is applied dynamically using the Traffic Control Interface (TraCI), adjusting vehicle speeds in real time to optimize traffic flow. This structured approach allows the AI system to interact effectively with the traffic simulation, ensuring adaptive and responsive traffic control.

3.5. Decision Process Flow

Figure 4 illustrates the step-by-step decision process implemented in our LLM-driven traffic optimization system. Unlike the system architecture diagram (Figure 1), which focuses on the components and their relationships, this flowchart highlights the temporal sequence of operations and decision points in the optimization loop.
The process begins with the collection of real-time sensor data from induction loops, which are then processed to calculate current traffic metrics (congestion levels and vehicle speeds). A key decision point occurs at regular intervals (every 5 simulation steps) to determine if a new LLM recommendation should be generated. When triggered, the system constructs a prompt containing the current traffic state, queries the Gemini-2.0-Flash LLM, parses the recommended speed value, and implements it at both the lane and individual vehicle levels.
This iterative process creates a closed feedback loop where traffic conditions continuously inform AI-driven interventions, allowing for adaptive speed management throughout the simulation. The separation of data collection (continuous) and LLM inference (at specified intervals) helps balance computational efficiency with responsive traffic control.

3.6. Simulation Setup

The simulation is implemented in SUMO with the following parameters:
  • Urban scenarios: Pacific Beach (San Diego), Coronado (San Diego), and Argüelles (Madrid).
  • Simulation duration: 1500 steps (≈25 min).
  • Vehicle count: Dynamically generated based on real-world traffic conditions.
  • IoT sensors: Induction loop detectors/drones positioned at key intersections.
  • AI intervention: Speed adjustments computed every 5 steps using Gemini-2.0-Flash LLM.
The number of vehicles in the simulation is derived from real-world traffic data for each urban scenario. To approximate realistic traffic flows, we use OpenStreetMap (OSM) data in combination with real-time traffic density statistics where available. The process follows these steps:
  • Base Traffic Demand: The simulation begins with an estimated traffic demand based on historical data for each location. This includes vehicle entry rates and expected peak congestion times.
  • Stochastic Variation: Vehicle arrivals are modeled as a Poisson process, ensuring a realistic distribution of cars entering the network over time.
  • Route Assignment: Each vehicle is assigned a route using the DuaRouter tool in SUMO, which estimates the most likely origin–destination pairs based on real-world road usage patterns.
  • Dynamic Adaptation: The vehicle count dynamically adjusts based on congestion levels observed in the simulation. This ensures that bottlenecks and free-flow conditions emerge naturally rather than being pre-programmed.
This approach allows for a realistic representation of urban traffic, where vehicle flows are not static but rather respond dynamically to congestion patterns and control interventions.
Each simulation run consists of two settings:
  • Baseline (No AI intervention): Vehicles follow standard SUMO rules.
  • AI-driven control: The LLM adjusts vehicle speeds based on congestion predictions.

3.7. Performance Metrics

To evaluate the effectiveness of AI-driven traffic optimization, the following metrics are measured:
Mean Traffic Congestion:
C = 1 | E | e E ρ e ( T )
where:
  • C represents the mean congestion level across all road segments.
  • ρ e ( T ) is the final congestion level at road segment e at the end of the simulation.
  • | E | is the total number of road segments in the network.
  • T is the total simulation time.
Total CO2 Emissions:
E C O 2 = t = 1 T v V e v ( t )
where:
  • E C O 2 represents the total CO2 emissions over the entire simulation duration.
  • e v ( t ) is the per-vehicle emission rate (in grams) of vehicle v at time t.
  • V is the set of all vehicles in the network.
  • T is the total simulation time.
The per-vehicle emissions e v ( t ) are determined based on SUMO’s built-in emission model, which follows the HBEFA (Handbook of Emission Factors for Road Transport) methodology. This model estimates emissions based on:
  • Vehicle category c v (e.g., passenger car, heavy-duty truck, bus).
  • Instantaneous speed v v ( t ) .
  • Acceleration profile a v ( t ) .
  • Engine type and fuel consumption characteristics.
In the simulation, vehicles are classified into categories following European vehicle classification standards, which distinguish:
  • Passenger vehicles (diesel/petrol/electric).
  • Light commercial vehicles.
  • Heavy-duty trucks.
  • Buses.
Each category has an associated emission factor function e c ( v , a ) , where:
e v ( t ) = e c v ( v v ( t ) , a v ( t ) )
which returns CO2 emissions based on the vehicle’s category, speed, and acceleration.

3.8. Summary of Methodology

The overall pipeline is summarized as follows:
  • IoT sensors collect real-time congestion and speed data.
  • The LLM processes the data and generates optimal speed recommendations.
  • Vehicles adjust their speeds based on AI outputs.
  • Performance metrics (congestion, emissions) are recorded.
In the absence of AI intervention, vehicles follow standard car-following and lane-changing models implemented in SUMO. The movement dynamics are governed by the KRAUSS model, which simulates driver behavior based on:
  • Acceleration (a) and deceleration (b): Each vehicle follows predefined acceleration and braking parameters that determine how it responds to traffic ahead.
  • Maximum speed ( v max ): Each vehicle type has a speed limit, typically set based on road regulations (e.g., 50 km/h for urban roads).
  • Headway distance: Vehicles maintain a safe following distance, adapting their speeds based on surrounding traffic.
  • Lane-changing behavior: The model allows vehicles to switch lanes if gaps are available, optimizing throughput based on SUMO’s built-in decision-making heuristics.

Differences Between Conventional and AI-Based Control

  • Conventional Model: Vehicles operate under fixed-speed limits and react only to nearby traffic conditions. Speed adjustments occur naturally based on SUMO’s default rules, but there is no global optimization.
  • AI-Based Model: The LLM dynamically suggests speed adjustments based on real-time congestion data, preventing bottlenecks and optimizing flow efficiency across multiple intersections.
By comparing these two approaches, the study evaluates the impact of AI-driven interventions on traffic congestion, vehicle flow, and environmental impact in urban settings.
The next section presents the experimental results, comparing AI-driven optimization against traditional traffic management.

4. Experimental Results

This section presents the results obtained from the traffic simulations conducted in Pacific Beach, Coronado (San Diego), and Argüelles (Madrid). The study evaluates the effectiveness of AI-assisted traffic optimization by comparing congestion levels and CO2 emissions between the baseline (no AI intervention) and AI-controlled traffic scenarios.

4.1. LLM-SUMO Integration Methodology

The technical implementation of the Large Language Model (LLM) integration with the SUMO traffic simulator involves several key components that enable real-time traffic optimization.

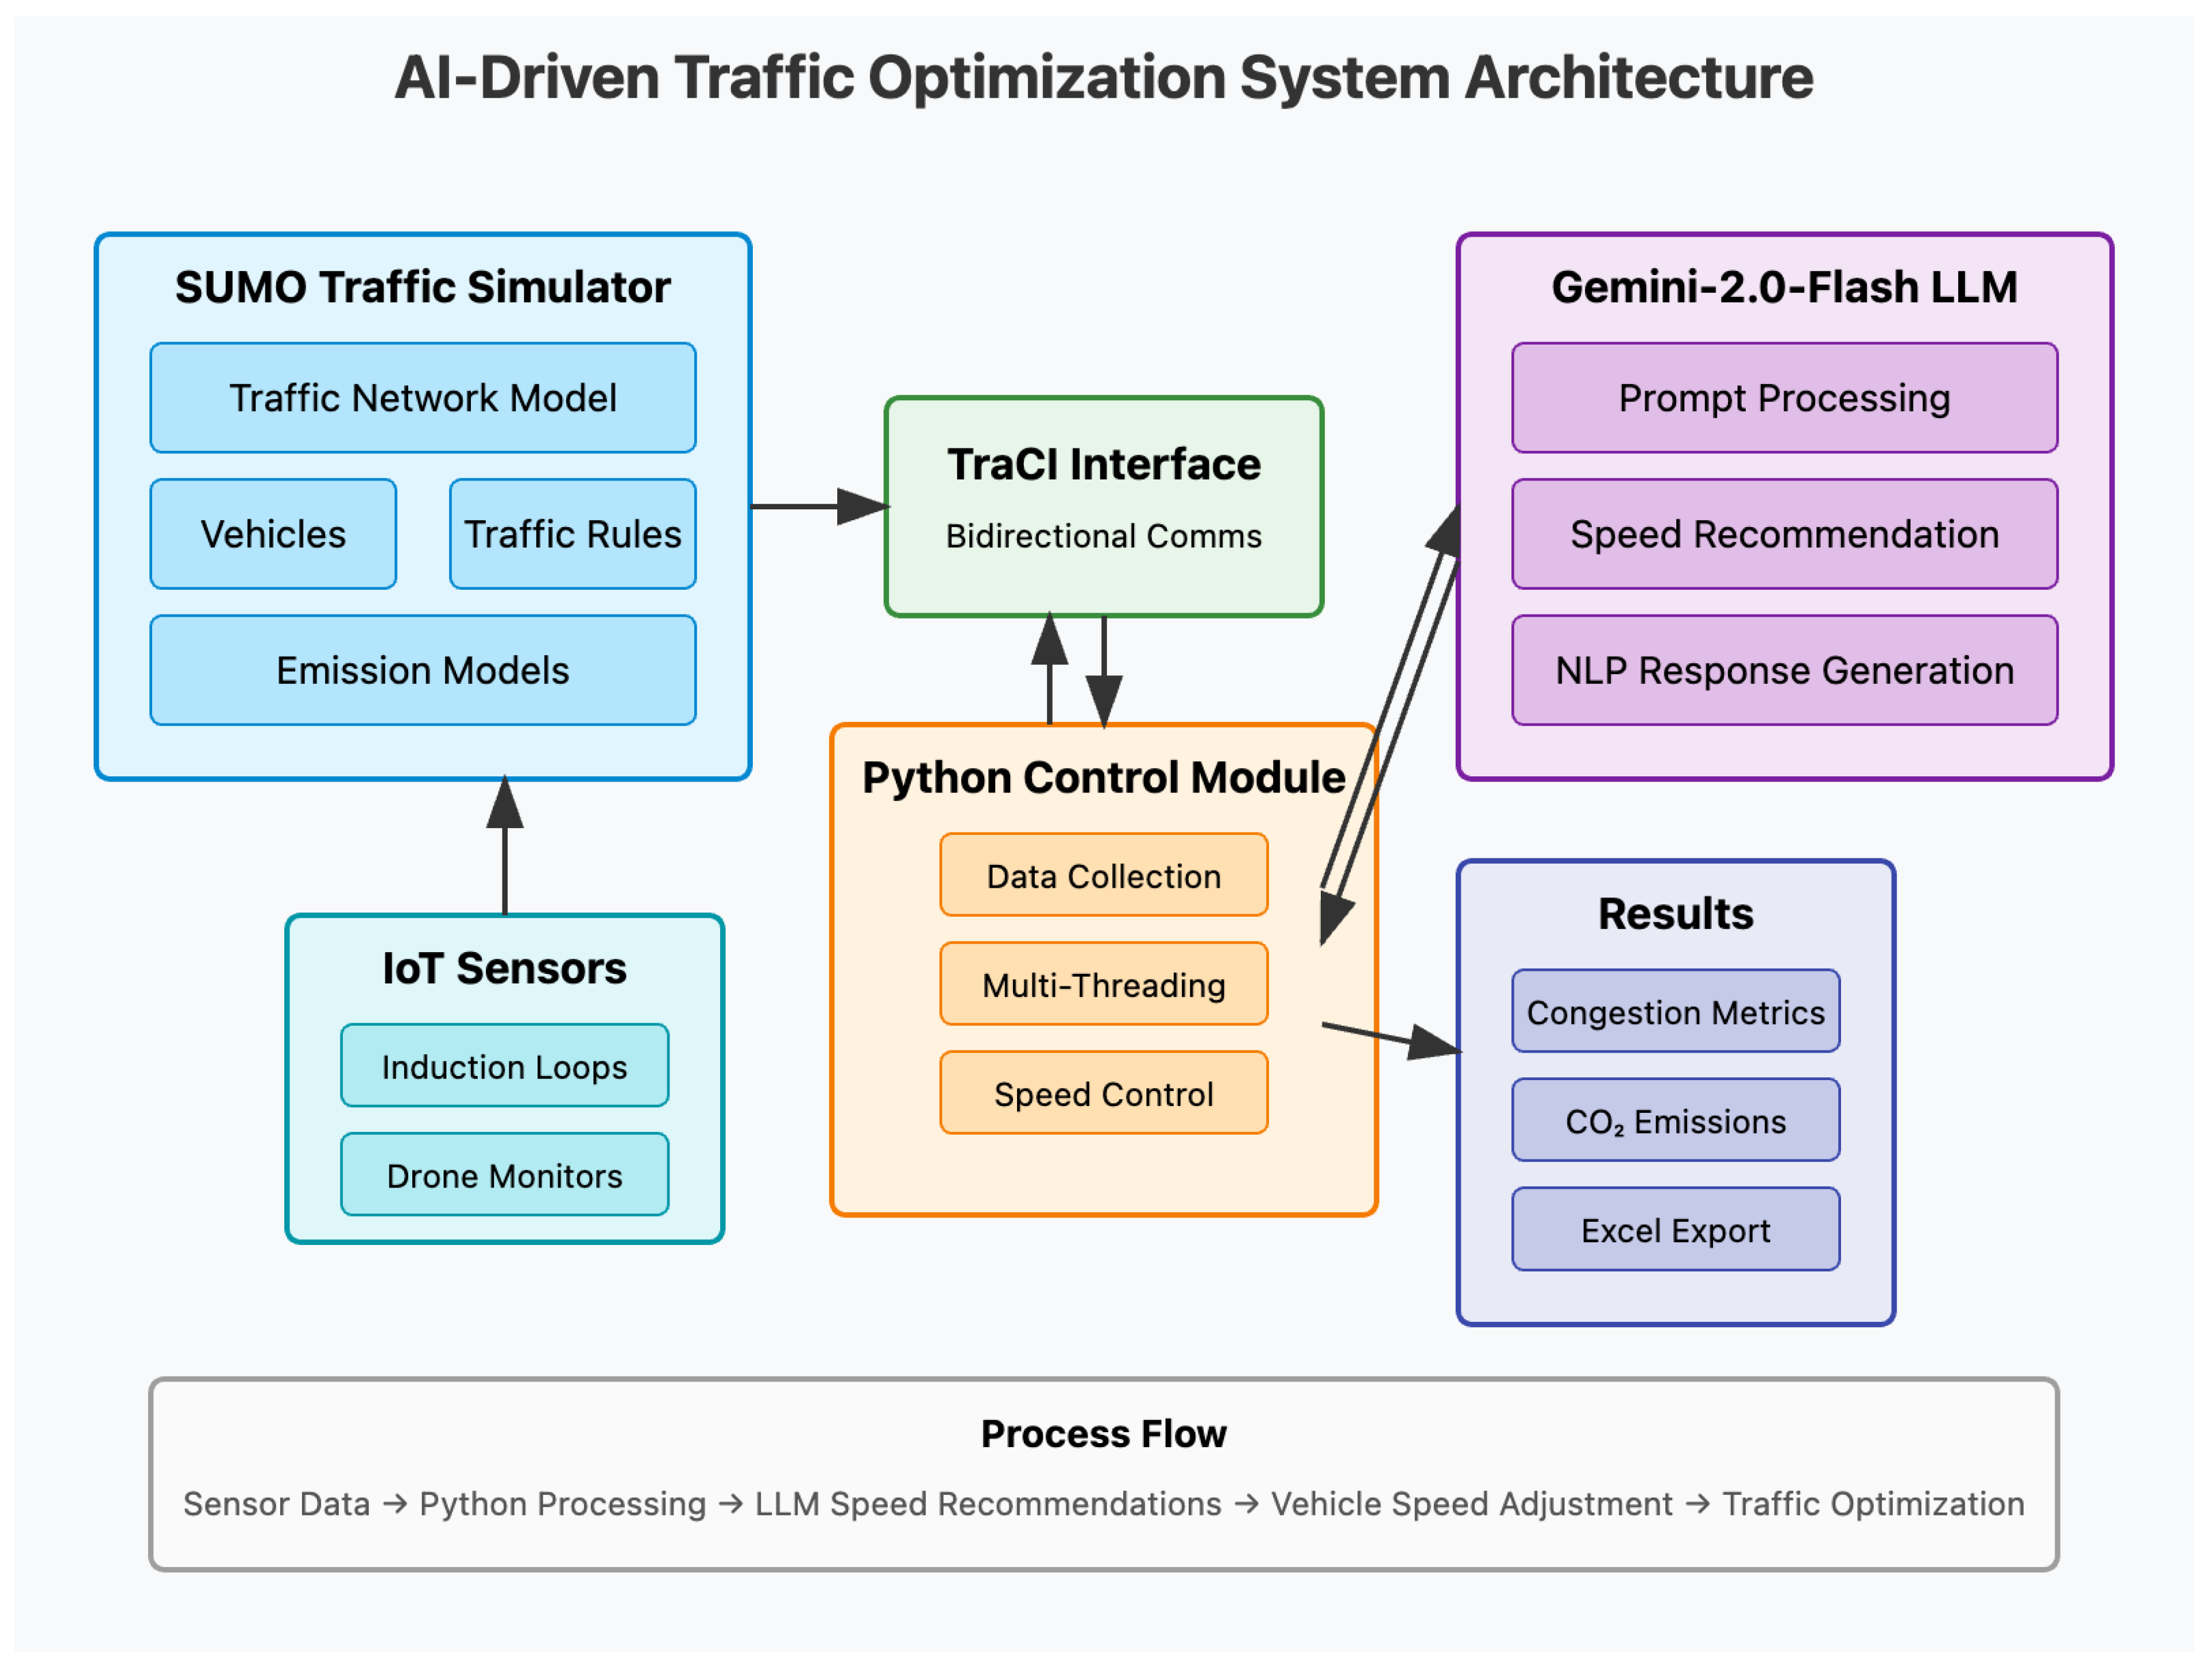
4.1.1. System Architecture

Our implementation uses TraCI (Traffic Control Interface) to establish bidirectional communication between the Python control module and the SUMO simulator. This architecture enables:
  • Real-time data extraction from traffic sensors.
  • Dynamic vehicle speed adjustments based on LLM recommendations.
  • Continuous monitoring of congestion and emissions metrics.
The system operates on a client-server model where TraCI commands are used to query the simulation state and implement control actions without interrupting the simulation flow.

4.1.2. Traffic Sensor Implementation

Induction loop detectors serve as proxies for IoT sensors or drone-based monitoring systems in our simulation. These sensors are strategically placed across the urban network to ensure comprehensive traffic monitoring.
  • Multiple sensors are positioned not only at critical intersections but also along key avenues, where they provide continuous vehicle flow data. In some cases, multiple loops are placed along a single stretch of road to capture speed variations and congestion propagation.
  • Each sensor records real-time vehicle counts, mean speeds, and occupancy rates, providing a continuous rather than point-based assessment of congestion.
  • A validation system ensures that only functional and properly calibrated sensors contribute data to the AI-driven optimization process.
This sensor network creates a high-resolution traffic data grid, enabling the AI model to make informed, real-time decisions about speed adjustments. The combination of intersection-based and avenue-based sensors improves coverage and allows for a more holistic understanding of urban traffic dynamics compared to relying solely on individual measurement points.

4.1.3. LLM Configuration and Prompt Engineering

The Gemini-2.0-Flash experimental LLM was configured with specific parameters to optimize its performance for traffic control:
  • Temperature setting of 1.0: A hyperparameter that controls the randomness of generated responses. Lower values (e.g., 0.1) make the model deterministic and repetitive, while higher values (e.g., 1.5) increase variability. A value of 1.0 was chosen to maintain a balance between predictable, interpretable speed adjustments and the ability to explore alternative solutions.
  • Top-p (0.95) and top-k (40) parameters: These control the sampling strategy to ensure diverse yet relevant recommendations.
  • Prompt engineering: The structured prompts provided to the LLM explicitly focus on congestion reduction based on real-time traffic metrics.
The temperature parameter directly influences how the AI generates speed recommendations. For example:
-
If set too low (e.g., 0.2), the AI would consistently repeat the most probable speed adjustment values, limiting adaptability to varying traffic patterns.
-
If set too high (e.g., 1.5), the AI might generate highly variable or inconsistent responses, reducing stability in speed control.
-
A value of 1.0 ensures that, while optimal speed adjustments remain structured, the model still has some flexibility to explore adaptive solutions in different traffic states.
The model receives a structured prompt containing the current mean speed and congestion values and returns recommended speed adjustments that optimize traffic flow.

4.1.4. Multi-Threaded Real-Time Processing

A critical implementation feature is the non-blocking, multi-threaded approach to AI inference:
  • Traffic metrics are collected at regular intervals (every 5 simulation steps).
  • LLM queries are processed in separate threads to avoid blocking the main simulation.
  • Regular expression parsing extracts numerical speed recommendations from natural language responses.
  • Speed adjustments are applied at both lane and individual vehicle levels.
This threading implementation ensures that the AI-based intervention remains responsive in real-time, even as the simulation complexity increases with more vehicles.

4.1.5. Speed Adjustment Mechanism

The core intervention mechanism involves:
  • Extracting recommended speed values from the LLM’s natural language responses.
  • Setting maximum lane speeds in affected road segments.
  • Adjusting individual vehicle speeds to conform to optimized values.
  • Validating vehicles before modification to prevent simulation errors.
This multi-level approach ensures that speed recommendations propagate efficiently throughout the traffic network, maximizing the impact of each AI intervention.

4.1.6. Data Collection for Analysis

Throughout the simulation, comprehensive data collection mechanisms track:
  • Per-step congestion metrics across all sensors.
  • Cumulative CO2 emissions calculated from individual vehicle outputs.
  • Vehicle count and flow rates at key intersections.
  • LLM response patterns and recommendation effectiveness.
These metrics are stored in structured formats (CSV and JSON) for subsequent analysis, visualization, and comparison between AI-controlled and baseline scenarios.
The integration techniques described in this section were consistently applied across all three urban scenarios (Pacific Beach, Coronado, and Argüelles), enabling fair comparison of performance improvements across different traffic patterns and urban layouts.

4.2. Traffic Congestion Analysis

Traffic congestion is measured as the mean occupancy rate ρ e ( t ) across all monitored road segments. The results for each scenario are summarized in Table 1.
Figure 5a–c illustrate the evolution of congestion over the simulation period for each scenario.
From Table 1, we observe that AI-driven control significantly reduces congestion across all three scenarios. The highest reduction is observed in Argüelles (82.2%), followed closely by Pacific Beach (80.6%), while Coronado (62.2%) shows a more moderate but still substantial improvement.

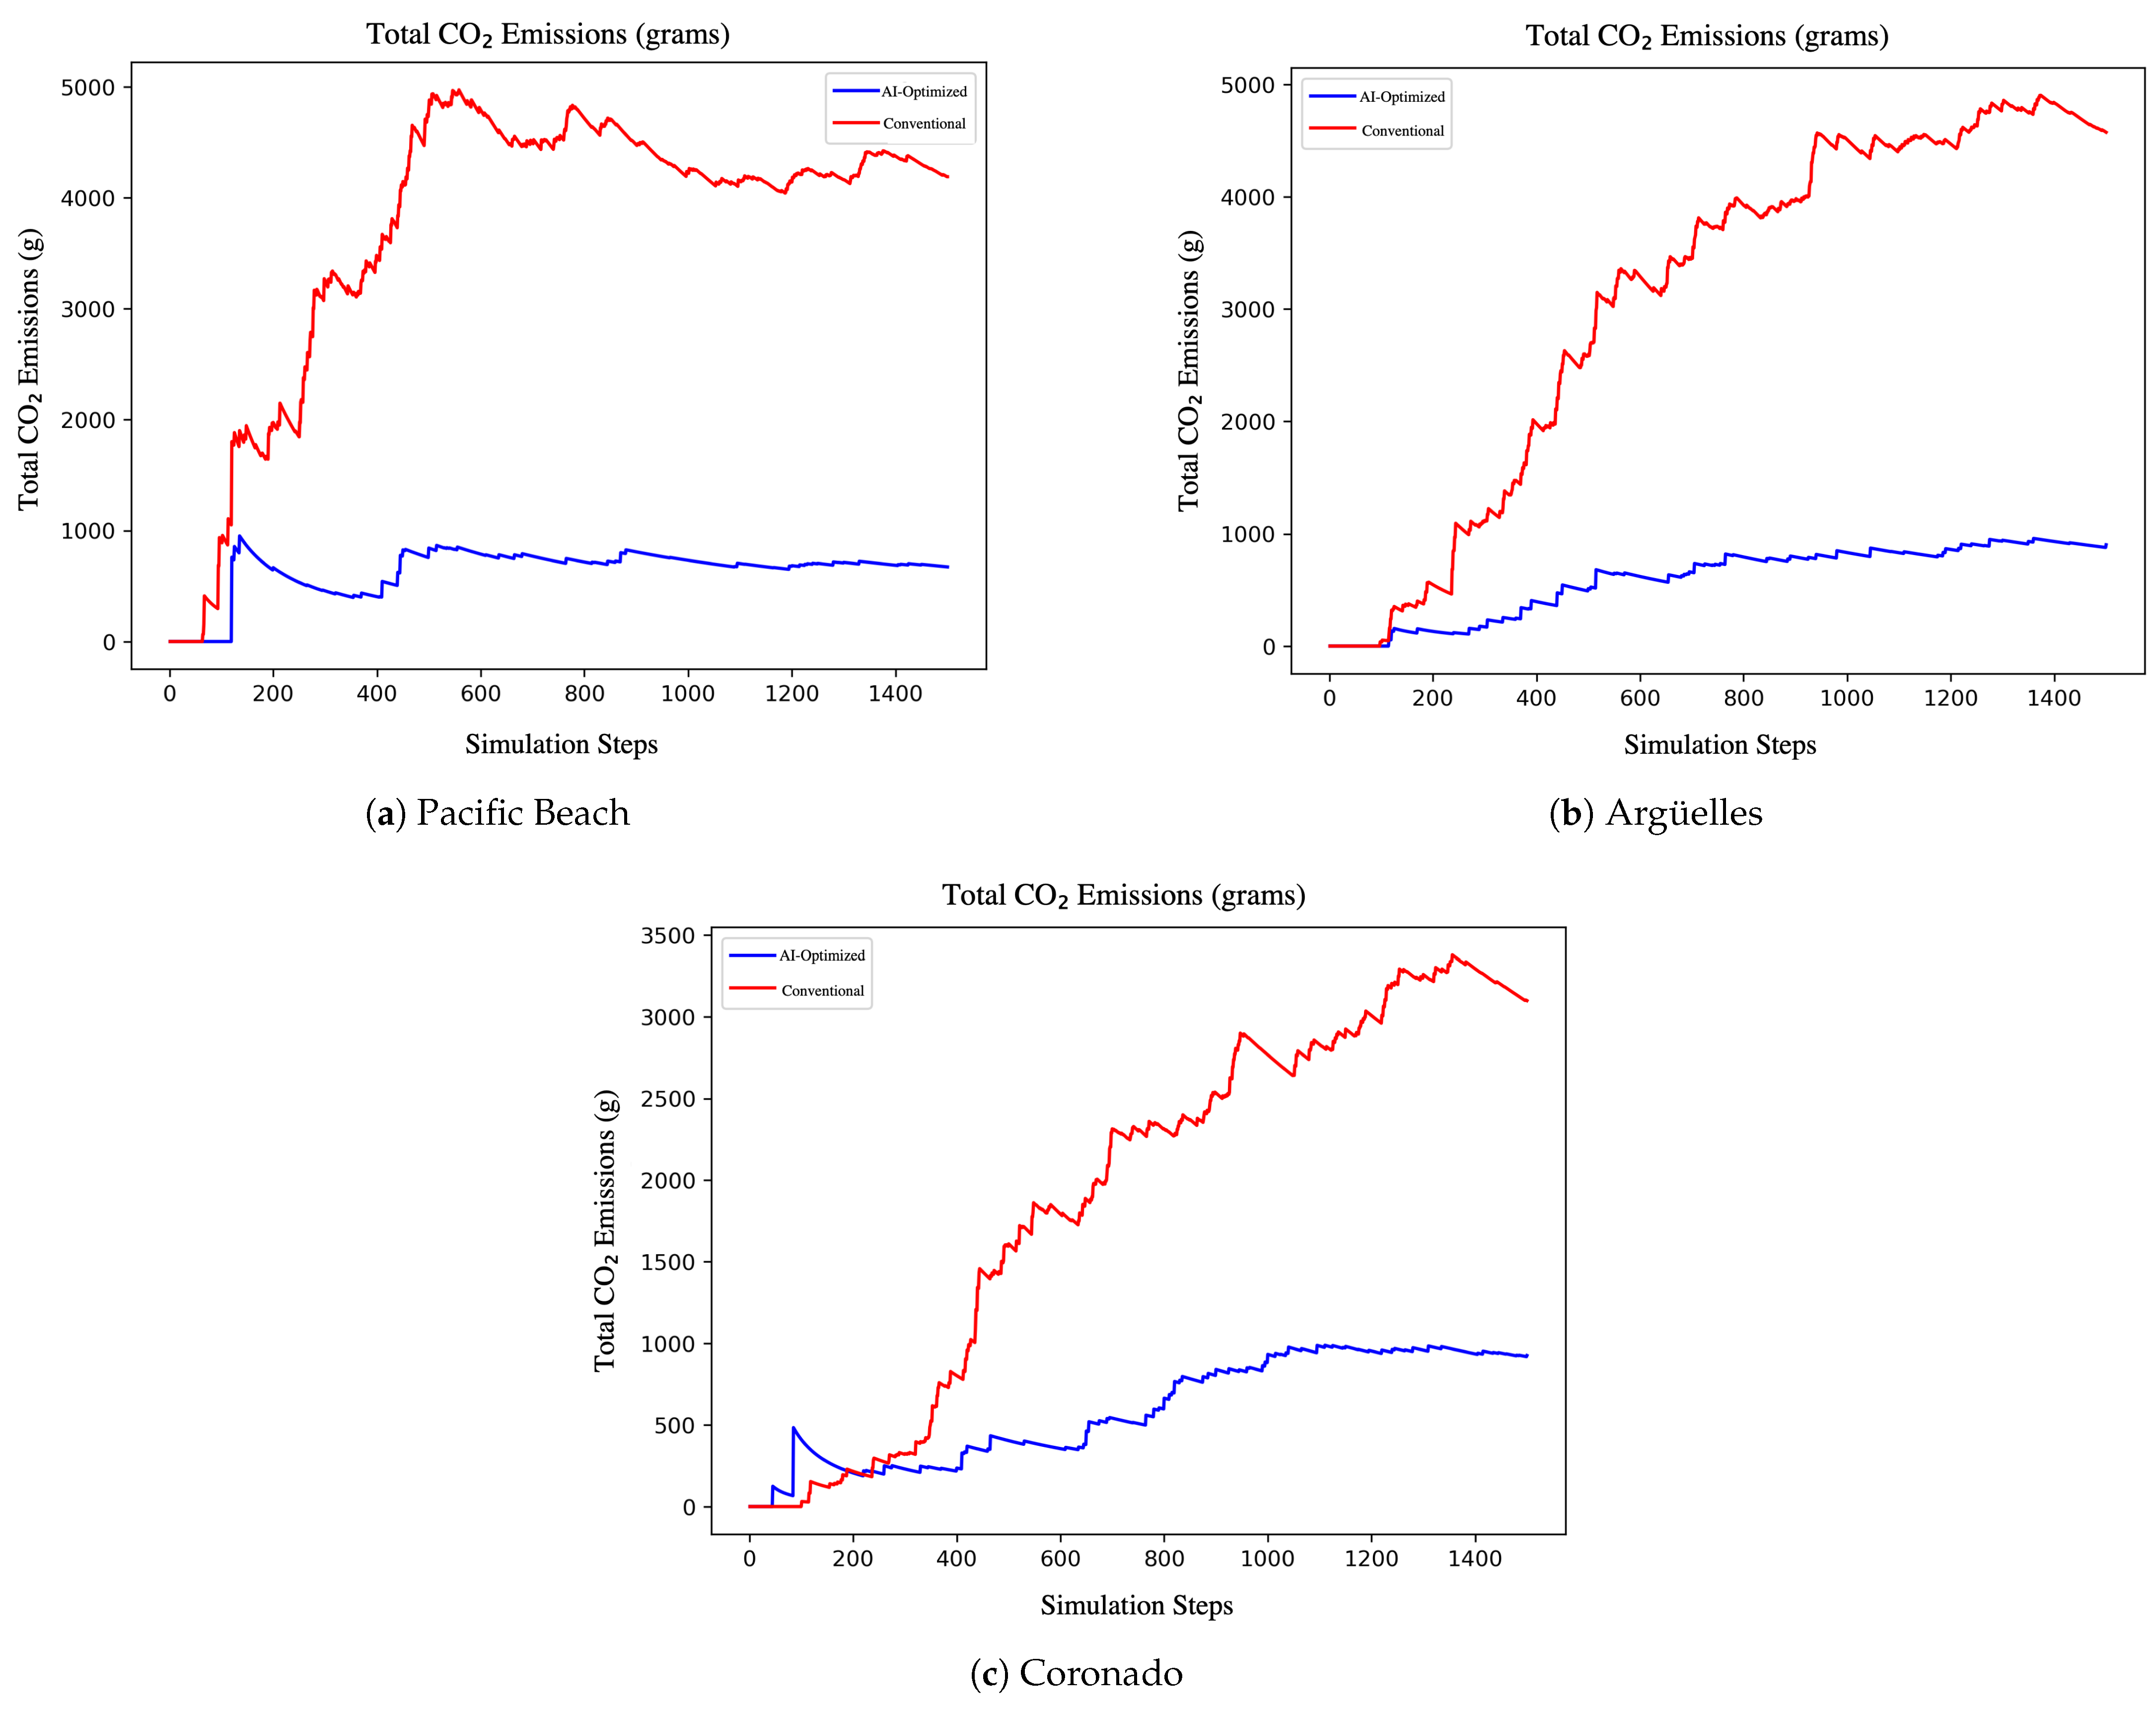
4.3. CO2 Emission Analysis

The total CO2 emissions were computed using:
E C O 2 = t = 1 T v V e v ( t )
where e v ( t ) represents the per-vehicle CO2 emission at time t. Table 2 presents the emission reduction across the three scenarios.
Figure 6a–c depict the CO2 emission trends for each urban environment.
From Table 2, we conclude that the AI-controlled approach achieves a substantial reduction in CO2 emissions, with the highest impact observed in Pacific Beach (75.0%) and Argüelles (74.0%), while Coronado (57.3%) exhibits a relatively lower but still notable improvement.
The congestion and emission reductions presented are based on measurements taken at key monitoring points, such as intersections and high-traffic areas, where congestion is most severe in the baseline scenario. That being said, the baseline scenarios in our experiments exhibit substantial congestion, leading to frequent stop-and-go vehicle behavior, which is known to be one of the most inefficient driving conditions in terms of fuel consumption and CO2 emissions. By dynamically adjusting vehicle speeds, the AI-driven system significantly reduced idle times and unnecessary acceleration, leading to a more fluid traffic flow. Studies have shown that smooth traffic flow can reduce fuel consumption by up to 40–50% in certain urban scenarios, particularly when congestion levels are initially high. Additionally, by optimizing travel times, the AI-controlled vehicles reached their destinations faster, thereby reducing the total duration of emissions per vehicle. These combined factors contribute to the observed reductions, which, while large, align with known effects of optimized traffic management strategies.

4.4. Summary of Findings

The experimental findings demonstrate that the integration of Large Language Models (LLMs) with IoT traffic sensors leads to significant traffic improvements. The key outcomes are:
  • Traffic congestion reduction: AI-driven traffic control reduces congestion by up to 82.2%.
  • CO2 emission reduction: AI-controlled optimization achieves a maximum reduction of 75.0% in emissions.
  • All three urban scenarios benefit significantly from real-time AI traffic optimization.
These results provide strong evidence that LLM-powered traffic control systems can effectively enhance urban mobility while reducing environmental impact.
The next section discusses the broader implications of these results, potential limitations, and future research directions.

5. Computational Costs and Scalability Analysis

The computational efficiency of the proposed AI-driven traffic optimization framework is a critical factor for real-time deployment. This section analyzes the computational costs of integrating Large Language Models (LLMs) with the SUMO traffic simulation, focusing on inference time, memory requirements, and scalability.

5.1. Computational Complexity of LLM Inference

Let M represent the LLM model, parameterized by θ , with a total of P parameters. The forward pass complexity of a Transformer-based model scales approximately as:
O ( P ) + O ( n s d h 2 ) + O ( n s 2 d h )
where:
  • n s is the input sequence length (number of tokens in the prompt).
  • d h is the hidden dimension size of the model.
  • P is the number of model parameters.
For a typical Gemini-2.0-Flash-based architecture with P 10 10 parameters and d h 4096 , the computational cost is dominated by the self-attention operation O ( n s 2 d h ) , making inference expensive for large inputs.
Given that each traffic state update consists of N sensors, with each contributing a congestion value and speed measurement, the sequence length can be approximated as:
n s = O ( 2 N )
Thus, the LLM inference complexity per traffic update is:
O ( N 2 d h ) + O ( P )

5.2. Memory Requirements

The memory consumption of the LLM is driven by:
  • Model parameters: Stored in GPU VRAM or RAM as 16-bit floating point (FP16).
    Memory model = P × 2 bytes
    For a 10-billion parameter model, this results in:
    10 10 × 2 bytes = 20 GB
  • Intermediate activations: Stored during inference and scale as:
    O ( n s d h )
    Given n s 100 tokens and d h 4096 , the activation memory requirement per query is:
    100 × 4096 × 2 800 KB
Total memory usage, including model weights and activations, is estimated as:
O ( P ) + O ( n s d h ) = O ( 10 10 ) + O ( 10 6 )
which remains GPU-dominant in terms of storage requirements.

5.3. Inference Latency and Processing Time

The inference time per query depends on the model’s FLOPs (floating point operations per second) and the hardware used. The number of FLOPs per inference step scales as:
FLOPs inference = O ( N 2 d h )
For an NVIDIA A100 GPU, which has a throughput of 19.5 TFLOPs (FP16), the LLM inference time per query is:
t inference = FLOPs inference TFLOPs per sec ond
With N = 50 sensors and d h = 4096 , a single query takes approximately:
( 50 2 × 4096 ) 19.5 × 10 12 8.4 ms
Thus, AI-driven traffic control remains feasible within real-time constraints if processed on a high-performance GPU.

5.4. Computational Scalability

We evaluate scalability by analyzing how computational costs scale with increasing urban environments. Let V be the number of vehicles in the simulation, and I the number of intersections. The computational complexity of the AI-enhanced traffic optimization approach can be summarized as:
O ( I ) + O ( V ) + O ( N 2 d h )
where:
  • O ( I ) accounts for SUMO’s baseline computational cost.
  • O ( V ) captures vehicle state updates.
  • O ( N 2 d h ) is the AI model’s inference cost.
For large-scale simulations (e.g., city-wide networks with V > 10 5 ), inference costs become the limiting factor, requiring parallelization or model distillation techniques.

5.5. Comparison to Alternative Methods

Compared to traditional rule-based control ( O ( I ) ), Reinforcement-Learning (RL) methods exhibit:
O ( T M d h )
where T is the training time and M is the number of policy updates. RL-based models require extensive offline training, making them less adaptive in real-time traffic conditions. The LLM-based approach, in contrast, processes real-time inputs efficiently without pre-training on the specific traffic scenario.

5.6. Optimizations for Deployment

For real-world applications, several optimizations can be applied:
  • Quantization: Reducing FP16 to INT8 representation reduces memory overhead by 50%.
  • Knowledge distillation: Compressing the LLM into a smaller, task-specific model decreases inference time.
  • Edge computing: Deploying inference on traffic control edge devices minimizes latency.

5.7. Inference via API: Cloud-Based Computation

Unlike locally hosted models on GPUs such as the NVIDIA A100, our experimentation leverages the Gemini-2.0-Flash Experimental model through an API-based architecture. This setup avoids the need to store and load multi-billion parameter weights directly on local hardware, instead outsourcing inference computation to Google’s AI cloud infrastructure.
Given this API-based architecture, the computational costs for real-time AI-driven traffic optimization are affected by:
  • API Response Latency: Time taken for request-response cycles.
  • Network Transmission Overhead: Latency due to sending traffic data and receiving responses.
For real-time deployments, API-based inference reduces the need for high-end local compute resources but introduces a dependency on cloud-based execution.

6. Discussion

The experimental results demonstrate that integrating Large Language Models (LLMs) with IoT-enabled traffic monitoring leads to significant reductions in congestion and CO2 emissions. This section discusses the implications of these findings, examines potential limitations, and outlines future research directions.

6.1. Implications for Urban Traffic Management

The proposed AI-driven framework exhibits a remarkable ability to adapt traffic conditions in real time, leading to:
  • A reduction in traffic congestion by up to 82.2% (Argüelles).
  • A decrease in CO2 emissions by up to 75.0% (Pacific Beach).
These improvements highlight the practical feasibility of LLM-assisted traffic control, particularly in high-density urban areas where congestion is a persistent issue. Unlike traditional traffic control mechanisms, which rely on static or rule-based strategies, our method dynamically adjusts vehicle speeds based on congestion predictions, leading to a self-regulating traffic ecosystem.
The deployment of drone-based monitoring further extends the application of AI-driven traffic control. By leveraging aerial traffic data, future implementations could provide city-wide adaptive traffic management, integrating LLM-based decision-making with aerial surveillance.

6.2. Comparison with Traditional Traffic Control Methods

Conventional traffic management strategies typically include:
  • Fixed-timing traffic signals, which are unable to respond to real-time congestion.
  • Rule-based adaptive control, which requires extensive manual configuration.
  • Reinforcement-learning (RL)-based optimization, which often lacks generalizability across different urban environments.
Compared to fixed and rule-based systems, our approach introduces a highly adaptable framework that can generalize across diverse traffic conditions without manual tuning. Additionally, LLM-powered intervention provides interpretability advantages over reinforcement-learning models, as LLM-generated recommendations can be directly analyzed and adjusted by traffic engineers.

6.3. Scalability and Real-World Deployment Challenges

While the SUMO-based simulation provides a robust evaluation framework, real-world deployment poses several challenges:
  • Latency in real-time AI inference: The computational overhead of LLM inference must be optimized for deployment in edge computing environments.
  • Sensor reliability and accuracy: IoT sensors and drones must consistently provide accurate congestion and velocity data to maintain intervention effectiveness.
  • Traffic rule compliance: Adjusting vehicle speeds must align with local traffic regulations to ensure road safety.
Overcoming these challenges requires further research into edge-based AI inference, where LLMs operate on low-latency, decentralized architectures for real-time decision-making.

6.4. Generalization Across Urban Environments

The effectiveness of AI-driven traffic control is inherently influenced by urban topology and road network design. While our study demonstrates success across three diverse urban areas (Pacific Beach, Coronado, and Argüelles), future research should consider:
  • High-density metropolitan areas, where congestion patterns are more unpredictable.
  • Highway traffic optimization, where speed recommendations must account for lane-changing behavior.
  • Multi-modal transportation, integrating pedestrian and public transit flow into AI-based optimization.
To further improve generalization, future work could explore transfer-learning techniques, enabling LLMs trained in one city to adapt seamlessly to another.

6.5. Potential of UAV-Assisted Traffic Optimization

While this study primarily models induction-loop data for real-time traffic control as an illustration, the integration of UAV-based traffic monitoring presents a significant opportunity for future research. UAVs can provide:
  • High-resolution, aerial congestion mapping beyond fixed sensor locations.
  • Enhanced real-time traffic modeling by tracking vehicle trajectories at a network level.
  • Improved AI decision-making through additional data features, including lane-wise vehicle distributions and intersection queue lengths.
Future implementations of this framework could incorporate real-world UAV video feeds processed through extended capabilities of LLMs, VLMs [10], and large multi-modal models [11] to extract vehicle speeds and congestion patterns dynamically. This would further improve the adaptability of AI-driven urban traffic management solutions, aligning with next-generation drone-assisted smart mobility infrastructures.

6.6. Ethical and Environmental Considerations

While AI-driven traffic management offers substantial environmental benefits via emission reductions, certain ethical considerations must be addressed:
  • Algorithmic bias: The AI model must ensure fair traffic optimization across all neighborhoods, avoiding disproportionate advantages or disadvantages to specific areas.
  • Privacy concerns: The integration of drone-based traffic monitoring necessitates robust data protection measures to prevent misuse of real-time traffic surveillance.
  • Energy consumption of AI models: While reducing congestion lowers fuel consumption, LLM inference itself has a computational footprint that must be optimized for sustainability.
Addressing these challenges requires interdisciplinary collaboration between AI researchers, urban planners, and policymakers to ensure ethical, scalable, and sustainable AI-driven traffic management.

6.7. Future Research Directions

While the present study demonstrates compelling improvements in congestion and emission reduction, several avenues for future research remain open:
  • Hybrid AI models: Combining LLM-based decision-making with Reinforcement Learning (RL) could enhance adaptability in highly dynamic environments.
  • Autonomous vehicle coordination: Extending AI-driven speed recommendations to autonomous vehicle fleets to create a fully AI-coordinated traffic network.
  • Human-in-the-loop AI optimization: Allowing traffic engineers to interact with the AI system, refining speed recommendations based on human expertise.
  • Real-world pilot studies: Deploying a scaled version of the proposed framework in live traffic settings to validate its feasibility beyond simulations.
This study provides a strong foundation for AI-assisted traffic optimization, demonstrating significant benefits in congestion control and emission reduction. The integration of IoT sensors, drones, and LLM-based AI represents a scalable and adaptable approach to modern urban traffic management. Future research should focus on real-world implementation challenges, ensuring that AI-driven mobility solutions are sustainable, ethical, and highly effective in diverse urban environments.
The next section presents the conclusions of this study, summarizing its contributions and impact.

7. Conclusions

This study has demonstrated the effectiveness of AI-driven traffic optimization by integrating Large Language Models (LLMs) with IoT-based traffic monitoring in a SUMO simulation environment. Through real-time speed recommendations, the AI-assisted system significantly reduces traffic congestion and CO2 emissions across three distinct urban scenarios: Pacific Beach, Coronado (San Diego), and Argüelles (Madrid).
The main contributions of this research are:
  • Novel AI-driven traffic control framework: A real-time traffic optimization system combining LLMs, IoT sensors, and drone-based monitoring.
  • Significant reduction in congestion and emissions: The proposed method achieves up to 82.2% congestion reduction and 75.0% CO2 emission reduction.
  • Dynamic speed adjustment mechanism: AI-generated recommendations optimize vehicle speeds in response to real-time congestion patterns.
  • Scalability and generalization analysis: The framework is evaluated in three diverse urban scenarios, demonstrating its potential for adaptation in different environments.
  • Discussion of ethical and deployment challenges: The study highlights potential biases, privacy concerns, and computational constraints that must be addressed for real-world implementation.
These findings indicate that LLM-enhanced traffic management is a viable and scalable approach for next-generation smart mobility systems.
The successful application of LLMs for traffic optimization suggests a paradigm shift in urban mobility management:
  • Cities can reduce traffic congestion and emissions without expensive infrastructure modifications.
  • AI-driven decision-making enables real-time, adaptive interventions that traditional traffic control systems lack.
  • Drone-based monitoring could facilitate scalable, autonomous traffic management across metropolitan areas.
As urban areas continue to face increasing traffic demands, integrating AI and IoT technologies will become essential for sustainable and efficient transportation systems.
While this study presents compelling improvements in traffic efficiency, several challenges remain:
  • Real-world deployment feasibility: Ensuring low-latency AI inference and reliable sensor data collection.
  • Integration with autonomous vehicles: Extending AI-driven traffic control to coordinate with autonomous vehicle fleets.
  • Multi-modal transportation optimization: Incorporating pedestrian flow, public transit, and emergency vehicles into AI-based traffic management.
  • AI interpretability and safety: Ensuring that AI-generated speed recommendations align with real-world traffic regulations and human driver behavior.
  • Pilot implementation studies: Deploying the proposed framework in real-world urban environments to validate its scalability and effectiveness.
Future research should focus on expanding AI-driven traffic control beyond simulation environments, ensuring that LLM-powered urban mobility systems are both practical and scalable for widespread adoption.
This study presents a novel, AI-powered traffic management system that significantly improves urban mobility by reducing congestion and emissions. The integration of IoT sensors, drone-based traffic monitoring, and LLM-driven optimization represents a promising avenue for next-generation smart cities.
By addressing real-world deployment challenges and extending AI-based traffic control to multi-modal urban mobility, future work can further enhance the efficiency, fairness, and sustainability of AI-assisted transportation systems.
The findings of this study serve as a foundation for future AI-driven smart mobility solutions, paving the way for data-driven, adaptive, and scalable urban traffic management frameworks.

Author Contributions

Conceptualization, Á.M. and J.d.C.; data curation, Á.M.; formal analysis, Á.M., J.d.C. and I.d.Z.; funding acquisition, J.d.C., I.d.Z. and C.T.C.; investigation, Á.M. and J.d.C.; methodology, Á.M. and J.d.C.; software, Á.M.; supervision, J.d.C.; validation, Á.M., J.d.C., I.d.Z. and C.T.C.; visualization, Á.M. and J.d.C.; writing—original draft, J.d.C. and I.d.Z.; writing—review and editing, J.d.C., Á.M., I.d.Z. and C.T.C. All authors have read and agreed to the published version of the manuscript.

Funding

The authors would like to thank the BARCELONA Supercomputing Center for providing access to MareNostrum 5 and technical support throughout this research. The work has been developed under the following project: “TIFON”. Álvaro Moraga would also like to thank Universidad Pontificia Comillas for the opportunity to participate in the international exchange program with the Shiley-Marcos School of Engineering at the University of San Diego.

Institutional Review Board Statement

Not applicable.

Informed Consent Statement

Not applicable.

Data Availability Statement

All data presented in the study are contained within the manuscript.

Conflicts of Interest

The authors declare that they have no conflicts of interest. The funders had no role in the design of the study; in the collection, analyses, or interpretation of data; in the writing of the manuscript; or in the decision to publish the results.

Abbreviations

The following abbreviations are used in this manuscript:
AIArtificial Intelligence
LLMsLarge Language Model
VLMsVisual Language Models
SUMOSimulation of Urban MObility
UAVsUnmanned Aerial Vehicles
CAVsConnected and Autonomous Vehicles
CO2Carbon Dioxide
CNNConvolutional Neural Network
DNNDeep Neural Network
RLReinforcement Learning
ITSIntelligent Transportation Systems
IoTInternet of Things
AIoT Artificial Intelligence of Things
OSM OpenStreetMap
ML Machine Learning
NLP Natural Language Processing
RL Reinforcement Learning
SUMO Simulation of Urban MObility
TraCI Traffic Control Interface
OD Origin–Destination
V2X Vehicle-to-Everything

References

  1. Almukhalfi, H.; Noor, A.; Noor, T.H. Traffic management approaches using machine learning and deep learning techniques: A survey. Eng. Appl. Artif. Intell. 2024, 133, 108147. [Google Scholar] [CrossRef]
  2. Doraswamy, B.; Krishna, K.L.; Rao, T.C.S. A Comprehensive Review on Real Time Traffic Management Coordination for Smart Cities with IoT Connected Drones. In Proceedings of the 2024 International Conference on Cognitive Robotics and Intelligent Systems (ICC-ROBINS), Coimbatore, India, 17–19 April 2024; pp. 584–589. [Google Scholar]
  3. Ding, C.; Ho, I.W.H.; Chung, E.; Fan, T. V2X and deep reinforcement learning-aided mobility-aware lane changing for emergency vehicle preemption in connected autonomous transport systems. IEEE Trans. Intell. Transp. Syst. 2024, 25, 7281–7293. [Google Scholar] [CrossRef]
  4. Colley, M.; Czymmeck, J.; Kücükkocak, M.; Jansen, P.; Rukzio, E. PedSUMO: Simulacra of Automated Vehicle-Pedestrian Interaction Using SUMO To Study Large-Scale Effects. In Proceedings of the 2024 ACM/IEEE International Conference on Human-Robot Interaction, Boulder, CO, USA, 11–14 March 2024; pp. 890–895. [Google Scholar]
  5. Brown, T.; Mann, B.; Ryder, N.; Subbiah, M.; Kaplan, J.D.; Dhariwal, P.; Neelakantan, A.; Shyam, P.; Sastry, G.; Askell, A.; et al. Language Models are Few-Shot Learners. Adv. Neural Inf. Process. Syst. 2020, 33, 1877–1901. [Google Scholar]
  6. Li, S.; Azfar, T.; Ke, R. Chatsumo: Large language model for automating traffic scenario generation in simulation of urban mobility. IEEE Trans. Intell. Veh. 2024, 1–12. [Google Scholar] [CrossRef]
  7. Guirado, R.; Padró, J.C.; Zoroa, A.; Olivert, J.; Bukva, A.; Cavestany, P. Stratotrans: Unmanned aerial system (uas) 4g communication framework applied on the monitoring of road traffic and linear infrastructure. Drones 2021, 5, 10. [Google Scholar] [CrossRef]
  8. de Curtò, J.; de Zarzà, I.; Calafate, C.T. Semantic Scene Understanding with Large Language Models on Unmanned Aerial Vehicles. Drones 2023, 7, 114. [Google Scholar] [CrossRef]
  9. Elloumi, M.; Dhaou, R.; Escrig, B.; Idoudi, H.; Saidane, L.A. Monitoring road traffic with a UAV-based system. In Proceedings of the 2018 IEEE Wireless Communications and Networking Conference (WCNC), Barcelona, Spain, 15–18 April 2018; pp. 1–6. [Google Scholar]
  10. Alayrac, J.B.; Donahue, J.; Luc, P.; Miech, A.; Barr, I.; Hasson, Y.; Lenc, K.; Mensch, A.; Millican, K.; Reynolds, M.; et al. Flamingo: A visual language model for few-shot learning. Adv. Neural Inf. Process. Syst. 2022, 35, 23716–23736. [Google Scholar]
  11. Wang, W.; Lv, Q.; Yu, W.; Hong, W.; Qi, J.; Wang, Y.; Ji, J.; Yang, Z.; Zhao, L.; Song, X.; et al. Cogvlm: Visual expert for pretrained language models. Adv. Neural Inf. Process. Syst. 2025, 37, 121475–121499. [Google Scholar]
  12. Webster, F. Traffic Signal Settings; Road Research Technical Paper No. 39; Department of Scientific and Industrial Research: London, UK, 1958.
  13. Robertson, D. TRANSYT: A Traffic Network Study Tool; Road Research Laboratory Report; Road Research Laboratory: Berkshire, UK, 1969; Volume 253. [Google Scholar]
  14. Wiering, M. Multi-agent reinforcement learning for traffic light control. In Proceedings of the 17th International Conference on Machine Learning, Banff, AB, Canada, 4–8 July 2004; pp. 1151–1158. [Google Scholar]
  15. Van der Pol, E.; Oliehoek, F.A. Coordinated deep reinforcement learners for traffic light control. NIPS Deep. Reinf. Learn. Workshop 2016, 8, 21–38. [Google Scholar]
  16. Ramakrishnan, N.; Soni, T. Network traffic prediction using recurrent neural networks. In Proceedings of the 2018 17th IEEE International Conference on Machine Learning and Applications (ICMLA), Orlando, FL, USA, 17–20 December 2018; pp. 187–193. [Google Scholar]
  17. Vaswani, A.; Shazeer, N.; Parmar, N.; Uszkoreit, J.; Jones, L.; Gomez, A.N.; Kaiser, Ł.; Polosukhin, I. Attention is all you need. Adv. Neural Inf. Process. Syst. 2017, 30, 5998–6008. [Google Scholar]
  18. Zhao, H.; Dong, C.; Cao, J.; Chen, Q. A survey on deep reinforcement learning approaches for traffic signal control. Eng. Appl. Artif. Intell. 2024, 133, 108100. [Google Scholar] [CrossRef]
  19. Yogi, K.S.; Sharma, A.; Gowda, V.D.; Saxena, R.; Barua, T.; Mohiuddin, K. Innovative Urban Solutions with IoT-Driven Traffic and Pollution Control. In Proceedings of the 2024 International Conference on Automation and Computation (AUTOCOM), Dehradun, India, 14–16 March 2024; pp. 136–141. [Google Scholar]
  20. Xiao, Z.; Lim, H.B.; Ponnambalam, L. Participatory sensing for smart cities: A case study on transport trip quality measurement. IEEE Trans. Ind. Inform. 2017, 13, 759–770. [Google Scholar] [CrossRef]
  21. Christin, D.; Reinhardt, A.; Kanhere, S.S.; Hollick, M. A survey on privacy in mobile participatory sensing applications. J. Syst. Softw. 2011, 84, 1928–1946. [Google Scholar] [CrossRef]
  22. Bisio, I.; Garibotto, C.; Haleem, H.; Lavagetto, F.; Sciarrone, A. A systematic review of drone based road traffic monitoring system. IEEE Access 2022, 10, 101537–101555. [Google Scholar] [CrossRef]
  23. de Zarzà, I.; de Curtò, J.; Cano, J.C.; Calafate, C.T. Drone-based decentralized truck platooning with UWB sensing and control. Mathematics 2023, 11, 4627. [Google Scholar] [CrossRef]
  24. Hashem, I.A.; Siddiqa, A.; Alaba, F.A.; Bilal, M.; Alhashmi, S.M. Distributed intelligence for IoT-based smart cities: A survey. Neural Comput. Appl. 2024, 36, 16621–16656. [Google Scholar] [CrossRef]
  25. Zaman, M.; Puryear, N.; Abdelwahed, S.; Zohrabi, N. A review of IoT-based smart city development and management. Smart Cities 2024, 7, 1462–1501. [Google Scholar] [CrossRef]
  26. De Curtò, J.; de Zarzà, I.; Cano, J.C.; Manzoni, P.; Calafate, C.T. Adaptive truck platooning with drones: A decentralized approach for highway monitoring. Electronics 2023, 12, 4913. [Google Scholar] [CrossRef]
  27. Alaba, F.A.; Oluwadare, A.; Sani, U.; Oriyomi, A.A.; Lucy, A.O.; Najeem, O. Enabling sustainable transportation through iot and aiot innovations. In Artificial Intelligence of Things for Achieving Sustainable Development Goals; Springer: Berlin/Heidelberg, Germany, 2024; pp. 273–291. [Google Scholar]
  28. Annunziata, D.; Chiaro, D.; Qi, P.; Piccialli, F. On the Road to AIoT: A Framework for Vehicle Road Cooperation. IEEE Internet Things J. 2024, 12, 5783–5791. [Google Scholar] [CrossRef]
  29. Krajzewicz, D.; Erdmann, J.; Behrisch, M.; Bieker, L. Recent development and applications of SUMO—Simulation of Urban MObility. Int. J. Adv. Syst. Meas. 2012, 5, 128–138. [Google Scholar]
  30. Higuchi, T.; Zhong, L.; Onishi, R. NUMo: Nagoya urban mobility scenario for city-scale V2X simulations. In Proceedings of the 2024 IEEE Vehicular Networking Conference (VNC), Kobe, Japan, 29–31 May 2024; pp. 17–24. [Google Scholar]
  31. Roccotelli, M.; Volpe, G.; Fanti, M.P.; Mangini, A.M. A Co-Simulation Framework for Autonomous Mobility in Urban Mixed Traffic Context. In Proceedings of the 2024 IEEE 20th International Conference on Automation Science and Engineering (CASE), Bari, Italy, 28 August–1 September 2024; pp. 812–817. [Google Scholar]
  32. Yang, K.; Tan, I.; Menendez, M. A reinforcement learning based traffic signal control algorithm in a connected vehicle environment. In Proceedings of the 17th Swiss Transport Research Conference (Strc 2017), STRC 2017, Ascona, Switzerland, 17–19 May 2017. [Google Scholar]
  33. Liu, J.; Qin, S.; Su, M.; Luo, Y.; Wang, Y.; Yang, S. Multiple intersections traffic signal control based on cooperative multi-agent reinforcement learning. Inf. Sci. 2023, 647, 119484. [Google Scholar] [CrossRef]
  34. Chen, W.; Yang, S.; Li, W.; Hu, Y.; Liu, X.; Gao, Y. Learning Multi-Intersection Traffic Signal Control via Coevolutionary Multi-Agent Reinforcement Learning. IEEE Trans. Intell. Transp. Syst. 2024, 25, 15947–15963. [Google Scholar] [CrossRef]
  35. Naranjo, J.E.; Serradilla, F.; Nashashibi, F. Speed control optimization for autonomous vehicles with metaheuristics. Electronics 2020, 9, 551. [Google Scholar] [CrossRef]
  36. Kebbati, Y.; Ait-Oufroukh, N.; Vigneron, V.; Ichalal, D.; Gruyer, D. Optimized self-adaptive PID speed control for autonomous vehicles. In Proceedings of the 2021 26th International Conference on Automation and Computing (ICAC), Portsmouth, UK, 2–4 September 2021; pp. 1–6. [Google Scholar]
  37. Ding, H.; Zhang, L.; Chen, J.; Zheng, X.; Pan, H.; Zhang, W. MPC-based dynamic speed control of CAVs in multiple sections upstream of the bottleneck area within a mixed vehicular environment. Phys. Stat. Mech. Its Appl. 2023, 613, 128542. [Google Scholar] [CrossRef]
  38. Zhu, M.; Wang, Y.; Pu, Z.; Hu, J.; Wang, X.; Ke, R. Safe, efficient, and comfortable velocity control based on reinforcement learning for autonomous driving. Transp. Res. Part C Emerg. Technol. 2020, 117, 102662. [Google Scholar] [CrossRef]
  39. Du, Y.; Chen, J.; Zhao, C.; Liu, C.; Liao, F.; Chan, C.-Y. Comfortable and energy-efficient speed control of autonomous vehicles on rough pavements using deep reinforcement learning. Transp. Res. Part C Emerg. Technol. 2022, 134, 103489. [Google Scholar] [CrossRef]
  40. Shiwakoti, N.; Stasinopoulos, P.; Fedele, F. Investigating the state of connected and autonomous vehicles: A literature review. Transp. Res. Procedia 2020, 48, 870–882. [Google Scholar] [CrossRef]
  41. Ahmed, H.U.; Huang, Y.; Lu, P.; Bridgelall, R. Technology developments and impacts of connected and autonomous vehicles: An overview. Smart Cities 2022, 5, 382–404. [Google Scholar] [CrossRef]
  42. Talebpour, A.; Mahmassani, H.S. Influence of connected and autonomous vehicles on traffic flow stability and throughput. Transp. Res. Part C Emerg. Technol. 2016, 71, 143–163. [Google Scholar] [CrossRef]
  43. Sun, Y.; Fesenko, H.; Kharchenko, V.; Zhong, L.; Kliushnikov, I.; Illiashenko, O.; Morozova, O.; Sachenko, A. UAV and IoT-based systems for the monitoring of industrial facilities using digital twins: Methodology, reliability models, and application. Sensors 2022, 22, 6444. [Google Scholar] [CrossRef]
  44. Motlagh, N.H.; Bagaa, M.; Taleb, T. UAV-based IoT platform: A crowd surveillance use case. IEEE Commun. Mag. 2017, 55, 128–134. [Google Scholar] [CrossRef]
  45. Cheng, N.; Wu, S.; Wang, X.; Yin, Z.; Li, C.; Chen, W.; Chen, F. AI for UAV-assisted IoT applications: A comprehensive review. IEEE Internet Things J. 2023, 10, 14438–14461. [Google Scholar] [CrossRef]
  46. Reza, S.; Ferreira, M.C.; Machado, J.; Tavares, J.M.R. A citywide TD-learning based intelligent traffic signal control for autonomous vehicles: Performance evaluation using SUMO. Expert Syst. 2025, 42, e13301. [Google Scholar] [CrossRef]
  47. Mamond, A.W.; Kundroo, M.; Yoo, S.E.; Kim, S.; Kim, T. FLDQN: Cooperative Multi-Agent Federated Reinforcement Learning for Solving Travel Time Minimization Problems in Dynamic Environments Using SUMO Simulation. Sensors 2025, 25, 911. [Google Scholar] [CrossRef]
  48. Janota, A.; Kalus, F.; Pirník, R.; Kafková, J.; Kuchár, P.; Skuba, M.; Holečko, P. Reinforcement Learning Approach to Adaptive Traffic Signal Control Using SUMO-RL. In Proceedings of the 2024 25th International Carpathian Control Conference (ICCC), Krynica Zdrój, Poland, 22–24 May 2024; pp. 1–6. [Google Scholar]
  49. Chavhan, S.; Doswada, R.; Gunjal, S.; Rodrigues, J.J. Next Generation Intelligent Traffic Signal Control: Empowering Electronics Consumers With Edge-AIoT Capabilities. IEEE Trans. Consum. Electron. 2025. [Google Scholar] [CrossRef]
  50. Din, I.U.; Almogren, A.; Rodrigues, J.J. AIoT integration in autonomous vehicles: Enhancing road cooperation and traffic management. IEEE Internet Things J. 2024, 11, 35942–35949. [Google Scholar] [CrossRef]
  51. Choudekar, P.; Singh, R. Traffic Management System Using AIoT. In Reshaping Intelligent Business and Industry: Convergence of AI and IoT at the Cutting Edge; John Wiley & Sons: Hoboken, NJ, USA, 2024; pp. 439–458. [Google Scholar]
  52. Forkan, A.R.M.; Kang, Y.B.; Marti, F.; Banerjee, A.; McCarthy, C.; Ghaderi, H.; Costa, B.; Dawod, A.; Georgakopolous, D.; Jayaraman, P.P. AIoT-citysense: AI and IoT-driven city-scale sensing for roadside infrastructure maintenance. Data Sci. Eng. 2024, 9, 26–40. [Google Scholar] [CrossRef]
Figure 1. System architecture of the AI-driven traffic optimization framework. The diagram shows the data flow between SUMO, IoT sensors, the Python control module, and the Gemini-2.0-Flash LLM. Real-time traffic data are collected from induction loops (representing IoT sensors or drone monitors), processed by the Python module, and sent to the LLM for speed recommendations that are then applied to vehicles in the simulation.
Drones 09 00248 g001
Figure 2. Extracting the Pacific Beach road network from OpenStreetMap using osmWebWizard.
Drones 09 00248 g002
Figure 3. Editing the Pacific Beach traffic network using netedit in SUMO. Red dots indicate sensor locations.
Drones 09 00248 g003
Figure 4. Decision process flow of the LLM-driven traffic optimization system. The flowchart illustrates the sequential steps from data collection through LLM inference to speed adjustment implementation. The process includes a conditional update interval check that determines when to query the LLM for new speed recommendations, with continuous monitoring of traffic metrics throughout the simulation.
Drones 09 00248 g004
Figure 5. Traffic congestion over time across the three urban scenarios. Blue lines represent AI-controlled traffic, while red lines show baseline (non-AI) conditions. All scenarios demonstrate significant congestion reduction with AI intervention, with reduction percentages of 80.6% (Pacific Beach), 82.2% (Argüelles), and 62.2% (Coronado).
Drones 09 00248 g005
Figure 6. CO2 emission trends over time across the three urban scenarios. Blue lines represent AI-controlled traffic, while red lines show baseline (non-AI) conditions. The AI approach achieved emission reductions of 75.0% (Pacific Beach), 74.0% (Argüelles), and 57.3% (Coronado).
Drones 09 00248 g006
Table 1. Mean traffic congestion (%) across scenarios.
ScenarioBaseline (%)AI-Controlled (%)Reduction (%)
Pacific Beach10.82.180.6
Argüelles12.42.282.2
Coronado9.83.762.2
Table 2. Total CO2 emissions (g) across scenarios.
ScenarioBaseline (g)AI-Controlled (g)Reduction (%)
Pacific Beach4800120075.0
Argüelles5000130074.0
Coronado3400145057.3
Disclaimer/Publisher’s Note: The statements, opinions and data contained in all publications are solely those of the individual author(s) and contributor(s) and not of MDPI and/or the editor(s). MDPI and/or the editor(s) disclaim responsibility for any injury to people or property resulting from any ideas, methods, instructions or products referred to in the content.

