1. Introduction
Ports and coastal areas have a significant role in the economics of a city. On the other hand, they are also one of the most sensitive places, generally due to the corrosive environment in which they exist [
1], adverse marine environments, human-induced factors, inadequate or absent maintenance, and climate changes [
2,
3,
4,
5] that cause infrastructure degradation [
6] and that affect structural integrity and resilience of maritime structures.
A wide assortment of structures protect coastal activities and communities from the action of tides and waves. Insufficient preservation can increase the risk of strong degradation of and damage to such structures that can have different levels of danger: aesthetic, functional, or structural. Hence, regular monitoring of port areas and waterfront is mandatory to avoid erosions, damages, and, in the worst scenario, disasters. In this case, the possibility of trusting in regular, accurate monitoring is fundamental [
7]. It allows effective and reliable evidence on the state of integrity of the structures, upon which basis decision makers and planners can create up-to-date executive plans [
8,
9] in a way that is cost-effective and proactive. These periodical inspections can offer comprehensive data on the infrastructure’s health conditions.
The up-to-date port vulnerability evaluation practices rely on the investigation of a variety of parameters (e.g., technical, physical, environmental, and socioeconomic). From an engineering point of view, ports’ vulnerability is strongly influenced by the structural condition of their parts. Hence, an ever-increasing necessity for infrastructure monitoring is highly recommended that allow for (i) evaluating existing performance, (ii) prioritizing maintenance and repair treatments, (iii) investigating the suitability of different uses and loads, and (iv) expanding the structure’s lifetime. The Permanent International Association of Navigation Congresses [
10] suggests and encourages the use of strategies built upon Structural Health Monitoring (SHM) principles with contact (e.g., accelerometers, displacement sensors) and non-contact (e.g., Non-Destructive Testing) measurement, which includes damage detection for structural response, evaluation of structural condition, and intervention actions [
11]. Considering this, SHM is already a mature science that has been applied in various engineering fields of infrastructure monitoring including bridges and some sensitive facilities (e.g., large dams or tunnels) within national defence or civil protection. Unfortunately, environmental conditions can influence the results [
11], such as high temperature and humidity [
12].
Remote sensing techniques are extensively used for infrastructures monitoring [
13] because they offer different instruments and devices depending on the object surveyed and allow both qualitative and quantitative measurements [
14,
15,
16]. Satellite, aerial, Unmanned Aerial Vehicles (UAVs), or close-range data can be used differentially or combined for the best result based on the objectives. Furthermore, if the surveys are scheduled periodically, these techniques can also offer temporal information, permitting users to obtain 4D structural analysis data.
As far as port areas are concerned, satellite imagery is generally used for monitoring land use changes [
17,
18] while UAVs are used for analysing infrastructure condition [
3,
19,
20]. The use of a single technology, especially in the study of a complex area, is limited: satellite images do not help in identifying details [
21], and close-range applications requires a time-consuming operation in situ, making it difficult to constantly monitor the area. The use of UAVs can compensate for the cons of the other technologies, even though they require many permits, especially with military installations. Therefore, the combination of these three methodologies is fundamental when dealing with the monitoring and documentation of this type of area. Each technology overcomes the limitation of the other two, allowing the combination to provide the most accurate data possible.
The employment of UAVs has rapidly become a significant topic in the research in infrastructure inspection [
22] because it allows image capturing and video recording to assist in the assessment of in situ infrastructure condition and visualization of the relevant output [
16]. Concerning port inspections, infrastructure monitoring has been analysed by some authors, e.g., refs. [
3,
23], while the application of monitoring security and controlling port services and areas is demonstrated by ref. [
24,
25]. The use of LiDAR digital photogrammetry in measuring rock slope damage on rubble mound breakwater was firstly employed on 2D-physical scaled models [
26,
27]. Recently, ref. [
28] showed that the damage level estimated by digital photogrammetry falls in the same range of the damage calculated by the standard laser profile procedure, with a mean relative error of about 5%. The value of UAV platforms for the monitoring and protection of coastal structures is also highlighted in ref. [
29], in which the importance is underlined of a systematic survey such as a UAV-based one that is cost-effective, offers high-resolution data, and gives access to difficult areas. The importance and usefulness of UAV photogrammetry is also emphasised in ref. [
30], which indicates the most common advantages using a drone for photogrammetry: (i) rather low hardware costs; (ii) high level of automation of photogrammetric survey; (iii) very low functioning cost; (iv) high repeatability of the survey with low costs; (v) high resolution photographs due to the low altitude of the flight; (v) use of ground control points (GCPs) for the survey; (vi) possibility of checking the images acquired immediately, allowing reacquisition of the images in case of blurred or damaged ones. The importance of drones for photogrammetric surveys aimed at monitoring maritime areas is described in ref. [
31], in which the authors underline the advantages of the use of UAVs and the problems faced during the work. The possibility, with drone surveys, of obtaining accurate 3D models through photogrammetry is fundamental when dealing with strategic environmental areas.
This paper presents the combined use of satellite, UAVs, and close-range images to identify discontinuities in the shape of a dock in the city of Naples. The idea is to create a 4D database (3D + time) that allows us to accurately monitor the dock area of the city of Naples to provide the best line of intervention during the restoration of the damages. By now, 2D data (satellite images) have been used for a visual comparison of coastlines that has started to be integrated with UAV 2D (orthophotos) and 3D data (models from UAV survey). These products have, by now, only covered one year, so the 4D repository of damage in the area will have a more reliable and accurate importance after few years, but it is a start in the monitoring of a key area that has been subjected through the years to heavy wave floods, winds, and coastal storms that have affected the stability of the structure, especially the part in the open water. One of the most encouraging aspects of 4D monitoring of port areas is its prospects for environmental governance and protection of anthropized areas, and hence the safety of citizens. Port areas are, by their intrinsic nature, exposed to several type of environmental and natural elements, and hence they require a regular inspection. The use of 3D technologies, especially when combined as aerial and close-range, above and below water [
32], has improved the accuracy and precision of data, along with the amount of time needed for the documentation of the area.
The project presented in this paper started with 2D data because, since the beginning of 2024, it was not possible to fly a UAV above the structure and take pictures, nor to acquire images on foot for close-range photogrammetry. However, the importance of the monitoring and the desire of the local maritime authority to have an initial point from which to start brainstorming regarding the conservation actions needed for the area pressed the timing of the research. Therefore, the only possibility was to use satellite images acquired through time to firstly identify the damages and provide the maritime authority with a first set of data
2. Materials and Methods
2.1. Description of the Area
The study area is in Naples’ harbour (Italy) in Middle Tyrrhenian Sea. The Port of Naples ranks as the 8th largest seaport in the country [
33], with an annual capacity of approximately 18.5 million tons of cargo and 595,000 TEUs. It also functions as a major tourist hub. By number of total passengers, with over 8.7 million annually, it ranks as the second most important in the Italian context.
From the perspective of the layout configuration of its external structures, the Port of Naples can be considered a hybrid port, combining elements of a classic “basin” configuration with a layout featuring a main breakwater parallel to the coast. Looking at
Figure 1, two main elements can be identified: (i) a coastline-attached breakwater (the “San Vincenzo” breakwater) with a secondary breakwater (called the “Duca degli Abruzzi” dam) and (ii) a detached breakwater, constituted by the “antemurale Tahon de Revel” and the “Duca d’Aosta” breakwater. The analysis in the present work involved all these four elements. Since the San Vincenzo breakwater is partially protected by other nearshore coastal defences, only its second half (i.e., on deeper waters) was considered.
The San Vincenzo breakwater represents a traditional rubble mound breakwater. The seaward armour layer is constituted by grooved concrete with holes, normally known as “antifer” blocks. The seaward slope at the mean water level (MWL) is of 1:2. The San Vincenzo breakwater was brought to attention because it hosts the first worldwide prototype of an overtopping wave energy converter integrated into a traditional rubble-mound breakwater [
34]. The prototype, termed OBREC (Overtopping BReakwater for Energy Conversion), constitutes a part of the seaward armour layer, with an area of 6 m × 12.5 m. The construction phase lasted for about 4 months (from July to September 2015).
The Duca degli Abruzzi breakwater, completed in 1925, provides additional protection against the main wave sector and is located outside the San Vincenzo pier. It was built with vertical caisson prefabricated elements featuring a particular lobed shape to reduce wave reflection. The caissons were placed on a rubble mound foundation.
The Tahon de Revel and Duca d’Aosta breakwaters were completed in the early 1920s using prefabricated cyclopean blocks stacked one on top of the other. At the end of the 1990s, the Duca d’Aosta breakwater underwent modifications on the external facing, i.e., adding cyclopean “tetrapod” blocks on the seaward, to reduce the effects of wave reflection. In addition, the breakwater was extended by 135 m by using prefabricated monolithic structures with a particular lobate pattern, placed to form a 15° angle with the existing breakwater. The caissons were then completed on site by creating a superstructure and a safeguarding wall (crown wall).
The water depth at the toe of the breakwaters in the area, ranging from 24 to 35 m, avoids the occurrence of breaking conditions for extreme waves, with significant wave height exceeding 3 m during the period from November to March. Recently, an intense sea storm affected the Gulf of Naples on 28 December 2020 [
35,
36], impacting directly on the port waterfront and causing severe consequences, as also highlighted by the present work.
2.2. Materials
Landsat satellite images were used as a preliminary 4D database to identify the damage that had occurred through time due to heavy coastal storms. This choice was due to its applications that include land cover/change monitoring, agricultural forecasting, disaster response, urban planning, land and water resource management, and ecosystem monitoring. The collection of the images covered a span of 14 to 16 years, depending on the area of interest in the research. The research started with the acquisition of Landsat 7 images for the year 2008 and then images from Landsat 8 for the years 2013–2024 [
37]. The dates of acquisition of the images are as follow: 20 April 2008; 19 June 2013; 29 June 2016; 14 November 2018; 5 September 2019; 29 July 2020; 9 April 2021.
The Landsat 7 program [
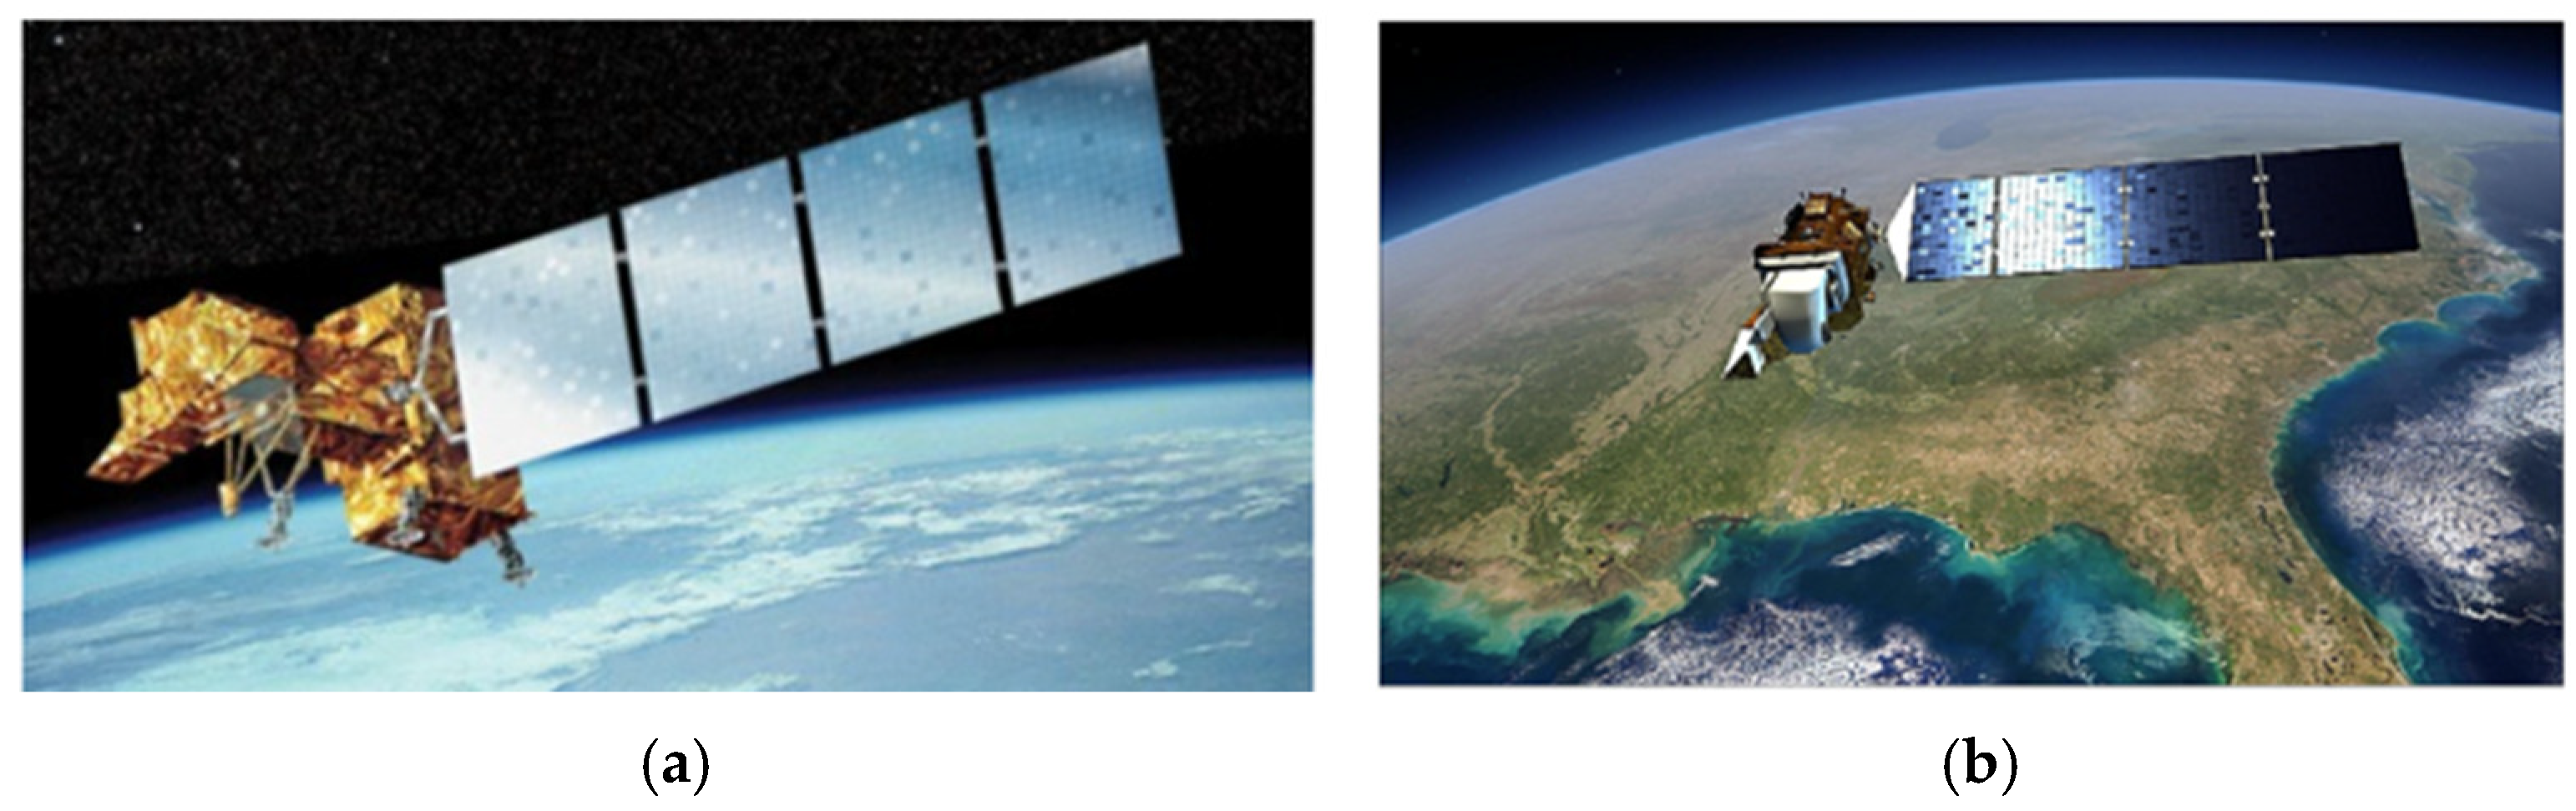
38] was launched by NASA in April 1999 to enhance the medium resolution multispectral images of Earth and was joined by Landsat 8 in February 2013. It introduces the Enhanced Thermal Mapper Plus (ETM+), a scanning radiometer which can acquire images in eight distinct bands: four visible and near-infrared (VNIR), two short wave infrared (SWIR), one thermal infrared (TIR), and one panchromatic (PAN) band. Landsat 7 (
Figure 2a) moves in a sun-synchronous polar orbit at an altitude of 705 km with an inclination of 98.2°. The nominal descending equator crossing time is at 1000–1015, with a period of 99 min and repeat coverage of 16 days.
Other images were taken by the Landsat 8 program, the first of the Landsat Data Continuity Mission (LDCM). The latter is operated by the United States Geological Survey (USGS) and aims to collect and archive thermal and multispectral image data whilst guaranteeing consistency with previous Landsat mission data [
39]. Landsat 8 (
Figure 2b) presents an Operational Land Imager (OLI) and a Thermal Infrared Sensor instrument (TIRS), which replace the Enhanced Thematic Mapper Plus (ETM+). It is a multispectral and moderate resolution imager with nine spectral bands covering a spectral range from 433–2300 nm, including five bands in the visible and near-infrared spectrum (VNIR), three in the short-wave infrared spectrum (SWIR), and one panchromatic image (PAN) band for image sharpening. The sensors onboard have a more reliable architecture, making it geometrically stable but requiring terrain selection to ensure accurate band registration. The spacecraft can reach a 185 km strip width with a 15-degree field of view. The satellite moves in a sun-synchronous orbit at an altitude of 705 km with a period of 99 min and repeat coverage of 16 days. Their characteristics are summarized in
Table 1.
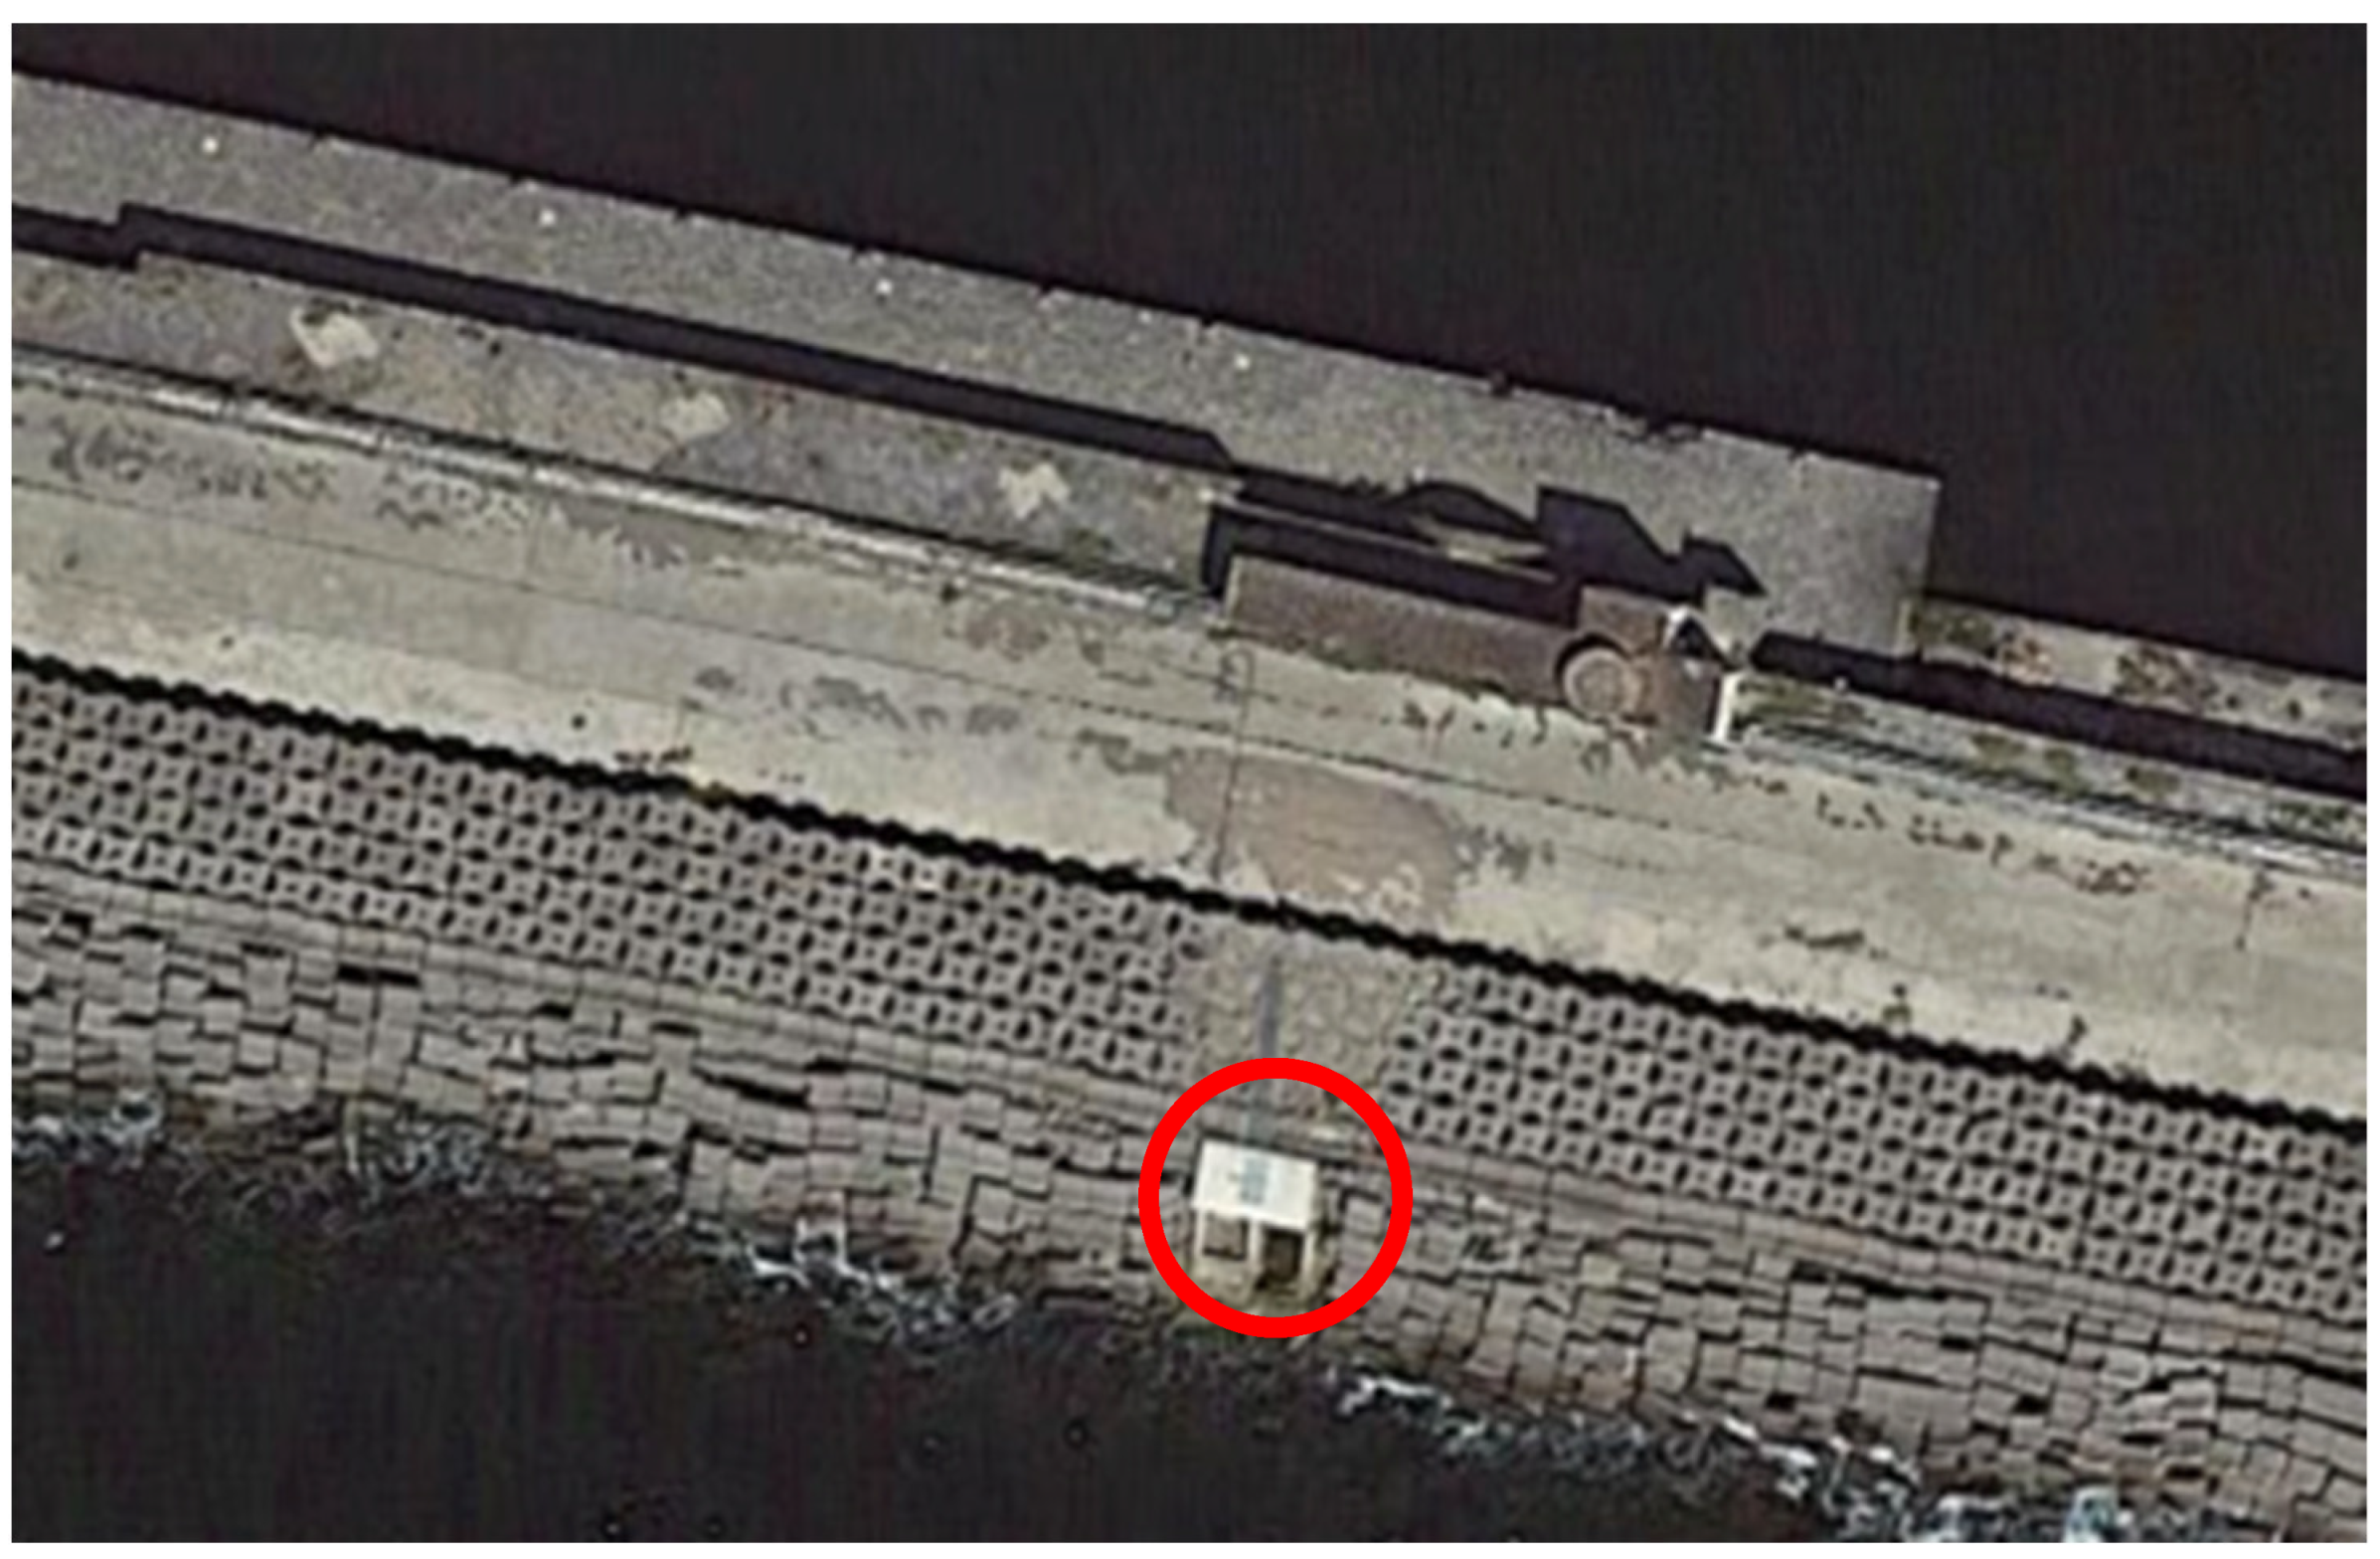
Their sharpness is, of course, not enough to overlap 3D models and classify all the concrete blocks that were moved from their position, but they were useful for the creation of a first 2D repository of damages. As soon as it was possible to have permission, a close-range photogrammetric model was created of a short portion of the San Vincenzo breakwater in which the OBREC is located (
Figure 3), and two UAV flights of all the area were conducted, one in January 2024 and the other in December 2024.
This was done out of a desire to document the place after a year, with the intention of doing it every year in the same period. In this way, it will be possible to control the condition of the dock.
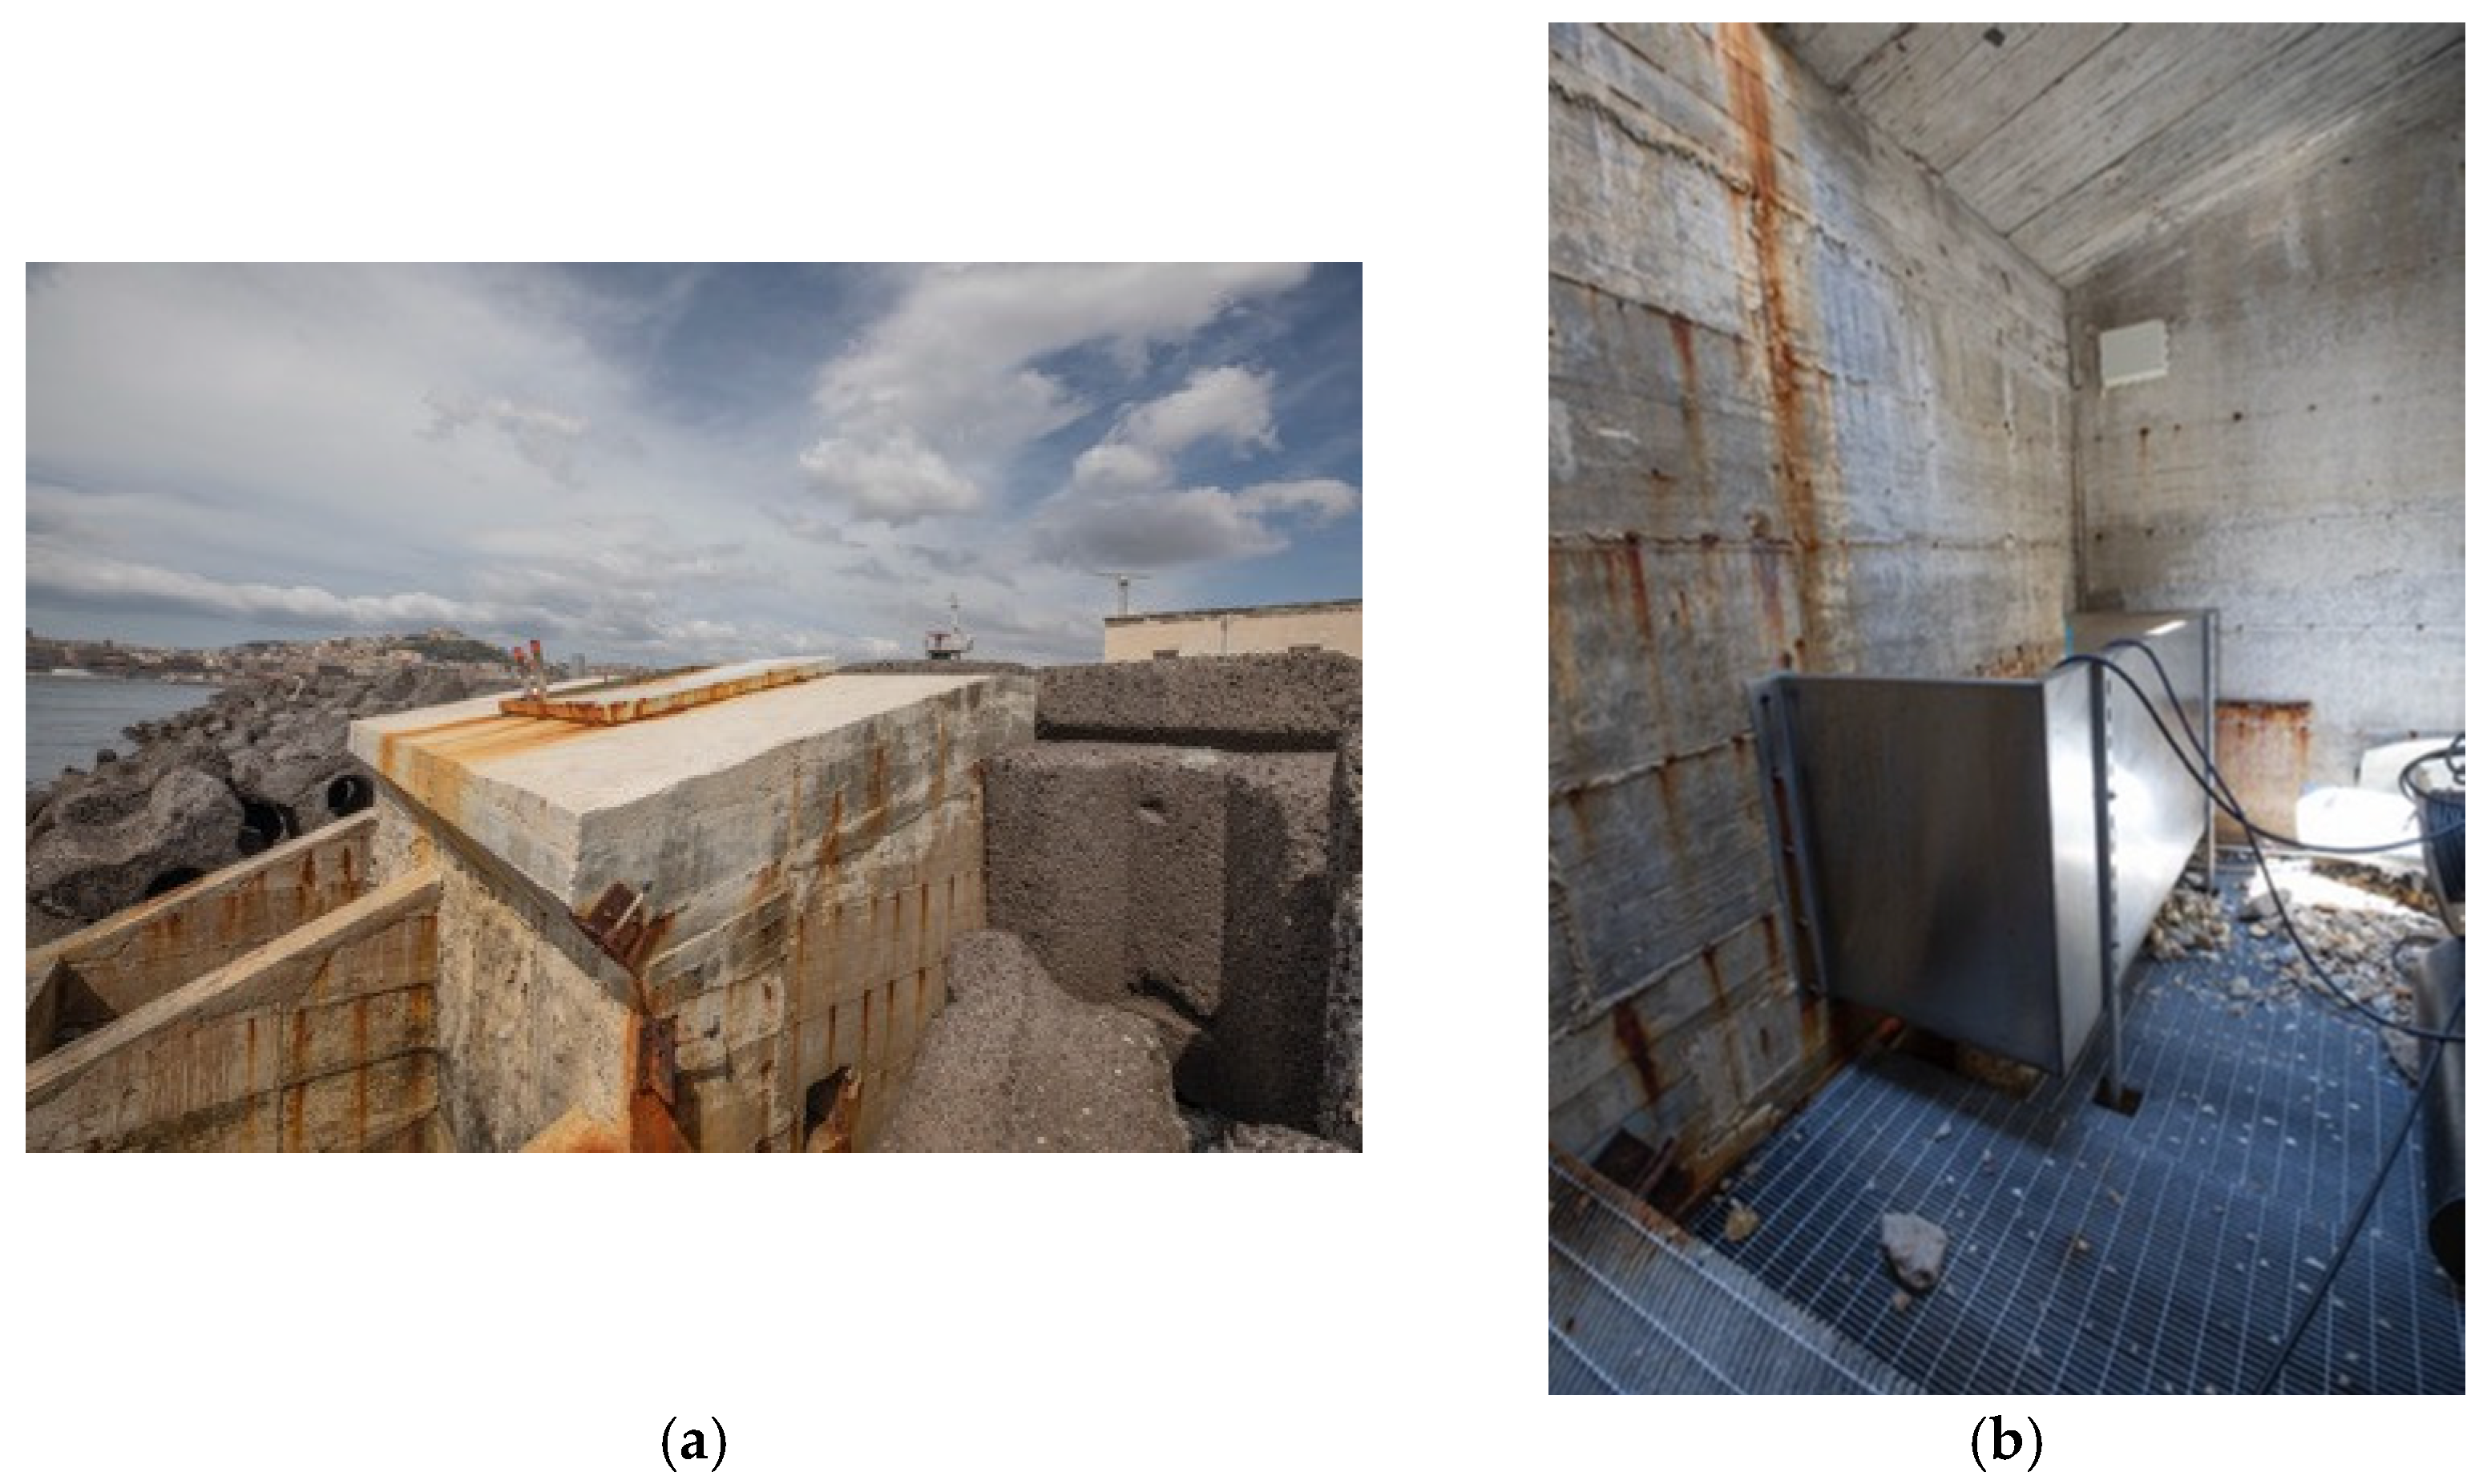
The close-range photogrammetry was performed using an APS Canon 60D camera coupled with a 16 mm wide lens. The survey covered a small area around the OBREC, focusing mainly on the acquisition of its inner chamber (
Figure 4), which hosts the mechanical and hydraulic equipment used to convert the wave flows into electricity. The laser scanning technology was not used because it was not possible to have electricity in the surroundings, as time of flight laser scanners need a socket to function, and because the inside of the OBREC is too narrow for a scanner to be used.
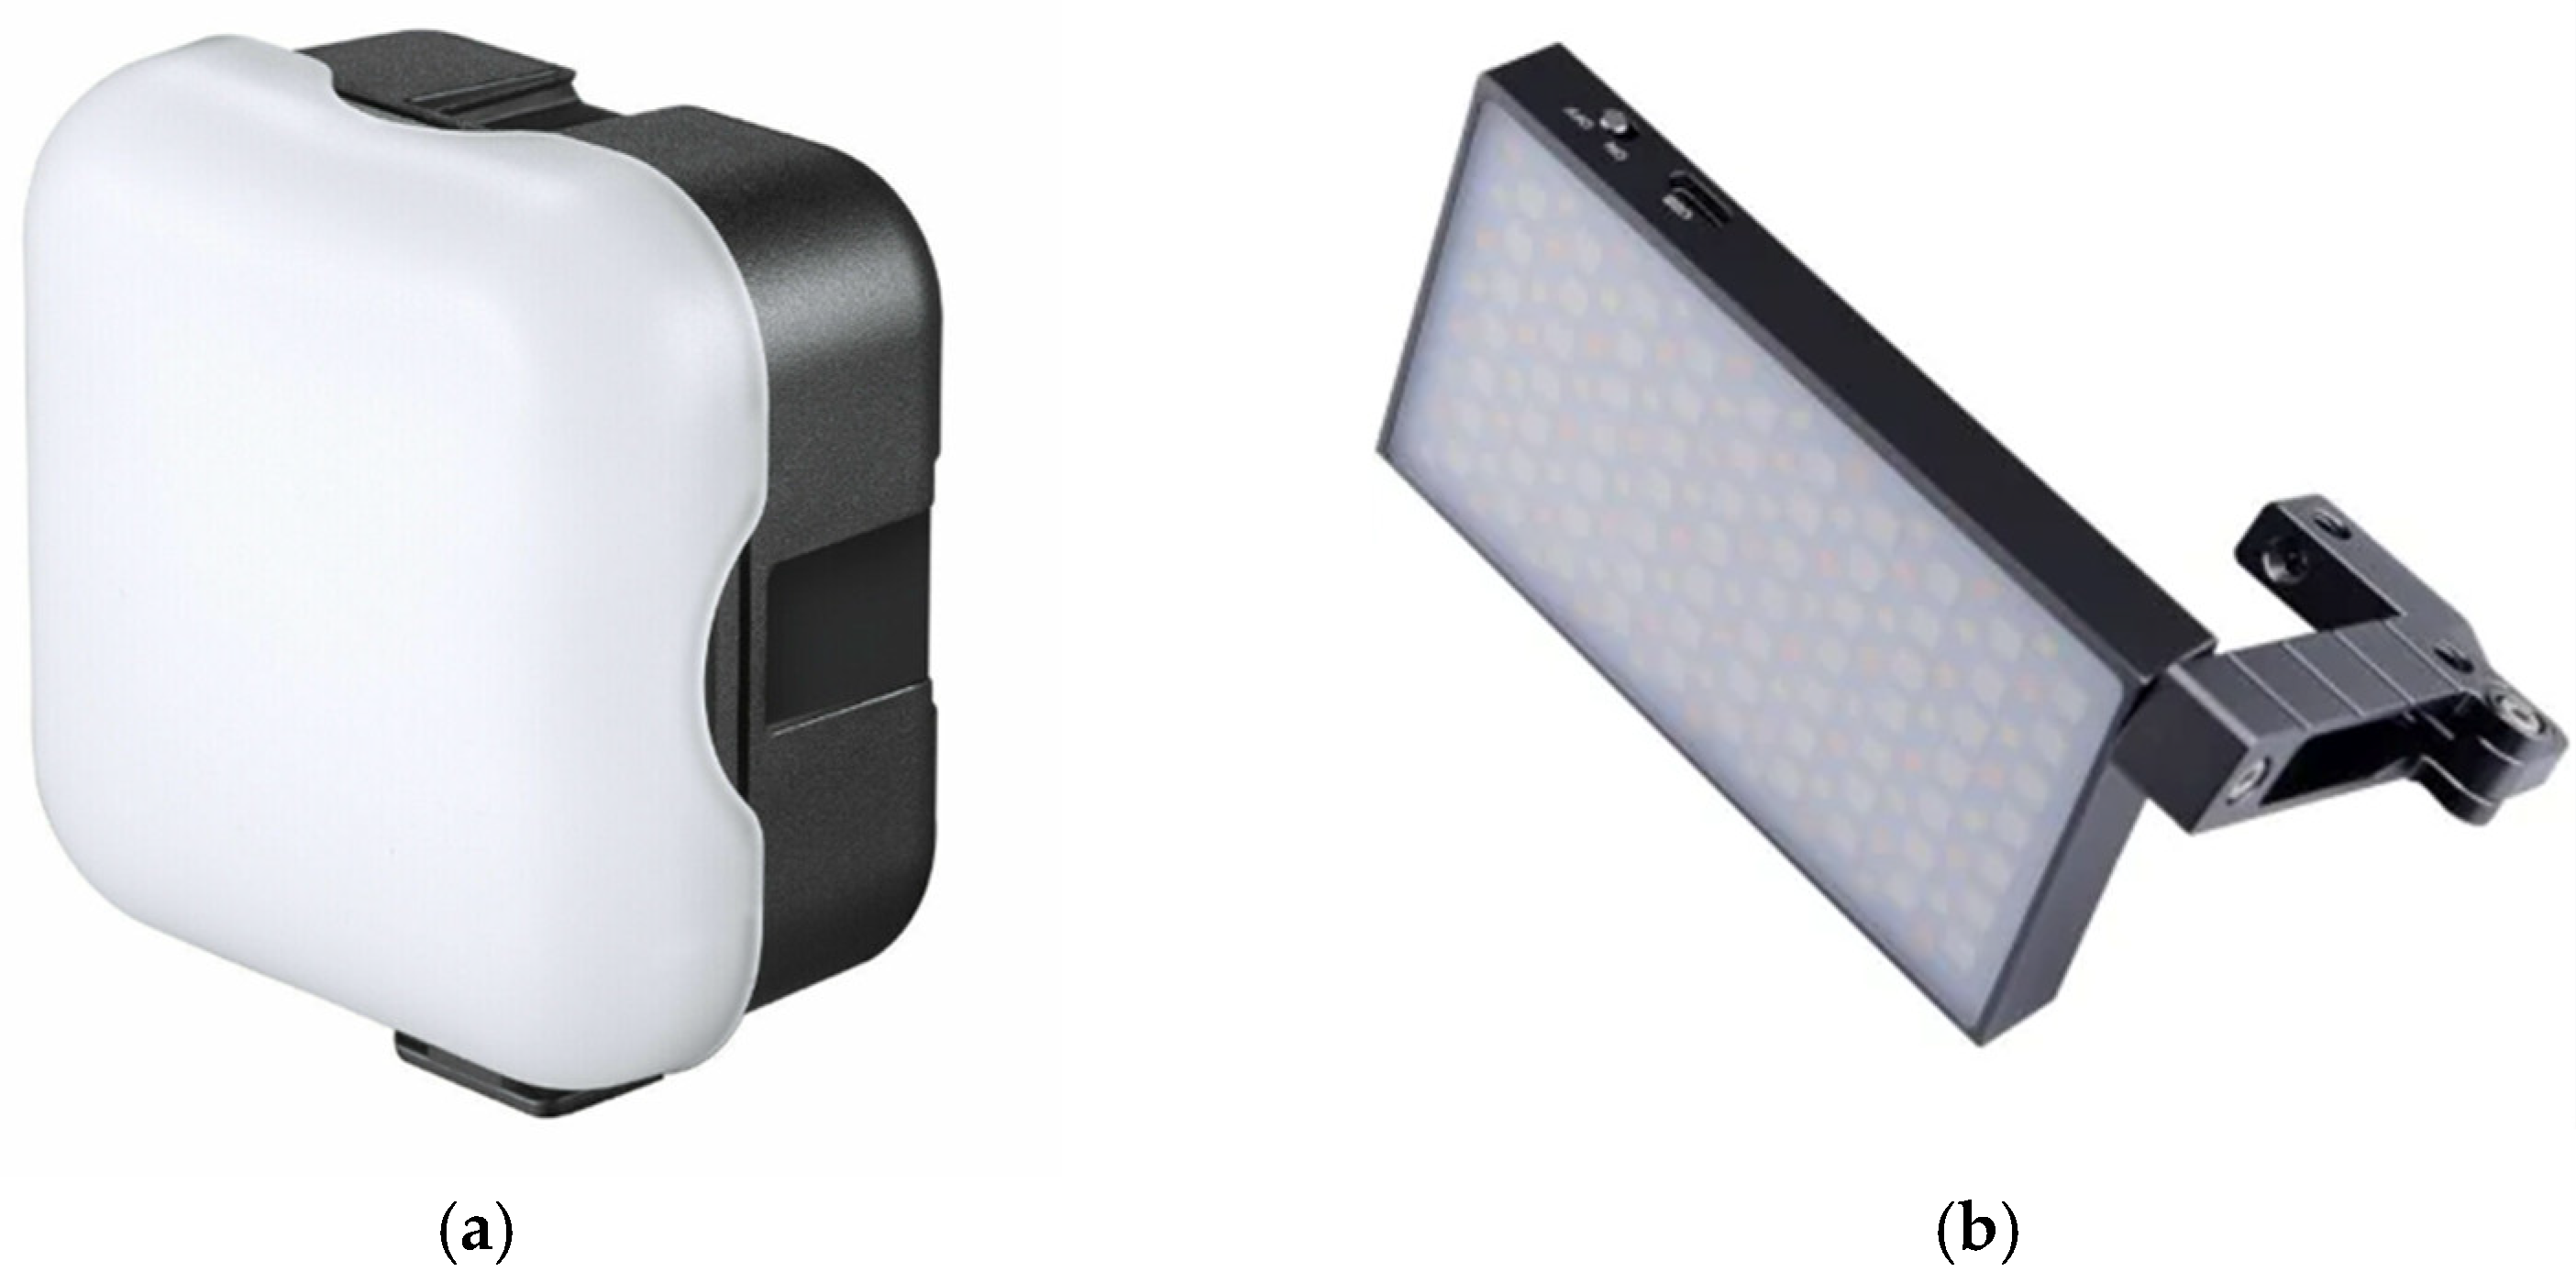
Due to the lack of illumination inside the OBREC and the impossibility of bringing an illuminator, the camera was integrated with a Godox (Milan, Italy)—LED LED6BI Bicolor 3200 K–6500 K CRI/TLCI 95 and a Godox LED LD-500W (
Figure 5a,b). These devices can be put on the camera in the place of the flash and provide a homogeneous light with different light spectra. They allowed us to lighten up the half-lighted spaces following the movement of the camera, thus providing illumination of the part surveyed. The choice between the two devices occurred considering the environmental light: when the place was too dark, the LED LD-500W was used, because it gave a brighter and stronger illumination.
As an improvement of both the satellite images and the close-range models, two UAV surveys were scheduled, one in January 2024 and one in December 2024, for the creation of 3D photogrammetric models of the breakwater.
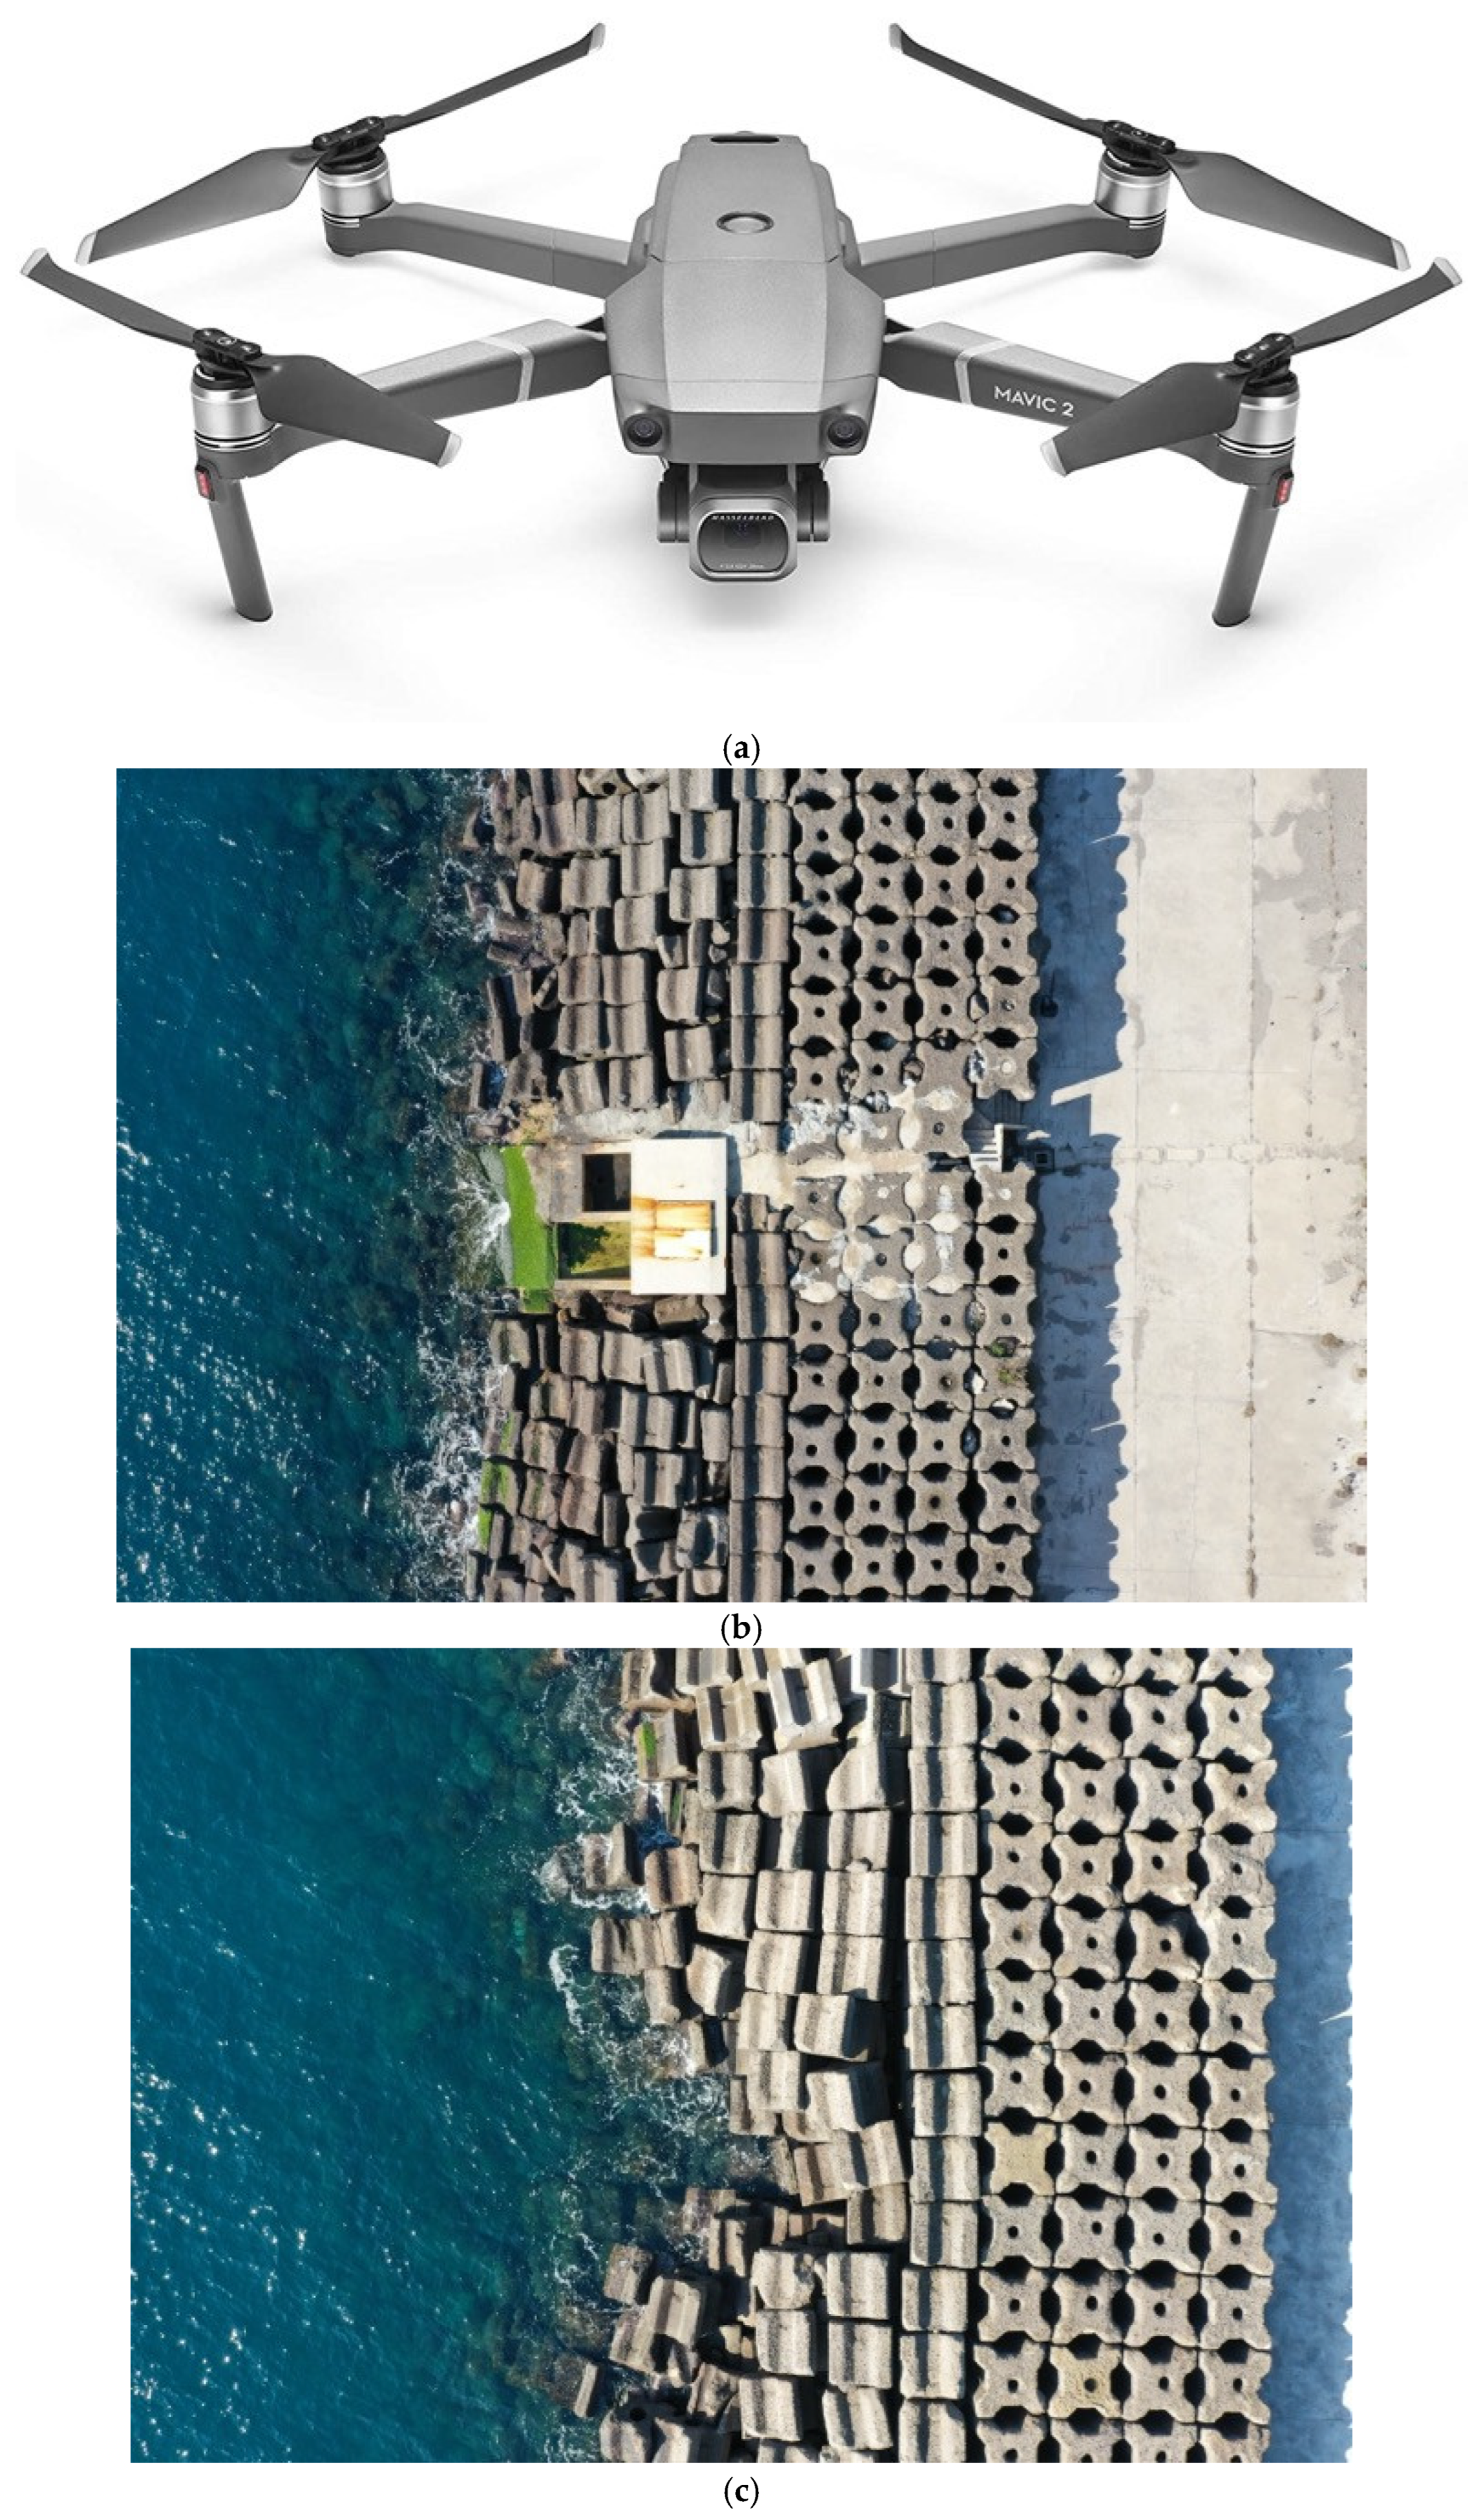
For the survey, a DJI Mavic Pro 2 drone with a 1″ CMOS sensor, Hasselbald L1D-20c camera (DJI, Milan, Italy) with f/2.8–f/11 aperture, and a 35mm lens equivalent to 28 mm was used. The image dimensions are 5472 × 3648 (
Figure 6a–c). The mechanical range tilt is from −135 to 45° and the pan is from −100 to 100°, while the controllable range tilt is from −90° to 30° and the pan is from −75° to 75°. The drone has also a 3-axis stabilization (tilt, roll, and pan) and uses both GPS and GLONASS. The specifics also state that the battery life is up to 31 min at a constant 25 km/h. For these surveys, since both the days were sunny and clear, the setup of the camera was as follow: f/4 stop, ISO 100.
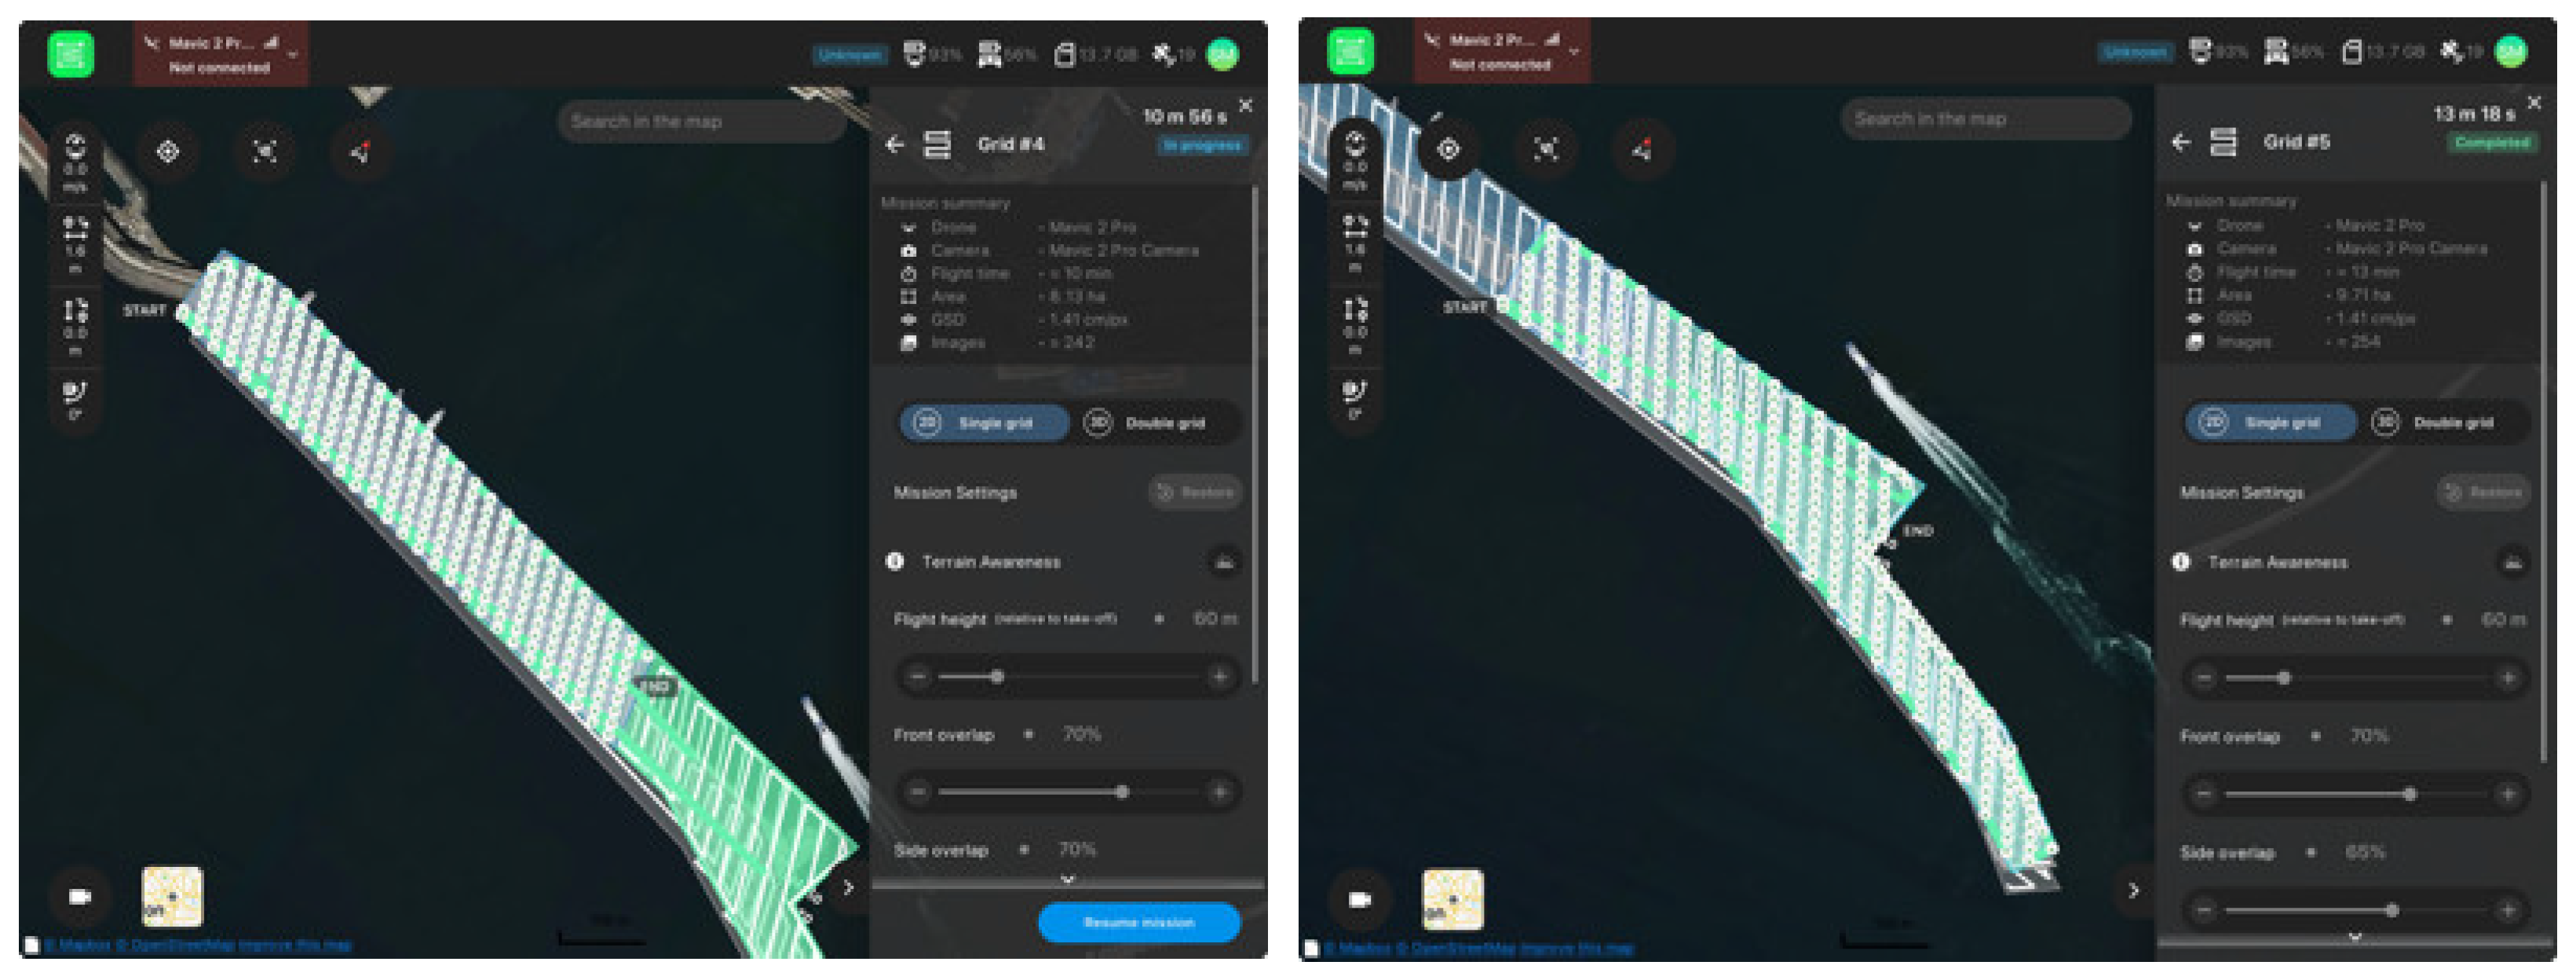
The flight plan was the same for both the flights: the survey started from the start point and moved in a grid; then it landed, the battery was changed, and the new survey with the same grid was performed on the last part (
Figure 7). The maximum time of flight was 18 min for the first flight and 20 min for the second flight due to the environmental conditions and the fact that tests and practices have make it clear that after 23 min in a situation with normal wind, the percentage of the battery decreases fast, starting from an already dangerous 21% battery life.
The first flight was made difficult by the strong wind, so the height of the flight was lower than the second one (40 m instead of 60 m). The result gave two different GSD, the first of 2.7 cm/px and the second of 4.07 cm/px, both more than enough for the purpose of the research. The first flight presents a number of images bigger than the second one: the reason lies both in the lower altitude, meaning a shorter land coverage in each photo, and an intention to acquire redundant data due to the wind. In this way, if few images were blurred because of the movement of the UAV, a surplus would have offered the possibility to substitute them with clearer ones. The overlap among images was 65% front and side for the first flight and 70% front and side for the second. For the first flight, oblique images with an overlap of 70% were also taken to fix the grid and increase the total overlapping of the images. No markers were placed on the ground since several well-known points acting as GCPs were used (e.g., the top of the lighthouse, the centre of the heliport), and the UAV has its own GPS data embodied in the exif of the camera. The deviation between the measurements of the UAV data and the data extracted from the fixed points spans a range of 10 cm. Having said that, the accuracy of the survey can certainly be increased, so for the next flights, a set of targets and a GNSS survey will be considered for integration.
3. Results
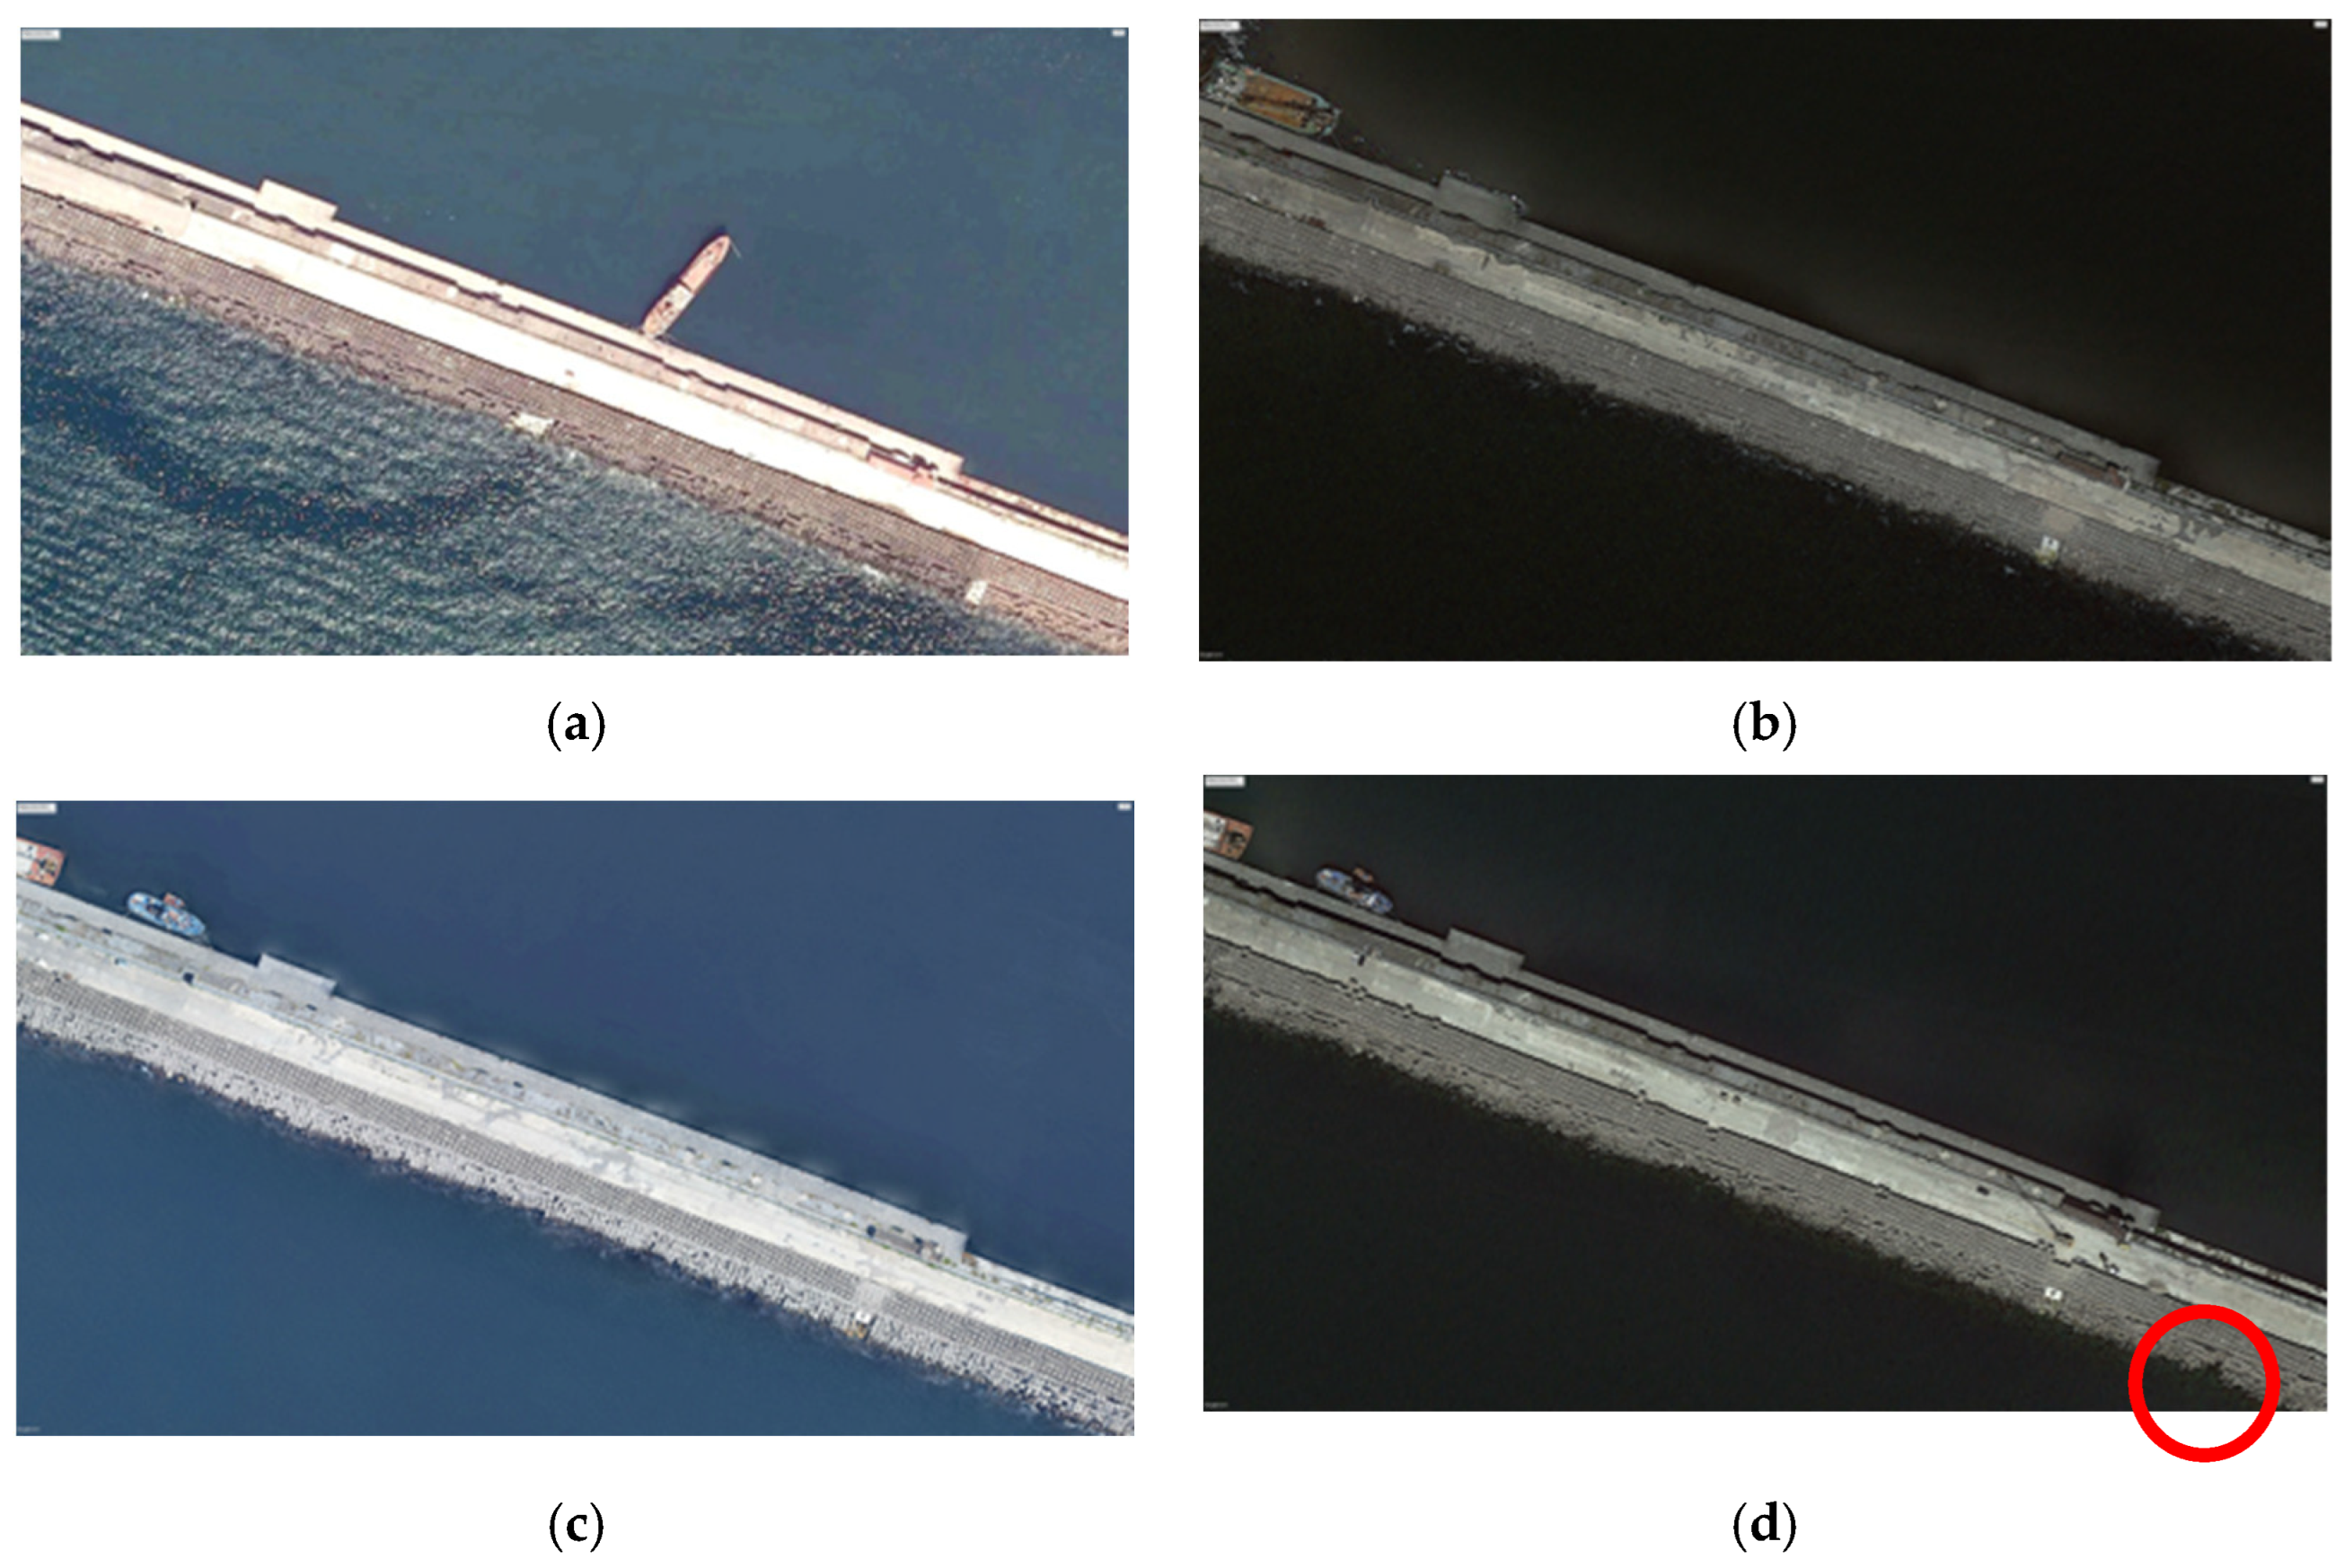
The satellite data were acquired, as mentioned, between the year 2008 and the year 2021. The idea was to compare the images to understand the changes in the shape of the dock (
Figure 8a–d). The portion chosen was the central one, where the OBREC was built. This choice was made because in that part of the San Vincenzo breakwater, the damage to the dock line is more visible and the decreased safety is more evident.
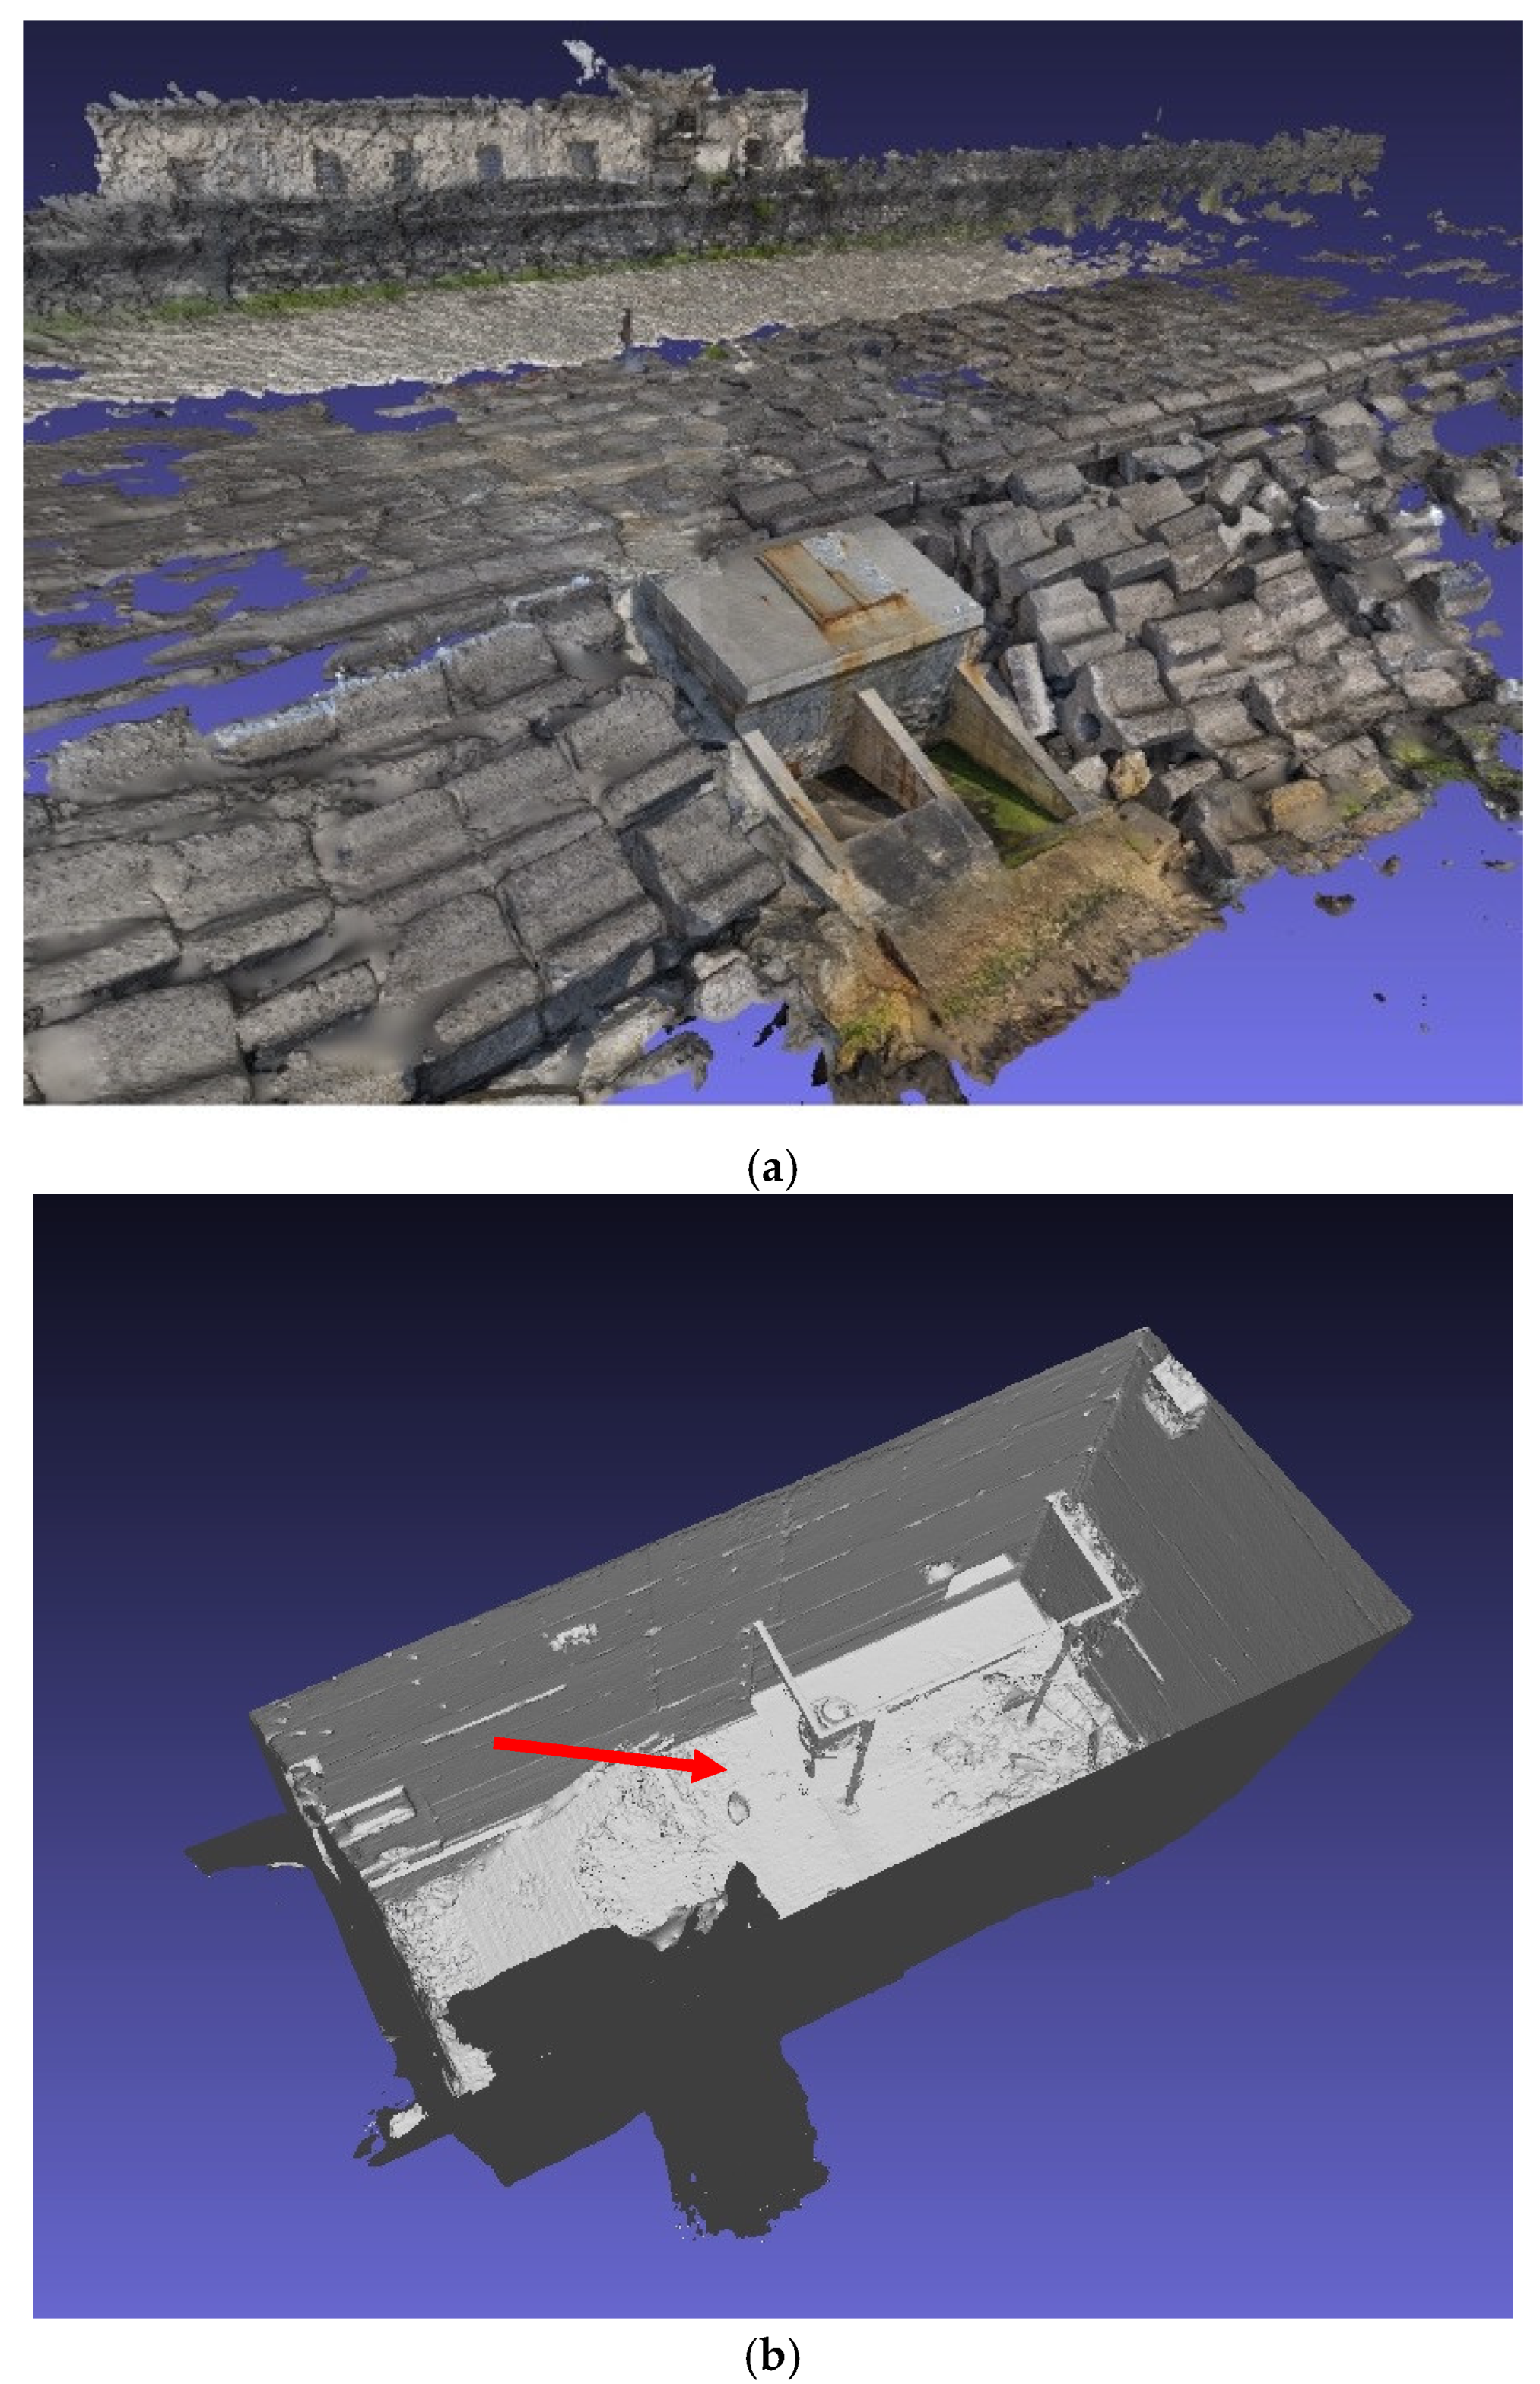
The result of the close-range photogrammetric survey can be seen in
Figure 9a,b: the survey covered the area close to the OBREC, mainly trying to acquire data of the outside geometry of the structure and partially of the surroundings (
Figure 9a), and then the inside, also covering a portion of the outside useful for the alignment of the two models (
Figure 9b).
The difficulties the survey ran into were, in the first place, the impossibility of covering the geometry of the surface of the dock in its entirety since walking on the surface, even with a wide-angle lens, does not allow for covering a sufficient portion of it because the shooting distance is too short. This led to a model with a lot of holes and missing parts, as can be easily seen in
Figure 9a. Considering the inside of the OBREC, the wide-angle lens was perfect for acquiring the images with a proper overlap, but the metal parts were too shiny, even with a low-light environment, due to the use of illuminators. It is visible in
Figure 9b (indicated by the red arrow) that the sides of the tank were not acquired.
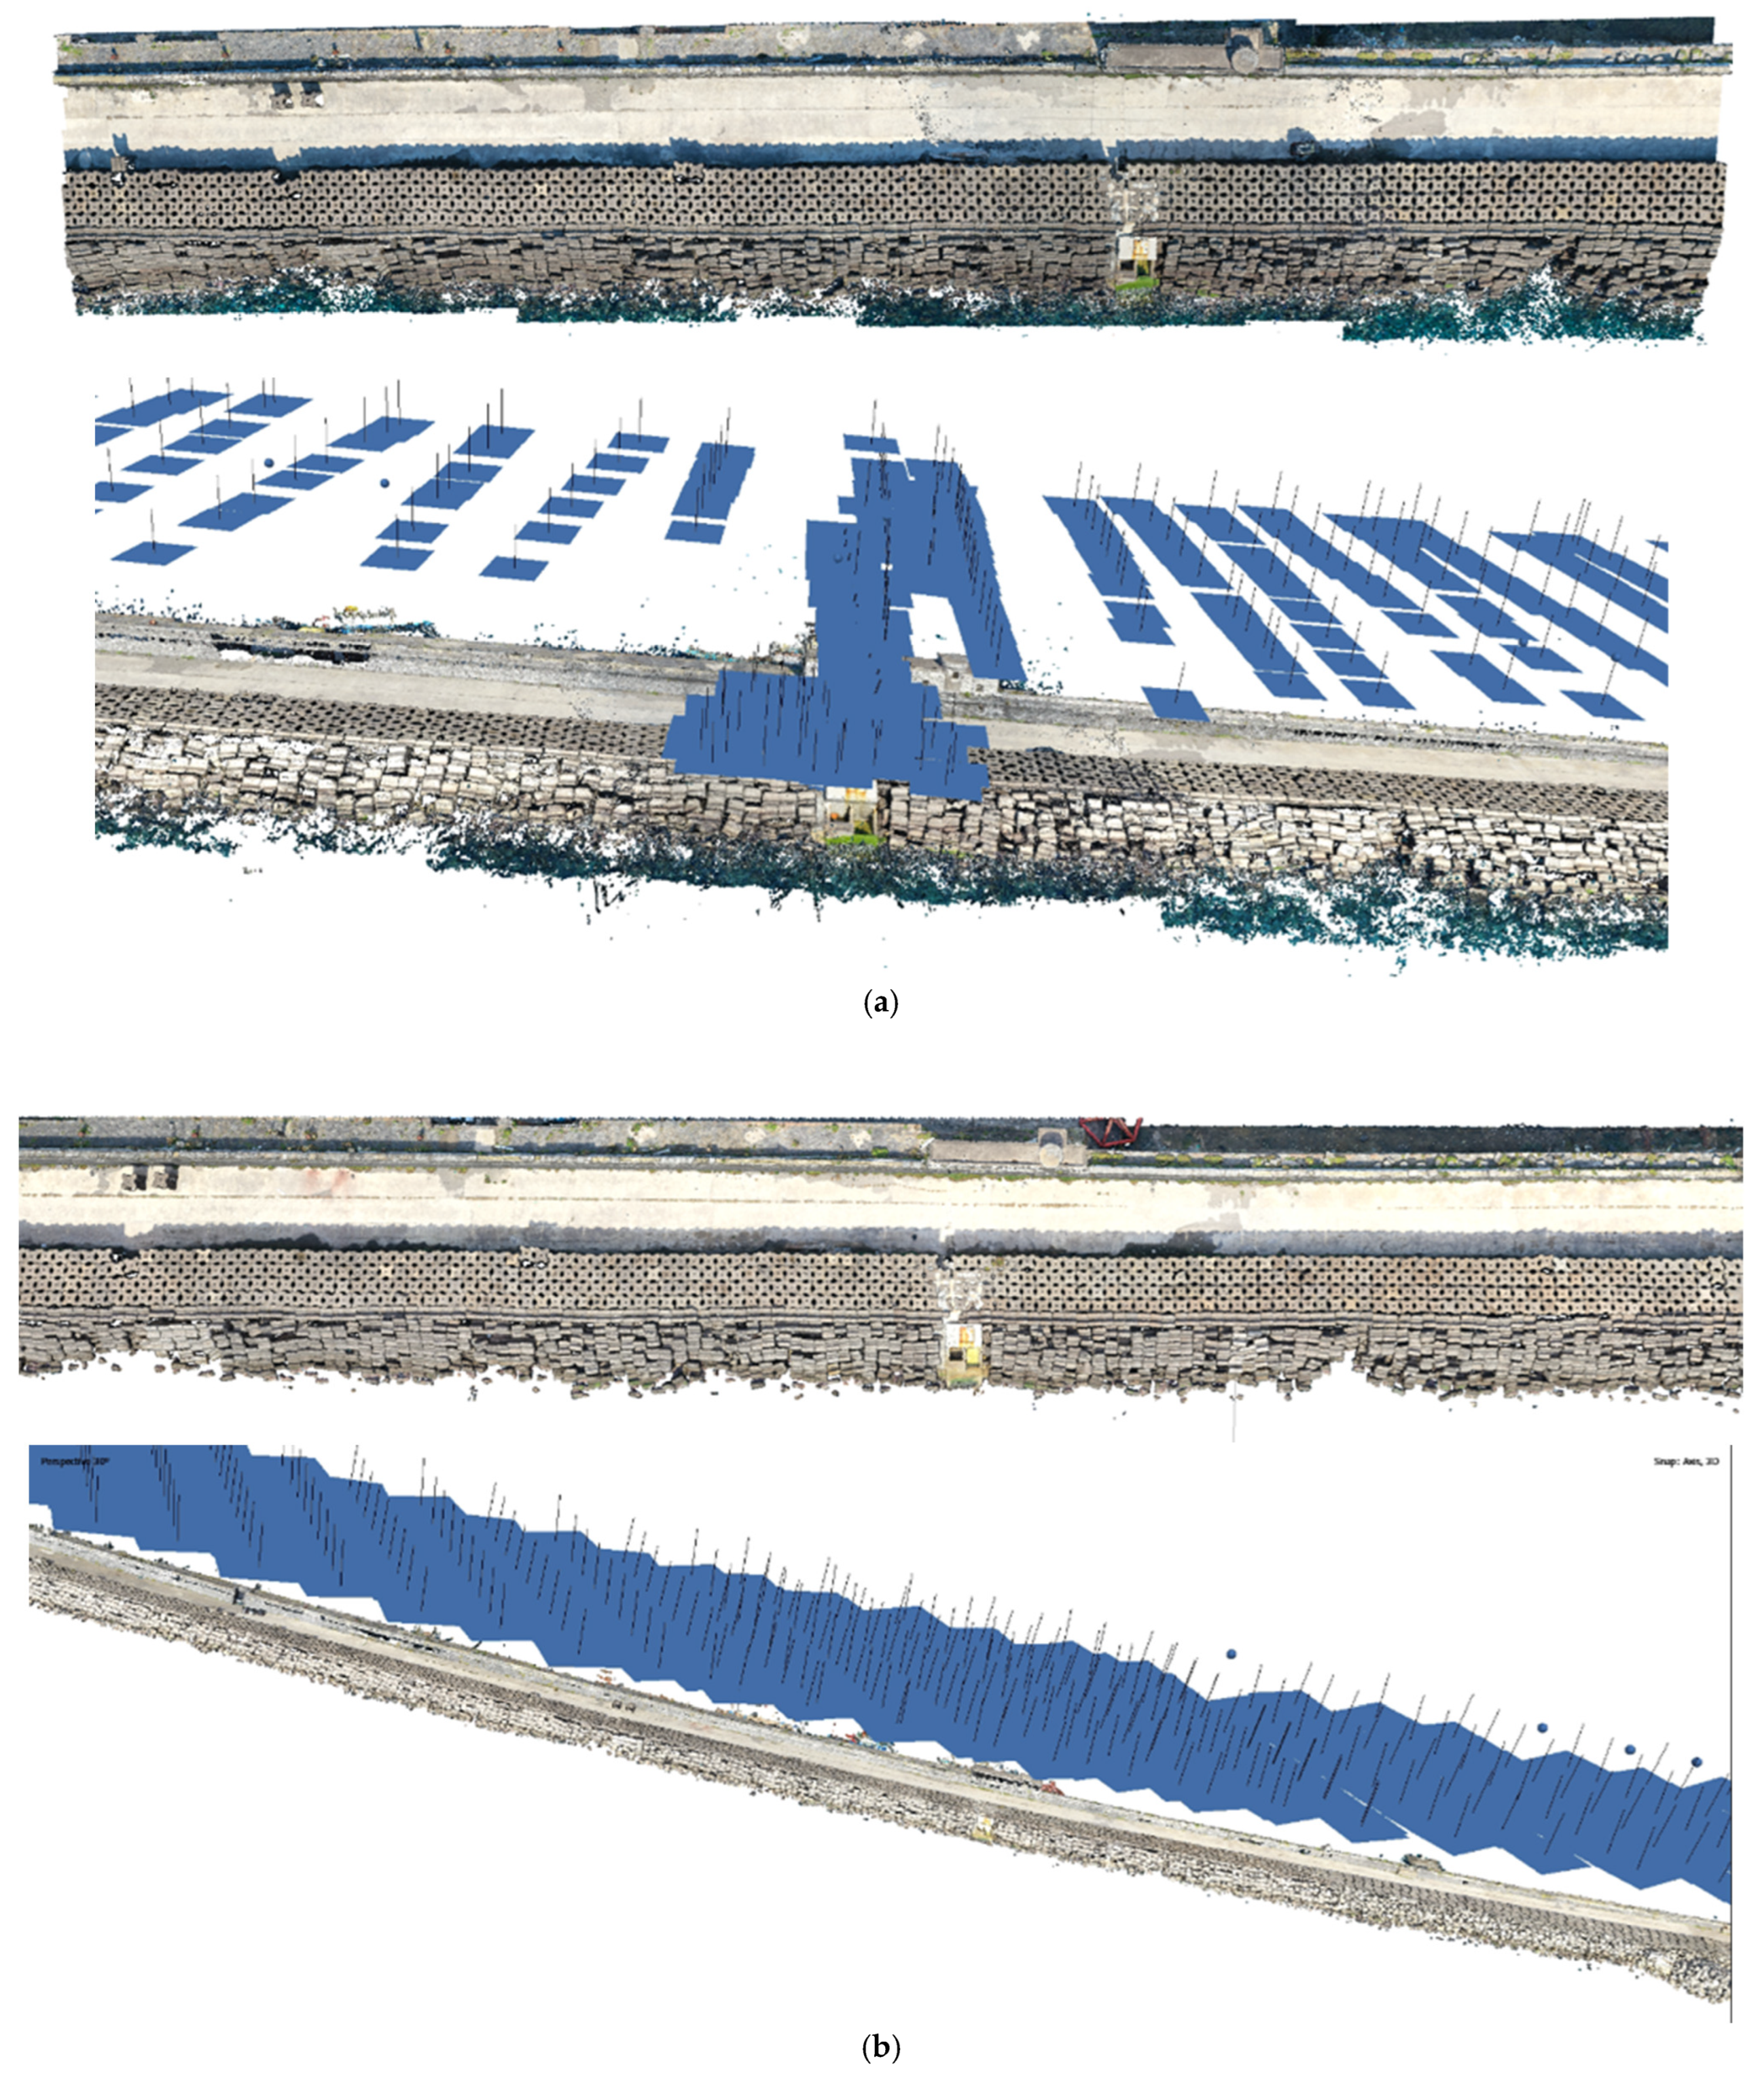
The UAV flights were scheduled for the 12 January 2024, and for the 18 December 2024, when the permissions to fly were available. The 3D point clouds were obtained with Agisoft Metashape, imposing high parameters for both alignment and “build point cloud”. The results of the two processes are summarized in
Table 2 and visible in
Figure 10a,b.
The 3D models of the breakwater were then exported to produce two orthophotos to be compared with the satellite images. The orthophotos and the 3D models were compared in a CAD environment and in CloudCompare 2.13 alpha software, respectively, to assess whether some parts were missing and if the two surveys gave the same result or if something had changed in almost one year. In the orthophoto, and hence 2D, comparison (
Figure 11a), it was possible to identify the differences in the two surveys: even if the identification is difficult visually (a percentage of opacity has been added to better identify the changes), using a CAD environment, it was possible to measure the gap as approximately 0.75 m. In the comparison of the 3D models (
Figure 11b), the mean and the standard deviation indicated by the software considered the entire models, in which several parts were different, especially regarding the sea portion and the ships (not visible in the image because they were not pertinent to the study). The portion regarding the missing part of the dock, affected by the storm, is inside a range of 0.69–0.75 cm, meaning that the massive stones that were moved are still changing their position, even if no other massive coastal storms have been documented. This is due to the fact that the geometry of the breakwater is not ideal anymore and so the stones are more exposed to the tides and the waves.
This indicates that monitoring is fundamental for the subsequent restoration to provide proper protection for the harbour.
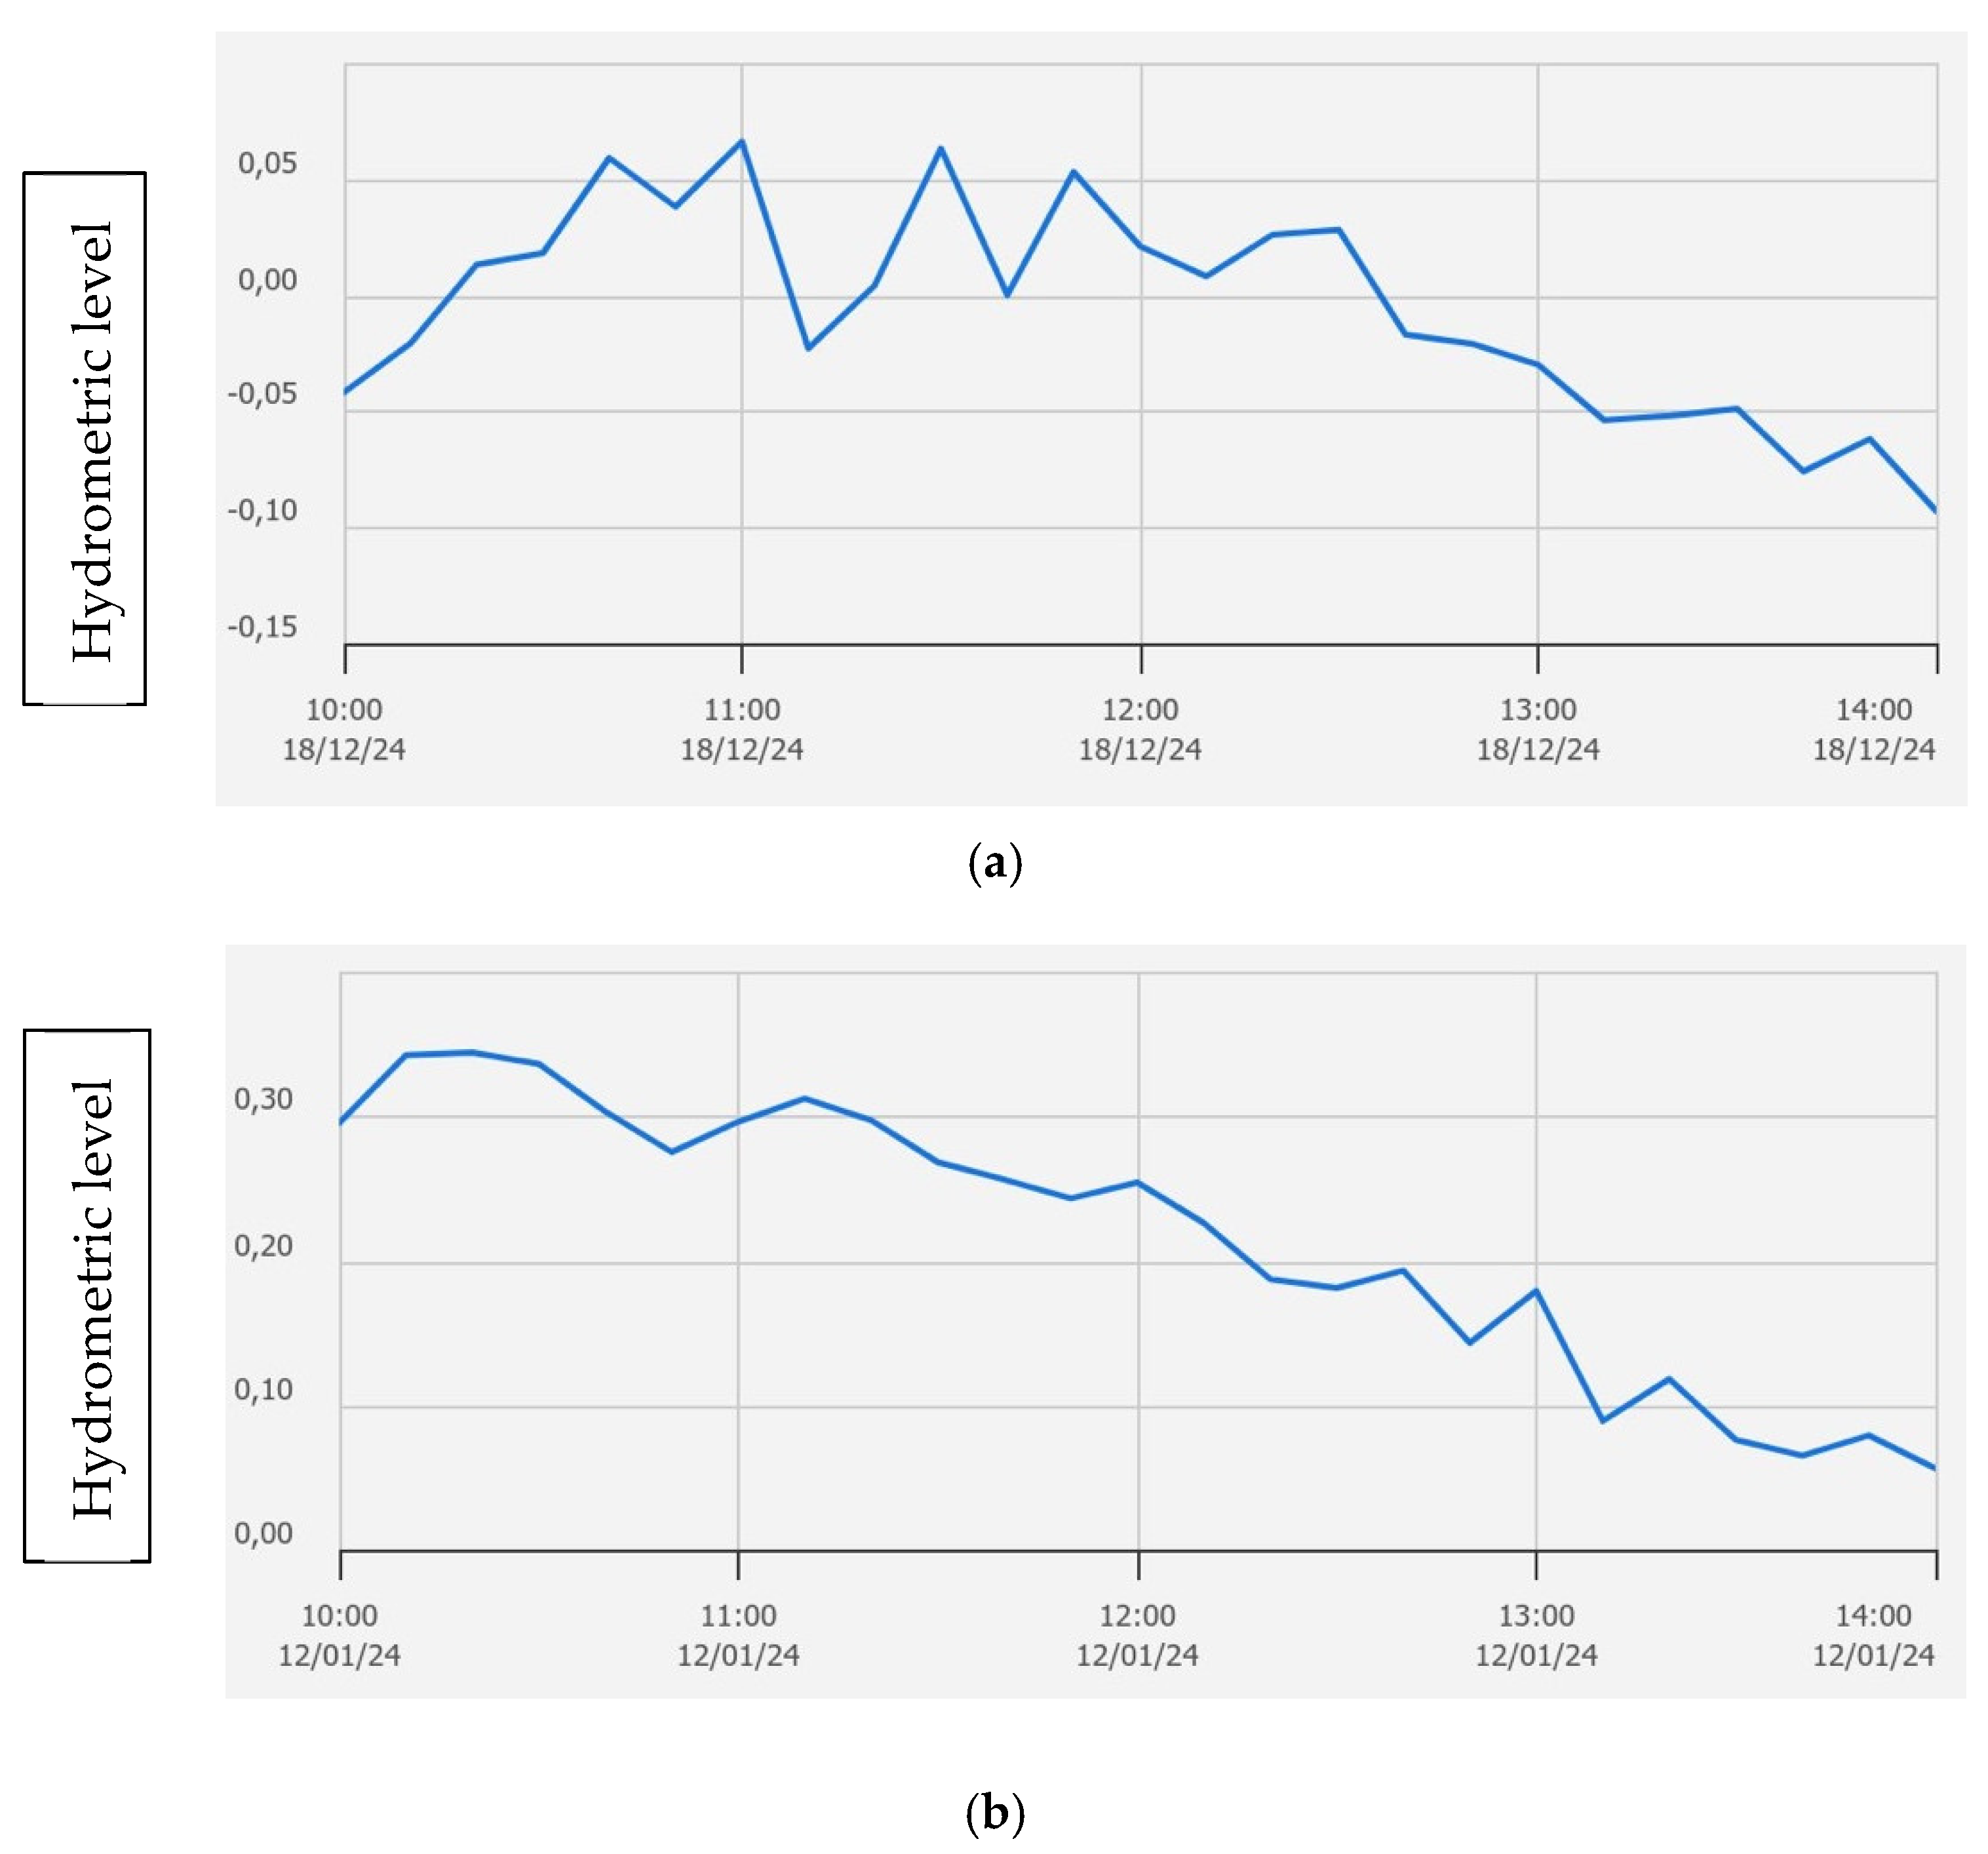
In the two comparisons, the differences in the hydrometric level during the two mornings of the surveys were considered. The time when the drone was flying over the OBREC was between 12.00 and 12.30, and as visible in
Figure 12a,b, the level of the sea on 12 January was between 0.179 and 0.089 and that on 18 December was between −0.03 and −0.049, suggesting around 15–20 cm of difference.
The second step was to compare the different satellite images and highlight the different coastlines with different colours to see the changes (
Figure 13). In this stage of the project, the coastline for each satellite image and orthophotos was extracted manually. For this purpose, the free software GIMP 2.10 was used: all the images were uploaded in the software, and for each one, a layer of the coastline was created in which the line was drawn. The process is not accurate or precise, but it is the first stage of the study and nevertheless allowed us to create an initial time-sensitive database of information. Considering that the following steps of the project will consider only UAV data, this part will remain for just documentation purposes, and the next identification of coastline discrepancy will be carried out using an automatic method directly on 3D point clouds.
Between 2008 and 2020, as expected, the coastlines did not change much, in part because the changes in the sea levels during this period were difficult to detect given the accuracy of the images. This is a first major difference and improvement in using drone data instead of satellite data. Where the changes in the shape of the coastline are evident, the images from satellite platforms can be used, though with perspicacity, considering their level of detail. But if, as in this case, the analysis must be conducted with centimetric accuracy, these data are not sufficient and the drone is, without any doubt, the best platform for this type of study.
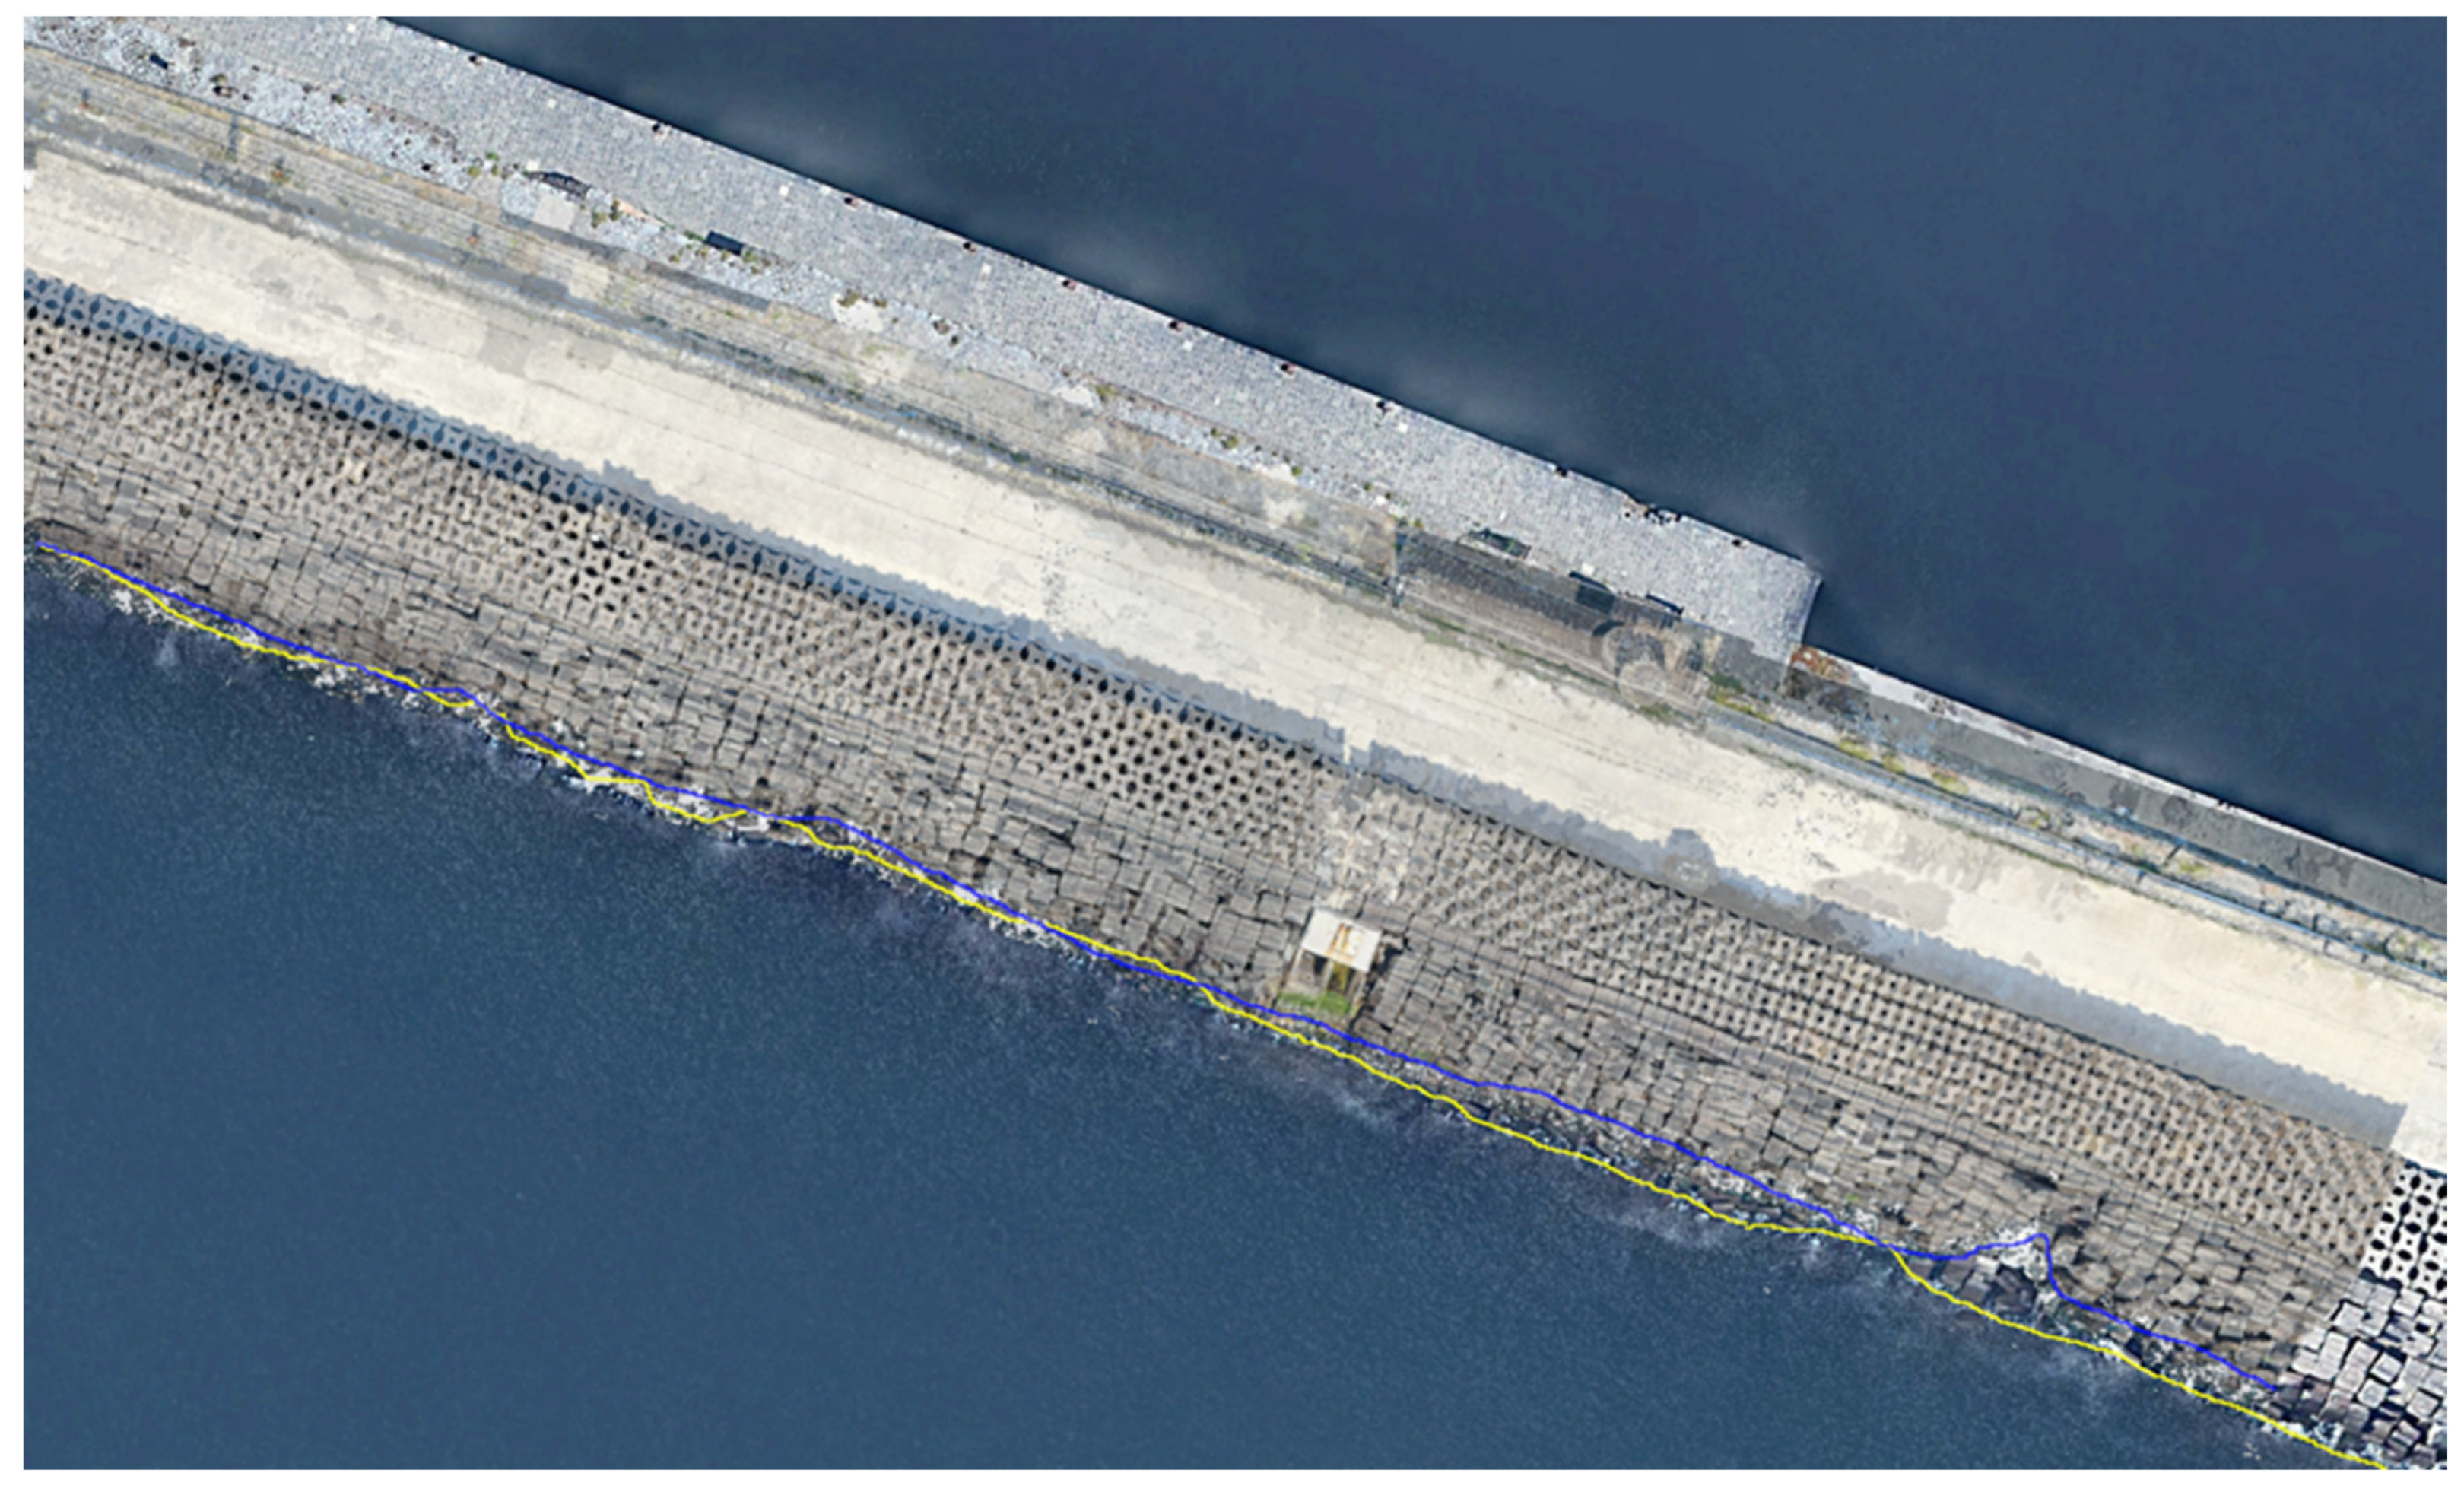
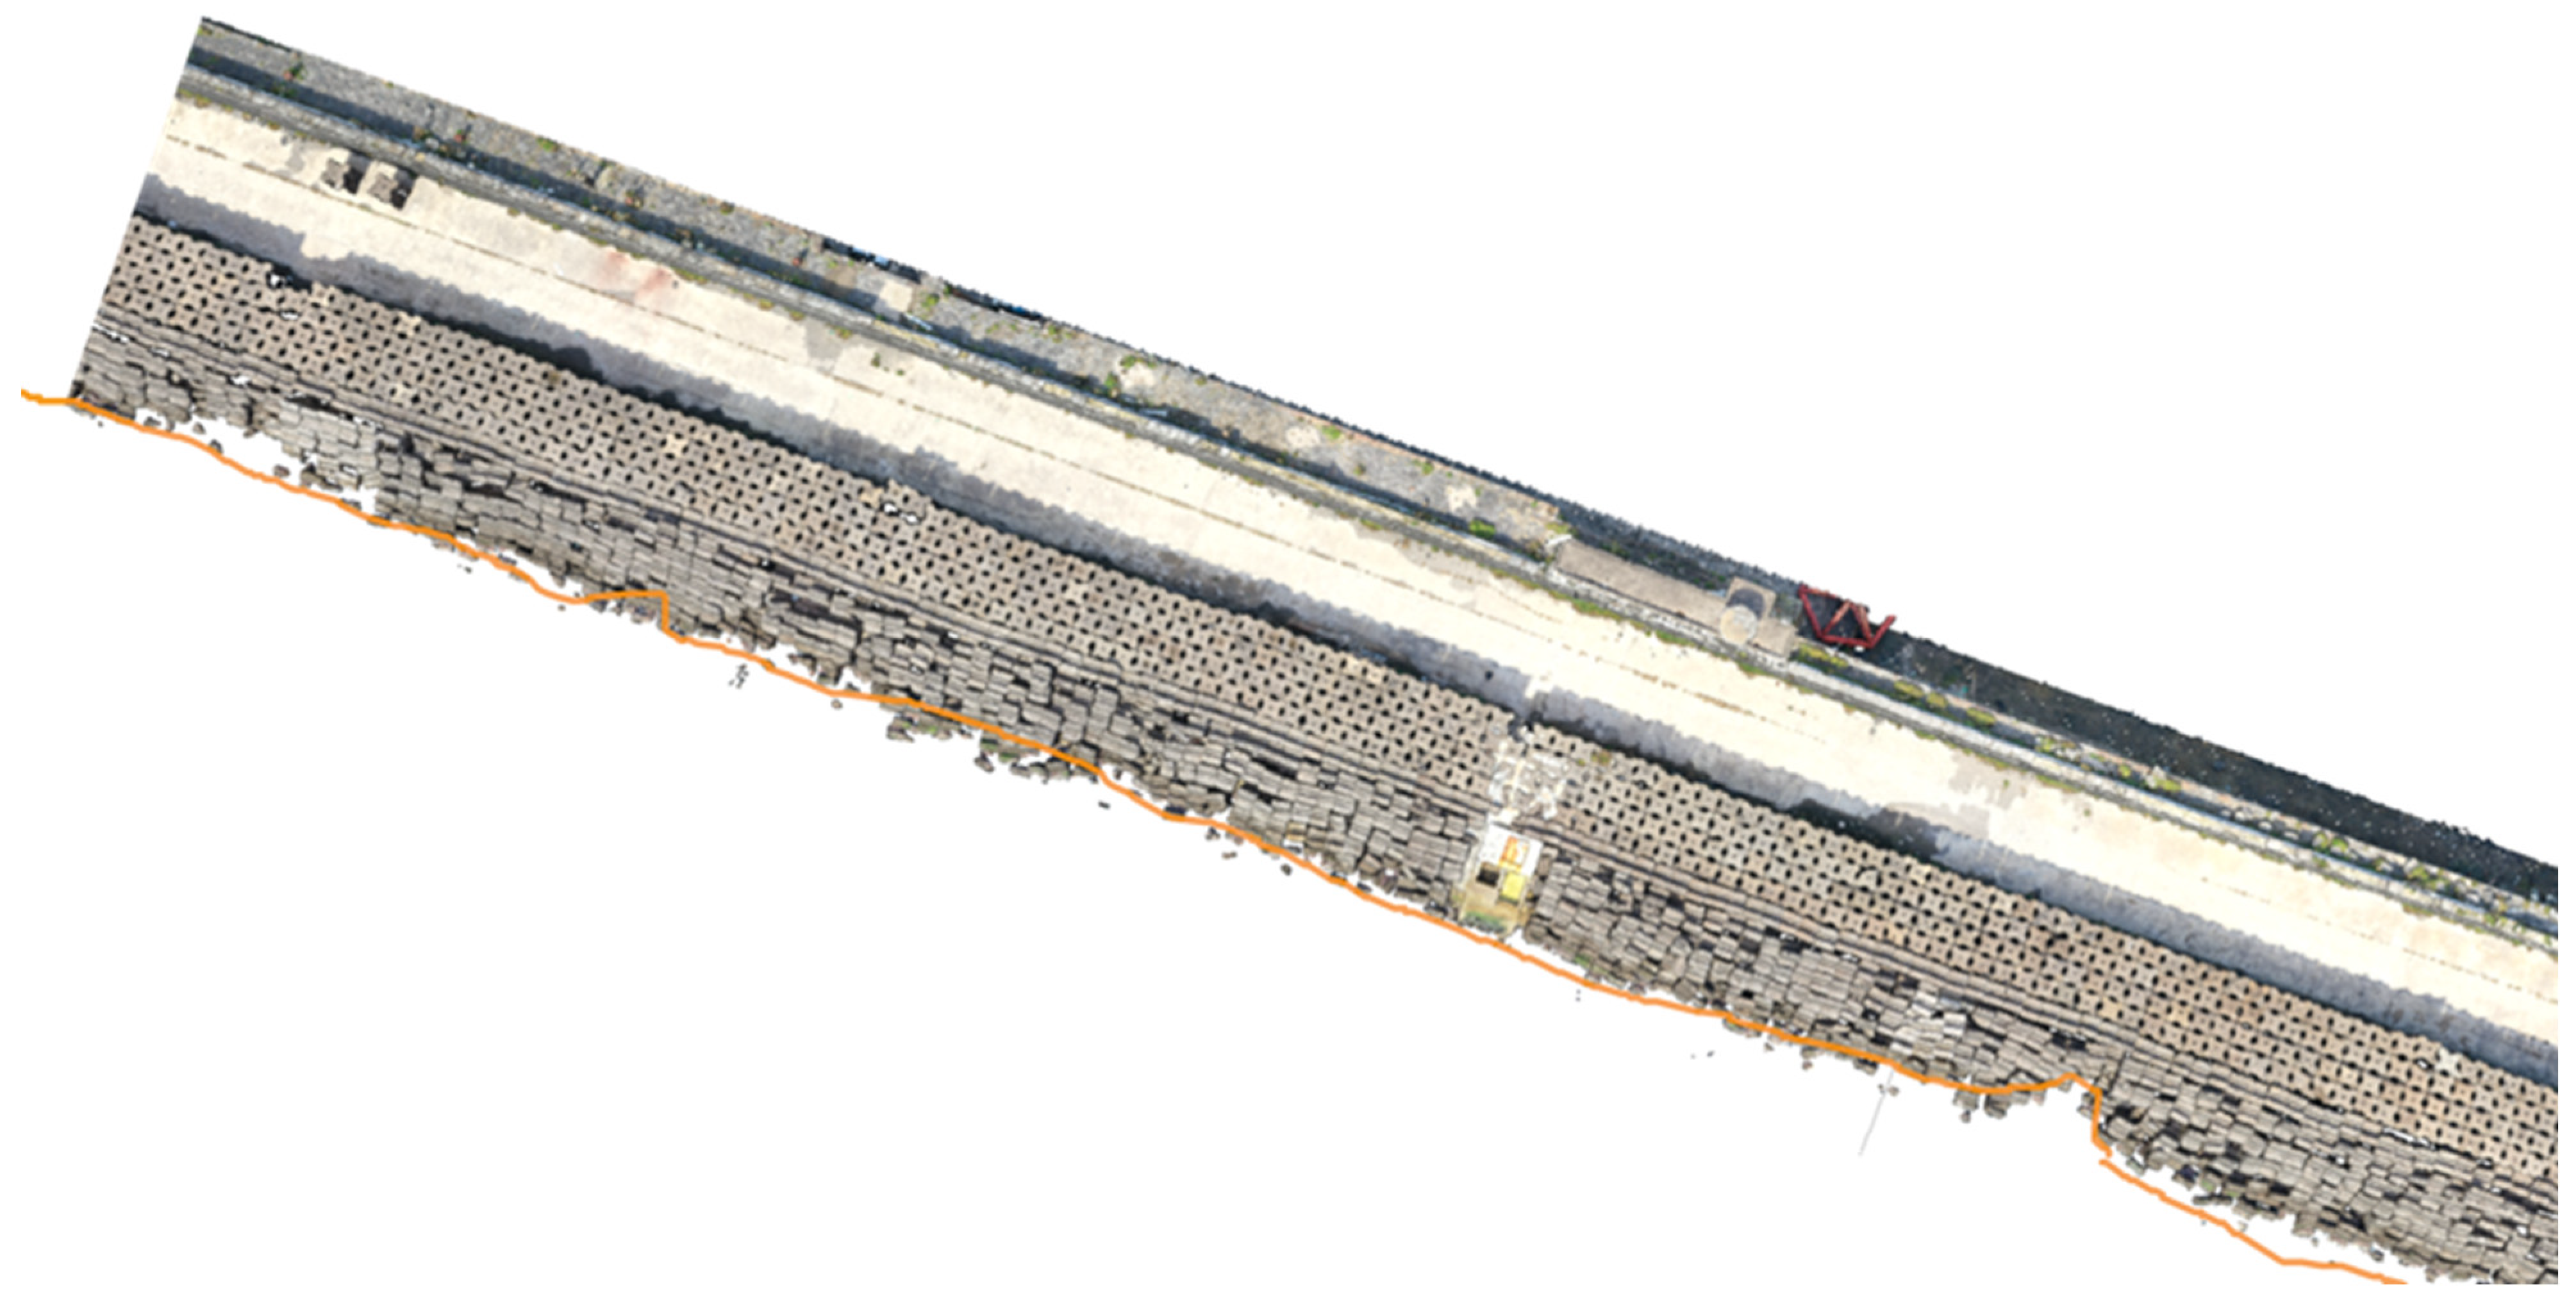
Then, the orthophoto from the December 2024 flight was compared with the satellite image acquired in 2019 (
Figure 14) and the coastline extrapolated from the 2021 satellite image (
Figure 15). The intention was to not only underline the differences in the coastline after the storm, data that have already been acquired with the comparison of satellite images, but also to identify the differences in accuracy and in the clarity of data. It is clear by the images that the coastline in the UAV orthophoto is much more visible, the geometry more detailed, and the identification of scattered blocks is evident. In analysing the comparison between the two sets of data, the differences in the tides that affected the accuracy of the profile extrapolated from the images were considered. However, apart from this specific point, there are few points that are intrinsically fixed, e.g., the profile of the OBREC along the line of water of the dock. It is clear from
Figure 14 and
Figure 15 that these data are not accurate when the profiles from the satellite images have been extrapolated, while they are more accurate from the UAV orthophoto. Moreover, the data from the UAV offered possibility of underlining the movement of the blocks and the dimension of the gaps. This information is fundamental for the maintenance of the breakwater.
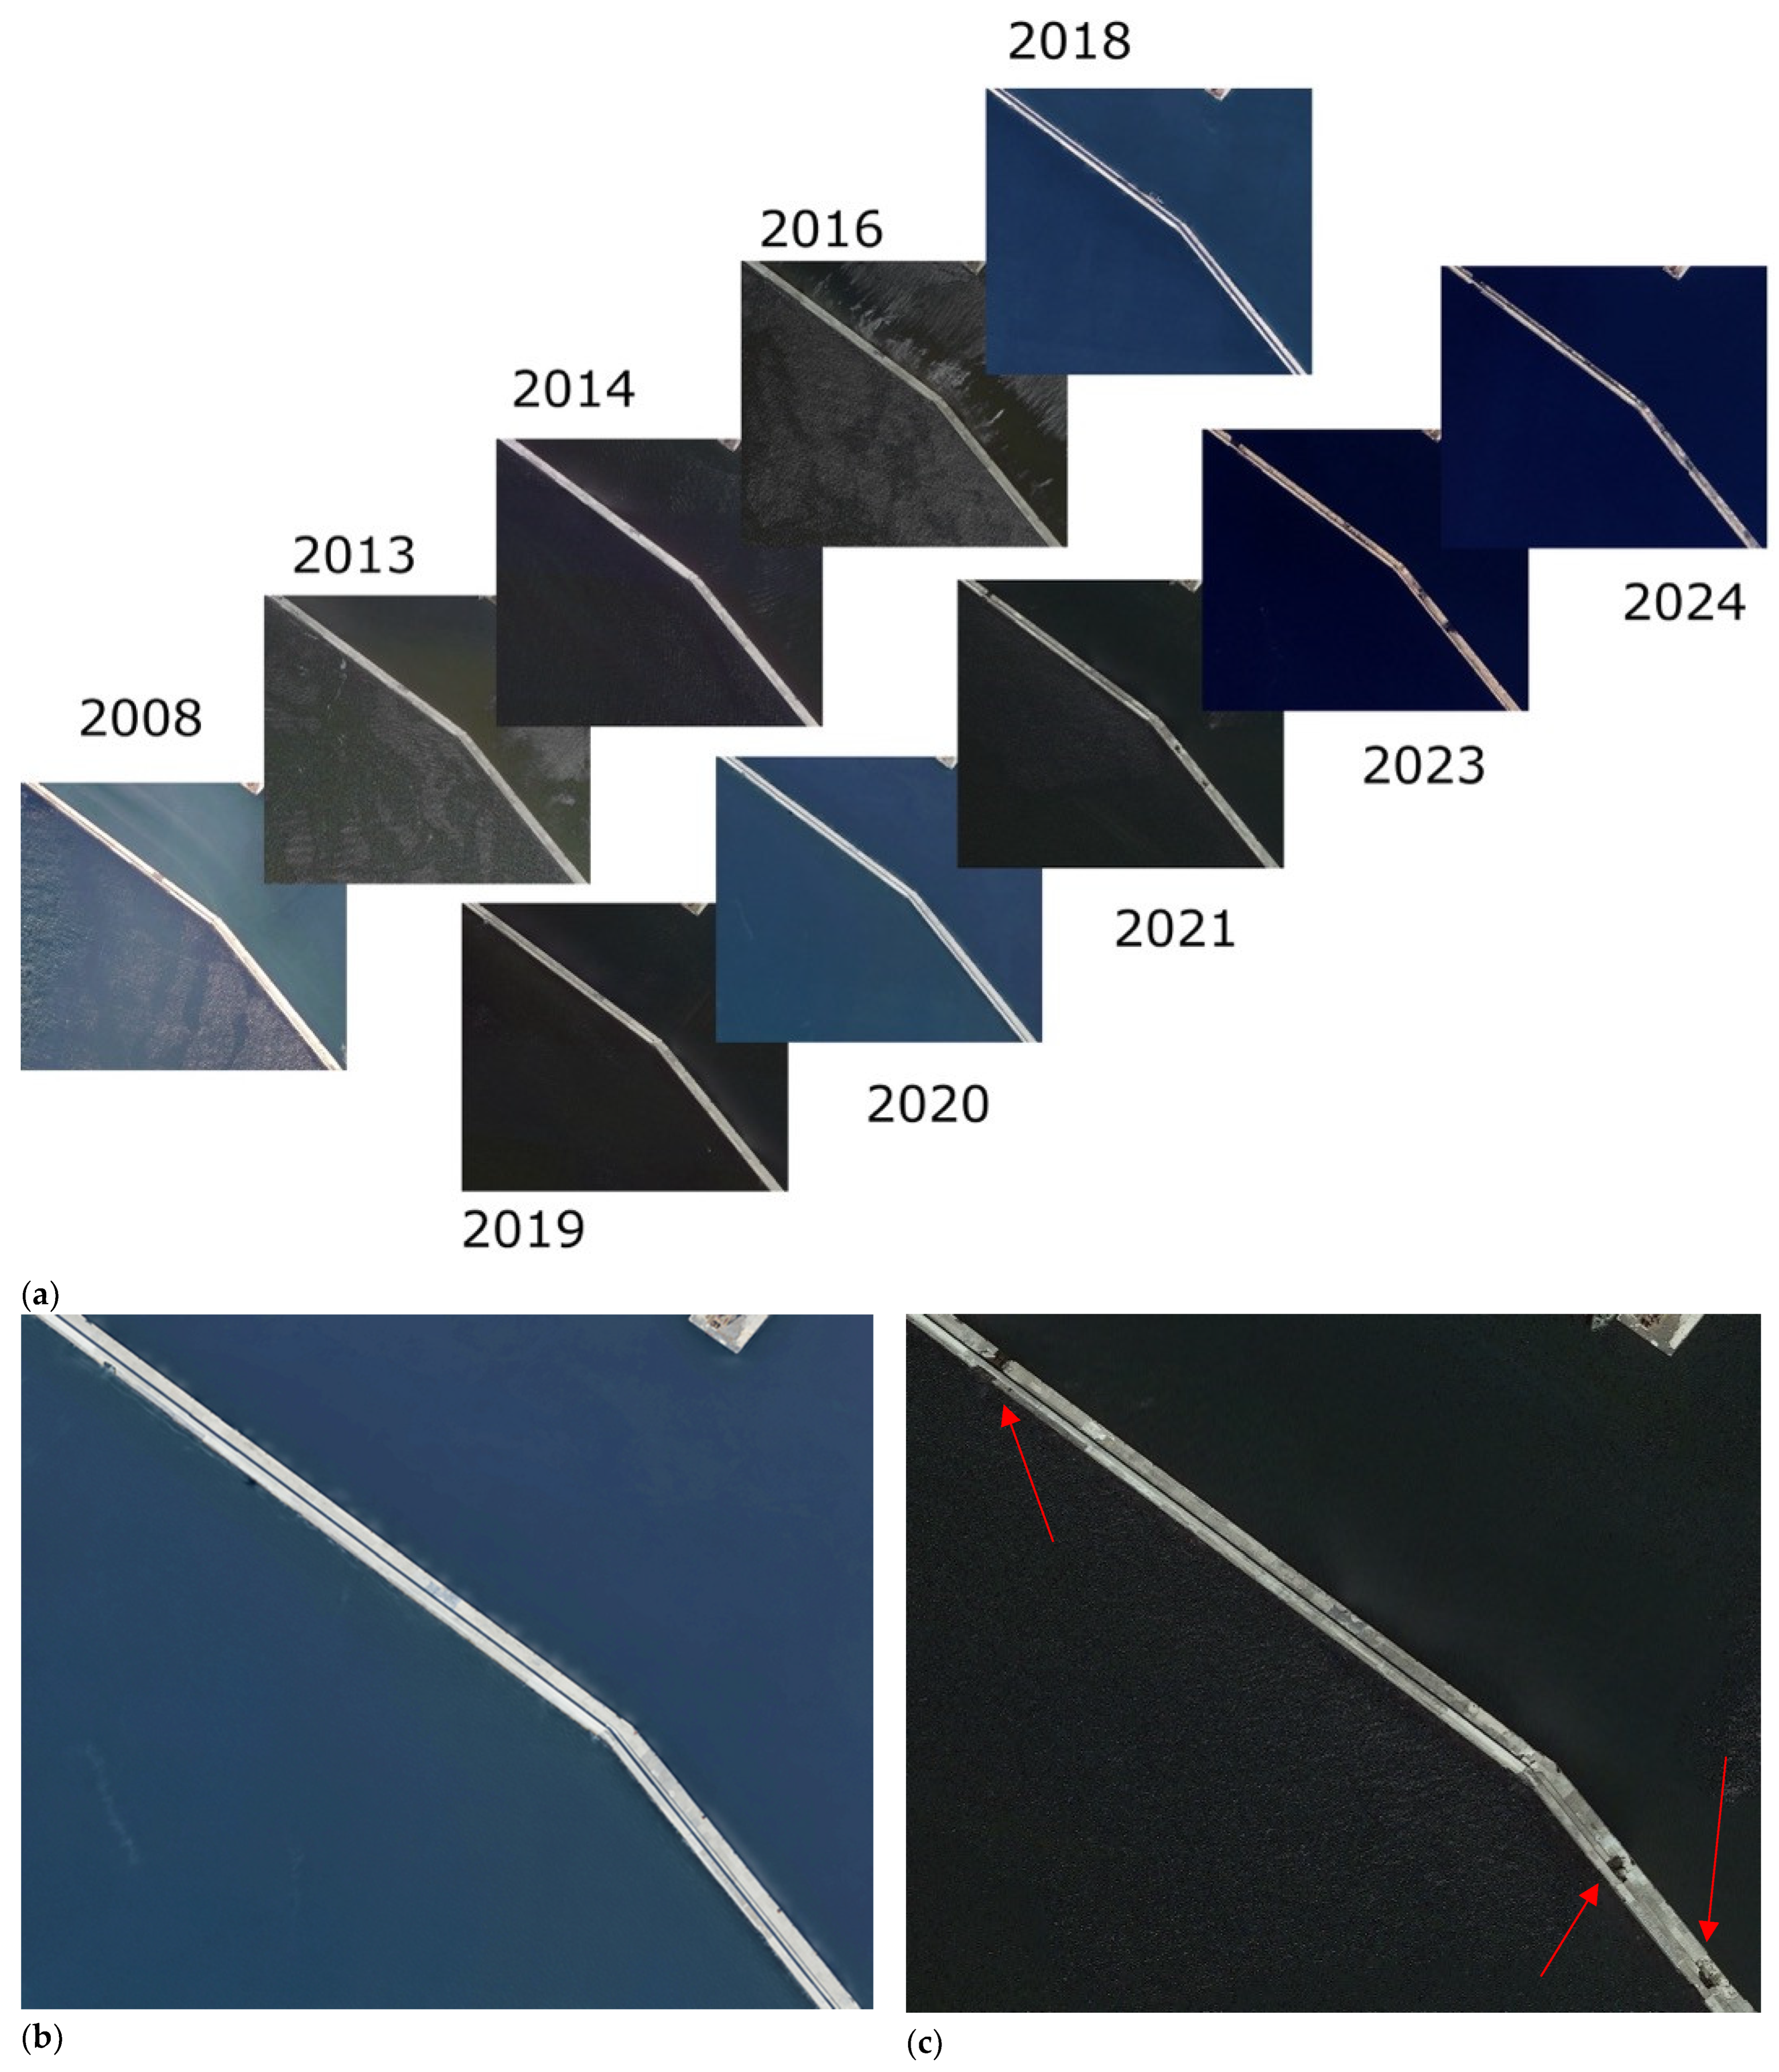
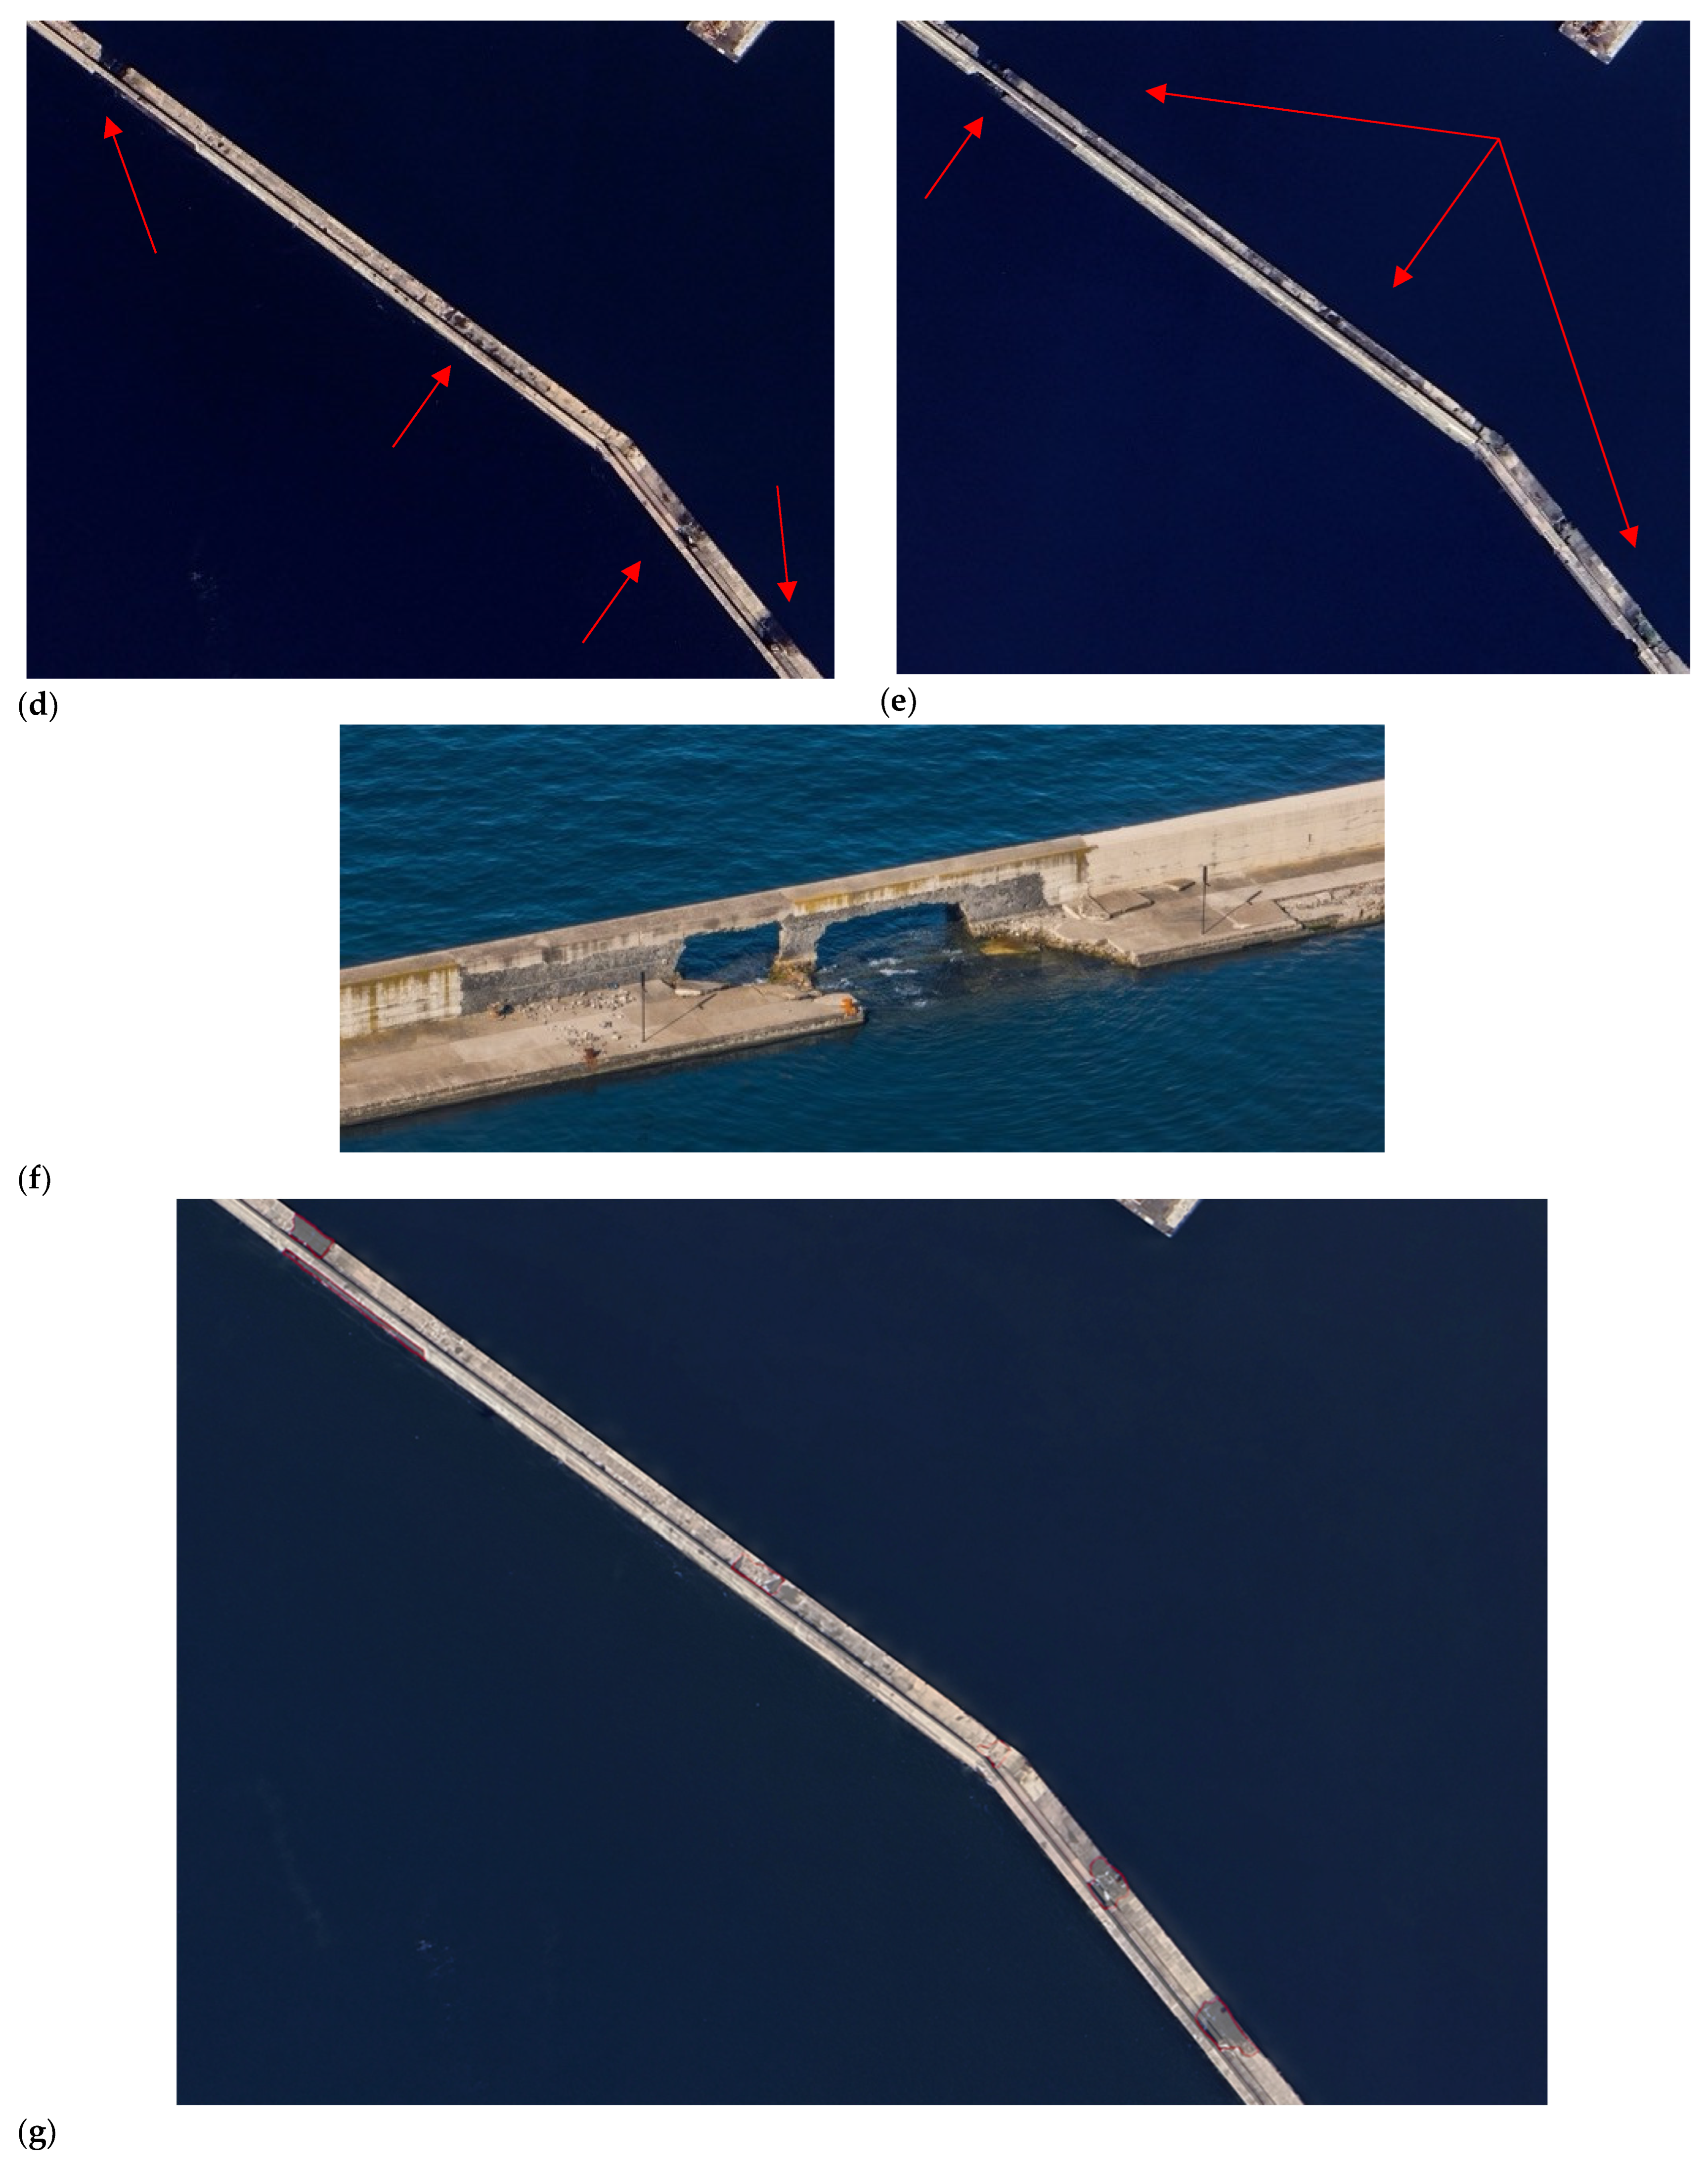
The last part of the research focused on the comparison of satellite images of the second breakwater, the Duca degli Abruzzi, that underwent significant damage during the same storm. In this area, it was not possible to conduct flights with the UAV yet, but as soon as the permission is ready, periodical flights will be scheduled as for the Molo San Vincenzo breakwater. In this area, the damage is even more evident, and the situation is more dangerous and complex. The storm impacted strongly on the horizontal and the vertical part of the breakwater, and the lack of maintenance in the following years worsened the situation. It is already evident from the visual analysis of the satellite images alone (
Figure 16a–g) that after the 2020 storm, the damage to the breakwater dangerously increased in dimension, affecting the structural integrity of the structure, hence necessitating actions to defend it.
In this part of the port, the use of UAV technology will be of enormous help in monitoring and maintaining the structure, especially considering the restoration that is planned in the early future, because using the drone, it is possible to acquire oblique images that permit the reconstruction of the structure in 3D. In this way, the knowledge of the damage and the difference in measurements of the halves is much more accurate.
4. Discussion
Aerial images are fundamental for the study, analysis, and monitoring of large urban and natural areas.
The idea of this research was to analyse the changes in and monitor a key area in one of the harbours of the city of Naples, Italy, that was hit by a strong storm in late 2020. The use of UAV data is definitely the most reliable, accurate, and economic method, but it is not always possible to fly, especially in urbanised areas or, as in this case, in military ones. Hence, for this project, the first datasets that were used for the monitoring of the state of conservation were Landsat images.
It was always clear, right from the start, that the data acquired were not sufficiently detailed for a specific and accurate analysis of the changes in the coastline of the dock through time, but only in 2024 was it possible to use UAVs over the area. Therefore, the satellite images were the only data available. In the future, Sentinel 2 images will be also considered to increase the accuracy of satellite data.
The methodology followed an established pipeline, overlapping the images and analysing the changes in the coastline, taking into consideration the changes in the sea level. As expected, the accuracy of the satellite images was limited for accurate analysis. They were enough, however, for the extrapolation of coastlines and their comparison. From this process, the result was the identification of the main parts where the storm hit hardest and the basic changes in the geometry of the coastline.
In 2024, when the UAV flight was permitted, and considering the accuracy of the data obtained, we decided to proceed with a survey every year to identify not only the changes in the geometry of the coastline but also the eventual loss or movements of the rocks forming the dock. During the timeframe between January and December 2024, in fact, movements of the stones of the breakwater were identified where the damage of the storm was visible. This result further underlined the necessity of periodic monitoring of the area and, even if it was already obvious and well specified by the state of the art in the research, that UAV data have a key role when dealing with detailed analysis.
The combination and the integration of data, also using 3D models from close-range photogrammetry, allowed us to increase the geometric analysis of the area, adding more accurate detail to the area around the OBREC, the point hit hardest by the storm. This result leads to significant implications for modelling purposes because complex shoreline detection methods are not required, especially in low-tidal zone such as the one studied in the present work. Future broad-scale modelling should follow a deterministic-probabilistic approach to account for damage levels on breakwaters.
The 3D modelling + time (4D) is by now at its starting point, considering that the UAV was allowed to fly only two times over the year in 2024. The results of the 3D model’s comparison were, however, very promising, since it was possible to analyse and identify a significant difference in the shape of the coastline where the damage was more evident. There is, hence, an intention to fly each year in approximately the same period to increase the 4D (time) data for better monitoring of the area. With this continuous monitoring, the maritime authority will have a complete database useful for documentation and restoration.
Hence, all the 3D models will be compared and the differences in shape and structure noted and taken into consideration for future interventions.
5. Conclusions
The use of UAV data has proven to be fundamental for the 4D monitoring of a restricted area of the Naples harbour. The role of this structure in the protection of a portion of the city of Naples is fundamental, and any damage could produce a weakness that could be fatal. Even though the satellite data analysis gave us an initial understanding of the state of the loss of portion of the structure, the accuracy was not sufficient to proceed to a proper investigation, as a basis for a subsequent restoration. The identification of warning/emergency thresholds could help to intervene promptly for the restoration of hydraulic and structural safety. For instance, the first level of attention could be assumed when the difference between subsequent shorelines is higher than the maximum horizontal tidal excursion (the last, in fact, could represent the standard error in measuring the shoreline).
Under these conditions (i.e., low tide and artificial “hard” shoreline), a secondary benefit highlighted in this study is the improvement of shoreline detection abilities without the need for human involvement, achieving a level of precision that is entirely comparable to manual contour identification.
Future work intends to continue with the annual monitoring by drone of the area, and the beginning of the monitoring of the Duca degli Abruzzi breakwater. This is fundamental for the creation of the 4D database and for giving the authority in charge the most accurate data possible to perform restoration. We also intend to integrate the UAV campaigns with markers and GCPs to increase the accuracy of the 3D models and orthophotos.


 ,
, 


