Abstract
Extracting accurate surface reflectance from multispectral UAV (unmanned aerial vehicle) imagery is a fundamental task in remote sensing. However, most studies have focused on short-endurance UAVs, with limited attention given to long-endurance UAVs due to the challenges posed by dynamically changing incident radiative energy. This study addresses this gap by employing a solar trajectory model (STM) to accurately estimate incident radiative energy, thereby improving reflectance calculation precision. The STM method addresses the following key issues: The experimental results demonstrated that the root mean square error (RMSE) of the STM method in Shanghai was 15.80% compared to the standard reflectance, which is 51% lower than the downwelling light sensor (DLS) method and 37% lower than the traditional method. This indicates that the STM method provides results that are more accurate, aligning closely with standard values. In Tianjin, the RMSE was 24% lower than the DLS method and 65% lower than the traditional method. The STM effectively mitigates inconsistencies in incident radiative energy across different image strips captured by long-endurance UAVs, ensuring uniform reflectance accuracy in digital orthophoto maps (DOMs). The proportion of corrected reflectance errors within the ideal range (±10%) increased by 24% compared to the histogram matching method. Furthermore, the optimal flight duration for long-endurance UAVs launched at noon was extended from 50 min to 150 min. In conclusion, this study demonstrates that applying the STM to correct multispectral imagery obtained from long-endurance UAVs significantly enhances reflectance calculation accuracy for DOMs, offering a practical solution for improving reflectance imagery quality under clear-sky conditions.
1. Introduction
Unmanned aerial vehicles (UAVs) are increasingly vital in fields such as geological exploration, agriculture, environmental monitoring, urban planning, and disaster response [1,2,3]. UAVs are typically classified into short-endurance rotor-wing and long-endurance fixed-wing types. With advancements in battery capacity, the deployment of long-endurance UAVs in remote sensing applications has significantly expanded [4,5,6,7,8]. These UAVs are equipped with various sensors, including multispectral, hyperspectral, and thermal sensors, which enable the capture of high-resolution digital orthophoto maps (DOMs). These maps are crucial for tasks such as mapping and monitoring crops, detecting diseases, and assessing environmental conditions, including applications like the detection of laurel wilt in avocados [9].
Accurate radiometric calibration is essential for computing surface reflectance from DOM images captured by long-endurance UAVs. Traditional calibration methods typically rely on the use of calibrated reflectance panels (CRPs) for preflight calibration, assuming stable incident radiometric energy during the flight [10,11]. However, this assumption becomes problematic during long-duration flights (1–2 h) due to fluctuations in solar radiation and the dynamics of UAV flight. These challenges can lead to significant errors in the radiometric data captured. In response, several commercial software tools have been developed to mitigate these issues, including Pix4DMapper and Metashape, which incorporate advanced algorithms for radiometric calibration, including sun angle compensation [12,13,14]. Pix4DMapper software (version 4.8.0) is widely used in photogrammetry; it includes a feature specifically designed to compensate for variations in solar radiation during flight. This sun angle compensation feature adjusts the data based on changes in solar geometry as the UAV moves through its flight path. By integrating these adjustments, Pix4DMapper helps to minimize the impact of solar radiation fluctuations on the image data, improving the accuracy of reflectance calculations. Additionally, Pix4DMapper is known for its high precision in processing UAV-captured images, which makes it particularly useful for large-scale mapping projects that require high-resolution outputs. However, Pix4DMapper is typically optimized for shorter, more stable flight paths, and its performance can degrade when applied to long-duration UAV missions with dynamic atmospheric conditions. Similarly, Metashape (version 2.0.2), another widely used software in photogrammetric applications, offers robust algorithms for radiometric correction, including sun angle compensation [15,16,17,18]. Metashape excels at processing multispectral and hyperspectral images, making it a valuable tool for remote sensing applications that require multiband data [12,13,14]. It includes sophisticated methods for correcting radiometric variations in imagery, helping to improve the accuracy of the reflectance values extracted from the data. Like Pix4DMapper, Metashape is typically optimized for short-duration flights, and while it provides excellent results under stable conditions, its performance may be limited when used for extended UAV missions under dynamic conditions. These limitations highlight the need for more specialized solutions when it comes to long-endurance UAV flights [19,20,21,22]. Despite the effectiveness of these commercial software tools, there are notable challenges when they are applied to long-duration UAV missions, especially those conducted under fluctuating atmospheric conditions. These tools, while robust, are optimized for shorter flight paths and may struggle to maintain consistent accuracy when the UAV is subjected to more dynamic atmospheric changes [19,23,24]. Therefore, the need for enhanced calibration methods that can handle longer flights and more variable conditions remains a critical research area.
Recent advancements in UAV image calibration have integrated deep learning models for radiometric correction as well as multisensor fusion techniques that combine data from multiple sensors to improve calibration accuracy [25,26,27,28,29]. These models help mitigate errors caused by tilt angles, sensor misalignment, and environmental variations. In addition, multitemporal calibration methods allow for real-time adjustments to correction factors, accommodating changes in atmospheric conditions throughout the flight. Advanced UAV-mounted sensors, such as hyperspectral cameras and LiDAR systems, have also contributed to improving image quality and calibration methods. These sensors provide higher resolution and additional spectral bands, which allow for more precise reflectance calculations. In terms of light measurement, DLSs have improved the accuracy of solar radiation measurements during UAV flights [30,31]. A DLS device is mounted on top of the UAV to receive solar radiation in real time, and CRP images are captured before takeoff to record the solar radiation energy during imaging. However, this method remains significantly limited by aircraft attitude issues, as even slight UAV movements can lead to substantial measurement errors. To address this problem, researchers developed the FGI AIRS (aerial image reference system). The FGI AIRS sensor system provides irradiance spectra along with GNSS positioning and orientation data, significantly improving the accuracy and reliability of radiometric correction. It has become a key tool for UAV-based radiometric correction [32,33,34]. A comparison between the FGI AIRS and Koppl’s methods demonstrates that both are effective at capturing tilt angles and producing reliable irradiance measurements [35]. Additionally, recent studies have proposed new DLS configurations that utilize multiple sensors oriented in different directions to measure both direct and scattered irradiance, showing promising results for enhancing radiometric correction accuracy [36,37]. Despite these advancements, several challenges remain. UAV-mounted cameras vary in compatibility with DLS systems [38], with some cameras lacking the necessary integration capabilities with DLS hardware [39,40,41,42,43]. Furthermore, variations in aircraft attitude, such as pitch, roll, and yaw, continue to influence the accuracy of DLS measurements. While many studies have sought to mitigate these effects, the inherent instability of UAV flight remains a persistent challenge [39]. Additionally, hyperspectral cameras, which typically feature hundreds of spectral channels, face difficulties in accurately calibrating each band due to the limited spectral bands available in DLS sensors, leading to potential systematic errors in radiometric correction [40,44,45].
To address these challenges, this paper introduces a novel solar trajectory model (STM) specifically designed for multispectral images captured by long-endurance UAVs under clear sky conditions. Unlike traditional methods and existing commercial solutions (e.g., Pix4DMapper and Metashape), which are optimized for short-duration flights and often fail to account for dynamic atmospheric conditions during long-endurance missions, the STM offers a unique approach by precisely calculating solar trajectories and top-of-atmosphere irradiance. This innovation significantly improves calibration accuracy, particularly for long-duration UAV flights, where variations in solar radiation and aircraft dynamics introduce substantial errors. Experimental results from Shanghai and Tianjin demonstrate that the STM reduces the RMSE by up to 51% compared to traditional methods and DLS-based approaches, while effectively mitigating inconsistencies in incident radiation energy across different image strips—a critical issue in large-scale DOM reflectance image mosaicking. Furthermore, the STM extends the optimal flight duration from 50 min to 150 min, providing researchers with significantly more flexibility in data collection. Through a comprehensive comparison of reflectance values between DLS-based and non-DLS-based correction methods, this study demonstrates the superior performance of the STM in improving the accuracy and reliability of reflectance imagery, offering a practical solution for long-endurance UAV applications in remote sensing.
2. Methodology
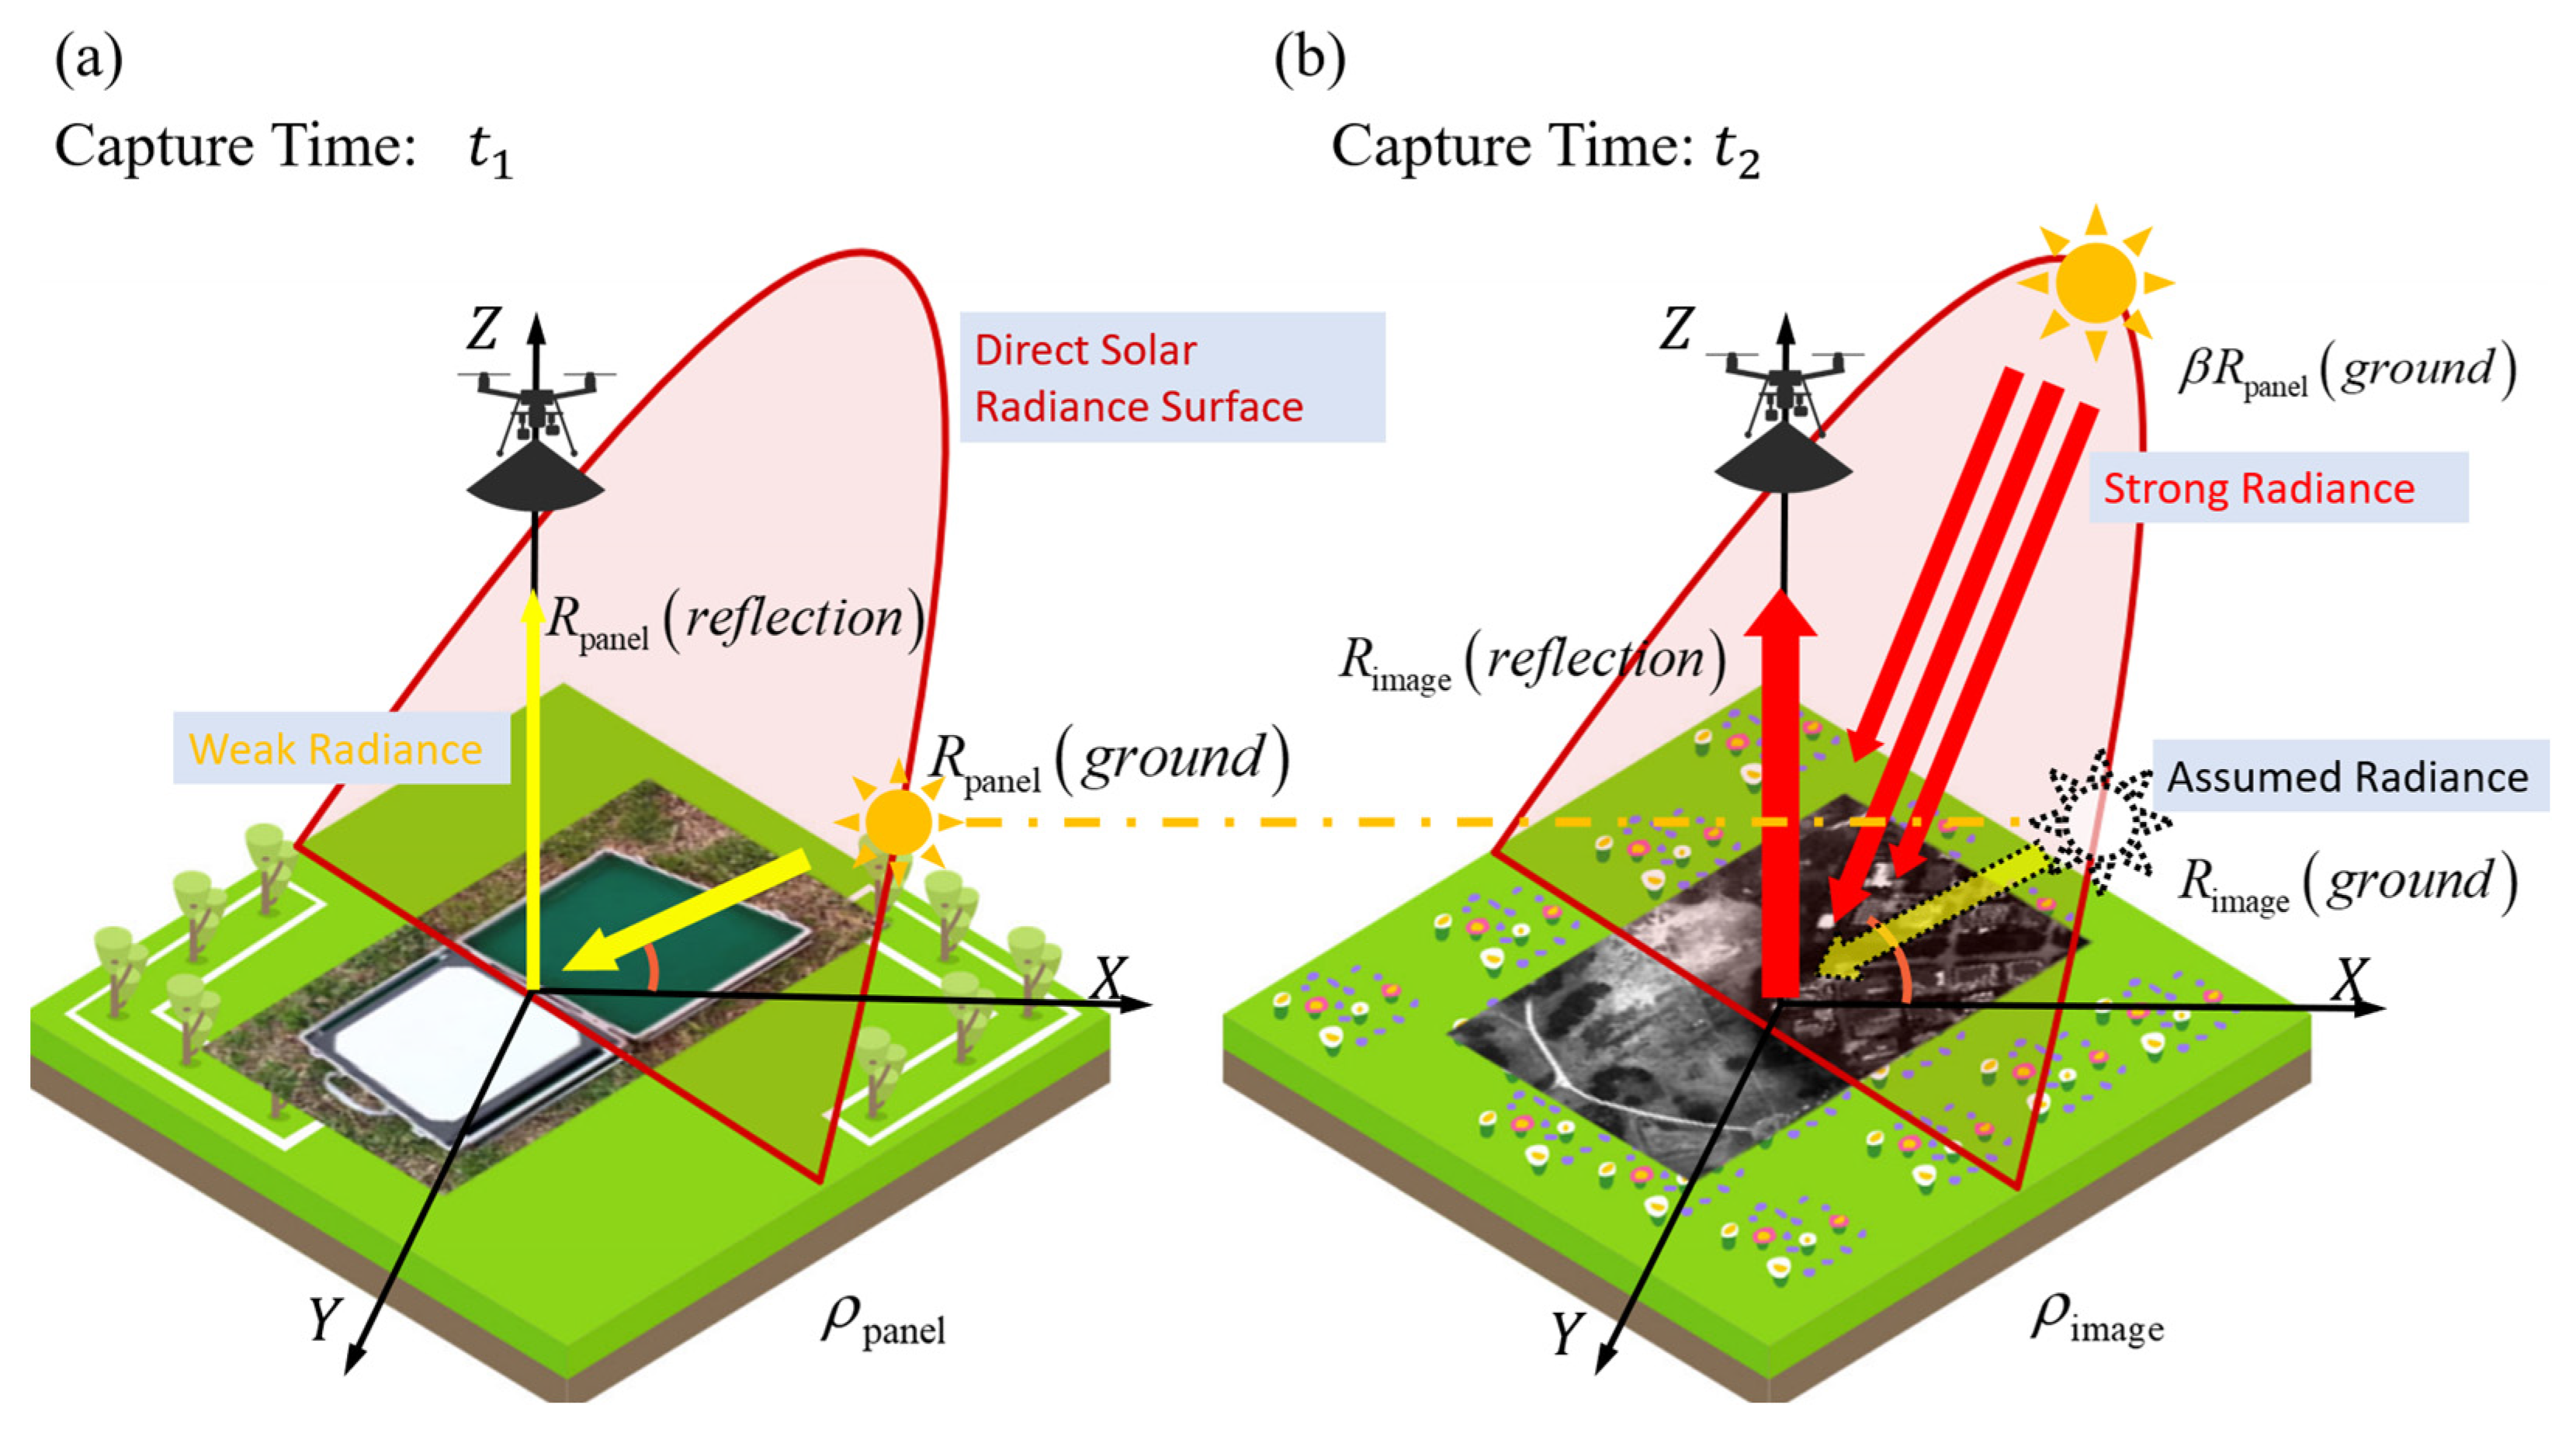
The traditional UAV reflectance calculation method assumes that the radiant energy reaching the ground at the time of capturing CRP images before the flight is equivalent to the radiant energy during image capture, as expressed in Equation (1) [39,46,47]. This traditional method presumes that the solar position remains constant between time intervals t1 and t2, as depicted by the yellow sun in Figure 1a and the dashed-line sun in Figure 1b. While this approximation is acceptable for short-endurance UAVs, it introduces significant errors for long-endurance UAVs. The solar position directly influences the radiant energy reaching the ground, as further illustrated by the yellow and dashed-line suns in Figure 1b. To address this, the STM considers changes in the solar position that lead to variations in radiant energy. Consequently, the STM provides an effective correction for this error, as indicated in Equation (1).
where and are the reflectance of the CRP and the ground feature, respectively. is the radiant energy reaching the ground, and represents the reflected radiant energy. In addition, represents direct radiation energy, and represents scattered radiation energy.
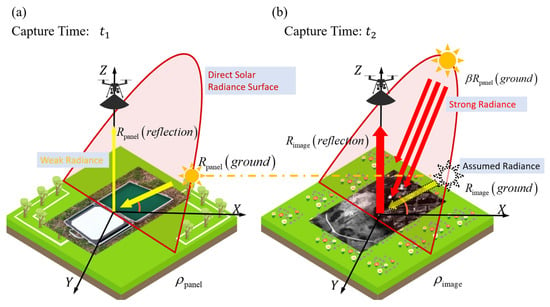
Figure 1.
The STM (a) Solar position and radiation energy during CRP capture. (b) Actual solar position during image capture and the assumed position in the traditional method.
The correction factor β, defined as the ratio of radiative energy reaching the ground between two time intervals, can be estimated using a radiative transfer model (RTM) or DLS measurements. However, precise calculation of β is challenging because the RTM requires detailed atmospheric profiles during the UAV flight, and DLS sensors are influenced by such factors as UAV flight attitude, structural design, and solar elevation. To simplify the calculation process, a controllably accurate approximation of is proposed under the assumption that atmospheric conditions remain relatively stable over one hour in clear sky conditions.
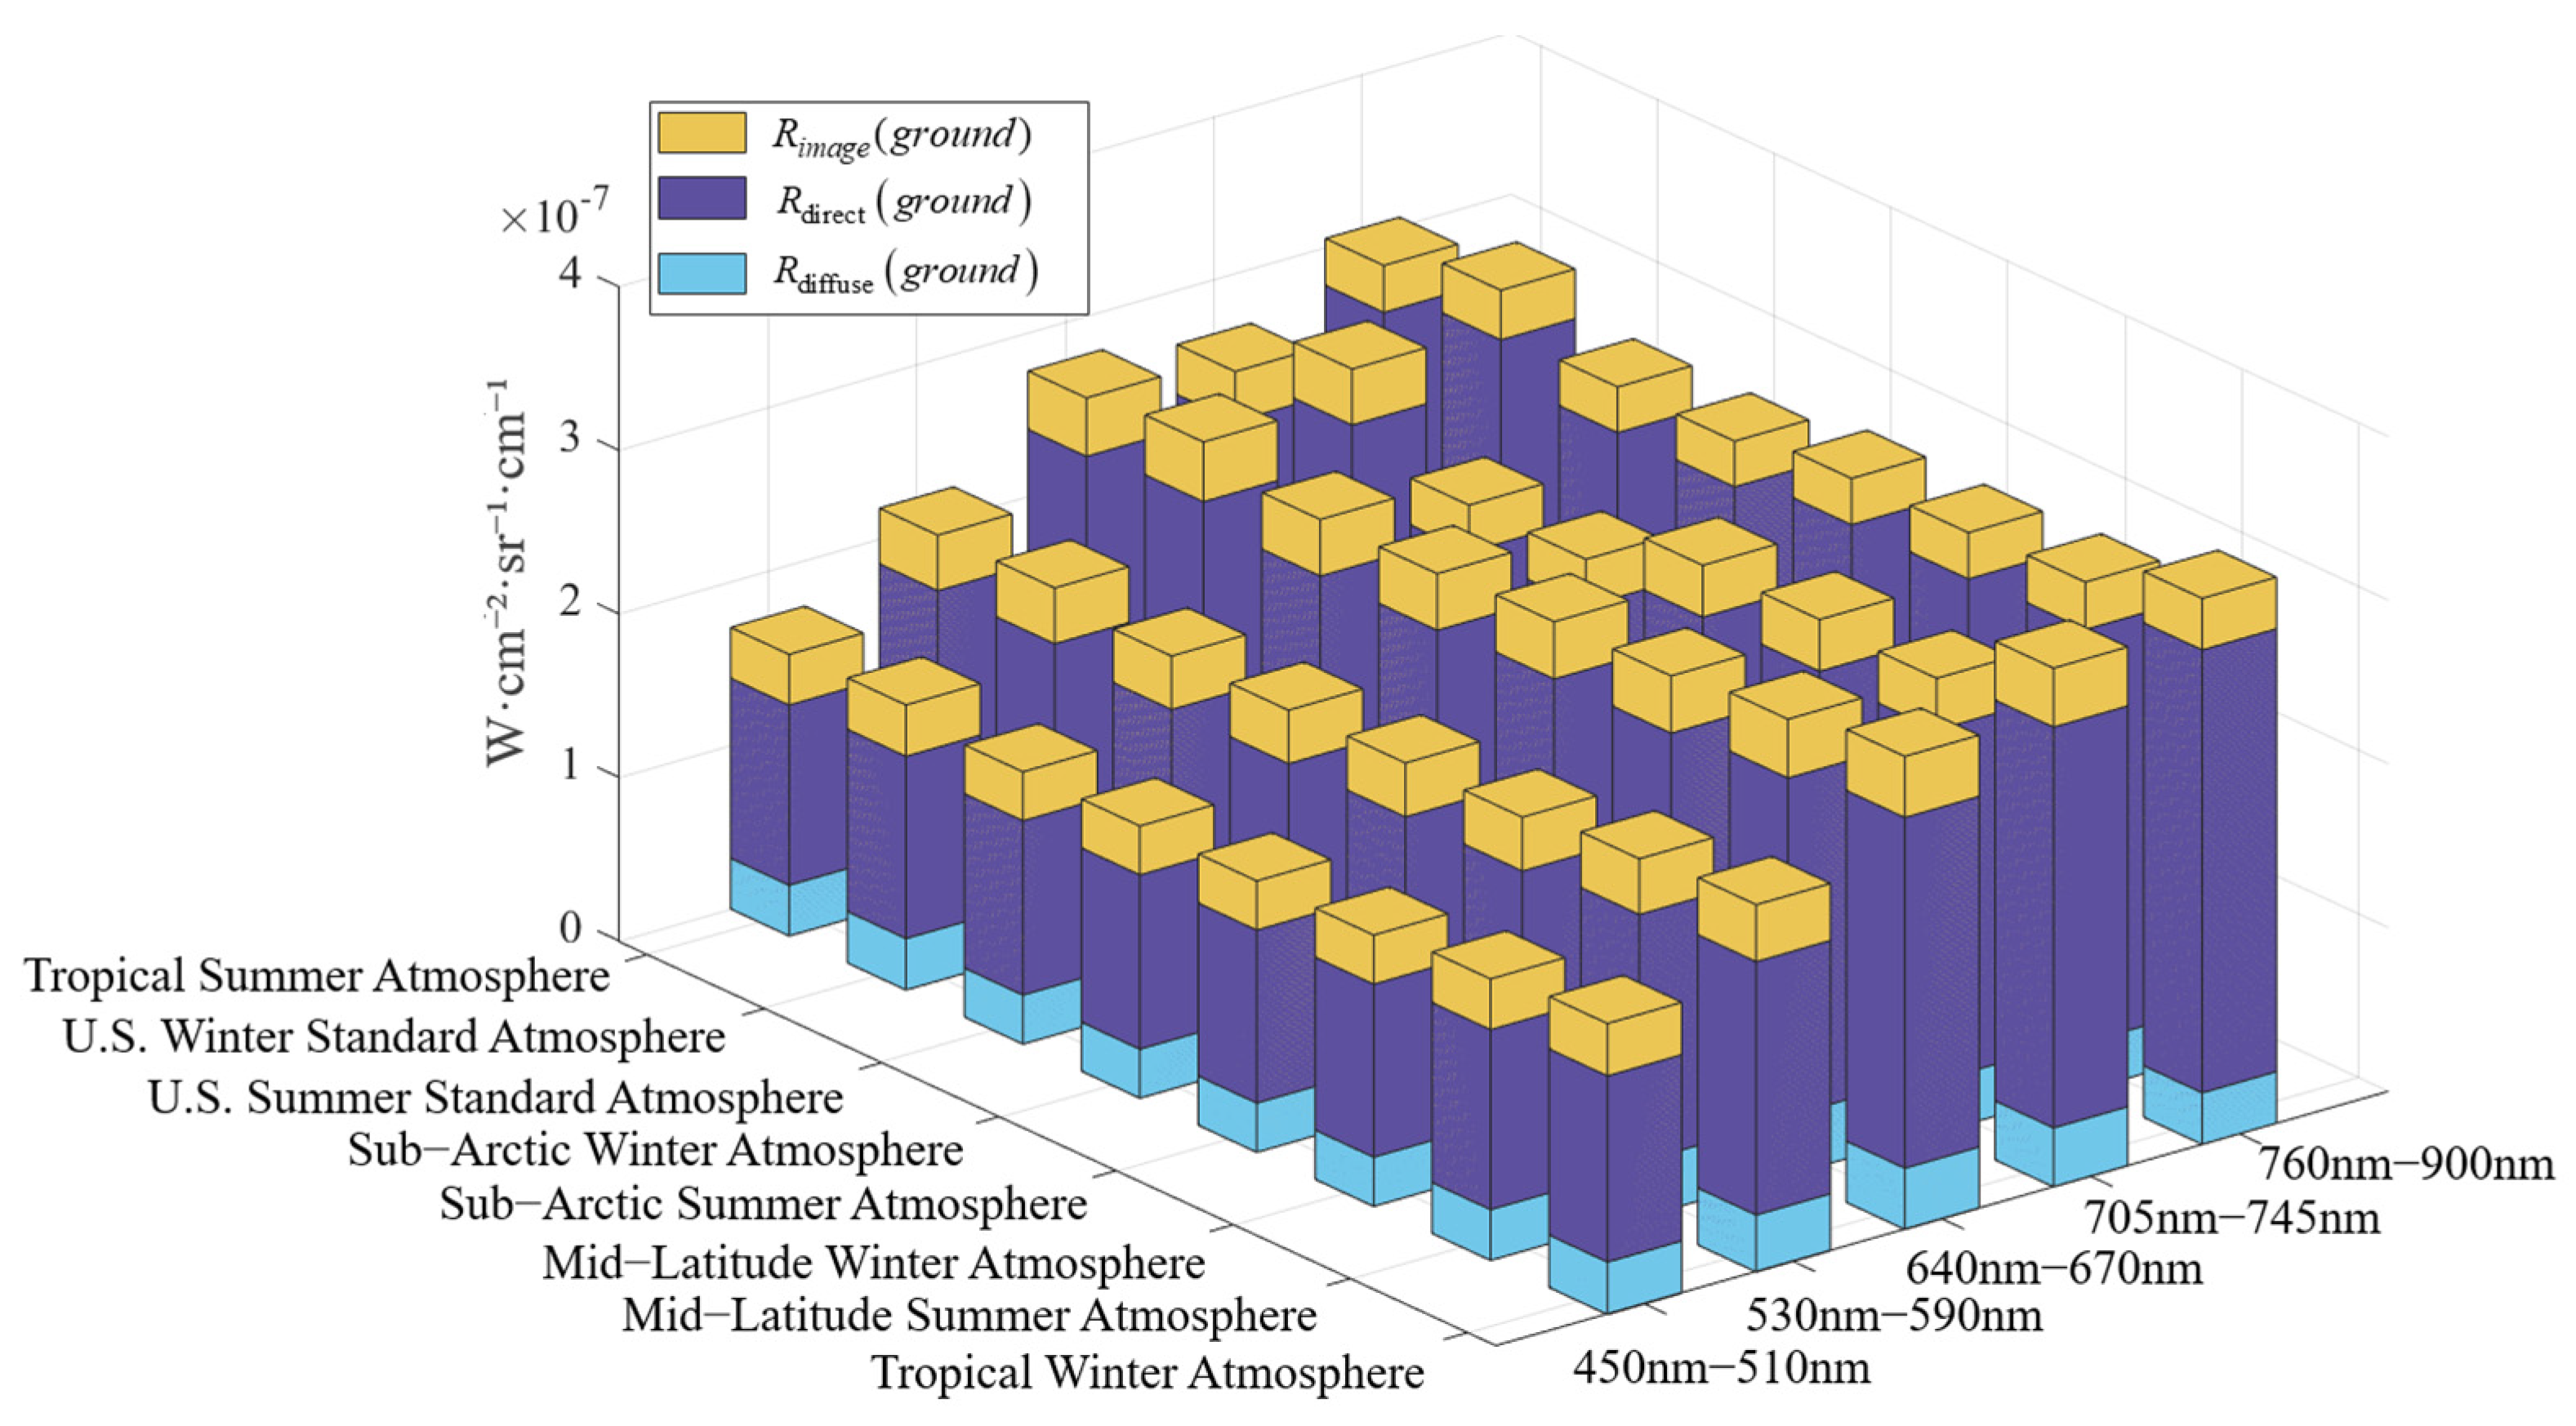
In Equation (3), represents an approximation of , where denotes the atmospheric transmittance, represents the optical thickness, and refers to the radiance at the top of the atmosphere (TOA). The was neglected because it accounts for only 5% to 15% of the total radiative energy, as determined through simulations of eight typical atmospheric types (tropical summer atmosphere, tropical summer atmosphere, midlatitude summer atmosphere, midlatitude winter atmosphere, subarctic summer atmosphere, subarctic winter atmosphere, U.S. winter standard atmosphere, and U.S. summer standard atmosphere) using MODTRAN (as illustrated in Figure 2). The direct radiance was calculated based on the radiance at the TOA and τ. Atmospheric transmittance over one hour was assumed to be constant due to the lack of real-time atmospheric profile data, and it was found to remain between 0.8 and 0.95 from morning to afternoon under clear sky conditions. Therefore, primarily depends on variations in solar radiation at the TOA, which can be calculated using the solar elevation angle (h) [48,49,50,51].
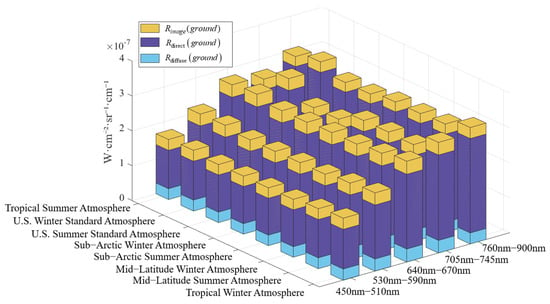
Figure 2.
The MODTRAN simulation results of different radiances in six typical atmospheric models.
3. Experiments
3.1. Experimental Design
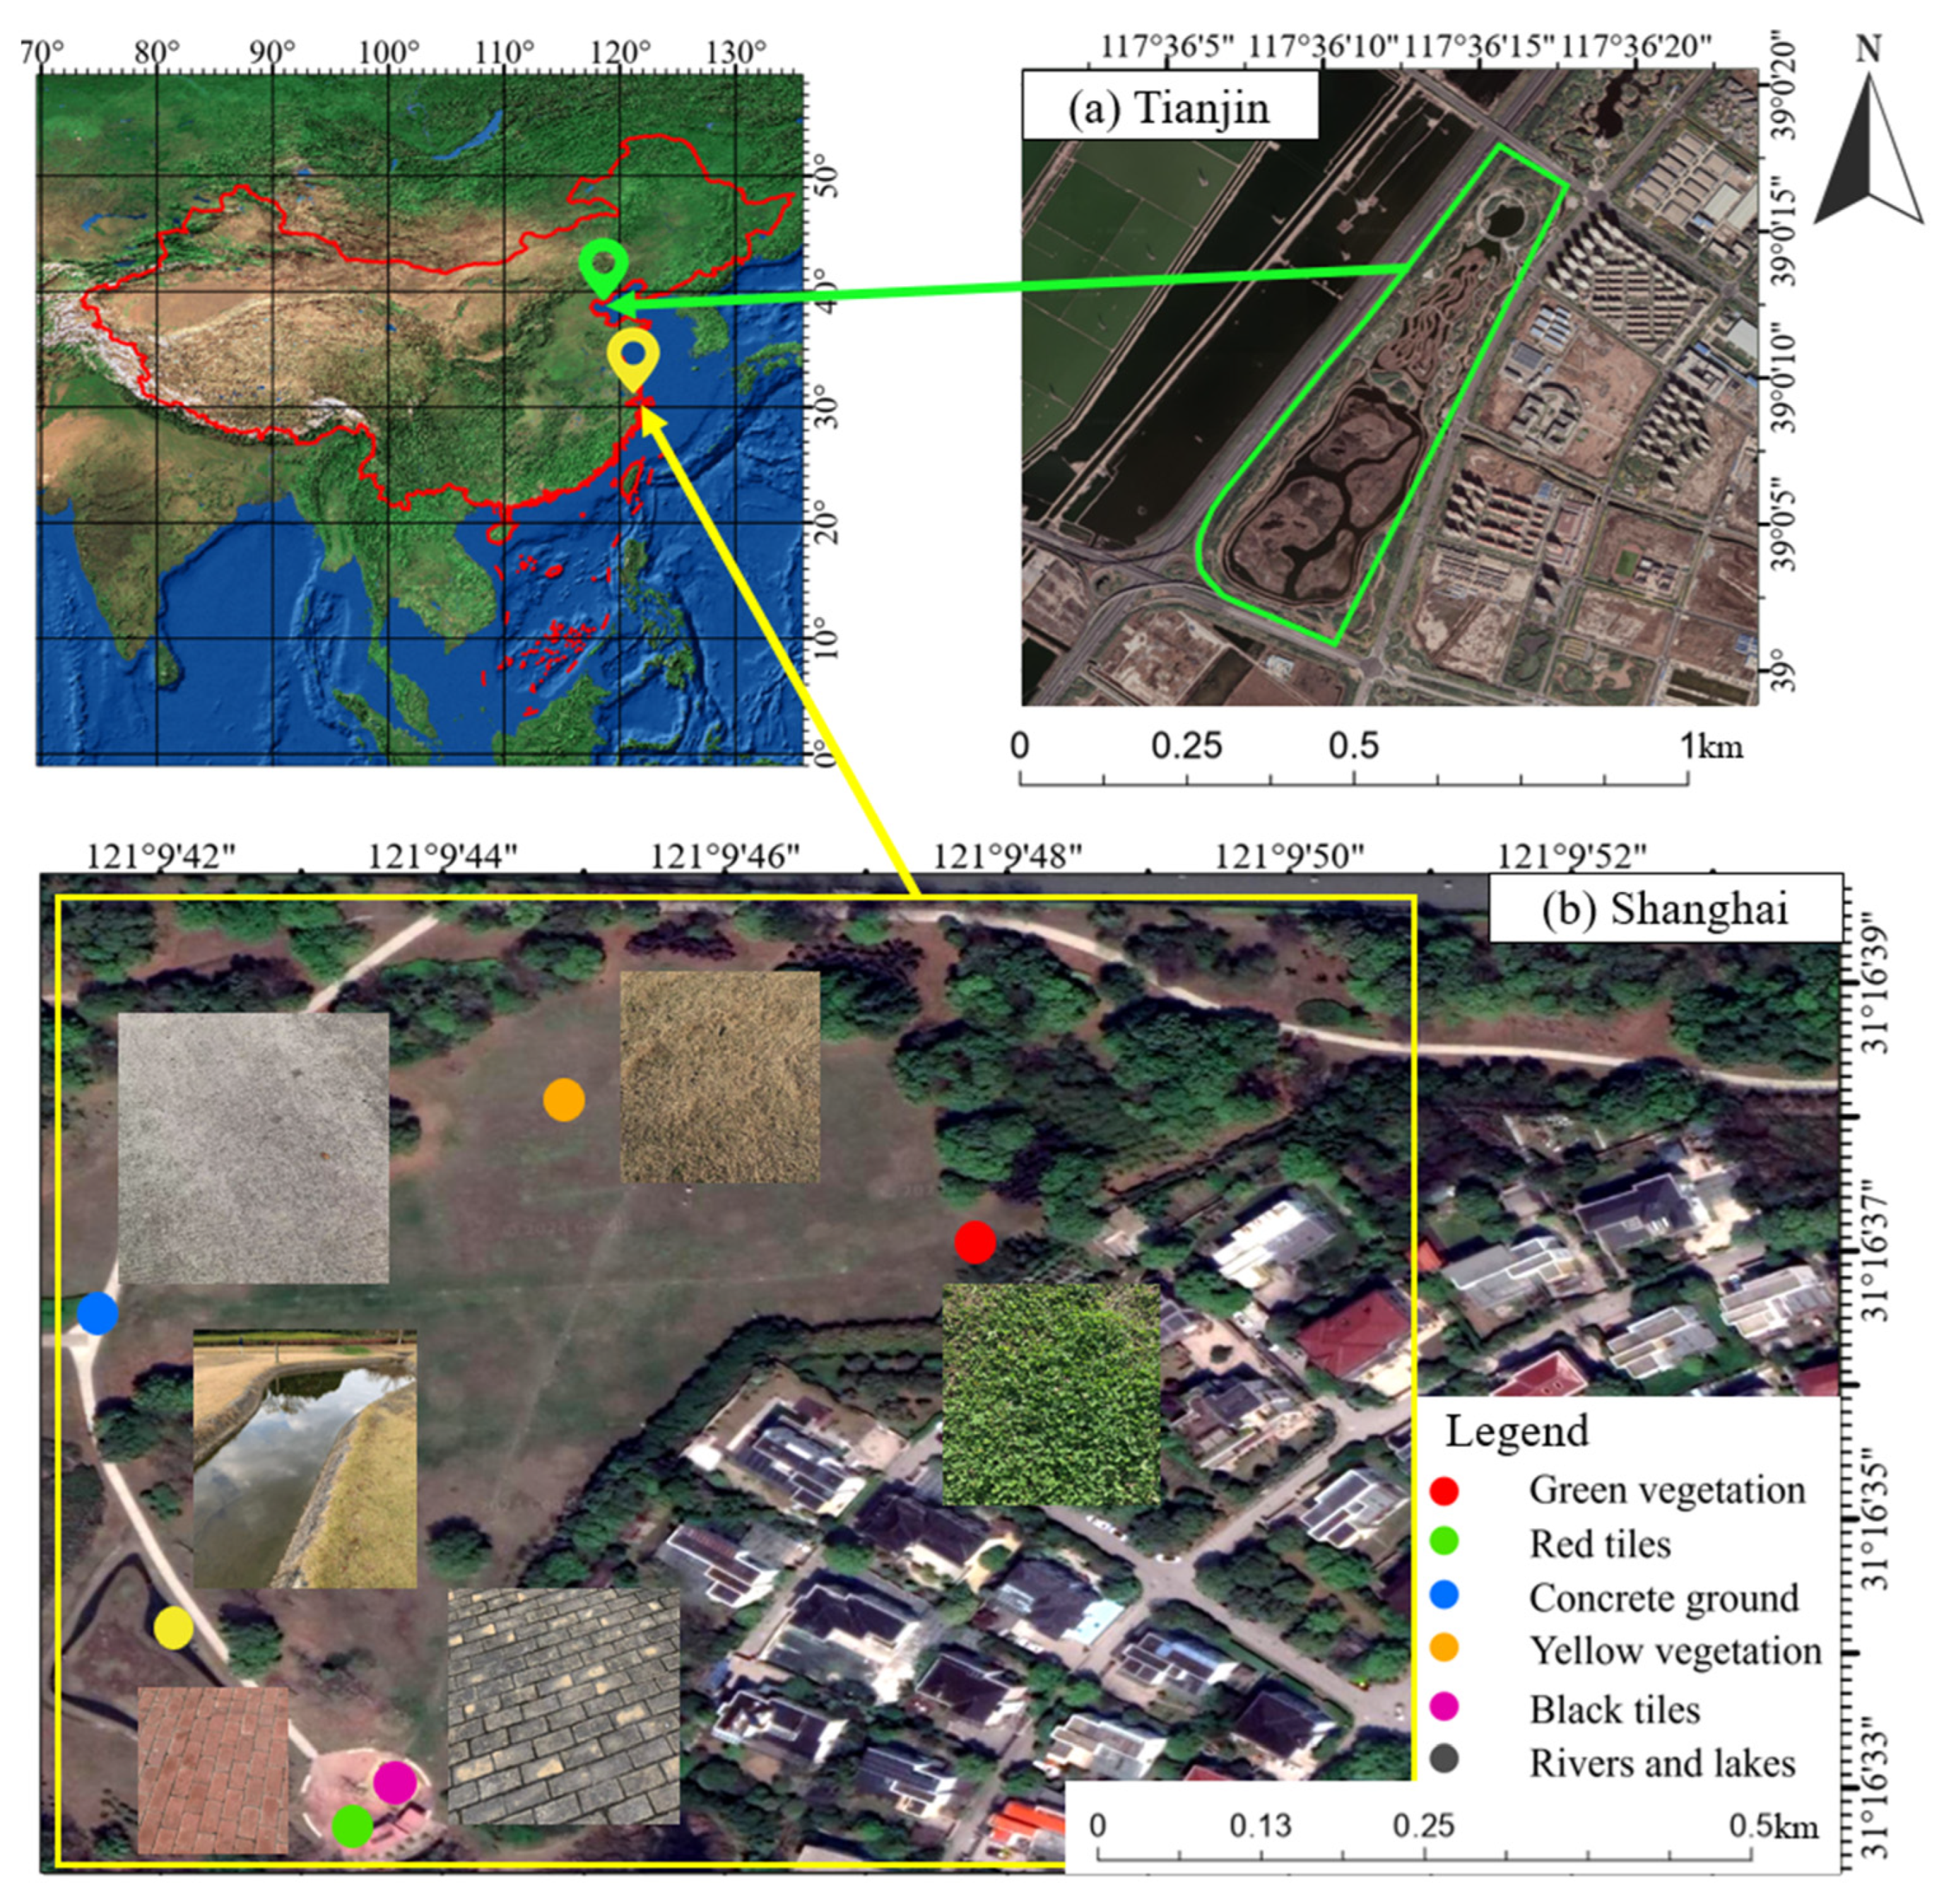
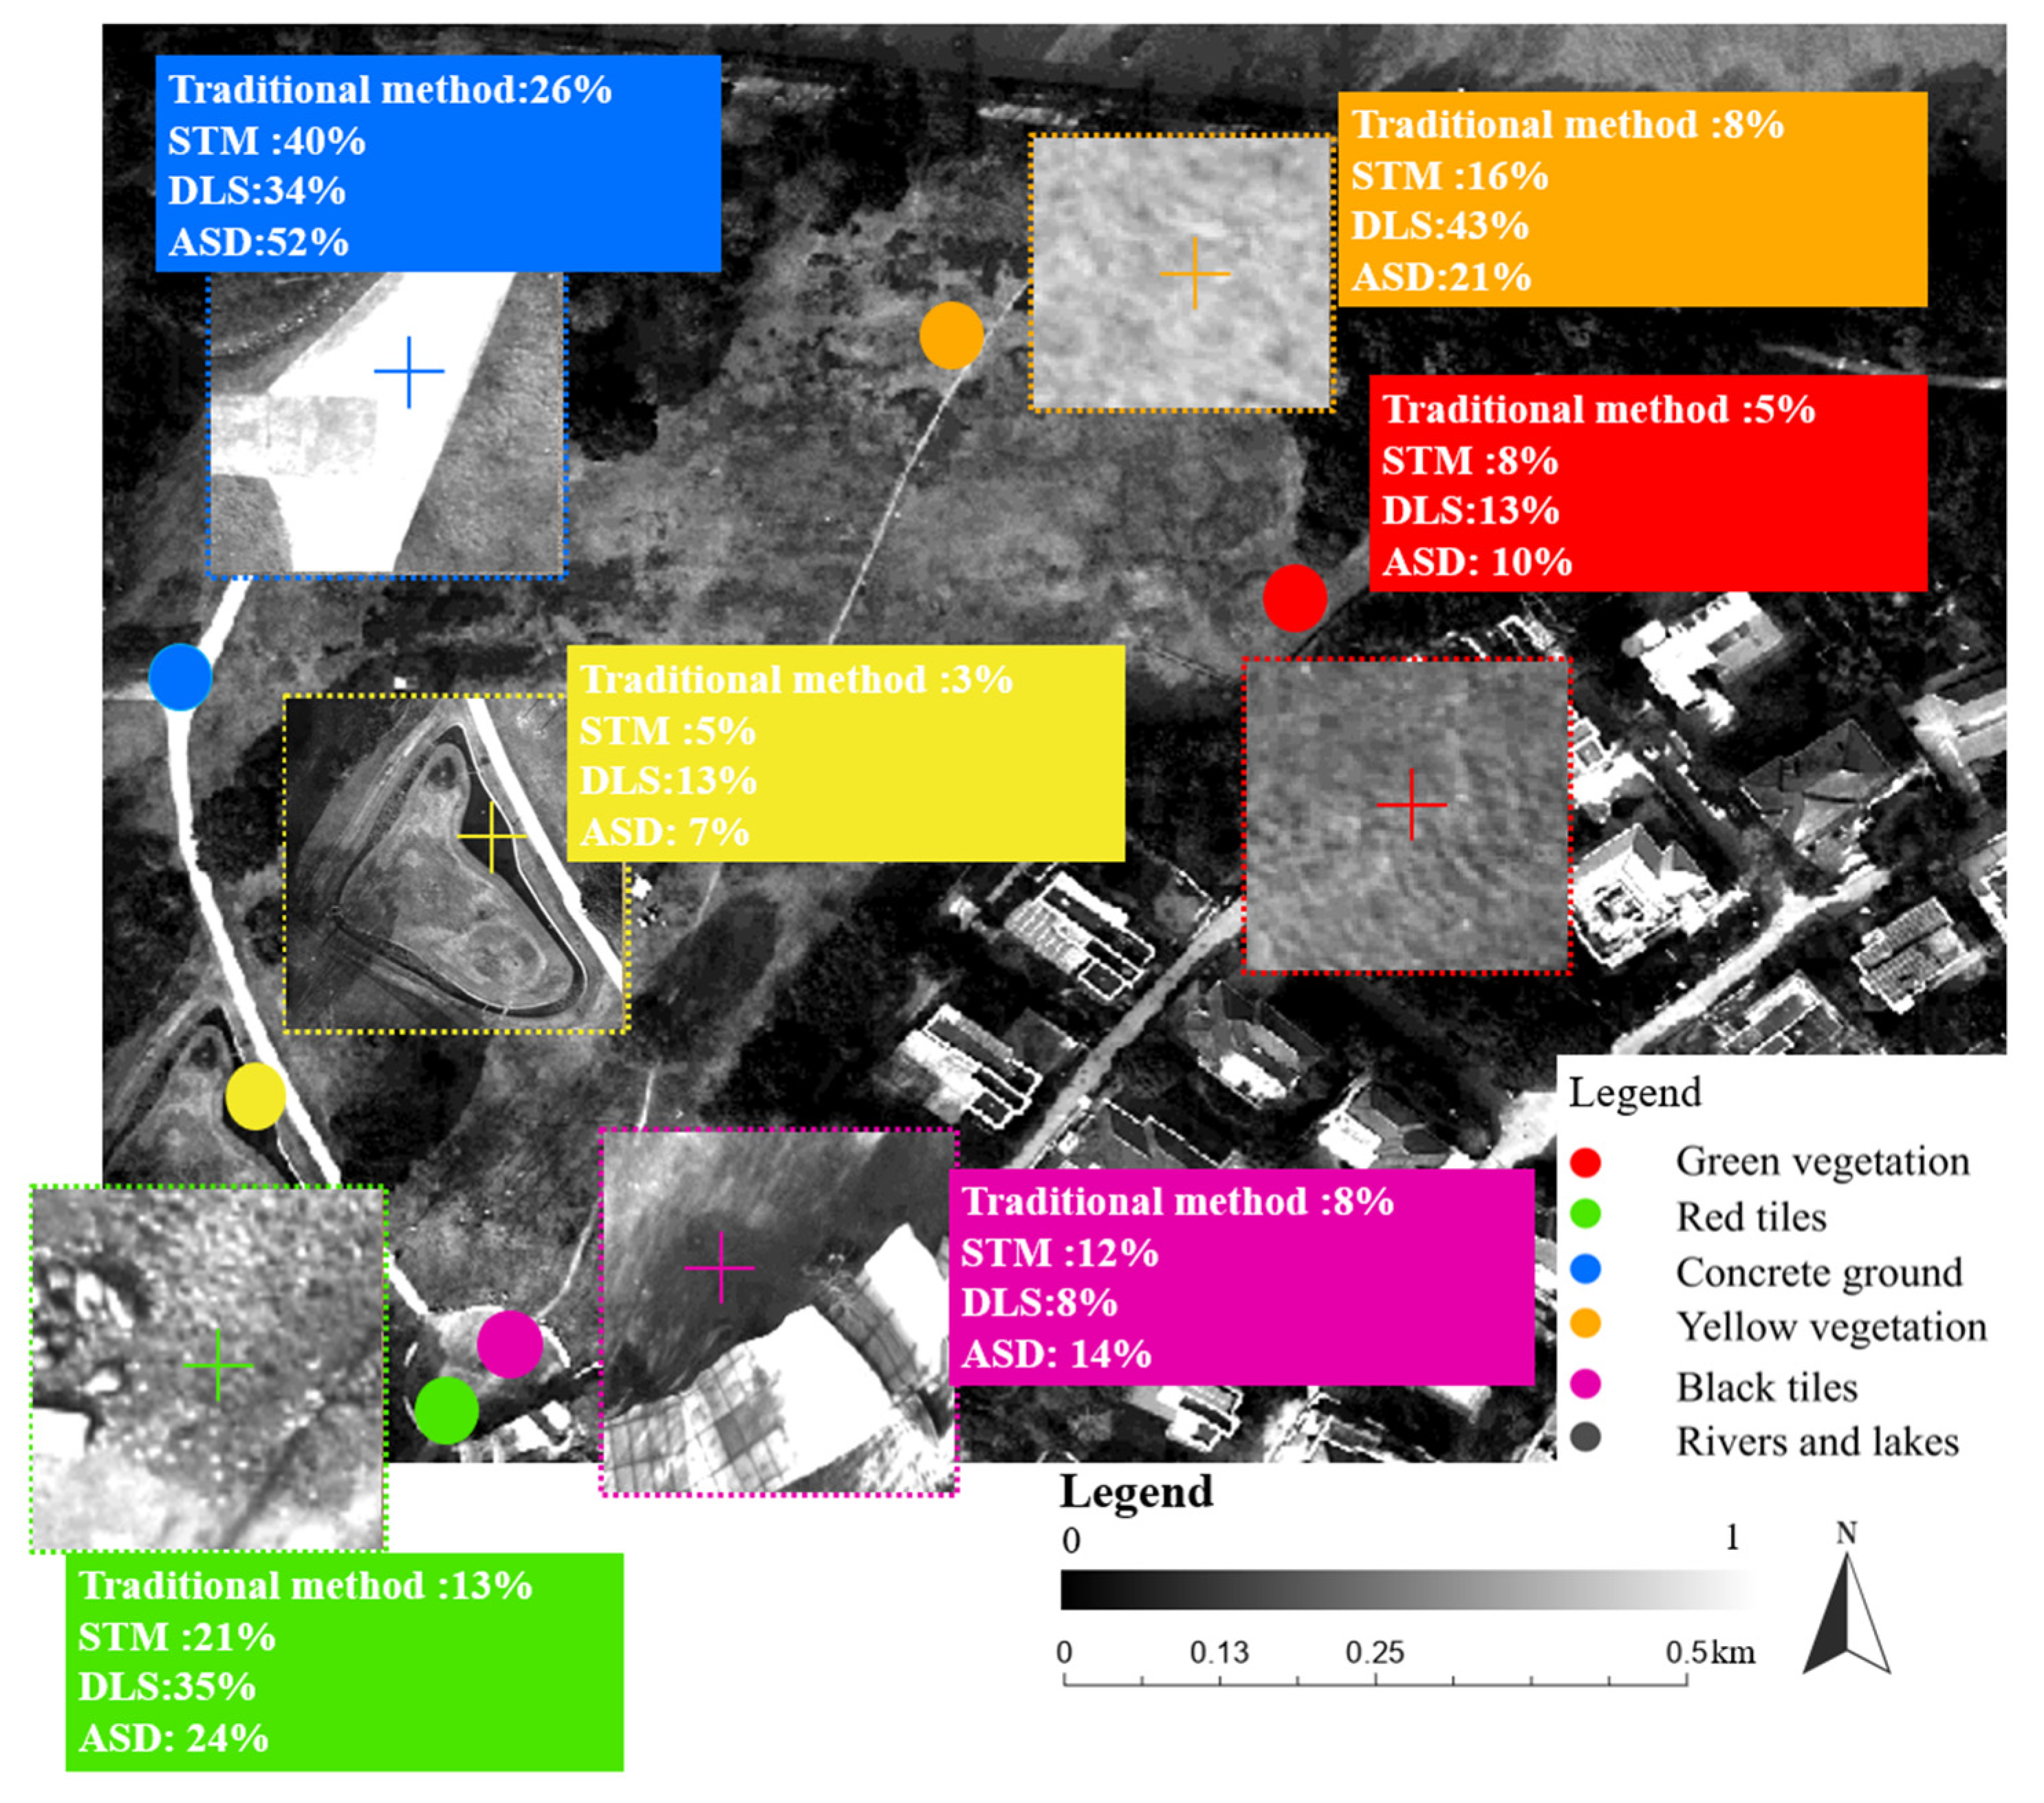
Experiments were conducted at two locations: Tianjin on 16 April 2023, and Shanghai on 14 December 2023, representing diverse environmental conditions. In Shanghai, the test area was located at 121°9′47″ E, 31°16′36″ N (Figure 3b). Real-time solar radiation measurements were taken in the morning using a ground-based solar radiometer. We simulated the aerial photography of a long-endurance UAV using a short-endurance DJI M300 UAV equipped with a DLS, which conducted aerial photography approximately every 20 min. By comparing the reflectance of the CRP across 2–3 flights, we could simulate the situation of a long-endurance UAV capturing the same area at different time intervals. Additionally, reflectance measurements of six representative surface features were conducted using an ASD spectrometer, marked by different colored dots in Figure 3b.
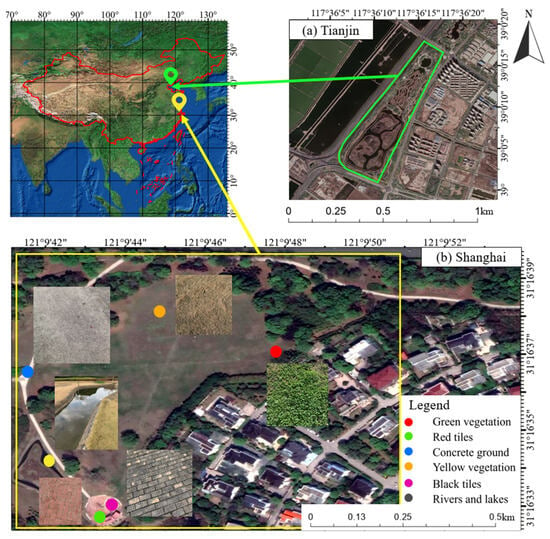
Figure 3.
Experimental area geographic location and sample points. (a) Tianjin experiment area. (b) Shanghai experiment area and sampling points.
In Tianjin, the experiment centered at 117°41′18″ E, 38°54′15″ N (Figure 3a) utilized a long-endurance CW-15 UAV for aerial photography every two hours, starting in the morning, with CRP images taken prior to each flight for consistency. Details such as test site area, flight altitude, image overlap rate, and other parameters are provided in Table 1. This design comprehensively simulated long-endurance UAV operations and evaluated their performance over extended periods. Multiple aerial photography sessions at different times and locations assessed the model’s effectiveness in simulating image correction, while spectrometer data ensured the accuracy and broad applicability of the experimental results.

Table 1.
UAV experimental operational parameters.
3.2. Experimental Equipment
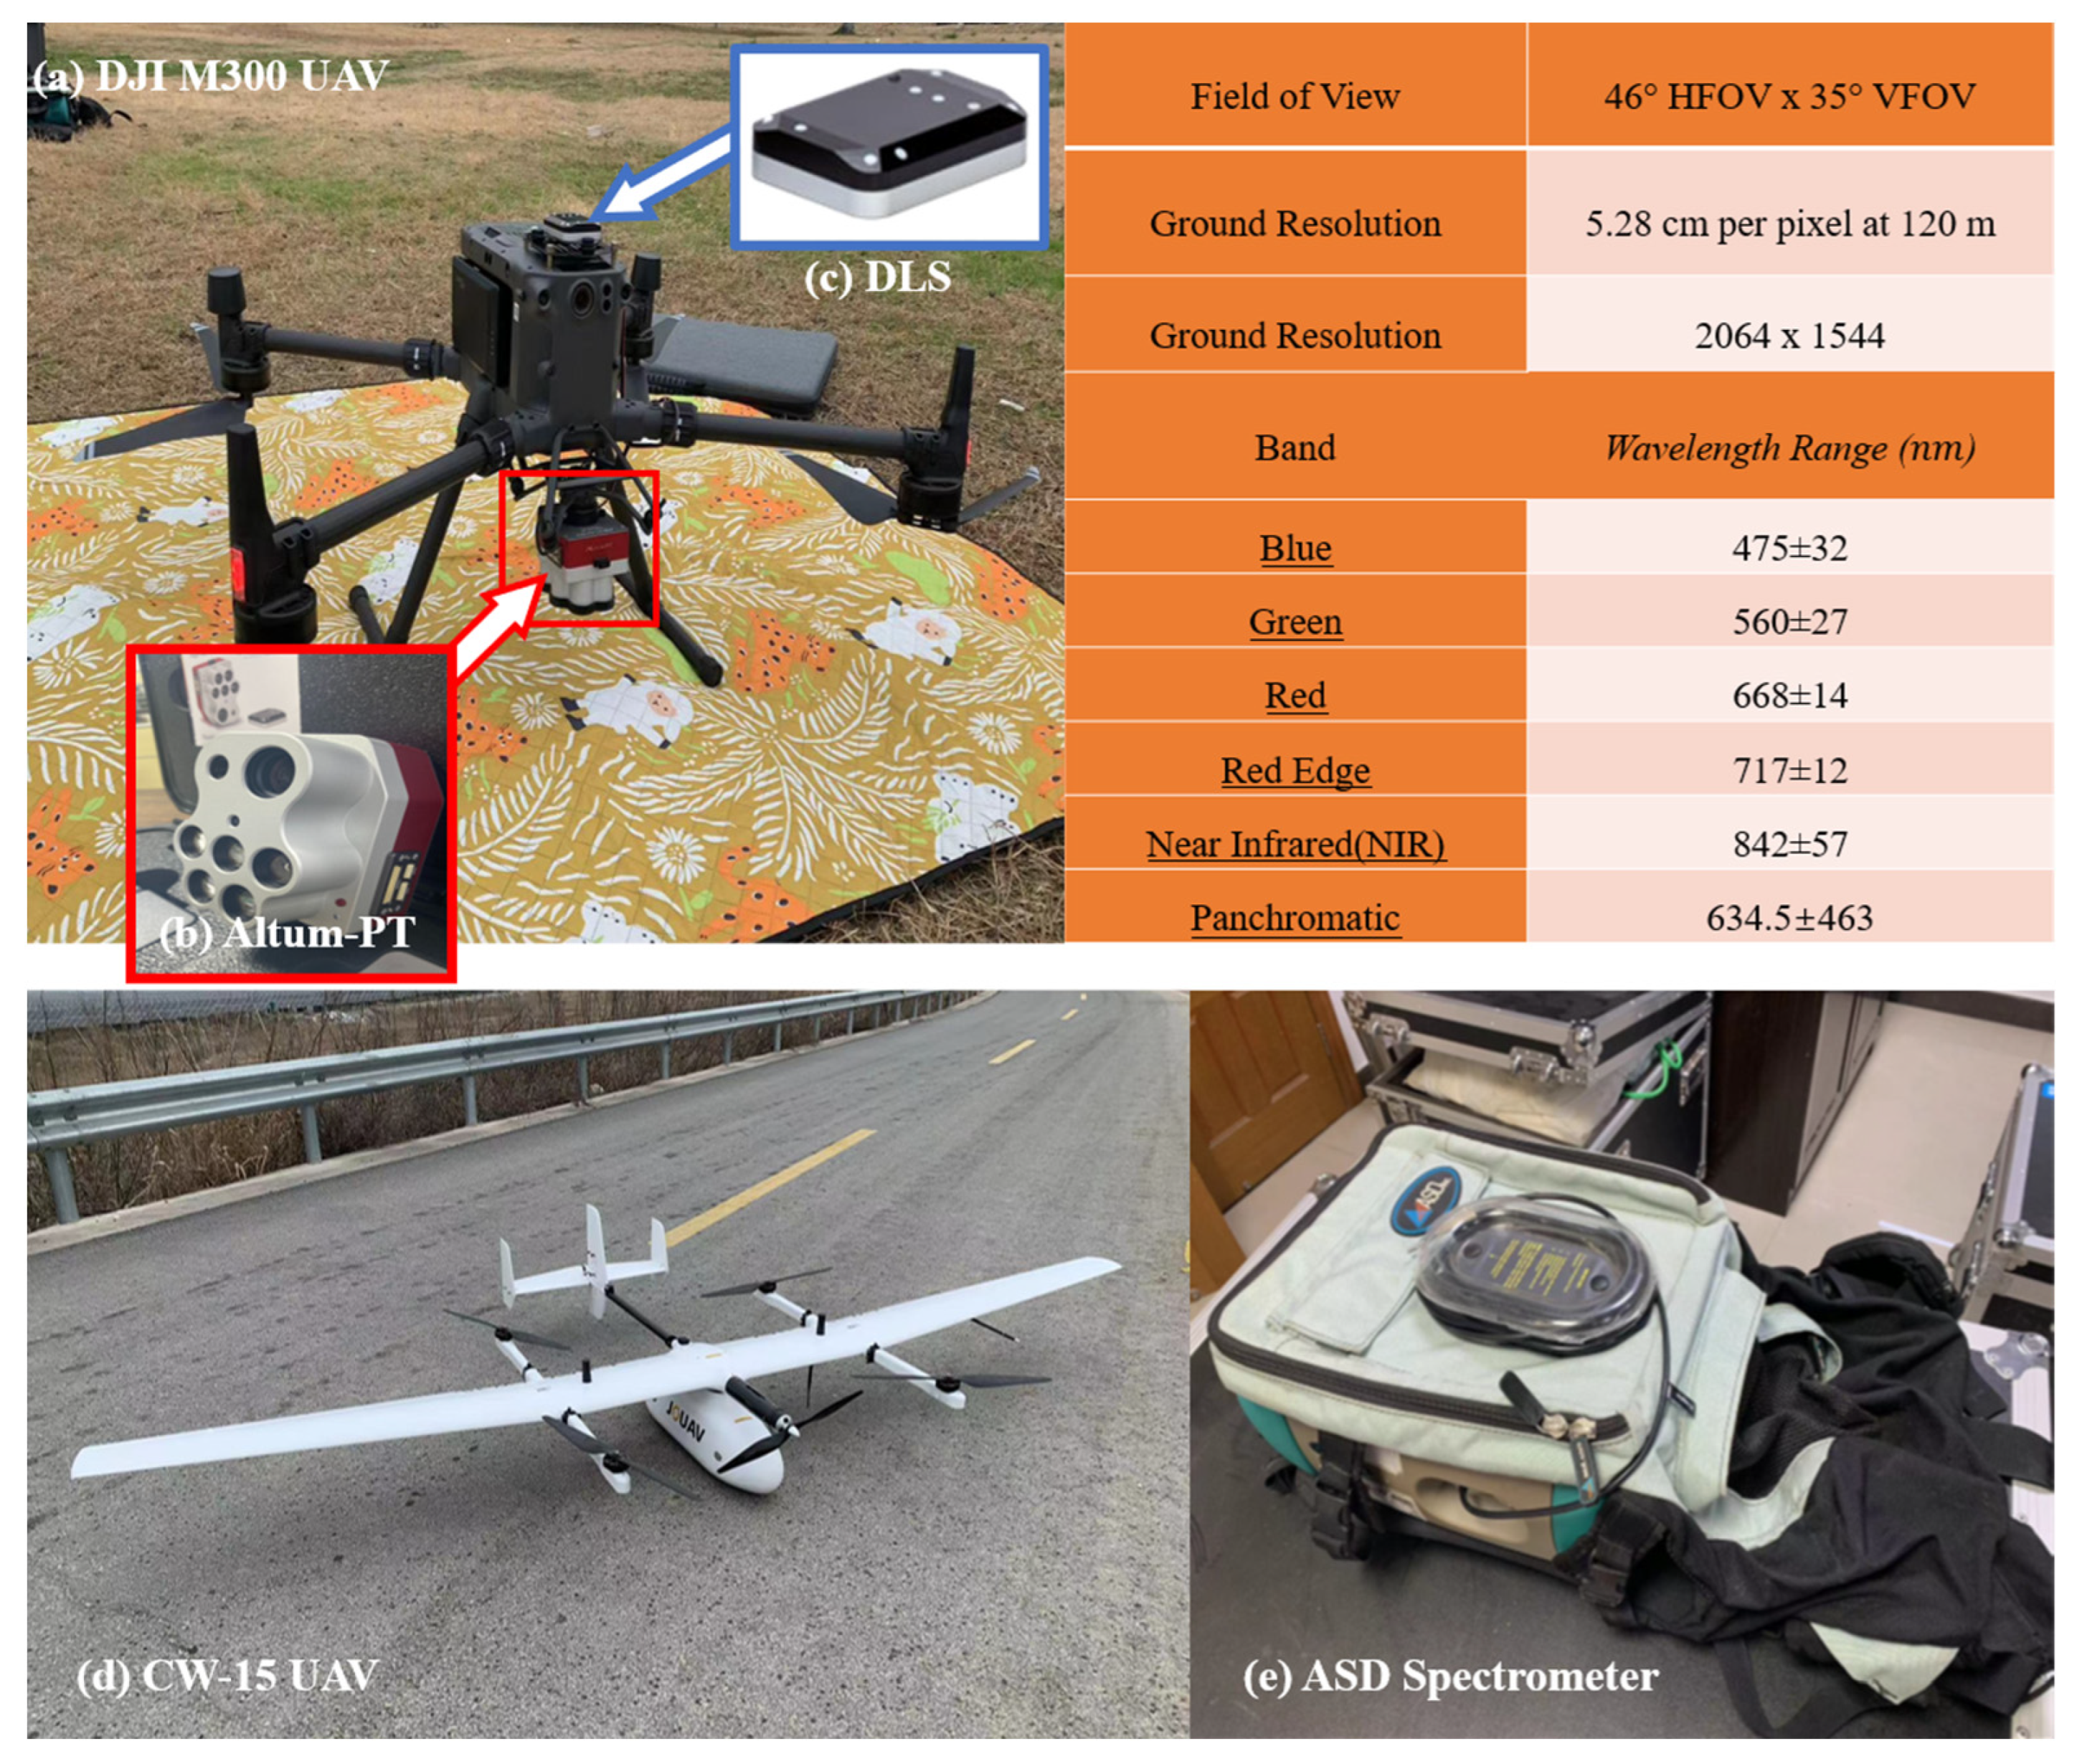
This experiment employed two types of UAV: the DJI M300, a short-endurance UAV with a flight duration of 30 min (Figure 4a), and the CW-15, a long-endurance UAV with a flight duration of 150 min (Figure 4d). The DJI M300 was used to simulate a scenario in which a long-endurance UAV captures images of the same surface feature at different times, allowing for the investigation of reflectance variations of the same surface feature under different solar radiation conditions. A CRP was selected as the target for this simulation due to its ability to provide consistent reflectance measurements. Additionally, a DLS was mounted to record the incoming solar radiation (Figure 4b). The DLS used in this experiment was from MicaSense (Seattle, WA, USA) and featured six bands, identical to the camera’s sensor. Although the DJI M300 has a shorter flight duration, it was deemed suitable for this simulation because it effectively simulates the scenario of a long-endurance UAV capturing images of the same feature during flight. In contrast, the CW-15 long-endurance UAV was used to simulate actual long-duration missions, serving as a benchmark for evaluating performance over extended periods. Both UAVs were equipped with an Altum-PT multispectral camera (Figure 4b), which is crucial for acquiring high-quality multispectral data. Additionally, an ASD high-resolution spectroradiometer (Figure 4e) was used to provide stable and reliable reflectance measurements.
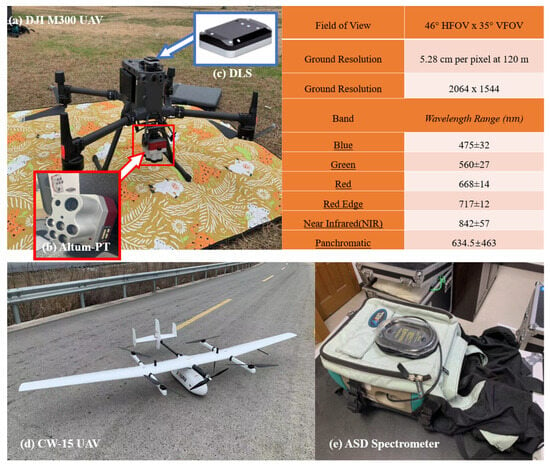
Figure 4.
Experimental equipment. (a) DJI M300 UAV. (b) Altum-PT multispectral camera and its parameters. (c) Downwelling light sensor. (d) CW-15 fixed-wing UAV (e) ASD spectral radiometer.
3.3. Validation Experiments
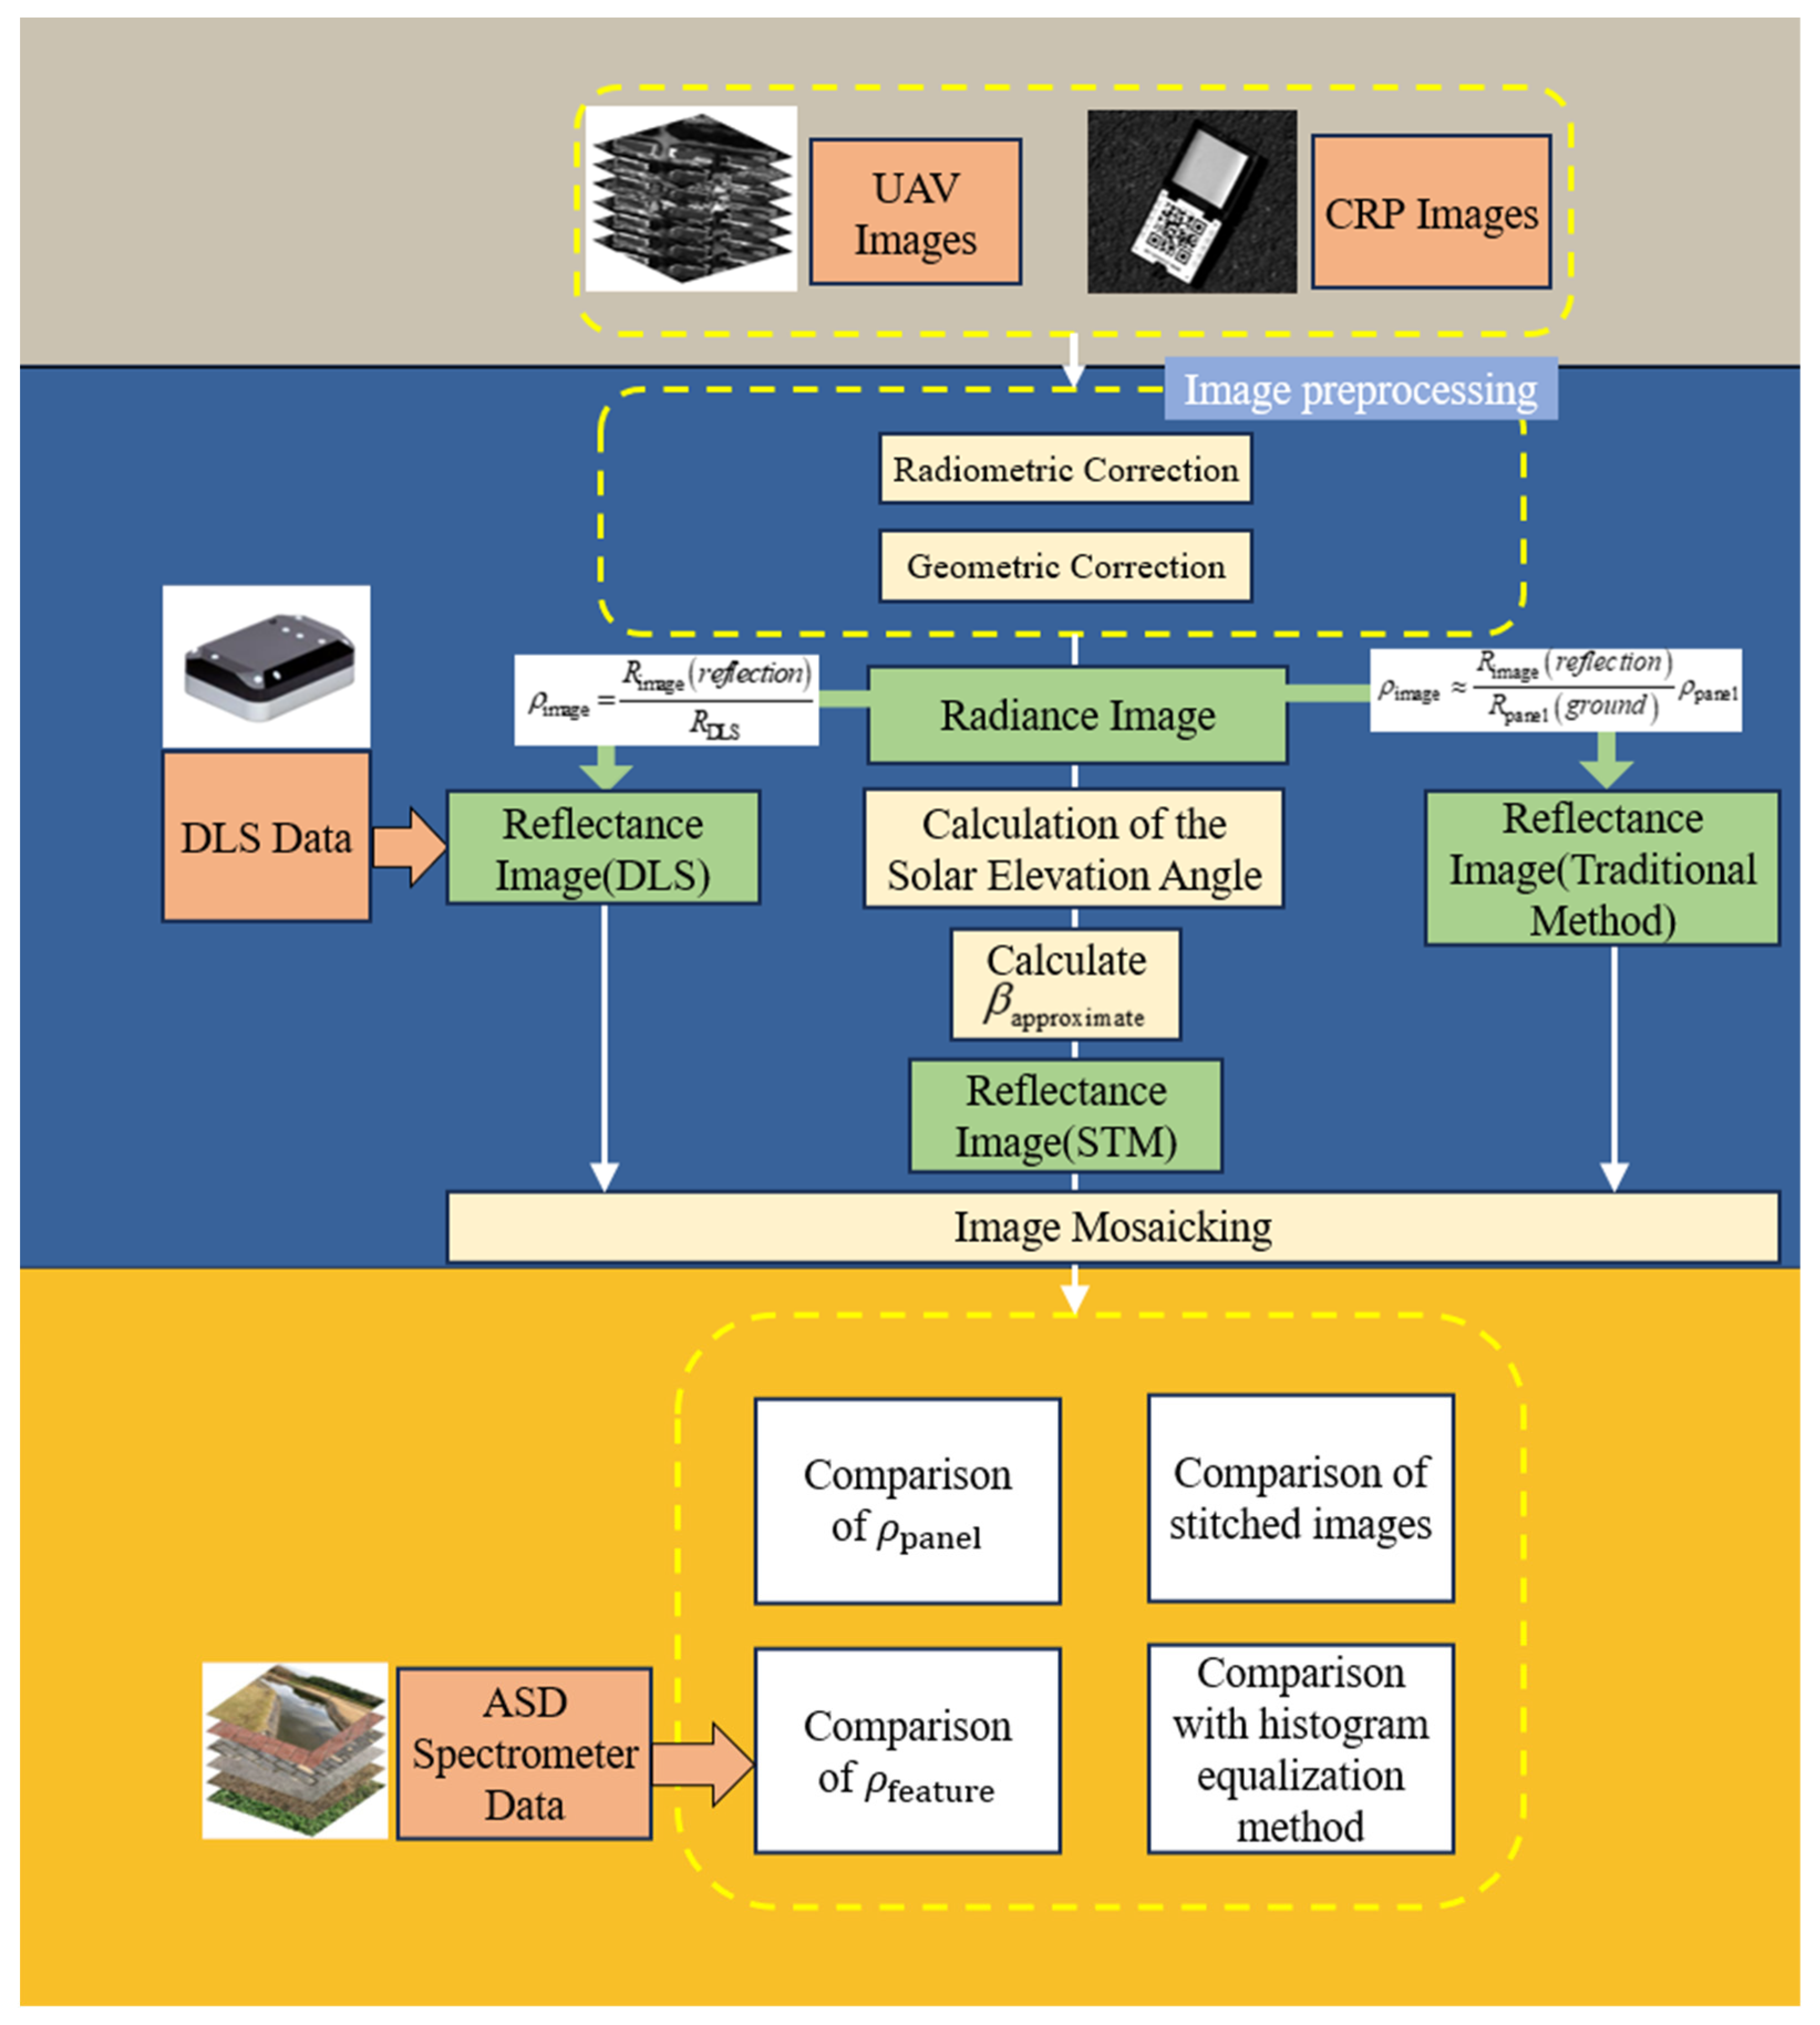
The validation experiment, as illustrated in the overall workflow shown in Figure 5, collected four types of data: UAV images, CRP images, ASD spectrometer measurements, and DLS data. First, data preprocessing was performed on the UAV images and CRP images, which included radiometric correction and geometric correction. Radiometric correction was applied to convert the raw digital numbers (DN) of the UAV images into radiance values using the CRP images as a reference to account for variations in solar radiation and sensor response. Geometric correction was then conducted to remove distortions caused by the UAV’s attitude (pitch, roll, and yaw) and lens aberrations, ensuring that the images were geometrically accurate. After preprocessing, the radiance image was obtained. Using Equation (1) and the DLS data, the reflectance images for both the DLS method and the traditional method were derived. For the reflectance image based on the STM, the solar elevation angle was first calculated, and β was computed using this angle. Subsequently, image mosaicking was applied to the reflectance images generated by all three methods.
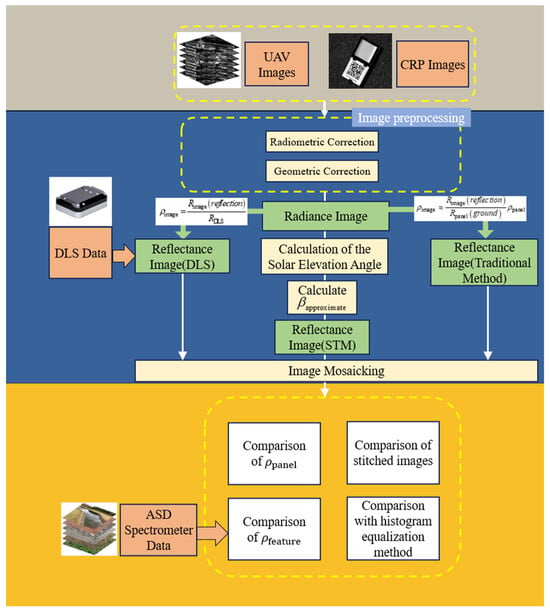
Figure 5.
Validation experiment workflow.
In the results comparison phase, four types of comparisons were conducted: (1) comparison of CRP reflectance values calculated by the three methods, (2) comparison of stitched reflectance images to evaluate consistency and accuracy, (3) comparison of reflectance values from UAV images with ground truth measurements obtained from the ASD spectrometer, and (4) comparison with the histogram equalization method to assess improvement in reflectance accuracy. These comparisons are discussed in detail in Section 4 and Section 5.
4. Results
Comparative experiments were carried out using various methods to evaluate the effectiveness of the STM. When compared with the traditional method and the DLS method, the STM proved to be more suitable for long-endurance UAVs and was able to effectively eliminate inconsistencies in incident radiation between adjacent image strips. Finally, the reflectance values of six feature types collected in the Shanghai test area were compared with the true reflectance values obtained from the ASD spectrometer, further validating the effectiveness of the model under real-world conditions.
4.1. Comparison of CRP Reflectance Calculated by the Different Methods
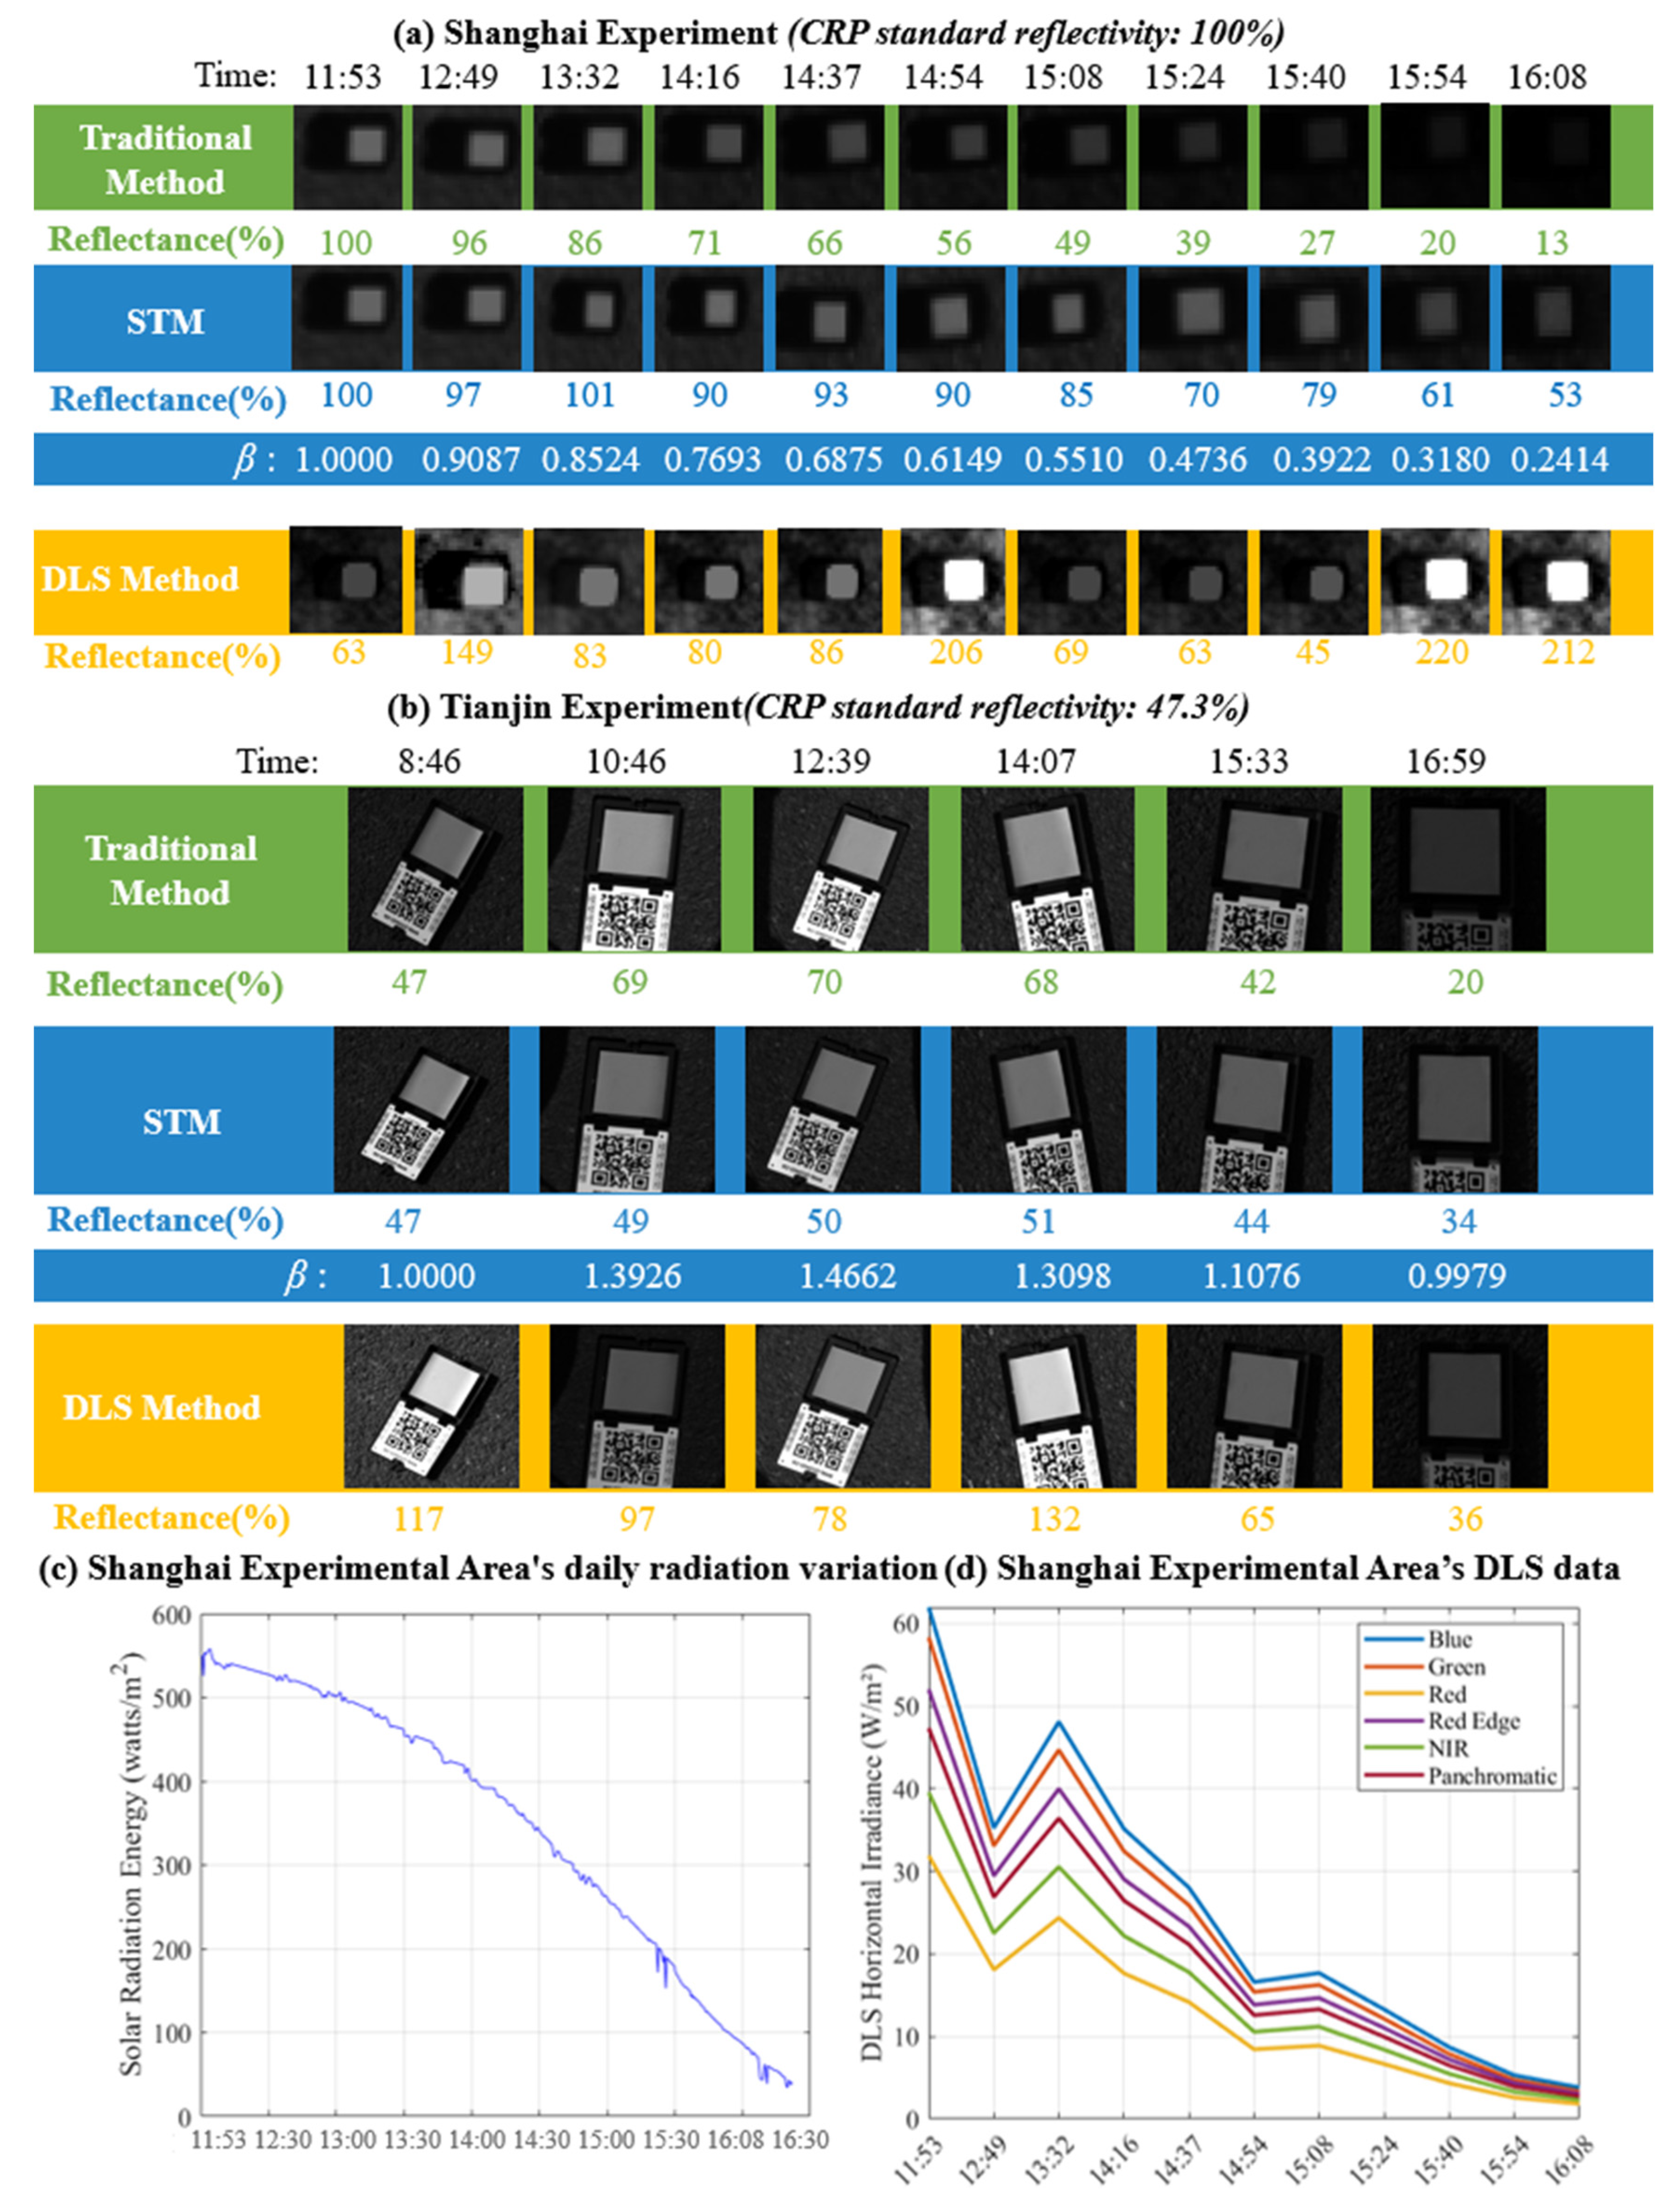
Figure 6 presents the simulation experiment results conducted in two test areas, validated by CRP blue band reflectance images. In the Shanghai test area, solar radiation data recorded by a solar radiometer are shown in Figure 6c, reflecting the actual solar radiation energy. Figure 6d displays the DLS data collected during image capture. Due to such factors as the installation angle of the DLS and the aircraft’s pitch, roll, and yaw, the raw irradiance values may be distorted due to the varying incident angles. Therefore, we applied horizontal irradiance data for processing. These data have undergone angle compensation using directional light sensors in the DLS for calibration. This data is not affected by IMU (inertial measurement unit) errors, effectively calculating the irradiance as if the DLS were in a horizontal state. This reduces errors caused by the aircraft’s tilt and makes the radiation correction more accurate. The initial reflectance of the traditional method was 100%, gradually decreasing over 3 h as the incident energy dropped in the afternoon to 96%, 86%, 71%, 66%, and 56%, creating a significant deviation from the true value. In contrast, the reflectance using the STM changed from an initial 100% to 97%, 101%, 90%, 93%, and 90%, remaining much closer to the true value of 100%. Additionally, although the reflectance calculated using the DLS method remained stable between 60% and 80%, significant peaks occurred at certain times due to shadow occlusion and sensor errors, with reflectance spiking at 149% at 12:49 and 206% at 14:54 in the afternoon.
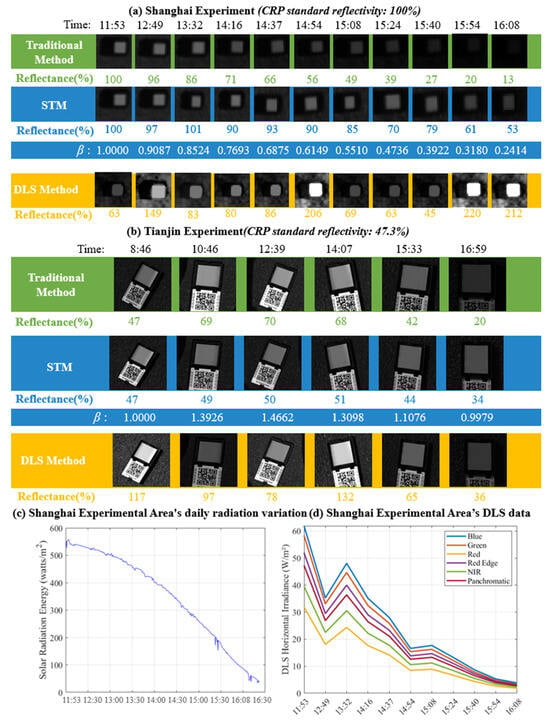
Figure 6.
Comparison of two CRPs’ blue band reflectance. (a) CRP in Shanghai (b) CRP in Tianjin. (c) Shanghai experimental area’s daily radiation variation. (d) DLS data during CRP capture.
In the Tianjin experiment, the CW-15 UAV captured CRP images every 1.5 to 2 h, simulating real long-endurance UAV mission conditions. The CRP reflectance in the Tianjin experiment was 47.3%, with the traditional method’s CRP reflectance rising to 70% in the morning and dropping to 20% in the afternoon. In contrast, the STM’s reflectance remained stable between 34% and 50% throughout the day. The RMSE indicated deviations from the standard reflectance of 100%. In Shanghai, the RMSE for the traditional method was 52.08%, while the DLS method yielded an error of 66.19%. The STM’s RMSE achieved 15.80%, reducing errors by about 37% and 51% compared to the other two methods. In Tianjin, the RMSEs for the traditional method and the DLS method were 23.98% and 64.57%, respectively, while the STM achieved an error of 7.72%, reducing errors by 16% and 56%, respectively.
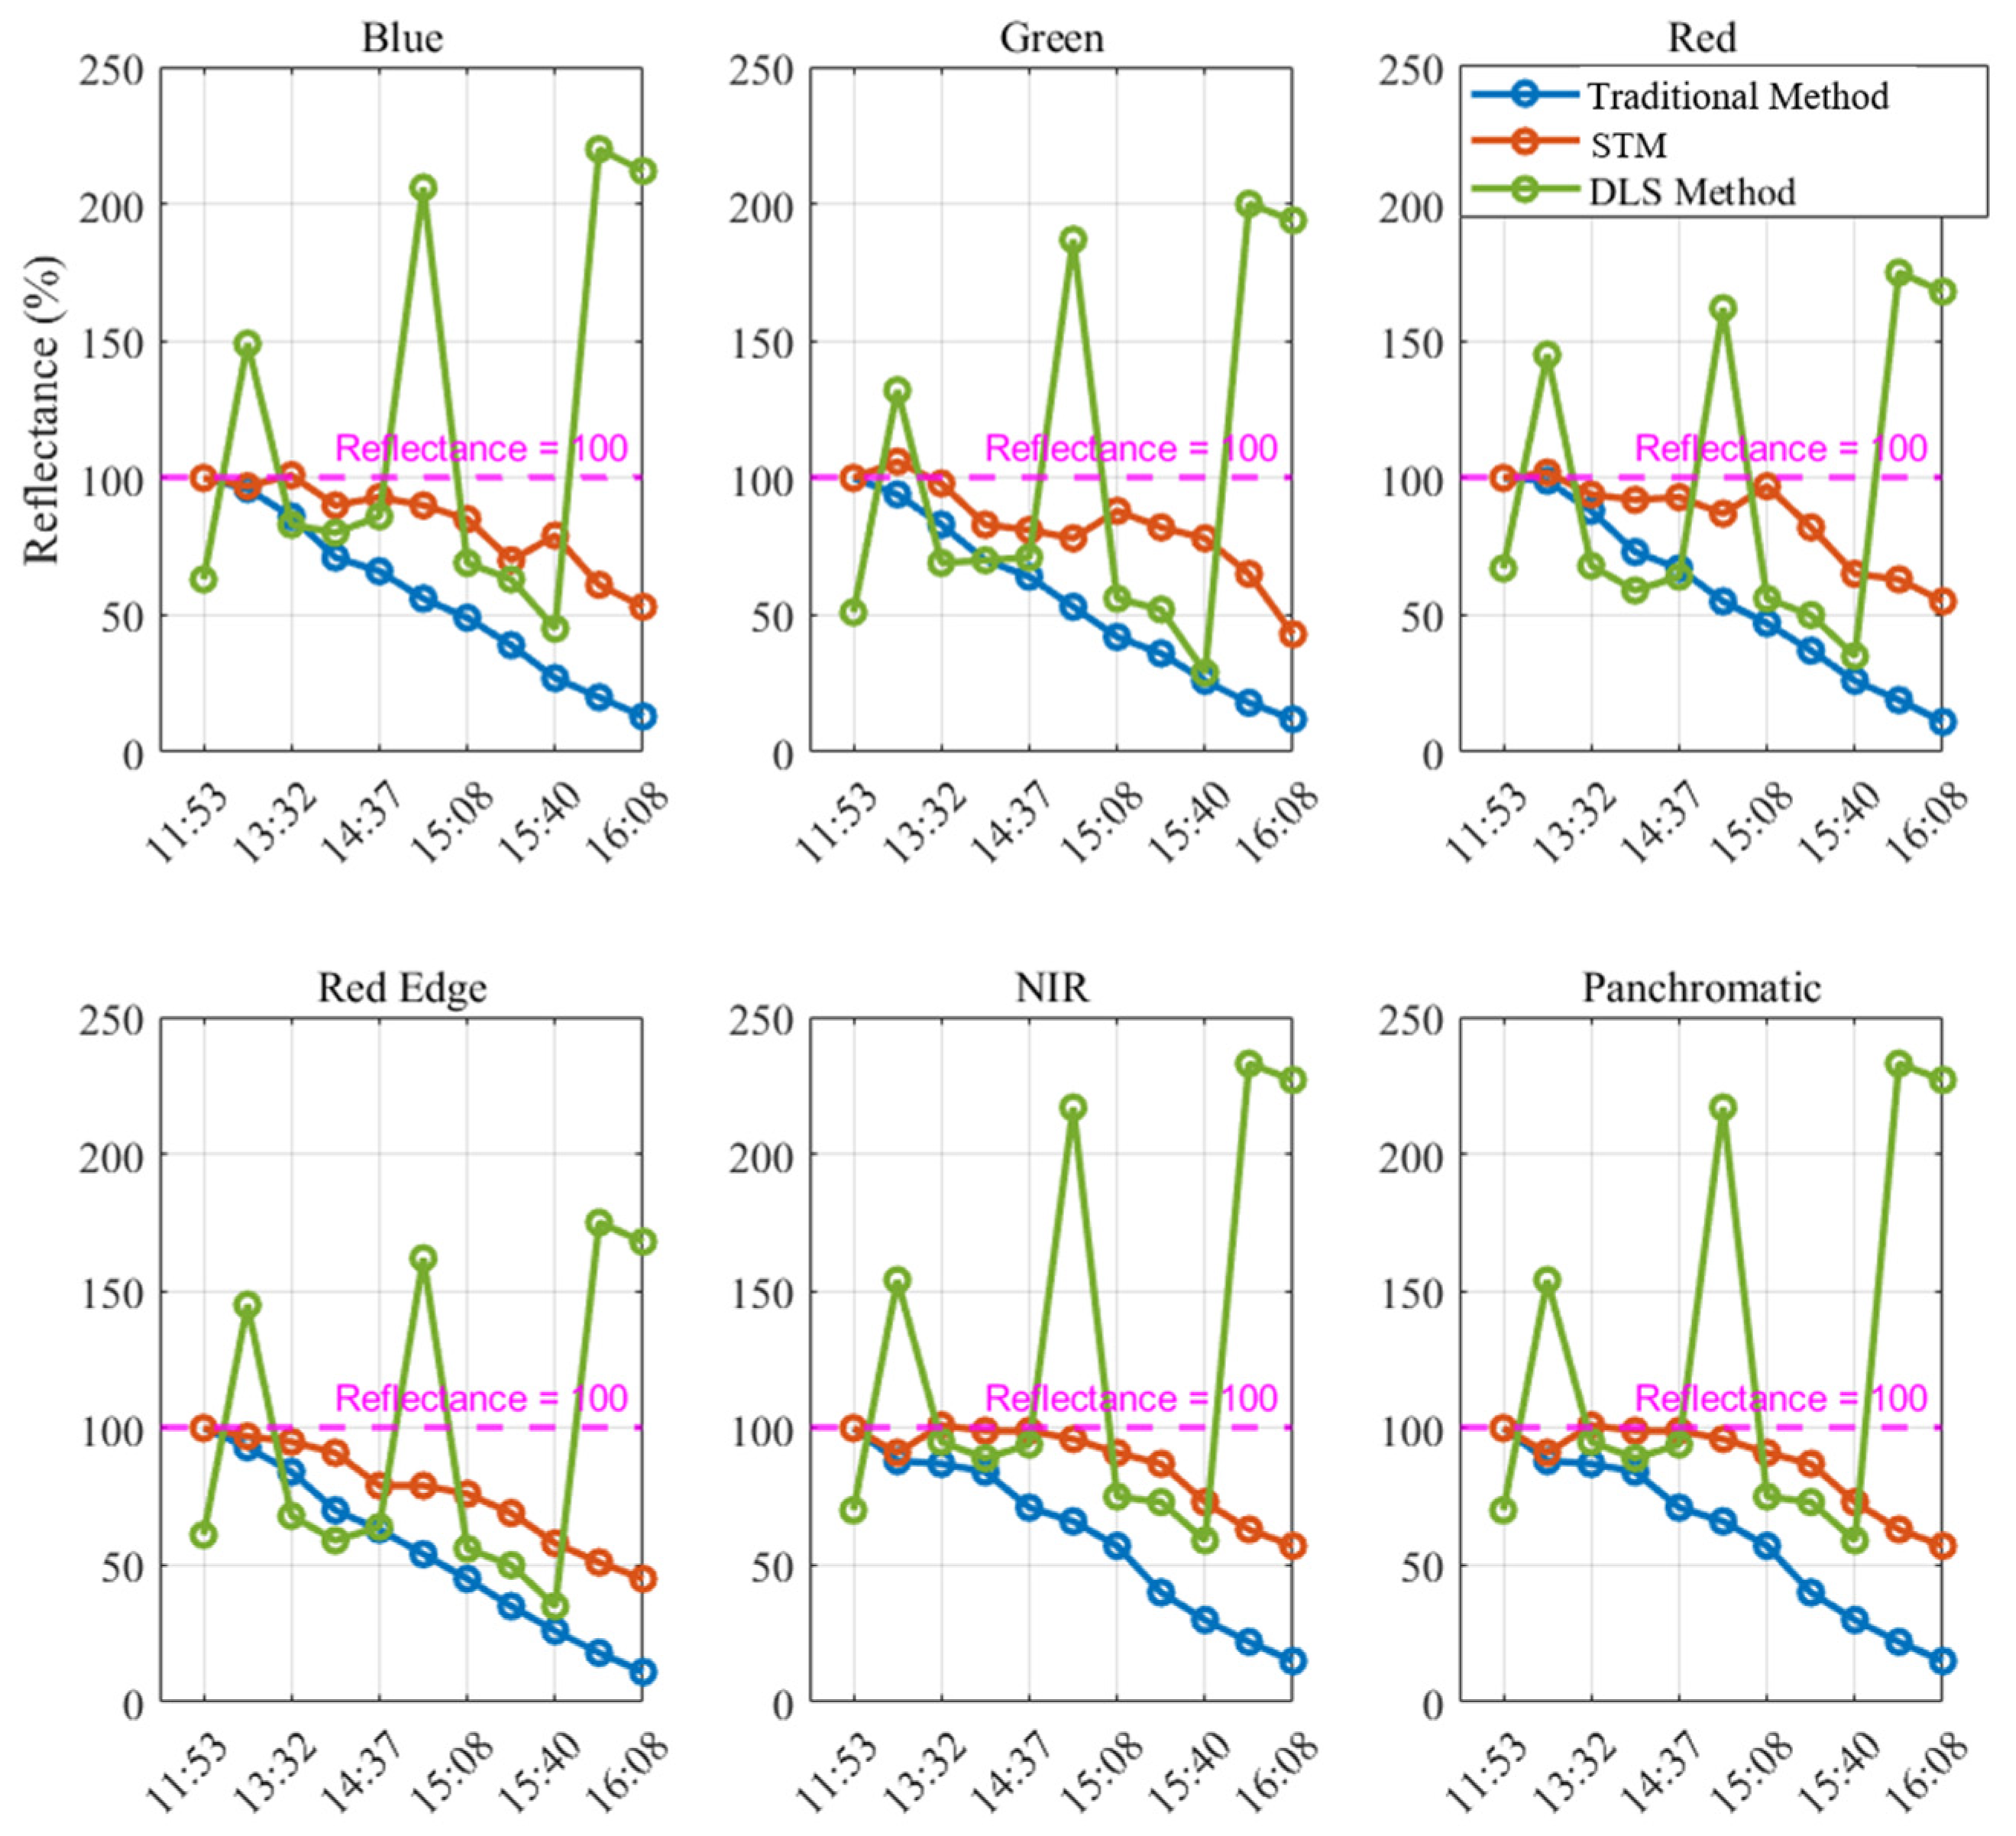
Figure 7 presents the reflectance results for all bands across the three methods in the Shanghai test area. The reflectance calculated using the DLS method remained mostly stable, between 100% and 60%, but significant errors occurred at certain times, with notable fluctuations in the green line. In contrast, the reflectance using the STM showed minimal differences between bands, with the red line gradually declining and stabilizing between 100% and 70% across all bands. The blue line, representing the traditional method, showed no significant fluctuations, but the overall reflectance was lower than the red line. The reflectance of the traditional method remained mostly stable, between 100% and 20%. This indicates that the STM effectively reduced errors and improved accuracy across all bands in the multispectral camera.
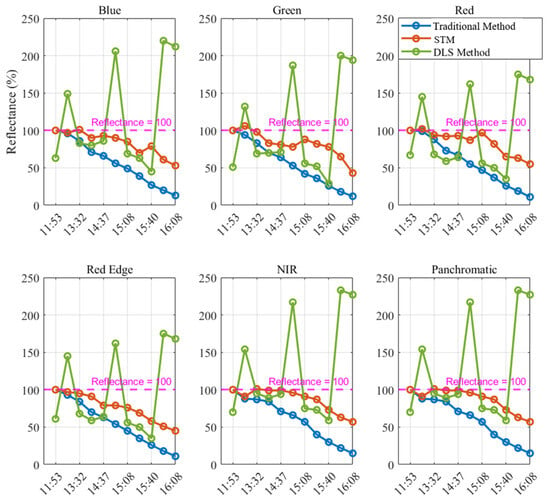
Figure 7.
Reflectance comparison of three methods in the Shanghai test area.
We added an efficiency comparison experiment of three algorithms to further verify the operational efficiency of the proposed method, particularly focusing on the comparison of running time and memory usage. The experiments were conducted on a Dell workstation (manufacturer: Dell, Round Rock, TX, USA) equipped with an Intel Core i7-12700K CPU and an NVIDIA RTX 3080 GPU. In Table 2, the three methods demonstrate the running time and memory usage for processing a single image and a strip of 1594 images. From Table 2, it can be observed that for a single image, the DLS method has a slightly higher peak memory usage compared to the other two methods, while the differences in average processing time are minimal. However, for a larger number of images, the peak memory usage of the DLS method is significantly higher than that of the other two methods, whereas the running time and peak memory usage of the traditional method and the STM show little difference. This indicates that the running time and memory usage of the STM are within an acceptable range, and this model does not require significantly more processing time or memory than the traditional method.

Table 2.
Comparison of average processing time and peak memory usage for the traditional method, DLS method, and STM.
4.2. Eliminating Inconsistent Incident Radiation Between Adjacent Strips
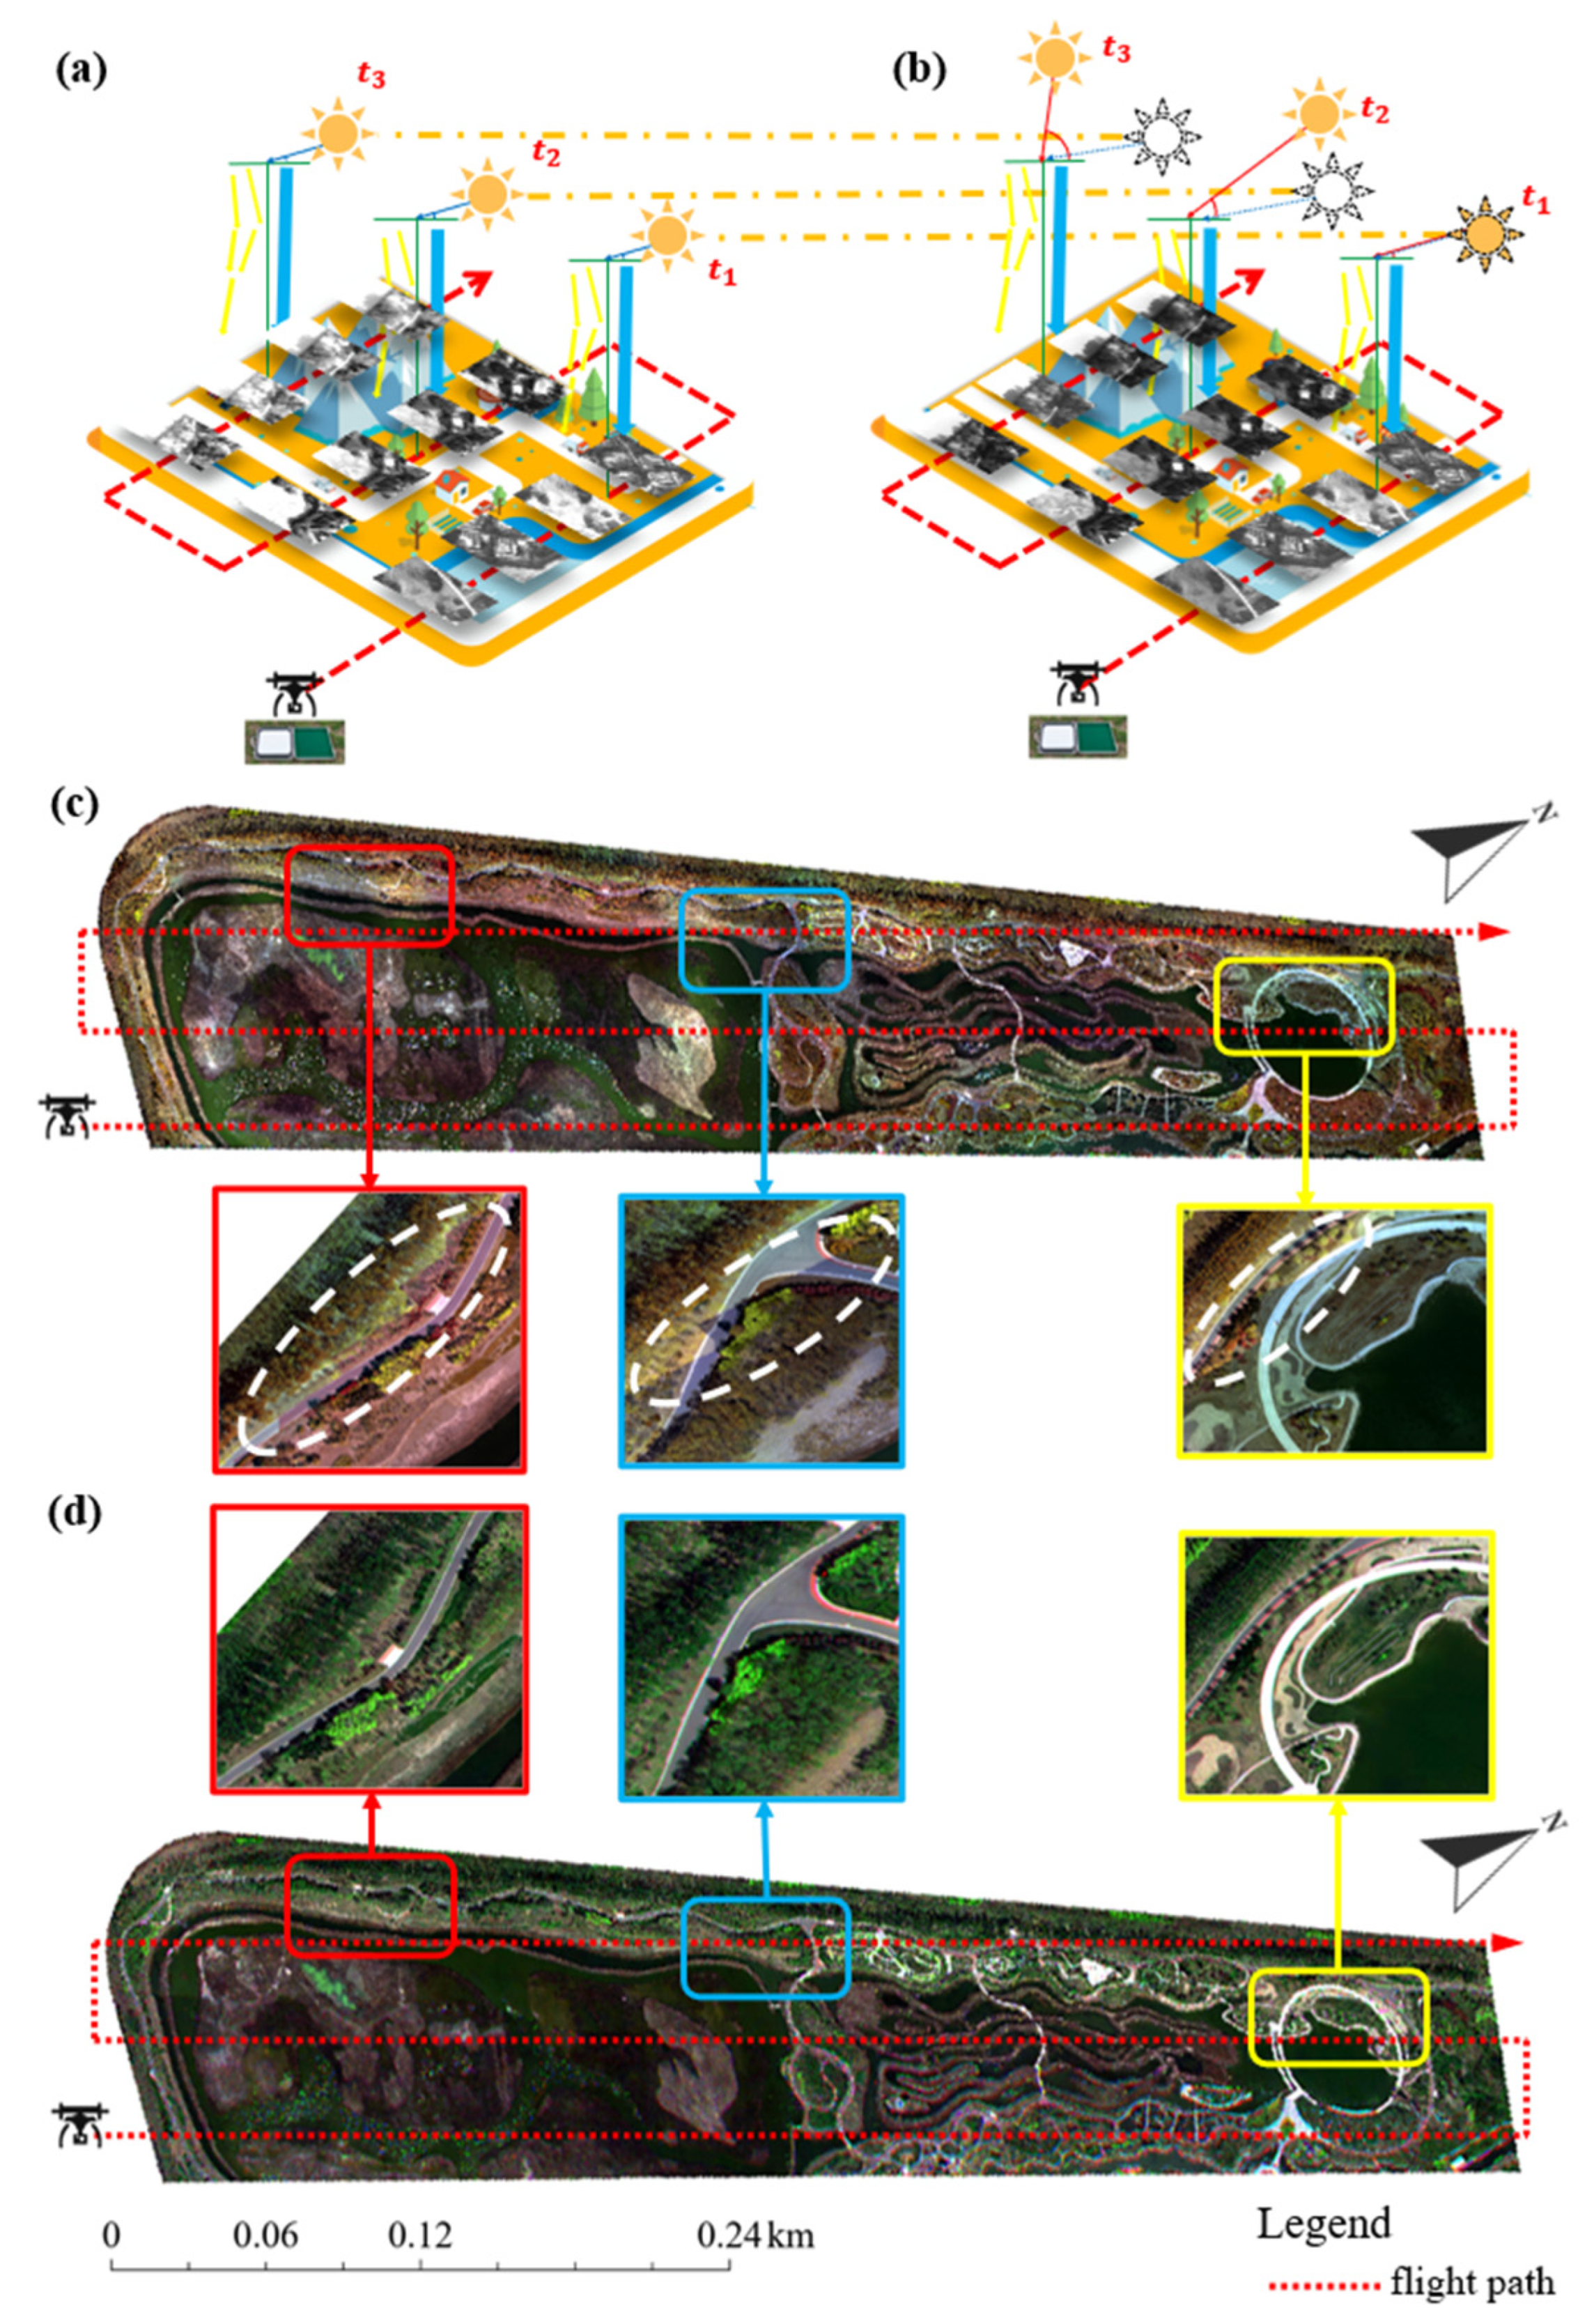
When stitching multispectral images from a long-endurance UAV, inconsistencies in incident radiance between different strips can occur. The STM effectively addresses this issue. Figure 8 shows the model schematic using the traditional method (Figure 8a) and the model schematic using the STM (Figure 8b), as well as the stitched image of the Tianjin area using the traditional method (Figure 8c) and the stitched image of the Shanghai area using the STM (Figure 8d).
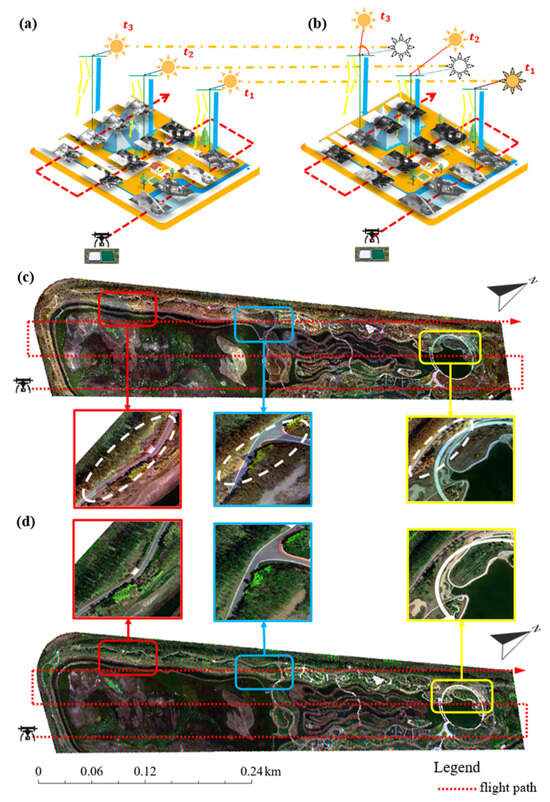
Figure 8.
Model schematic diagram and Tianjin result mosaic (with 1% linear elongation). (a) Traditional method (b) STM correction (c) Traditional Tianjin result mosaic (d) Mosaic of Tianjin after STM correction.
Figure 8a,b illustrate the model schematics for the traditional method and the method incorporating the STM, respectively. The operation is assumed to take place in the morning, with the shooting times of the three image strips set at , , and . The traditional method for calculating reflectance assumes that the incident radiative energy remains constant, implying that the solar position does not change at , , and , as shown by the solar position markers in Figure 8a. This assumption introduces errors, causing the reflectance of images captured closer to noon to appear higher and the reflectance of images taken earlier in the morning to appear lower, as depicted in Figure 8a. Specifically, the reflectance is lower at and higher at . The introduction of the STM addresses this issue by calculating the solar position based on the shooting time of each image, thereby correcting the incident radiative energy. This correction ensures that reflectance values align more closely with the actual conditions, reducing the discrepancies observed between the images captured at and , as illustrated by the model in Figure 8b. Consequently, images exhibit fewer fluctuations in reflectance, resulting in more consistent values. Figure 8c shows the reflectance map produced using the traditional method, which is characterized by numerous jagged edge lines. These jagged edges arise due to reflectance inconsistencies between multiple stitched image strips, as emphasized by the white dashed lines in Figure 8c. In contrast, a comparison between Figure 8c,d reveals that the STM effectively mitigates these reflectance discrepancies. The image in Figure 8d demonstrates significantly improved consistency and readability, aligning more closely with the actual reflectance conditions.
4.3. Reflectance of Typical Features
Reflectance data for six features were measured using an ASD spectrometer across six bands. Figure 9 shows the reflectance values in the blue band, calculated using the traditional method, the STM, DLS data, and ASD spectrometer measurements. The remaining bands are shown in Table 3.
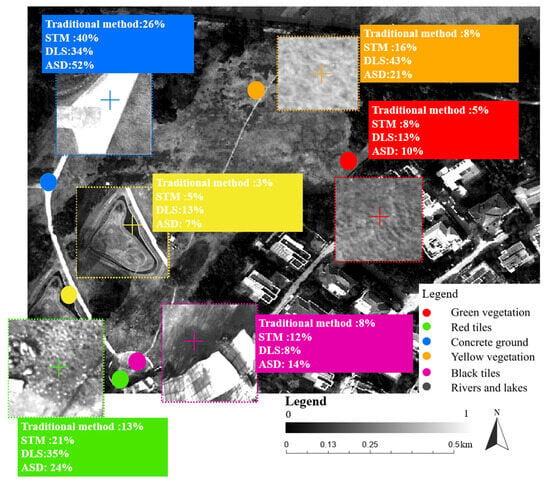
Figure 9.
Comparison of the reflectances of sampled surface features.

Table 3.
Reflectance of six features across all bands (%).
The features include green vegetation, red tiles, concrete ground, yellow vegetation, black tiles, and rivers/lakes. To simulate long-endurance UAV missions, CRP data from 11:53 AM were used to estimate incident radiation, and an image from 12:49 PM simulated conditions after a 1 h flight. DLSs were also installed to collect radiation values for comparison. The results indicate that the STM closely aligns with ASD measurements, with errors within 3%. The traditional method shows significant deviations, particularly for concrete ground (ASD: 52%, traditional method: 26%). Although DLS data improve accuracy, they occasionally overestimate reflectance, introducing discrepancies.
The reflectance values of six features across all spectral bands are presented in Table 3. In the table, a green background represents the ASD measurement data, while a red font indicates the results from the optimal method. Reflectance values computed using the STD method showed the closest numerical agreement with the ASD-measured results for green vegetation, red tiles, concrete ground, yellow vegetation, and rivers/lakes. In contrast, the DLS-calculated results performed best in only three bands for black tiles.
5. Discussion
Currently, the installation of DLSs is the most popular and effective method for addressing the challenge of accurately calculating reflectance images from long-endurance UAVs. Therefore, it is crucial to compare the solar radiation values computed using the STM with those recorded by the DLS and the ground solar radiation measurements. Additionally, the STM is compared with the histogram matching method, which is usually used to correct reflectance. Finally, the STM could extend the ideal flight time of current long-endurance UAVs, with particular attention paid to the optimal operating time and duration.
5.1. Comparison of Downwelling Radiation Obtained Using the STM and DLS
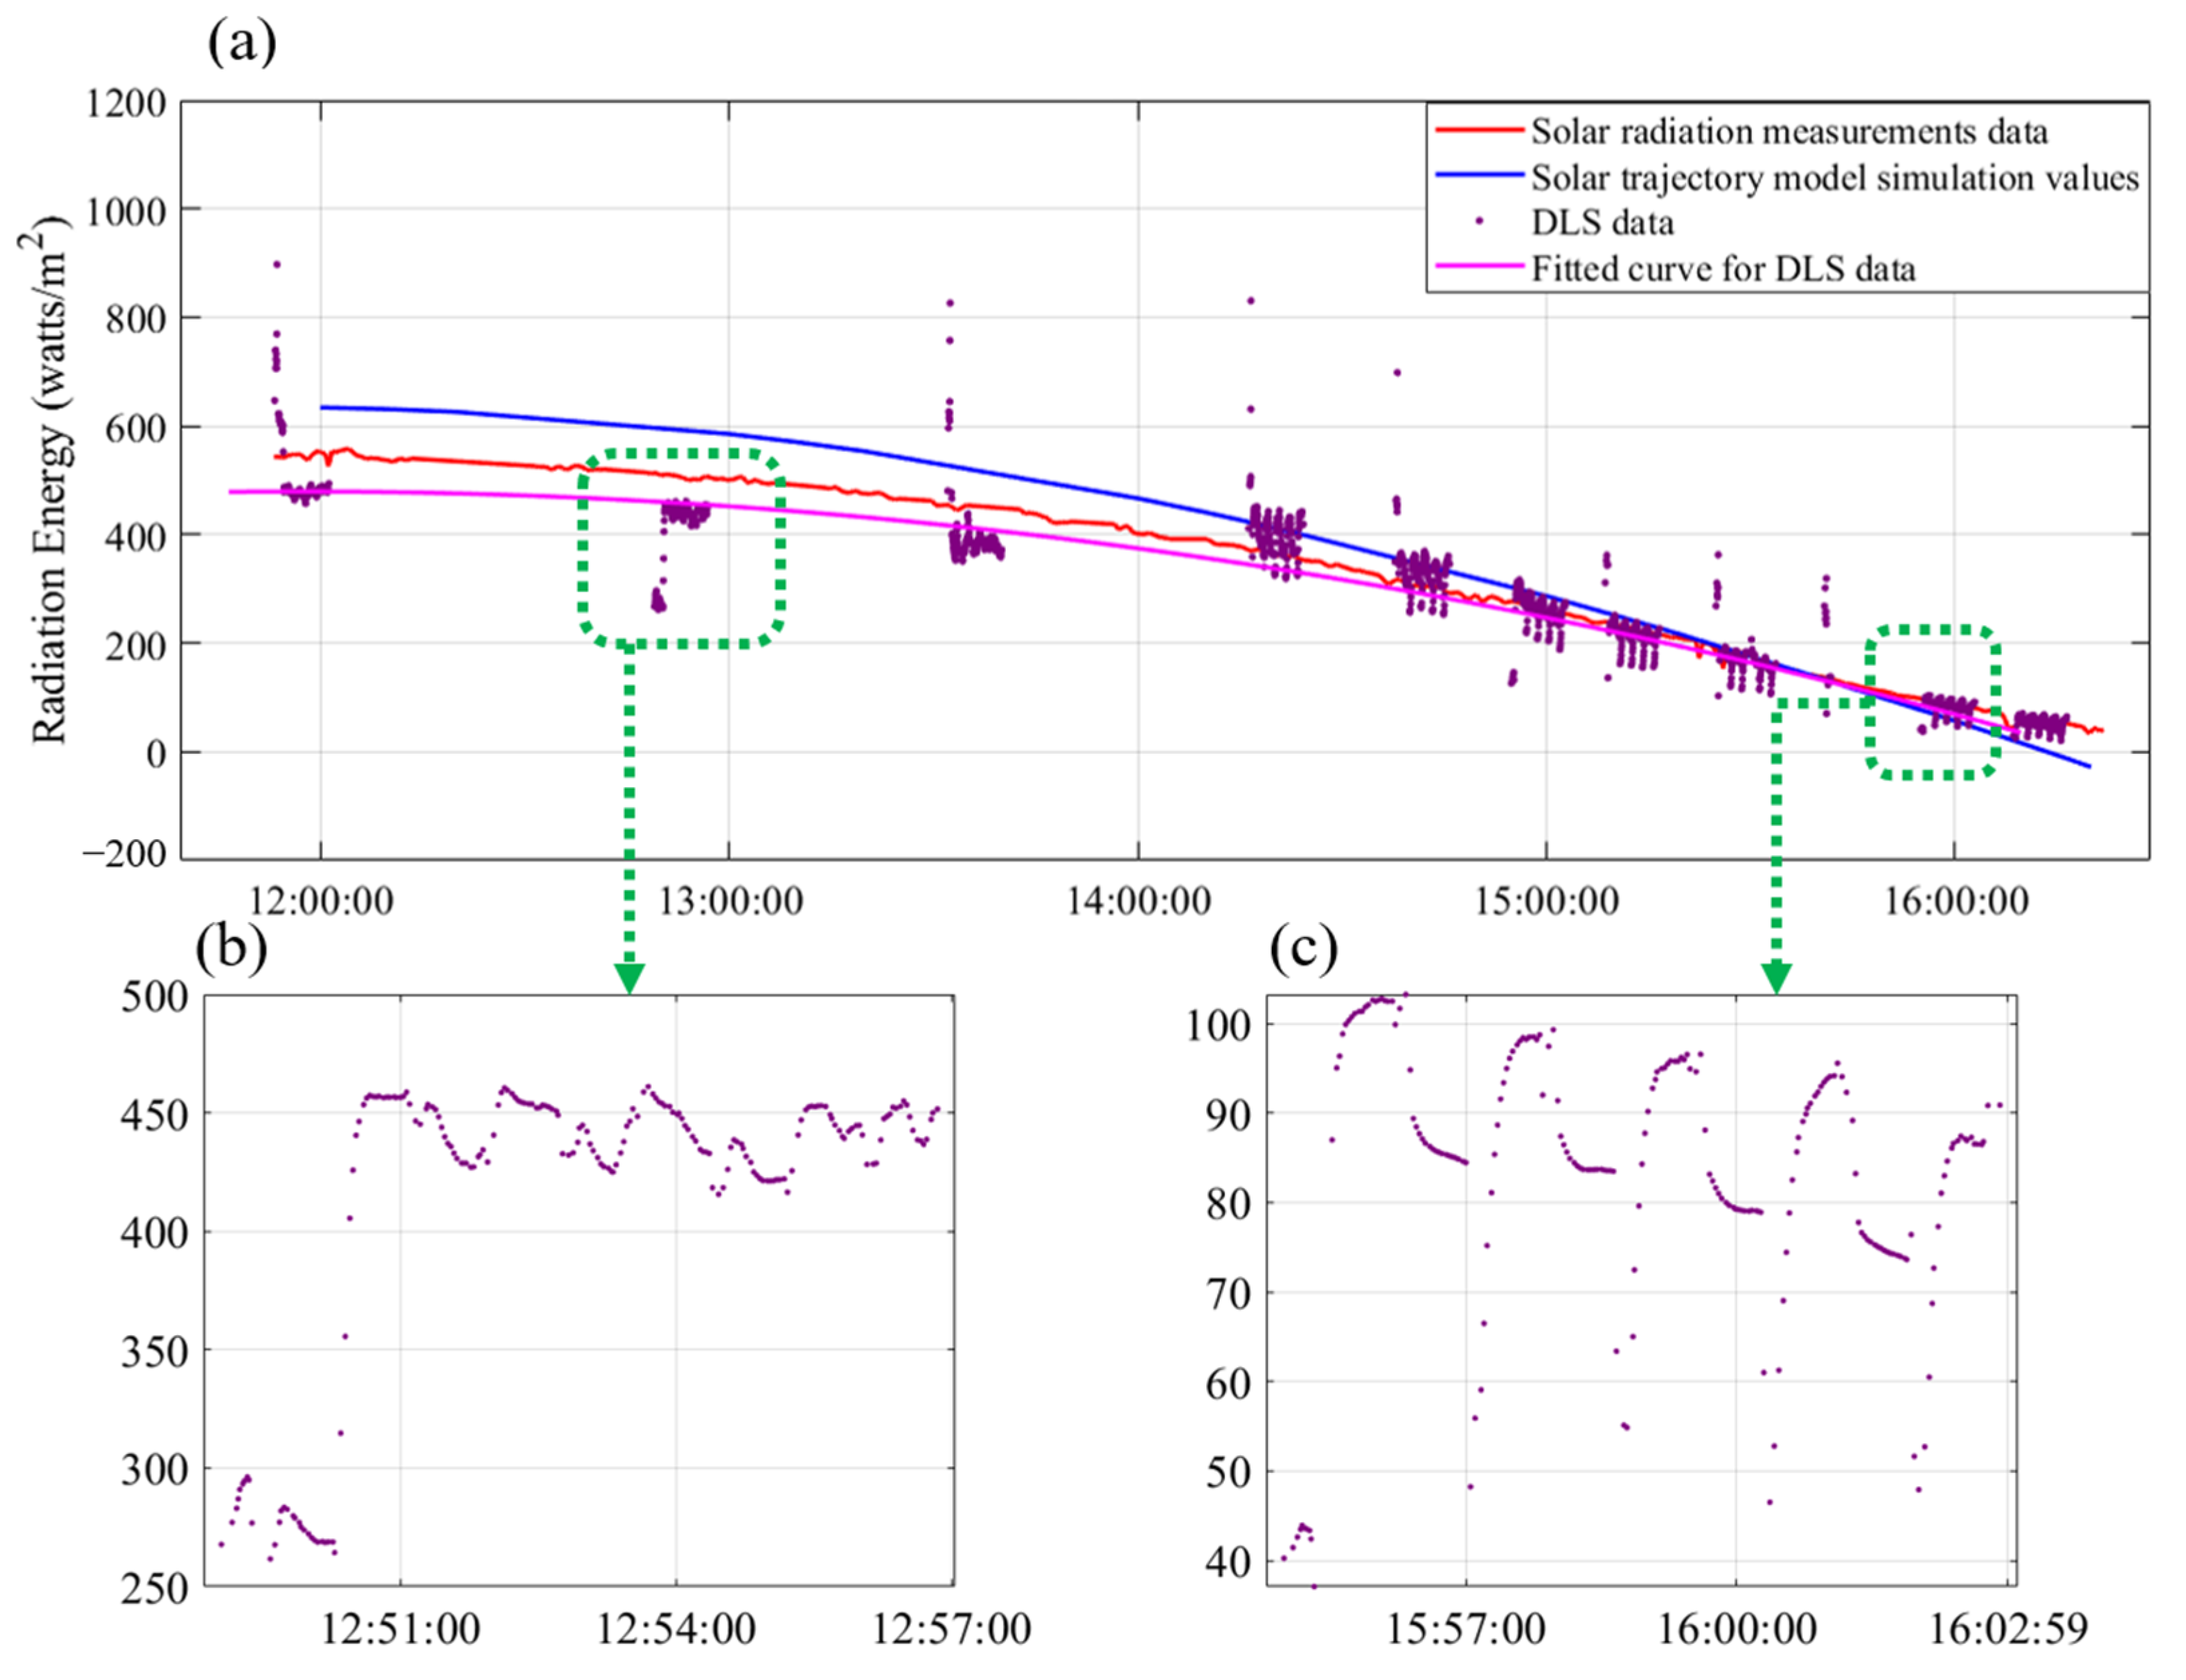
The UAV deployed in the Shanghai experimental area was equipped with a DLS, enabling the recording of downwelling solar radiation during each flight. Additionally, solar radiation measurements were conducted on the ground, starting from noon, to record baseline solar radiation values. This setup facilitated a comparative analysis of the solar radiation values simulated using the STM, those recorded by the DLS, and those measured on the ground. Figure 10a presents the results of solar radiation values obtained from these three methods. Since the DLS data can only be recorded during the UAV’s flight, purple dots are used to represent these data points, with densely clustered regions indicating a single flight session. For a clearer comparison, least squares fitting was employed to model the DLS-recorded points, represented by the purple line in Figure 10. It is evident from the figure that the curvature of the three datasets is similar, accurately capturing the decline in solar radiation values over time. However, it is worth noting that the solar radiation values recorded by the DLS exhibited significant fluctuations during a single flight session. This variability is illustrated in Figure 10a, where many purple dots deviate from the modeled purple line.
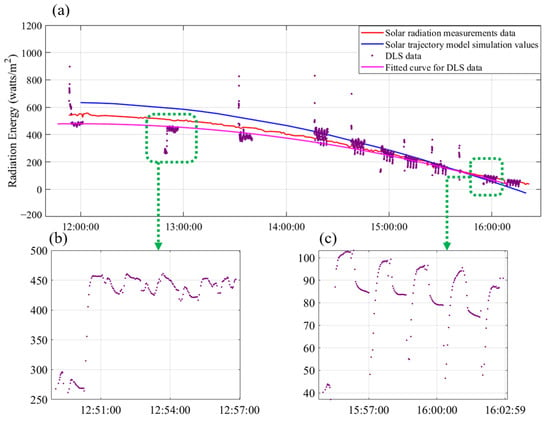
Figure 10.
Comparison of downwelling solar radiation. (a) Three types of solar downward radiation data. (b) Second flight DLS data (c) Ninth flight DLS data.
To better investigate this phenomenon, two flight sessions, one conducted near noon and the other at dusk, were selected for detailed analysis. Figure 10b,c display the data from the second flight session (12:49) and the ninth flight session (15:54), respectively. In the second flight session, the DLS-recorded points are more dispersed and exhibit considerable variation. In contrast, the solar radiation values recorded in the ninth flight session show less fluctuation and greater stability. By comparison, the solar radiation values calculated using the STM effectively mitigate this variability and align more closely with the solar radiation values obtained from ground measurements.
5.2. Comparison of STM and Histogram Matching Method
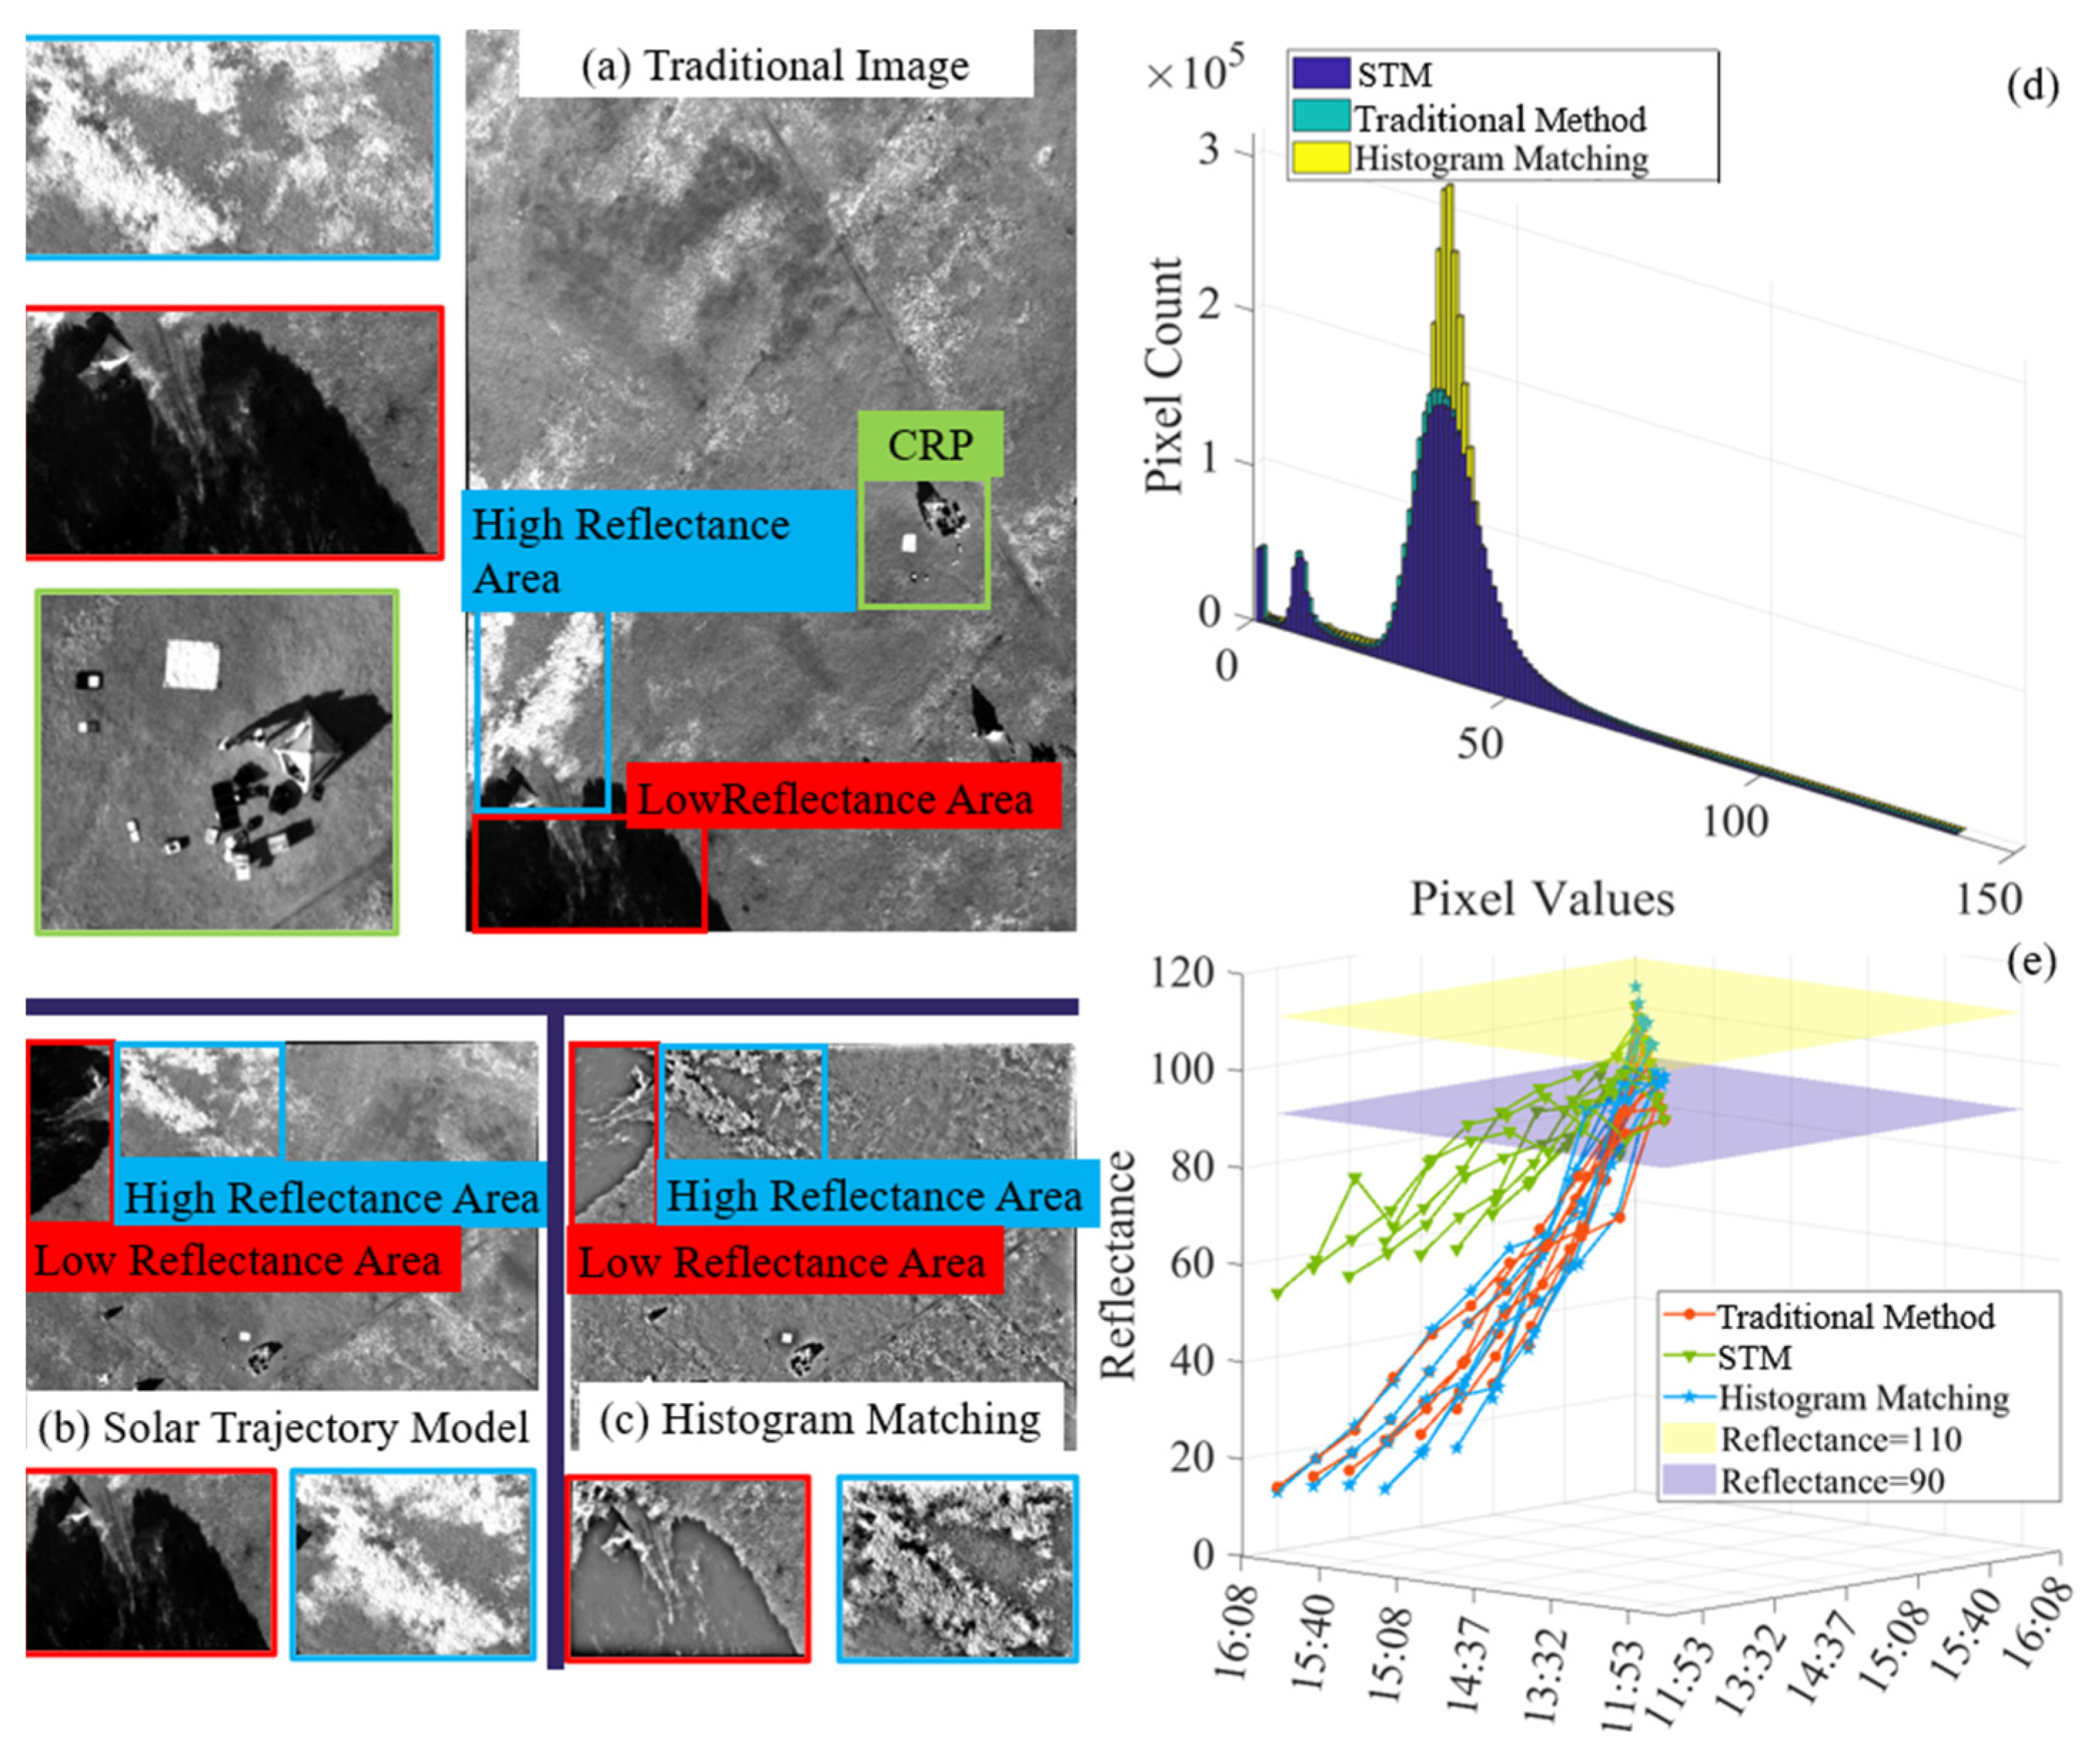
To assess the effectiveness of the histogram matching method and the STM for correcting UAV images, 11 CRP images from the Shanghai test area (captured between 11:53 AM and 4:08 PM) were analyzed. Both correction methods were applied using a target CRP reflectance of 100% with an acceptable range of 90–110%. The STM achieved the most accurate results, with 48% accuracy (32 points within range), closely aligning with the ideal reflectance. In contrast, the histogram matching method provided limited improvement, achieving 24% accuracy (16 points) but failing to correct reflectance consistently. This method often distorted image details due to the nature of histogram equalization. The traditional method, as expected, exhibited the lowest accuracy (21%, 14 points), with significant deviations—most notably for concrete surfaces (ASD reflectance: 52%; traditional method reflectance: 26%). A simulated long-endurance UAV mission provided additional insights, using CRP images captured at 11:53 AM as a preflight reference and those at 1:32 PM to represent postflight conditions after 1.5 h of operation. Both correction methods were applied to the same image (Figure 11a–c). A histogram analysis (Figure 11d) reveals that the STM preserved details in dark areas more effectively than the histogram matching method. The latter method overemphasized reflectance in the 20–60% range, thereby reducing overall image quality. The STM demonstrated superior performance by providing better accuracy and retaining greater image detail, whereas the histogram matching method required further refinement to improve its effectiveness. These findings highlight the critical importance of advanced correction methods, such as the STM, in improving the quality and reliability of UAV imaging for various applications.
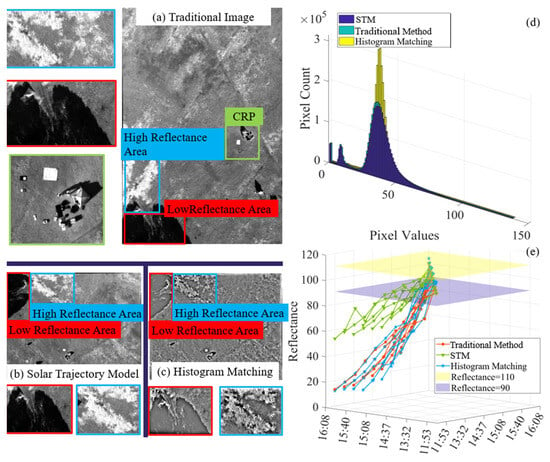
Figure 11.
(a) Traditional method image (b) Image after STM correction. (c) Image after histogram equalization. (d) Histogram of pixel distribution for three types of images. (e) Line chart of CRP reflectivity for three methods.
5.3. Optimal Flight Time and Duration
The term “optimal flight duration” refers to the maximum period during which the CRP reflectance remains within the ideal reflectance range, while “optimal flight time” denotes the time of takeoff. In typical fixed-wing long-endurance UAV missions, takeoff generally occurs around noon, with flight durations usually restricted to approximately one hour. The STM is designed to significantly extend both the optimal flight duration and the optimal flight time, thereby accommodating a broader range of application requirements.
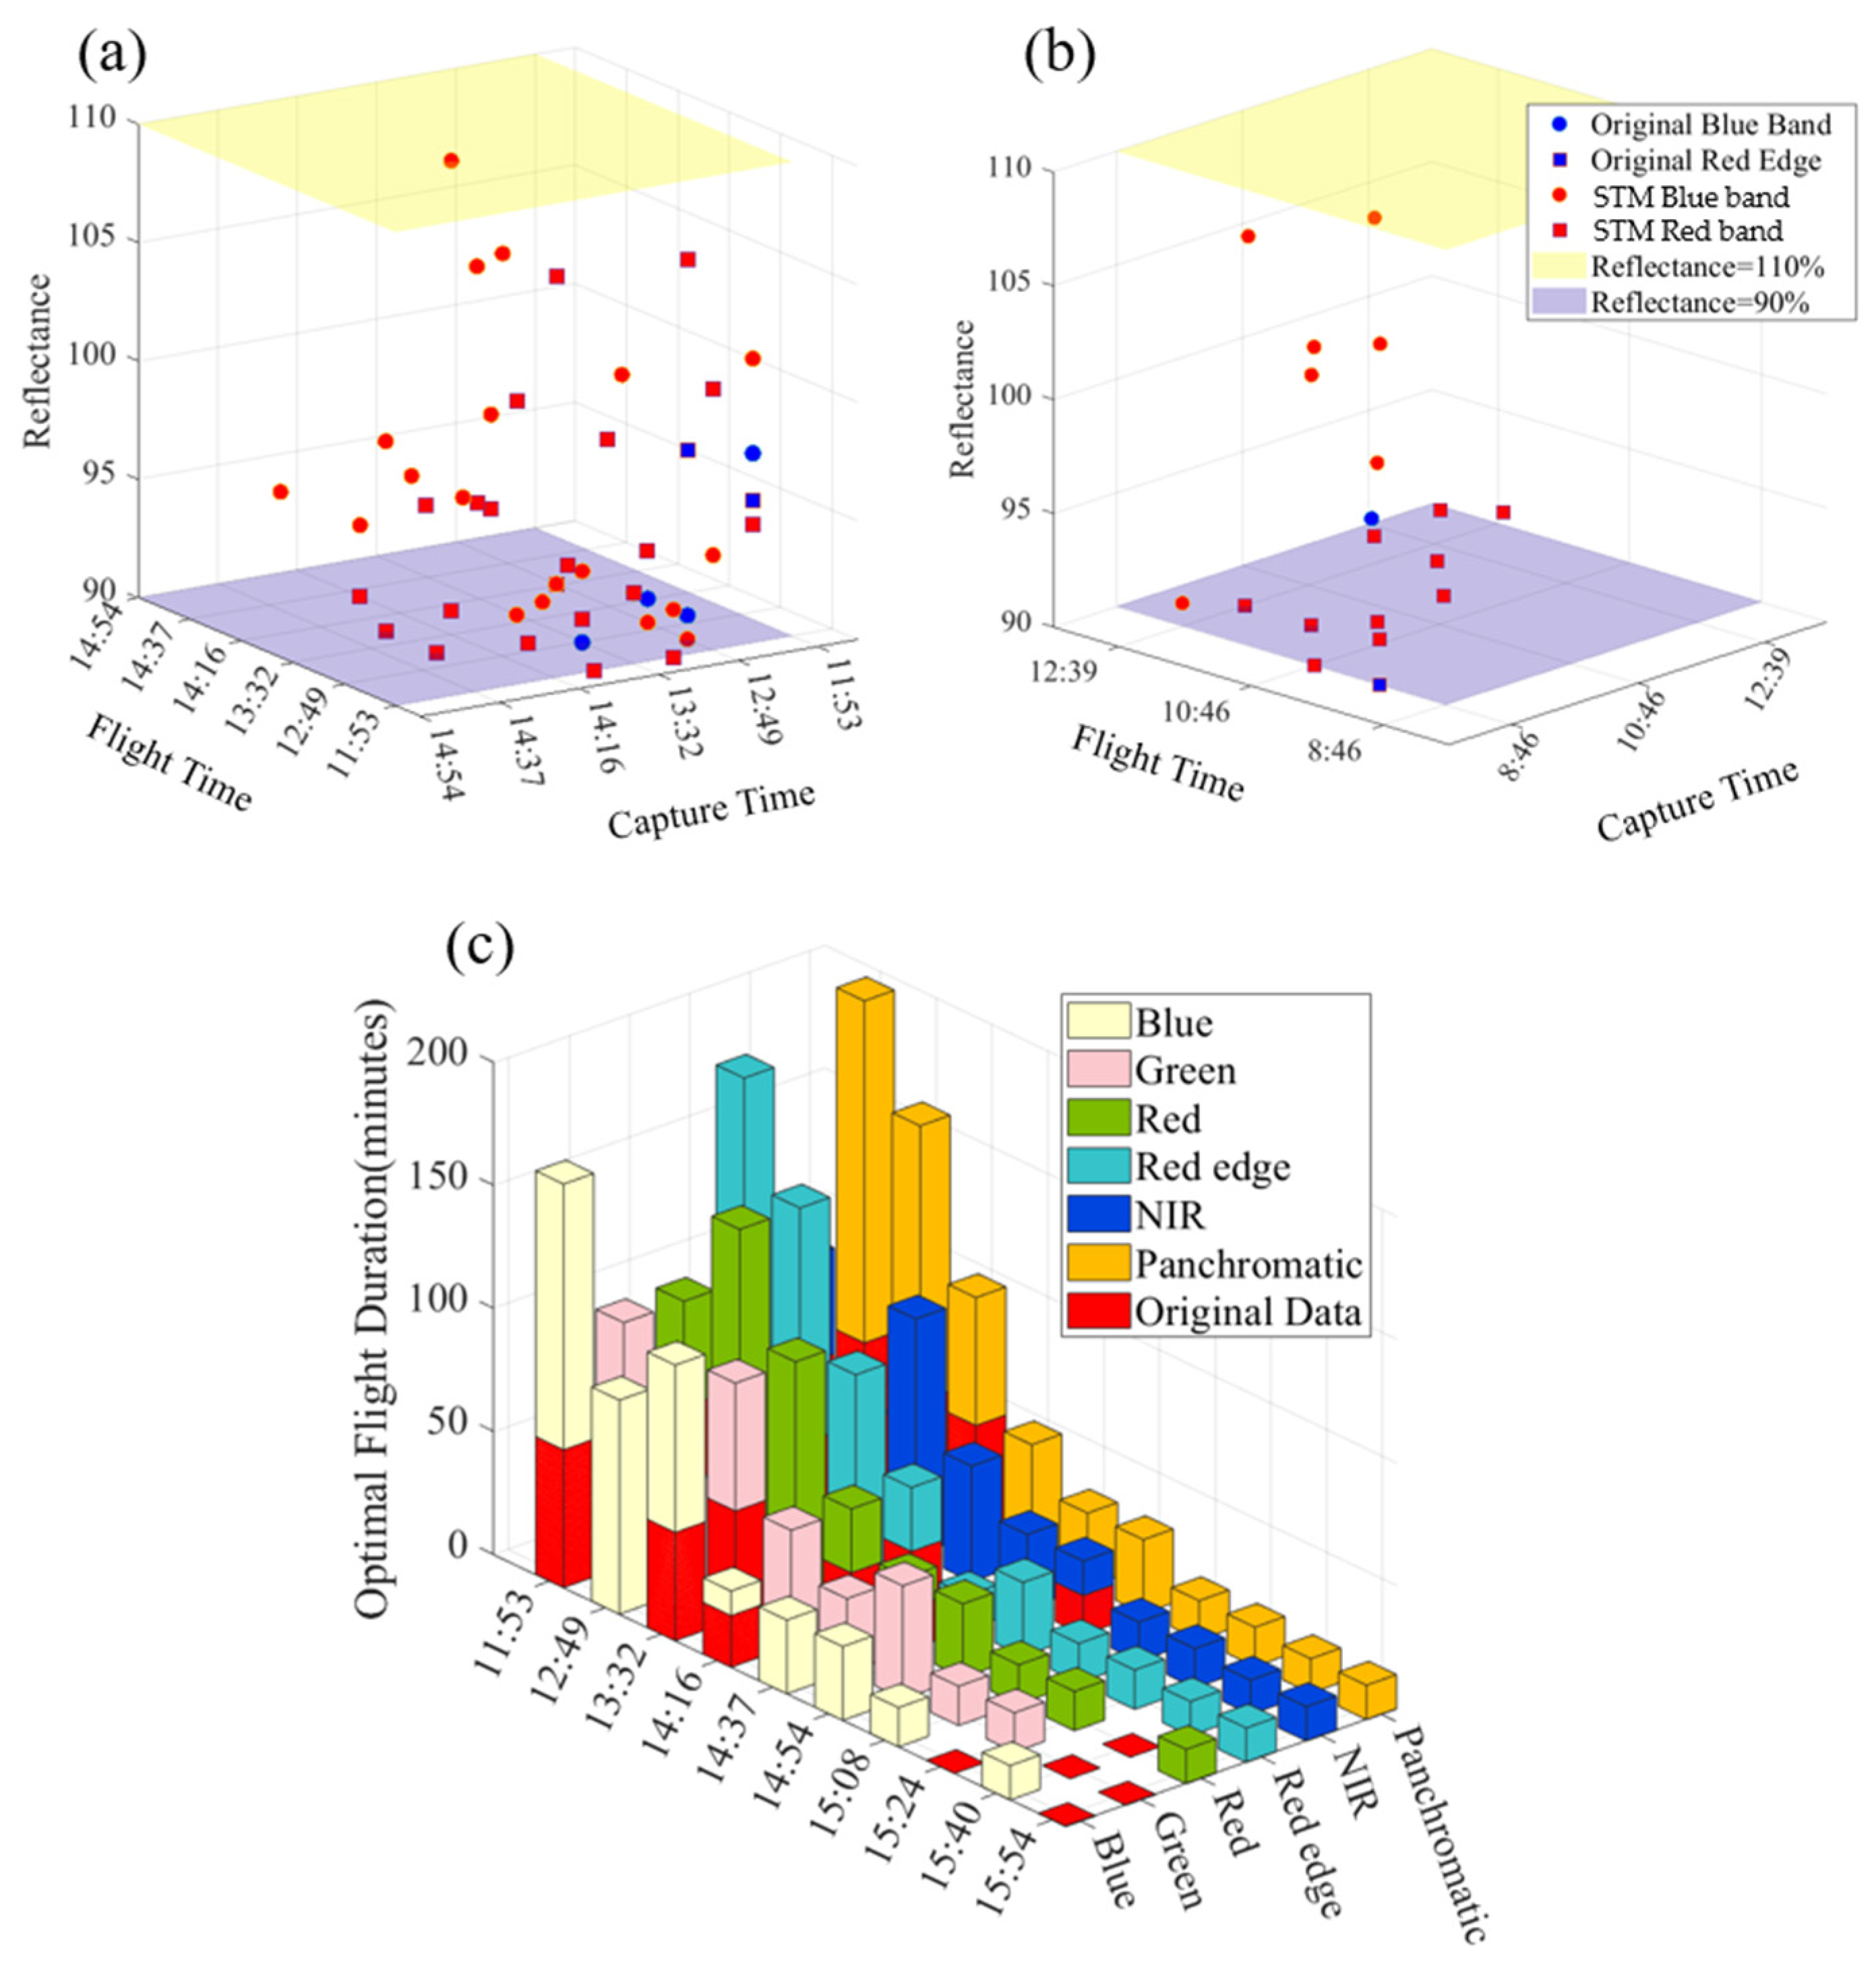
The scatter plots illustrate the relationship between CRP capture time (x-axis), image correction time (y-axis), and CRP reflectance (z-axis), with each point indicating an optimal flight time. Figure 12a,b compare optimal flight times in two test areas, where blue points represent traditional reflectance and red points indicate corrected reflectance. The data show a significantly higher number of corrected optimal flight times (red points) compared to traditional ones (blue points) in both areas. Minimal differences exist across bands, with the blue band and red edge showing nearly identical numbers of corrected optimal flight times.
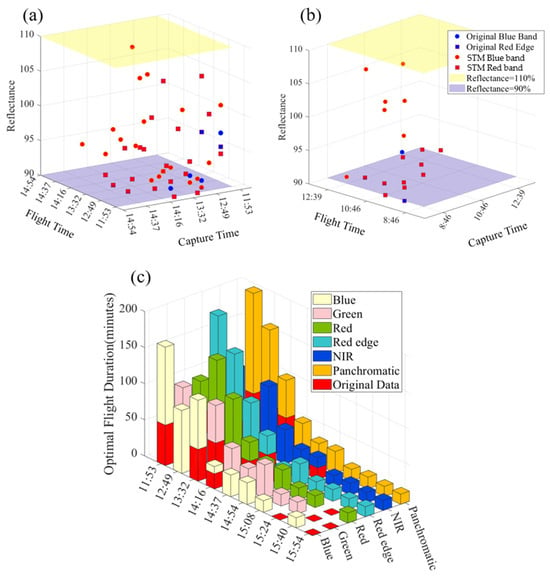
Figure 12.
Comparison of optimal flight time and duration. (a) Scatter plot of optimal duration in Shanghai. (b) Scatter plot of optimal duration in Tianjin. (c) Comparison of optimal flight duration in Shanghai.
Figure 12c presents the changes in optimal flight duration before and after correction, with red bars for the traditional method and various colors for the corrected data. Overall, corrected optimal flight durations exceed traditional method values, particularly around noon. Although slight variations exist among bands, they are not significant, with the blue band, red edge, and Panchromatic showing longer durations. Optimal flight durations peak at noon, extending over 100 min with corrections, before declining in the afternoon.
6. Conclusions
This study investigates a solar trajectory-based correction method, referred to as the STM, for improving the accuracy of multispectral images captured by long-endurance UAVs under clear sky conditions. The study presents the following key findings:
Validation of Effectiveness in Experiments: Experiments conducted in Shanghai and Tianjin validated the effectiveness of the STM. The method reduced the RMSE by 16% in Shanghai and 51% in Tianjin, while improving accuracy by approximately 51% compared to correction methods using DLS.
Correction of Radiation Inconsistencies: The STM effectively resolved inconsistencies in incident radiation energy across different image strips captured by long-endurance UAVs. This resulted in a significant enhancement in image clarity and successfully addressed jagged-edge issues caused by uneven exposure.
Surface Reflectance Accuracy: A comparative analysis of reflectance for six surface feature types captured by long-endurance UAVs demonstrated that STM-corrected reflectance values were more closely aligned with true measurements obtained from the ASD spectrometer. Accuracy improvements ranged from 40% to 70%, underscoring the model’s reliability.
Advancement in Histogram Distribution: The STM produced a histogram distribution that better preserved image quality compared to the traditional method. When compared with the histogram matching method, the STM achieved an accuracy improvement of approximately 24%.
Extended Optimal Flight Time: The STM successfully extended the optimal flight time of long-endurance UAVs. The operational window increased from the typical 20 min to approximately 80 min, with some spectral bands maintaining optimal performance for up to 100 min. This extension provides researchers with significantly more imaging time and flexibility in data collection.
In conclusion, the STM consistently delivered more accurate reflectance imagery in clear sky conditions, reduced errors, mitigated image inconsistencies, and enhanced overall image quality. Its application supports more efficient and reliable data acquisition for long-endurance UAV missions and contributes to advancements in remote sensing technologies.
Author Contributions
Conceptualization, methodology, data curation, validation, and writing by S.W.; writing—review by K.N. and X.L.; project administration and funding acquisition by W.F., S.Z. and F.W. All authors have read and agreed to the published version of the manuscript.
Funding
This study is supported by the Central Public-Interest Scientific Institution Basal Research Fund, ECSFR, CAFS (NO. 2022ZD0401 and NO. 2024TD04).
Data Availability Statement
The data that support the findings of this study are available from the corresponding author upon reasonable request.
Conflicts of Interest
Author Siyao Wu is a graduate student at the East China Sea Fisheries Research Institute, Chinese Academy of Fishery Sciences. The remaining authors declare that the research was conducted in the absence of any commercial or financial relationships that could be construed as a potential conflict of interest.
References
- Fu, H.; Sun, G.; Zhang, L.; Zhang, A.; Ren, J.; Jia, X.; Li, F. Three-Dimensional Singular Spectrum Analysis for Precise Land Cover Classification from UAV-Borne Hyperspectral Benchmark Datasets. ISPRS J. Photogramm. Remote Sens. 2023, 203, 115–134. [Google Scholar] [CrossRef]
- Gallo, I.G.; Martínez-Corbella, M.; Sarro, R.; Iovine, G.; López-Vinielles, J.; Hérnandez, M.; Robustelli, G.; Mateos, R.M.; García-Davalillo, J.C. An Integration of UAV-Based Photogrammetry and 3D Modelling for Rockfall Hazard Assessment: The Cárcavos Case in 2018 (Spain). Remote Sens. 2021, 13, 3450. [Google Scholar] [CrossRef]
- Yan, Q. Advantage and Application of Unmanned Aerial Vehicle Remote Sensing in Engineering Survey. Rem. Sens. 2020, 9, 22. [Google Scholar] [CrossRef]
- Wang, Y.; Hyyppa, J.; Liang, X.; Kaartinen, H.; Yu, X.; Lindberg, E.; Holmgren, J.; Qin, Y.; Mallet, C.; Ferraz, A.; et al. International Benchmarking of the Individual Tree Detection Methods for Modeling 3-D Canopy Structure for Silviculture and Forest Ecology Using Airborne Laser Scanning. IEEE Trans. Geosci. Remote Sens. 2016, 54, 5011–5027. [Google Scholar] [CrossRef]
- Tu, Y.-H.; Johansen, K.; Aragon, B.; Stutsel, B.M.; Angel, Y.; Camargo, O.A.L.; Al-Mashharawi, S.K.M.; Jiang, J.; Ziliani, M.G.; McCabe, M.F. Combining Nadir, Oblique, and Façade Imagery Enhances Reconstruction of Rock Formations Using Unmanned Aerial Vehicles. IEEE Trans. Geosci. Remote Sens. 2021, 59, 9987–9999. [Google Scholar] [CrossRef]
- Honkavaara, E.; Eskelinen, M.A.; Polonen, I.; Saari, H.; Ojanen, H.; Mannila, R.; Holmlund, C.; Hakala, T.; Litkey, P.; Rosnell, T.; et al. Remote Sensing of 3-D Geometry and Surface Moisture of a Peat Production Area Using Hyperspectral Frame Cameras in Visible to Short-Wave Infrared Spectral Ranges Onboard a Small Unmanned Airborne Vehicle (UAV). IEEE Trans. Geosci. Remote Sens. 2016, 54, 5440–5454. [Google Scholar] [CrossRef]
- Fakhri, A.; Latifi, H.; Samani, K.M.; Fassnacht, F.E. CaR3DMIC: A Novel Method for Evaluating UAV-Derived 3D Forest Models by Tree Features. ISPRS J. Photogramm. Remote Sens. 2024, 208, 279–295. [Google Scholar] [CrossRef]
- Skobalski, J.; Sagan, V.; Alifu, H.; Al Akkad, O.; Lopes, F.A.; Grignola, F. Bridging the Gap between Crop Breeding and GeoAI: Soybean Yield Prediction from Multispectral UAV Images with Transfer Learning. ISPRS J. Photogramm. Remote Sens. 2024, 210, 260–281. [Google Scholar] [CrossRef]
- Liu, K.; Shen, X.; Cao, L.; Wang, G.; Cao, F. Estimating Forest Structural Attributes Using UAV-LiDAR Data in Ginkgo Plantations. ISPRS J. Photogramm. Remote Sens. 2018, 146, 465–482. [Google Scholar] [CrossRef]
- Yue, J.; Lei, T.; Li, C.; Zhu, J. The Application of Unmanned Aerial Vehicle Remote Sensing in Quickly Monitoring Crop Pests. Intell. Autom. Soft Comput. 2012, 18, 1043–1052. [Google Scholar] [CrossRef]
- Hu, Y.; Yang, C.; Yang, J.; Li, Y.; Jing, W.; Shu, S. Review on Unmanned Aerial Vehicle Remote Sensing and Its Application in Coastal Ecological Environment Monitoring. IOP Conf. Ser. Earth Environ. Sci. 2021, 821, 012018. [Google Scholar] [CrossRef]
- Brine, D.T.; Iqbal, M. Diffuse and Global Solar Spectral Irradiance under Cloudless Skies. Solar Energy 1983, 30, 447–453. [Google Scholar] [CrossRef]
- Antonanzas-Torres, F.; Urraca, R.; Polo, J.; Perpiñán-Lamigueiro, O.; Escobar, R. Clear Sky Solar Irradiance Models: A Review of Seventy Models. Renew. Sustain. Energy Rev. 2019, 107, 374–387. [Google Scholar] [CrossRef]
- Gueymard, C.A.; Wilcox, S.M. Assessment of Spatial and Temporal Variability in the US Solar Resource from Radiometric Measurements and Predictions from Models Using Ground-Based or Satellite Data. Solar Energy 2011, 85, 1068–1084. [Google Scholar] [CrossRef]
- James, M.R.; Robson, S. Mitigating Systematic Error in Topographic Models Derived from UAV and Ground-based Image Networks. Earth Surf. Process. Landf. 2014, 39, 1413–1420. [Google Scholar] [CrossRef]
- Aasen, H.; Burkart, A.; Bolten, A.; Bareth, G. Generating 3D Hyperspectral Information with Lightweight UAV Snapshot Cameras for Vegetation Monitoring: From Camera Calibration to Quality Assurance. ISPRS J. Photogramm. Remote Sens. 2015, 108, 245–259. [Google Scholar] [CrossRef]
- Turner, D.; Lucieer, A.; Watson, C. An Automated Technique for Generating Georectified Mosaics from Ultra-High Resolution Unmanned Aerial Vehicle (UAV) Imagery, Based on Structure from Motion (SfM) Point Clouds. Remote Sens. 2012, 4, 1392–1410. [Google Scholar] [CrossRef]
- Nex, F.; Remondino, F. UAV for 3D Mapping Applications: A Review. Appl. Geomat. 2014, 6, 1–15. [Google Scholar] [CrossRef]
- Hakala, T.; Suomalainen, J.; Kaasalainen, S.; Chen, Y. Full Waveform Hyperspectral LiDAR for Terrestrial Laser Scanning. Opt. Express 2012, 20, 7119. [Google Scholar] [CrossRef]
- Burkart, A.; Cogliati, S.; Schickling, A.; Rascher, U. A Novel UAV-Based Ultra-Light Weight Spectrometer for Field Spectroscopy. IEEE Sens. J. 2014, 14, 62–67. [Google Scholar] [CrossRef]
- Honkavaara, E.; Saari, H.; Kaivosoja, J.; Pölönen, I.; Hakala, T.; Litkey, P.; Mäkynen, J.; Pesonen, L. Processing and Assessment of Spectrometric, Stereoscopic Imagery Collected Using a Lightweight UAV Spectral Camera for Precision Agriculture. Remote Sens. 2013, 5, 5006–5039. [Google Scholar] [CrossRef]
- Smith, M.W.; Carrivick, J.L.; Quincey, D.J. Structure from Motion Photogrammetry in Physical Geography. Prog. Phys. Geogr. Earth Environ. 2016, 40, 247–275. [Google Scholar] [CrossRef]
- Ma, L.; Li, M.; Ma, X.; Cheng, L.; Du, P.; Liu, Y. A Review of Supervised Object-Based Land-Cover Image Classification. ISPRS J. Photogramm. Remote Sens. 2017, 130, 277–293. [Google Scholar] [CrossRef]
- Zhang, C.; Kovacs, J.M. The Application of Small Unmanned Aerial Systems for Precision Agriculture: A Review. Precis. Agric. 2012, 13, 693–712. [Google Scholar] [CrossRef]
- Hakala, T.; Markelin, L.; Honkavaara, E.; Scott, B.; Theocharous, T.; Nevalainen, O.; Näsi, R.; Suomalainen, J.; Viljanen, N.; Greenwell, C.; et al. Direct Reflectance Measurements from Drones: Sensor Absolute Radiometric Calibration and System Tests for Forest Reflectance Characterization. Sensors 2018, 18, 1417. [Google Scholar] [CrossRef]
- Hu, X.; Zhong, Y.; Wang, X.; Luo, C.; Zhao, J.; Lei, L.; Zhang, L. SPNet: Spectral Patching End-to-End Classification Network for UAV-Borne Hyperspectral Imagery With High Spatial and Spectral Resolutions. IEEE Trans. Geosci. Remote Sens. 2022, 60, 1–17. [Google Scholar] [CrossRef]
- Peng, J.; Nieto, H.; Neumann Andersen, M.; Kørup, K.; Larsen, R.; Morel, J.; Parsons, D.; Zhou, Z.; Manevski, K. Accurate Estimates of Land Surface Energy Fluxes and Irrigation Requirements from UAV-Based Thermal and Multispectral Sensors. ISPRS J. Photogramm. Remote Sens. 2023, 198, 238–254. [Google Scholar] [CrossRef]
- Von Bueren, S.K.; Burkart, A.; Hueni, A.; Rascher, U.; Tuohy, M.P.; Yule, I.J. Deploying Four Optical UAV-Based Sensors over Grassland: Challenges and Limitations. Biogeosciences 2015, 12, 163–175. [Google Scholar] [CrossRef]
- Turkulainen, E.; Honkavaara, E.; Näsi, R.; Oliveira, R.A.; Hakala, T.; Junttila, S.; Karila, K.; Koivumäki, N.; Pelto-Arvo, M.; Tuviala, J.; et al. Comparison of Deep Neural Networks in the Classification of Bark Beetle-Induced Spruce Damage Using UAS Images. Remote Sens. 2023, 15, 4928. [Google Scholar] [CrossRef]
- Li, X.; Shang, S.; Lee, Z.; Lin, G.; Zhang, Y.; Wu, J.; Kang, Z.; Liu, X.; Yin, C.; Gao, Y. Detection and Biomass Estimation of Phaeocystis Globosa Blooms off Southern China From UAV-Based Hyperspectral Measurements. IEEE Trans. Geosci. Remote Sens. 2022, 60, 1–13. [Google Scholar] [CrossRef]
- Xie, W.; Liu, T.; Gu, Y. Intrinsic Hyperspectral Image Recovery for UAV Strips Stitching. IEEE Trans. Geosci. Remote Sens. 2024, 62, 1–13. [Google Scholar] [CrossRef]
- Hu, P.; Wang, A.; Yang, Y.; Pan, X.; Hu, X.; Chen, Y.; Kong, X.; Bao, Y.; Meng, X.; Dai, Y. Spatiotemporal Downscaling Method of Land Surface Temperature Based on Daily Change Model of Temperature. IEEE J. Sel. Top. Appl. Earth Obs. Remote Sens. 2022, 15, 8360–8377. [Google Scholar] [CrossRef]
- Güngör Şahin, O.; Gündüz, O. A Novel Land Surface Temperature Reconstruction Method and Its Application for Downscaling Surface Soil Moisture with Machine Learning. J. Hydrol. 2024, 634, 131051. [Google Scholar] [CrossRef]
- Mukherjee, F.; Singh, D. Assessing Land Use–Land Cover Change and Its Impact on Land Surface Temperature Using LANDSAT Data: A Comparison of Two Urban Areas in India. Earth Syst Env. 2020, 4, 385–407. [Google Scholar] [CrossRef]
- Köppl, C.J.; Malureanu, R.; Dam-Hansen, C.; Wang, S.; Jin, H.; Barchiesi, S.; Serrano Sandí, J.M.; Muñoz-Carpena, R.; Johnson, M.; Durán-Quesada, A.M.; et al. Hyperspectral Reflectance Measurements from UAS under Intermittent Clouds: Correcting Irradiance Measurements for Sensor Tilt. Remote Sens. Environ. 2021, 267, 112719. [Google Scholar] [CrossRef]
- Zhao, M.; Li, W.; Li, L.; Wang, A.; Hu, J.; Tao, R. Infrared Small UAV Target Detection via Isolation Forest. IEEE Trans. Geosci. Remote Sens. 2023, 61, 1–16. [Google Scholar] [CrossRef]
- Fang, H.; Ding, L.; Wang, X.; Chang, Y.; Yan, L.; Liu, L.; Fang, J. SCINet: Spatial and Contrast Interactive Super-Resolution Assisted Infrared UAV Target Detection. IEEE Trans. Geosci. Remote Sens. 2024, 62, 1–22. [Google Scholar] [CrossRef]
- Suomalainen, J.; Hakala, T.; Alves De Oliveira, R.; Markelin, L.; Viljanen, N.; Näsi, R.; Honkavaara, E. A Novel Tilt Correction Technique for Irradiance Sensors and Spectrometers On-Board Unmanned Aerial Vehicles. Remote Sens. 2018, 10, 2068. [Google Scholar] [CrossRef]
- Yang, S.; Kang, R.; Xu, T.; Guo, J.; Deng, C.; Zhang, L.; Si, L.; Kaufmann, H.J. Improving Satellite-Based Retrieval of Maize Leaf Chlorophyll Content by Joint Observation with UAV Hyperspectral Data. Drones 2024, 8, 783. [Google Scholar] [CrossRef]
- Gao, P.; Wu, T.; Song, C. Cloud–Edge Collaborative Strategy for Insulator Recognition and Defect Detection Model Using Drone-Captured Images. Drones 2024, 8, 779. [Google Scholar] [CrossRef]
- Daniels, L.; Eeckhout, E.; Wieme, J.; Dejaegher, Y.; Audenaert, K.; Maes, W.H. Identifying the Optimal Radiometric Calibration Method for UAV-Based Multispectral Imaging. Remote Sens. 2023, 15, 2909. [Google Scholar] [CrossRef]
- Johansen, K.; Duan, Q.; Tu, Y.-H.; Searle, C.; Wu, D.; Phinn, S.; Robson, A.; McCabe, M.F. Mapping the Condition of Macadamia Tree Crops Using Multi-Spectral UAV and WorldView-3 Imagery. ISPRS J. Photogramm. Remote Sens. 2020, 165, 28–40. [Google Scholar] [CrossRef]
- Gruszczyński, W.; Puniach, E.; Ćwiąkała, P.; Matwij, W. Application of Convolutional Neural Networks for Low Vegetation Filtering from Data Acquired by UAVs. ISPRS J. Photogramm. Remote Sens. 2019, 158, 1–10. [Google Scholar] [CrossRef]
- Grando, L.; Jaramillo, J.F.G.; Leite, J.R.E.; Ursini, E.L. Systematic Literature Review Methodology for Drone Recharging Processes in Agriculture and Disaster Management. Drones 2025, 9, 40. [Google Scholar] [CrossRef]
- Marcello, J.; Spínola, M.; Albors, L.; Marqués, F.; Rodríguez-Esparragón, D.; Eugenio, F. Performance of Individual Tree Segmentation Algorithms in Forest Ecosystems Using UAV LiDAR Data. Drones 2024, 8, 772. [Google Scholar] [CrossRef]
- Savinelli, B.; Tagliabue, G.; Vignali, L.; Garzonio, R.; Gentili, R.; Panigada, C.; Rossini, M. Integrating Drone-Based LiDAR and Multispectral Data for Tree Monitoring. Drones 2024, 8, 744. [Google Scholar] [CrossRef]
- Fu, H.; Zhou, T.; Sun, C. Object-Based Shadow Index via Illumination Intensity from High Resolution Satellite Images over Urban Areas. Sensors 2020, 20, 1077. [Google Scholar] [CrossRef]
- Vermote, E.F.; Tanre, D.; Deuze, J.L.; Herman, M.; Morcette, J.-J. Second Simulation of the Satellite Signal in the Solar Spectrum, 6S: An Overview. IEEE Trans. Geosci. Remote Sens. 1997, 35, 675–686. [Google Scholar] [CrossRef]
- Berk, A.; Bernstein, L.S.; Anderson, G.P.; Acharya, P.K.; Robertson, D.C.; Chetwynd, J.H.; Adler-Golden, S.M. MODTRAN Cloud and Multiple Scattering Upgrades with Application to AVIRIS. Remote Sens. Environ. 1998, 65, 367–375. [Google Scholar] [CrossRef]
- Mayer, B.; Kylling, A. Technical Note: The libRadtran Software Package for Radiative Transfer Calculations—Description and Examples of Use. Atmos. Chem. Phys. 2005, 26, 1855–1877. [Google Scholar]
- Van Genderen, J.L. Advances in Environmental Remote Sensing: Sensors, Algorithms, and Applications. Int. J. Digit. Earth 2011, 4, 446–447. [Google Scholar] [CrossRef]
Disclaimer/Publisher’s Note: The statements, opinions and data contained in all publications are solely those of the individual author(s) and contributor(s) and not of MDPI and/or the editor(s). MDPI and/or the editor(s) disclaim responsibility for any injury to people or property resulting from any ideas, methods, instructions or products referred to in the content. |
© 2025 by the authors. Licensee MDPI, Basel, Switzerland. This article is an open access article distributed under the terms and conditions of the Creative Commons Attribution (CC BY) license (https://creativecommons.org/licenses/by/4.0/).

