Article

Increasing Automation on Mission Planning for Heterogeneous Multi-Rotor Drone Fleets in Emergency Response

by
Ilham Zerrouk
1,*,†,
Esther Salamí
2,†,
Cristina Barrado
2,*,†,
Gautier Hattenberger
1,† and
Enric Pastor
2,†
1
ENAC ISAE-SUPAERO ONERA Federation, University of Toulouse, 31055 Toulouse, France
2
Computer Architecture Department, Universitat Politècnica de Catalunya (UPC), 08860 Castelldefels, Spain
*
Authors to whom correspondence should be addressed.
These authors contributed equally to this work.
Drones 2025, 9(12), 816; https://doi.org/10.3390/drones9120816
Submission received: 14 October 2025 / Revised: 13 November 2025 / Accepted: 17 November 2025 / Published: 24 November 2025

Highlights

What are the main findings?
  • In less than two minutes we generate efficient trajectories for drones in a heterogeneous fleet to obtain reliable maps with uniform precision.
  • A balanced strategy showed benefits in extensive comparisons of decomposition algorithms for non-convex areas with no-fly zones. Consistent gain in trajectories is also observed relative to the state of the art.
What are the implications of the main findings?
  • First responders will quickly understand the situation after a disaster and prioritize action thanks to the complete coverage and a precise mapping of large or complex areas.

Abstract

Drones are increasingly vital for disaster management, yet emergency fleets often consist of heterogeneous platforms, complicating task allocation. Efficient deployment requires rapid assignment based on vehicle and payload characteristics. This work proposes a three-step method composed of fleet analysis, area decomposition and trajectory generation for multi-rotor drone surveillance, aiming to achieve complete area coverage in minimal time while respecting no-fly zones. The three-step method generates optimized trajectories for all drones in less than 2 min, ensuring uniform precision and reduced flight distance compared to state-of-the-art methods, achieving mean distance gains of up to 9.31% with a homogeneous fleet of 10 drones. Additionally, a comparative analysis of area partitioning algorithms reveals that simplifying the geometry of the surveillance region can lead to more effective divisions and less complex trajectories. This simplification results in approximately 8.4% fewer turns, even if it slightly increases the total area to be covered.

Graphical Abstract

1. Introduction

Based on reports from the Office for Disaster Risk Reduction (DRR) of the United Nations (UN) [1], over the last twenty years, 7348 natural disaster events were recorded throughout the world. In total, disasters affected a total of over 4 billion people, with casualties summing up approximately 1.23 million lives, which is an average of 60,000 per year. Furthermore, disasters cost approximately USD 2.97 trillion in economic losses worldwide. These concern only natural-hazard-related disasters, excluding biological, technological, and other human-related disasters. The current climate change situation predicts that the number of disasters will increase in the following years. The UN Sustainable Development Goals aim to reverse climate change, but in the process the Earth needs to develop resilience strategies to reduce the risk of these catastrophic events.
According to the Sendai Framework for Disaster Risk Reduction (DRR) 2015–2030 [2], the creation of knowledge and tools is needed to achieve the UN sustainability and resilience objectives. Sendai addresses the Disaster Risk Reduction strategy in three dimensions: to prevent the creation of new risk, to reduce existing risk, and to increase resilience. In all three dimensions, the adoption of new technologies is essential to foster the success of the Sendai strategy.
Technologies that are well known in disaster risk management are computerized control centers from where commanders and politicians manage the emergencies. The quality of the decisions are directly related to the situational awareness, the existence and knowledge of actuation plan, and the assets available to deploy in the terrain. Satellites and Internet of Things (IoT) sensors help in the creation of situational awareness. However, satellites can be absent at the area of interest in the moment of the disaster, or visibility at the moment of maximum approach of the orbit can be reduced due to clouds, smoke, or lack of daylight. Ground sensors can be destroyed, or the communication network can have failures in the event of disasters. The use of drones is ideal to replace missing assets, providing data with high accuracy and at the desired time and place [3].
For instance, during the eruption of the Cumbre Vieja volcano in La Palma in 2021, drones played a crucial role in emergency response efforts [4]. They were deployed to monitor the progression of lava flows and assess the extent of damage in real time. High-resolution aerial imagery helped authorities create accurate maps, allowing for better decision-making regarding evacuations and resource allocation. In addition, drones were used to measure air quality by detecting toxic gases, ensuring the safety of emergency teams working in hazardous areas.
Similarly, after Hurricane Ian caused widespread devastation across Florida in 2022, drones became essential tools for damage assessment and recovery [5]. Emergency teams used drones to survey flooded areas and assess infrastructure damage, identifying the most critical locations in need of assistance. Search and rescue operations benefited from drones equipped with thermal imaging cameras, which helped locate stranded survivors, particularly in areas that were difficult to access by boat or helicopter. Utility companies also leveraged drones to inspect damaged power lines and expedite electrical restoration, significantly reducing the time required for repairs.
More recently, following the devastating earthquake that struck Türkiye and Syria in 2023, drones played a key role in search and rescue missions [6]. Equipped with thermal cameras, they scanned collapsed buildings to detect signs of life, allowing rescue teams to focus their efforts on areas with the highest probability of finding survivors. Drones were also used for logistical support, transporting emergency medical supplies to areas that were inaccessible due to debris and infrastructure damage. In addition, in regions where communication networks had collapsed, drones provided temporary relay connections, allowing emergency teams to coordinate more effectively.
Recent analyses, such as the 2022 IEDO International Best Practices Report [7], highlight that interoperability, standardized mission procedures, and decision-support tools are essential to coordinate multi-drone and multi-agency operations efficiently. Similarly, Janik et al. [8] emphasize the need to adapt the Specific Operations Risk Assessment (SORA) methodology for emergency services, as rescue operations often involve unpredictable timing, locations, and weather. The authors recommend developing an automated, rescue-specific tool that enables fast decision-making. In a complementary scoping review, Vincent-Lambert et al. [9] examine the use of drones in wilderness search and rescue operations. They discuss both the operational benefits, such as situational awareness, communication, and response time, as well as the practical limitations, such as flight endurance and weather constraints. These recommendations provide a clear motivation for the development of integrated platforms such as PANTHEON [10].
The PANTHEON project is developing a digital twin to test emergency plans and train first responders about the correct use of collaborative decision-making tools. Drones are recognized as an emerging asset for the situational awareness of an area during an emergency situation. As part of the PANTHEON toolset, planning the fleet of drones, in connection with the Command and Control Center (C2C), is a relevant contribution.
In Pantheon disaster scenarios, UAV missions typically involve three main phases: reaching the area of interest while avoiding restricted zones, performing information recovery, and returning to the base. Information recovery is modeled as an area scanning task. The objective is to cover a user-defined area completely and efficiently, avoiding unnecessary overlaps and obstacles. The task is solved using Coverage Path Planning (CPP) techniques.
An examination of existing research reveals some limitations in current CPP strategies. In [11], the authors restrict their study to convex polygons without holes, limiting applicability to more complex terrains. The work [12] focuses on a single fixed-wing UAV and proposes turning strategies for non-holonomic vehicles but does not consider drone endurance, a critical factor in real missions. In [13] the area is divided into equal sub-areas without accounting for the actual coverage capacity of each UAV, potentially leading to inefficiencies for a large area. Reference [14] incorporates 2D/3D space discretization and climbing and descending UAV constraints but overlooks energy consumption and does not guarantee the balancing of the mission allocation. The method in [15] assumes identical UAVs and ignores obstacles, although it attempts to balance energy usage. Ref. [16] supports heterogeneous UAVs but does not address non-convex areas or obstacles. The Energy-Aware Multi-UAV Coverage (EAMC) approach proposed in [17] supports various area-division strategies, estimates trajectory energy during Coverage Path Planning (CPP), and ensures that the maximum energy per path remains within a user-defined threshold. Although it aims to minimize energy consumption per traveled distance, it assumes homogeneous UAV capabilities neglecting the complexities of heterogeneous fleets. These limitations underscore the need for a more holistic framework that incorporates heterogeneous UAV capabilities, considers realistic terrain constraints and drone endurance, and employs adaptive area partitioning methods. Addressing these aspects constitutes the core objective of our work.
This paper evaluates several methods for the allocation of area surveillance task to fleets of heterogeneous drones of different rescue teams, taking into account the characteristics of the vehicle and its payload. It proposes a new method for planning drone trajectories in a non-convex region while avoiding restricted areas and considering the drones’ endurance constraints. The final objective is to obtain the complete situational awareness of the disaster area in the minimum time, using all available resources.
The document is organized as follows: Section 2 presents a literature review. Section 3 presents the methodology of the use of fleets of heterogeneous drones in emergency situational awareness, including contributions in requirements assignment, area decomposition, and trajectory generation. The results of the methodology for 100 areas worldwide using a diverse composition of drone fleets and a comparison with a best-in-class Coverage Path Planning method for a non-heterogeneous fleet of drones are presented in Section 4. Finally, Section 5 discusses the results obtained for the different comparisons and concludes with future work.

2. Previous Works

The use of drones for emergencies has been extensively explored. Multiple surveys [18,19,20,21] highlight their potential in disaster management, search and rescue, and emergency deliveries. Inès et al. [22] propose a system that expands the capabilities of drones for remote and real-time sensing in emergencies by integrating them into the C2C as any other asset. Authors build a collaborative data delivery scheme able to transfer very accurate information to the C2C in near-real-time. In another recent article [23], as part of the initiative Automatic Fire Extinguishing and Prevention using Drones of the Department of Civil Defense of Jordan, authors propose the use of drones equipped with thermal cameras, sensors, and fire-suppressant delivery mechanisms to detect fire outbreaks early and respond instantly.
One of the main technical challenges in optimizing drone operations for such missions is ensuring full area coverage with minimal time and energy consumption. This challenge is identified in the literature as a Coverage Path Planning (CPP) problem [24]. A CPP problem involves finding a path that ensures that the entire space of a confined area is covered. In CPP the goal is to plan a route that allows a robot or agent to traverse all parts of the area without unnecessary repetition, while avoiding obstacles and restricting the amount of overlapping as needed for the image reconstruction. It must also consider factors like path length, number of turns and total flight time as highlighted by Kumar and Kumar (2023) [20].
Depending on the characteristics of the area to be surveyed, the complexity of the CPP problem can vary significantly. The area to be covered can range from simple, regular regions with no internal holes to highly complex environments characterized by non-convex shapes and multiple internal holes. For simple and well-structured regions, it is generally sufficient to adopt regular coverage patterns, such as back-and-forth or spiral trajectories. However, when dealing with complex areas, most proposed methods rely on geometric partitioning approaches [25], on micro shifts following potential field forces [14,26], on optimization-based strategies such as particle swarm optimization (PSO) [27,28], or on cooperative frameworks based on leader–follower models [29,30]. Recent reviews emphasize the growing role of intelligent path planning algorithms that combine computational intelligence, machine learning, and hybrid approaches to improve robustness and adaptability in dynamic environments [31].
To address the CPP problem with multi-robot or swarm systems, different schemes have been proposed. While most studies have focused on fleets of ground robots, the proposed algorithms can also be applied to drones. The geometric division is a common strategy and consists of two steps: first, the area to cover is divided into regions, and then an individual path planning is applied to each drone. By using more than one drone this strategy allows for the coverage of very large areas. Partition is also useful when the area is very complex because partition can simplify the geometry of the area into less complex regions. However, finding the most suitable partition introduces an additional challenge, often referred to in the literature as the Polygon Partition Problem (PPP). For a good partition, the size of the resulting subregions should match the operational capabilities of the drones in the fleet.
The classical planar polygon partition is extensively used. It is based on swap lines crossing the polygon from border to border. The improved sweep line Hert Lumelsky algorithm [32] has an open version extended for non-uniform partitions and non-convex polygons and is available under the name PODE. For convex polygons, an analytical method (PDAN) is proposed in [33]. This analytical method optimizes the compactness of the regions by also using sweep line division, but directly from derivative formulae. It demonstrates the ability to find optimal polygon decompositions with very fast execution times.
The Distributed Autonomous Robot Planning (DARP) [34] applies local optima decisions at the individual drone level, based on the shared knowledge of the environment. The method is able to generate the non-overlapping trajectory of each vehicle, for non-convex, complex-shaped areas using a grid-based division. Three optimization terms are considered: the completeness of the area coverage, the size of the grid nodes on the border of the polygon, and the alignment of the paths with the polygon’s borders. For each partition, the trajectory with fewer turns is generated, with some overlapping allowed. Compared with other state of the art methods, DARP reduces the length of the trajectories and the number of turns, at the cost of losing some small percent of the area coverage. The method is proposed to fix flight altitude and tested with ground vehicles. Apostolides et al. [25] extended the use of DARP for the heterogeneous division of an area.
A swarming formation scheme is proposed in [35] using the leader–follower model. The method is assessed for in situ optimizing the collaboration of drones to provide a trusted situation awareness of an area under a disaster emergency. However, the particularities of aerial trajectories and the heterogeneity of the vehicles in the fleets are not fully exploited.
Miah et al. [36] provide a real-time implementation of an area coverage optimization algorithm for a team of heterogeneous mobile robots. These are small ground robots and heterogeneous in the sense that they have different actuator limits, physical dimensions, and processing capabilities. The method is based on geometric Voronoi tessellation and the application of state-feedback control law for actuator inputs of each robot that optimizes energy consumption.
The collaborative use of heterogeneous fleets of drones has gained increasing attention in recent years, with several studies reporting real flight experiences in flood response and forest fire monitoring. These works highlight that training is essential for commanders to understand drone capabilities and that dedicated tools are needed to facilitate optimal drone deployment in stressful environments. In a related context, Sadrabadi et al. [37] propose a conceptual design of a human-centered wildfire emergency response system encompassing software, hardware, human components, their interactions, and interfaces. However, their system assumes swarms composed of quasi-identical drones and does not consider training as an integral element of operational effectiveness.

3. Materials and Methods

The objective of this work is to build a tool embedded in PANTHEON Disaster Risk Reduction (DRR) platform to rapidly plan the deployment of a fleet of heterogeneous drones. The tool will target full reconnaissance of an area in a disaster scenario. The parameter to optimize is the time needed to cover the area. Since time depends on the flight distance and the number of turns, and those depend on the compactness of the region, we consequently will optimize those. As a result of this optimization, the energy consumption will also be reduced in most cases. The drone flights shall return a set of images that cover the full area with a specific pixel resolution, given as a ground sampling distance input value.
To effectively cover the specified area, we employ a three-step method: first, the specifications of the available drones in the fleet are analyzed and compared against the area; second, we decompose the area into regions with defined proportions; and finally we plan the four-dimension trajectories (4DTs) of each drone in each region, including the round trip trajectory from and to the drone take-off location.
The tool architecture is modular, allowing independent execution of the partitioning and path planning processes. Data exchange is currently performed through GeoJSON files, which serve as both input and output formats, but can be adapted to other standards. The user can define the area of interest and drone specifications directly through these files, or interactively through a graphical interface, but the core processing module is independent and can run autonomously on a local machine or as a server-based service to allow integration into the system.
The tool modules are developed with the python language and were executed on different hardware configurations depending on the experiment:
  • The comparison with EAMC in Section 4.3 was performed on a first hardware configuration: Intel(r) Core(tm) i7-1255U (Santa Clara, CA, USA), CPU @ 1700 MHz, 10-Core laptop with 16 GB of RAM, while the validation was executed with a second configuration: Intel(r) Core(tm) i5-7300HQ CPU @ 2.50 GHz 4-Core laptop with 8 GB of RAM. The EAMC written in C++ [38] was executed on the first configuration through Windows Subsystem for Linux (WSL).
  • The experiments in Section 4.4 were executed by separating steps. For the partitioning (step 2), executions have been performed with a third hardware configuration: Intel i5-1135G7 (4 Cores) laptop with 16 GB of RAM, while path planning (including steps 1 and 3) was executed with the second hardware configuration.

3.1. Fleet Analysis

The fleet is assumed to consist of heterogeneous drones, varying in range, speed, camera field of view, and pixel resolution. To account for this diversity, we incorporate these parameters into the process of calculating inputs for the decomposition algorithm, specifically, the maximum area a drone can cover, and into the operations of the path planning algorithm, which requires flight altitude, spacing between flight tracks in the back-and-forth trajectory, and the capture distance between successive images.
The formalization of the process is as follows: first, we identify the desired Ground Sampling Distance G S D d e s i r e d for the images to be captured. This value is determined by the size of objects that need to be detected in the images, such as people, vehicles, or infrastructure damages, such as debris or cracks. This value, along with some characteristics of the camera, namely the vertical and horizontal fields of view and the output image resolution, will determine the drone’s flight altitude, which is essential for flight planning. For simplicity, it is assumed that the camera maintains a nadir (downward-facing) orientation. Equations (1)–(3) illustrate how to derive the altitude Above Ground Level A G L from the desired Ground Sampling Distance G S D d e s i r e d .
G S D d e s i r e d = H F P / H I R
where H F P is the Horizontal Foot-Print and H I R is the Horizontal Image Resolution.
The H F P is calculated as follows (Equation (2)):
H F P = 2     A G L     t a n ( H F o V / 2 )
where A G L is the altitude Above Ground Level and H F o V is the Horizontal Field of View.
The A G L for each drone is then obtained using the formula in Equation (3):
A G L = ( H I R     G S D d e s i r e d ) / ( 2     t a n ( H F o V / 2 ) )
Other parameters to determine before planning are as follows: the Sweep Distance S D that separates two adjacent flight lines and the Capture Distance C D that separates two consecutive image captures on the same flight line. These two distances are used to transform the area of interest into a grid of points. These will be later referenced by the horizontal and vertical separation distances of the grid points.
Calculating these two distances involves a mapping-specific parameter: the o v e r l a p between captures. For zero o v e r l a p , the sweep lines are separated by a distance equal to the Horizontal Ground Footprint H F P , whereas for non-zero o v e r l a p , the sweep lines are separated by a distance less than H F P . The formulas for calculating these distances are Equations (2), (4)–(6):
S D = H F P     ( 1 o v e r l a p )
C D = V F P     ( 1 o v e r l a p )
with H F P calculated using Equation (2) and V F P is determined as shown in Equation (6):
V F P = 2     A G L     t a n ( V F o V / 2 )
where V F o V is the Vertical Field of View.
Finally, once S D is determined, Equation (7) is used to calculate the maximum area that the drone can cover A C D (Area Covered by Drone):
A C D = S D     M F D
where M F D is the Maximum Flight Distance provided for each drone.
Figure 1 shows the parameters that influence the calculation of the maximum area that a given drone can fly and the parameters needed for the operation of the path planning algorithm.
The first-respondent stations provide the take-off point from which the drones depart and to which they return after the flight. They can correspond to buildings hosting a fire brigade, a police station, or also to mobile stations, such as drones that are transported and operated from a truck. In most cases, these stations are located outside the area of interest.
During this first step and to determine the distance to reach the area, the initial location of the fleet is used as a starting point. Since the area has not yet been partitioned, there is no information about which region each drone will be assigned to. Considering the worst case, the solution consists of taking the farthest point of the polygon as the entry point. The length of the two routes, towards and back from the region to scan, is subtracted from the drone’s range M F D to ensure that it does not run out of power.
Finally, if the sum of A C D i for all drones indexed by i is greater than the polygon area then a proportional reduction is applied to all of them. Conversely, if the sum is less than the area, a new area requirement is added that will represent the area that cannot be covered with the current resources. We will tag this area as ‘Not Assigned’.
At the end of this step, a list of drones’ names and their respective area requirements is returned.
These calculations are based on ideal conditions: normal weather conditions, a monitored battery in good condition, a predefined and fixed payload, and low altitude having minimal impact on flight performance. In real-world scenarios, the variability of these factors can significantly reduce the actual flight distance. Still, battery degradation, caused by repeated charge and discharge cycles, can be monitored by logging usage data and estimating the resulting loss in capacity over time. Adaptive trajectory planning, which allows the drone to respond to real-time variations mid-flight, offers a way to mitigate some of these limitations. In addition, considering that the flights are executed with multi-rotor drones flying at fixed ground speed, on a closed circuit, and with operational margins to the maximum flight speed and flight time, the present work is valid in a conservative way.

3.2. Area Decomposition

The decomposition process utilizes as input the polygon that delimits the area of interest. This polygon may include holes (i.e., restricted zones) that specify no-fly zones. Other external no-fly zones can be specified as input. The second input is the list of the available drones and their capabilities (e.g., the area that an UAV can cover). The objective of the decomposition process is to create partitions of suitable sizes. These partitions can be non-convex and can occasionally contain holes within sub-areas.
We use several polygon partition algorithms: a grid-based bottom-up algorithm (NPD) from [39], the improved sweep line Hert Lumelsky algorithm (PODE) [32] and the analytical decomposition (PDAN) [33], with the latter running only over the convex hull of the original polygon. All of them split a polygon into two regions according to the area requirements. Executing the split algorithm iteratively for all drones completes the area partition.
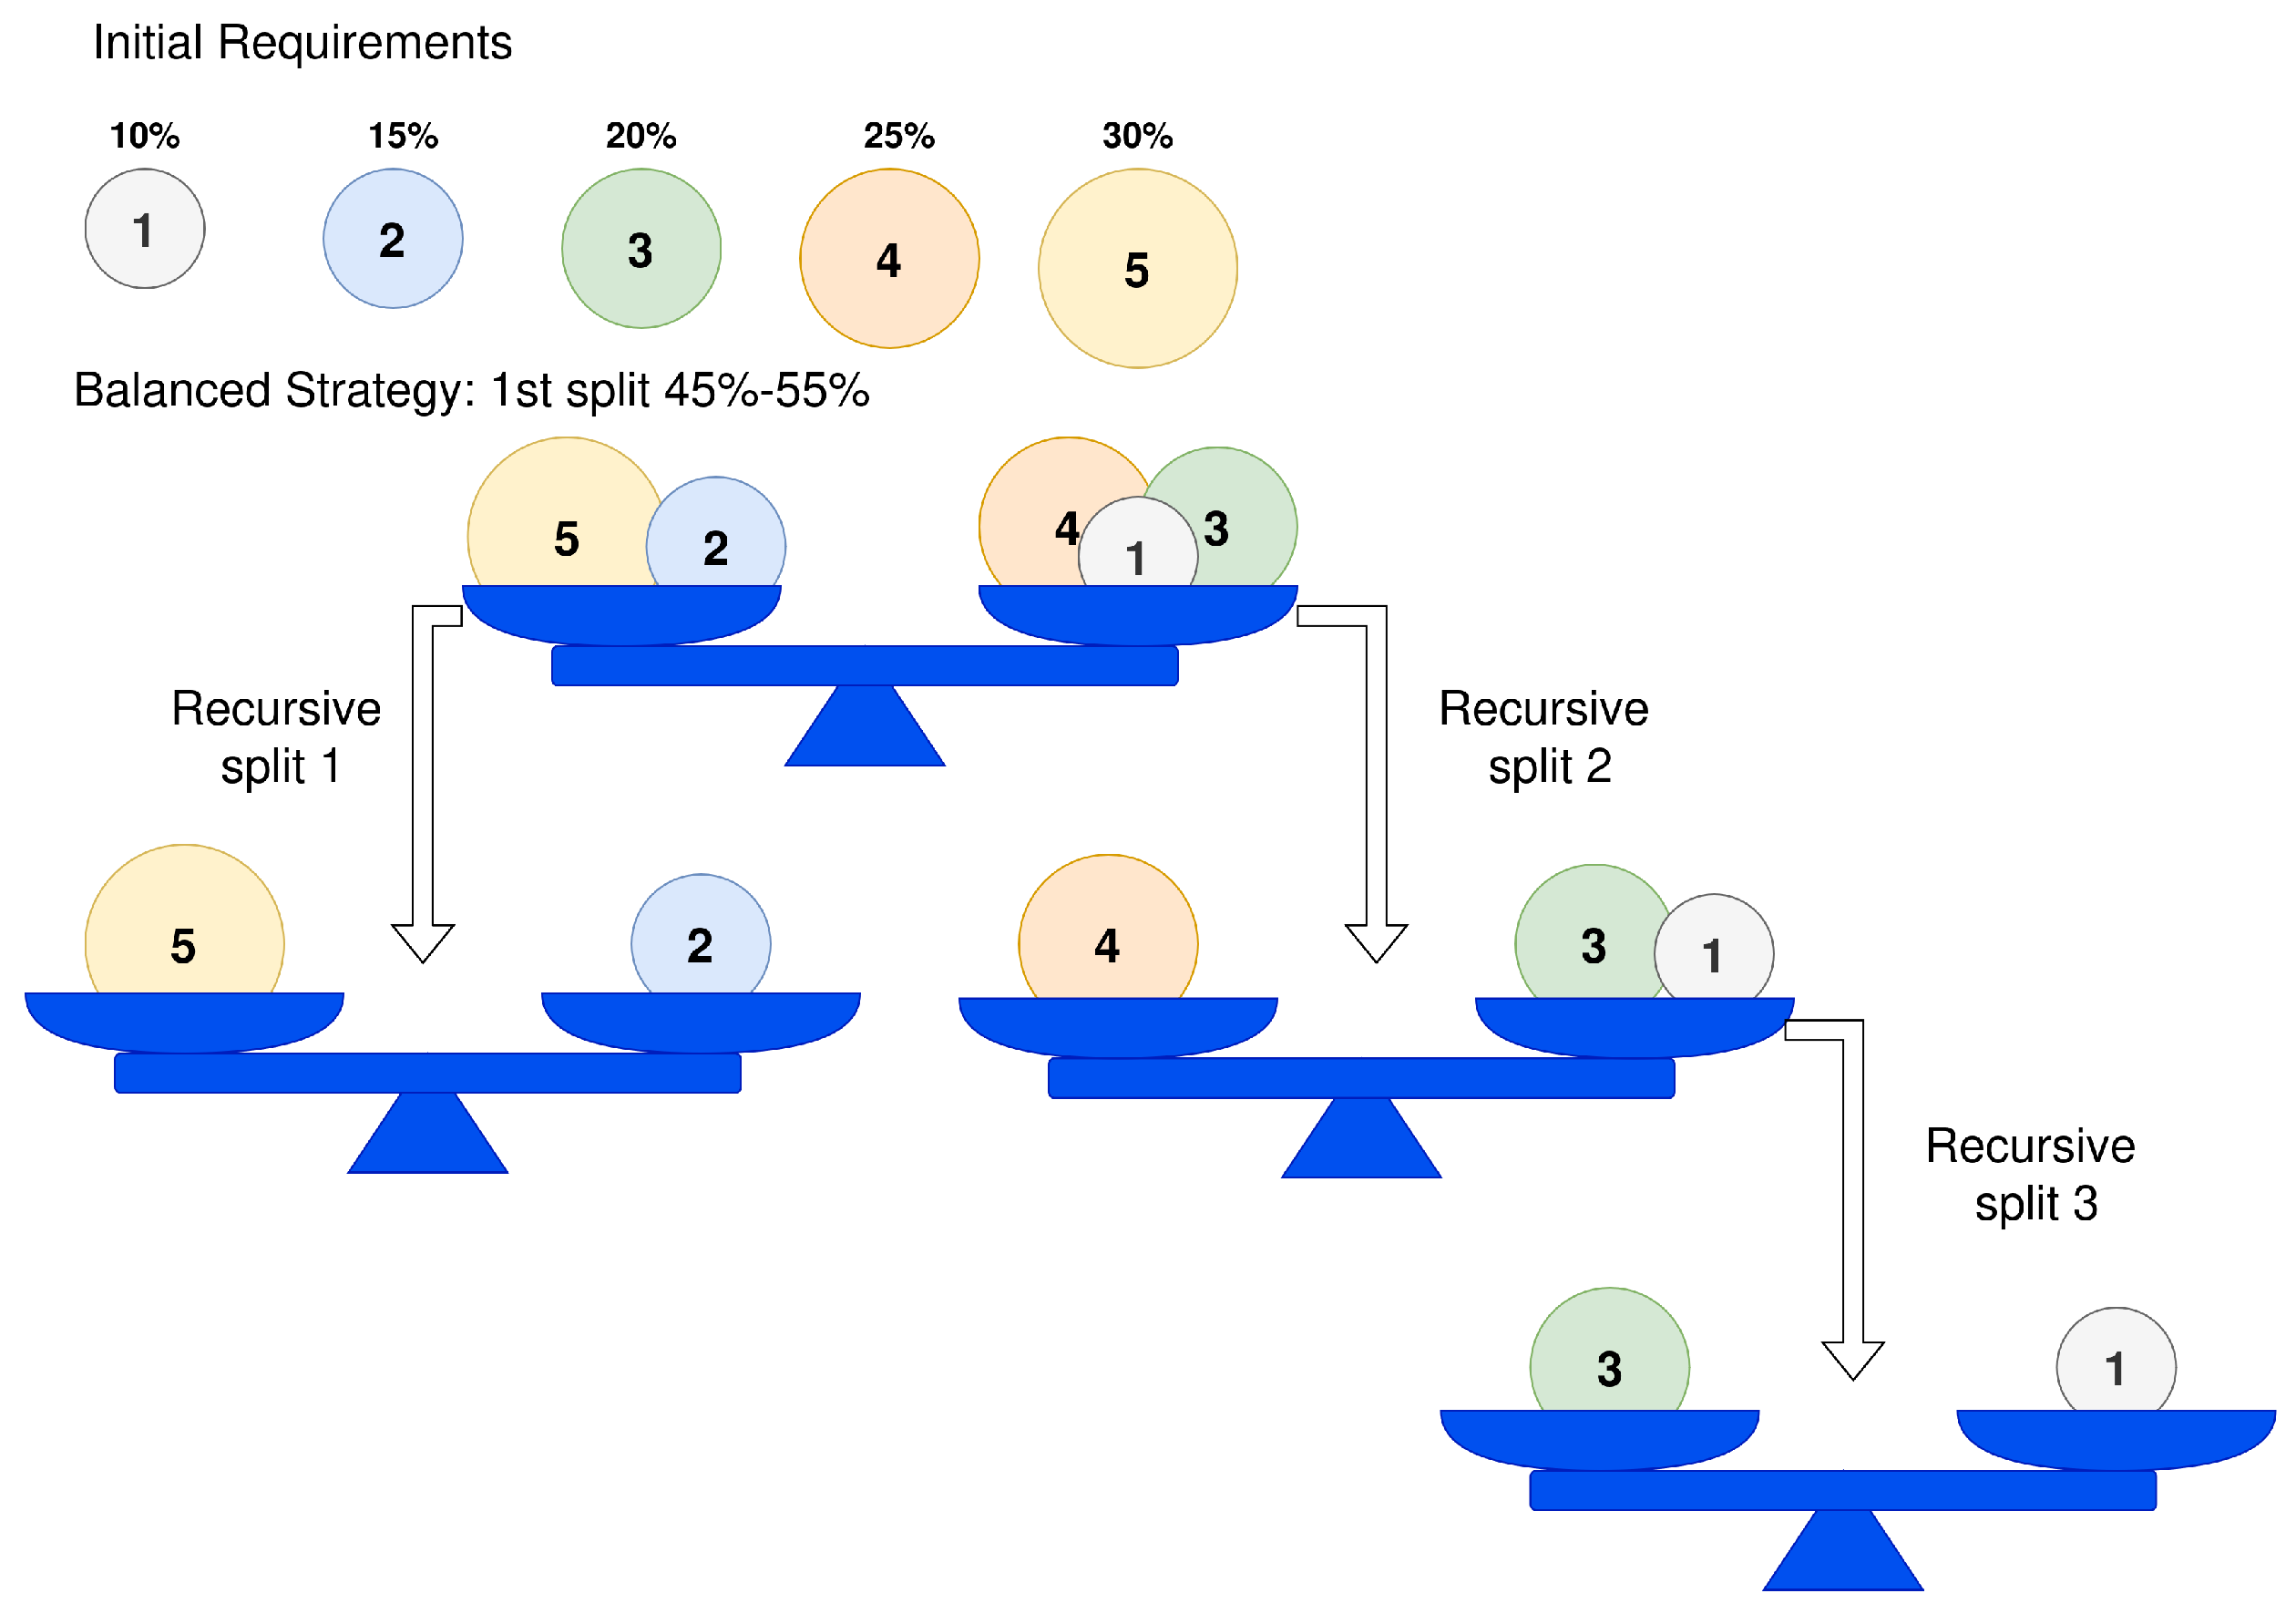
The main contribution on this part is the introduction of a preliminary step in which the order of the split requirements follows a balanced strategy. This recursive algorithm takes the list of unassigned area requirements and divides them into two sets with similar total area requirements, thereby avoiding the creation of small regions at the early stages of the process.
The process begins by sorting all area requirements from largest to smallest. Then, following a greedy policy, each requirement is assigned to the set with the smallest accumulated area at that iteration, progressively balancing the partition. Although this strategy does not guarantee an optimal solution in all cases, it is simple, efficient, and fast for balancing area requirements. Once the two sets are formed, the split algorithm computes the most compact division between their corresponding spatial regions. The subdivision is recursively applied to each resulting region that still contains more than one area requirement. The recursion terminates when the set of requirements associated with a region corresponds to a single original area requirement, that is, when no further subdivision is needed Figure 2 illustrates the process for an example with five different area requirements.

3.3. Path Planning

The proposed path planning method uses as input one or more polygons that delimit the regions to cover. These polygons may include holes (i.e., obstacles or restricted zones) that specify no-fly zones. Other inputs are information on the available drones, their assigned region, and their performance characteristics.
Our path planning method is able to manage convex and non-convex input polygons. It generates multiple potential paths and then selects the one with the minimum turns and a short distance. It ensures maximum area coverage while avoiding restricted zones. The path planning process is carried out in two main stages. First, a grid of points and a set of undirected graphs are generated for a rotated version of the polygon at various rotation angles. Then, trajectories are computed within these rotated polygons and the best trajectory is selected.
In this section, we begin by presenting the two stages, then provide details on how no-fly zones are avoided, followed by a discussion of the path planning algorithm’s time complexity.

3.3.1. Grid and Graph Creation

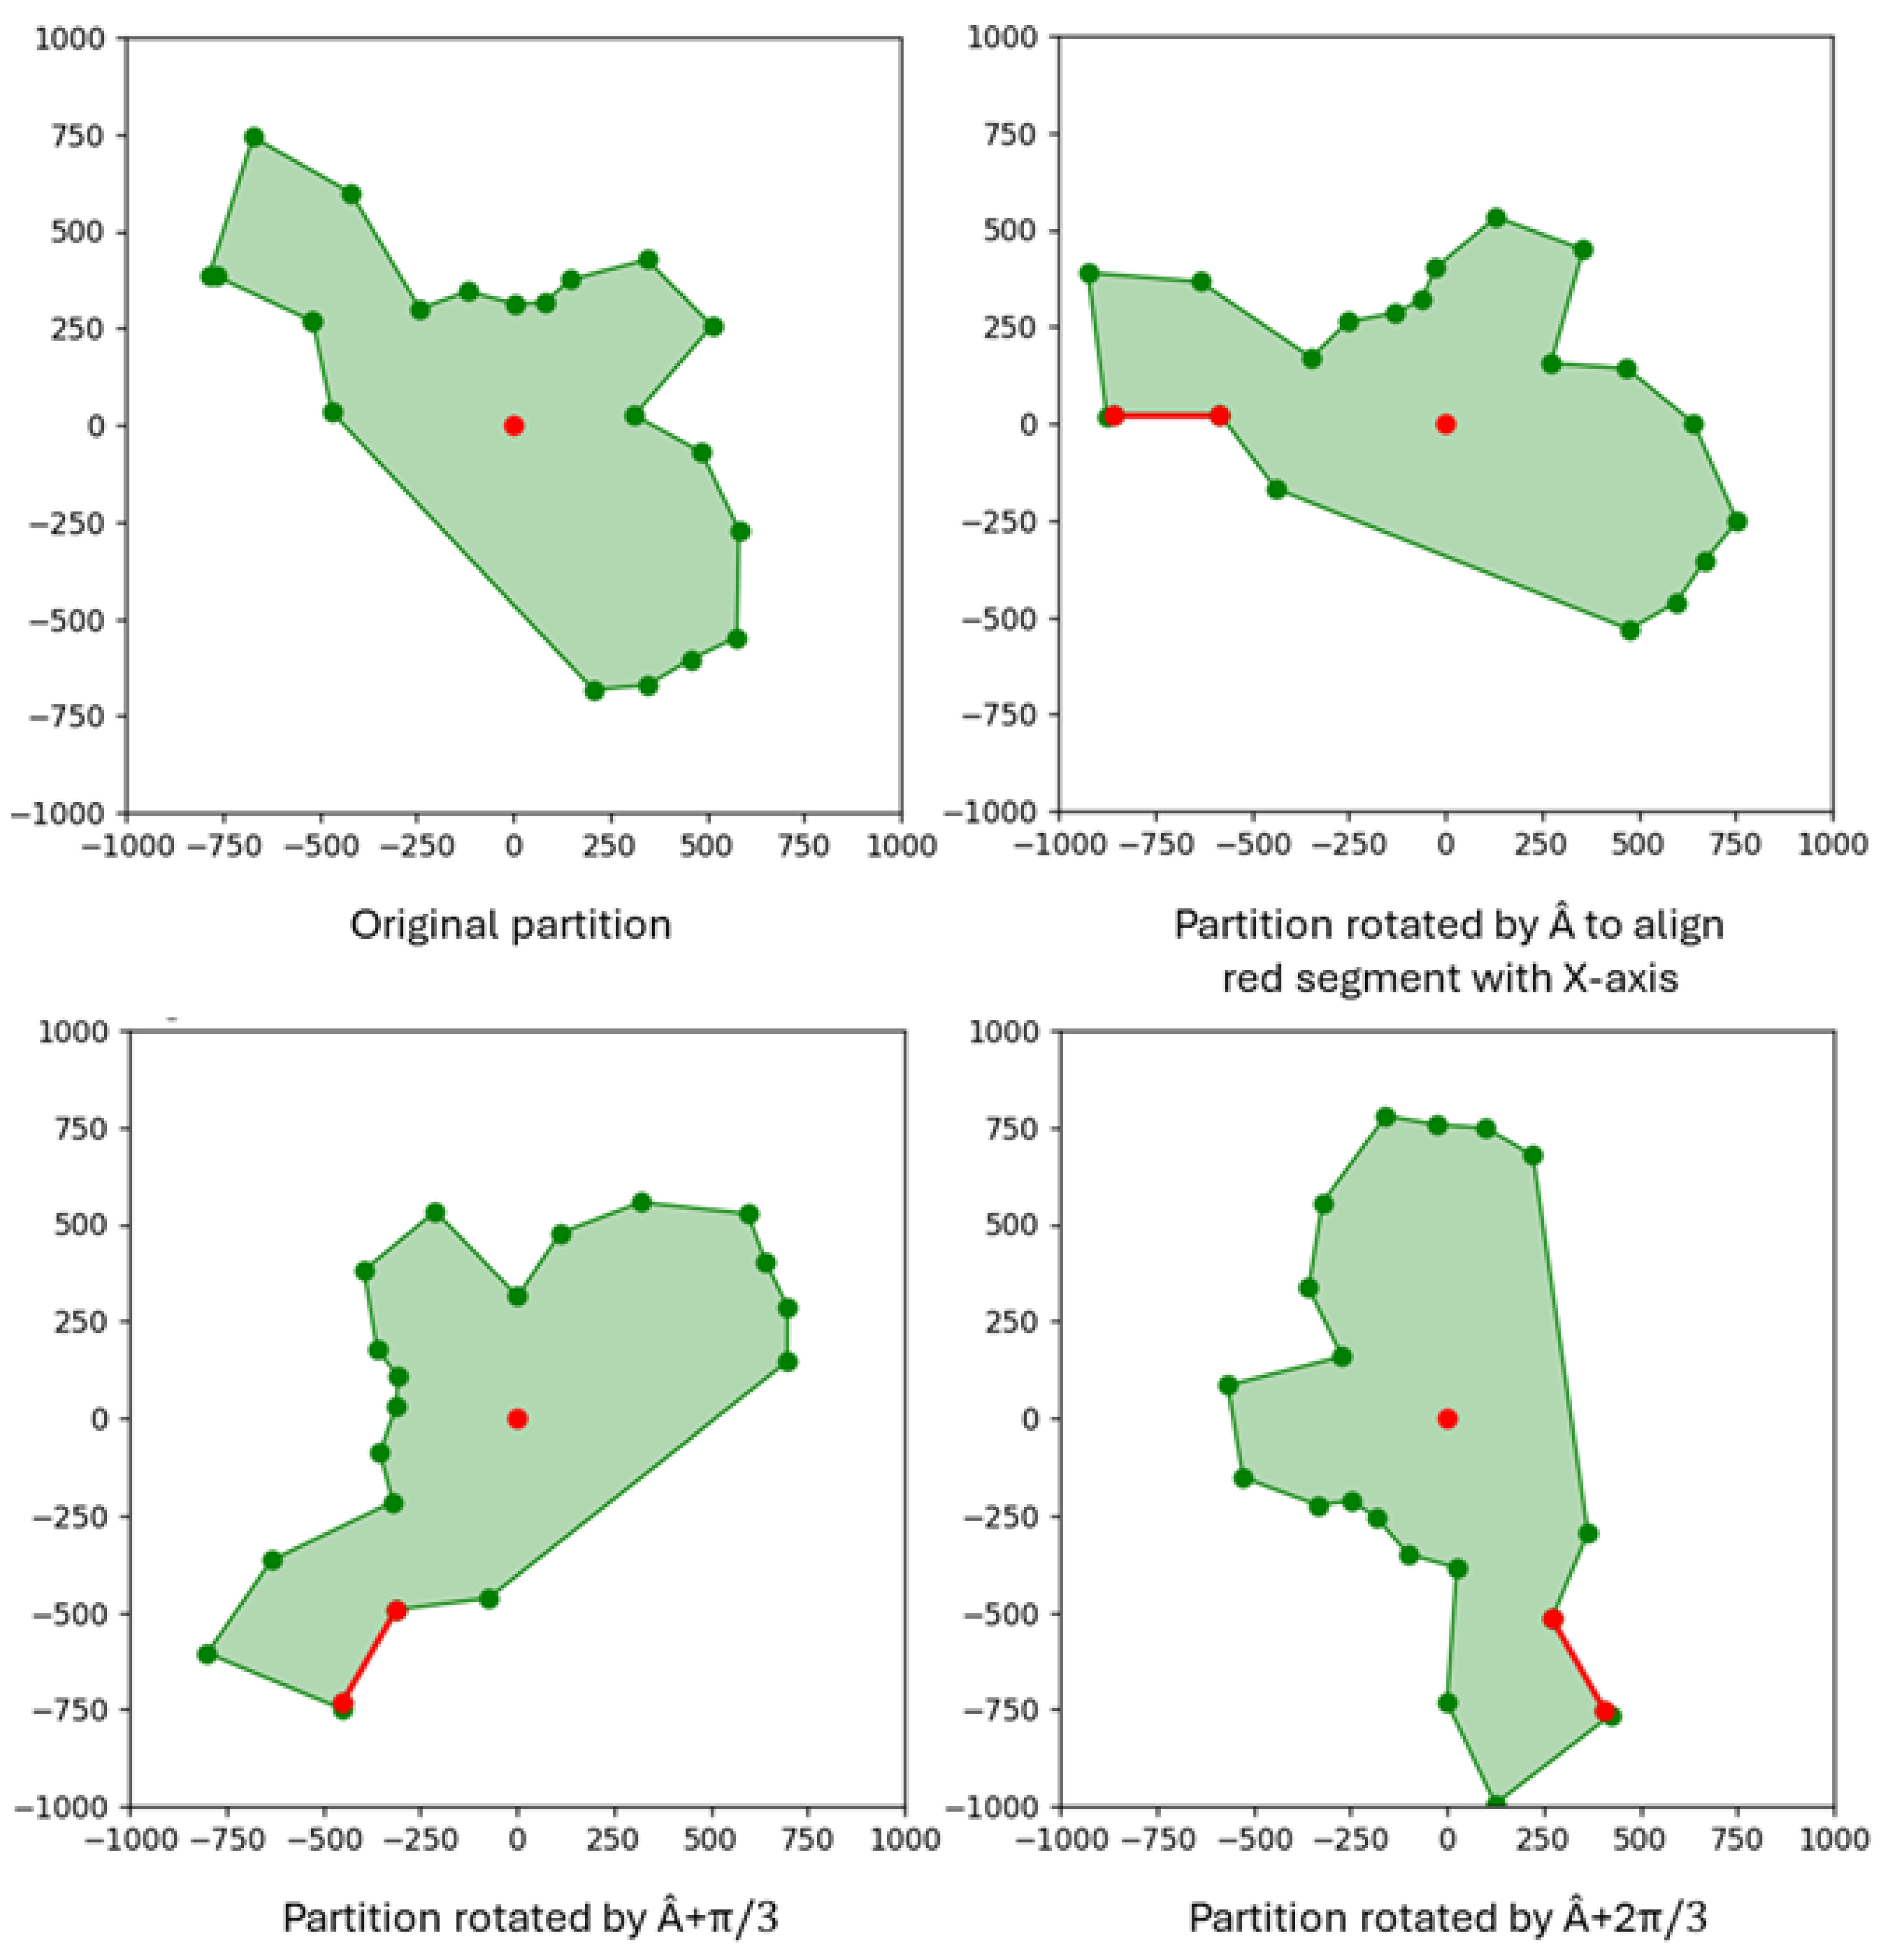
Each region generated by the area decomposition algorithm is represented as a polygon. The polygon is assumed to lie in a planar coordinate system with the Y-axis oriented toward the north and the X-axis toward the east. For every segment of this polygon, the planning algorithm first computes the rotation angle  required to align the segment with the X-axis of the plane. This alignment angle is then added to the N discrete angles of the set { 0 , π / N , , ( N 1 ) π / N } where N is a configurable parameter of the algorithm. The resulting N angles are used to rotate the polygon accordingly, as shown in Figure 3.
For each rotated polygon with the summed angles (angle for alignment and angle from the set), the algorithm creates a grid of points parallel to the X-axis of the plane. These points start at H F P / 4 from the bottom point of the polygon boundaries and are vertically separated at a distance interval of S D . Points in the same horizontal line start and end at V F P / 4 from the outermost boundaries of the polygon. They are distanced by C D except for the last point that can be distanced by less than C D .
Grids transform the environment into a discrete structure, significantly simplifying the application of graph-based algorithms. This discrete approach is one of the key reasons grids are widely adopted in path planning methods. Their effectiveness has been thoroughly investigated in numerous studies [13,40,41].
All points located within the polygon are classified as pass points, whereas any points outside the polygon are considered no-pass points. Examples of no-pass points include those lying within holes in the polygon or those positioned between two segments that form a concave angle. Figure 4 shows different grids resulting from different rotation angles.
Points in the same horizontal line represent a sweep line of the drone trajectory, and every pass point marks the position where the camera captures each new image.
Upon generating the complete set of points for a given rotated polygon, an undirected graph is constructed, wherein the nodes are the external and internal vertices of the polygon (internal vertices are those defining any holes). Initially, the graph edges consist of the polygon segments (external border and, if relevant, internal perimeter of the holes). The graph structure may be augmented at this step by introducing two pass points surrounding every no-pass points’ segment along the same sweep line as auxiliary nodes (this helps define a route in the graph to go around the no-pass points). These nodes are then linked to existing graph vertices to facilitate the computation of a shortest path between them (see Figure 5).

3.3.2. Path Calculation

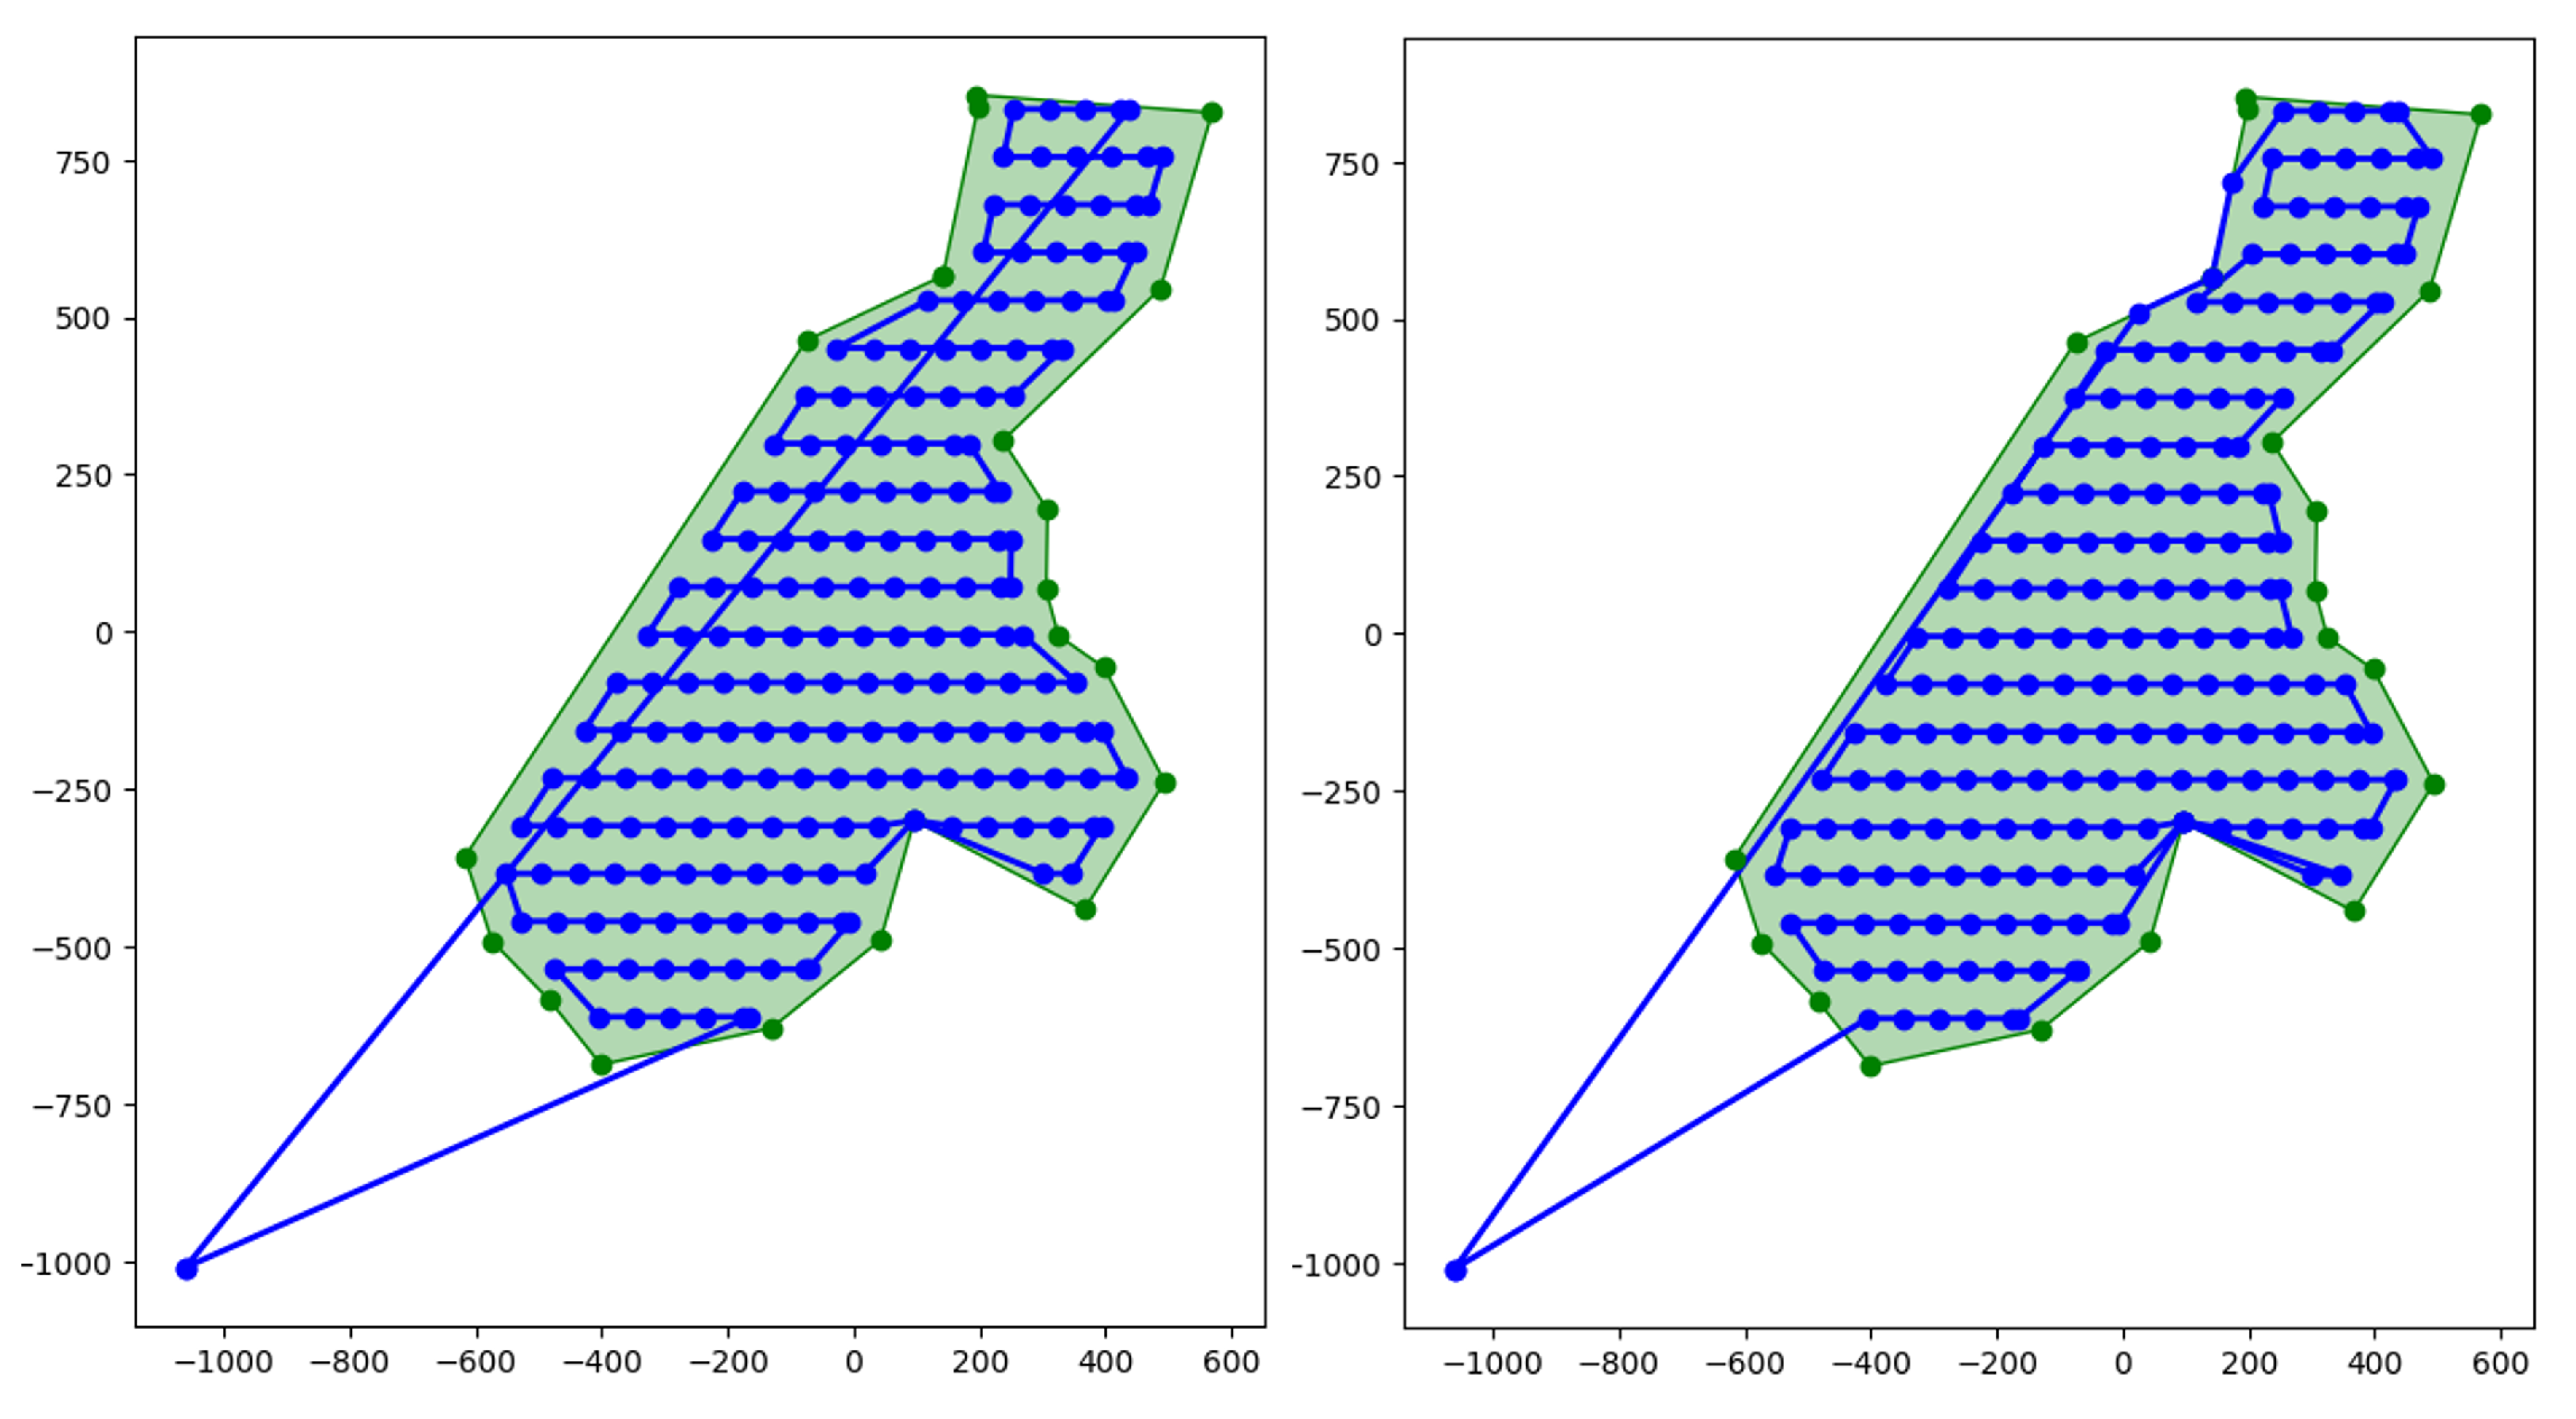
In this stage, for each rotated polygon and its associated points obtained during the grid and graph creation stage described in Section 3.3.1, two paths are calculated as potential drone trajectories. Each path begins at the drone’s starting position and leads to one of the entry points represented in Figure 4. These points are endpoints of the line that starts at the bottom of the polygon. That line will be referred to as the lowest sweep line. If a path crosses one or more no-fly zones, an alternative path is computed to avoid them. More details on area avoidance will be provided later in this section.
Arriving at an endpoint of the lowest sweeping line, each path continues following a systematic back-and-forth pattern from the bottom to the top, passing through each point designated as a pass point. When two pass points are separated by one or more no-pass points, or the segment connecting them is not entirely contained within the polygon (i.e., it intersects the edges of the polygon), both points, whether adjacent or not, are added as nodes in the graph. They are then connected to polygon vertex nodes that can be reached without crossing any internal or external polygon boundaries (see Figure 5, right plot).
After updating the graph with these two auxiliary nodes, the algorithm searches for the shortest path that connects them, restricted to traverse exclusively through the polygon vertices. This shortest path search is performed using the A* algorithm, selected for its computational efficiency and its proven ability to quickly determine optimal paths. The resulting shortest path is then integrated into the global trajectory currently being constructed.
Once all pass points have been visited, the point corresponding to the initial position of the drone is appended as the final destination to the global trajectory. If this return path intersects one or more no-fly zones, an alternative route is computed to ensure complete avoidance of restricted areas like before.
The two trajectories shown in Figure 6, each passing from different endpoints of the lowest sweeping line, lead to a different number of turns and different flying distances. These trajectories are evaluated against each other, as well as against trajectories generated for the same partition under different rotation angles.
Among the candidate trajectories, those with the minimum number of turns are first identified. If multiple trajectories share the same number of turns, the one with the shortest length is selected.
To express the trajectory selection process mathematically, we define a decision rule based on two criteria: the number of turns and the trajectory length.
Let T i be a candidate trajectory for partition P, n i be the number of turns in trajectory T i , and d i be the length of trajectory T i .
The selection process is formulated as follows:
  • Minimize the number of turns:
    T = arg min T i T n i
  • If multiple trajectories have the same minimum number of turns, select the one with the shortest length:
    T = arg min T i { T j T n j = min k n k } d i
    where T is the set of candidate trajectories for a given partition, and T     is the selected optimal trajectory.
After computing the optimal trajectories for all partitions, the overall performance of the mission is evaluated based on a set of metrics presented later.

3.3.3. Trajectory Refinement: Avoidance of No-Fly Zones

This refinement is applied when the drone encounters one or more restricted areas, both while heading toward the partition from its initial position and when returning to it after completing the partition scan. It is part of the path calculation stage.
Restricted areas can vary in number and configuration. They can be holes within the polygon to be scanned or adjacent polygons that may be located along a flight path. For all cases, a detour path must be computed to avoid them.
For this, we construct a visibility graph [42] where each node is a vertex of the polygons that define the restricted areas. Edges are added between nodes only if the straight line connecting them does not intersect the interior of any restricted zone.
Once all valid connections are established, the graph is ready to be used to calculate avoidance paths for any trajectory generated by the algorithm. In fact, to connect the starting position of a drone to an entry point in its partition, we simply add two new nodes that represent these positions in the graph. Each is then linked to all accessible nodes that do not require crossing restricted areas (see Figure 7). The shortest path between these two new nodes is then computed using the A* algorithm.

3.3.4. Computational Considerations in Trajectory Generation

To proceed with the trajectory generation, the algorithm requires several input parameters. These can be mission-specific, such as the area to be covered and the presence of no-fly zones, where the number of vertices in each polygon significantly affects processing time. The drone specifications, which is another mission-specific input, determine the grid resolution used during path planning. Additionally, a user-defined parameter which is the number of rotations, is required.
When focusing solely on vertices, we can observe that the trajectory planning over areas with a high vertex count can lead to a substantial increase in execution time. However, when these vertices are closely spaced, the algorithm can simplify the geometry by reducing their number, thereby improving processing efficiency. Moreover, using modern cameras with a wide footprint increases the sweeping distance and reduces the grid resolution. From an implementation perspective, this leads to reduced execution time and a shorter scanning trajectory, which is a notable advantage of our approach. Another factor that can mitigate the impact of a large number of vertices is the reduction in the number of required rotations. By minimizing these rotations, the overall execution time can be further optimized. When none of these methods yields results within a reasonable timeframe, fallback strategies may be considered by applying more aggressive geometric simplification techniques or make the algorithm independent of the number of vertices.
An example using the Fyli area with two different sweeping distances, 7.5 and 75 m (number of vertices unchanged), resulted in execution times of 71.4 s and 8 s, respectively. This highlights the significant impact of grid resolution on performance. Alongside the results presented later that explore variations in the number of rotations (N), these examples clearly demonstrate that multiple factors can substantially influence execution time. Nonetheless, by carefully balancing input parameters, it is possible to maintain execution times that remain appropriate for emergency response scenarios.

3.4. Metrics

Generalization of the goodness of the algorithm needs to be conducted using objective metrics. The most essential metric is the total time required to obtain images of the full area of interest. This includes the flight time of all drones (see T f l i g h t in Equation (10)), from the first departure ( T D ) to the last return ( T A ). The time required to obtain the complete map of the area from the images taken by the drones is beyond the scope of this work.
T f l i g h t = m a x d f l e e t ( T A ) m i n d f l e e t ( T D )
The partition algorithms aim at maximizing the region compactness. We also define the Compactness (C) as the average compactness of all regions assigned to drones (see Equation (11)).
C = d f l e e t C d | f l e e t |
where C d is the compactness for the region R assigned to drone d, defined as follows:
C d = A r e a ( R ) P e r i m e t e r ( R )
We will also look at the total turns ( T u r n s total ) and the total flight distance ( D total ), by accumulating the individual values of each drone i, with n is the number of drones.
T u r n s total = i = 1 n T u r n s i
D total = i = 1 n D i
While D i corresponds directly to the length of the trajectory of the drone i. The T u r n s i is determined by counting the angles formed by each three consecutive points on the drone trajectory that are not equal to π .
Finally, the C o v e r a g e metric accounts for the quality of the result, showing the percent of the total area A total covered by photography.
C o v e r a g e = A covered A total × 100
The A covered is determined based on both the H F P and the V F P . It also takes into account the yaw rotation of the drone at the time each image is captured. This metric considers all captured images and evaluates the percentage of the area effectively covered by these images.
Some scenarios may end with an area that is not visited during the unique flight of the drone fleet if its combined range is not high enough. In others, coverage may come very close to 100% without fully achieving it, mainly due to tiny regions with negligible area that are missed by drone imagery. When these small gaps are absent and the number of drones is sufficient, the full coverage is achieved.

3.5. Example of Fyli Scenario

This section presents an example of the complete process using the Fyli scenario setup, in one of the pilots prepared in the PANTHEON project [10]. It defines an area of interest that needs to be urgently monitored after a disaster. The scenario also defines the available resources (the drones, their characteristics, and their base station).

3.5.1. Area of Interest

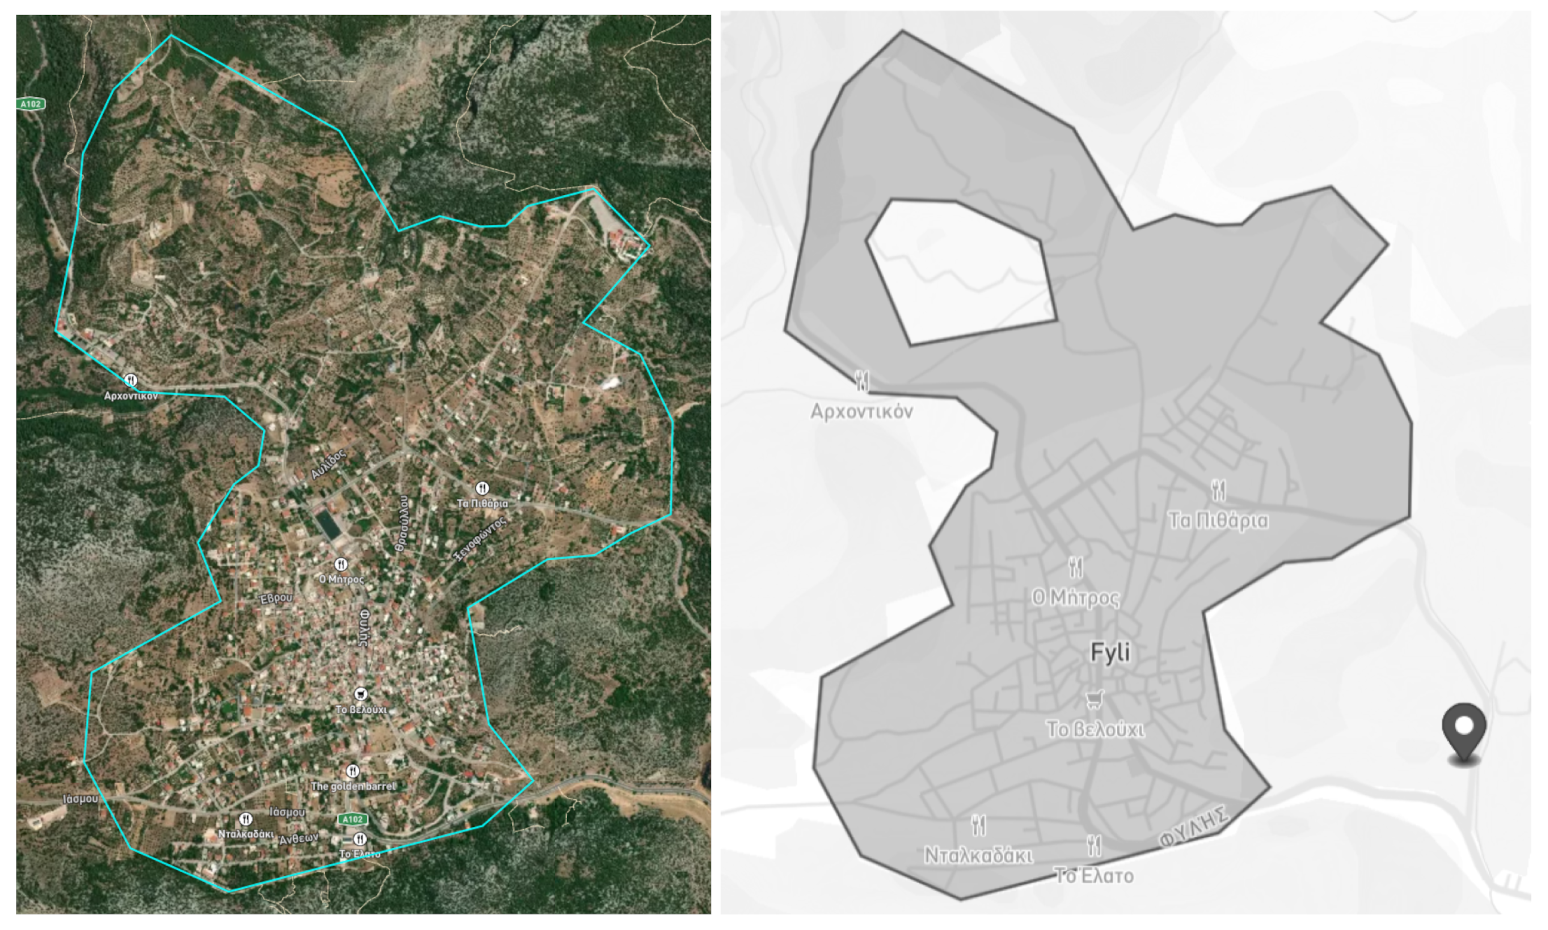
The city of Fyli, Greece, has been selected as the area that needs to be monitored after a disaster. Fyli is in the North-West of Athens that had some emergency episodes in the past and has been selected as one of the PANTHEON project pilots. Figure 8 shows Fyli and its surroundings.
The municipality of Fyli has almost 50 thousands of inhabitants and an area of 109.128 km2. The area of interest in case of an emergency is the populated area, highlighted in the figure. This area is contained within a polygon of 2.66 km2.
The example assumes a first-responder station located in the east of the area and excludes a non-populated area in the north-west (see Figure 8).

3.5.2. Drones Fleet

We assume that the first-responder crew in charge of the emergency has a diverse drone fleet with heterogeneous performances. On day-by-day activities they may use the drone with the best performance, but in a large-scale emergency all available drones will be deployed because this can help to react faster.
Table 1 shows a list of seven drones with their characteristics, selected for the Fyli showcase. These are typical small drones (except for the Yuneec H520E) that may be used by many firefighters or police crews today. Some values were obtained directly from the official documentation, while others were derived based on available technical information. In cases where specific data were unavailable, reasonable approximations were made to support the calculation of drone capability.
The drone speeds listed in Table 1 are those used to determine the Maximum Flight Distance M F D and will serve as a reference for all subsequent calculations.

3.5.3. Algorithm Steps

The first step is to calculate the area that each drone model can cover. We need to subtract twice the distance between the initial drone position and the farthest point of the polygon. Then, assuming a target G S D equal to 2 cm/px, the remaining range capability is converted to area using the calculated sweep distance (SD). Table 2 presents the maximum surface that each drone can cover and area requirements once proportionally reduced to cover the Fyli area.
The second step is the partition of the area according to the values obtained above. Three potential partitions are shown in Figure 9 using different partition algorithms: On the left PODE, on the middle NPD, and on the right PDAN, with this last one using the convex hull and ignoring the holes. The first row shows the non-balanced results of the decomposition algorithm and the second row shows the balanced partitions.
The cleanest and most homogeneous partition is obtained with PDAN when applying the proposed balancing strategy. However, in this case, the original polygon has been replaced by its convex hull, since PDAN can only process non-convex polygons that do not contain holes. The PODE method has not been implemented with the balancing strategy, and therefore no balanced version is shown. Its partition appears rather irregular, with complex shapes and some elongated or small subregions. Finally, although the NPD algorithm produces a slightly more regular decomposition after balancing, the overall improvement remains limited and its effects are not clearly conclusive. Further details on the partitioning results are provided in Section 4.
The trajectory generation step follows after the polygon partition. The results of this third step are the trajectory lines shown in Figure 10. All trajectories (lines in blue) depart from and return to the first responder’s unique location. Note that the density of the capture points (shown as points within the path lines) and the separation of the sweep lines are very different, depending on the quality of the camera onboard each drone. Additionally, Figure 10 highlights several no-fly zones that drones must avoid in order to successfully reach the designated area.

4. Experimentation and Results

4.1. Scenarios

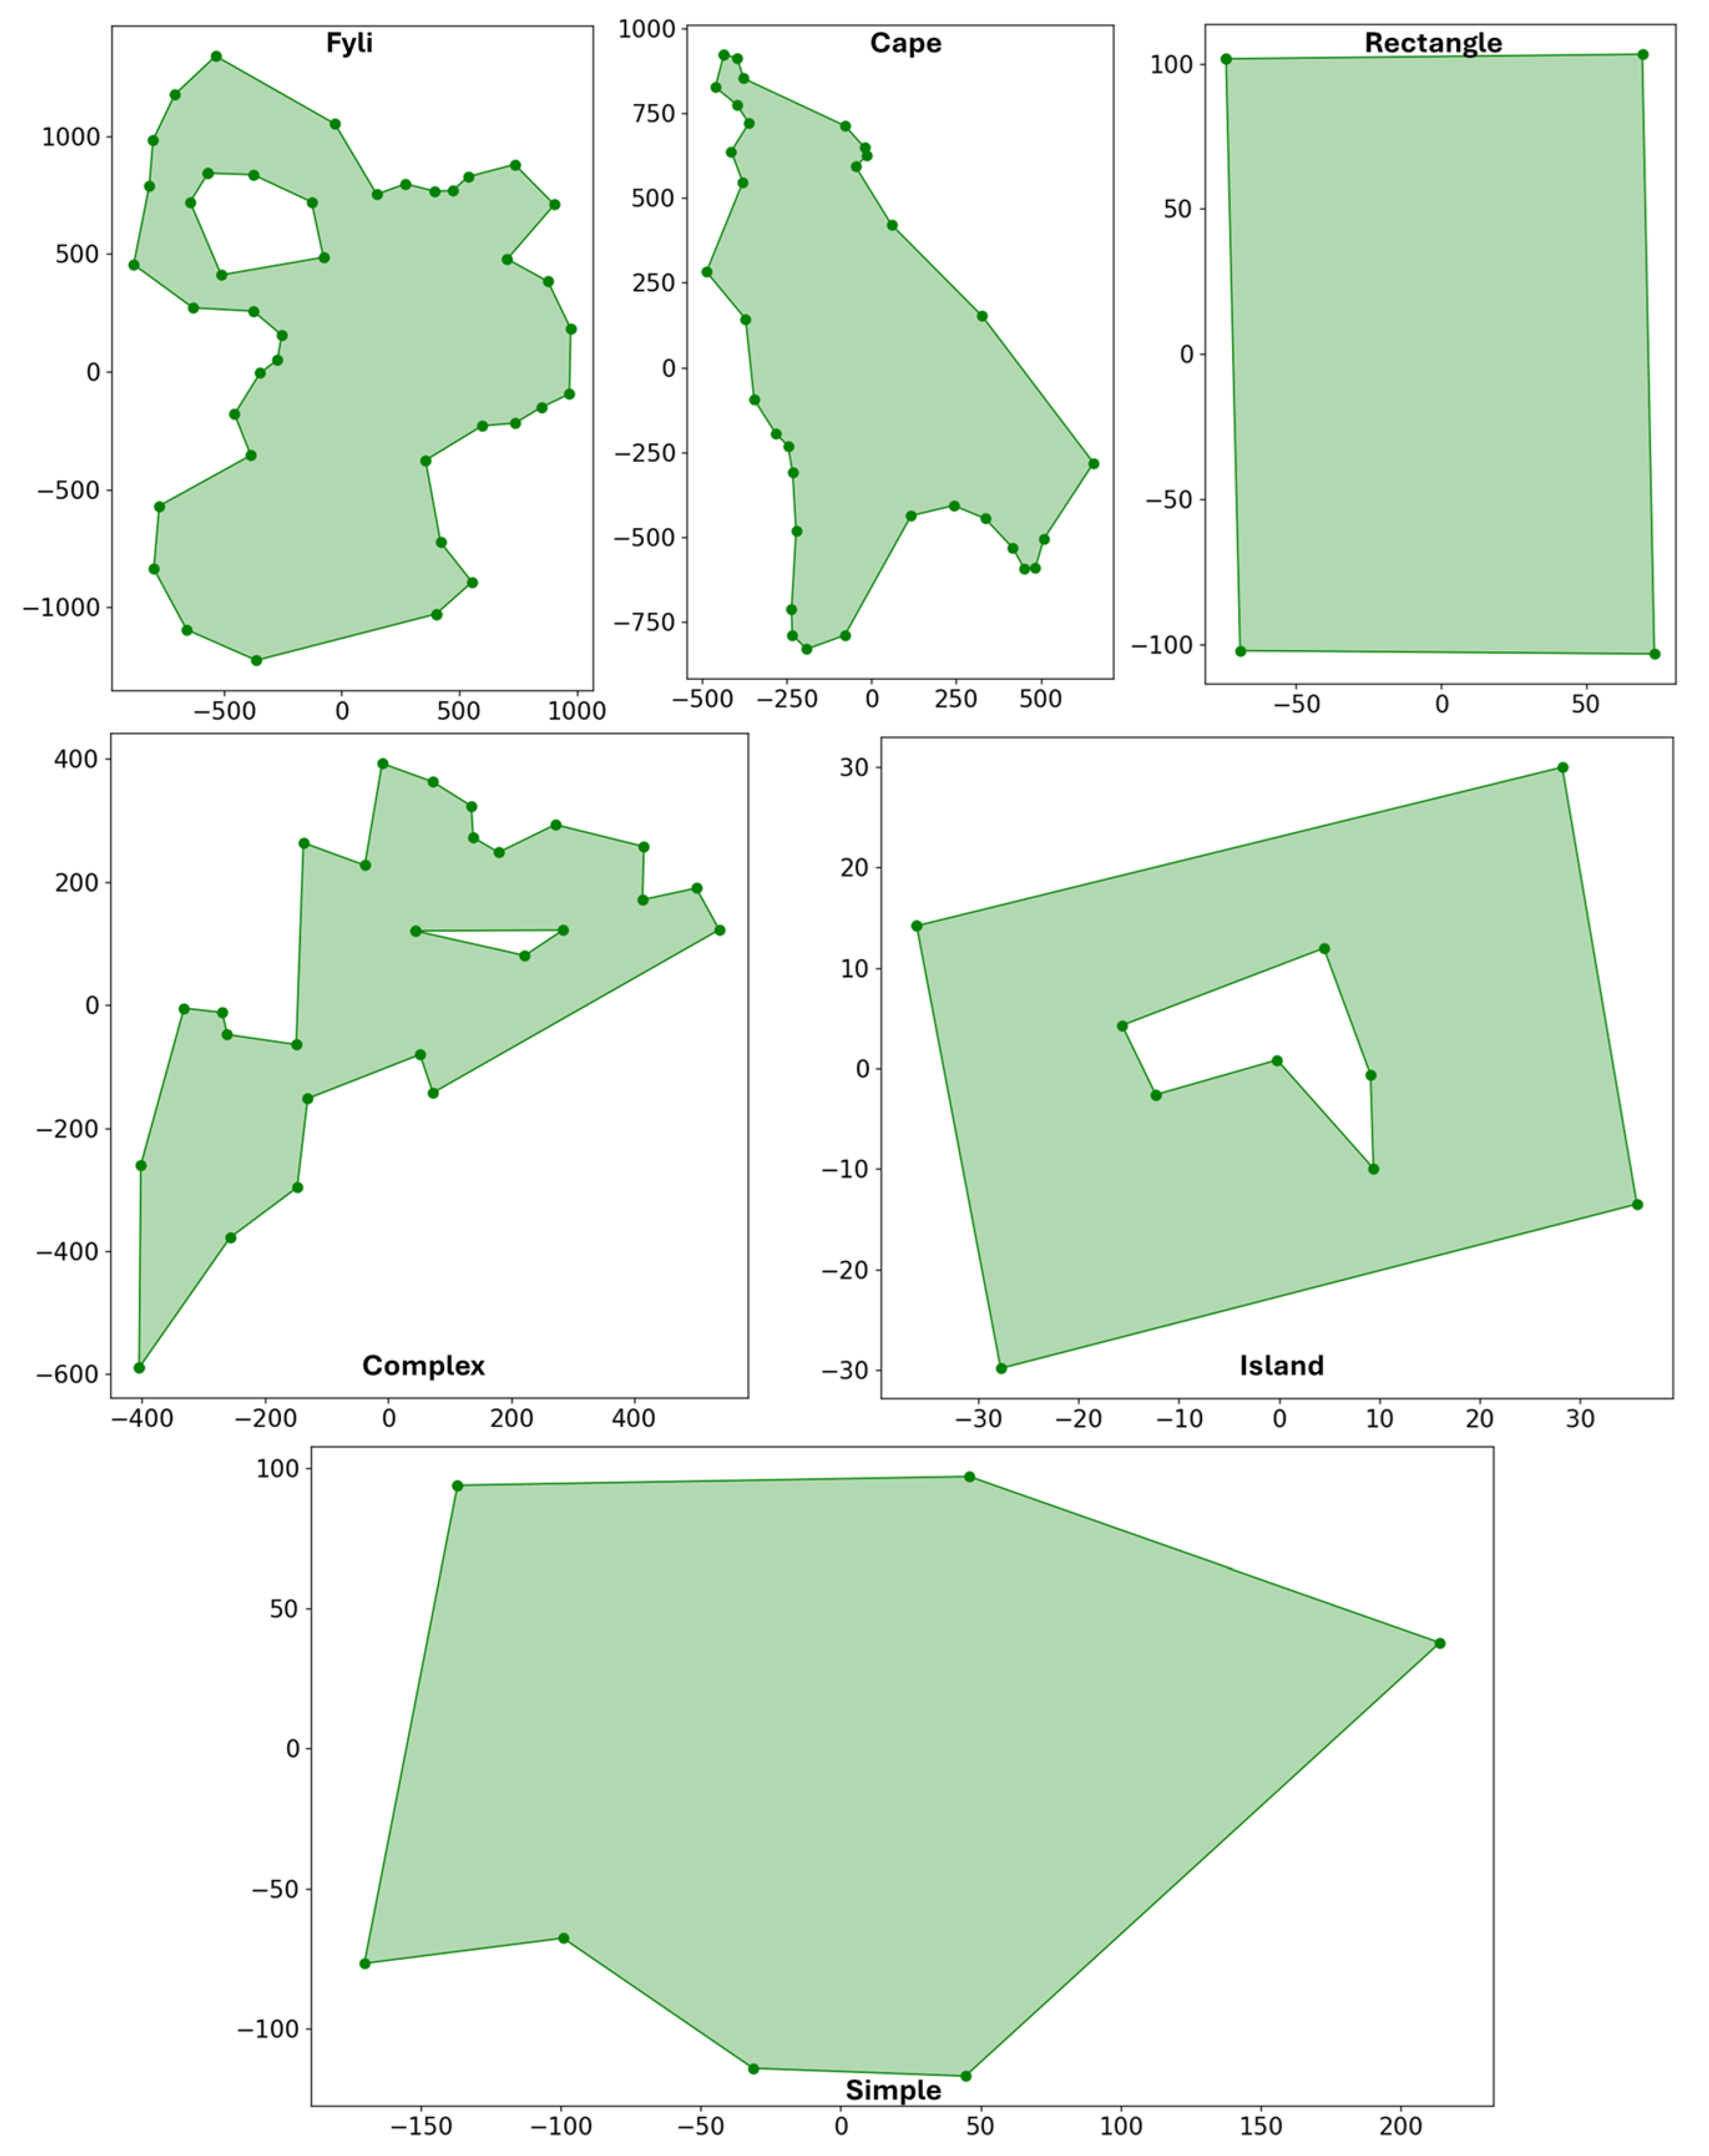
For our experiments, we used various areas to build our scenarios: the first zone is Fyli, a case study from the PANTHEON project; five additional zones were taken from the EAMC paper; and a dataset containing 100 other polygons was created for this work. All of these will be presented in this section.

4.1.1. Fyli and EAMC Scenarios

Fyli, Cape, and Complex are large, non-convex zones characterized by a high number of vertices, with holes present in Fyli and Complex, but not in Cape. In contrast, Island, Rectangle, and Simple are smaller areas with fewer vertices, with only Island containing a hole. The area sizes vary considerably from 2681.54 m2 (Island) to 2,666,993.92 m2 (Fyli) and the number of vertices ranges from 5 to 36. The drones’ distances from the centroid of each polygon also vary, with the furthest being 1390.77 m (Fyli) and the closest being 31.50 m (Island). All of these areas and their characteristics are summarized in Table 3 and illustrated in Figure 11.

4.1.2. One Hundred Polygons Dataset

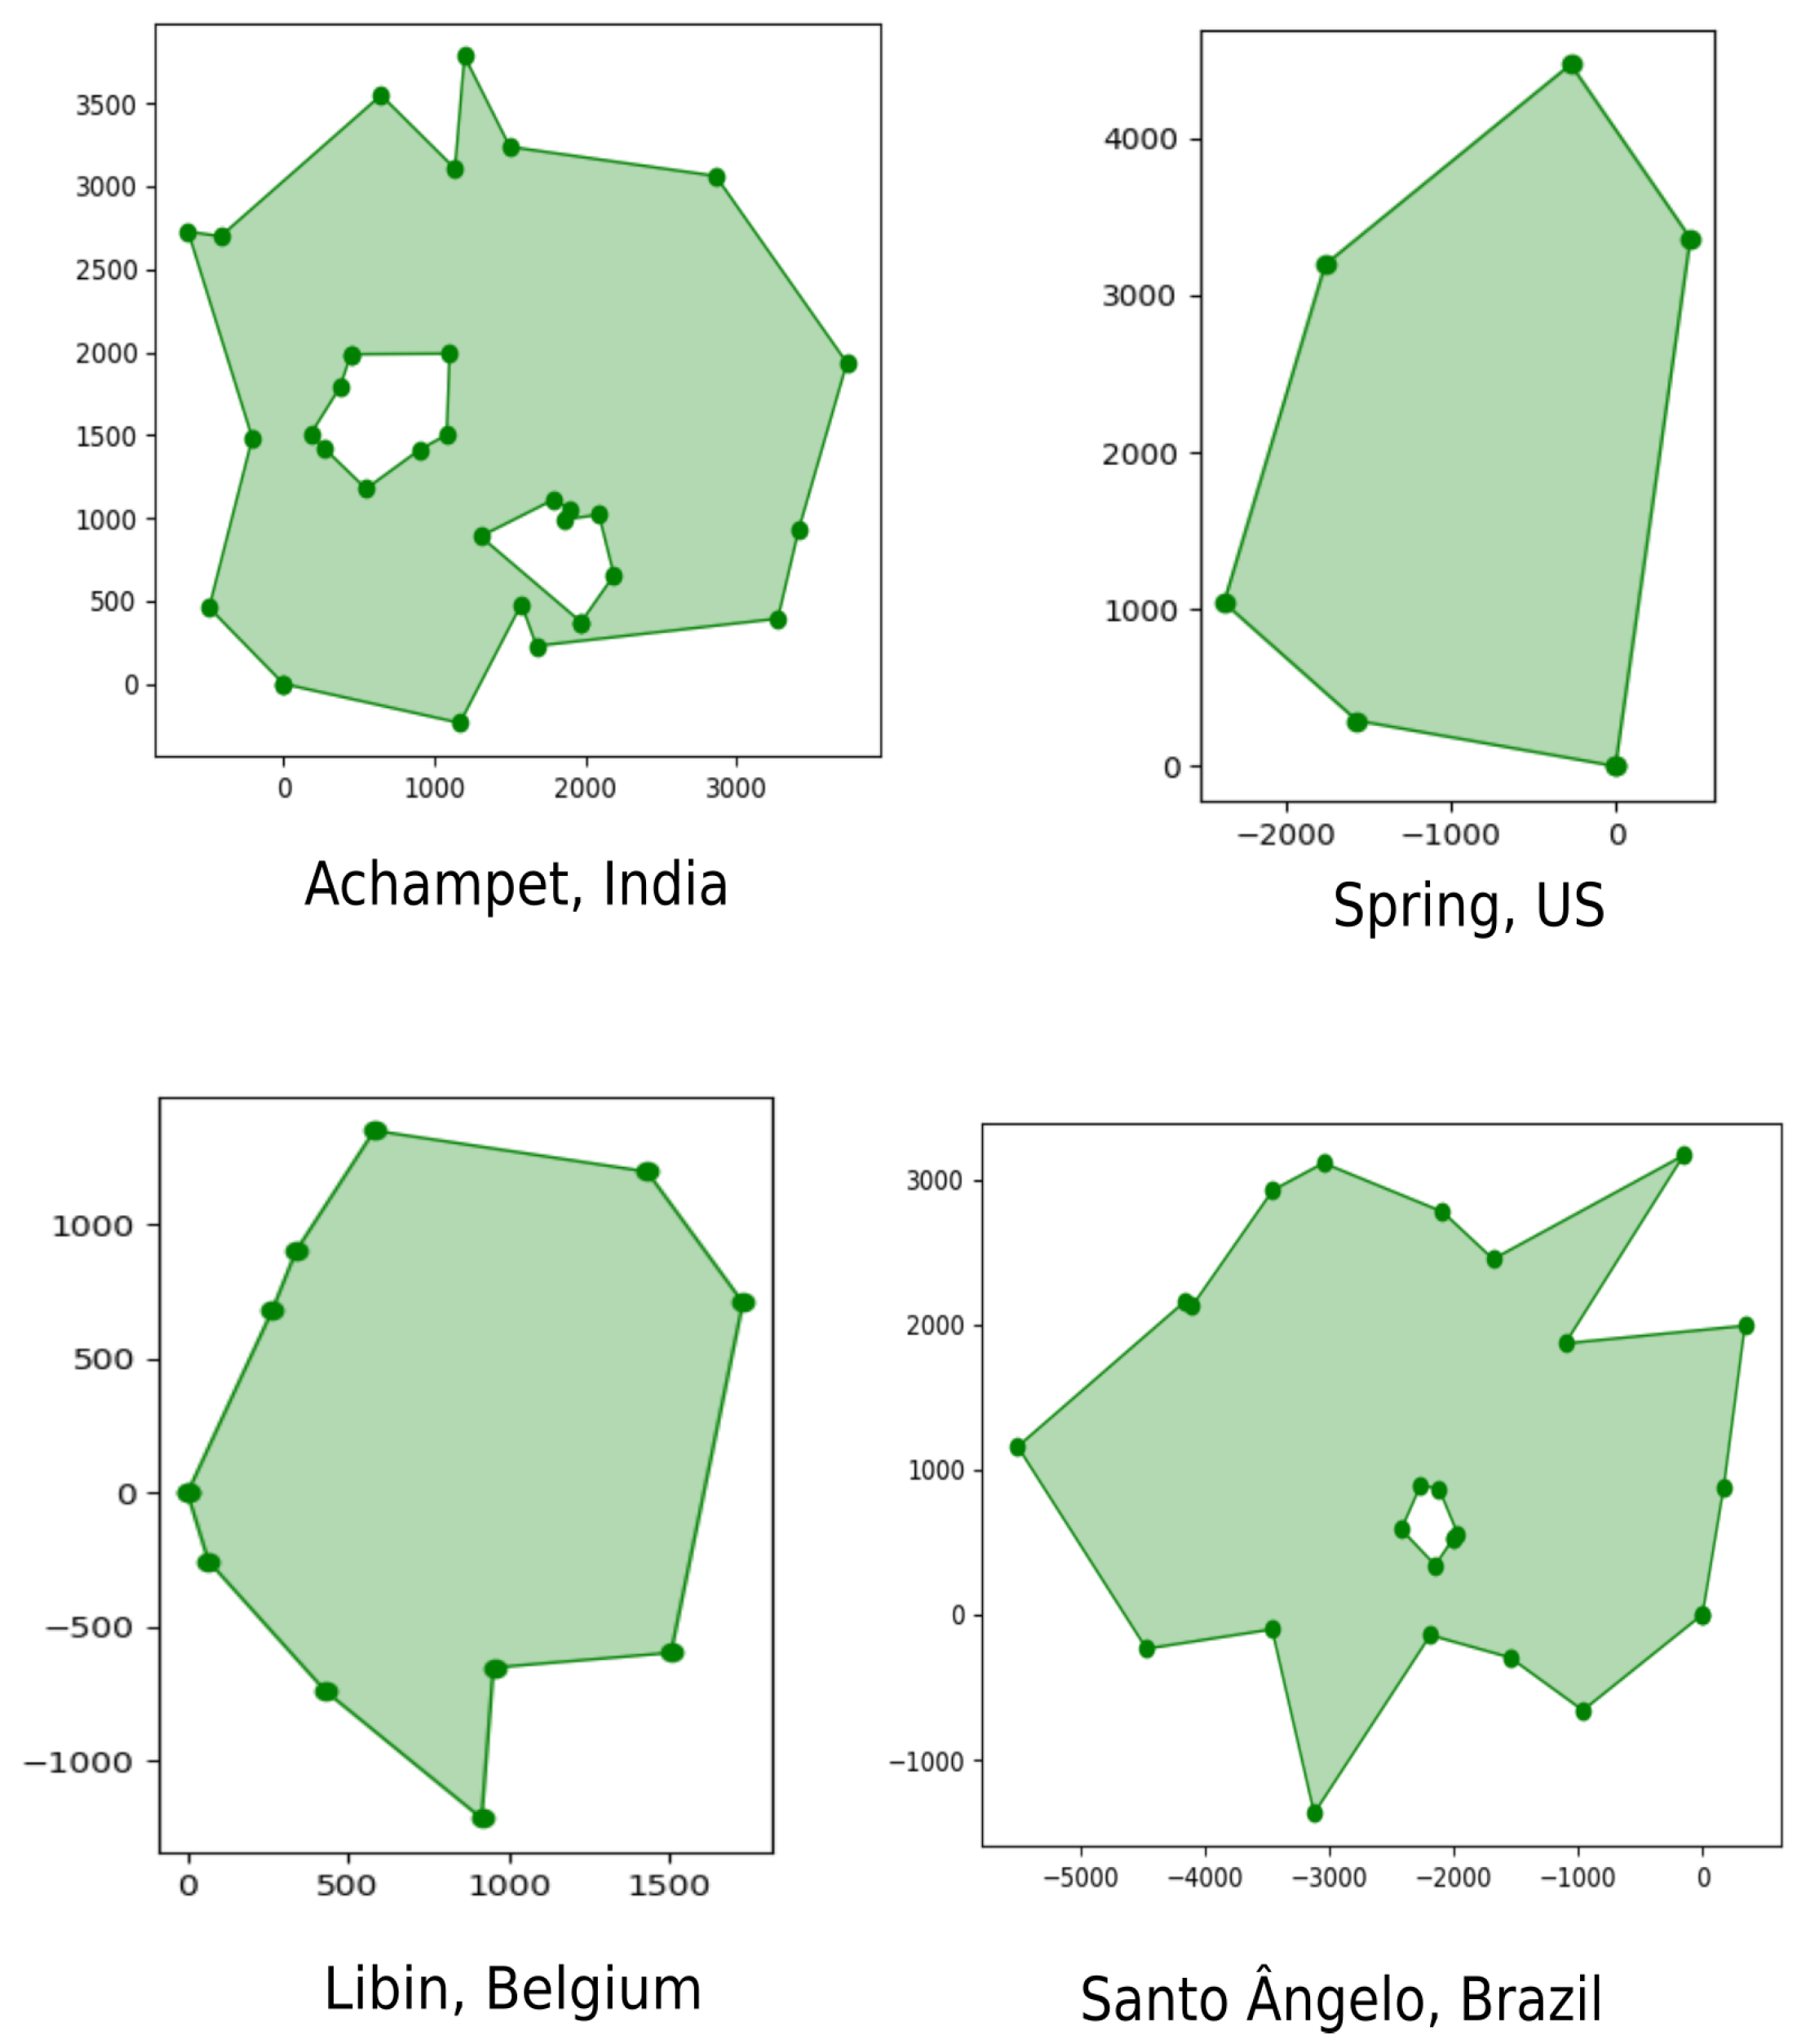
We created ad hoc for this work a dataset of 100 polygons. It is publicly available [43] and contains polygons created from cities all over the world and named accordingly. The polygon names reflect only their geographic location and do not imply any particular characteristics. The areas range from approximately 1.9 to 31.9 km2 and may contain up to four holes.
A global summary of the geometric properties of the polygons is provided in Table 4. The table reports, for both the original polygons and their corresponding convex hulls, the number of polygons, percentage of non-convex polygons, area, compactness, and number of vertices and holes. The original polygons show irregular geometries with a mean compactness of 0.19 and a high percentage of non-convex shapes (95%). Convex hulls remove holes and non-convexity, resulting in a more regular shape that increases compactness to 0.26 but also increases the average area from 11.12 km2 to 12.88 km2. Four representative polygons are depicted in Figure 12.

4.2. Evaluation Setup

To evaluate the effectiveness of the proposed method, a comprehensive series of tests was performed for each stage under a variety of scenarios.
The parameters of the path planning algorithm, the o v e r l a p ratio and the number of rotation angles N, are set to 0.5 and 3, respectively. The flight altitude A G L is computed as described in Equation (3) for a G S D equal to 2 cm/px. We set an additional parameter, the maximum allowable flight altitude, at 120 m, to comply with the current regulation. If A G L exceeds it, the value is truncated.
For partition algorithms, we need to define the area tolerance. This is the difference margin allowed between the requested area and the actual region obtained, and particularly for NPD, the number of Steiner points used to set the triangulation grid size. The default parameter values are 5   ×   10 6 for the tolerance and 30 for the number of Steiner points.
These parameters are used as defined in this section, unless explicitly specified otherwise.

4.3. Homogeneous Fleet Algorithm Validation and Comparison

4.3.1. Algorithm Comparison

We evaluated the performance of our combined methods against the EAMC algorithm proposed in [17], in which a cell decomposition is followed by a solver to compute the multiple set traveling salesman problem. The code is open and the solution works for homogeneous drone fleets. For the comparison, we used Fyli and EAMC scenarios of Section 4.1.1.
The drone model selected for the Fyli scenario is Parrot ANAFI AI. Its corresponding battery model and other physical characteristics were recovered from [44] while the other scenarios preserved their original drone settings that can be found in [38]. We also assume that, for each scenario, all drones take off from the same starting location for the two algorithms.
Table 5 provides the shared configuration parameters applied to the compared algorithms. To ensure a fair comparison, both algorithms were tested under identical conditions: using the same number of drones and equal sweep distances in each scenario, as detailed in Table 5. Additionally, the distance maintained between the flight trajectories and the polygon boundaries, referred to as the lateral offset, was set to 50% of the sweep distance.
Both methods use the rotation operation. The EAMC uses two parameters: the number of rotations applied to the polygon, which is set to 3, and the rotation per cell, with values provided in Table 6. In our method, the number of rotations per segment N, defined in Section 3.3.1 has been set to 3.
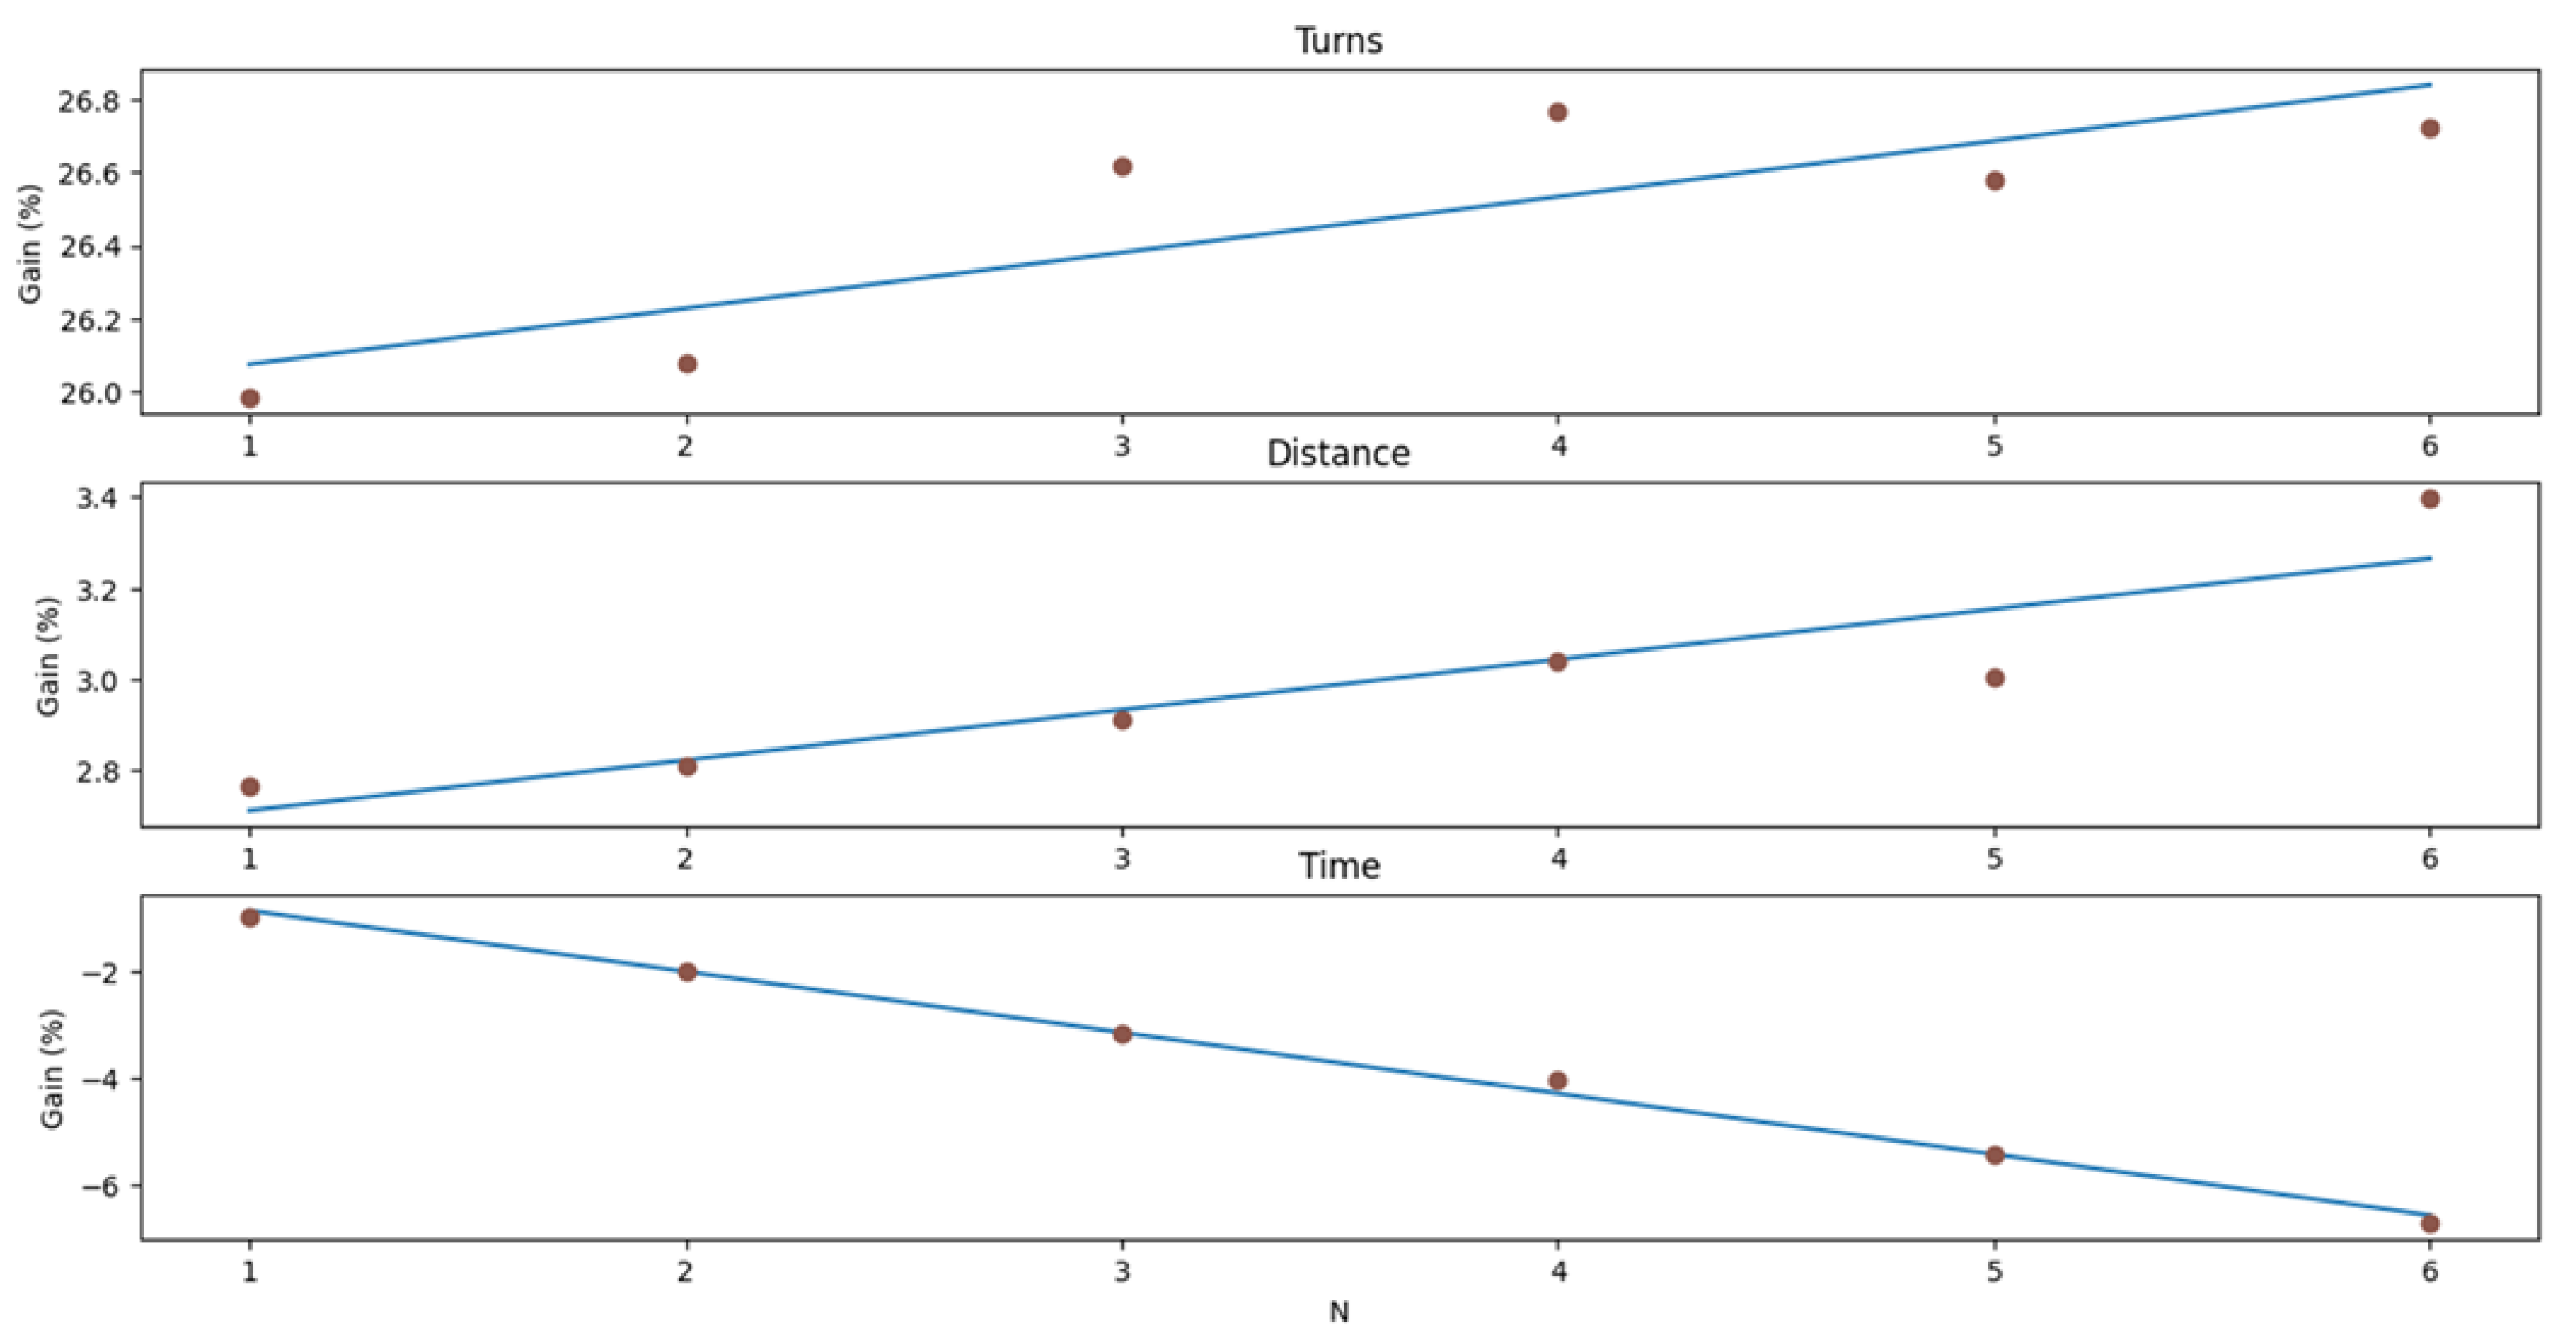
Since execution time increases with the parameter N, smaller values are generally preferred to preserve computational efficiency. However, setting N = 1 aligns the sweeping line with a polygon segment, which significantly limits the search space. To expand the search space while maintaining acceptable execution times, we considered values N { 2 , 3 , 4 } . After summing the trajectory lengths across all six scenarios (Fyli and EAMC scenarios), N = 3 resulted in the shortest total distance of 143,893.37 m, representing a better compromise between N = 2 and N = 4 , which resulted in total distances of 144,318.27 m and 144,016.09 m, respectively.
An additional analysis extends the test to six different values of N, computing the average gains for these six scenarios in terms of turns, distance, and time relative to the baseline values obtained for N = 0 . Here, N = 0 corresponds to the case where no rotations were performed. Figure 13 illustrates the points representing these gains as a function of N, along with a first-degree linear regression curve.
The gains in turns for N = 3 and N = 4 are higher than the regression line, making them strong candidates for the Fyli and EAMC scenarios. However, when considering time efficiency, N = 4 incurs a higher execution time, reflected by a negative gain, whereas N = 3 results in a smaller time loss, making the latter the more favorable option overall and supporting the decision to adopt N = 3 .
For the decomposition algorithm, EAMC uses Boustrophedon decomposition, and we use NPD with the balanced approach.
Additional configuration options related to the algorithms and their implementation are summarized in Table 6. They were adjusted for convenience to the shape and size of the original polygon.
The results of the two algorithms are summarized in Table 7. Each line has the result of one of the scenarios. On the left are the results of the EAMC and on the right are the results of our method. For EAMC, we computed the number of turns and the flight distance for comparison. Our method also provides flight time and coverage percentage as quality metrics.
The best metric values have been emphasized (italic) for easy identification. The number of turns in all but two scenarios is higher for EAMC, and the proposed algorithm consistently yields shorter flight distances compared to the benchmark algorithm. In the island scenario, the only one where the flight distance is higher in our method, only one drone is used without any decomposition. Since the polygon contains a hole, the trajectory must navigate around it, resulting in a longer travel distance. The area coverage metric, not given in EAMC, is consistently near-complete or fully achieved by our method. The time to end the mission is between a minute and 25 min, depending on the size of the area and the number of drones used, but very good for an emergency response and situational awareness construction.

4.3.2. Distance Reduction Validation

To validate our assumption regarding the reduction in flight distance compared to EAMC, we performed a series of t-tests across various scenarios. These scenarios involved areas selected from our set of 100 polygons presented in Section 4.1.2 and four different fleet sizes, where f l e e t { 5 , 10 , 15 , 20 } . Each t-test was conducted independently for a given fleet size. Each fleet consists exclusively of the Parrot ANAFI AI drone model, whose specifications are detailed in Table 1. From the combinations of ( P o l y g o n i , f l e e t j ) , where 1 i 100 and 1 j 4 , we retained only those cases in which the entire area was completely covered by the drone fleet.
For these valid cases, we computed and compared the trajectories generated by both the EAMC algorithm and our proposed method. The configuration parameters for both algorithms were similar to those used in the Fyli setup, with the exception of the sweeping distance, which was calculated using Equation (4). Consequently, the lateral offset, set to half the sweeping distance, was also adjusted accordingly.
The Steiner points S P , used by our algorithm, were calculated using Equation (16) to adjust their number to the size of the polygon P o l y g o n that will be partitioned.
S P = A r e a ( P o l y g o n ) / H F P
The paired samples t-test was used to analyze the differences in lengths between the trajectories generated by the two algorithms for the same polygons. These differences follow a normal distribution, satisfying the assumptions required for a t-test. Table 8 presents the number of polygons that were fully covered and included in each t-test, along with the results of the normality tests, t-tests, and the corresponding confidence intervals. It also reports the mean trajectory length improvements for each fleet configuration.
The p-values from the normality tests for each fleet were all above 0.05, indicating that the differences in trajectory lengths were approximately normally distributed. The p-values from the paired t-tests were all below 0.05, revealing a statistically significant difference in the mean trajectory lengths produced by the two algorithms. Additionally, the negative confidence intervals confirm that our algorithm consistently generated shorter trajectories than the EAMC algorithm.
The mean distance gain represents the average improvement in the distances traveled by the drone fleet when using our method compared to the EAMC approach. This metric highlights enhanced route planning efficiency, resulting in shorter or more optimal paths with gains of up to 9.31% (10 UAVs). Even a small gain, such as 0.37% (20 UAVs), indicates a marginal but measurable improvement in travel distance.

4.4. Heterogeneous Fleet Performance Analysis

We perform further analysis using the 100 polygons presented in Section 4.1.2. From each polygon, four scenarios were created with random fleets selected from the drone dataset in Table 1 and an increasing number of vehicles (5, 10, 15, and 20 drones). The fleets were positioned outside the polygon borders, ensuring consistency with operational constraints.
The results for the heterogeneous fleets present the partial results of each of the three steps of the method, followed by an analysis of the algorithm’s computational complexity.

4.4.1. Area Requirements Calculation

Before the area partition, the range of the drones is conveniently updated to ensure that drones will be able to reach the polygon and return to the base independently of the assigned area. G S D is set to 2 cm/px and the sweep line distance ( S D ) and the capture distance ( C D ) are calculated for each drone. With all of this data, the maximum surface area that each drone could fly is calculated.
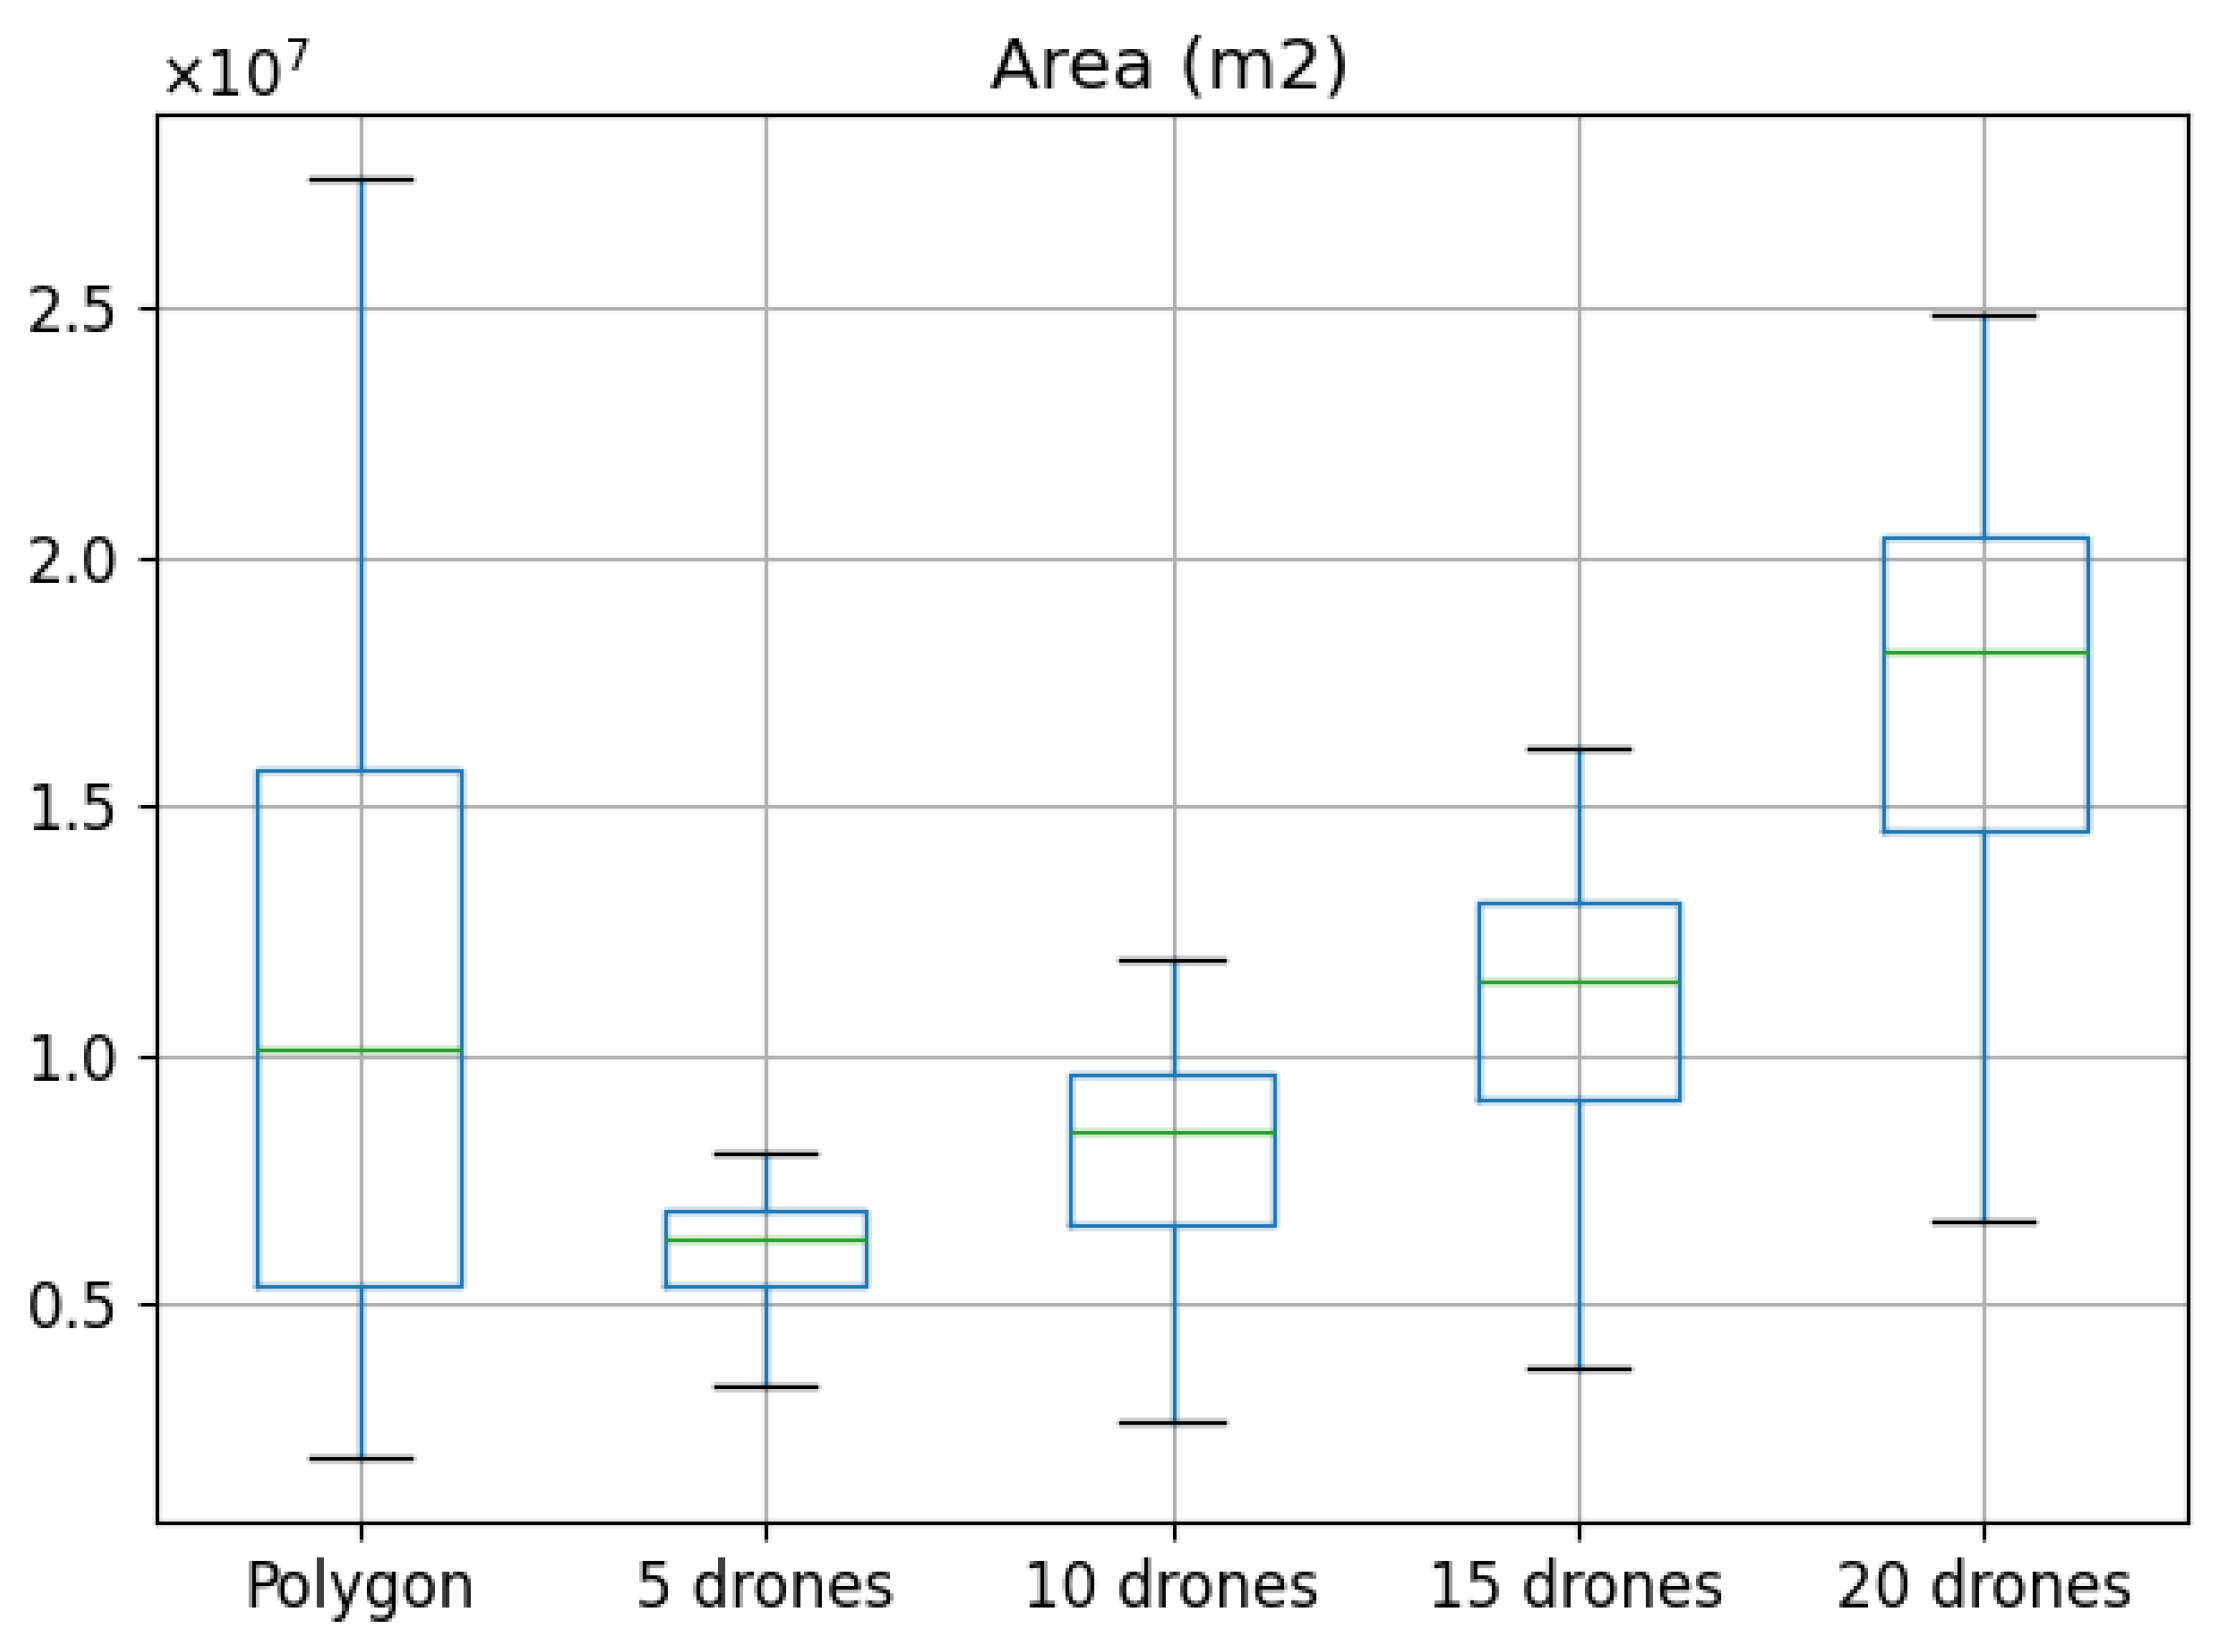
The plot in Figure 14 shows the box plots of the total area of the polygons and the total area that each fleet of small drones can cover. Observe that there are some scenarios where the area that a fleet can cover is lower than the area of the polygon, especially for the fleets with fewer drones.
In consequence, a number of the generated scenarios have insufficient resources to cover the area. Table 9 shows them per fleet size. Observe that, in general, the fleets of 5 to 10 drones cannot handle the coverage of more than half of the areas generated. Even for the largest fleet size, with 20 drones, almost one third will fail.

4.4.2. Partition Algorithm Comparison

We tested three split algorithms, PODE [32], NPD [39], and PDAN [33] and calculated the ability of each to perform the best area assignment. We also evaluate the benefits of applying the balanced strategy.
Figure 15 shows the distribution of the area coverage (in percentage) for each of the three algorithms and for each of the four sizes of the fleets. For all algorithms, the first quartile of the area coverage increases as the number of drones increases, but NPD is the one where better coverage is obtained when the number of partitions grows. On the contrary, PDAN has the worst results, as expected given the increase in the convex hull area.
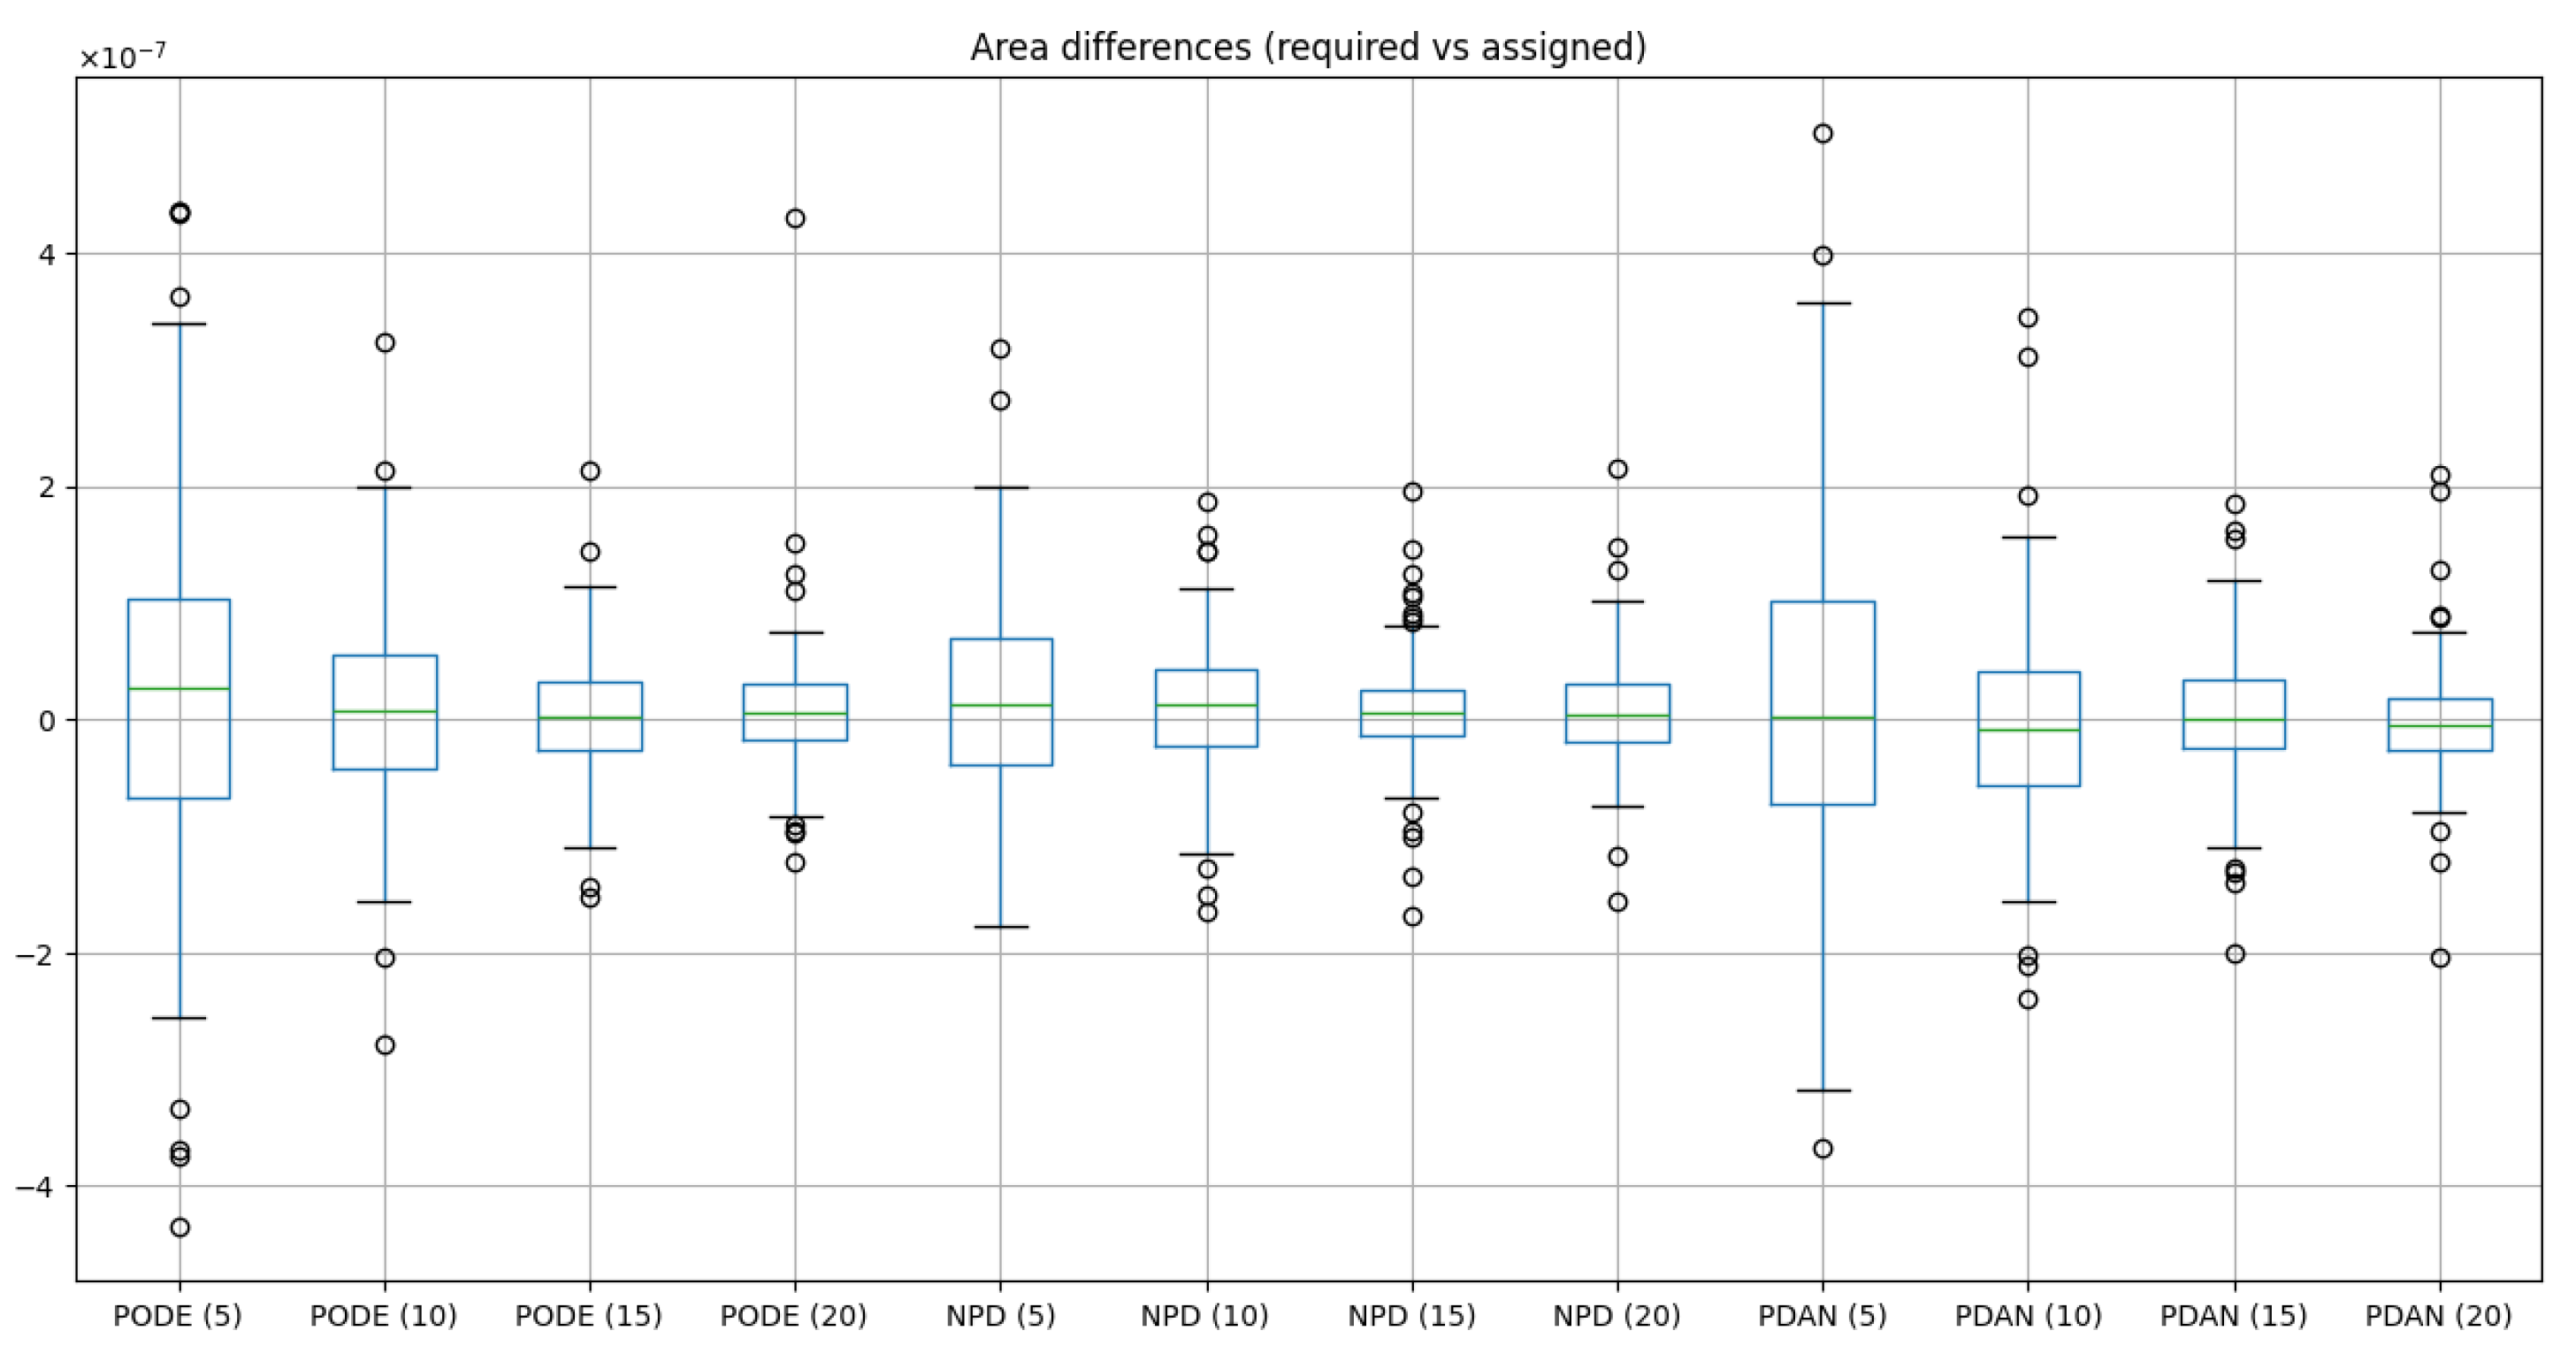
To further analyze the algorithms quality, Figure 16 shows the differences between the area distribution entered as a requirement to the split algorithm and the final area assigned to each drone. Results are given as box plots per algorithm and per fleet size.
Observe that the medians are zero or very close to zero, which shows the good quality of all the heterogeneous split algorithms. We can also observe that the distribution of the values of the differences is smaller as the number of drones increases, because the choices of the algorithm also increase. By comparing the amplitude of the box plots and the number of outliers, we can conclude that NPD is the best algorithm when adjusting the area requirements with the assigned area.
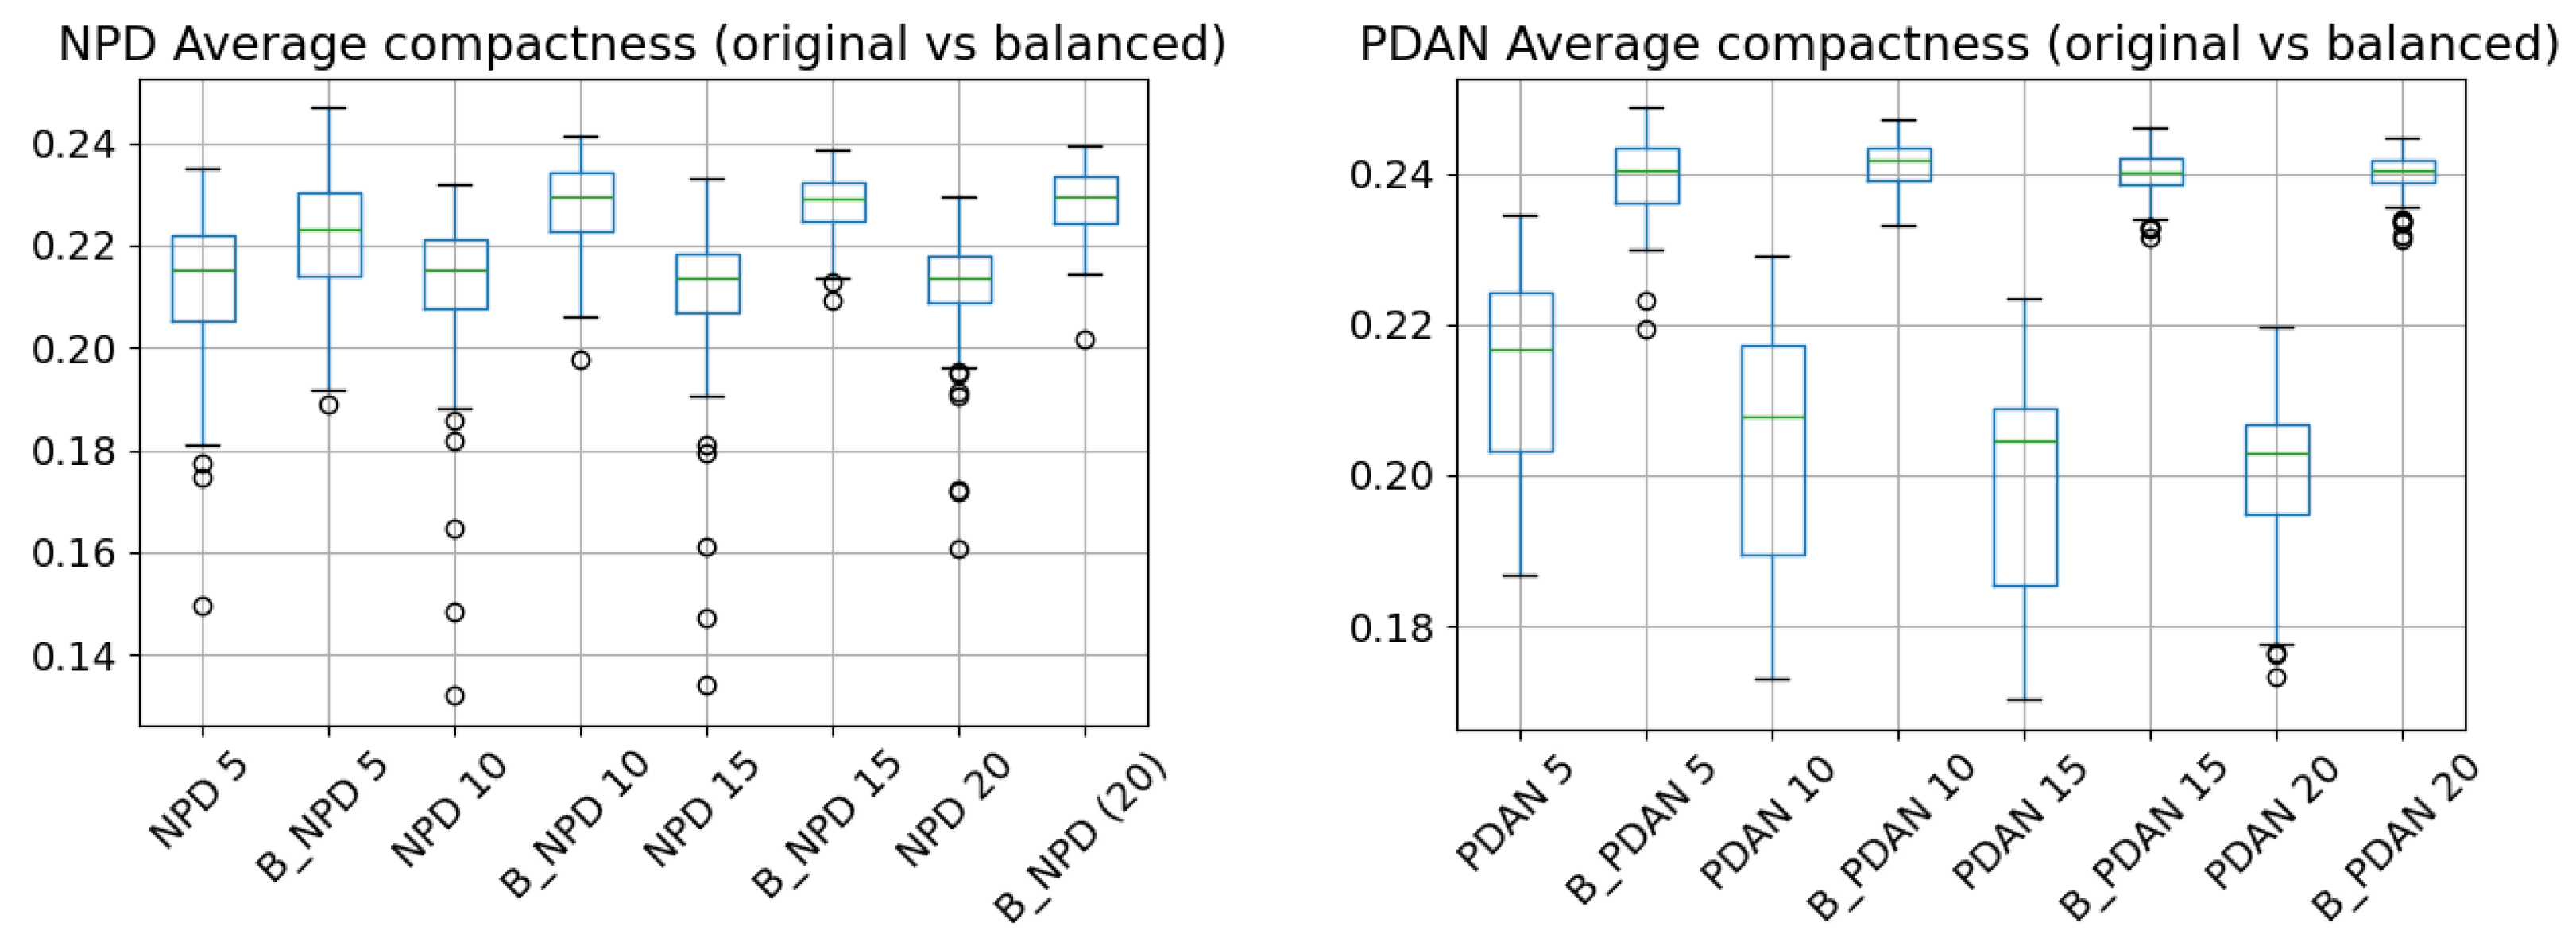
Next, we evaluate the balanced strategy presented in Section 3.2 showing the results of compactness for two of the three algorithms. Figure 17 shows side-by-side the compactness box plots obtained by the original (NPD and PDAN) and the balanced split (B_NPD and B_PDAN). On the left for NPD and on the right for PDAN, and detailed per fleet sizes. Looking at the differences, we observe that the balanced strategy always increases compactness. The balanced strategy also obtains significantly fewer negative outliers (those with very low compactness). The strategy applied to the PDAN algorithm has even more positive effects with compactness medians growing from 0.21 to 0.24 . In consequence, the rest of the results of the section use the balanced strategy in NPD and PDAN.
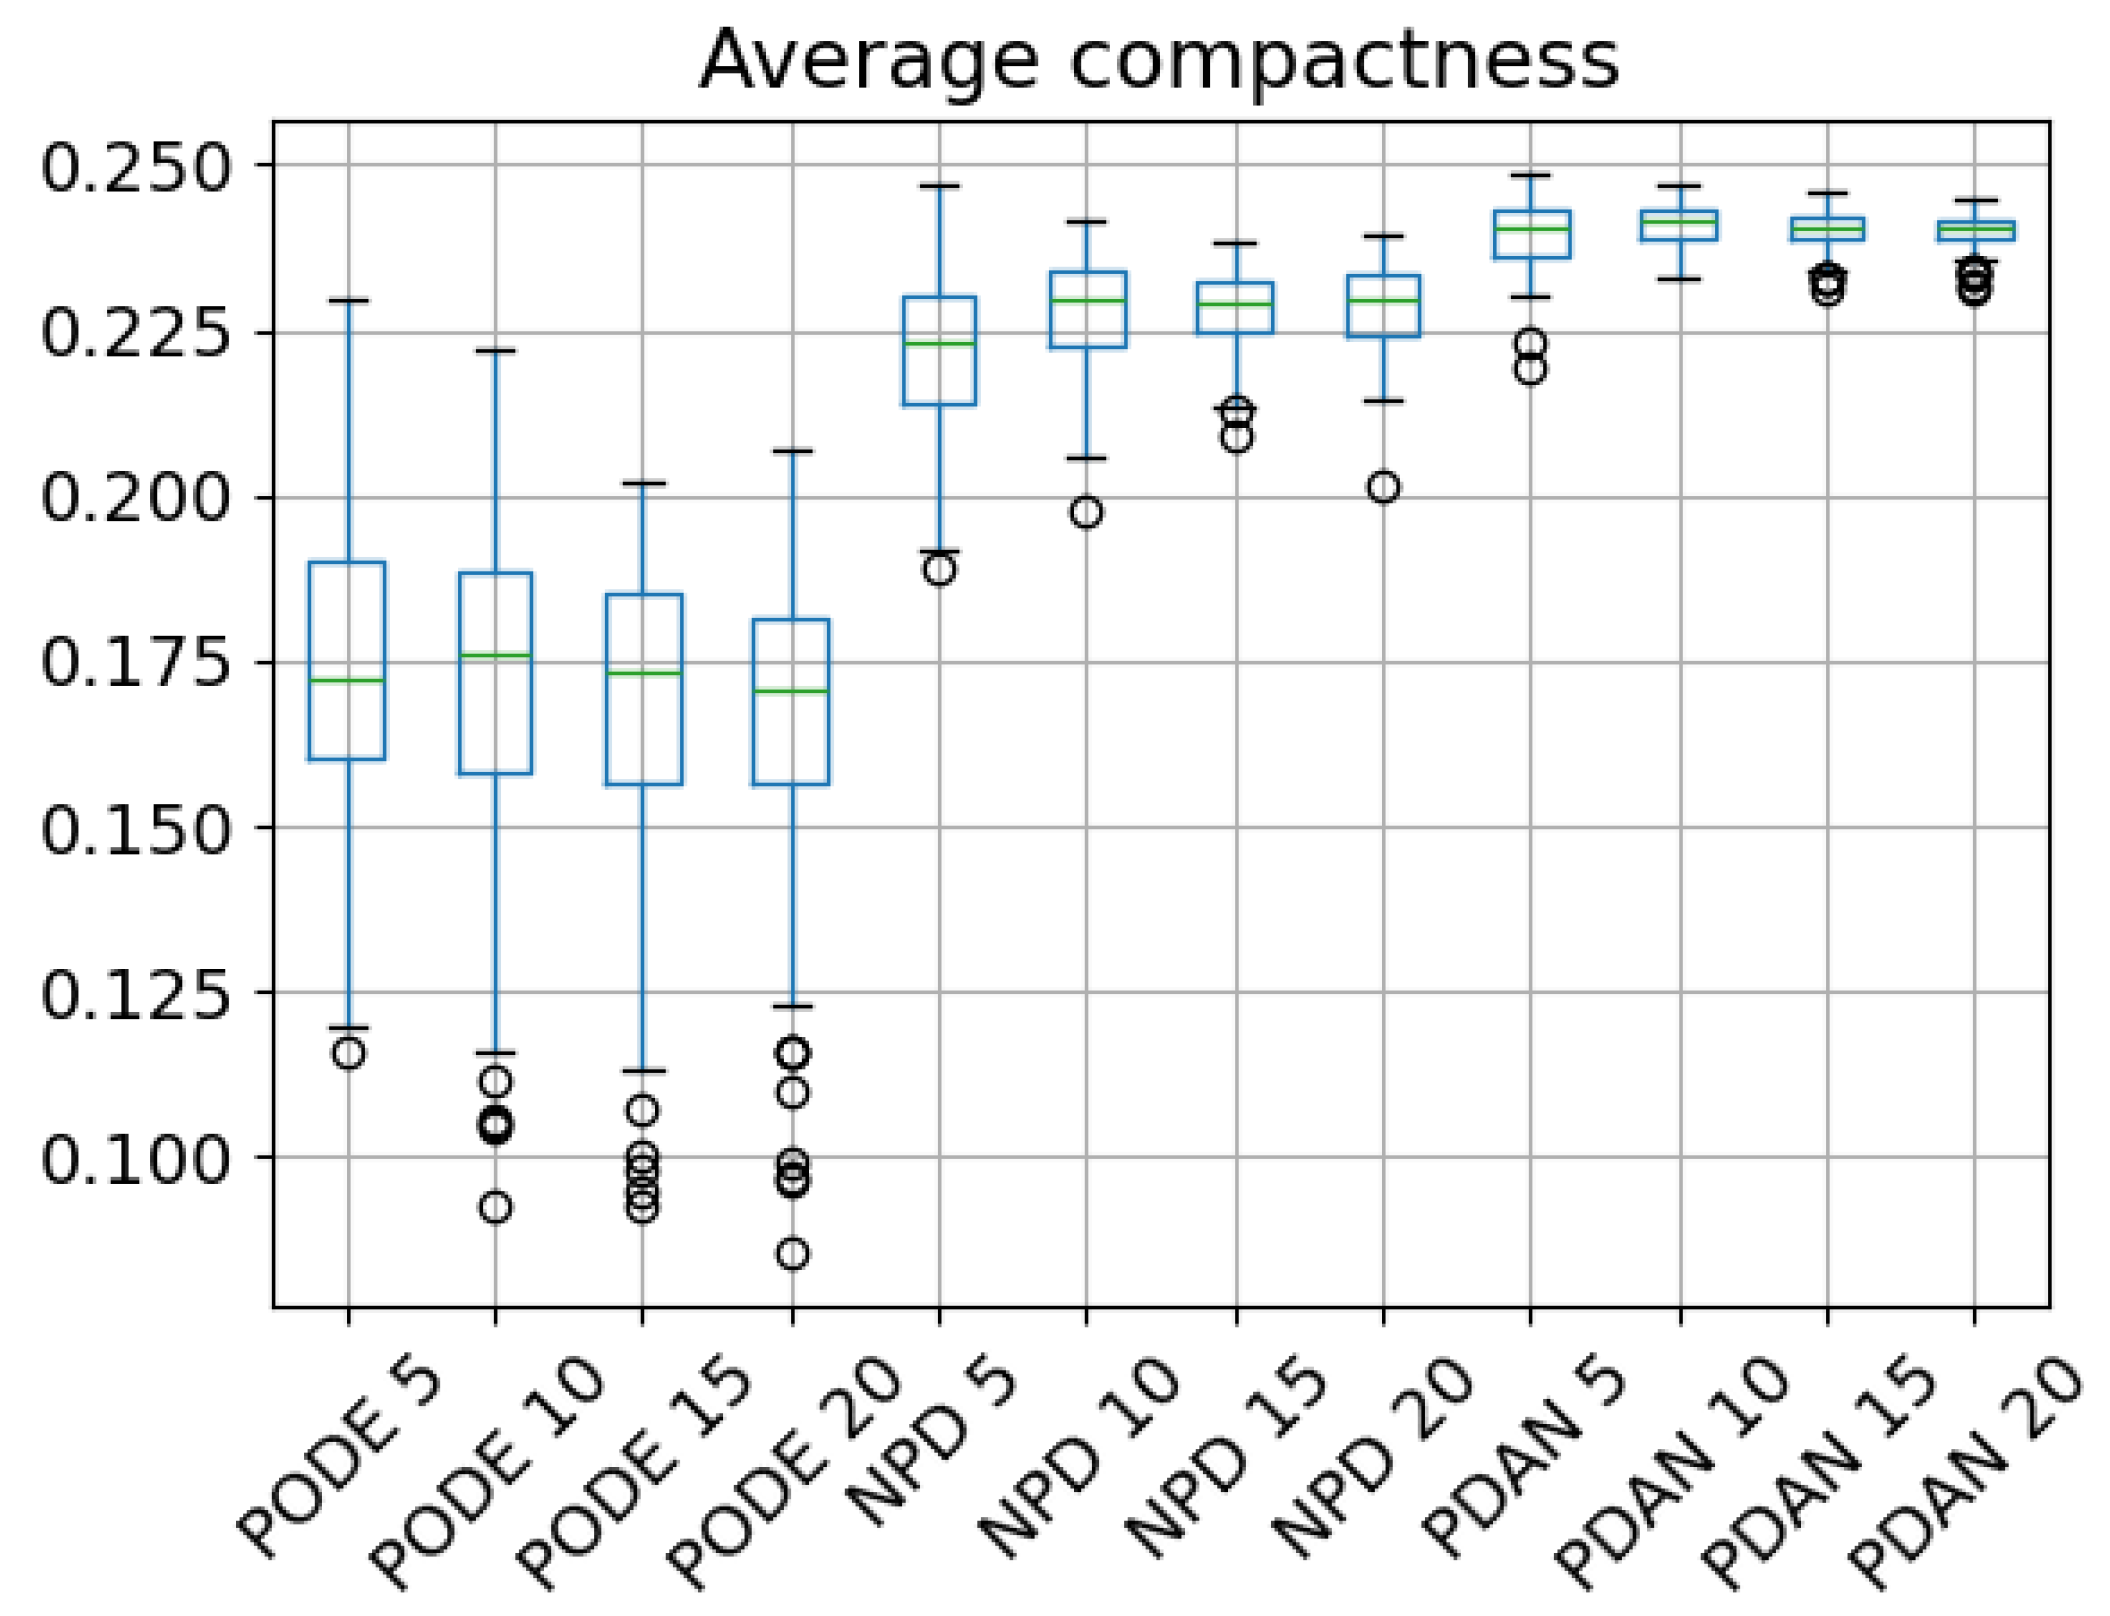
Figure 18 shows the final results of the three partition algorithms tested, with the average compactness of the regions. The plot is a box plot showing quartiles, outliers and median, and is organized by algorithm and per fleet size. Observe that the PODE shows the worst compactness, while PDAN has the best, at the cost of flying a greater area than strictly needed.

4.4.3. Trajectory Generation Metrics

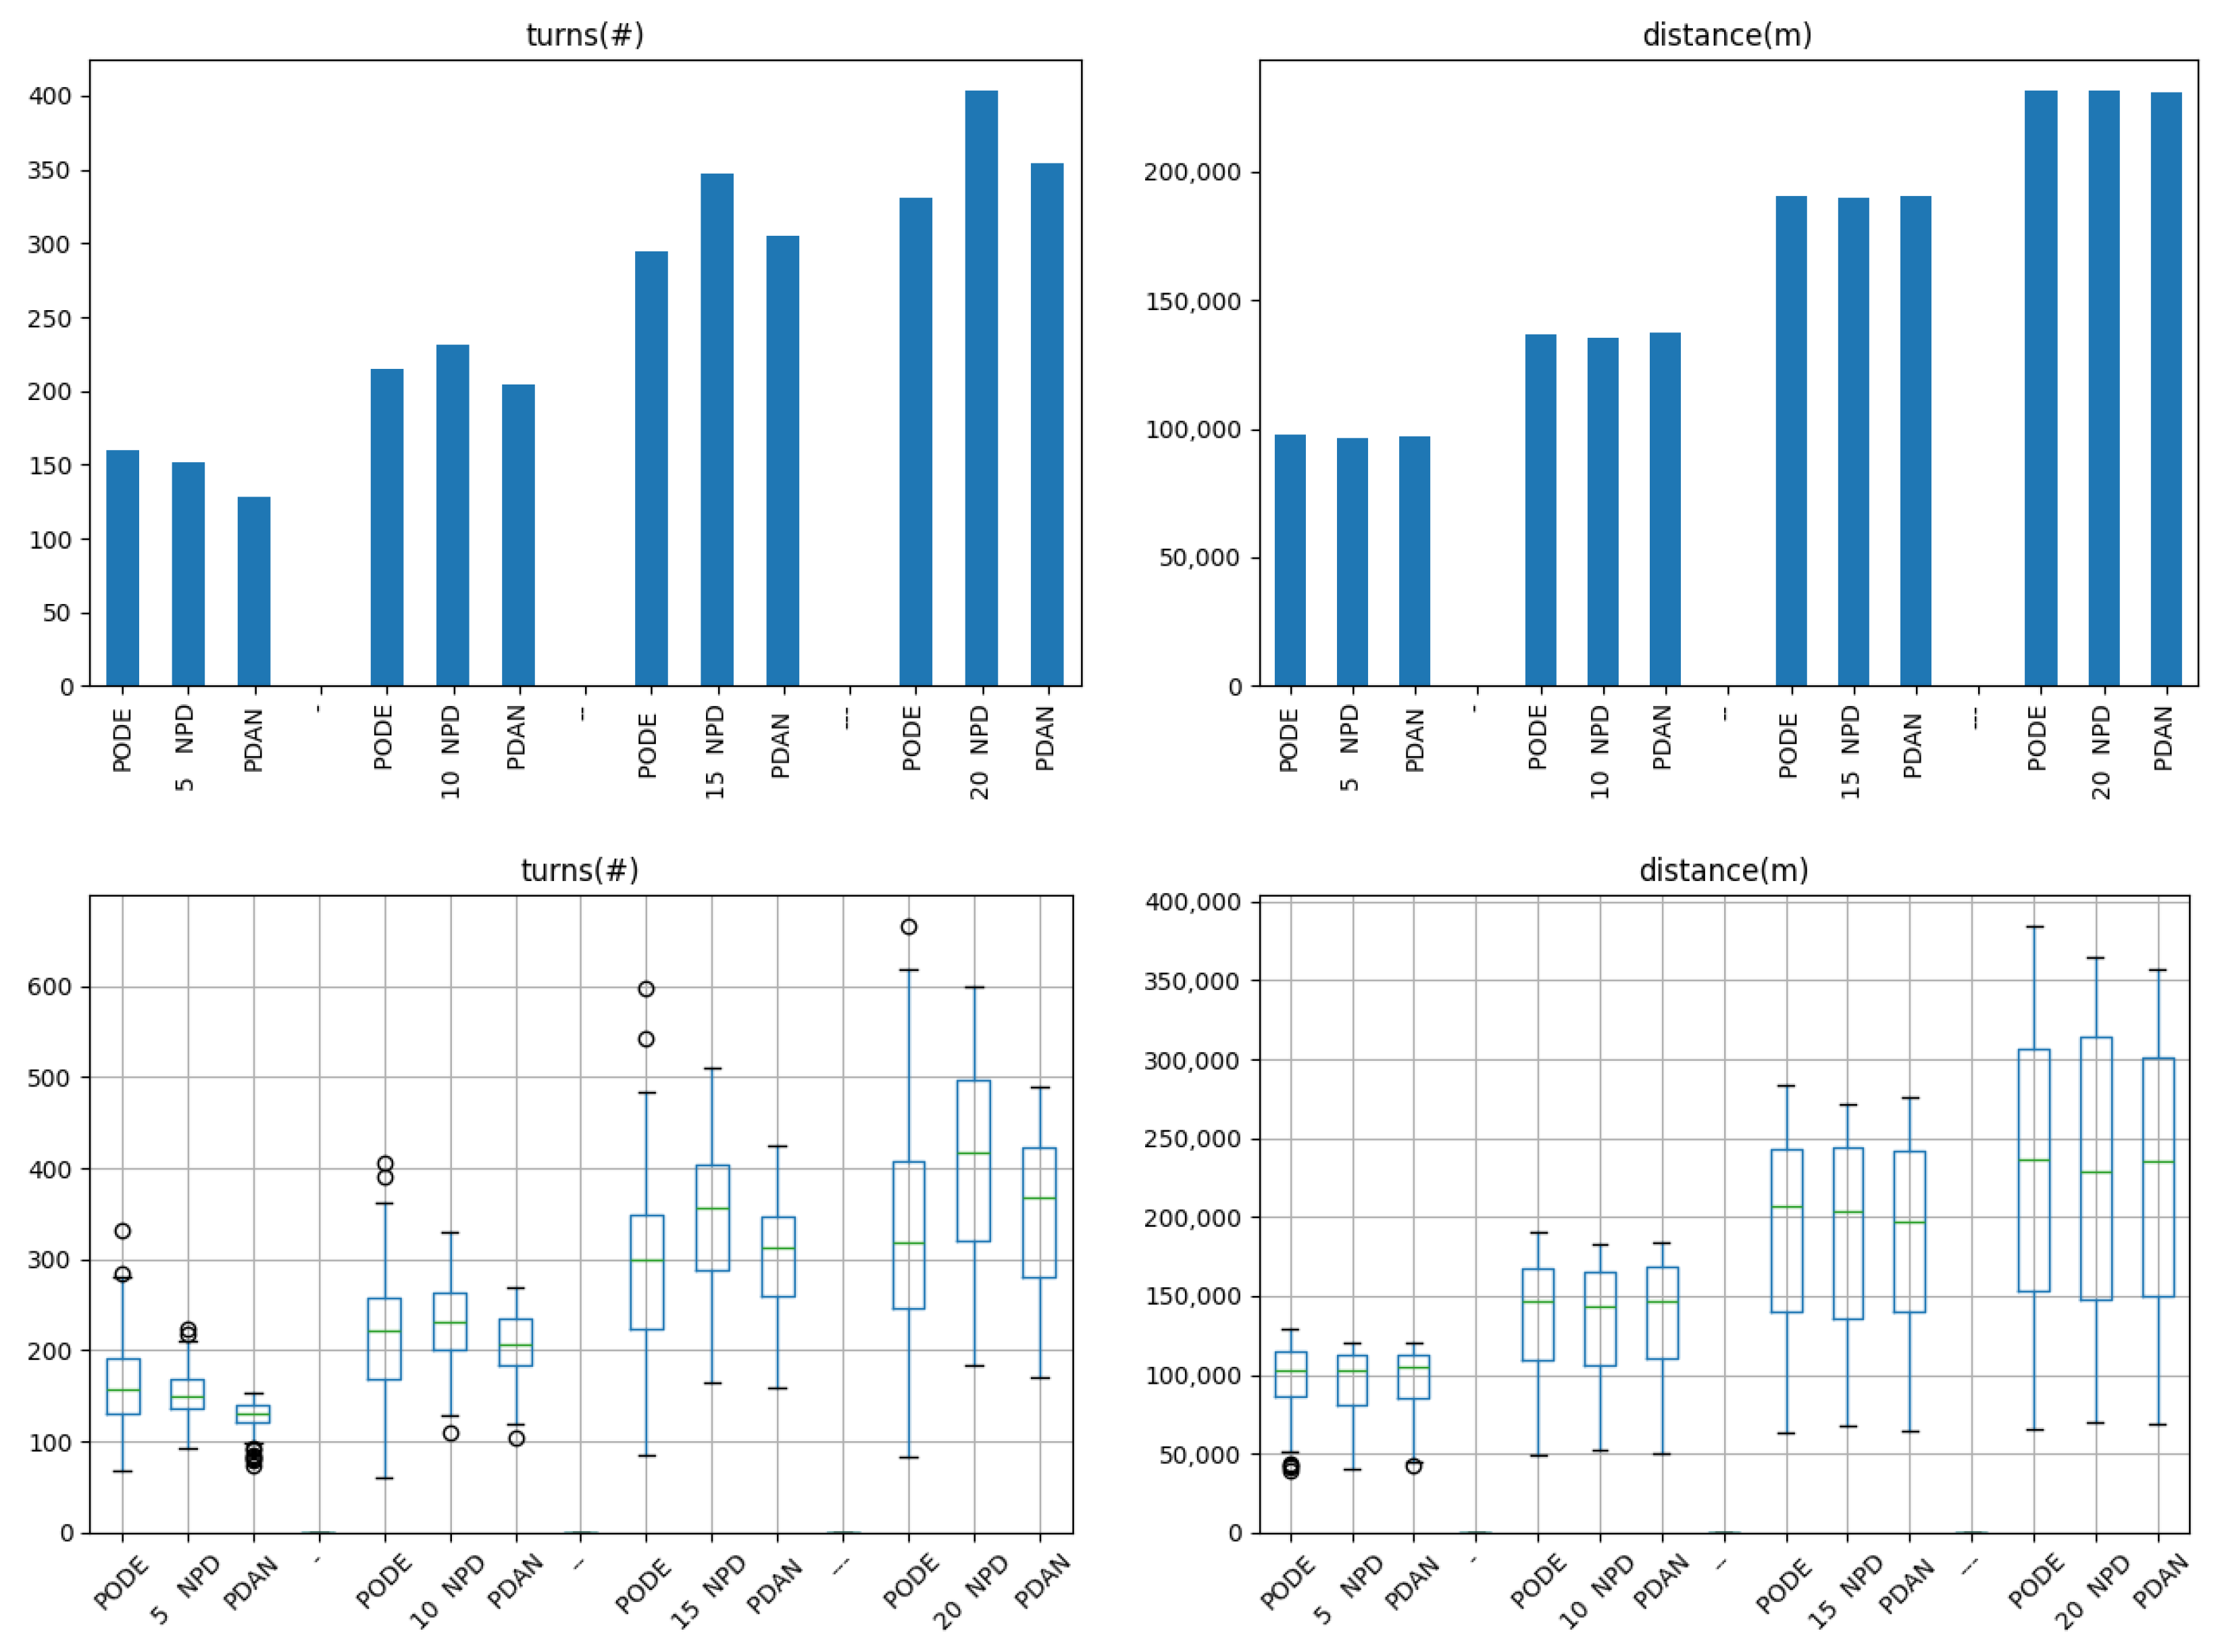
We measured the number of turns and the total distance to flight as defined in Section 3.4 for all algorithms and all fleet sizes. Figure 19 shows the number of turns (left) and the distance to flight (right) as average (top) and box plots (bottom). We observe that both turns and total distance grow as the number of drones increases and that the best algorithm again is PDAN despite the increase in the total area to cover of the convex hull.
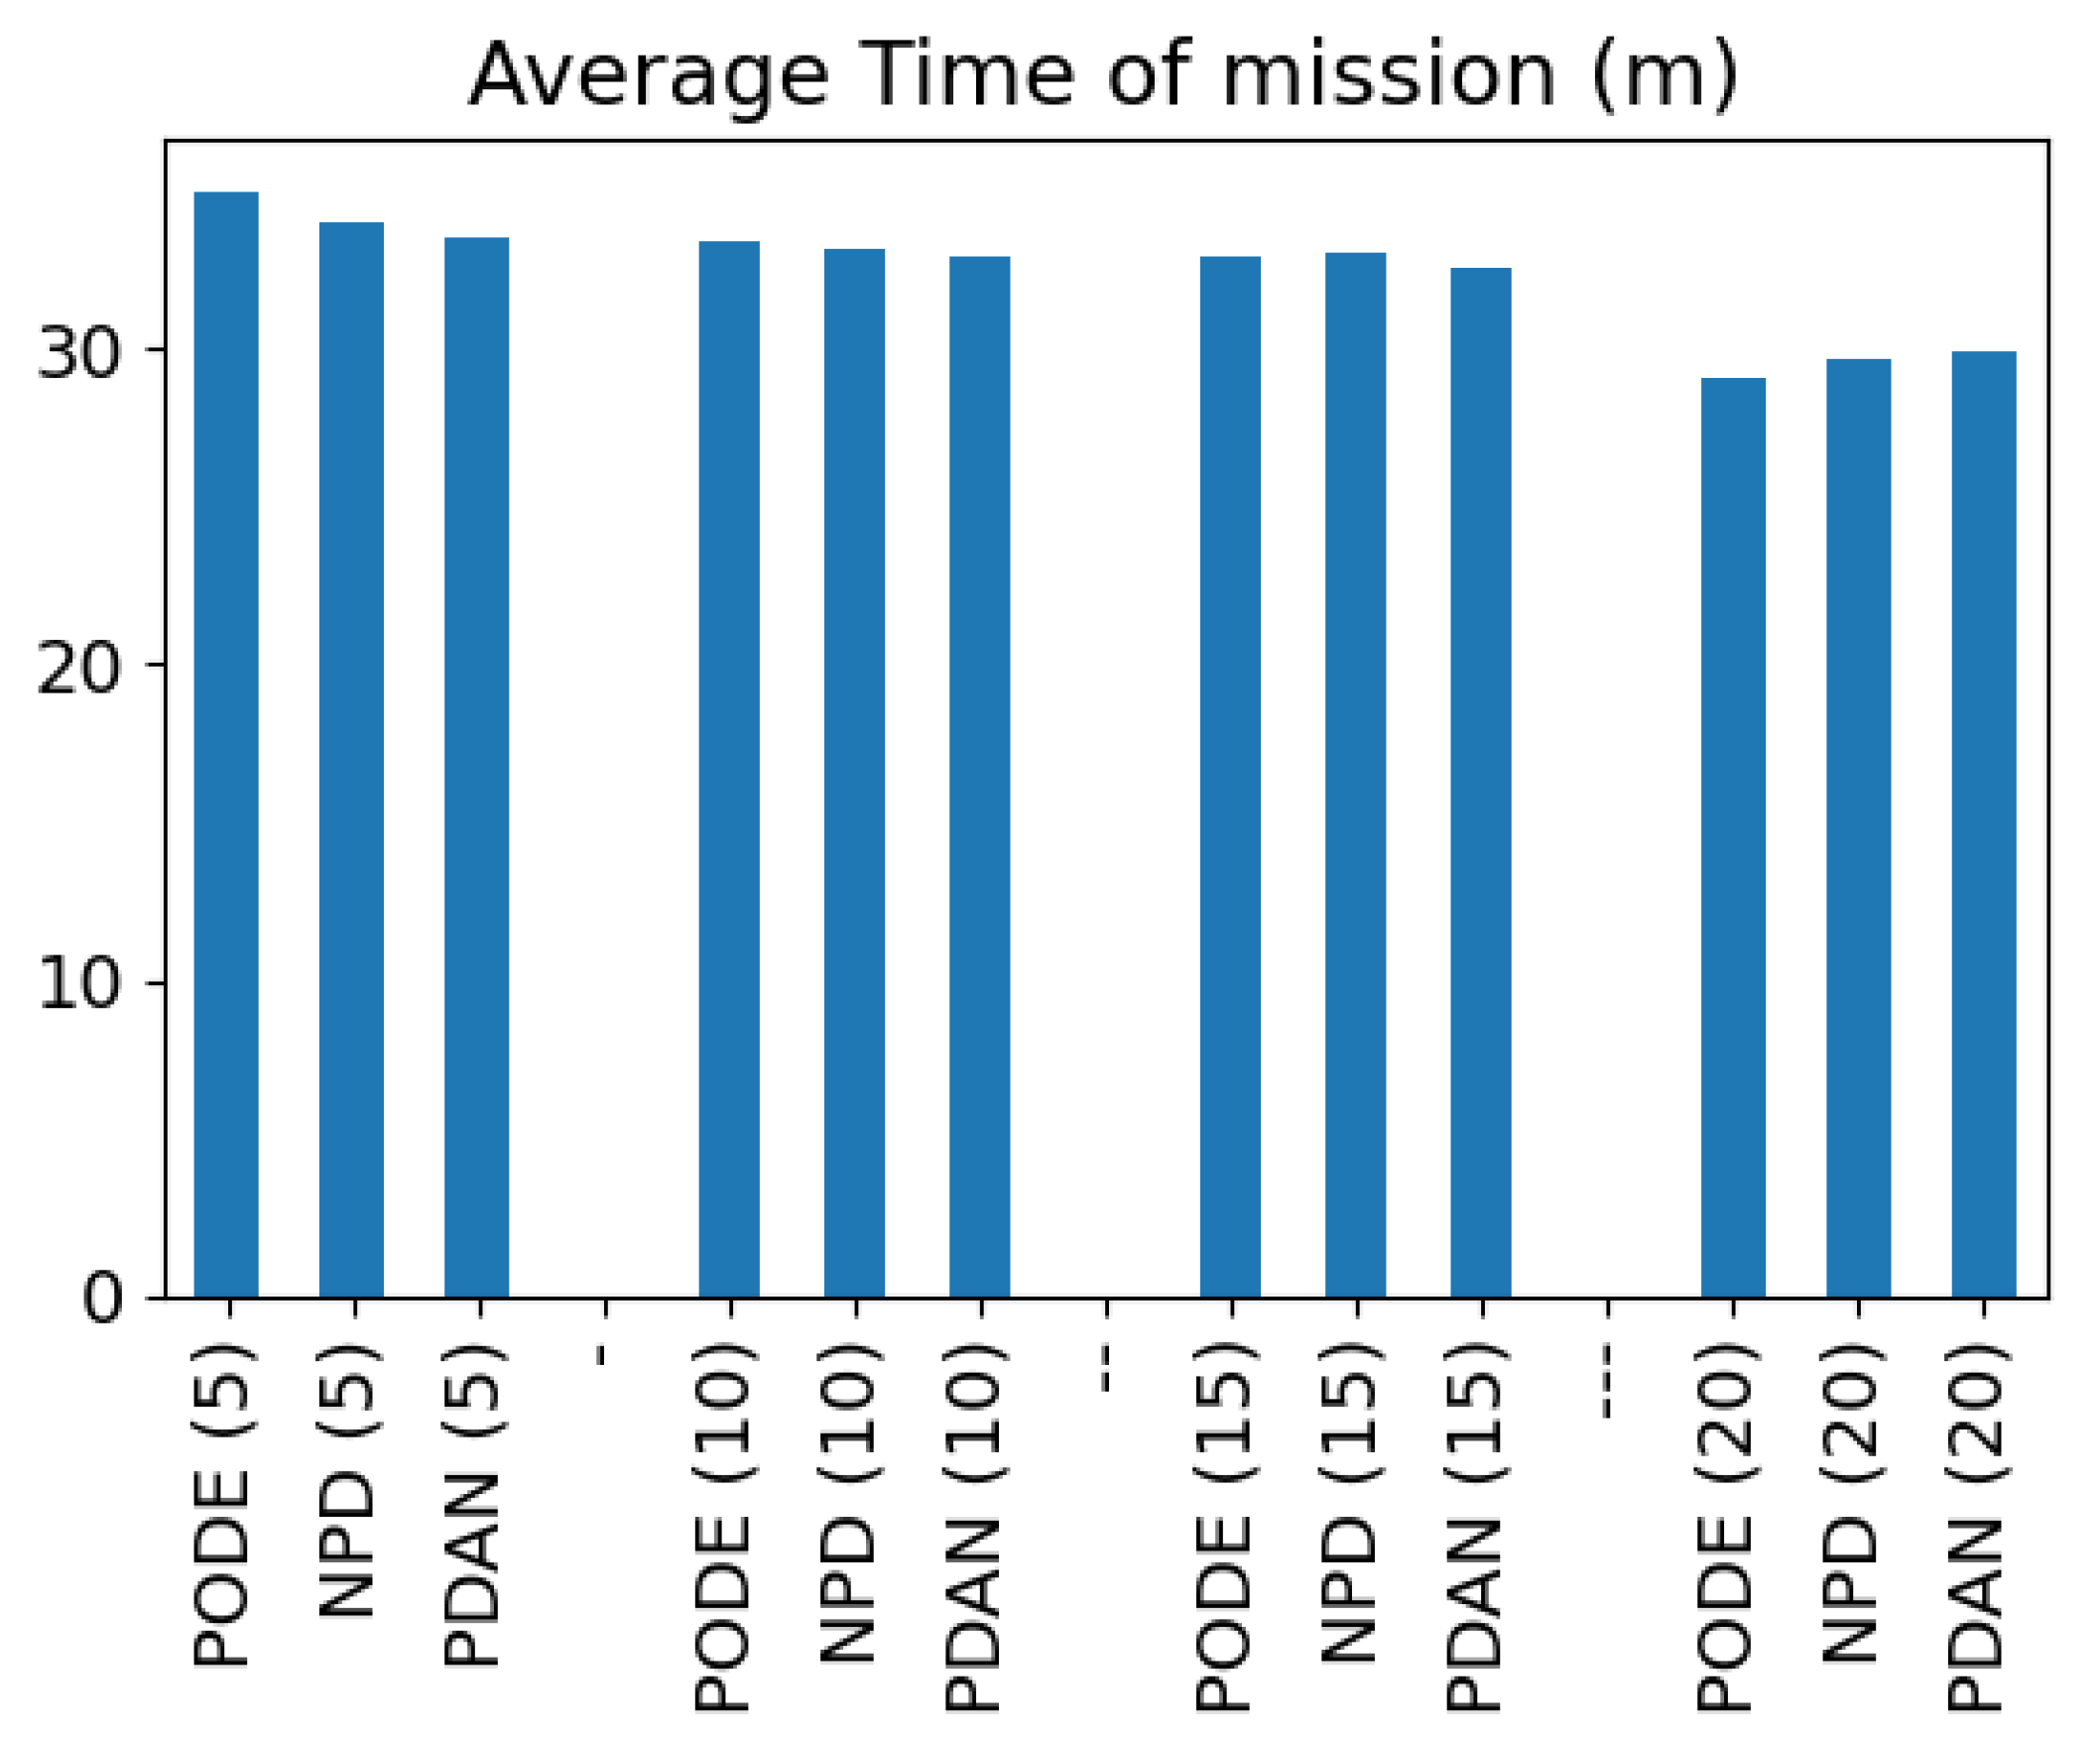
But the most important result from the perspective of the end users, who need to have situational awareness as fast as possible of the emergency area, is the total mission time as shown in Equation (10) which measures the flight time from the departure of the first drone until the landing of the last drone. Figure 20 shows the average for the 100 polygons of the total mission time detailed by partition algorithm and grouped by fleet size. Observe that PDAN generally provides faster flight times, although the differences are not very significant.
It is worth noting that the time reduction when using four times more resources is clearly below expectations (increasing the fleet from 5 to 20 drones gives only 15 % time reduction). We further analyzed the time distribution of each scenario by dividing the time to go towards the region of the polygon to be covered, the time to fly a scan pattern over the region and the time to return to base once the region is covered.
Figure 21 shows the mission time for each flight phase per algorithm and per fleet size. The behavior for the three algorithms is the same: the times to route to and to get back from the region are practically constant through the different fleet sizes, while the scan time is the only part that decreases. Note that the time minutes in this plot are all lower than those in Figure 20. The reason is that in this plot we calculate the average of all drones, while in the other the total mission time is calculated using the time of the slowest drone.
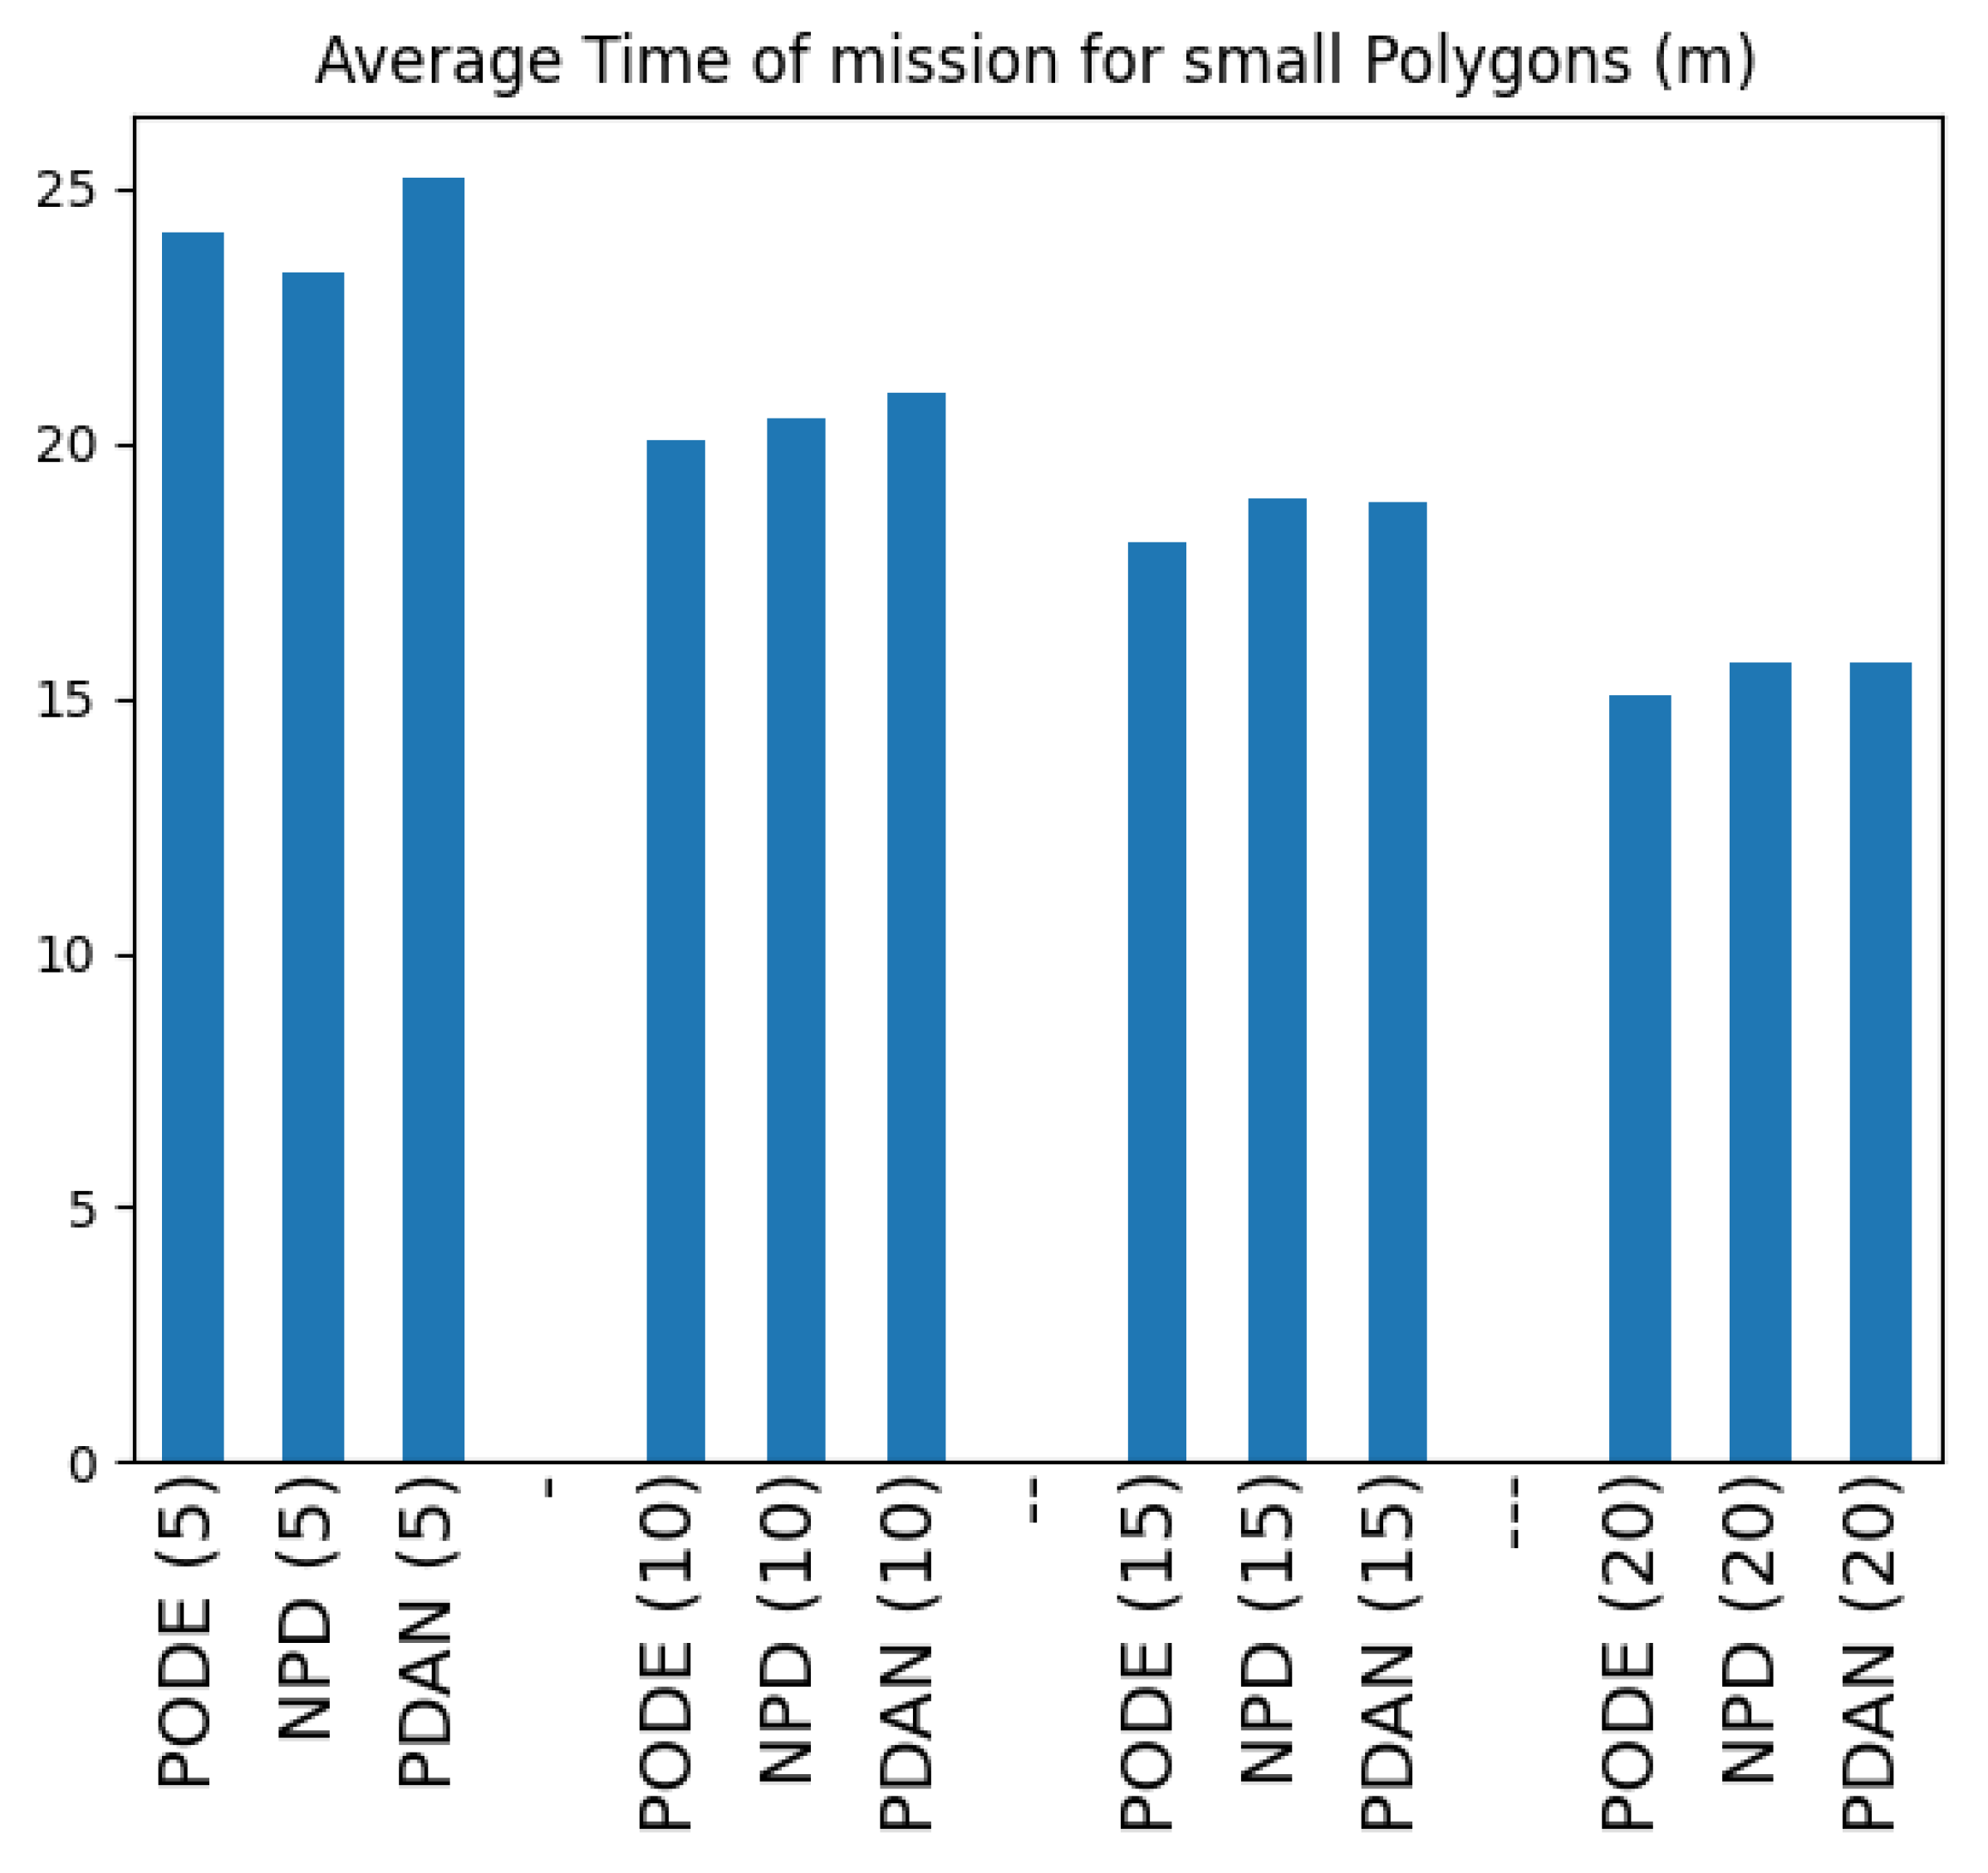
Finally, we present the mission time results considering only those scenarios in which the fleet has the capacity to cover the full area. Refer to Table 9 to see that this subset represents almost half of the scenarios: From the original 100 polygons, only 29 polygons can be covered by the fleet of five drones, while 73 by the fleet of 20 drones. Evaluating only these polygons, we can observe (see Figure 22) that the time reduction of the full mission is more appreciable with the introduction of new resources.

4.4.4. Computational Performance

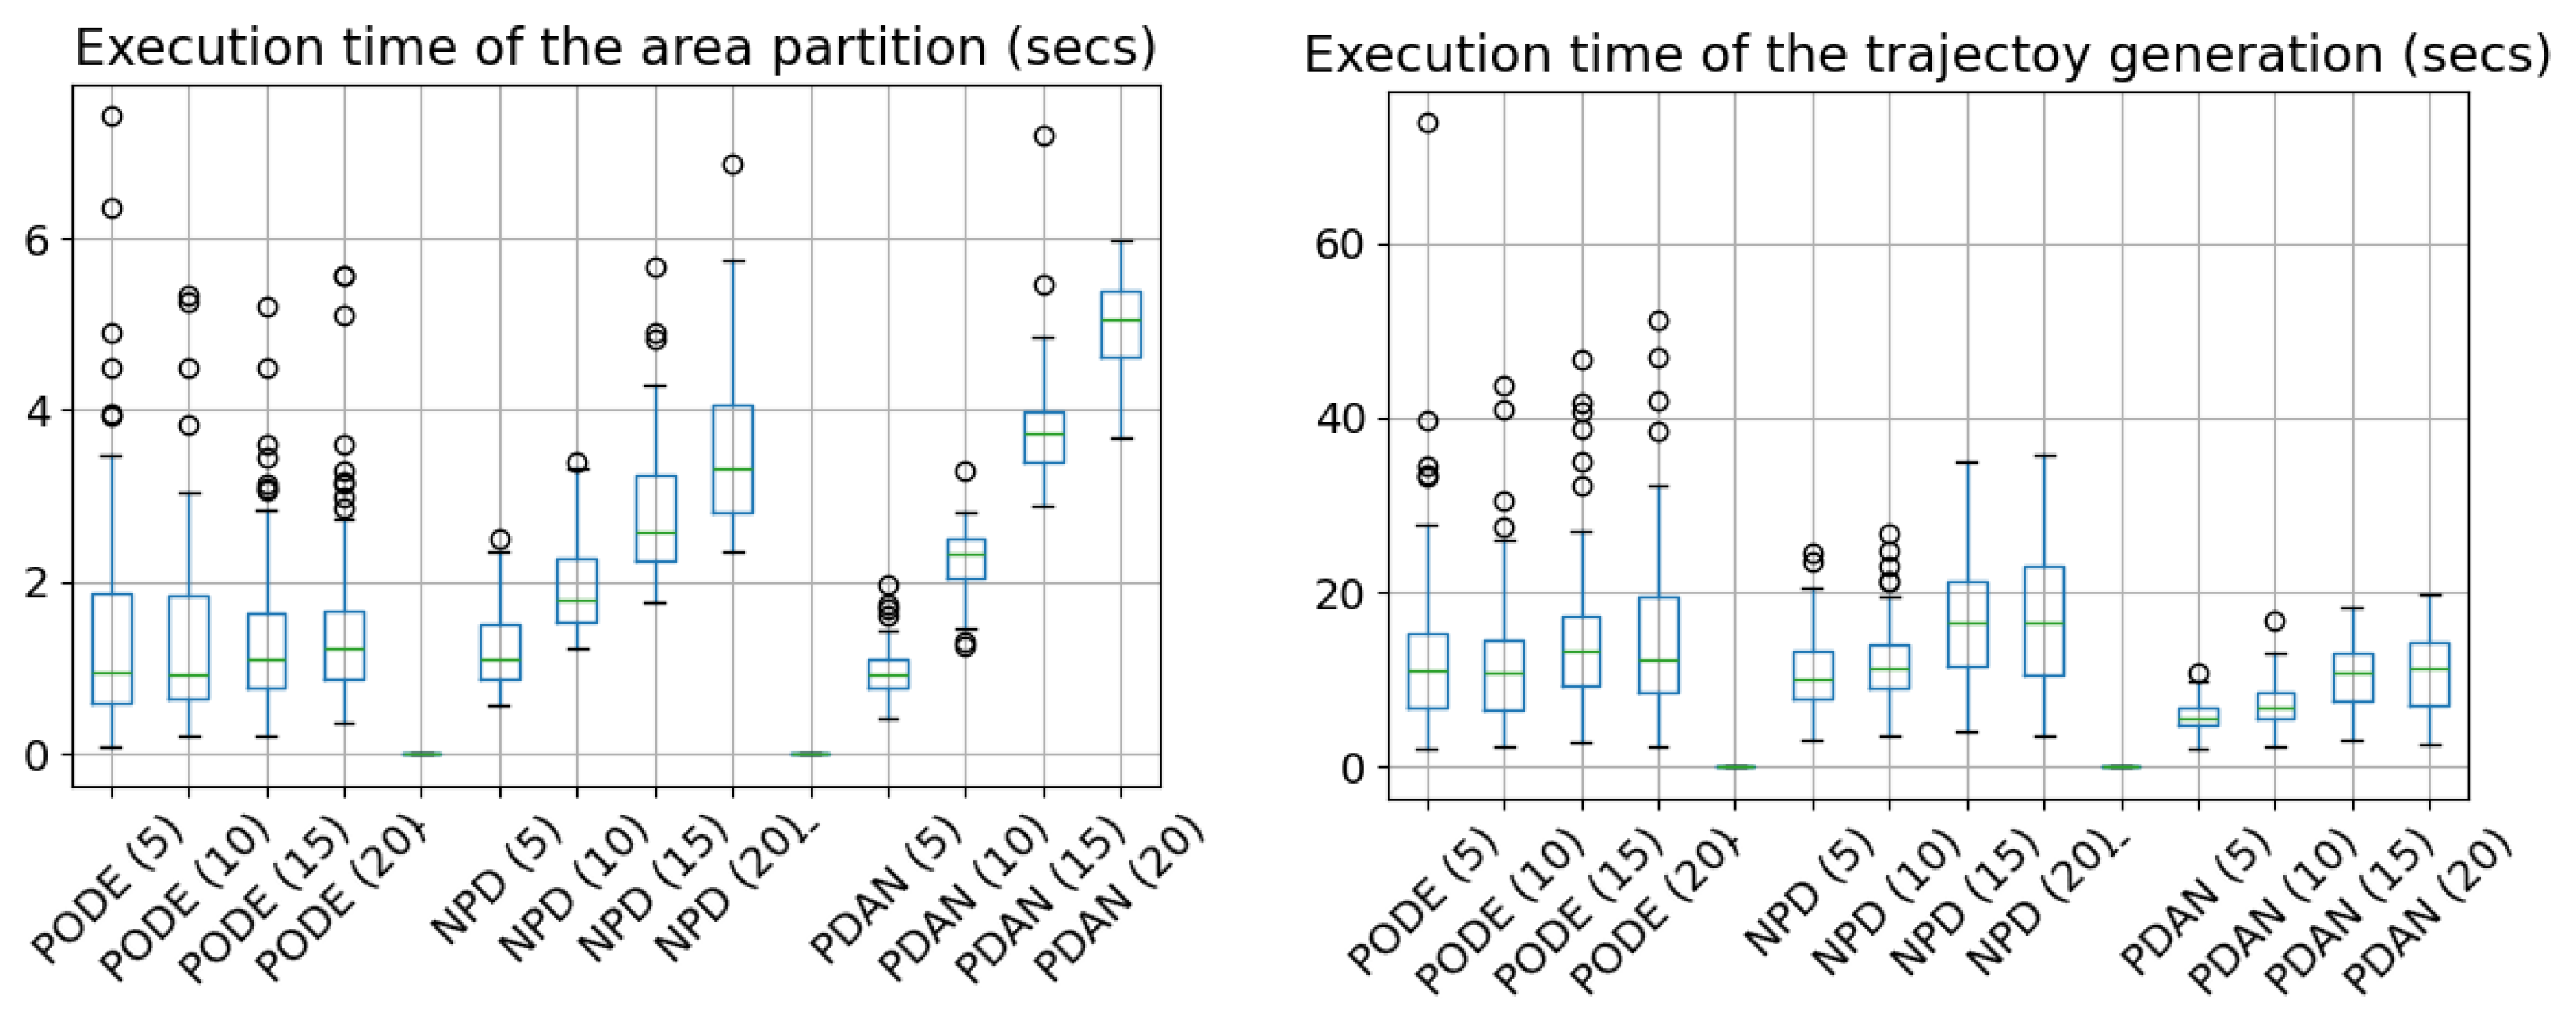
Figure 23 shows the execution times of the method, separating area partition and trajectory generation processes. The execution time of step 1 (fleet analysis) is included in the trajectory generation process.
The largest execution of the partition algorithm is less than 7 s (PODE, 5 drones), and the median is in 1 to 4 s. In comparison, the trajectory execution time is longer, with medians around 15 s and the worst cases reaching more than 90 s. In any case in less than 2 min, the method is able to produce the flight plan of up to 20 drones for any area. Also, observe that the trajectory generation runs faster for PDAN, the method that produced regions with the highest compactness.
Finally, Figure 24 shows the total planning time, including area partition and trajectory generation, for the three partition algorithms and different fleet sizes. Note that PODE-based planning is less sensitive to the number of drones on average. However, it also exhibits the highest variability and significant number of outliers. Very wide ranges are observed, especially at five drones, where the planning time ranges from 3.07 to 103.74 s. NPD-based planning is generally the slowest algorithm, with average planning time increasing from 17.70 s (5 drones) to 32.55 s (20 drones). PDAN-based planning shows the most consistent performance, with standard deviation over mean from 3 to 6 s. Its execution time grows approximately linearly with fleet size, ranging from 9.34 s for 5 drones to 22.32 s for 20 drones on average.

5. Discussion and Conclusions

In the event of an emergency, all available resources can help to facilitate the task of first responders and speed up the correct decision-making with the situational awareness that drones can provide. Speed is very important and it is advisable to have a fleet planning tool that integrates the method proposed in this paper. During the first step of the method, one can already know if the available fleet is sufficient and, if not, request more resources from other teams. Alternatively, a new polygon of smaller size can be created to better delimit the area with the highest interest, so that the available fleet can progress according to the experts’ criteria.
The requirement for using the method is to have an up-to-date database with the drone fleet characteristics. Then, at the moment of emergency, some operator has to create the shape of a polygon that contains the area to cover and set the current position of the fleet. Any geographical information system (GIS) can be used for this. The algorithm accepts geojson format, but any other similar standard format for geographical shapes could be used.
For the polygon partition, the results show that Balanced PDAN algorithm is the best option for convex polygons without holes. If the polygon is non-convex but flying outside its boundaries or disregarding internal holes is operationally acceptable, Balanced PDAN applied to the convex hull remains the most efficient choice. The trade-off between simplified partitioning and compliance with real-world no-fly zones can be observed by comparing NPD (hole-aware) and PDAN applied to the convex hull (ignoring holes). In the evaluated scenarios, the convex hull increases the total area to be covered by 16.1% (±9.99) on average, meaning that approximately one-sixth of the mission area may include zones that were originally restricted or contained holes. Despite the flight area increment, PDAN with convex hull reduces trajectory complexity, with about 8.4% fewer turns, and obtains minor improvements in flight distance (0.9%) and mission time (1.9%). Coverage difference between both approaches was negligible (0.02%).
The reduction in the number of turns is particularly relevant, as it has a direct impact on flight smoothness and energy efficiency. However, if there is a significant difference between the area of the polygon and its convex hull, the additional area can increase flight time without providing any operational advantage. This effect is difficult to assess, as it depends on the geometry of the polygon and where the holes are distributed spatially. Furthermore, when holes represent actual no-fly zones (such as hazardous material sites in disaster scenarios), this simplification cannot be applied. Therefore, the choice between NPD and PDAN depends on the situation: PDAN over the convex hull is recommended for open areas without critical restrictions, where holes represent areas of no interest for the mission, while NPD is required when strict compliance with no-fly zones is mandatory. Ultimately, the decision should be made by the first responders in charge.
In any case, the balanced strategy significantly improves the average compactness of the partitions compared to the non-balanced approach, with PDAN achieving a 15.93% improvement on compactness on convex hulls and NPD showing a 6.70% improvement on original polygons. By grouping area requirements into two balanced subsets at each step, the algorithm preserves proportionality and minimizes the formation of elongated or irregular shapes, which also facilitates efficient path planning and task allocation.
The proposed method outperforms the current best state-of-the-art approach in terms of flight distance, ensures coverage rates between 99.99% and 100%, and avoids all forbidden areas both inside and outside the target region. In tests with homogeneous fleets of different size, the method achieved mean distance savings of up to 9.31%. In the performed experiments, the overall execution time is about 20 s on average, which is reasonable for near real-time mission planning, enabling rapid generation of drone deployment plans.
The method still has some improvements to make it more practical to first responders. When the available fleet does not have enough capabilities to cover the area it may be necessary to plan the replacement of batteries as part of the task allocation algorithm. New fleet information, specifying the time to recharge or replace batteries of each drone shall be specified and used in the new planning.
The take-off location was assumed to be shared for all the vehicles of the fleet, but in a large-scale emergency more than one first responders body will be collaborating, each with their own fleet that will probably have different departure points. The partition algorithms can improve their response by adding a new constraint: to split the area taking into consideration also the distance from the departure point. This new constraint can also help to speed up the time to reach the area, which in this work is in the sequence of vehicles. Separating the fleet strategically in different departure points will allow us to reach the area by flying in parallel.
The compactness is a metric that has been largely used in decomposition algorithms, but further analysis about the relationship between flight time and compactness is desired. A new metric could be defined to better anticipate the flight time of the drone fleet and that could produce a better version of the analytical algorithm.
In the trajectory generation step, when holes are still present in a partitioned area, the scanning strategy should be improved to avoid many detours, which can lead to an increased number of turns and greater travel distance. Although terrain elevation is considered during trajectory generation, the current calculation of flight distance does not include the altitude component (Z-axis). Incorporating altitude variations would provide a more accurate estimation of the actual distance flown.
To adapt the algorithm for fixed-wing UAVs, it is essential to consider wind conditions, minimize the number of turns, and take into account the aircraft’s turning rate to enable more efficient and realistic path planning for this type of drone. Currently, the approach assumes normal weather conditions, a fixed payload, and constant cruise ground speed. Revisiting the algorithm to systematically address the variability of operational constraints, such as battery degradation, payload variations or weather effects across different drone types, would be highly valuable for enhancing drone performance in real-world scenarios.

Author Contributions

Conceptualization, investigation, and writing, I.Z., E.S. and C.B.; methodology, C.B., E.S. and I.Z.; software, I.Z., E.S., C.B. and G.H.; validation, resources and supervision, G.H. and E.P.; All authors have read and agreed to the published version of the manuscript.

Funding

This work has been partially funded by the European Union’s Horizon Europe program under PANTHEON project with grant number 101074008, the Ministry of Science, Innovation and Universities of Spain under grant PID2023-152053OB-C21.

Data Availability Statement

One hundred polygons have been generated around cities from all around the world. Polygons are generally non-convex and can have holes inside. Each polygon has the original shape and its convex hull, and has been extended with four fleets of increasing size, from 5 to 20 UAS, creating a total of 800 scenario files. Finally, the polygons have been partitioned with three algorithms, resulting in a total of 1200 sets of trajectories. Datasets with polygons, drone fleet, partitions, and trajectories are available at ZENODO at https://doi.org/10.5281/zenodo.15746579 (accessed on 10 November 2025). ALL DATA are in GEOJSON format.

Acknowledgments

The authors acknowledge the support given by Toni Calvo in creating the 100 polygons dataset, Jim Sharples and Michail Karamousadakis for their active participation in the project, and Younes Moumen for his valuable technical advice.

Conflicts of Interest

The authors declare no conflicts of interest.

Abbreviations

The following abbreviations are used in this manuscript:
4DTFour-dimension trajectory
C2CCommand and Control left
CPPCoverage Path Planning
DARPDistributed Autonomous Robot Planning
DRRDisaster Risk Reduction
EAMCEnergy-Aware Multi-UAV Coverage
GSDGround Sampling Distance
IoTInternet of Things
NPDNon-convex Polygon Decomposition
PDANPolygon Decomposition by Analytics
PODEPolygon Decomposition
PPPPolygon Partition Problem
UAVUnmanned Aerial Vehicle
UNUnited Nations
WSLWindows Subsystem for Linux

References

  1. Van Loenhout, J.; Below, R.; McClean, D. The Human Cost of Disasters: An Overview of the Last 20 Years (2000–2019); Technical Report; Centre for Research on the Epidemiology of Disasters (CRED): Brussels, Belgium; United Nations Office for Disaster Risk Reduction (UNDRR): Geneva, Switzerland, 2020. [Google Scholar]
  2. Center, A.D.R. Sendai Framework for Disaster Risk Reduction 2015–2030; Technical Report; United Nations Office for Disaster Risk Reduction: Geneva, Switzerland, 2015. [Google Scholar]
  3. Kucharczyk, M.; Hugenholtz, C.H. Remote sensing of natural hazard-related disasters with small drones: Global trends, biases, and research opportunities. Remote Sens. Environ. 2021, 264, 112577. [Google Scholar] [CrossRef]
  4. Román, A.; Tovar-Sánchez, A.; Roque-Atienza, D.; Huertas, I.; Caballero, I.; Fraile-Nuez, E.; Navarro, G. Unmanned aerial vehicles (UAVs) as a tool for hazard assessment: The 2021 eruption of Cumbre Vieja volcano, La Palma Island (Spain). Sci. Total Environ. 2022, 843, 157092. [Google Scholar] [CrossRef]
  5. Manzini, T.; Murphy, R.; Merrick, D. Quantitative Data Analysis: CRASAR Small Unmanned Aerial Systems at Hurricane Ian. In Proceedings of the 2023 IEEE International Symposium on Safety, Security, and Rescue Robotics (SSRR), Naraha, Japan, 13–15 November 2023; pp. 7–12. [Google Scholar] [CrossRef]
  6. Ozturkcan, S. Technology and Disaster Relief: The Türkiye-Syria Earthquake Case Study. In Innovation; IntechOpen: Rijeka, Croatia, 2023; Chapter 13. [Google Scholar]
  7. IEDO. International Report on Best Practices in Robotics 2022; IEDO: Washington, DC, USA, 2022. [Google Scholar]
  8. Janik, P.; Zawistowski, M.; Fellner, R.; Zawistowski, G. Unmanned Aircraft Systems Risk Assessment Based on SORA for First Responders and Disaster Management. Appl. Sci. 2021, 11, 5364. [Google Scholar] [CrossRef]
  9. Vincent-Lambert, C.; Pretorius, A.; Van Tonder, B. Use of Unmanned Aerial Vehicles in Wilderness Search and Rescue Operations: A Scoping Review. Wilderness Environ. Med. 2023, 34, 580–588. [Google Scholar] [CrossRef]
  10. Grabmaier, I.; Bittner, S.; Kainz, S.; Barrado, C.; Bagiyan, V.; Bakunts, S.; Zamora, D. Enhancing community participation in Disaster Risk Management: Recommendations for an inclusive approach. Open Res. Europe 2025, 5, 50. [Google Scholar] [CrossRef]
  11. Maza, I.; Ollero, A. Multiple UAV cooperative searching operation using polygon area decomposition and efficient coverage algorithms. In Distributed Autonomous Robotic Systems 6; Springer: Berlin/Heidelberg, Germany, 2007; pp. 221–230. [Google Scholar]
  12. Xu, A.; Viriyasuthee, C.; Rekleitis, I. Optimal Complete Terrain Coverage Using an Unmanned Aerial Vehicle. In Proceedings of the 2011 IEEE International Conference on Robotics and Automation, Shanghai, China, 9–13 May 2011; pp. 2513–2519. [Google Scholar] [CrossRef]
  13. Ghaddar, A.; Merei, A.; Natalizio, E. PPS: Energy-Aware Grid-Based Coverage Path Planning for UAVs Using Area Partitioning in the Presence of NFZs. Sensors 2020, 20, 3742. [Google Scholar] [CrossRef]
  14. Wu, Y.; Yin, H.; Chen, X.; Zhang, M. Multicircuit route planning for UAVs performing the terrain coverage task. IEEE Internet Things J. 2024, 11, 23765–23779. [Google Scholar] [CrossRef]
  15. Xiao, S.; Tan, X.; Wang, J. A Simulated Annealing Algorithm and Grid Map-Based UAV Coverage Path Planning Method for 3D Reconstruction. Electronics 2021, 10, 853. [Google Scholar] [CrossRef]
  16. Li, J.; Yang, X.; Yang, Y.; Liu, X. Cooperative Mapping Task Assignment of Heterogeneous Multi-UAV Using an Improved Genetic Algorithm. Knowl. Based Syst. 2024, 296, 111830. [Google Scholar] [CrossRef]
  17. Datsko, D.; Nekovar, F.; Penicka, R.; Saska, M. Energy-aware multi-uav coverage mission planning with optimal speed of flight. IEEE Robot. Autom. Lett. 2024, 9, 2893–2900. [Google Scholar] [CrossRef]
  18. Sanz-Martos, S.; Lopez-Franco, M.D.; Alvarez-Garcia, C.; Granero-Moya, N.; Lopez-Hens, J.M.; Camara-Anguita, S.; Pancorbo-Hidalgo, P.L.; Comino-Sanz, I.M. Drone applications for emergency and urgent care: A systematic review. Prehospital Disaster Med. 2022, 37, 502–508. [Google Scholar] [CrossRef]
  19. Daud, S.M.S.M.; Yusof, M.Y.P.M.; Heo, C.C.; Khoo, L.S.; Singh, M.K.C.; Mahmood, M.S.; Nawawi, H. Applications of drone in disaster management: A scoping review. Sci. Justice 2022, 62, 30–42. [Google Scholar] [CrossRef]
  20. Kumar, K.; Kumar, N. Region coverage-aware path planning for unmanned aerial vehicles: A systematic review. Phys. Commun. 2023, 59, 102073. [Google Scholar] [CrossRef]
  21. Yucesoy, E.; Balcik, B.; Coban, E. The role of drones in disaster response: A literature review of operations research applications. Int. Trans. Oper. Res. 2025, 32, 545–589. [Google Scholar] [CrossRef]
  22. Inès, J.; Annett, W.; Simone, D. Manual for CEMS-Rapid Mapping Products; Publications Office of the European Union: Luxembourg, 2020. [Google Scholar]
  23. Alkhatib, A.A.; Jaber, K.M.; Al-Madi, M. A Proposed Automatic Forest Fire Extinguishing and Prevention System Using Drones. In Proceedings of the 2024 IEEE International Humanitarian Technologies Conference (IHTC), Bari, Italy, 25–27 November 2024; IEEE: New York, NY, USA, 2024; pp. 1–6. [Google Scholar]
  24. Cao, Z.L.; Huang, Y.; Hall, E.L. Region filling operations with random obstacle avoidance for mobile robots. J. Robot. Syst. 1988, 5, 87–102. [Google Scholar] [CrossRef]
  25. Apostolidis, S.D.; Kapoutsis, P.C.; Kapoutsis, A.C.; Kosmatopoulos, E.B. Cooperative multi-UAV coverage mission planning platform for remote sensing applications. Auton. Robot. 2022, 46, 373–400. [Google Scholar] [CrossRef]
  26. Iqbal, M.M.; Ali, Z.A.; Khan, R.; Shafiq, M. Motion Planning of UAV Swarm: Recent Challenges and Approaches. In Aeronautics; IntechOpen: Rijeka, Croatia, 2022; Chapter 3. [Google Scholar]
  27. Cheng, Q.; Zhang, Z.; Du, Y.; Li, Y. Research on Particle Swarm Optimization-Based UAV Path Planning Technology in Urban Airspace. Drones 2024, 8, 701. [Google Scholar] [CrossRef]
  28. Wei, J.; Zhang, Y.; Wei, W. HSEPSO: A Hierarchical Self-Evolutionary PSO Approach for UAV Path Planning. In Proceedings of the Genetic and Evolutionary Computation Conference (GECCO ’25), Málaga, Spain, 14–18 July 2025; pp. 1577–1584. [Google Scholar] [CrossRef]
  29. Lee, J.H.; Jeong, S.K.; Ji, D.H.; Park, H.Y.; Kim, D.Y.; Choo, K.B.; Jung, D.W.; Kim, M.J.; Oh, M.H.; Choi, H.S. Unmanned Surface Vehicle Using a Leader–Follower Swarm Control Algorithm. Appl. Sci. 2023, 13, 3120. [Google Scholar] [CrossRef]
  30. Adoni, W.Y.H.; Fareedh, J.S.; Lorenz, S.; Gloaguen, R.; Madriz, Y.; Singh, A.; Kühne, T.D. Intelligent Swarm: Concept, Design and Validation of Self-Organized UAVs Based on Leader–Followers Paradigm for Autonomous Mission Planning. Drones 2024, 8, 575. [Google Scholar] [CrossRef]
  31. Alaa, D.; Abdelmadjid, K.; Fadhila, L. Intelligent path planning algorithms for UAVs: Classification, complexity analysis, hybrid ablation insights, and future directions. Adv. Mech. Eng. 2025, 17, 16878132251355020. [Google Scholar] [CrossRef]
  32. Skorobogatov, G.; Barrado, C.; Salamí, E.; Pastor, E. Flight planning in multi-unmanned aerial vehicle systems: Nonconvex polygon area decomposition and trajectory assignment. Int. J. Adv. Robot. Syst. 2021, 18, 1729881421989551. [Google Scholar] [CrossRef]
  33. Skorobogatov, G.; Barrado, C.; Salamí, E. Multi-Robot workspace division based on compact polygon decomposition. IEEE Access 2021, 9, 165795–165805. [Google Scholar] [CrossRef]
  34. Kapoutsis, A.C.; Chatzichristofis, S.A.; Kosmatopoulos, E.B. DARP: Divide areas algorithm for optimal multi-robot coverage path planning. J. Intell. Robot. Syst. 2017, 86, 663–680. [Google Scholar] [CrossRef]
  35. Papakostas, L.; Geladaris, A.; Mastrogeorgiou, A.; Sharples, J.; Hattenberger, G.; Chatzakos, P.; Polygerinos, P. Optimized Area Coverage in Disaster Response Utilizing Autonomous UAV Swarm Formations. In Proceedings of the 2025 33rd Mediterranean Conference on Control and Automation (MED), Tangier, Morocco, 10–13 June 2025; pp. 630–635. [Google Scholar] [CrossRef]
  36. Miah, M.S.; Knoll, J. Area coverage optimization using heterogeneous robots: Algorithm and implementation. IEEE Trans. Instrum. Meas. 2018, 67, 1380–1388. [Google Scholar] [CrossRef]
  37. Sadrabadi, M.T.; Peiró, J.; Innocente, M.S.; Rein, G. Conceptual design of a wildfire emergency response system empowered by swarms of unmanned aerial vehicles. Int. J. Disaster Risk Reduct. 2025, 124, 105493. [Google Scholar] [CrossRef]
  38. Datsko, D.; Nekovar, F.; Penicka, R. GitHub-Ctu-Mrs/EnergyAwareMCPP: Energy-Aware Multi-UAV Coverage Mission Planning with Optimal Speed of Flight. Available online: https://github.com/ctu-mrs/EnergyAwareMCPP (accessed on 10 November 2025).
  39. Skorobogatov, G.; Calvo, T.; Barrado, C.; Salamí, E. Compact Workspace Decomposition Based on a Bottom-Up Approach. IEEE Access 2025, 13, 3917–3928. [Google Scholar] [CrossRef]
  40. Khiati, W.; Moumen, Y.; Zerrouk, I.; Berrich, J.; Bouchentouf, T. Air Surveillance Planning Approach for Large Areas. In Proceedings of the 2019 Third International Conference on Intelligent Computing in Data Sciences (ICDS), Marrakech, Morocco, 28–30 October 2019; pp. 1–6. [Google Scholar] [CrossRef]
  41. Khiati, W.; Moumen, Y.; Habchi, A.E.; Zerrouk, I.; Berrich, J.; Bouchentouf, T. Grid Based approach (GBA): A new approach based on the grid-clustering algorithm to solve a CPP type problem for air surveillance using UAVs. In Proceedings of the 2020 Fourth International Conference on Intelligent Computing in Data Sciences (ICDS), Fez, Morocco, 21–23 October 2020; pp. 1–5. [Google Scholar] [CrossRef]
  42. Bellingham, J.; Tillerson, M.; Richards, A.; How, J.P. Multi-Task Allocation and Path Planning for Cooperating UAVs. In Cooperative Control: Models, Applications and Algorithms; Butenko, S., Murphey, R., Pardalos, P.M., Eds.; Springer: Boston, MA, USA, 2003; pp. 23–41. [Google Scholar] [CrossRef]
  43. Calvo, T.; Salamí, E.; Barrado, C.; Zerrouk, I. Dataset: Polygons for Testing Disaster Scenarios and UAS Swarms Usage. 2025. Available online: https://zenodo.org/records/15746579 (accessed on 10 November 2025).
  44. Bauersfeld, L.; Scaramuzza, D. Range, Endurance, and Optimal Speed Estimates for Multicopters. IEEE Robot. Autom. Lett. 2022, 7, 2953–2960. [Google Scholar] [CrossRef]
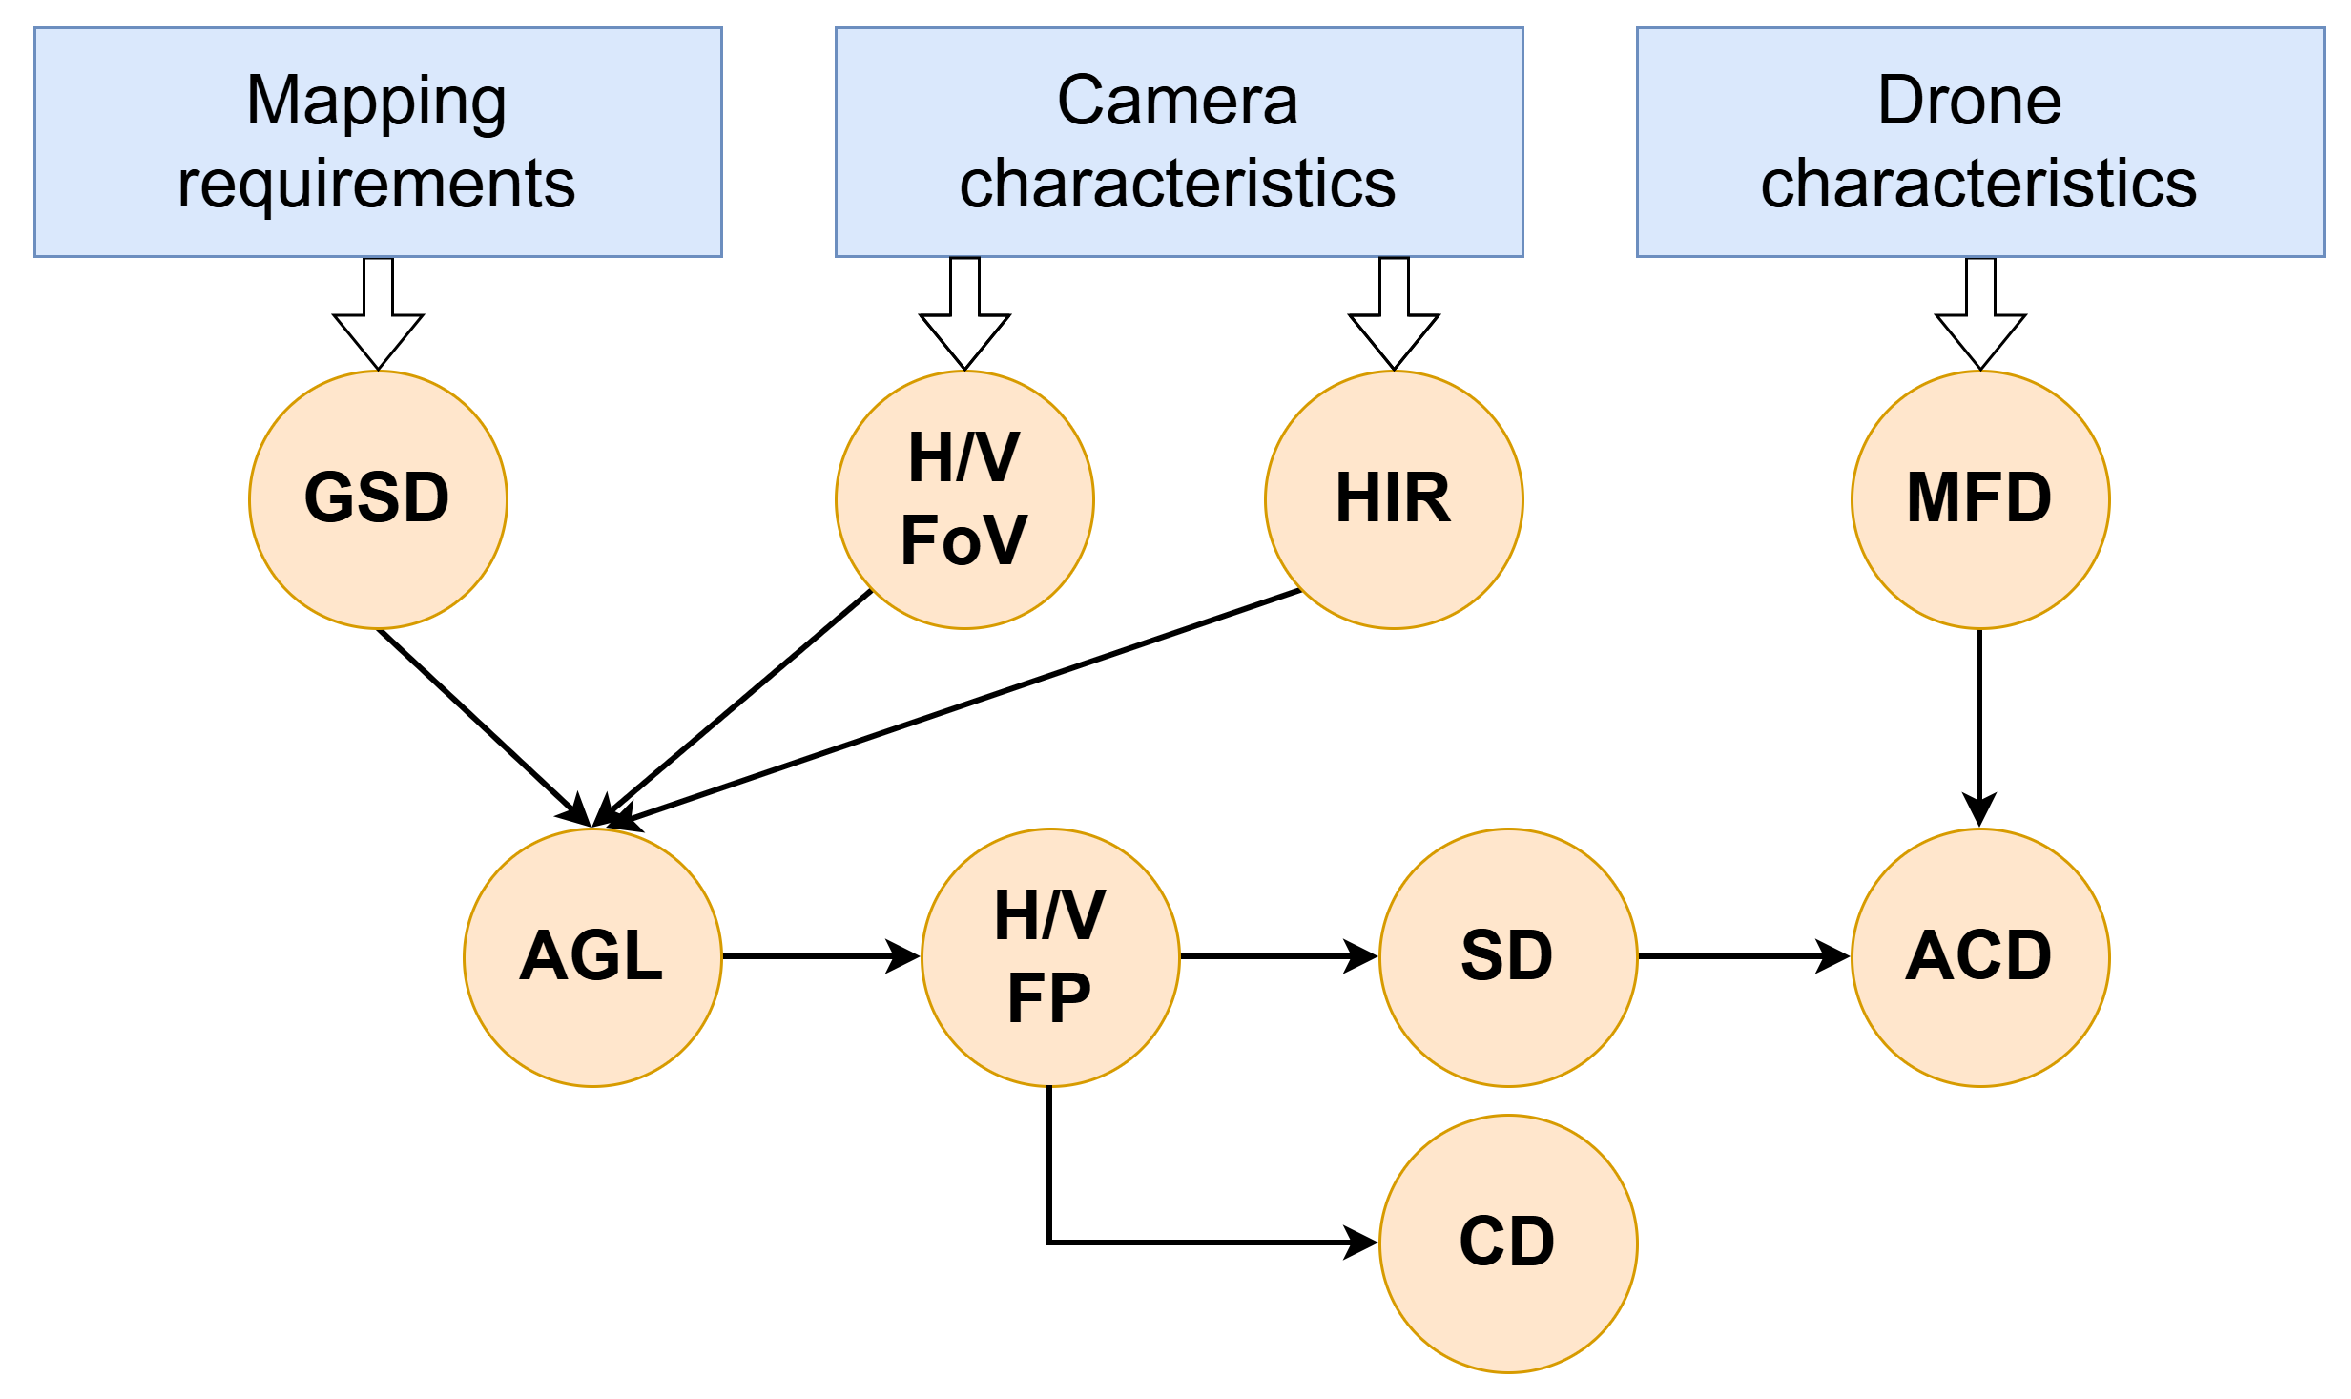
Figure 1. Parameters influencing the maximum area that a drone can cover A C D and key parameters for path planning.
Drones 09 00816 g001
Figure 2. Example of the balanced split strategy. The figure illustrates how the recursive algorithm groups five drones with different area requirements into two sets of similar total capacity before each subdivision step.
Drones 09 00816 g002
Figure 3. An original and its rotated partitions by N = 3 angles relative to the red segment. Axis values are expressed in meters.
Drones 09 00816 g003
Figure 4. Point grids generated for a partition with different rotations. Blue points are pass points, red points are no-pass points, and yellow points are entry points belonging to the lowest line. C D and S D denote capture distance and sweep distance, respectively. Axis values are expressed in meters.
Drones 09 00816 g004
Figure 5. (Left) A graph connecting the polygon vertices from 0 to 19. (Right) the initial graph with two auxiliary nodes (20, 6) and (20, 8) connected to the existing nodes. Blue circles represent nodes and black segments represent edges.
Drones 09 00816 g005
Figure 6. Two trajectories (in blue) generated for a rotated partition (in green), each entering from a different endpoint of the lowest sweeping line and avoiding any crossing with polygon boundaries. Axis values are expressed in meters.
Drones 09 00816 g006
Figure 7. Connecting the drone’s initial position (yellow, right–bottom) to the designated area entry points (yellow, left–top), ensuring that the path avoids crossing any restricted zones (red). (Left) A graph representation used to prevent crossing restricted areas. (Right) Forward and backward paths (blue) generated to access a partition (green) while avoiding restricted zones, using the graph on the (Left). Axis values are expressed in meters.
Drones 09 00816 g007
Figure 8. Fyli area, in Greece, used in PANTHEON as the planning scenario of an earthquake disaster. On the right the polygon with the area of interest in gray and the initial location of the drones fleet.
Drones 09 00816 g008
Figure 9. Fyli polygon partitions obtained with three algorithms: PODE (left), NPD (middle), and PDAN (right). The top row shows the original partitions, while the bottom row presents the balanced versions.
Drones 09 00816 g009
Figure 10. Generated trajectories (in blue) for the area of interest (in green) while avoiding no-fly zones (in red) and a hole. (Left) Trajectories for the decomposed area using (balanced) NPD. (Middle) A polygonal hole with avoidance paths. (Right) Multiple external polygons as no-fly-zones, with corresponding avoidance trajectories. Axis values are expressed in meters.
Drones 09 00816 g010
Figure 11. Fyli and EAMC areas used for the comparison of our algorithm with EAMC [17].
Drones 09 00816 g011
Figure 12. Examples of four polygons from the benchmark dataset [43], illustrating the diversity of shapes and sizes used in the experiments.
Drones 09 00816 g012
Figure 13. Gains in turns, distance and time (brown dots) calculated using the Fyli and EAMC scenarios for N { 1 , 2 , 3 , 4 , 5 , 6 } with their first-degree regression lines (blue lines).
Drones 09 00816 g013
Figure 14. Comparison between the total area of the test polygons and the total coverage capacity of the drone fleets for different fleet sizes (5, 10, 15, and 20 drones).
Drones 09 00816 g014
Figure 15. Percentage of area coverage achieved by each partition algorithm (PODE, NPD, and PDAN) for different fleet sizes (5, 10, 15, and 20).
Drones 09 00816 g015
Figure 16. Accuracy of the area assignment for each algorithm (PODE, NPD, and PDAN) and fleet size (5, 10, 15, and 20), computed as the difference between required and assigned areas (in m2).
Drones 09 00816 g016
Figure 17. Evaluation of the balanced partition strategy for NPD (left) and PDAN (right) algorithms, comparing average compactness improvements for different fleet sizes (5, 10, 15, 20).
Drones 09 00816 g017
Figure 18. Average compactness of the regions obtained by each algorithm (PODE, NPD, and PDAN) for different fleet sizes (5, 10, 15, and 20).
Drones 09 00816 g018
Figure 19. Characterization of the generated trajectories. The upper plots show the average number of turns (left) and total flight distance (right) for each algorithm (PODE, NPD, and PDAN) and fleet size (5, 10, 15, and 20). The lower plots display the corresponding box plots, illustrating variability across the 100 scenarios.
Drones 09 00816 g019
Figure 20. Average total mission time (in minutes) for the 100 polygon scenarios, grouped by partition algorithm (PODE, NPD, and PDAN) and fleet size (5, 10, 15, and 20).
Drones 09 00816 g020
Figure 21. Distribution of flight time among the mission phases (forward, scan, and return) for each algorithm (PODE, NPD, and PDAN) and fleet size (5, 10, 15, and 20).
Drones 09 00816 g021
Figure 22. Total mission time for scenarios where the fleet capacity was sufficient to fully cover the assigned area for each algorithm (PODE, NPD, PDAN) and fleet size (5, 10, 15, 20).
Drones 09 00816 g022
Figure 23. Execution times of the proposed method: partition algorithm (left) and trajectory generation (right) for each algorithm (PODE, NPD, and PDAN) and fleet size (5, 10, 15, and 20).
Drones 09 00816 g023
Figure 24. Planning time of the three algorithms (PODE, NPD, and PDAN) for different fleet sizes (5, 10, 15, and 20).
Drones 09 00816 g024
Table 1. List of the seven drone models used in the Fyli test scenario. The values in italic are approximate.
Drone TypeMaximum Flight DistanceSpeedField of View H, VImage Resolution
(km)(m/s)(Deg)(Pixels)
Parrot Anafi AI22.51464.6, 50.78000 × 6000
DJI MINI 4 Pro1811.369.7, 55.18064 × 6048
DJI Phontom 4 Pro V2.018.6310.3571.5, 56.74864 × 3648
DJI Air322.08869.6, 558064 × 6048
Skydio X2E Color208.367.7, 53.44056 × 3040
Skydio X10361580.2, 64.68192 × 6144
Yuneec H520E17.0110.12578.3, 62.84864 × 3648
Table 2. Maximum surface of each drone, and area required once proportionally reduced to cover the Fyli area (265.5 ha).
Drone TypeMaximum Surface (ha)Area Requirement (ha)
Parrot Anafi AI136.544.8
DJI MINI 4 Pro101.333.2
DJI Phontom 4 Pro V2.064.221.0
DJI Air3134.244.0
Skydio X2E Color59.119.4
Skydio X10250.382.0
Yuneec H520E63.320.1
Table 3. Scenario characteristics.
Scenario NameCapeComplexFyliIslandRectangleSimple
Area size (m2)903,979.52302,285.382,666,993.922681.5429,348.9555,807.64
ConvexFalseFalseFalseFalseTrueFalse
Number of vertices342436558
Number of holes011100
Drones’ distance from
the polygon centroid (m)1348.2447.631390.7731.5058.0547.84
Table 4. Global summary of the input polygons by type. N = number of polygons; %NonConv = percentage of non-convex polygons; Area and Compactness are reported as mean ± standard deviation; Vertices and Holes are reported as mean (min–max).
TypeN%NonConvArea [km2]CompactnessVerticesHoles
Original10095.011.12 ± 6.590.19 ± 0.0313.8 (5–21)1.61 (0–4)
Convex hull1000.012.88 ± 7.680.26 ± 0.018.85 (5–14)0 (0–0)
Table 5. Configuration of the scenarios.
Scenario NameCapeComplexFyliIslandRectangleSimple
Number of drones333133
Sweep distance (m)351055586
Lateral offset (m)17.5527.52.543
Table 6. Specific configurations of the algorithms.
AlgorithmParameterCapeComplexFyliIslandRectangleSimple
EAMC [17]Minimum subpolygons per UAV433111
Rotations per cell433535
Our three-step methodNumber of Steiner points704535357035
Table 7. Comparison of EAMC and our method for homogeneous fleet of drones.
EAMCOur 3-Step Method
ScenariosNumber of TurnsFlight Distance
(m)
Flight Time
(s)
Coverage
(%)
Number of TurnsFlight Distance
(m)
Flight Time
(s)
Coverage
(%)
cape16235,633.6__9735,254.87871.42100.0
complex29136,331.1__24034,287.51841.1299.99
fyli12759,665.7__13959,358.951466.05100.0
island38615.489__35694.9149.63100.0
rectangle544373.02__544315.18106.56100.0
simple10310,580.8__1389981.93245.3299.99
Table 8. Results for the paired t-test.
ResultsFleet1 (5 UAVs)Fleet2 (10 UAVs)Fleet3 (15 UAVs)Fleet4 (20 UAVs)
Number of polygons26435670
Normal test0.783.805.775.81
p-value (normality)0.670.140.0550.054
t-statistic−3.76−8.60−6.21−3.67
p-value (t-test)9.08 × 10−48.03 × 10−117.18 × 10−84.66 × 10−4
Confidence interval[−3632, −1062][−14,856, −9214][−23,156, −11,865][−18,466, −5471]
Mean distance gain3.19%9.31%6.17%0.37%
Table 9. Number of areas not covered by the fleet of drones for different sizes.
Fleet SizeNot Fully Covered
571
1060
1543
2027
Disclaimer/Publisher’s Note: The statements, opinions and data contained in all publications are solely those of the individual author(s) and contributor(s) and not of MDPI and/or the editor(s). MDPI and/or the editor(s) disclaim responsibility for any injury to people or property resulting from any ideas, methods, instructions or products referred to in the content.