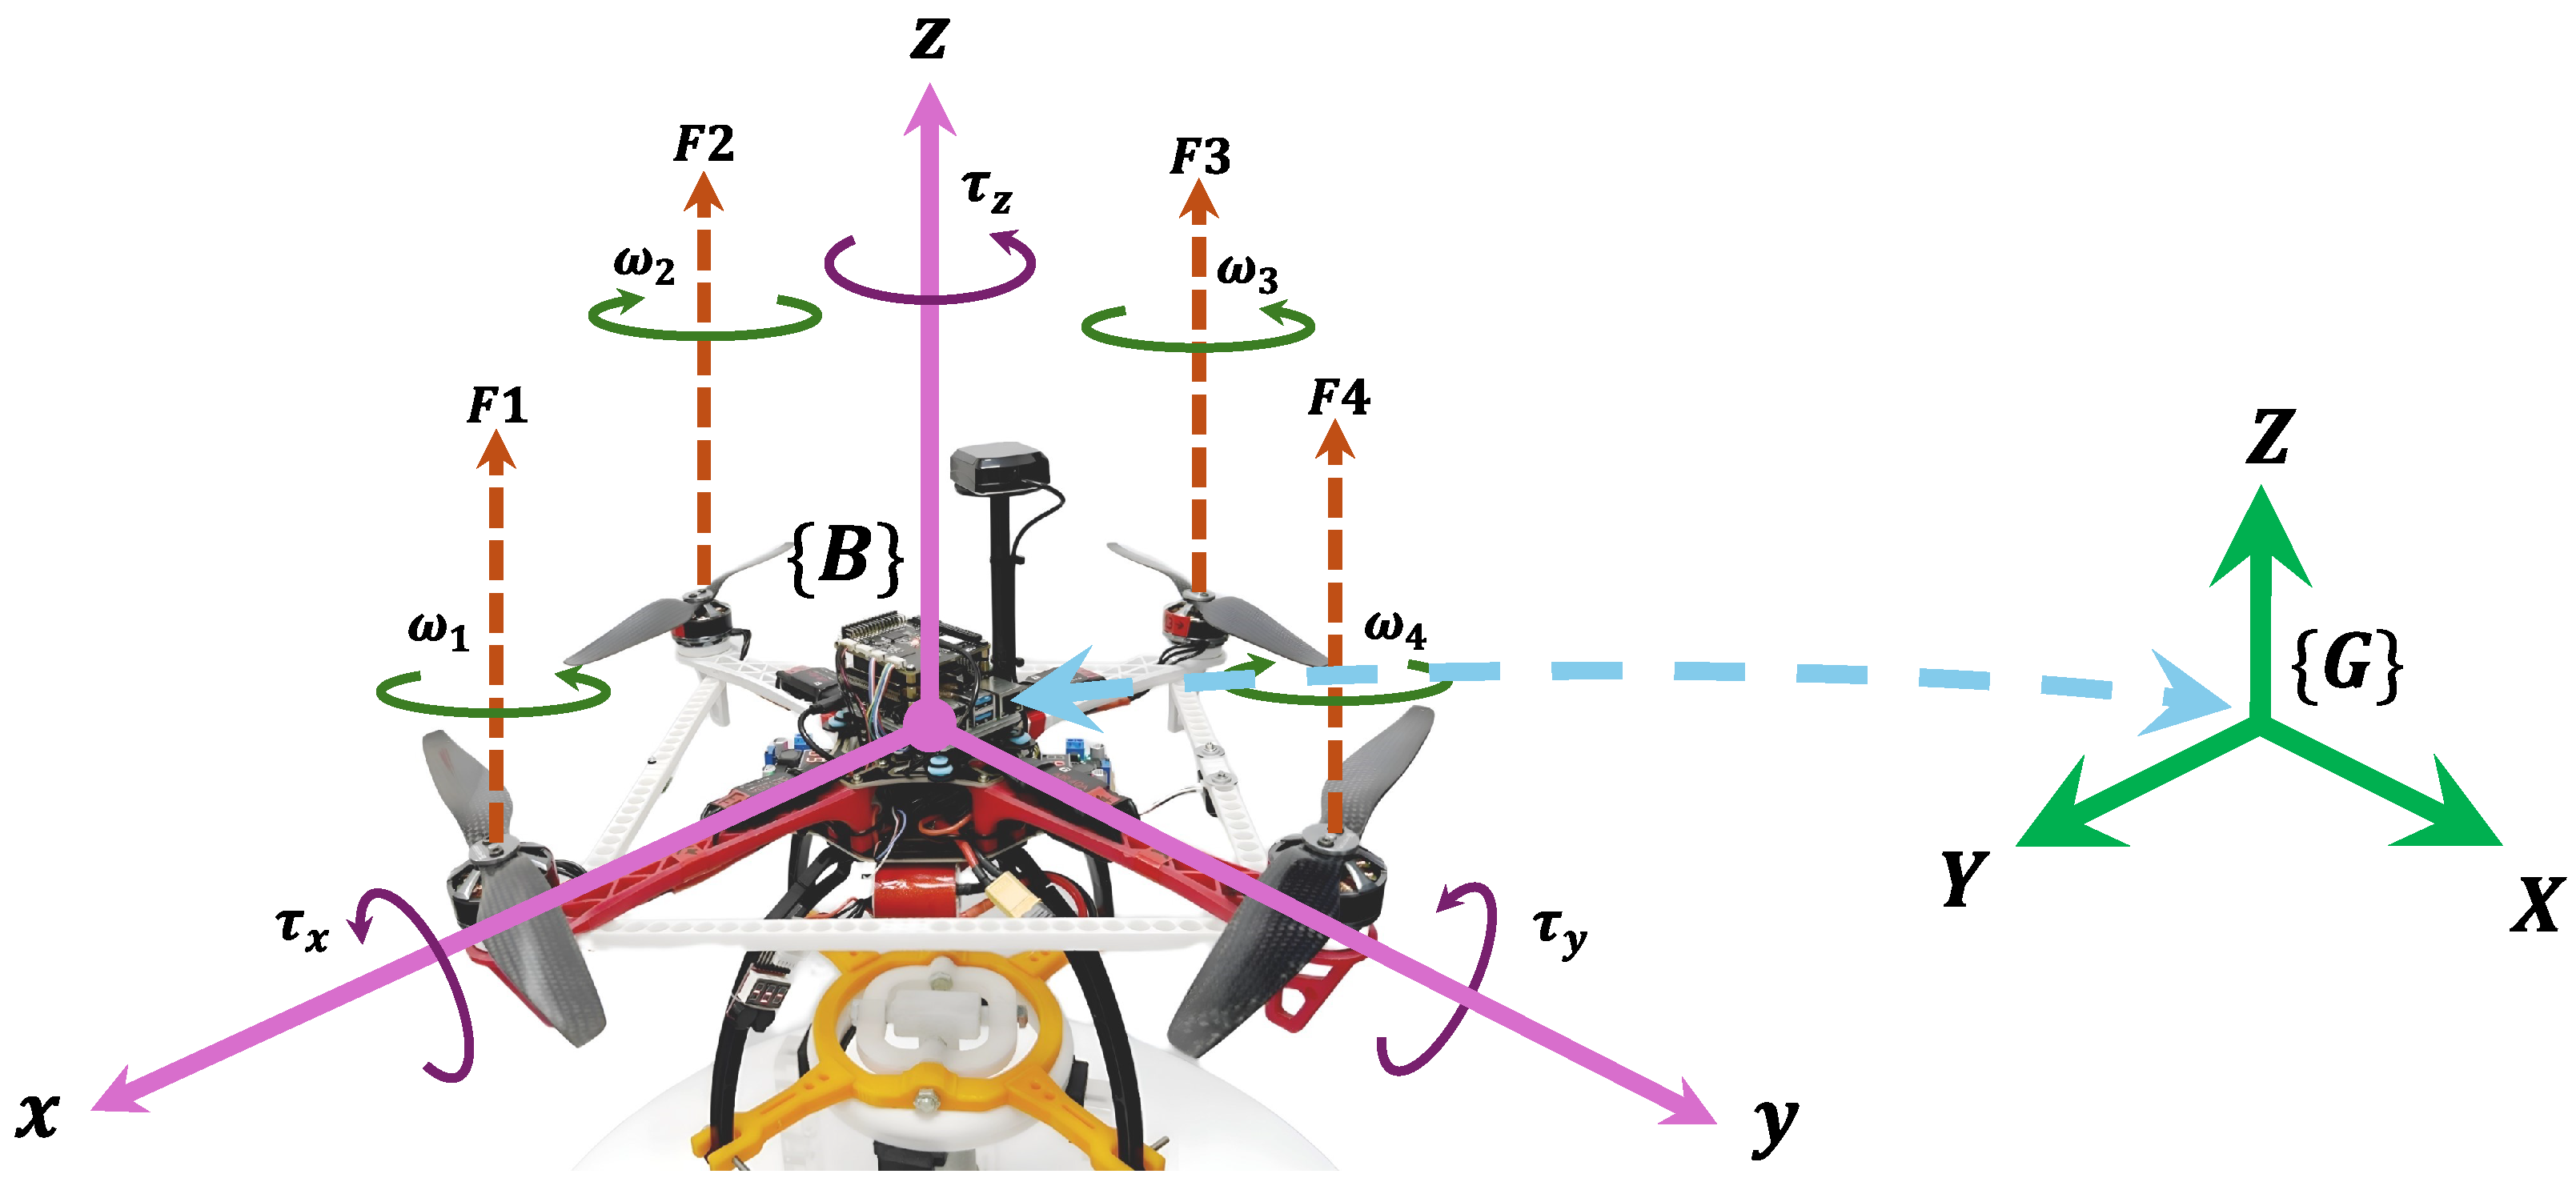
Figure 1.
Quadrotor body-fixed frame relative to the inertial frame .
Figure 1.
Quadrotor body-fixed frame relative to the inertial frame .
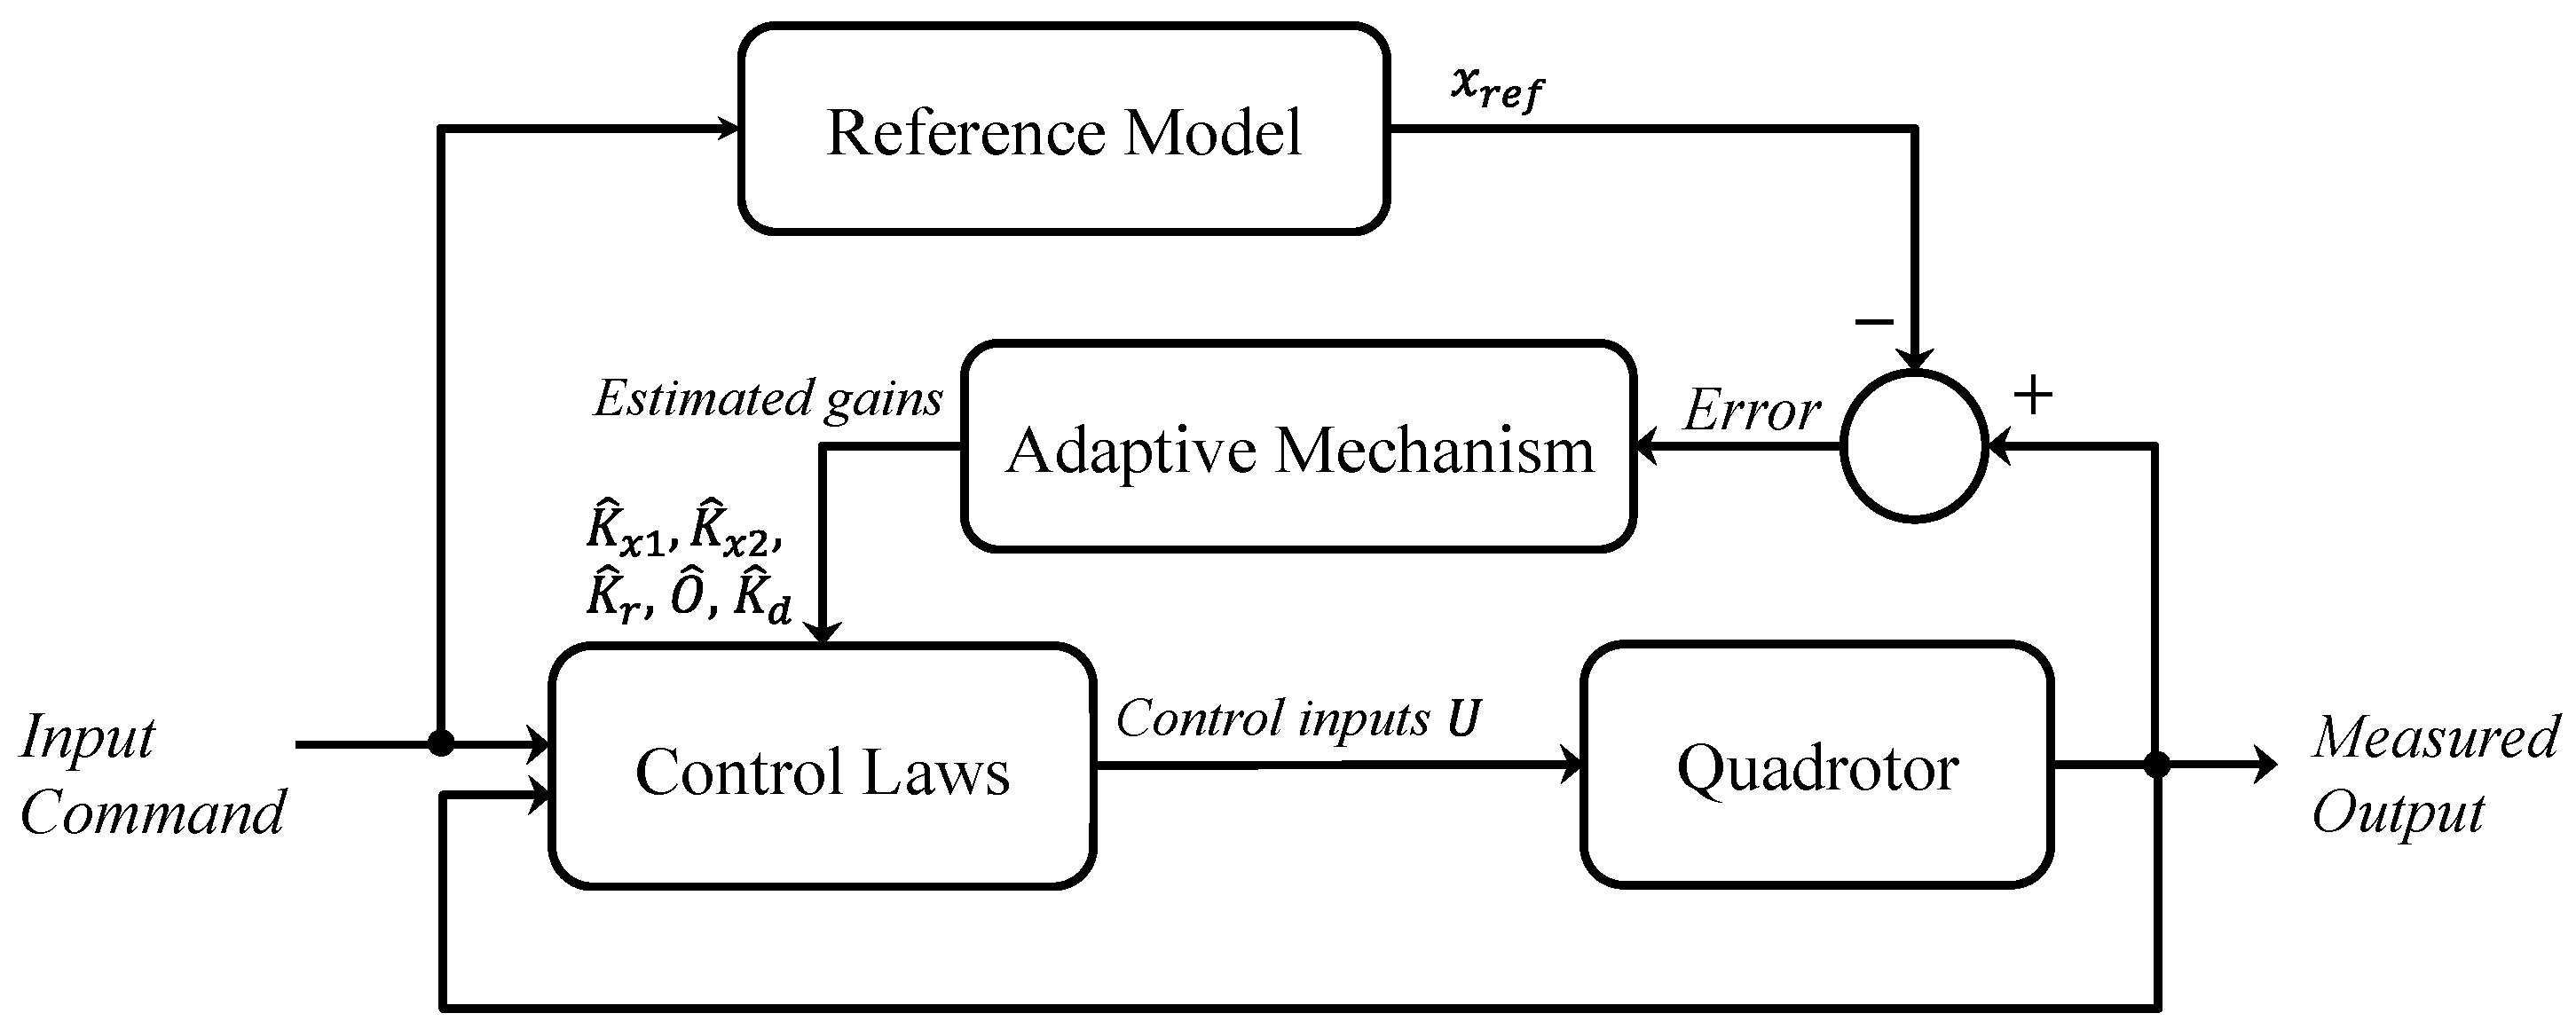
Figure 2.
MRAC block diagram.
Figure 2.
MRAC block diagram.
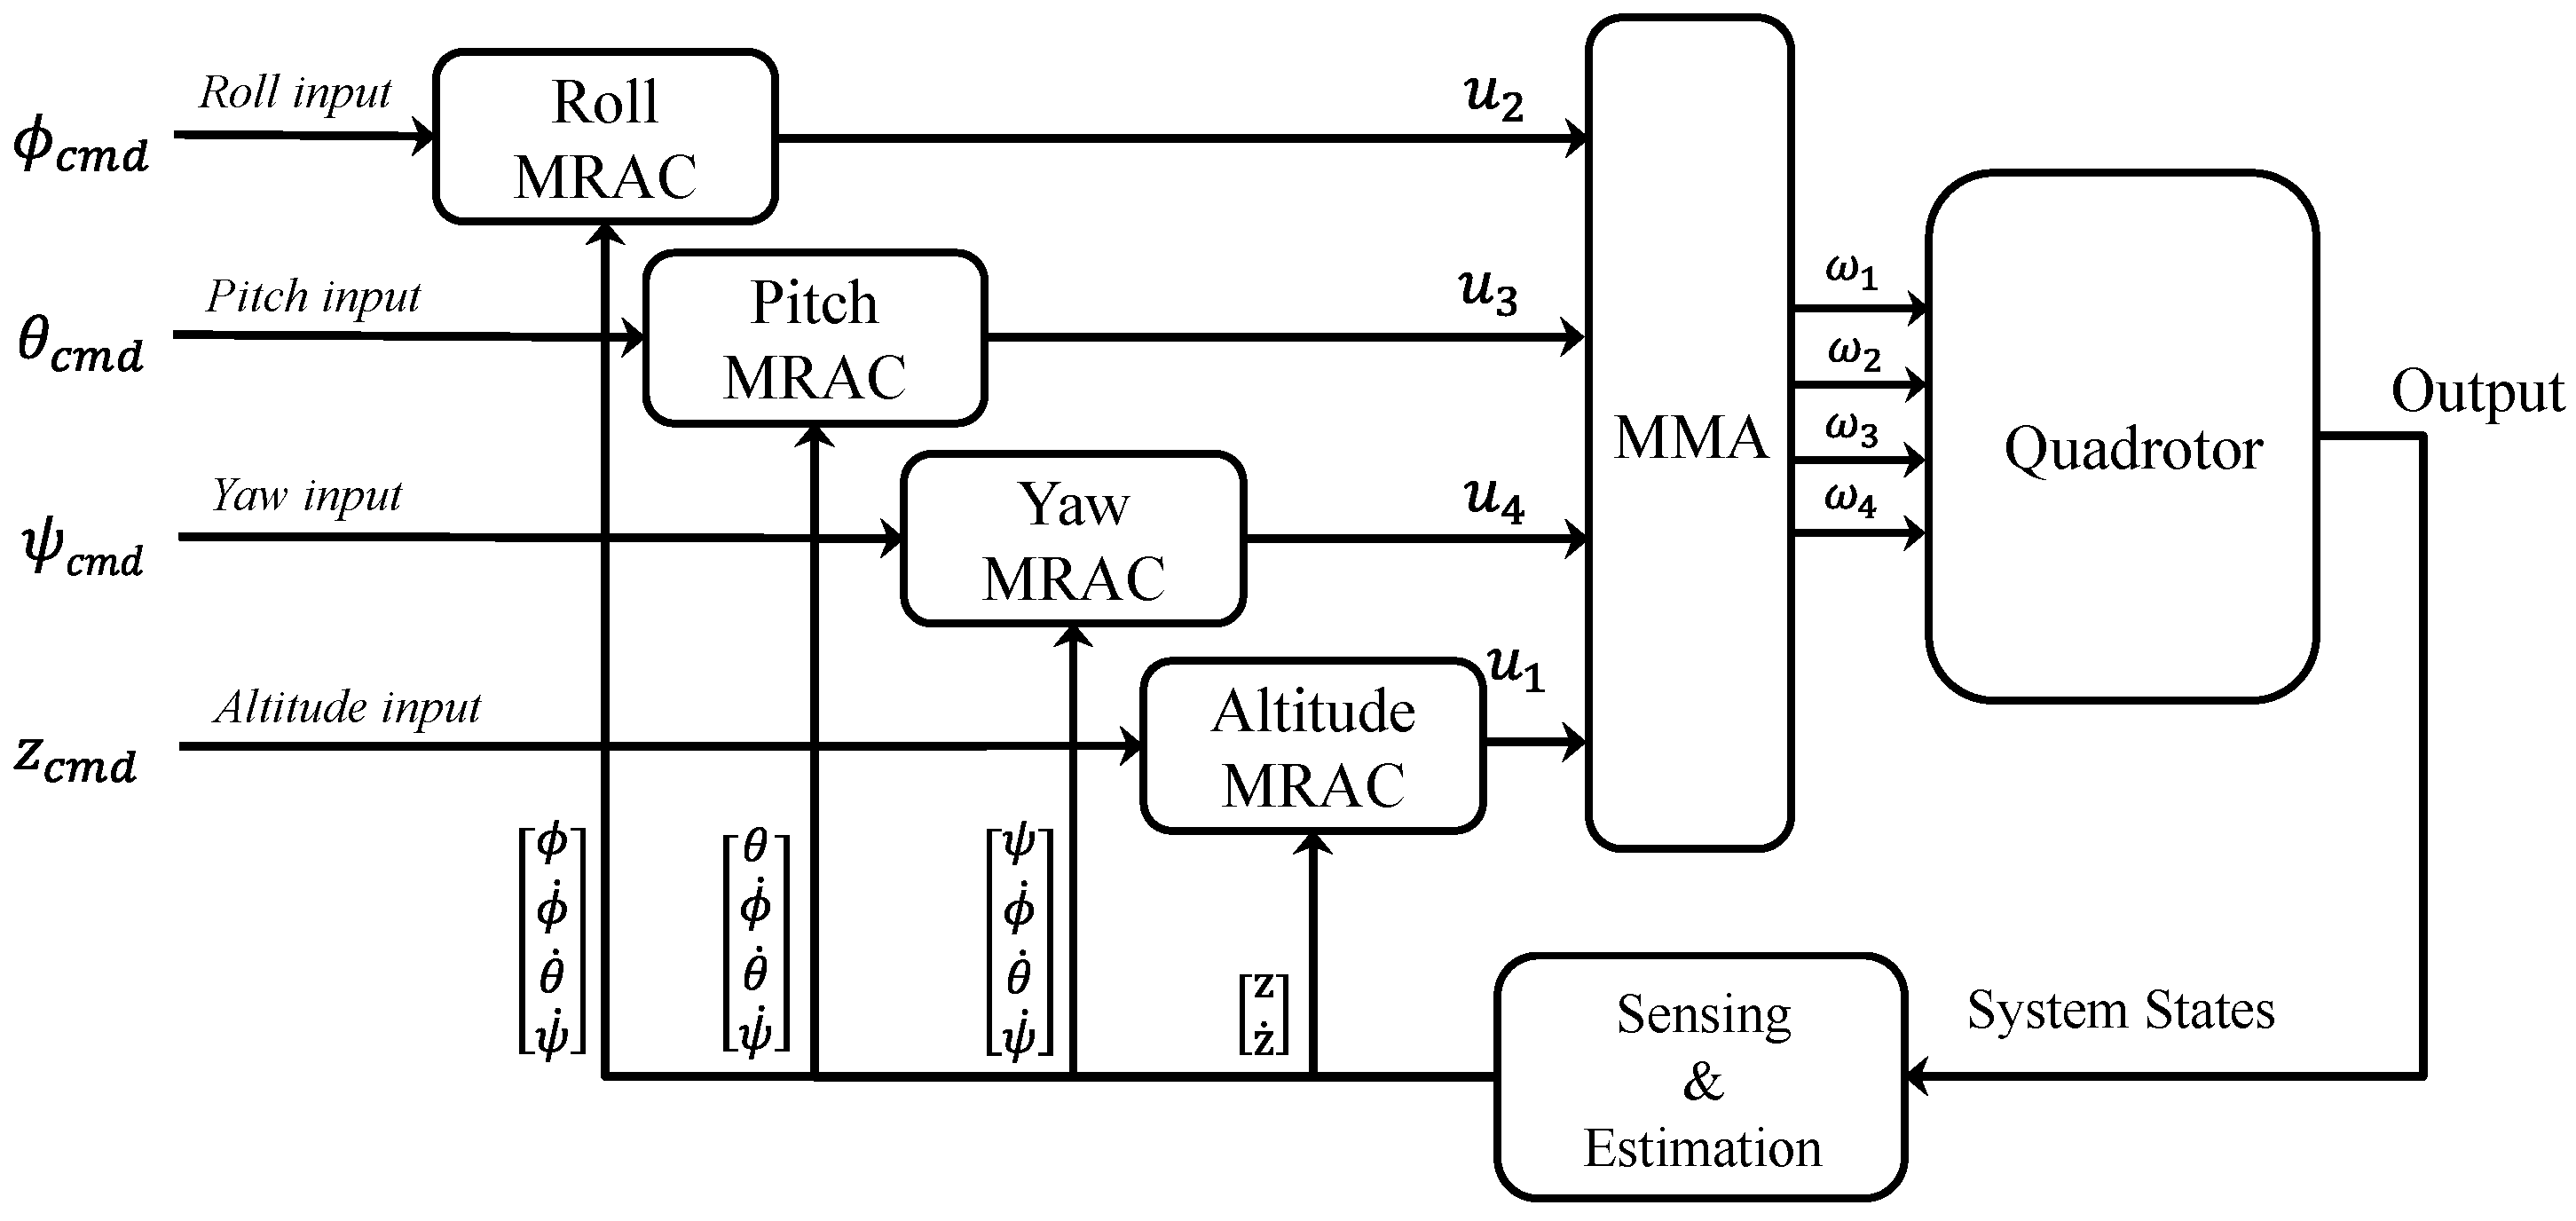
Figure 3.
MRAC-based control architecture for quadrotor altitude and attitude regulation.
Figure 3.
MRAC-based control architecture for quadrotor altitude and attitude regulation.
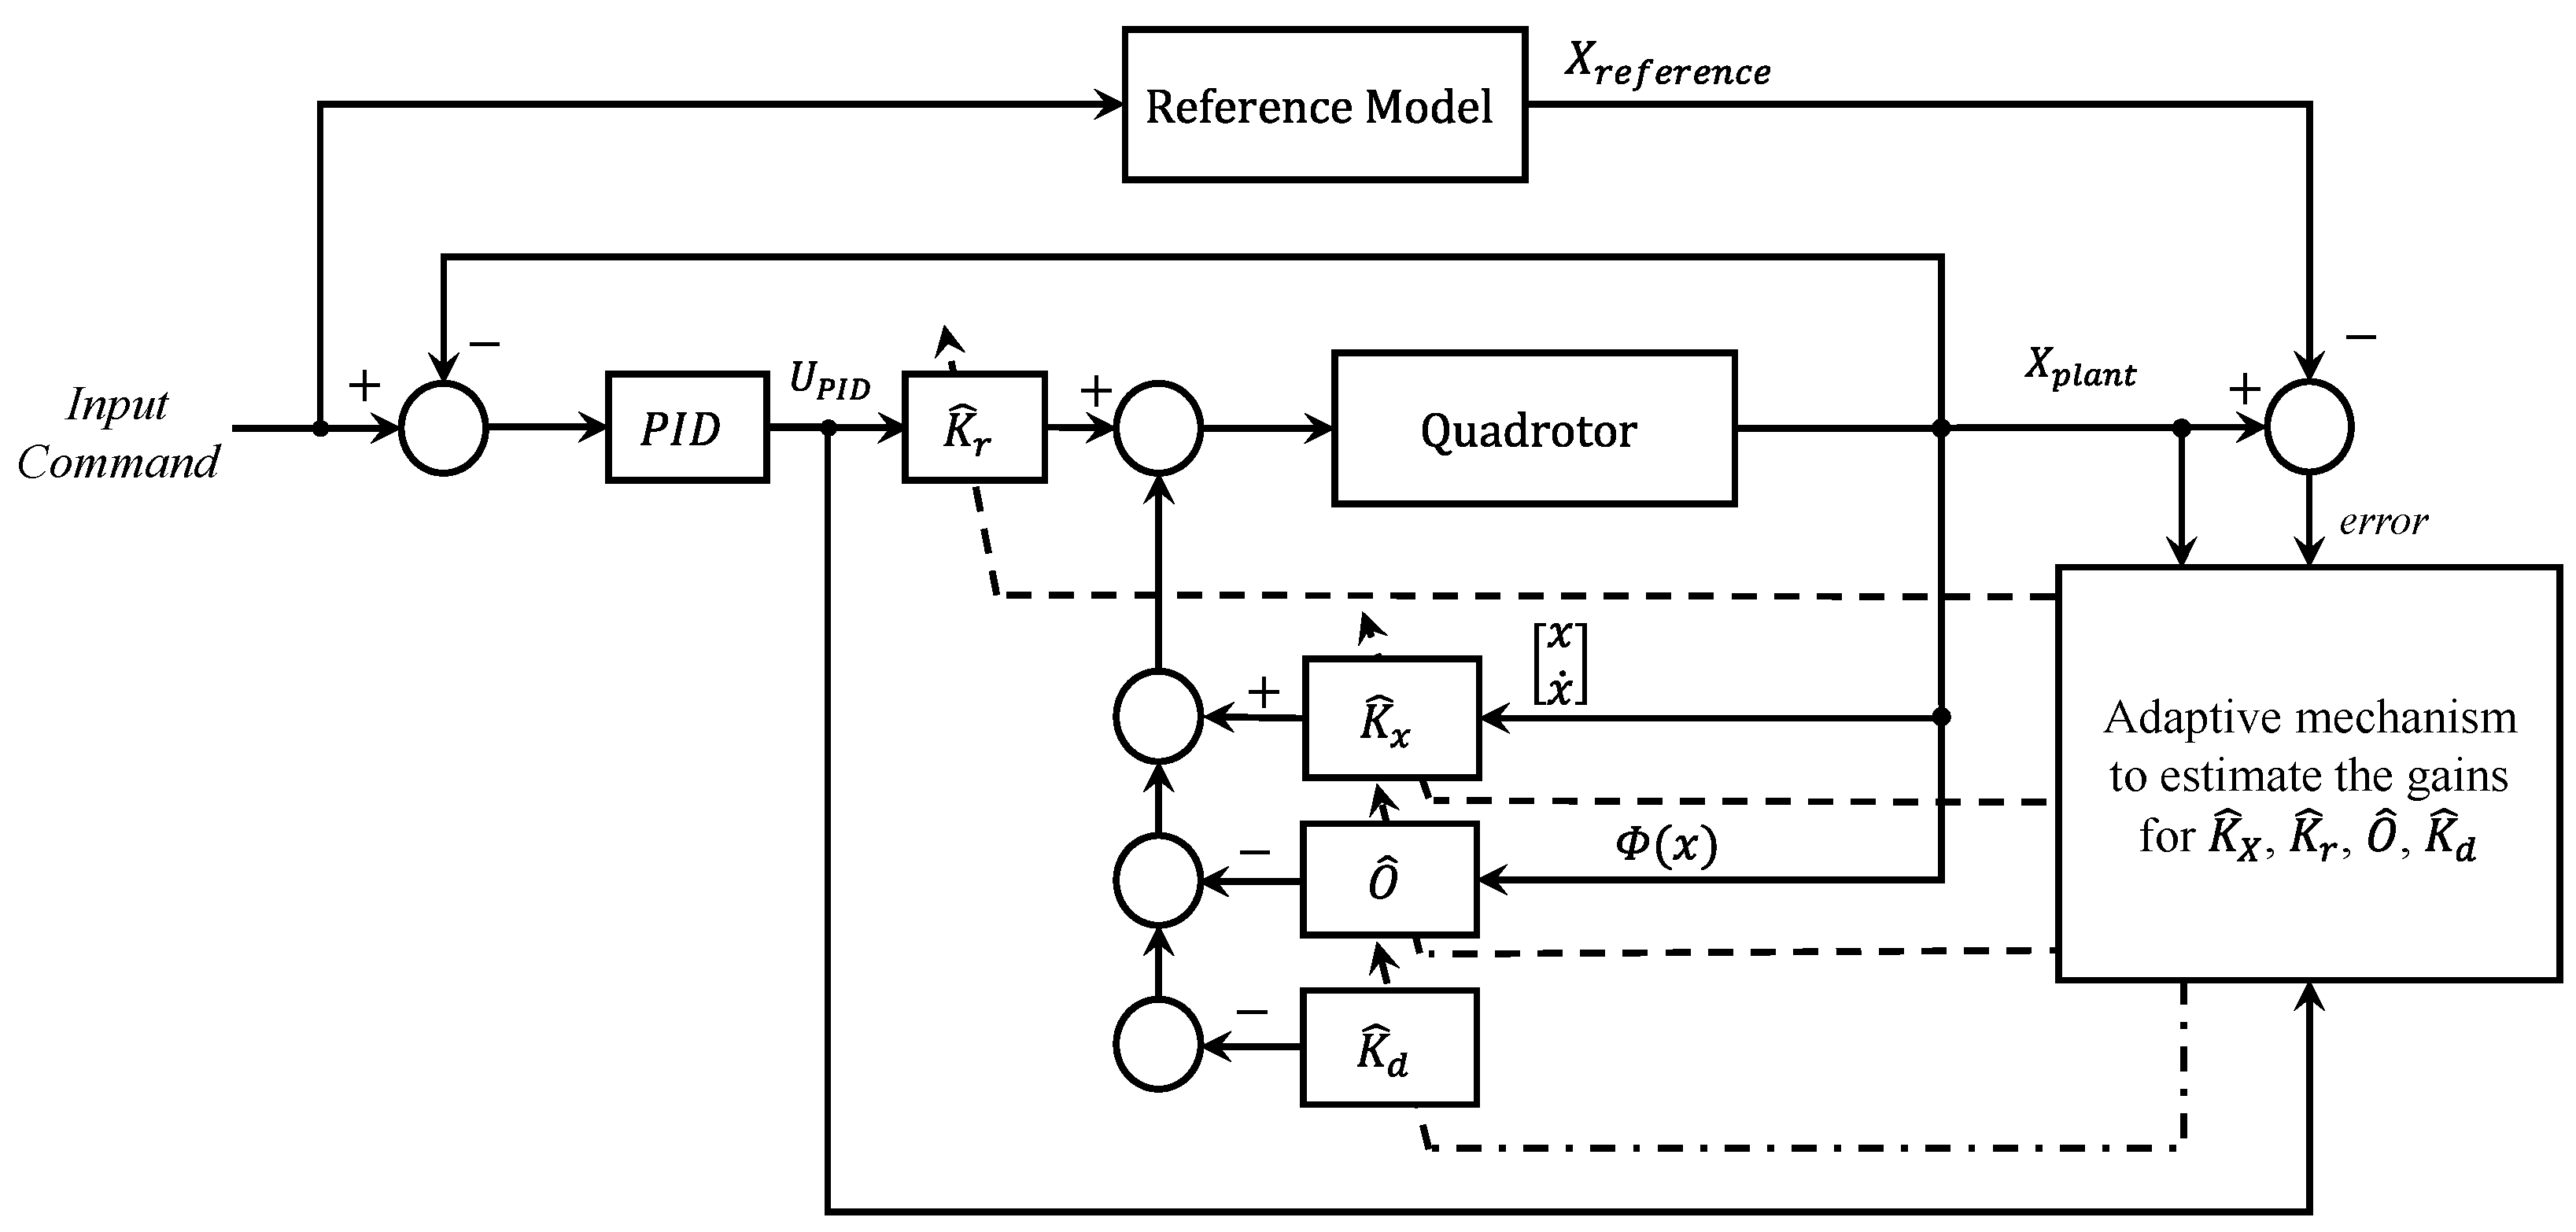
Figure 4.
Generalized MRAC controller for the quadrotor. Solid arrows indicate the signal flow, and dashed arrows represent the adaptation mechanism of the controller gains.
Figure 4.
Generalized MRAC controller for the quadrotor. Solid arrows indicate the signal flow, and dashed arrows represent the adaptation mechanism of the controller gains.
Figure 5.
Block diagram of the cascaded MRAC–LQR controller. Solid arrows indicate the signal flow, and dashed arrows represent the adaptation mechanism of the controller gains.
Figure 5.
Block diagram of the cascaded MRAC–LQR controller. Solid arrows indicate the signal flow, and dashed arrows represent the adaptation mechanism of the controller gains.
Figure 6.
Block diagram of the cascaded MRAC–PID controller. Solid arrows indicate the signal flow, and dashed arrows represent the adaptation mechanism of the controller gains.
Figure 6.
Block diagram of the cascaded MRAC–PID controller. Solid arrows indicate the signal flow, and dashed arrows represent the adaptation mechanism of the controller gains.
Figure 7.
Altitude tracking responses for standalone MRAC, MRAC–PID, and MRAC–LQR controllers.
Figure 7.
Altitude tracking responses for standalone MRAC, MRAC–PID, and MRAC–LQR controllers.
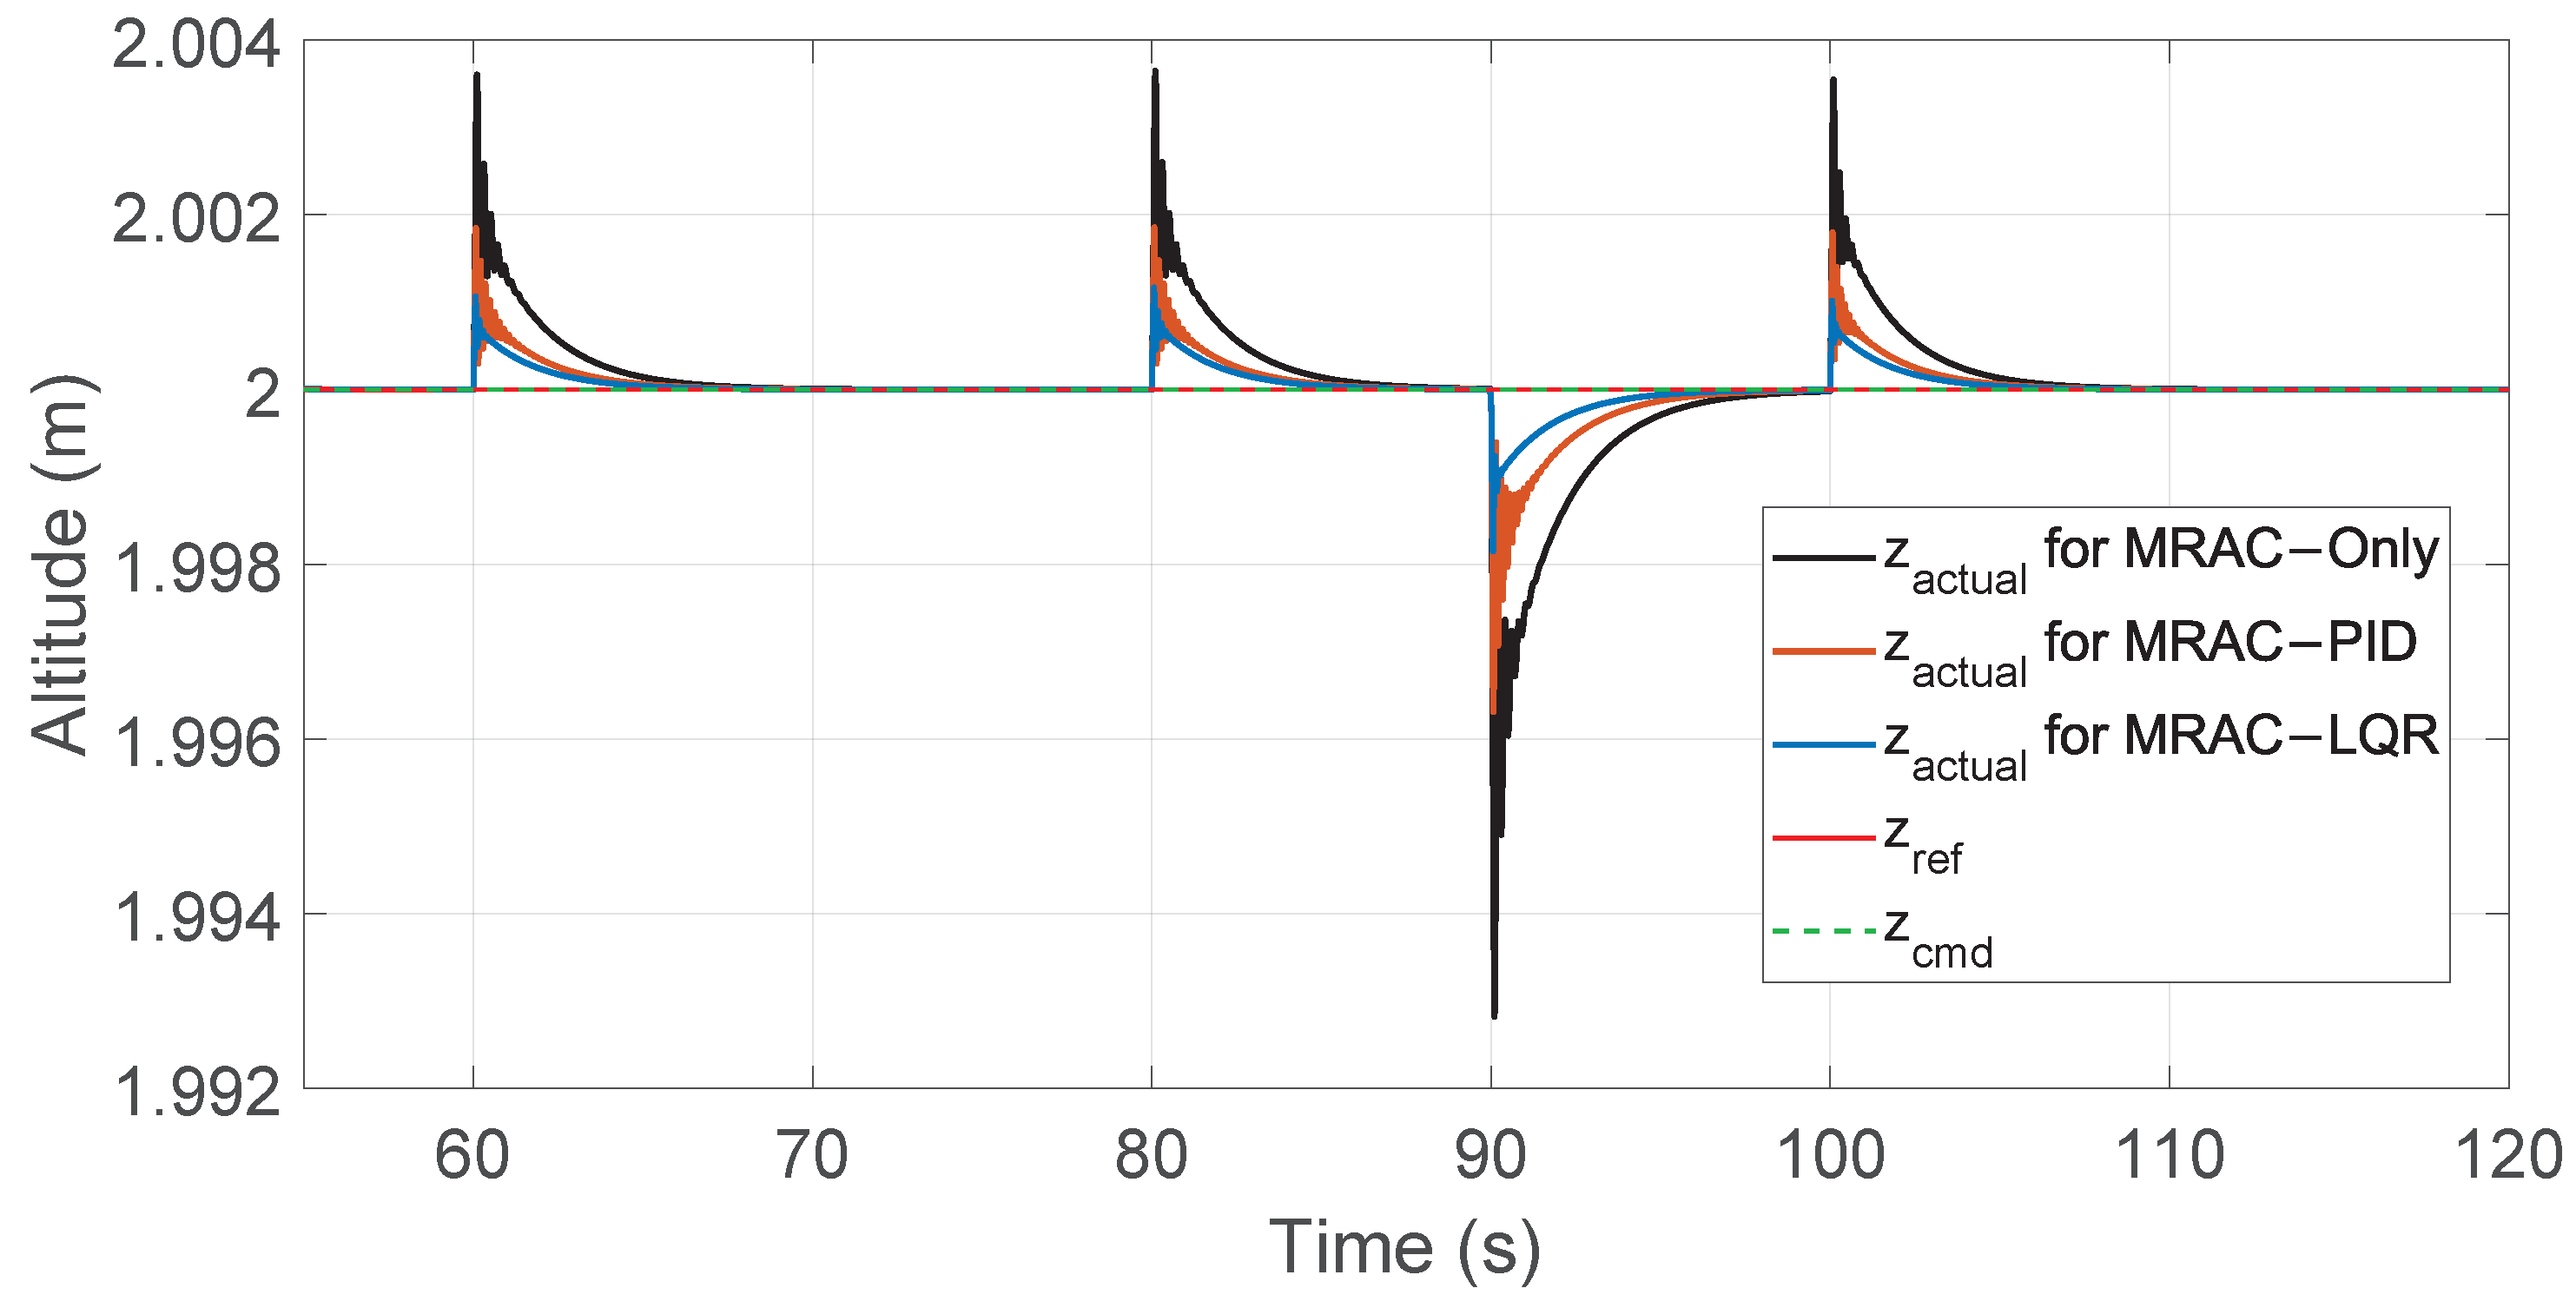
Figure 8.
Zoomed view of altitude responses between 55 s and 120 s illustrating disturbances and mass changes.
Figure 8.
Zoomed view of altitude responses between 55 s and 120 s illustrating disturbances and mass changes.
Figure 9.
Altitude tracking errors for standalone MRAC, MRAC–PID, and MRAC–LQR controllers.
Figure 9.
Altitude tracking errors for standalone MRAC, MRAC–PID, and MRAC–LQR controllers.
Figure 10.
Roll angle tracking performance for MRAC controllers.
Figure 10.
Roll angle tracking performance for MRAC controllers.
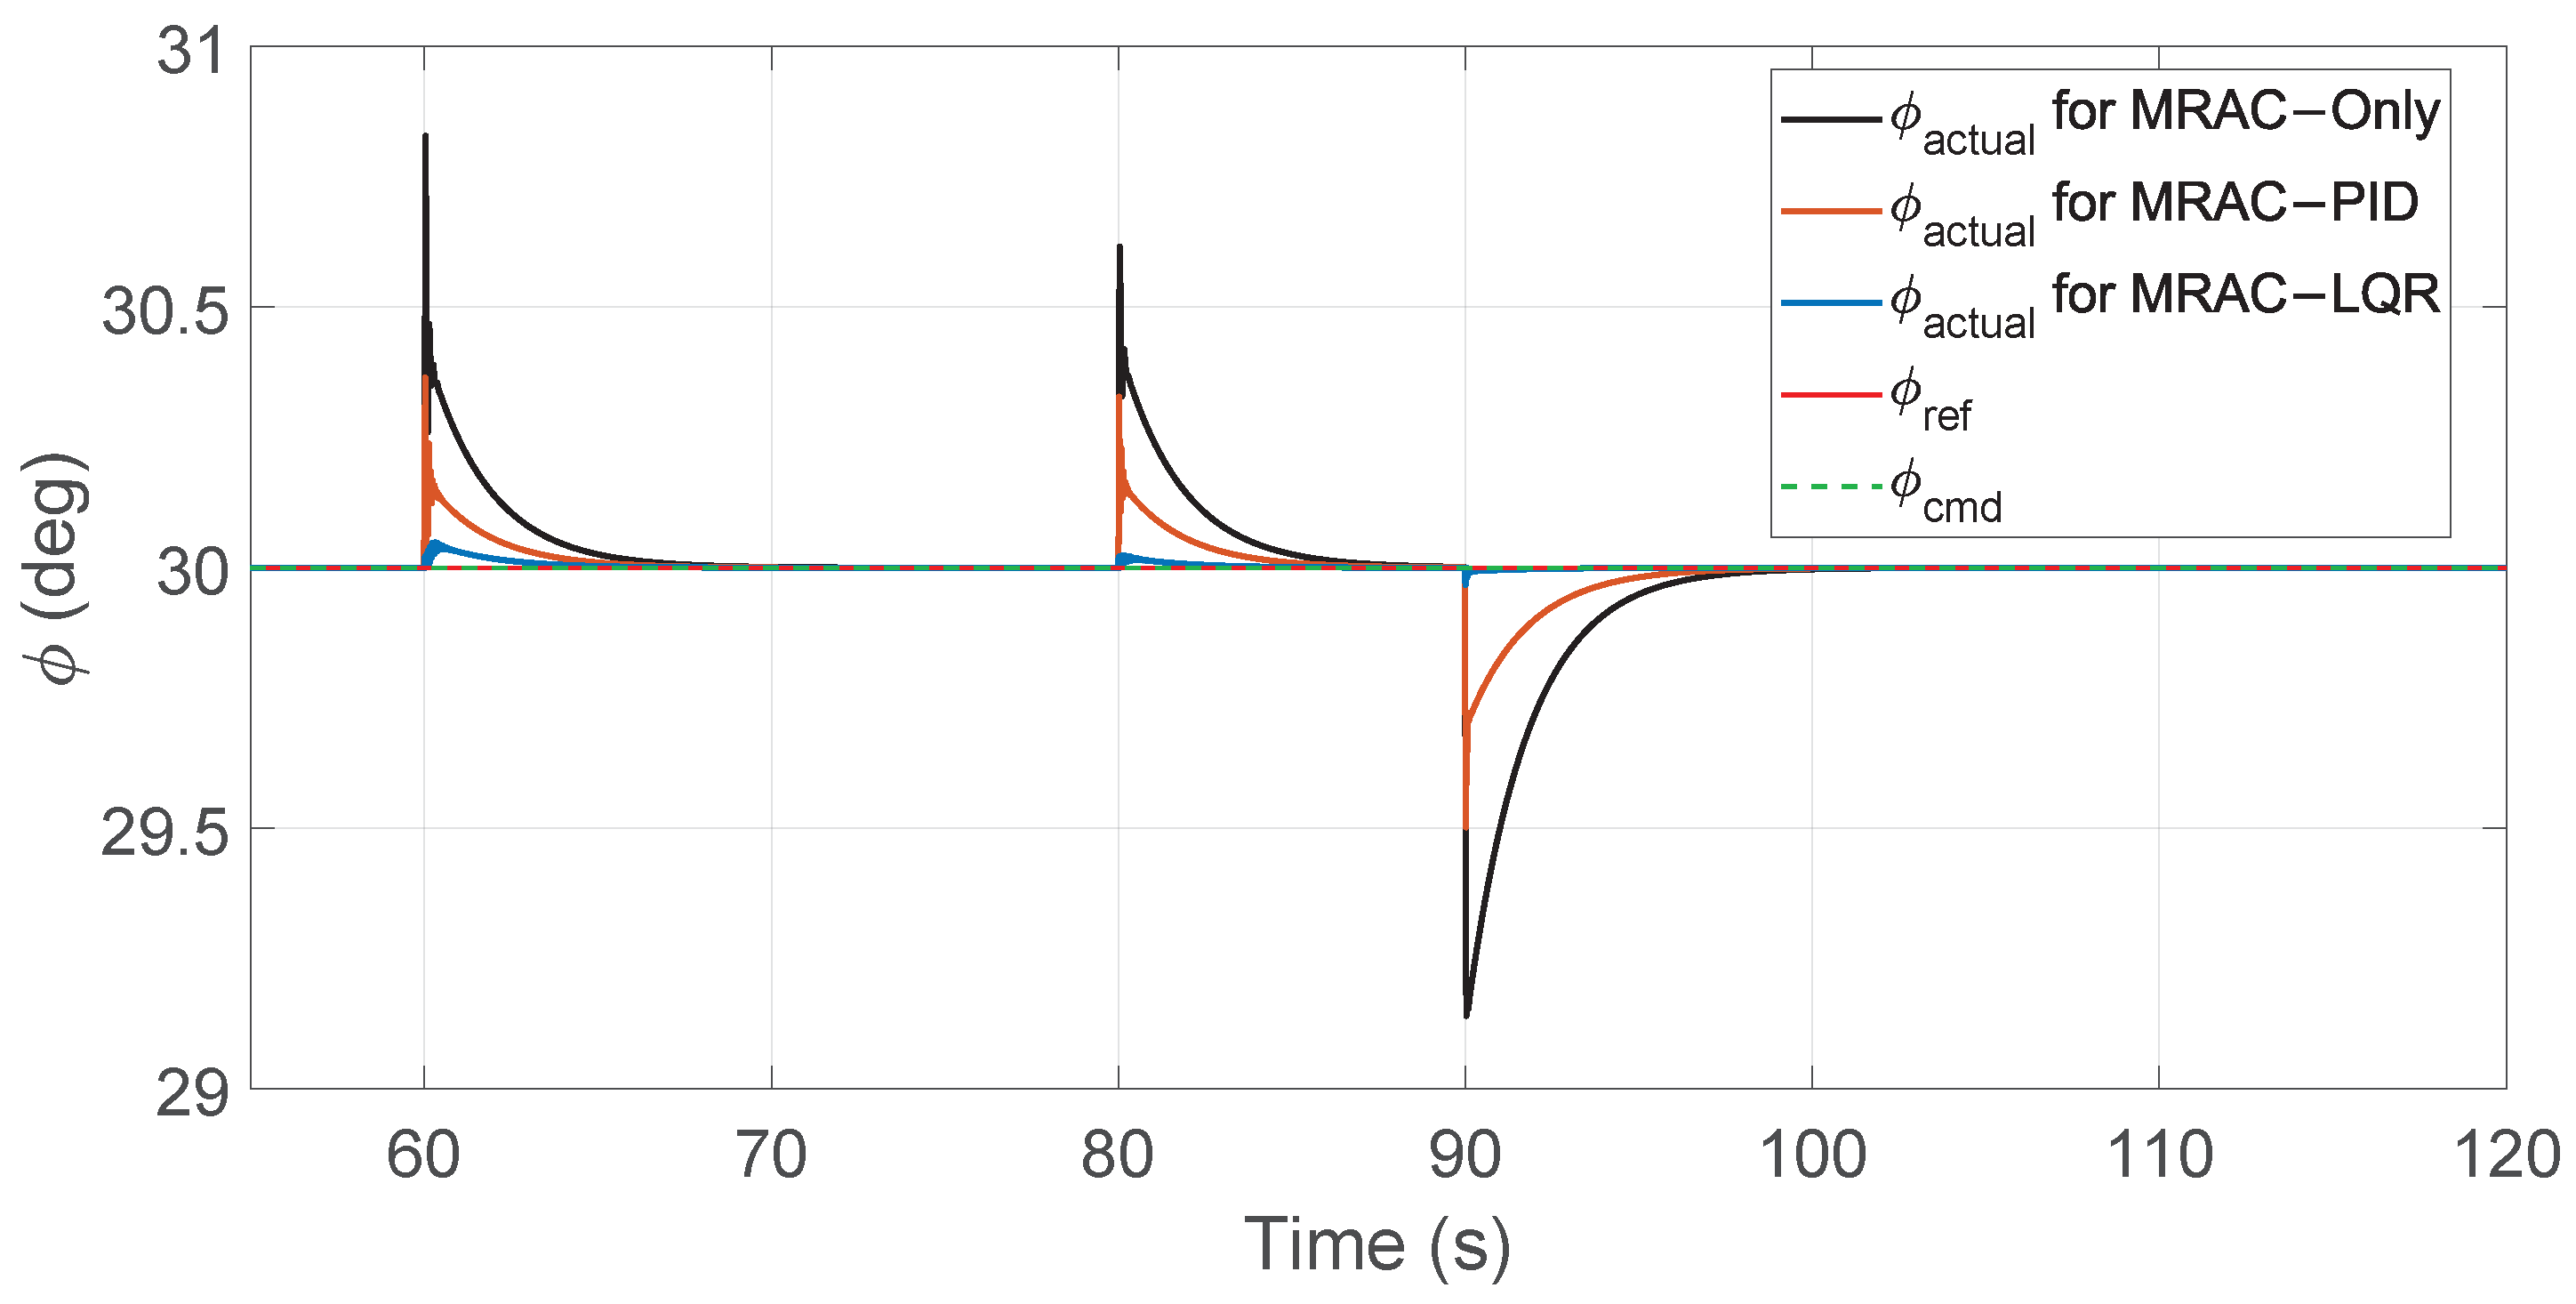
Figure 11.
Zoomed view of roll angle tracking showing disturbance periods.
Figure 11.
Zoomed view of roll angle tracking showing disturbance periods.
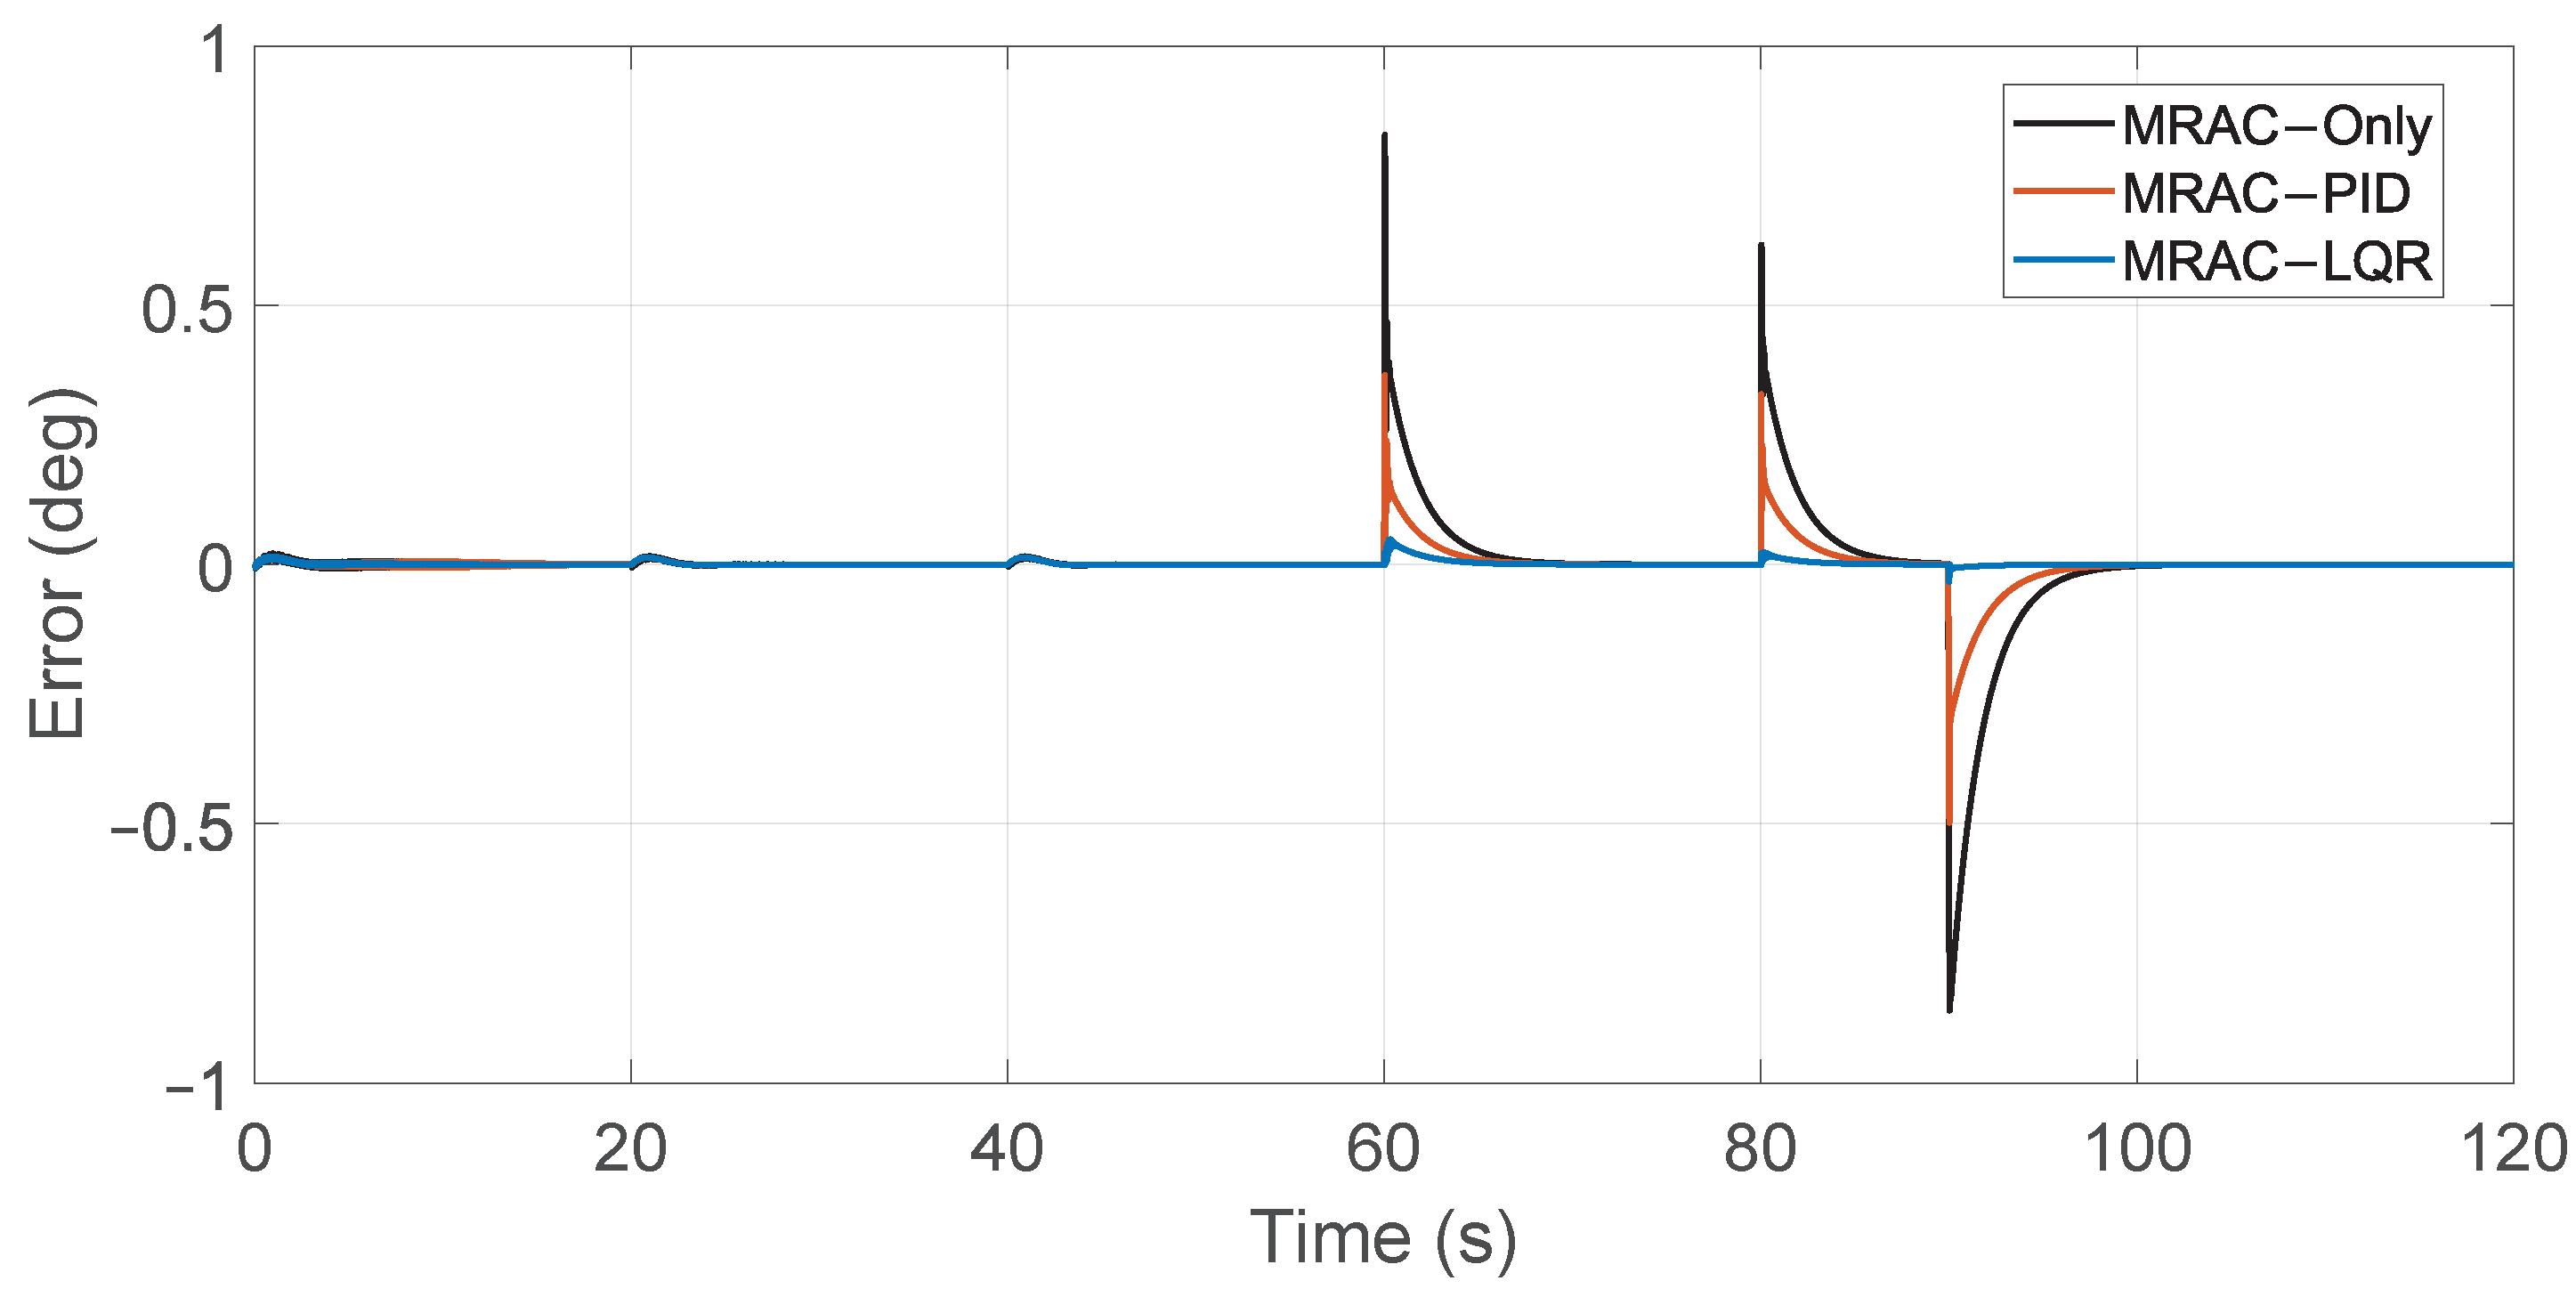
Figure 12.
Roll angle tracking errors for MRAC controllers.
Figure 12.
Roll angle tracking errors for MRAC controllers.
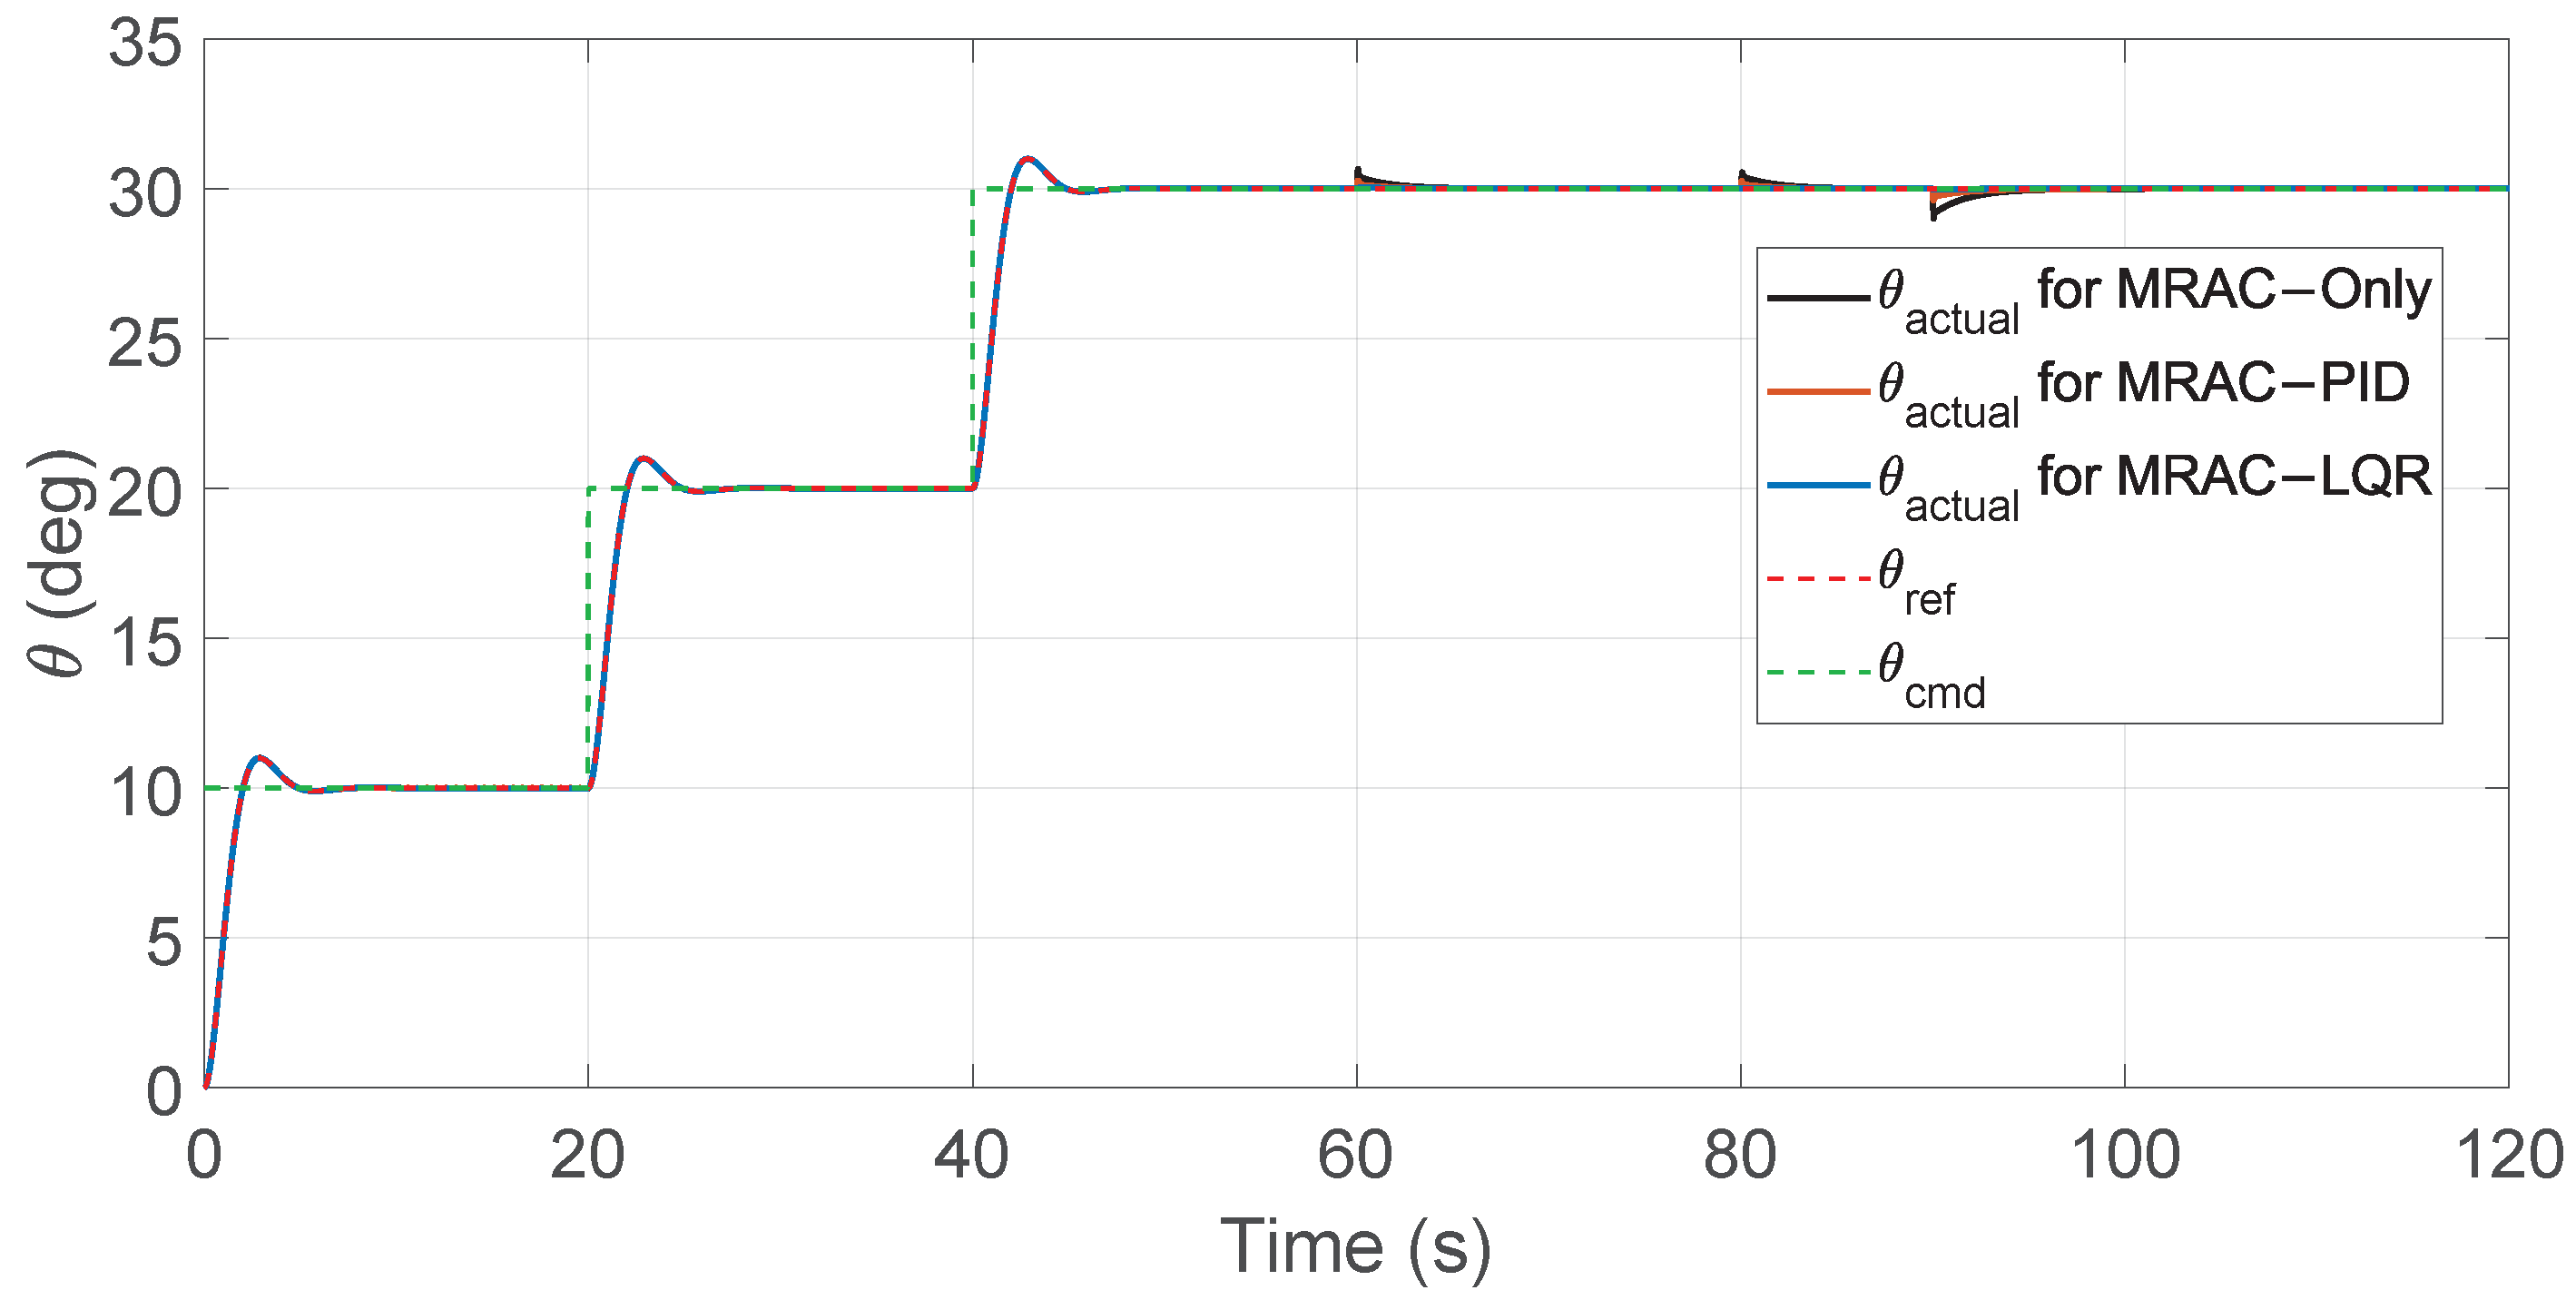
Figure 13.
Pitch angle tracking performance for MRAC controllers.
Figure 13.
Pitch angle tracking performance for MRAC controllers.
Figure 14.
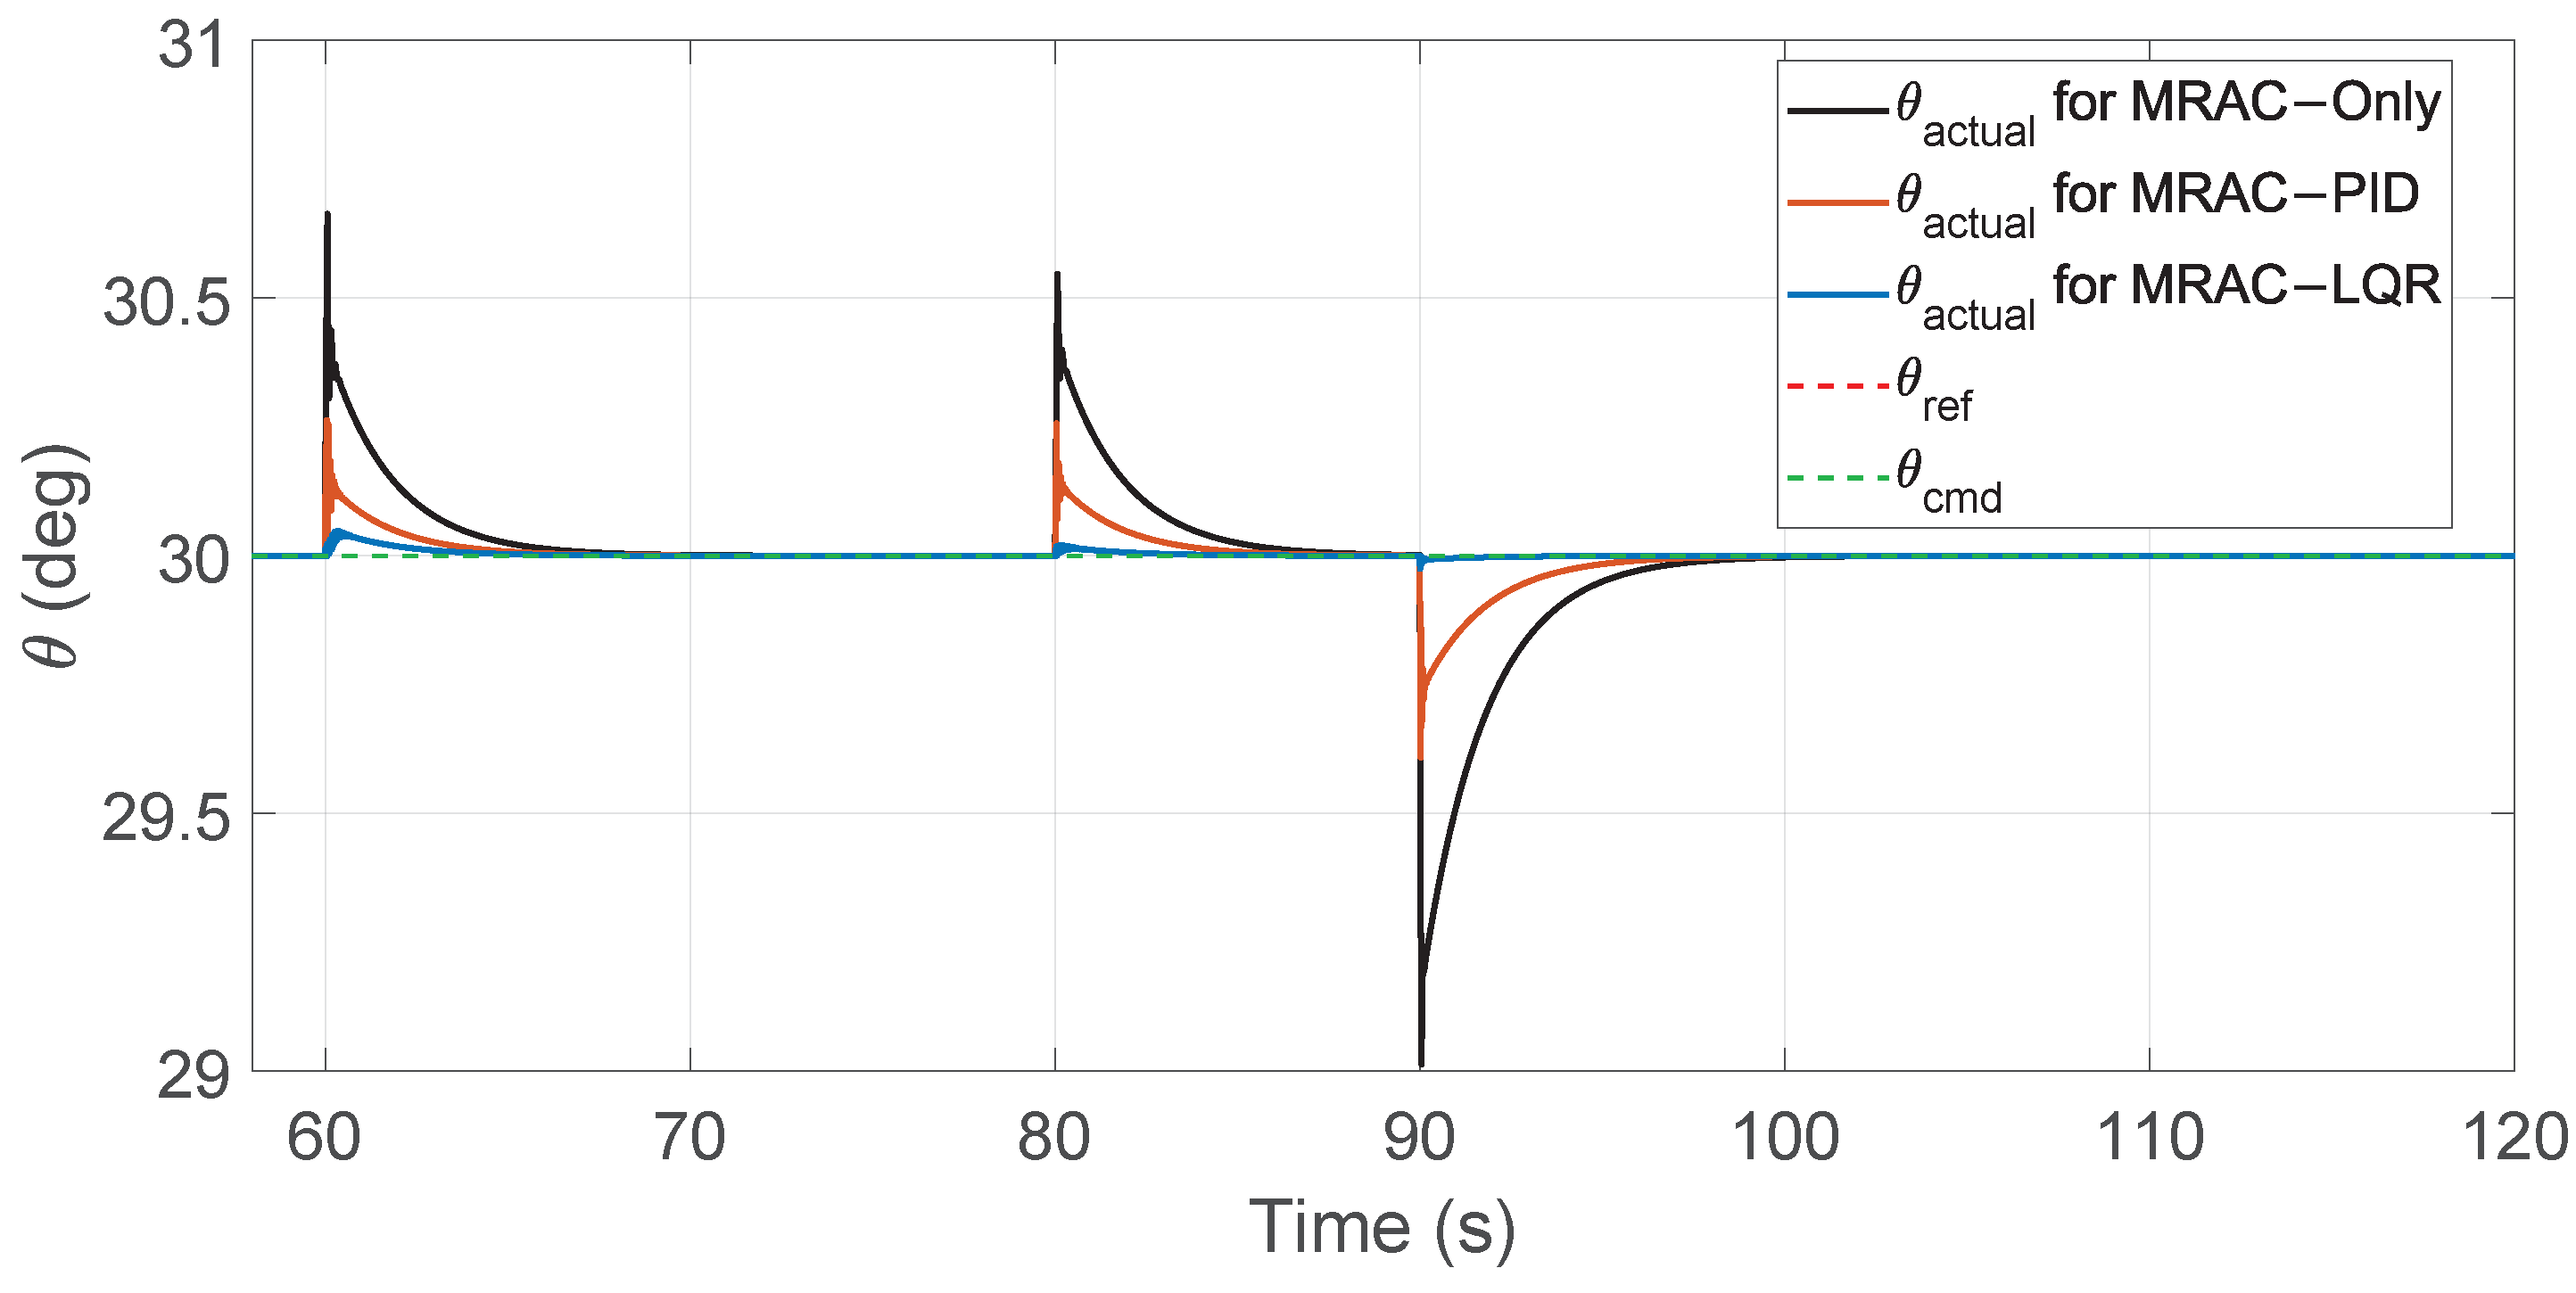
Zoomed view of pitch angle tracking showing disturbance periods.
Figure 14.
Zoomed view of pitch angle tracking showing disturbance periods.
Figure 15.
Pitch angle tracking errors for MRAC controllers.
Figure 15.
Pitch angle tracking errors for MRAC controllers.
Figure 16.
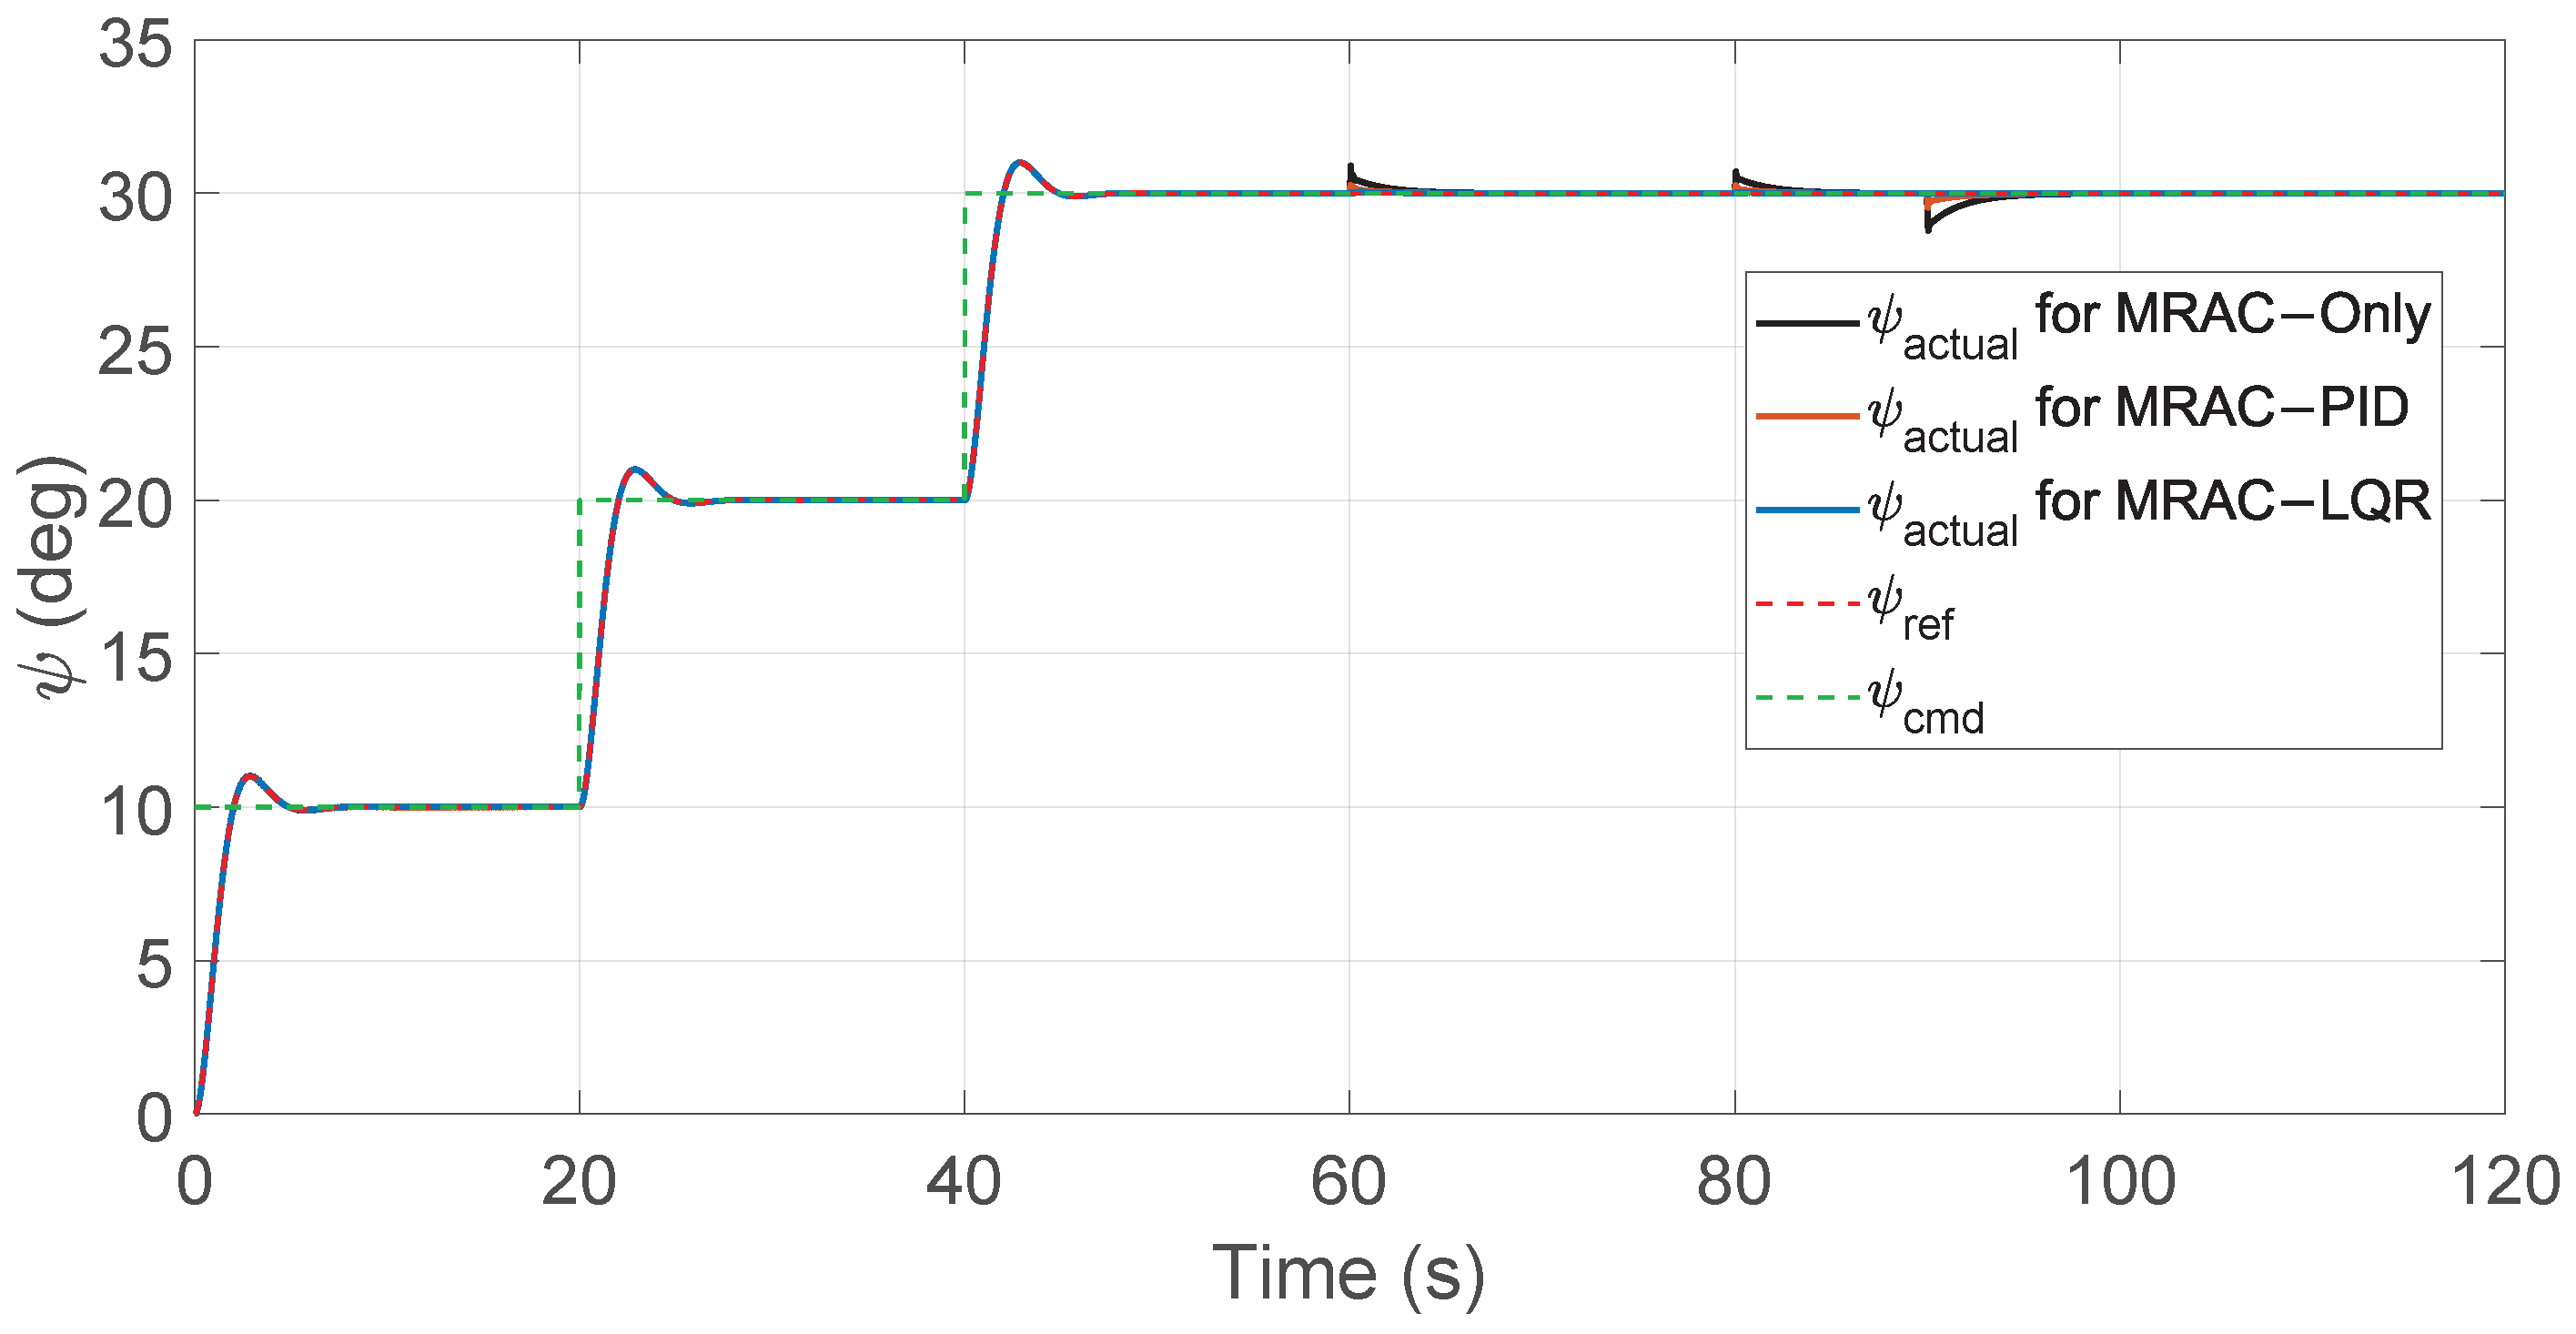
Yaw angle tracking performance for MRAC controllers.
Figure 16.
Yaw angle tracking performance for MRAC controllers.
Figure 17.
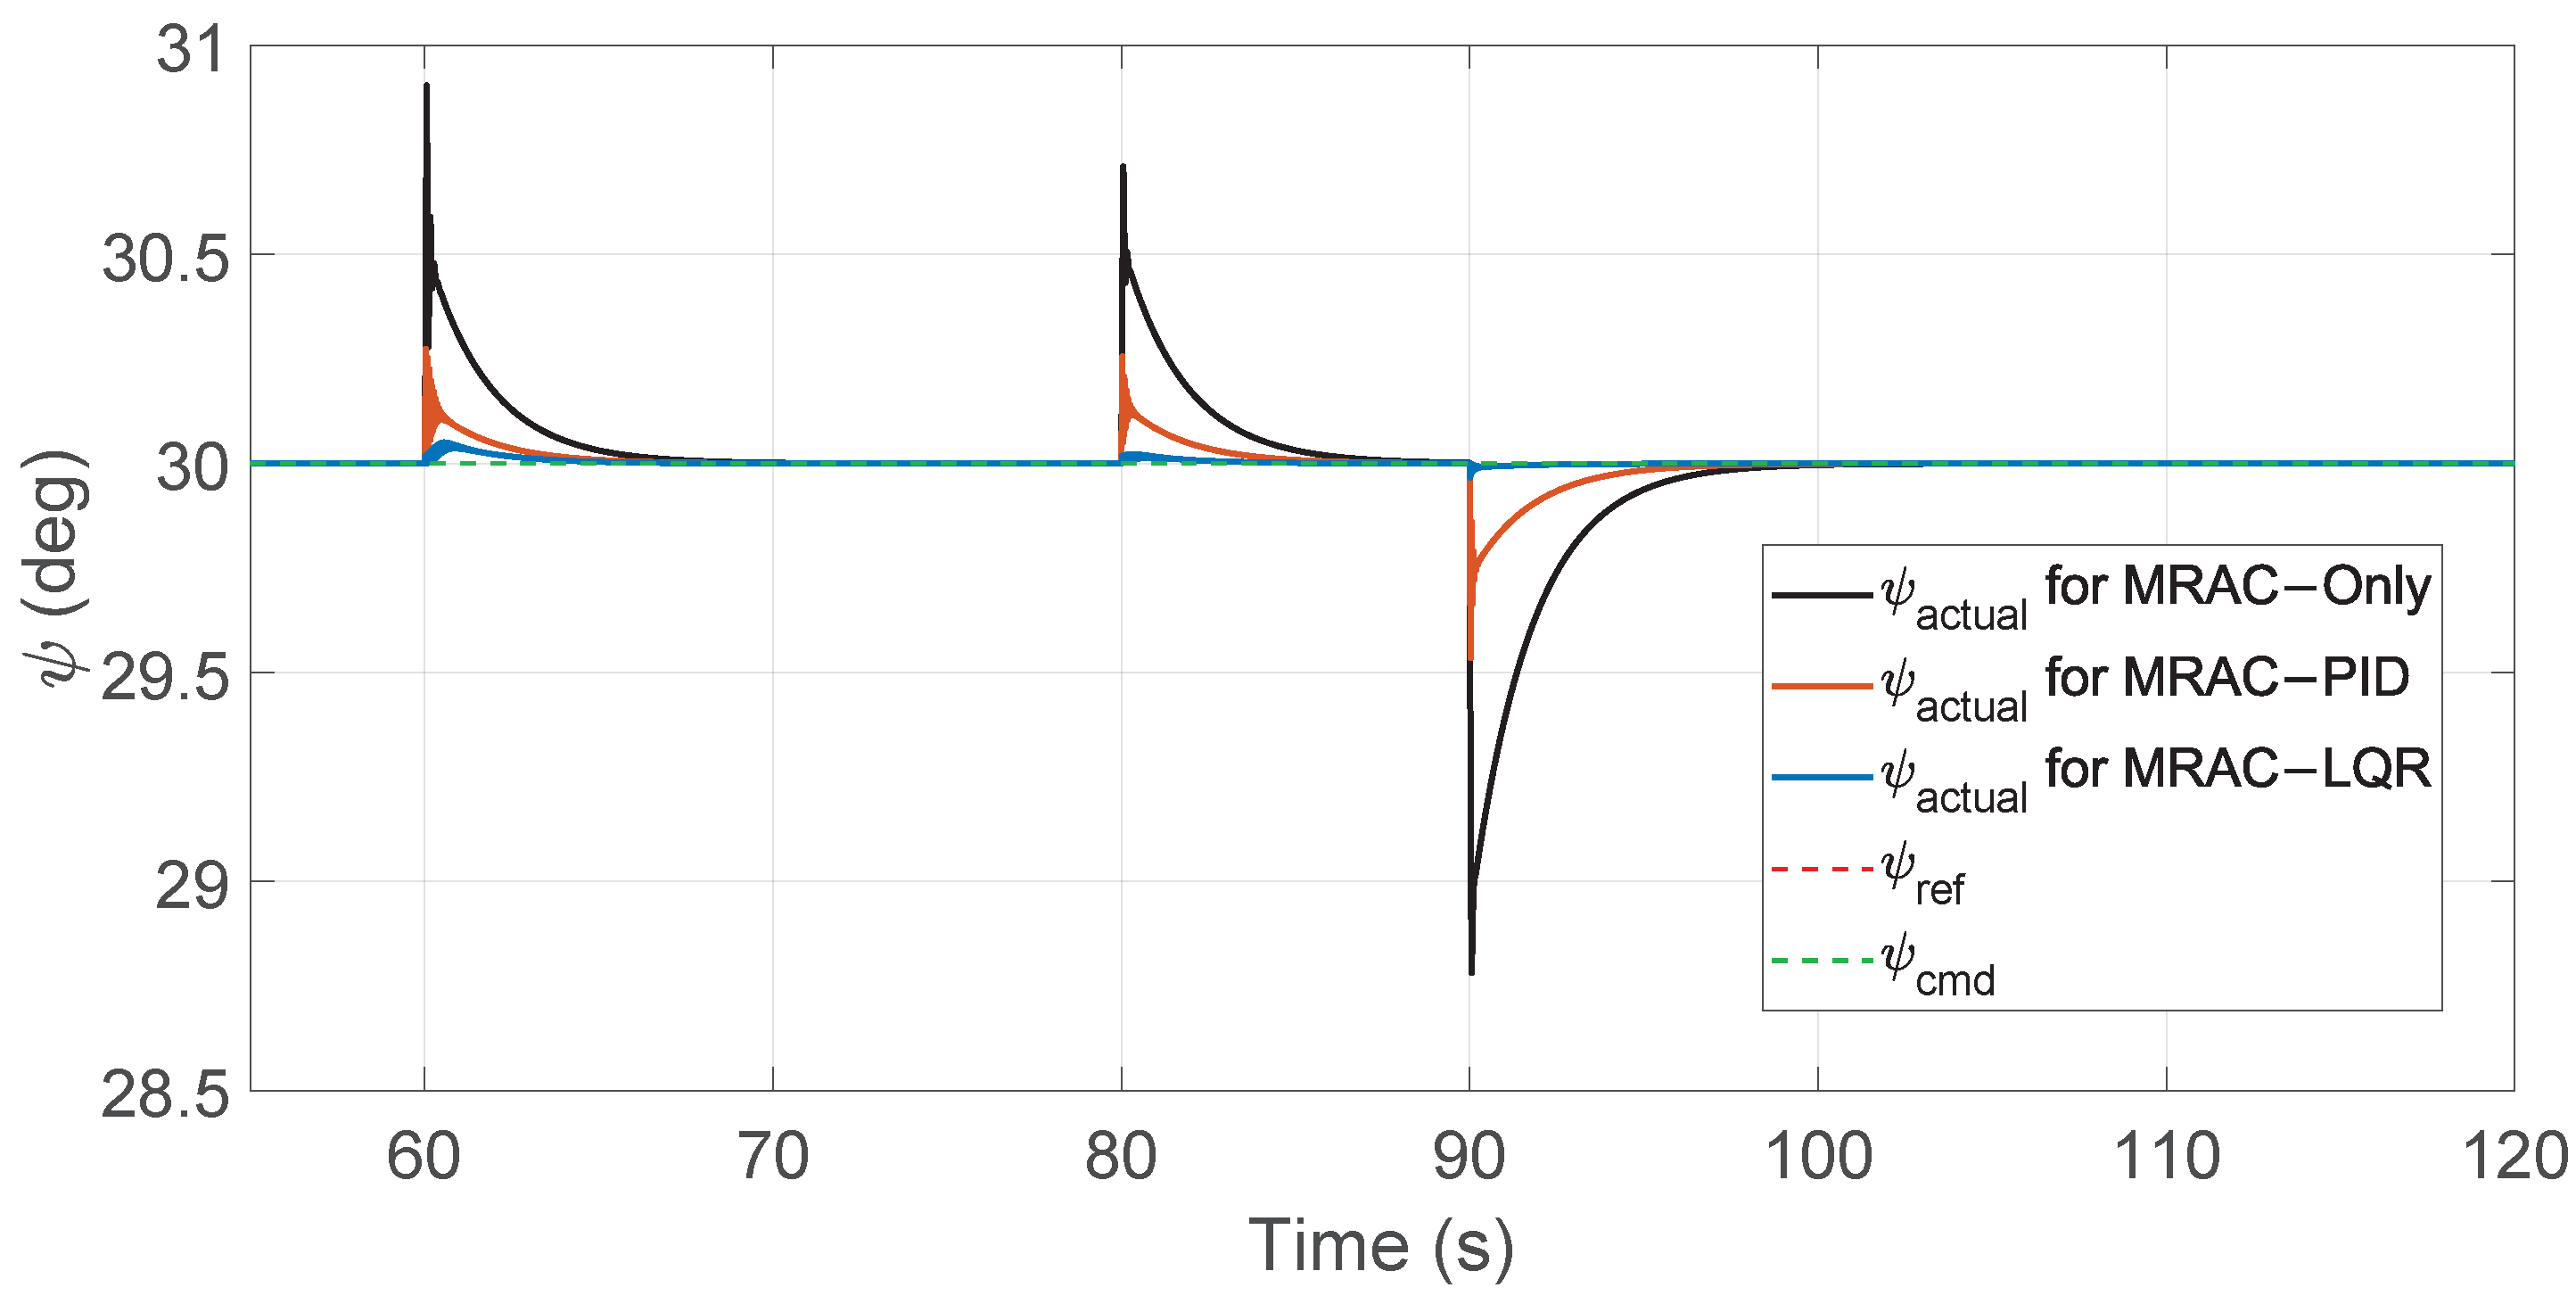
Zoomed view of yaw angle tracking showing disturbance periods.
Figure 17.
Zoomed view of yaw angle tracking showing disturbance periods.
Figure 18.
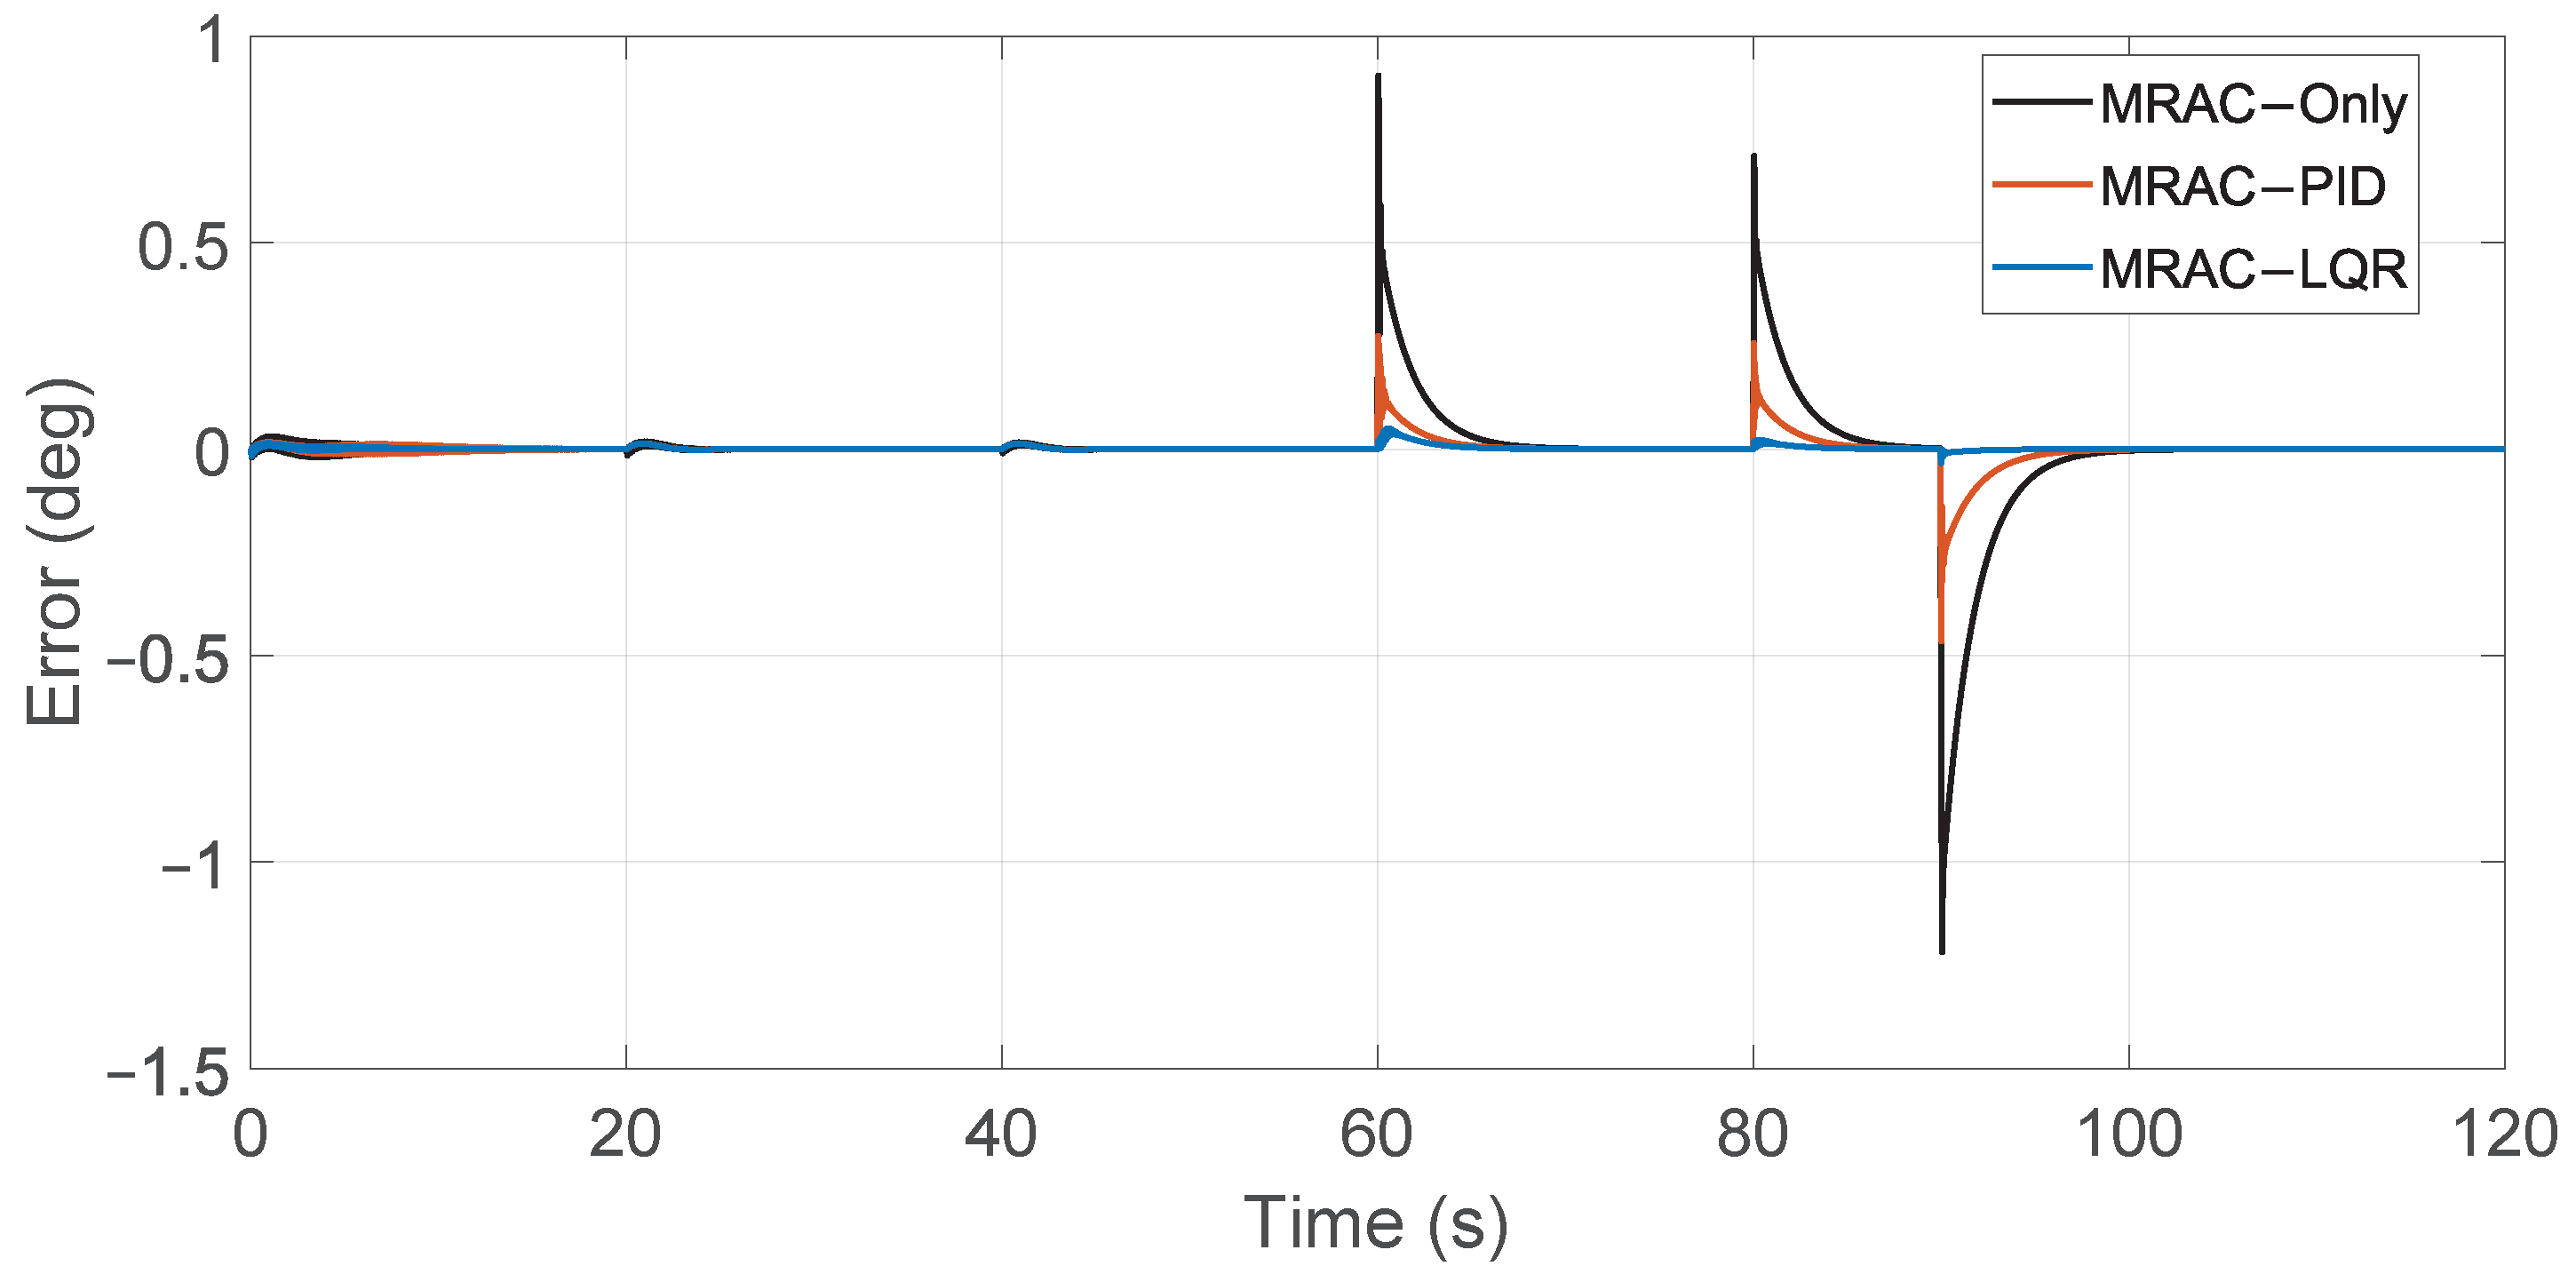
Yaw angle tracking errors for MRAC controllers.
Figure 18.
Yaw angle tracking errors for MRAC controllers.
Figure 19.
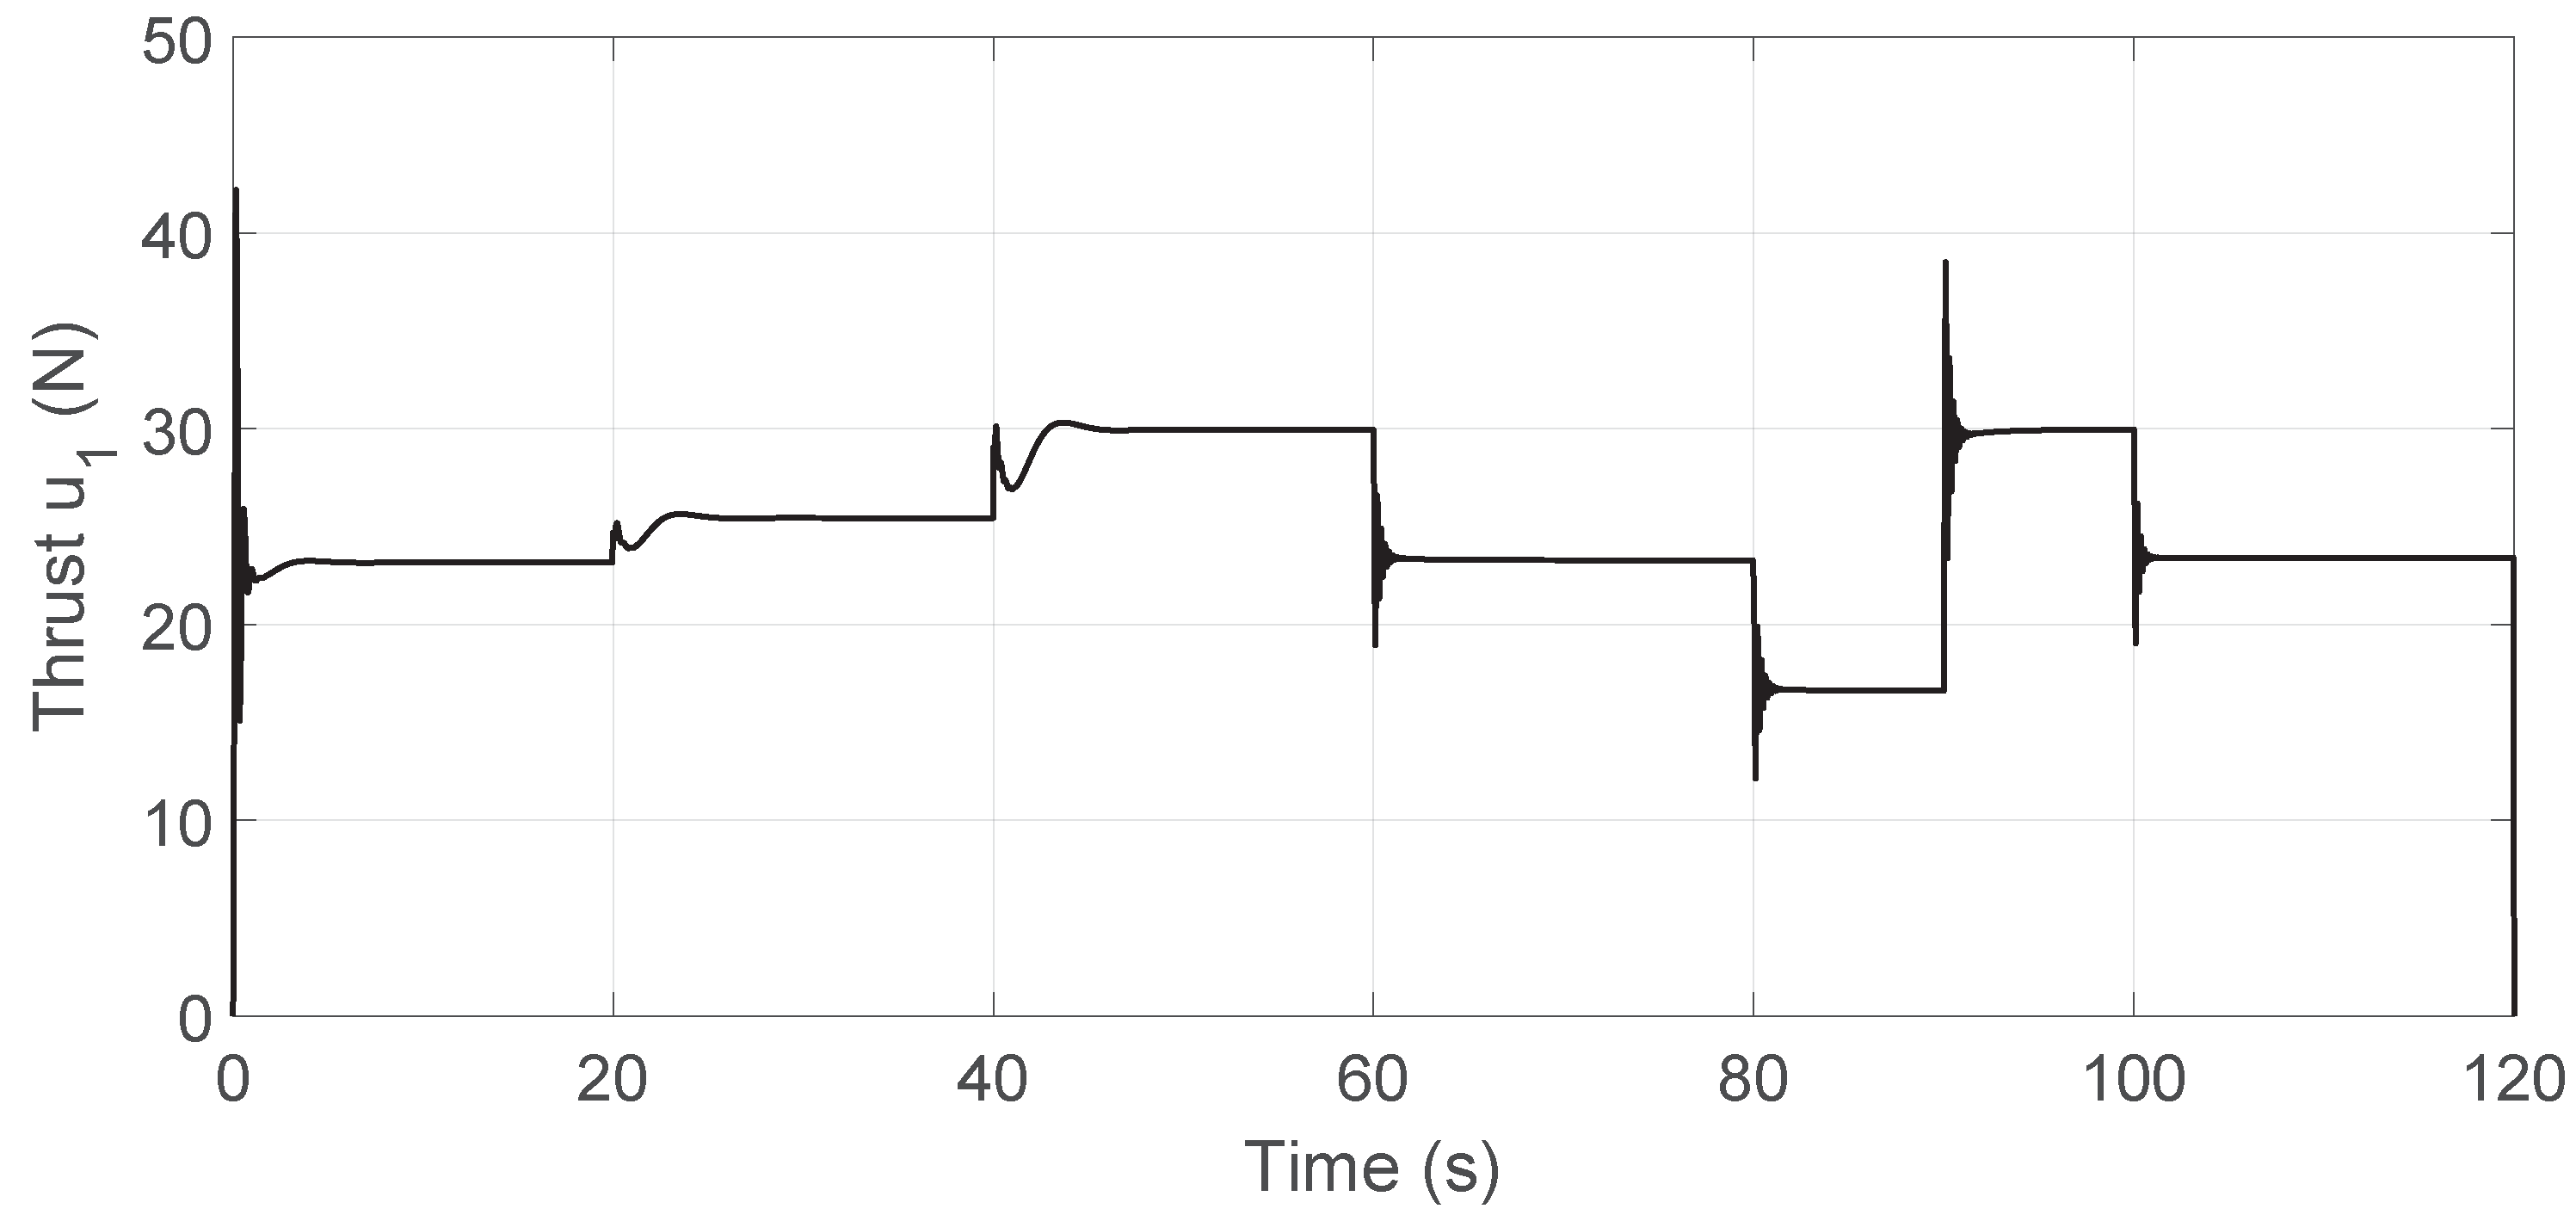
Control input for standalone MRAC.
Figure 19.
Control input for standalone MRAC.
Figure 20.
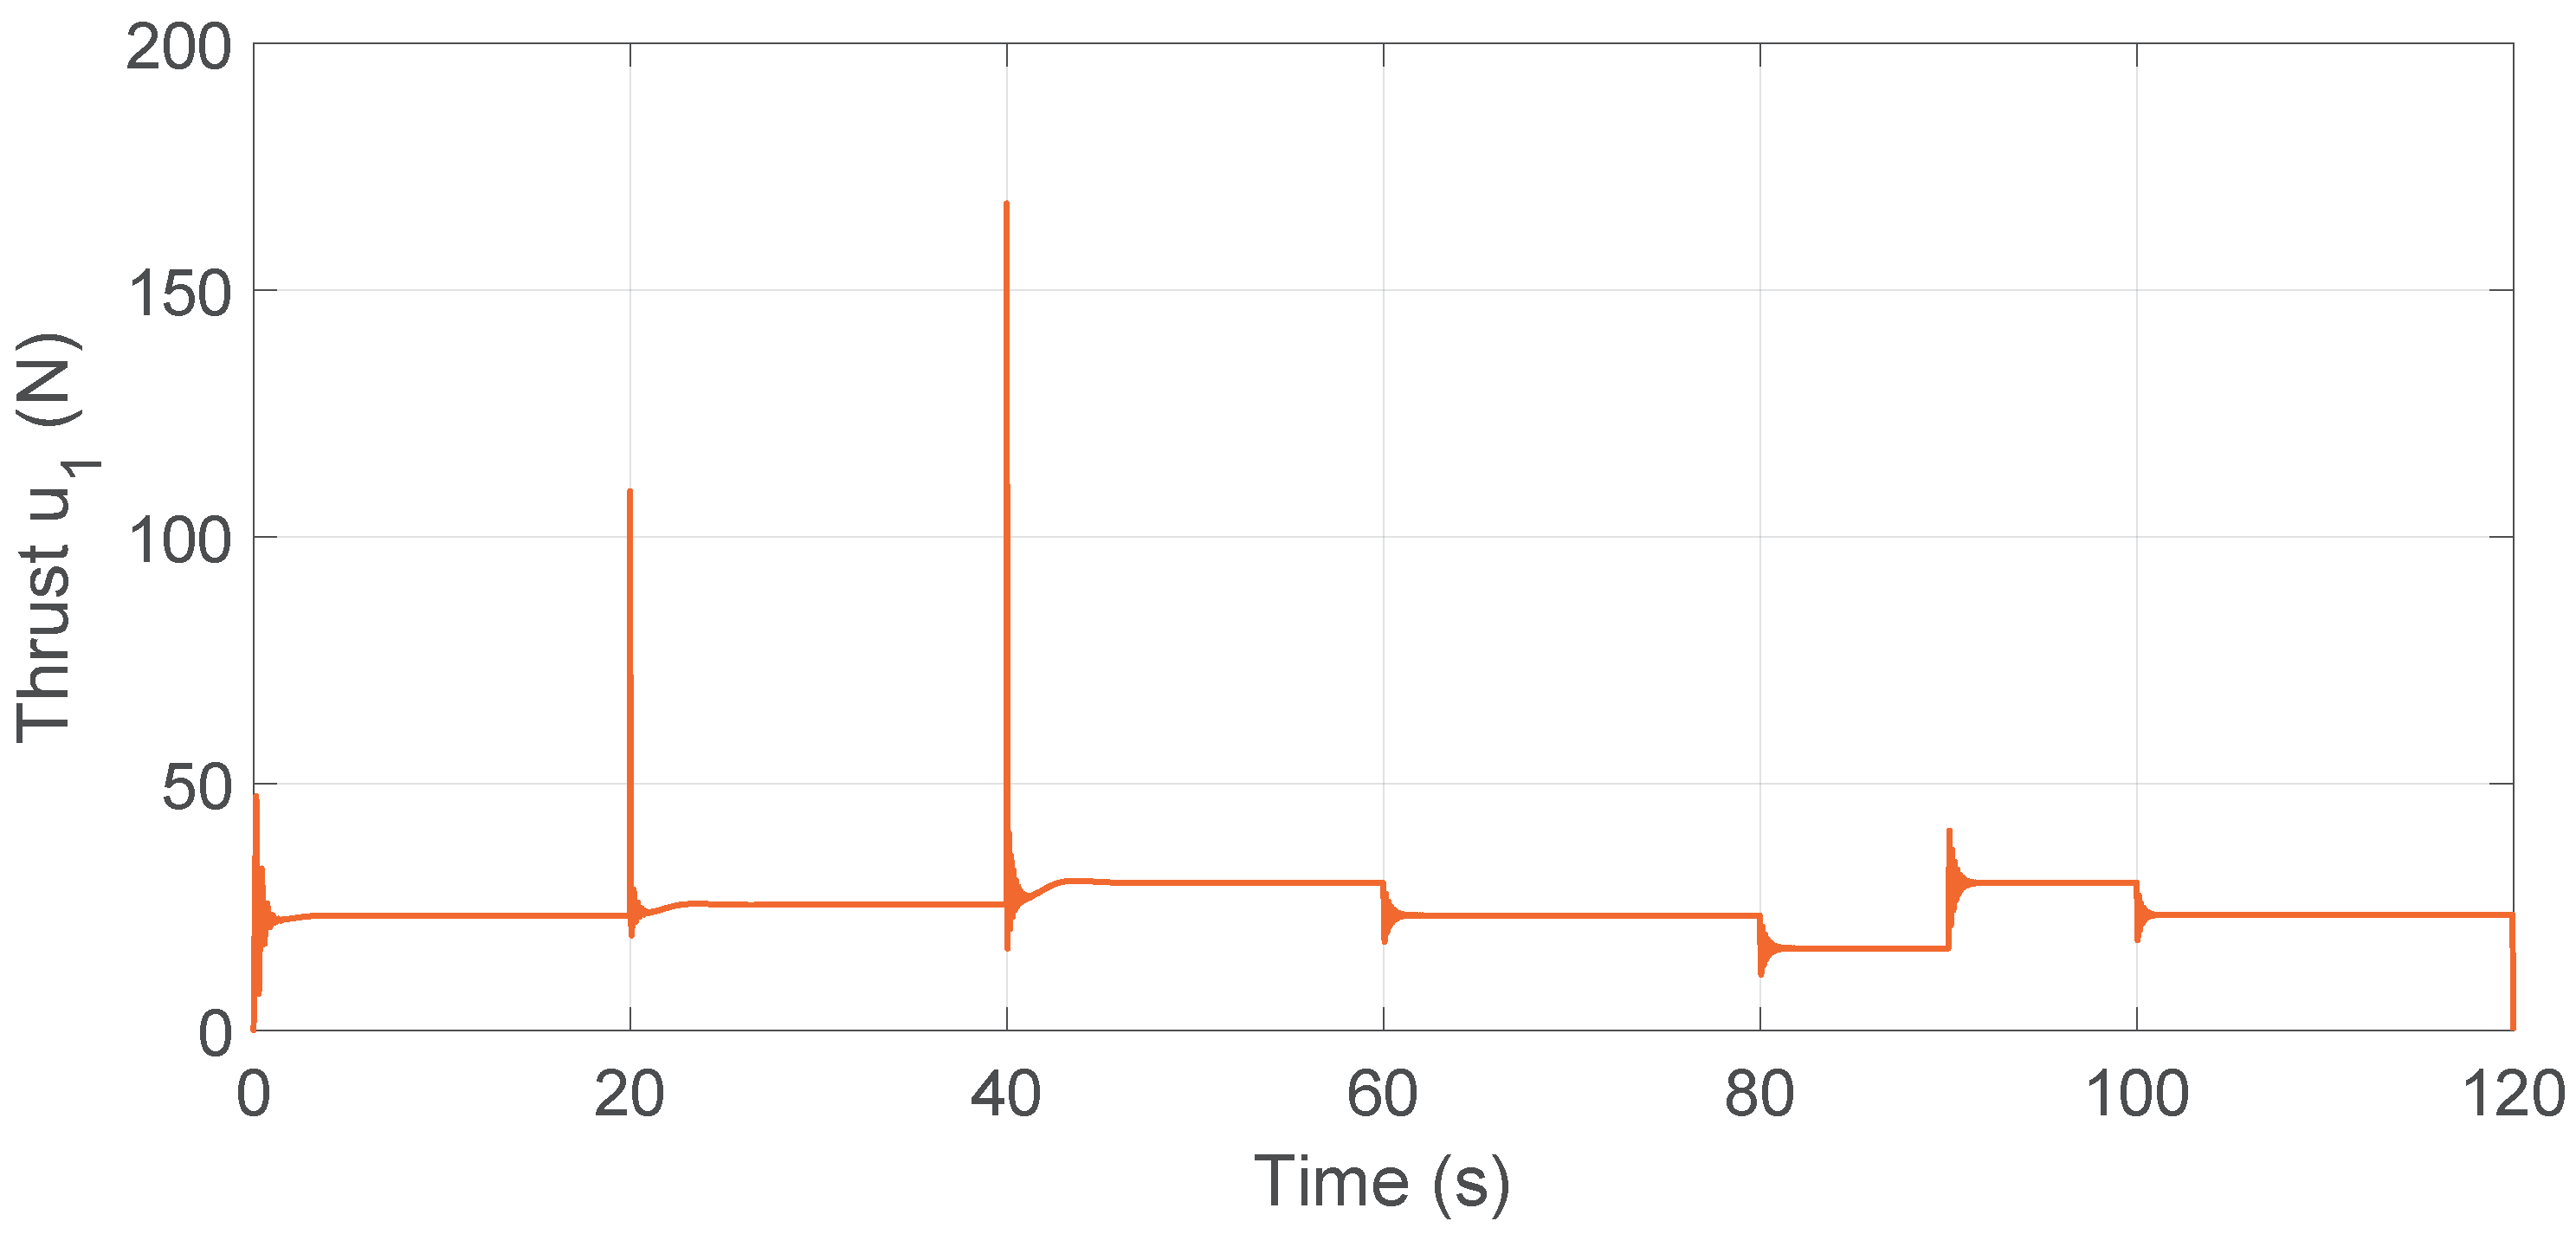
Control input for MRAC–PID.
Figure 20.
Control input for MRAC–PID.
Figure 21.
Zoomed view of the MRAC–PID thrust input around .
Figure 21.
Zoomed view of the MRAC–PID thrust input around .
Figure 22.
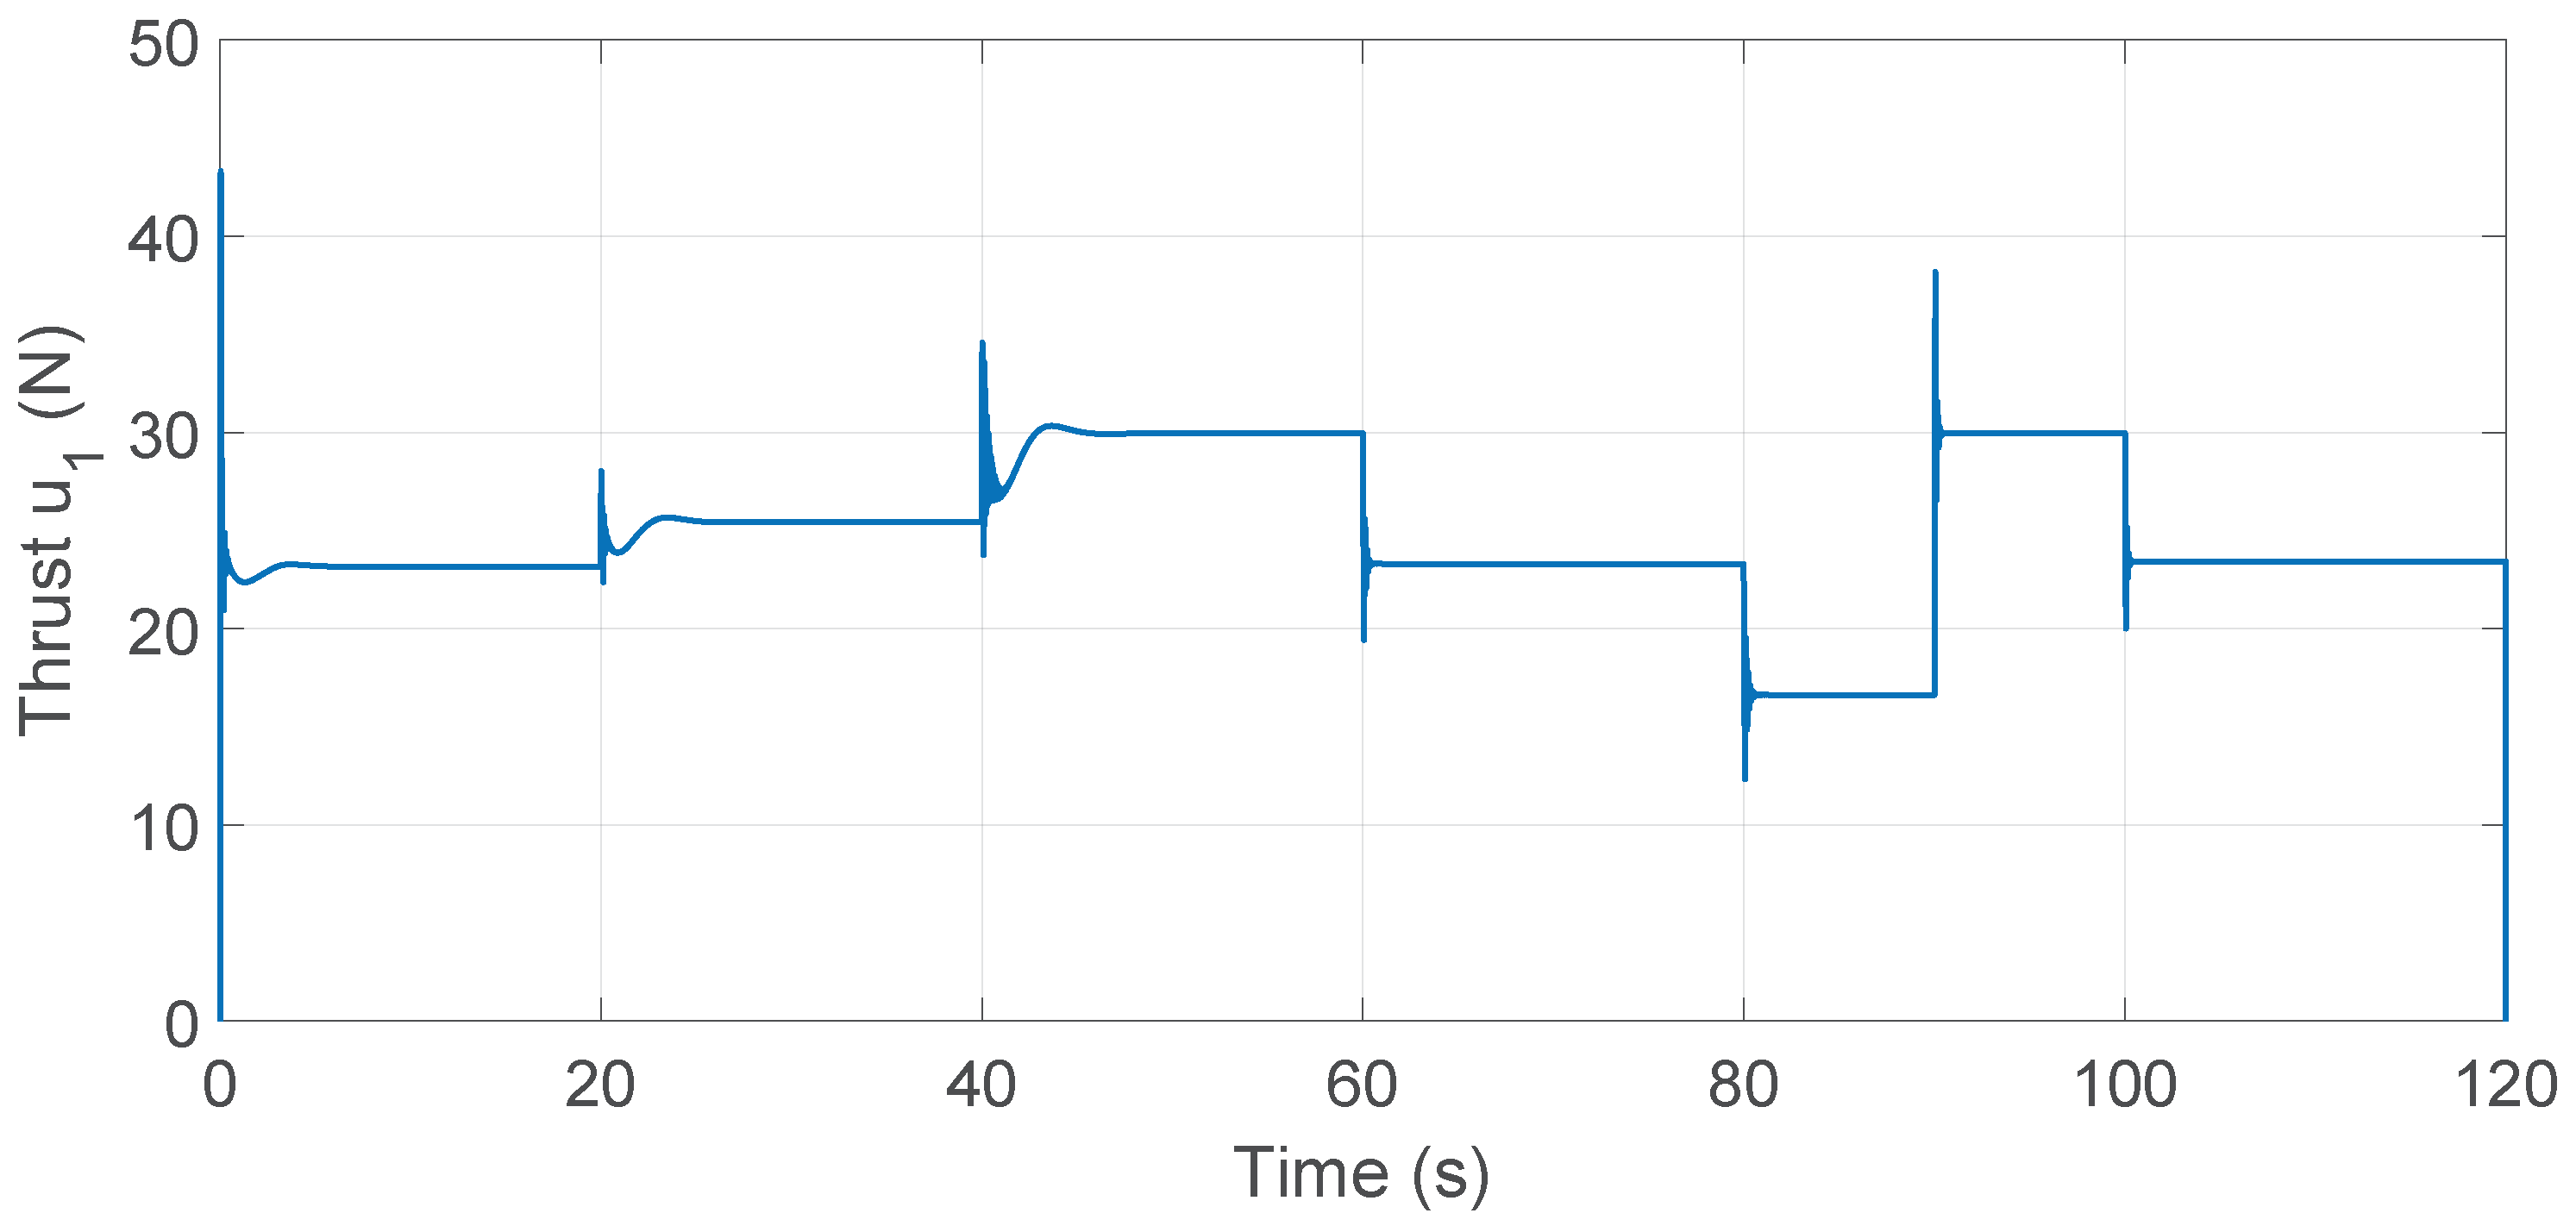
Control input for MRAC–LQR.
Figure 22.
Control input for MRAC–LQR.
Figure 23.
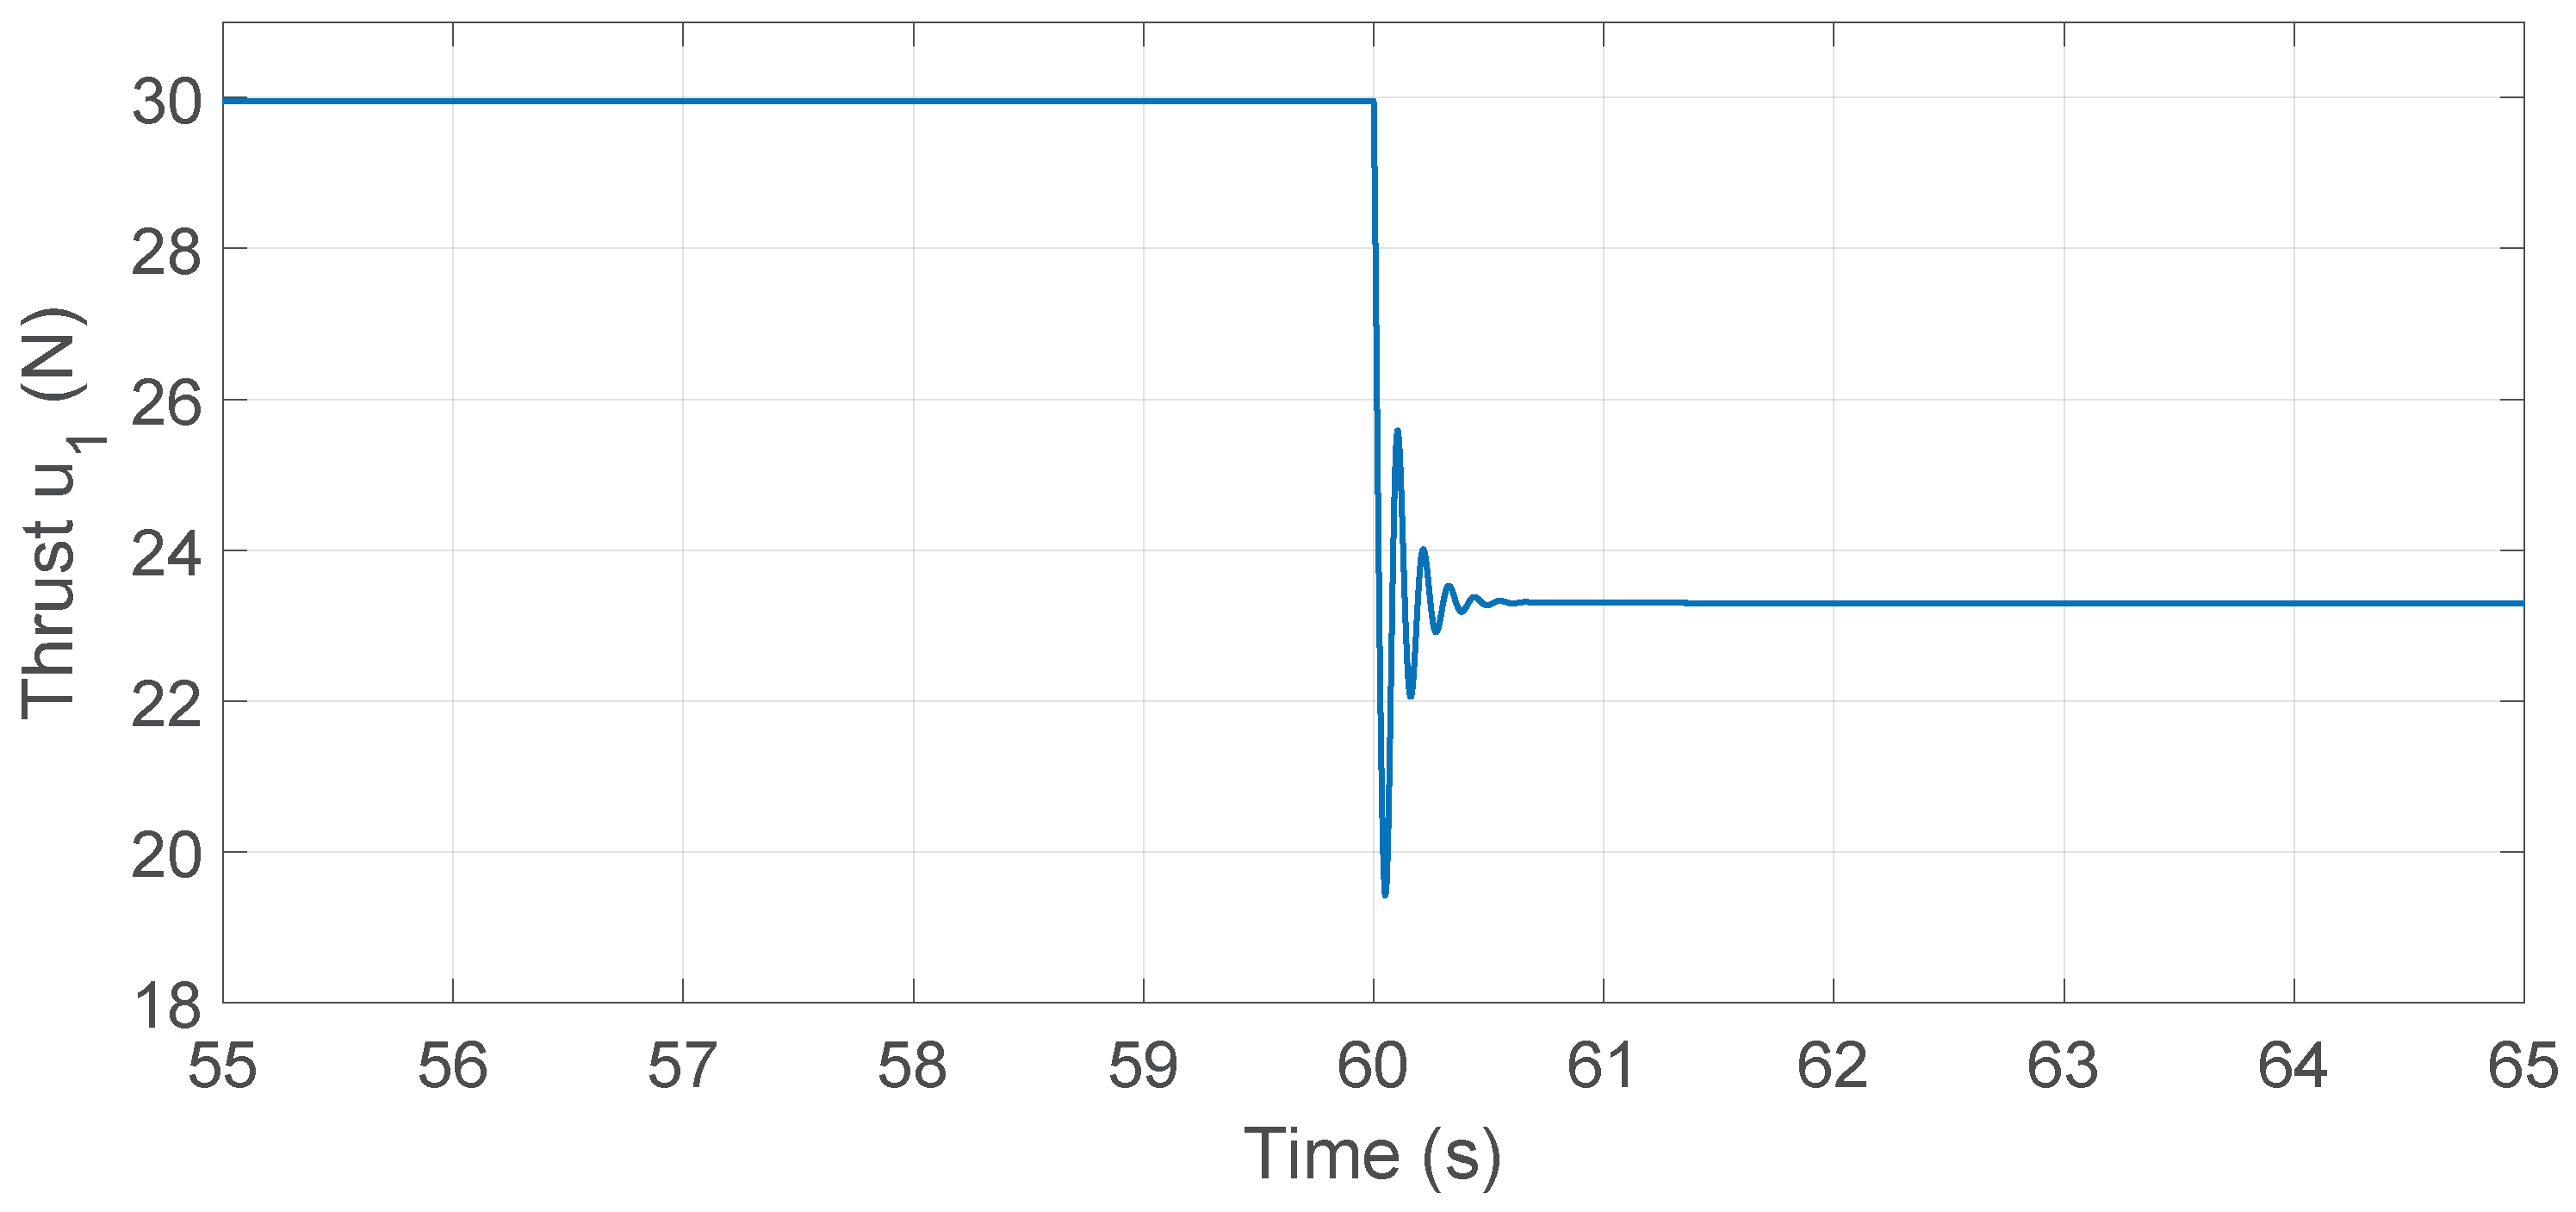
Zoomed view of the MRAC–LQR thrust input around .
Figure 23.
Zoomed view of the MRAC–LQR thrust input around .
Figure 24.
Rotor speed for standalone MRAC under step inputs.
Figure 24.
Rotor speed for standalone MRAC under step inputs.
Figure 25.
Rotor speed for MRAC–PID under step inputs.
Figure 25.
Rotor speed for MRAC–PID under step inputs.
Figure 26.
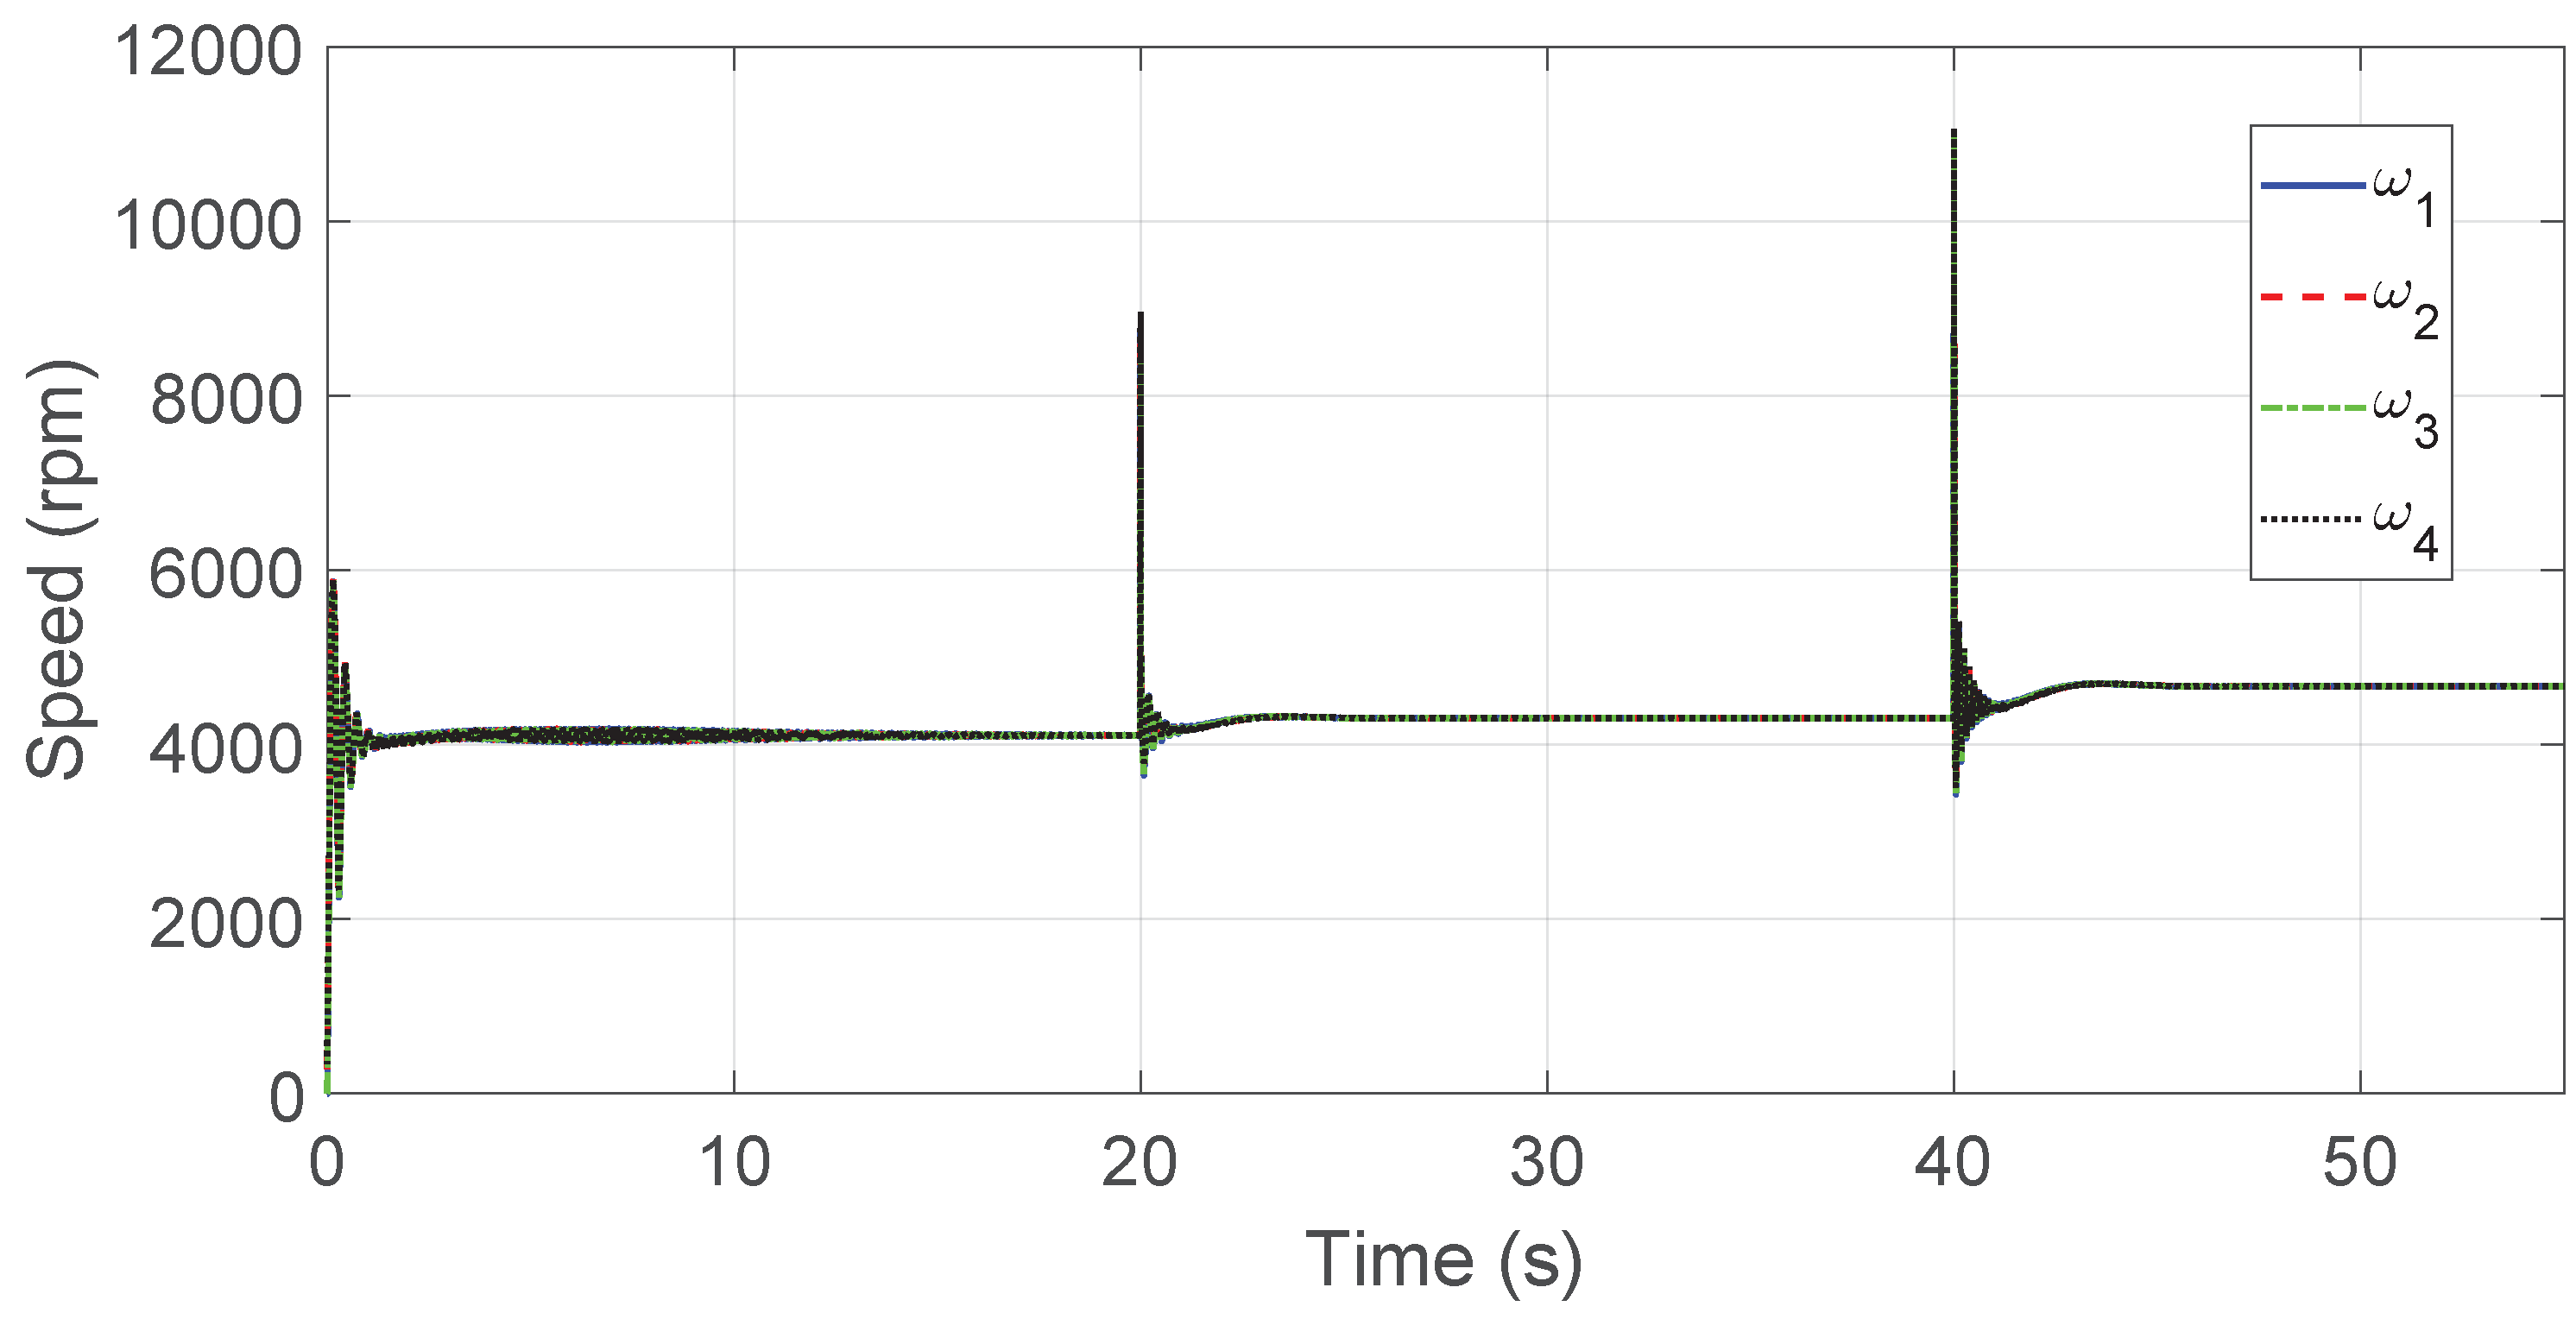
Rotor speed for MRAC–LQR under step inputs.
Figure 26.
Rotor speed for MRAC–LQR under step inputs.
Figure 27.
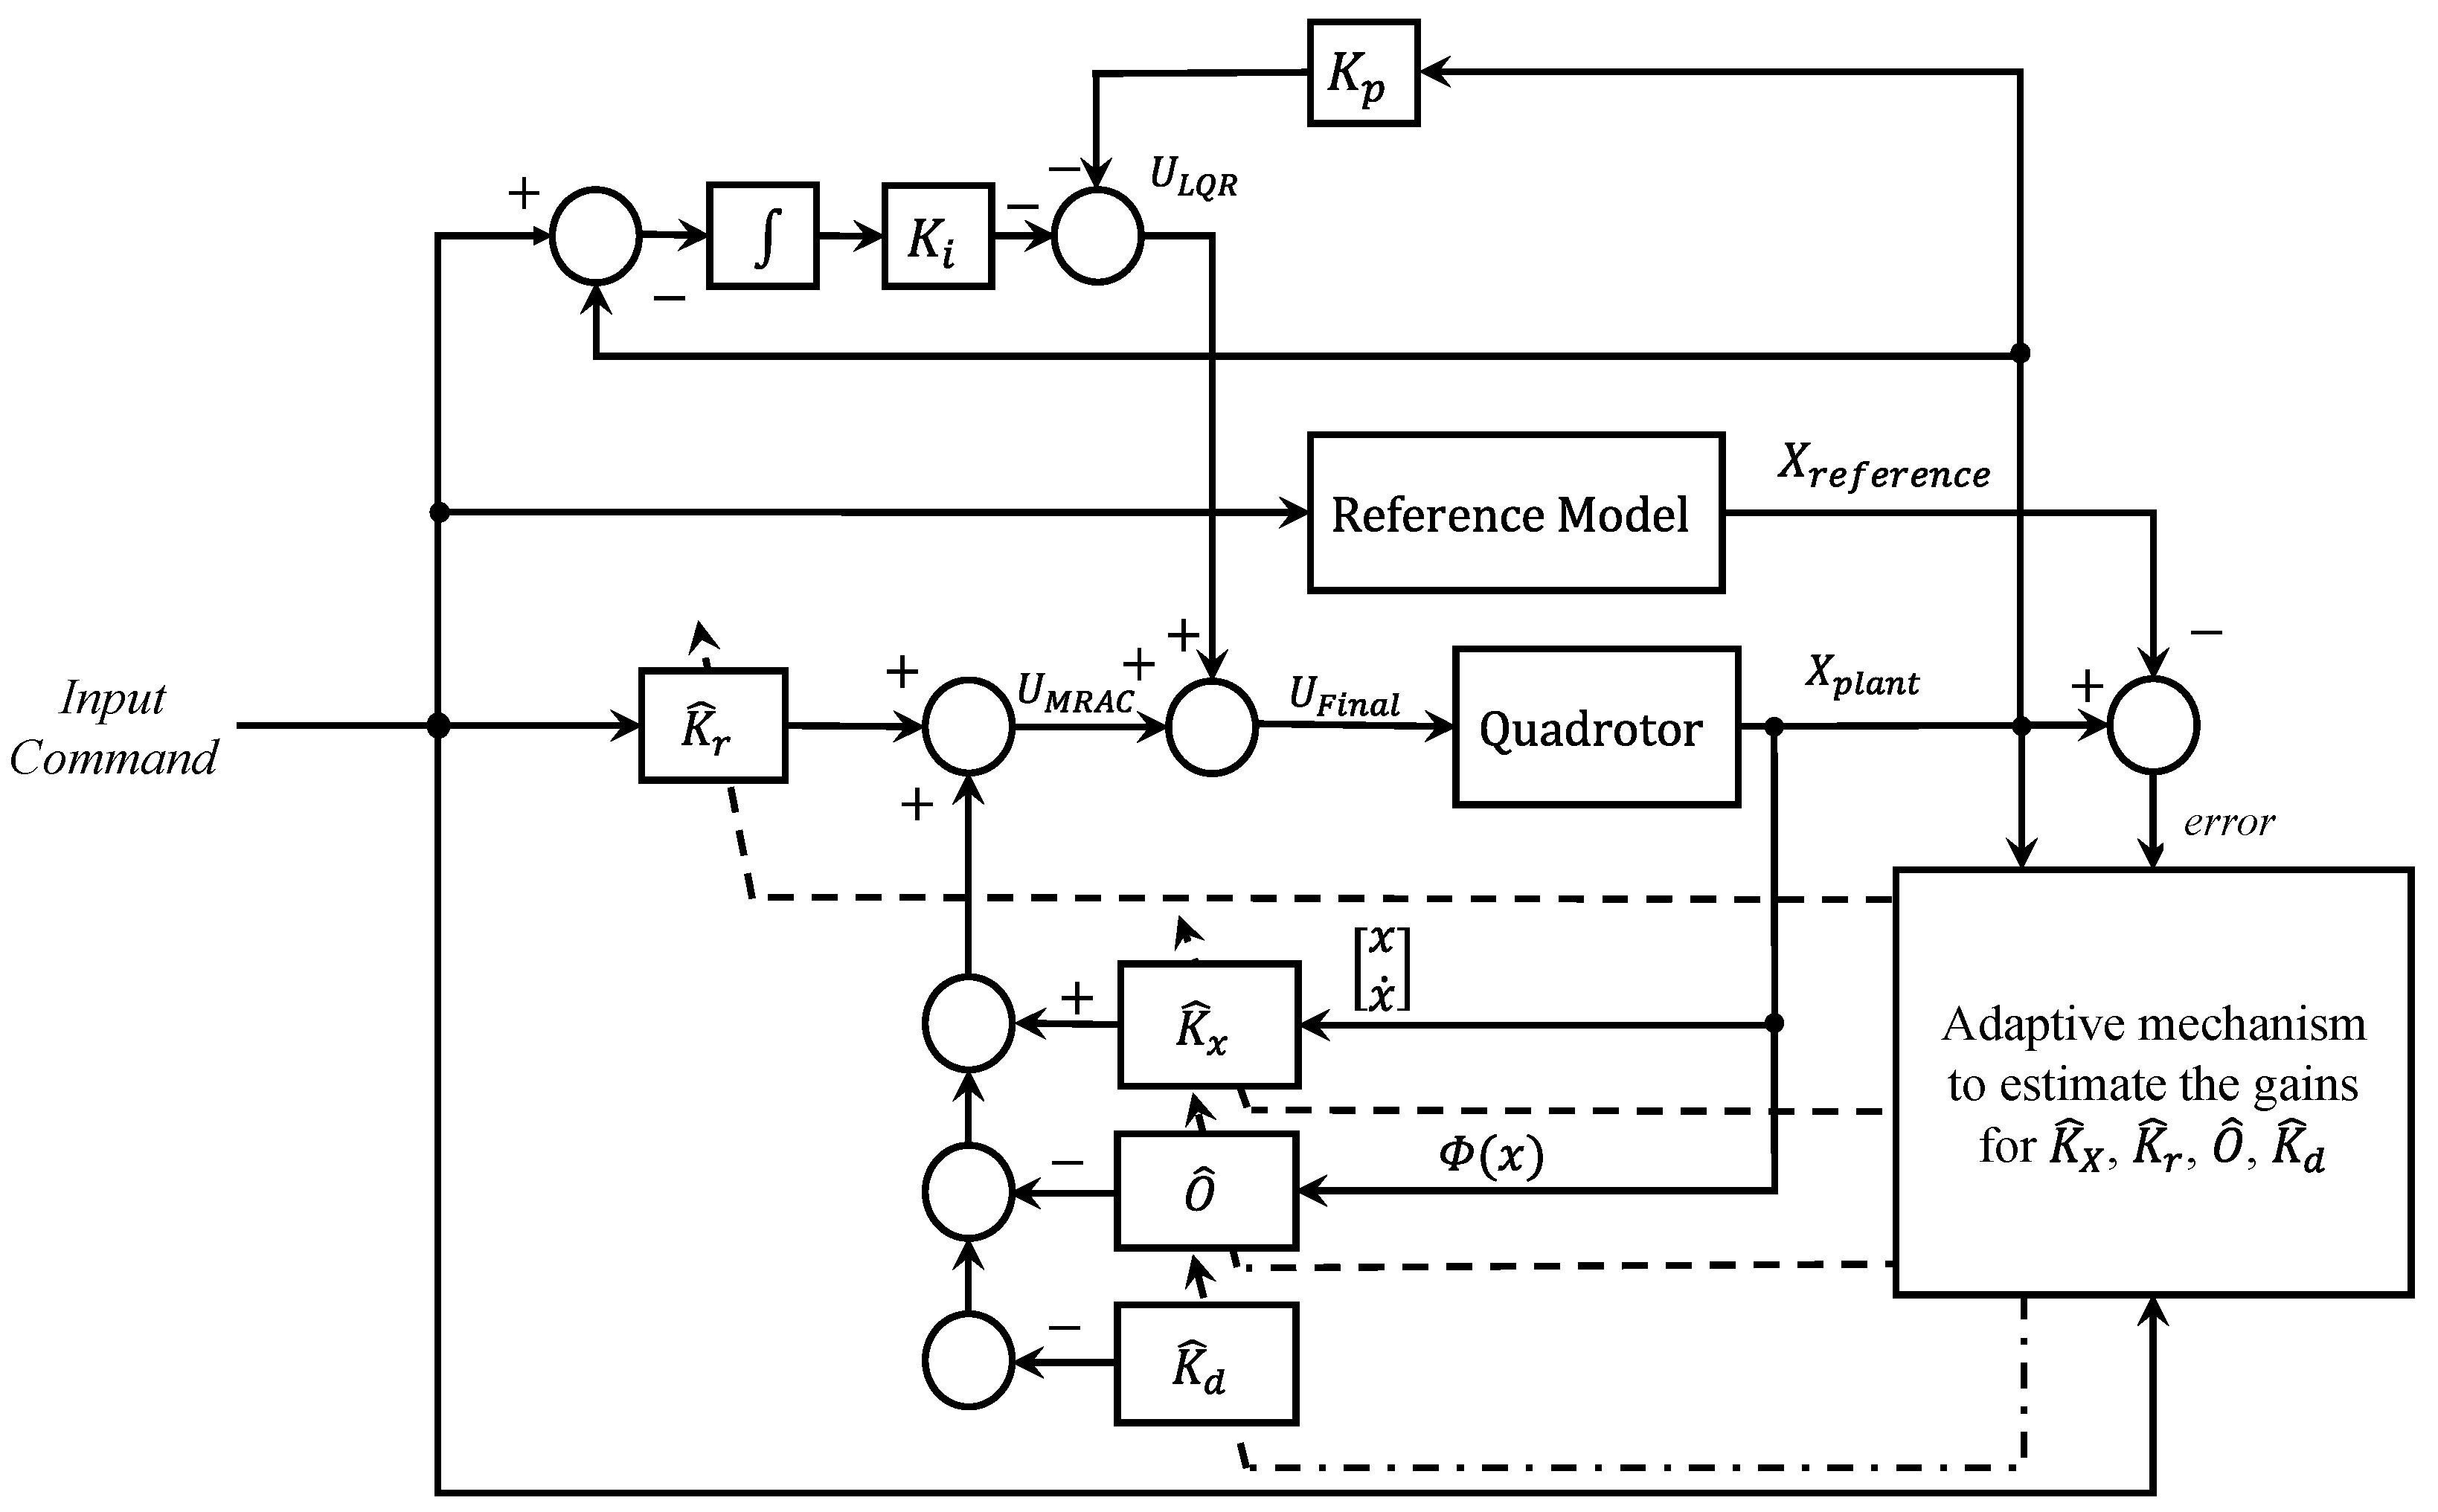
Parallel MRAC–LQR: LQR and MRAC run in parallel on the same command, and their outputs are summed to form the plant input. Solid arrows indicate the signal flow, and dashed arrows represent the adaptive update signals from the adaptation mechanism to the controller gains.
Figure 27.
Parallel MRAC–LQR: LQR and MRAC run in parallel on the same command, and their outputs are summed to form the plant input. Solid arrows indicate the signal flow, and dashed arrows represent the adaptive update signals from the adaptation mechanism to the controller gains.
Figure 28.
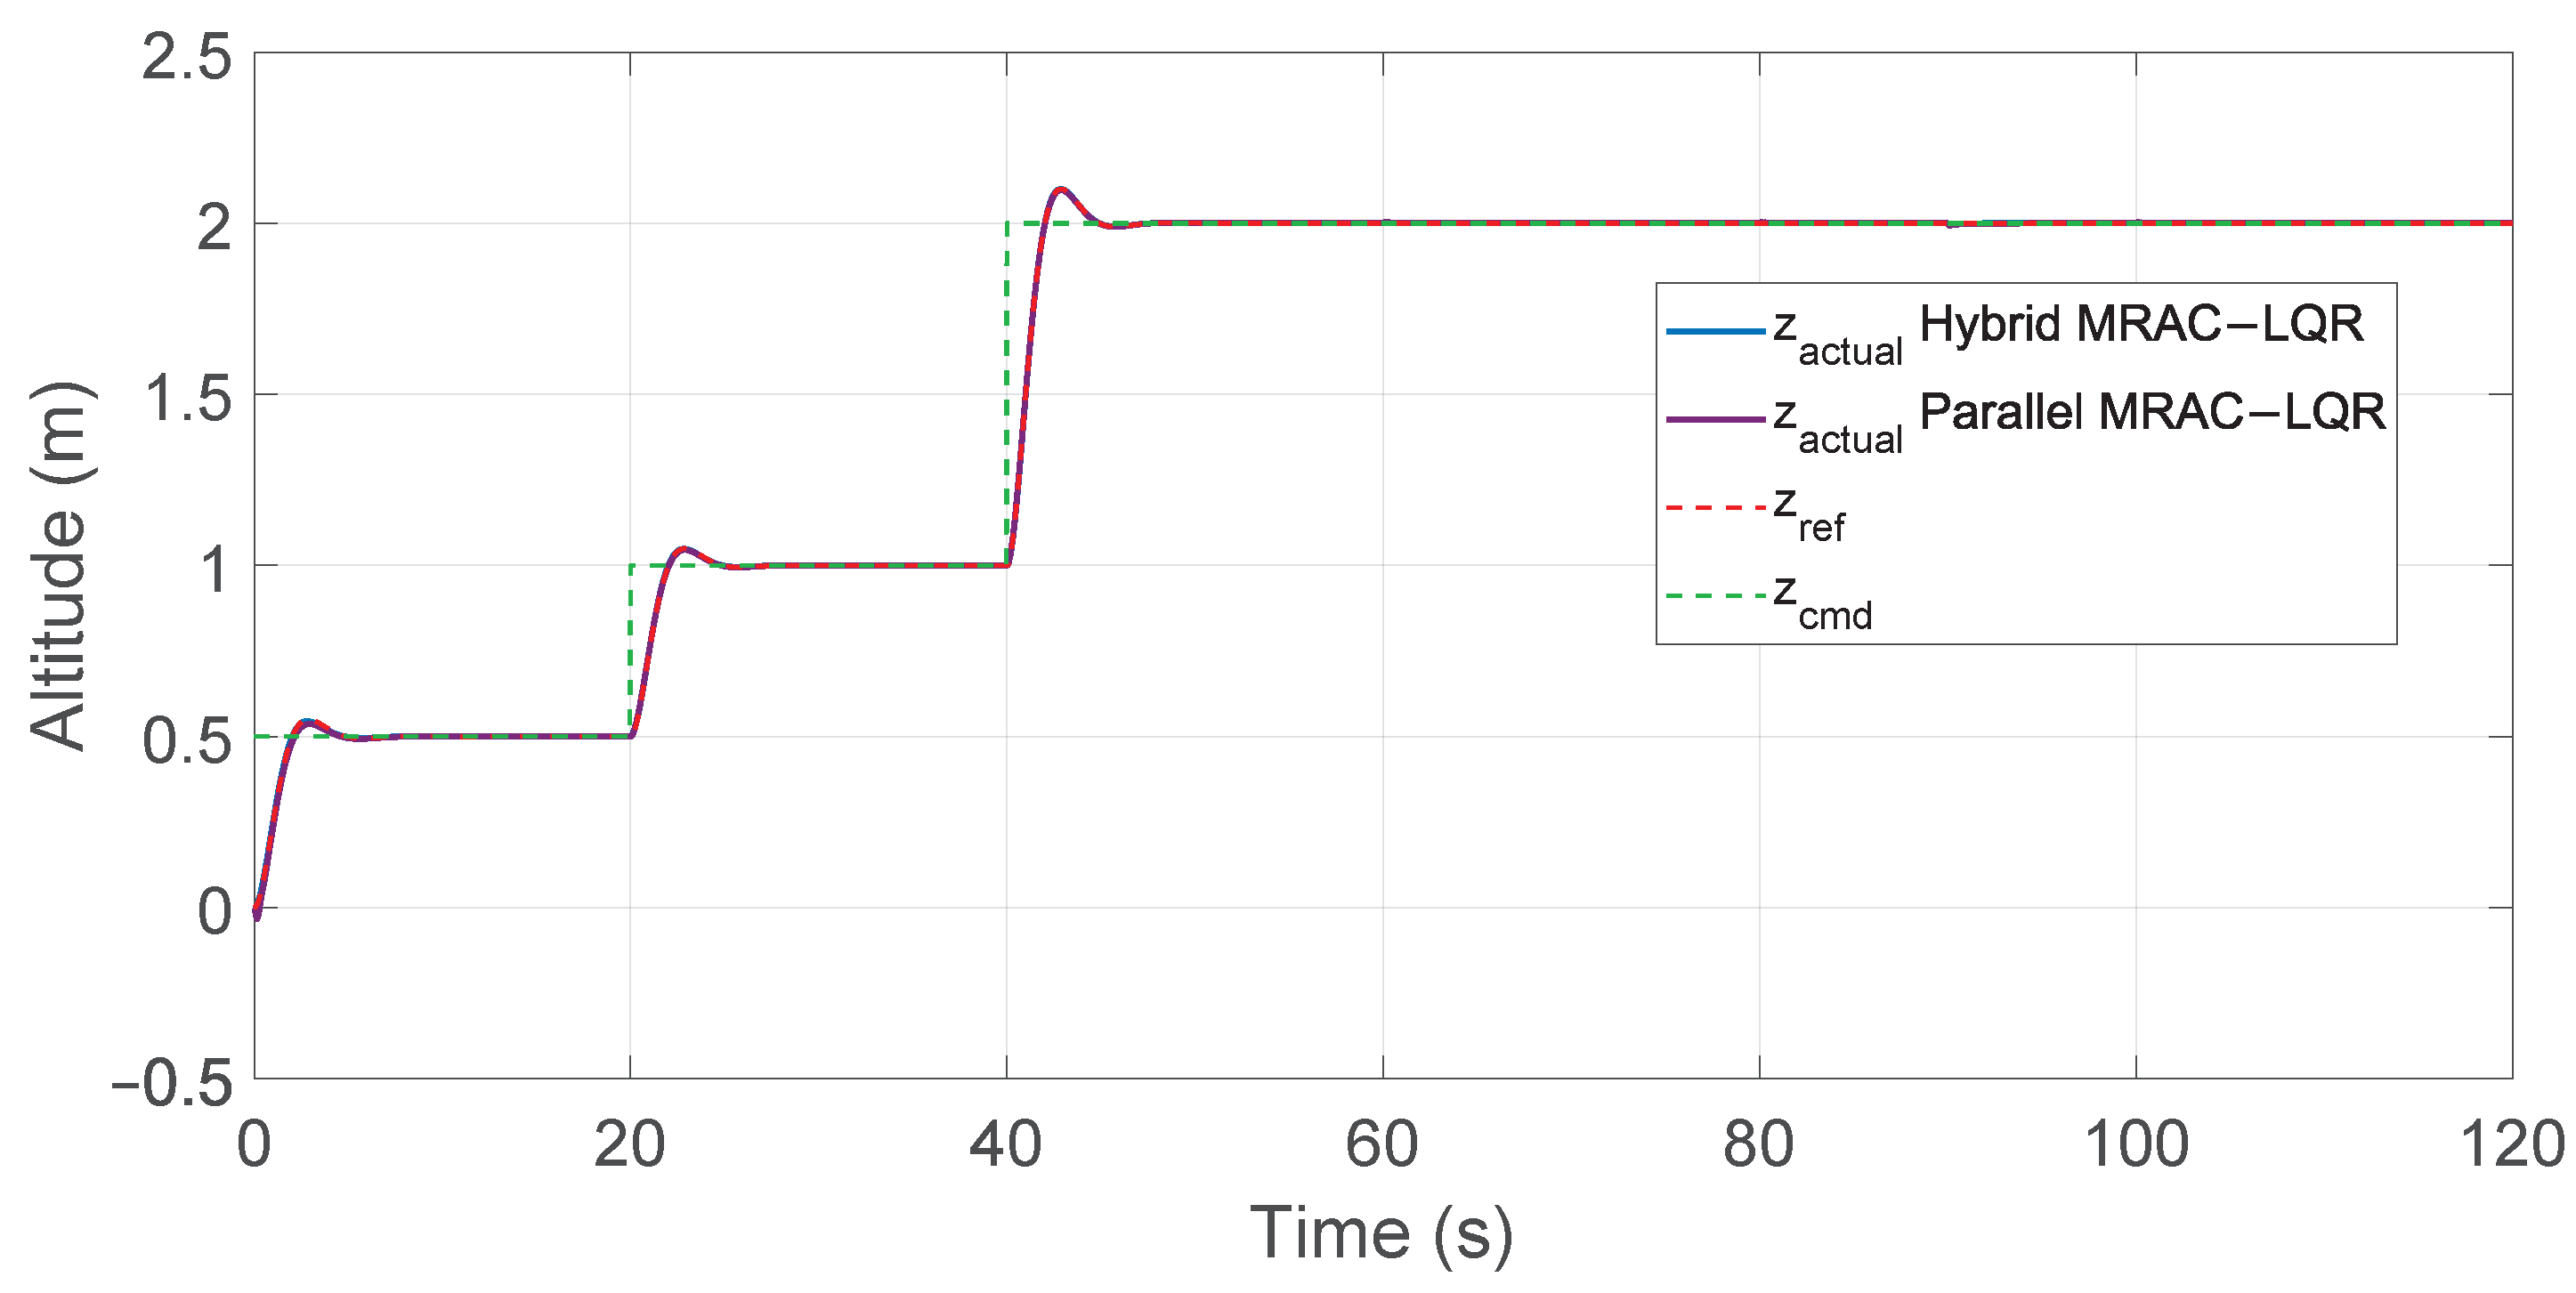
Altitude tracking performance for hybrid and parallel MRAC–LQR controllers.
Figure 28.
Altitude tracking performance for hybrid and parallel MRAC–LQR controllers.
Figure 29.
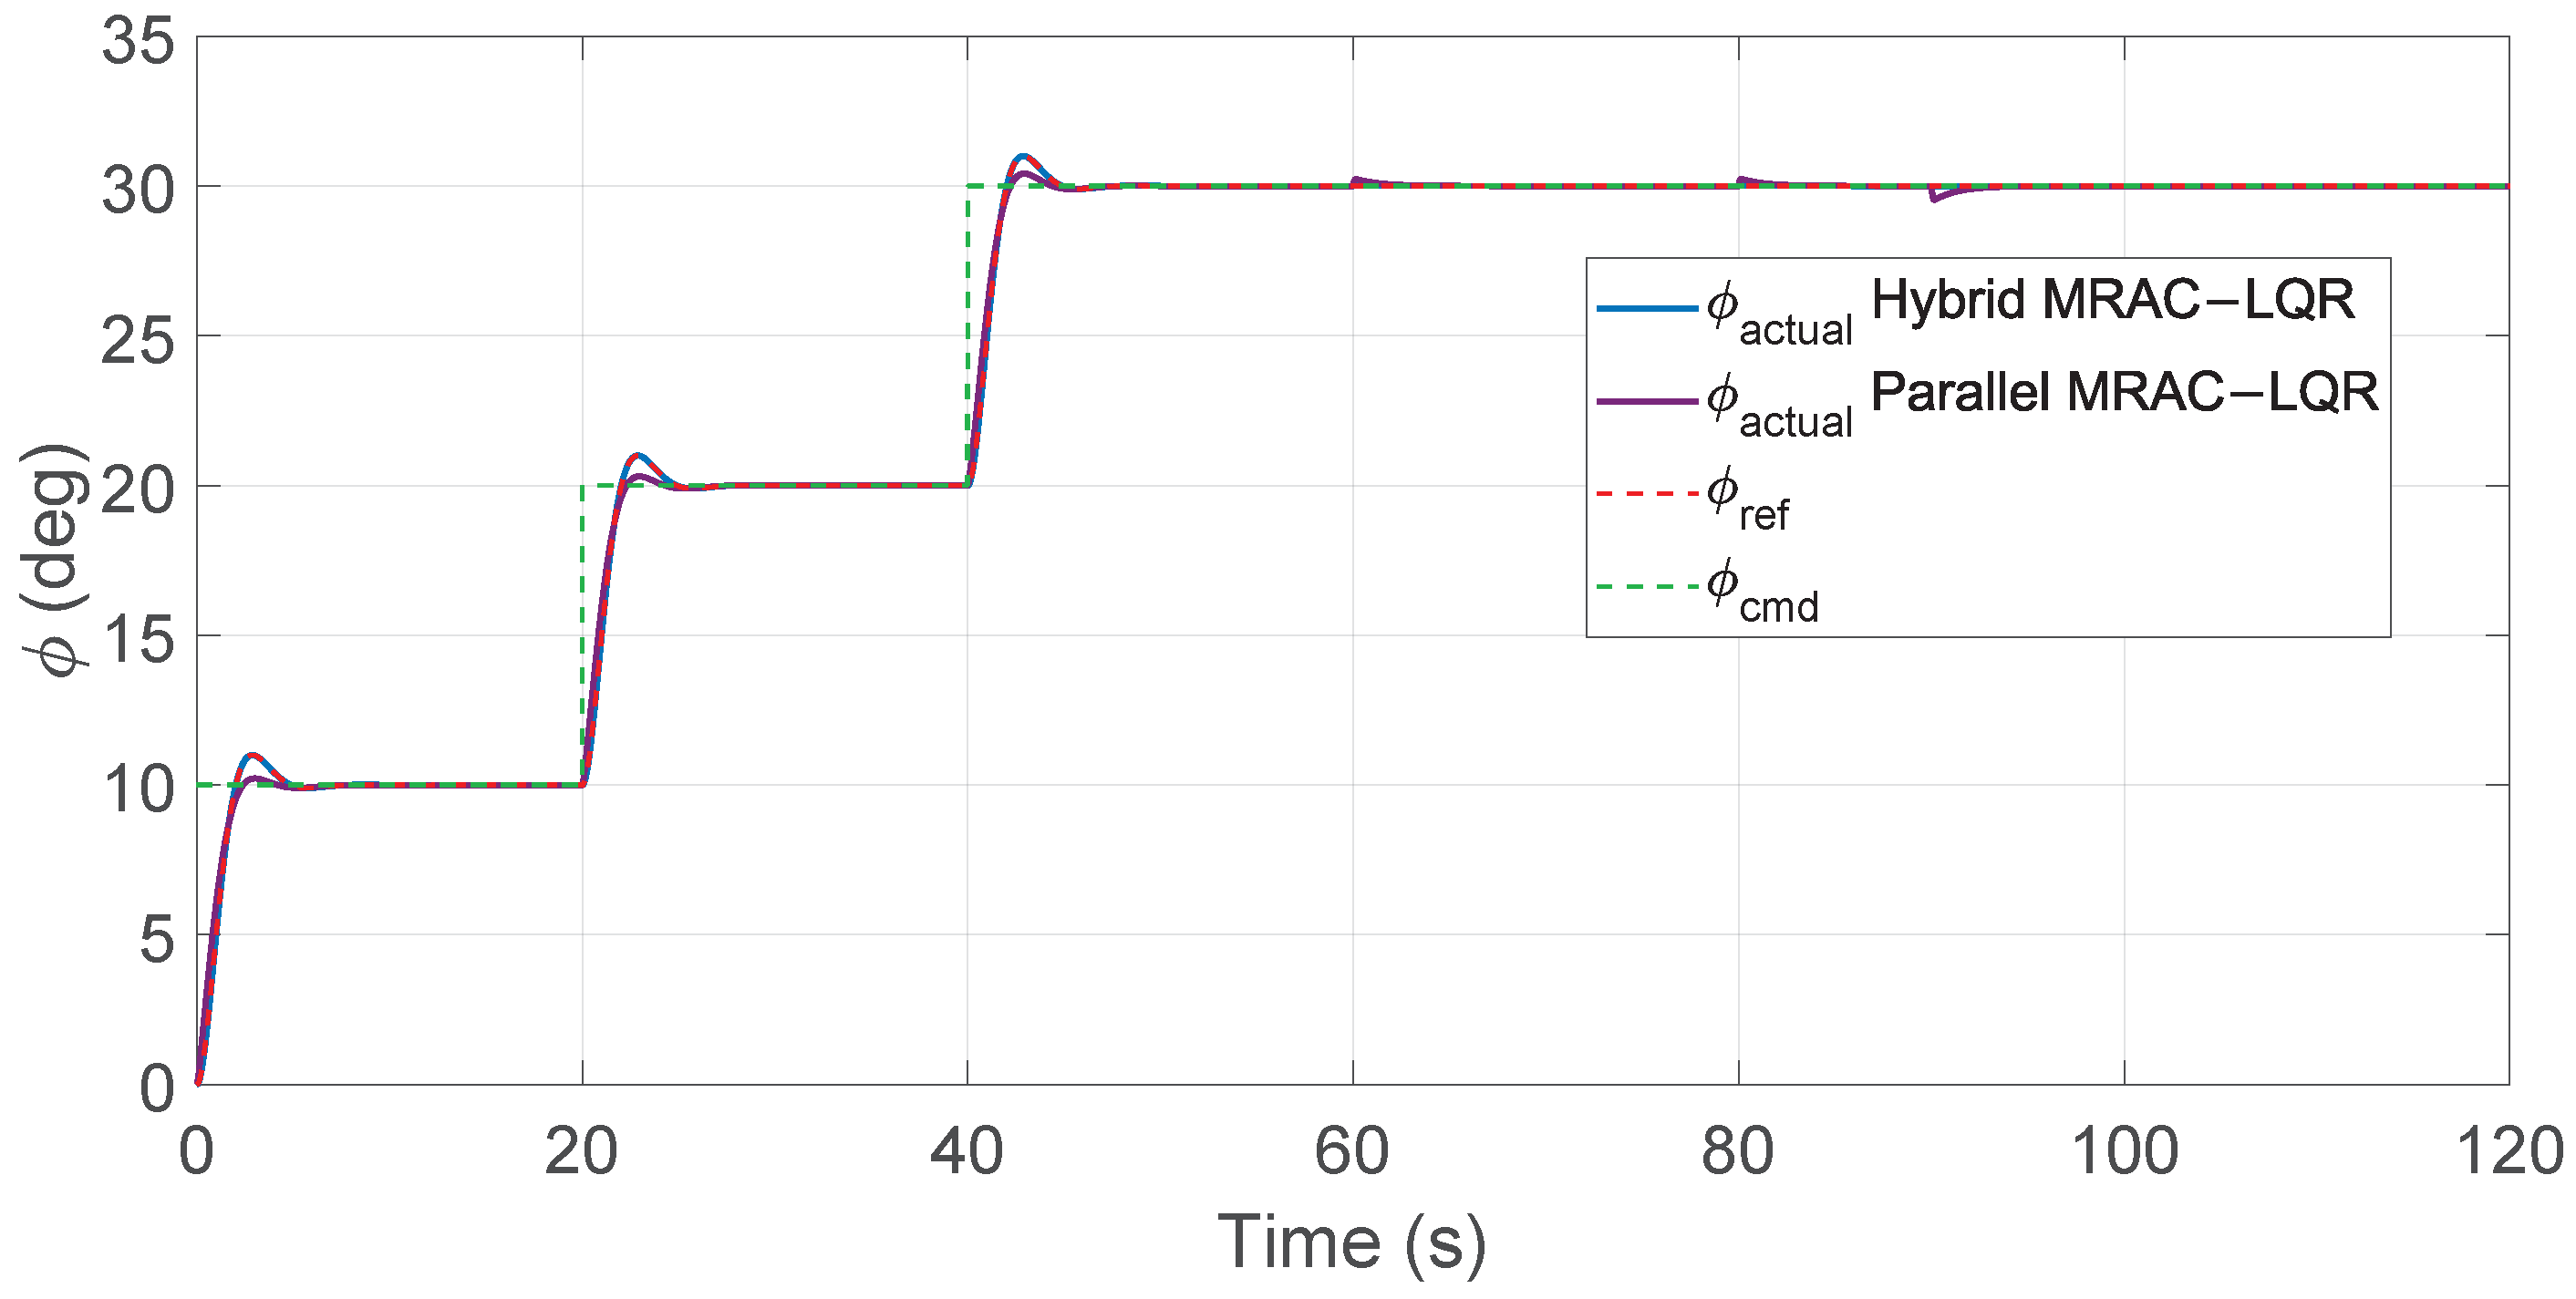
Roll angle tracking performance for hybrid and parallel MRAC–LQR controllers.
Figure 29.
Roll angle tracking performance for hybrid and parallel MRAC–LQR controllers.
Figure 30.
Pitch angle tracking performance for hybrid and parallel MRAC–LQR controllers.
Figure 30.
Pitch angle tracking performance for hybrid and parallel MRAC–LQR controllers.
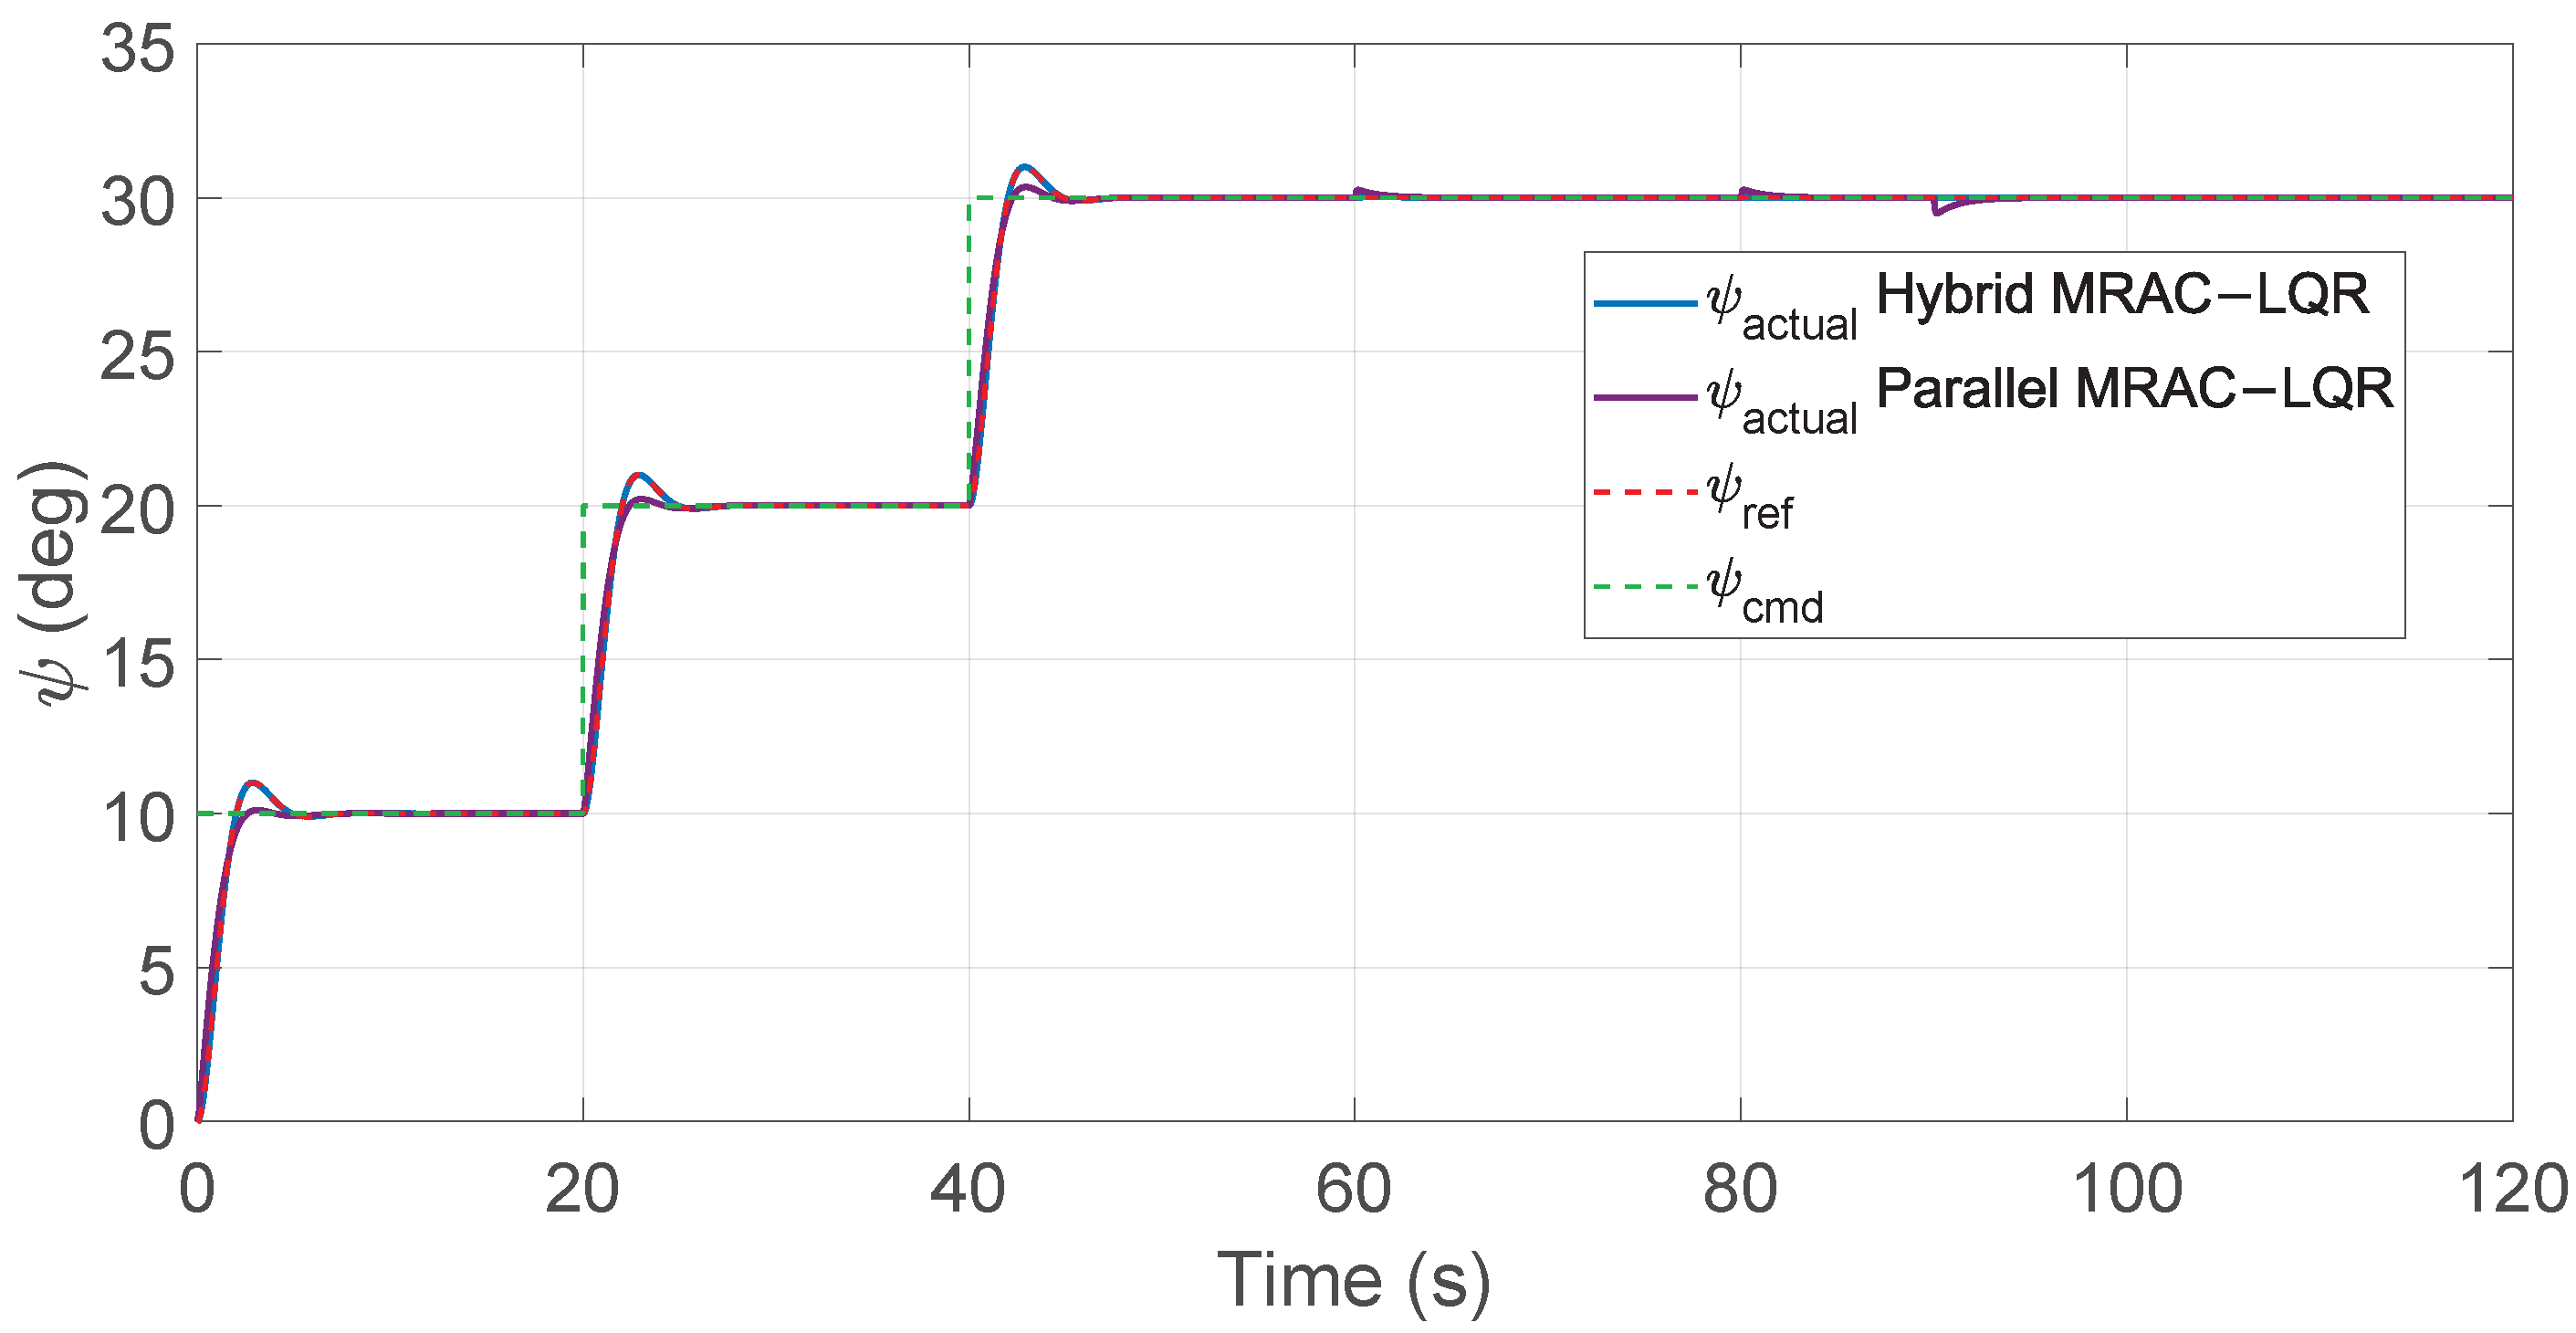
Figure 31.
Yaw angle tracking performance for hybrid and parallel MRAC–LQR controllers.
Figure 31.
Yaw angle tracking performance for hybrid and parallel MRAC–LQR controllers.
Figure 32.
Zoomed view of transient response in altitude tracking for hybrid and parallel MRAC–LQR controllers.
Figure 32.
Zoomed view of transient response in altitude tracking for hybrid and parallel MRAC–LQR controllers.
Figure 33.
Zoomed view of transient response in roll tracking for hybrid and parallel MRAC–LQR controllers.
Figure 33.
Zoomed view of transient response in roll tracking for hybrid and parallel MRAC–LQR controllers.
Figure 34.
Zoomed view of transient response in pitch tracking for hybrid and parallel MRAC–LQR controllers.
Figure 34.
Zoomed view of transient response in pitch tracking for hybrid and parallel MRAC–LQR controllers.
Figure 35.
Zoomed view of transient response in yaw tracking for hybrid and parallel MRAC–LQR controllers.
Figure 35.
Zoomed view of transient response in yaw tracking for hybrid and parallel MRAC–LQR controllers.
Figure 36.
Zoomed view of disturbance rejection in altitude tracking for hybrid and parallel MRAC–LQR controllers.
Figure 36.
Zoomed view of disturbance rejection in altitude tracking for hybrid and parallel MRAC–LQR controllers.
Figure 37.
Zoomed view of disturbance rejection in roll tracking for hybrid and parallel MRAC–LQR controllers.
Figure 37.
Zoomed view of disturbance rejection in roll tracking for hybrid and parallel MRAC–LQR controllers.
Figure 38.
Zoomed view of disturbance rejection in pitch tracking for hybrid and parallel MRAC–LQR controllers.
Figure 38.
Zoomed view of disturbance rejection in pitch tracking for hybrid and parallel MRAC–LQR controllers.
Figure 39.
Zoomed view of disturbance rejection in yaw tracking for hybrid and parallel MRAC–LQR controllers.
Figure 39.
Zoomed view of disturbance rejection in yaw tracking for hybrid and parallel MRAC–LQR controllers.
Table 1.
Quadrotor model parameters used in simulation.
Table 1.
Quadrotor model parameters used in simulation.
| Parameter | Symbol | Value |
|---|
| Roll moment of inertia | | |
| Pitch moment of inertia | | |
| Yaw moment of inertia | | |
| Rotor inertia | | |
| Mass | m | |
| Gravity | g | |
| Thrust coefficient | | |
| Drag coefficient | | |
| Translational drag coeff. x | | |
| Translational drag coeff. y | | |
| Translational drag coeff. z | | |
| Rotor arm length | L | |
Table 2.
Optimized MRAC learning-rate constants for altitude and attitude axes.
Table 2.
Optimized MRAC learning-rate constants for altitude and attitude axes.
| Axis | | | | |
|---|
| Altitude | | | – | |
| Roll | | | | |
| Pitch | | | | |
| Yaw | | | | |
Table 3.
Optimized PID gains used in the MRAC–PID controller.
Table 3.
Optimized PID gains used in the MRAC–PID controller.
| Axis | | | |
|---|
| Roll | | | |
| Pitch | | | |
| Yaw | | | |
| Altitude | | | |
Table 4.
Command inputs applied to the nonlinear quadrotor model.
Table 4.
Command inputs applied to the nonlinear quadrotor model.
| Time Interval (s) | z (m) | | | |
|---|
| 0–20 | 0.50 | 10 | 10 | 10 |
| 20–40 | 1.00 | 20 | 20 | 20 |
| 40–120 | 2.00 | 30 | 30 | 30 |
Table 5.
Wind-force profile used in all tests.
Table 5.
Wind-force profile used in all tests.
| Time Interval (s) | (N) | Description |
|---|
| 60–80 | 5 | Mild wind |
| 80–90 | 10 | Strong wind |
| 90–120 | 0 | No wind |
Table 6.
MSE values for the MRAC controllers.
Table 6.
MSE values for the MRAC controllers.
| Controller | Altitude | Roll | Pitch | Yaw |
|---|
| MRAC | | | | |
| MRAC–PID | | | | |
| MRAC–LQR | | | | |
Table 7.
Altitude peak deviation comparison for MRAC controllers.
Table 7.
Altitude peak deviation comparison for MRAC controllers.
| Time (s) | Command/Disturbance | MRAC (m) | MRAC–PID (m) | MRAC–LQR (m) |
|---|
| 0–20 | Command = 0.5 m | 0.0783 | 0.0518 | 0.0085 |
| 20–40 | Command = 1 m | 0.0074 | 0.0066 | 0.0053 |
| 40–60 | Command = 2 m | 0.0059 | 0.0043 | 0.0036 |
| 60–80 | Wind force = 5 N | 0.0036 | 0.0018 | 0.0011 |
| 80–90 | Wind force = 10 N | 0.0036 | 0.0019 | 0.0012 |
| 90–100 | Wind force removed | 0.0072 | 0.0037 | 0.0019 |
| 100–120 | 0.5 g mass reduction | 0.0035 | 0.0018 | 0.0010 |
Table 8.
Roll peak deviation comparison for MRAC controllers.
Table 8.
Roll peak deviation comparison for MRAC controllers.
| Time (s) | Command/Disturbance | MRAC (°) | MRAC–PID (°) | MRAC–LQR (°) |
|---|
| 0–20 | Command = 10° | 0.0198 | 0.0144 | 0.0142 |
| 20–40 | Command = 20° | 0.0155 | 0.0137 | 0.0138 |
| 40–60 | Command = 30° | 0.0149 | 0.0137 | 0.0137 |
| 60–80 | Wind force = 5 N | 0.7246 | 0.3181 | 0.0470 |
| 80–90 | Wind force = 10 N | 0.5604 | 0.2842 | 0.0219 |
| 90–120 | Wind force removed | 0.9465 | 0.4793 | 0.0313 |
Table 9.
Pitch peak deviation comparison for MRAC controllers.
Table 9.
Pitch peak deviation comparison for MRAC controllers.
| Time (s) | Command/Disturbance | MRAC (°) | MRAC–PID (°) | MRAC–LQR (°) |
|---|
| 0–20 | Command = 10° | 0.0205 | 0.0138 | 0.0141 |
| 20–40 | Command = 20° | 0.0158 | 0.0156 | 0.0137 |
| 40–60 | Command = 30° | 0.0151 | 0.0139 | 0.0136 |
| 60–80 | Wind force = 5 N | 0.7190 | 0.2796 | 0.0469 |
| 80–90 | Wind force = 10 N | 0.5606 | 0.2578 | 0.0196 |
| 90–120 | Wind force removed | 0.9481 | 0.4296 | 0.0268 |
Table 10.
Yaw peak deviation comparison for MRAC controllers.
Table 10.
Yaw peak deviation comparison for MRAC controllers.
| Time (s) | Command/Disturbance | MRAC (°) | MRAC–PID (°) | MRAC–LQR (°) |
|---|
| 0–20 | Command = 10° | 0.0312 | 0.0169 | 0.0168 |
| 20–40 | Command = 20° | 0.0187 | 0.0142 | 0.0138 |
| 40–60 | Command = 30° | 0.0164 | 0.0139 | 0.0137 |
| 60–80 | Wind force = 5 N | 0.8872 | 0.2738 | 0.0508 |
| 80–90 | Wind force = 10 N | 0.6989 | 0.2551 | 0.0224 |
| 90–120 | Wind force removed | 1.2333 | 0.4659 | 0.0335 |
Table 11.
Summary of average tracking improvements for MRAC variants under different test conditions.
Table 11.
Summary of average tracking improvements for MRAC variants under different test conditions.
| Channel | MRAC–PID Improvement (%) | MRAC–LQR Improvement (%) |
|---|
| Altitude | 38.03 | 62.52 |
| Roll | 86.09 | 99.70 |
| Pitch | 89.00 | 99.67 |
| Yaw | 92.99 | 99.75 |
Table 12.
Altitude peak deviation: cascaded MRAC–LQR vs. parallel MRAC–LQR.
Table 12.
Altitude peak deviation: cascaded MRAC–LQR vs. parallel MRAC–LQR.
| Time (s) | Cascaded MRAC–LQR (m) | Parallel MRAC–LQR (m) |
|---|
| 60–80 s (5 N wind) | 0.0011 | 0.00346 |
| 80–90 s (10 N wind) | 0.0012 | 0.00347 |
| 90–100 s (disturbance removed) | 0.0019 | 0.00688 |
| 100–120 s (mass change) | 0.0010 | 0.00248 |
Table 13.
Attitude peak deviation: cascaded MRAC–LQR vs. parallel MRAC–LQR.
Table 13.
Attitude peak deviation: cascaded MRAC–LQR vs. parallel MRAC–LQR.
| Channel | 60–80 s (5 N Wind) | 80–90 s (10 N Wind) | 90–120 s (Disturbance Removed) |
|---|
| Cascaded | Parallel | Cascaded | Parallel | Cascaded | Parallel |
|---|
| Roll | 0.0470 | 0.234 | 0.0219 | 0.235 | 0.0313 | 0.461 |
| Pitch | 0.0469 | 0.224 | 0.0196 | 0.224 | 0.0268 | 0.454 |
| Yaw | 0.0508 | 0.256 | 0.0224 | 0.256 | 0.0335 | 0.512 |
