Article

Adaptive Multi-Scale Bidirectional TD3 Algorithm for Layout Optimization of UAV–Base Station Coordination in Mountainous Areas

1
School of Computer Science and Technology, Zhejiang Normal University, Jinhua 321004, China
2
College of Engineering, Zhejiang Normal University, Jinhua 321004, China
*
Authors to whom correspondence should be addressed.
Drones 2025, 9(11), 805; https://doi.org/10.3390/drones9110805
Submission received: 30 September 2025 / Revised: 8 November 2025 / Accepted: 9 November 2025 / Published: 18 November 2025

Highlights

What are the main findings?
  • The algorithm effectively integrates dynamic weight adaptation, multi-time scale optimization, and bidirectional information exchange, enhancing the adaptability and efficiency of UAV-assisted base station deployment in dynamic environments.
  • The AMB-TD3 algorithm achieves a signal coverage rate of 98.094% in complex mountainous areas, significantly outperforming other existing methods in terms of coverage rate, UAV energy consumption, and solution stability.
What are the implications of the main findings?
  • This study provides an efficient solution for improving communication coverage in complex terrains such as mountainous regions, which is of vital importance to the development of 6G networks and future integrated space-air-ground communication systems.
  • This innovative algorithmic approach offers a new framework for optimizing UAV and base station coordination, which can be applied to various scenarios requiring efficient signal coverage and resource management.

Abstract

With the rise of 6G communication technology, the issue of communication coverage in mountainous areas has become increasingly prominent. These regions are characterized by complex terrain, sparse user distribution, and small-scale clustering, making it difficult for traditional ground-based base stations, constrained by fixed locations and terrain obstructions, to achieve comprehensive signal coverage in mountainous areas. To address this challenge, this paper conducts an in-depth analysis of mountainous terrain and the differentiated needs of users, utilizing UAV-assisted base station signal coverage and designing an adaptive multi-scale bidirectional twin delayed deep deterministic policy gradient (AMB-TD3) algorithm to optimize base station layout and plan UAV routes. The algorithm significantly enhances performance by introducing a dynamic weight adaptation mechanism, multi-timescale coupling, and bidirectional information interaction strategies. In experiments, the best signal coverage rate of AMB-TD3 reached 98.094%, verifying its practicality in solving base station signal coverage issues in complex mountainous scenarios.

1. Introduction

Wireless communication technology has undergone a leapfrog development from analog to digital, from narrowband to broadband, and from single voice services to integrated multimedia services [1,2,3]. Currently, it is comprehensively moving towards a new stage led by the sixth-generation (6G) mobile communication [4,5,6]. The 6G system, with the vision of achieving global seamless coverage, extreme transmission performance, and intelligent inclusive services [7,8], is expected not only to further enhance transmission rates, reduce end-to-end latency, and increase connection density but also to deeply integrate breakthrough technologies such as artificial intelligence [9], integrated sensing and communication [10], and terahertz band communication [11]. These integrations will comprehensively empower emerging application scenarios like augmented reality (AR) [12], virtual reality (VR) [13], holographic communication [14], and smart Internet of Things (IoT) [15].
Nevertheless, the comprehensive construction of the 6G network has not yet been completed, and communication coverage in special geographical environments remains a significant challenge, especially in mountainous areas with complex terrain and sparse population distribution that is locally clustered [16,17,18]. Traditional terrestrial base stations, due to difficulties in deploying fixed infrastructure, line-of-sight transmission obstructions, and high maintenance costs, struggle to achieve efficient, continuous, and reliable signal coverage. To address this issue, drone-assisted mobile communication, as a flexible and cost-effective coverage enhancement solution, has garnered considerable attention in recent years [19,20]. Drones can serve as aerial base stations, dynamically adjusting their spatial positions to bypass terrain obstructions and respond in real time to users’ changing signal demands, thereby significantly improving regional communication capacity and coverage quality [21,22].
However, drone communication also faces a prominent trade-off between coverage performance and energy consumption. On one hand, it is necessary to maximize signal coverage and service quality. On the other hand, limited onboard energy necessitates optimized path and deployment strategies to extend effective operation time. Therefore, how to jointly optimize the position deployment, path planning, and resource allocation of drones in complex geographical and communication environments has become a key research issue [23,24,25].
Furthermore, compared to traditional terrestrial base stations, UAV-assisted communications face unique challenges in signal propagation. The aerial nature of UAV-BSs leads to longer and more dynamic transmission paths, resulting in significant path loss. Concurrently, air-to-ground (A2G) links are highly susceptible to fading effects, including small-scale fading due to multipath propagation and large-scale shadow fading caused by terrain obstructions. These attenuation effects are further exacerbated by environmental factors such as atmospheric conditions and precipitation, which can severely degrade the signal quality and reliability of the communication links. Consequently, overcoming these signal attenuation challenges is crucial for maintaining stable and efficient communication coverage in complex mountainous scenarios.
Moreover, to ensure continuous network coverage and seamless handover during user mobility, adjacent base stations need to maintain a reasonable overlap in coverage. Appropriate overlap can effectively avoid signal dead zones and support smooth handovers between base stations, maintaining service continuity. However, excessive overlap can lead to multiple users being covered by several base stations simultaneously, causing co-channel interference. This not only degrades signal quality and system capacity but also results in frequent handovers and increased signaling overhead. Therefore, it is essential to control the overlap through precise network planning and parameter optimization to achieve an optimal balance between coverage, handover, and interference [26].
In response to the aforementioned challenges, this paper proposes an Adaptive Multi-Scale Bidirectional Twin Delayed Deep Deterministic Policy Gradient (AMB-TD3) algorithm tailored for 6G coverage enhancement in mountainous areas. By integrating the dynamic weight adaptation mechanism (DWAM), the multi-time scale collaborative optimization method (MTS-COM), and the bidirectional information exchange channel (BIEC) strategy, the AMB-TD3 algorithm jointly optimizes the three-dimensional deployment and flight path of UAV base stations, thereby significantly reducing energy consumption while ensuring high signal coverage. Experiments demonstrate that the AMB-TD3 algorithm can achieve a signal coverage rate of 98.094% in typical mountainous environments, thereby verifying its effectiveness and practicality in enhancing 6G network coverage in complex terrains and providing key technical support for the deployment of future integrated space–air–ground communication systems. The contributions of this study can be summarized as follows:
  • This paper proposes the AMB-TD3 algorithm, which ingeniously combines the efficient decision-making capabilities of deep reinforcement learning (Twin Delayed Deep Deterministic Policy Gradient, TD3) with the collective search advantages of differential evolution (DE). This effectively enhances the algorithm’s efficiency while reducing computational costs. The goal is to maximize the signal coverage area of base stations over mountainous terrains while utilizing unmanned aerial vehicles (UAVs) to work in coordination with base stations, planning routes reasonably to minimize the flight energy consumption of UAVs. This innovative approach holds significant theoretical and practical value in the field of base station deployment, offering a new solution to the signal coverage challenges in complex environments.
  • Within the framework of deep reinforcement learning, a dynamic weight adaptation mechanism is integrated, which flexibly adjusts the decision-making weights of TD3 and DE by evaluating the dynamic complexity and fluctuation index of the environment, allowing the AMB-TD3 algorithm to better adapt to changing environments. A multi-time scale collaborative optimization method is introduced, mapping complex objective functions onto short-term, medium-term, and long-term scales for consideration, enabling flexible decision-making for UAV movement and base station deployment, thereby minimizing UAV energy consumption while meeting signal coverage requirements. A bidirectional information exchange channel is adopted, establishing an expert buffer zone, achieving bidirectional knowledge transfer and cooperative evolution between TD3 and DE.
  • This paper comprehensively verifies the performance of the proposed algorithm through extensive experiments and compares it with Q-learning, deep Q-network (DQN), phasic policy gradient (PPG), DRL-based energy-efficient control for coverage and connectivity (DRL-EC3), double DQN-state splitting Q network (DDQN-SSQN), simulated annealing with Q-learning (SA-Q), and Decentralized Reinforcement Learning with Adaptive Exploration and Value-based Action Selection (DecRL-AE & VAS). In addition, ablation experiments are conducted to analyze the contribution of each component to the overall performance. The experimental results show that the proposed algorithm significantly outperforms existing methods, especially in terms of convergence speed, solution quality, and robustness to different environments.
The structure of the subsequent sections is as follows. Section 2 introduces the research on base station deployment and drones path planning as well as the background and literature on deep reinforcement learning. Section 3 elaborates on the three-dimensional base station communication model, including the principles of terrain generation, signal coverage description, base station deployment requirements, UAV flight constraints, and special signal needs of users. In Section 4, the motivations behind the original TD3, DE algorithm, and its subsequent improved algorithms are discussed, followed by a detailed introduction to AMB-TD3, clarifying its three innovative aspects. Section 5 conducts simulation experiments and analysis to verify the feasibility and effectiveness of the proposed method. Finally, Section 6 summarizes the main contributions of this paper and proposes more innovative and effective methods for future research.

2. Related Work

This section provides an overview of the current research on base station deployment and UAV path planning, as well as the background and relevant literature on deep reinforcement learning.

2.1. Base Station Deployment Research

Base stations have a wide range of applications, including antenna design to enhance signal coverage and quality, switching technology to optimize energy consumption, backup batteries to increase the flexibility of power systems, and vertical heterogeneous networks to support future communication demands. These technologies collectively promote the development of 6G and future networks.
Qin et al. [27] proposed a novel aperture-sharing dual-band antenna design method based on a partially reflective surface (PRS) for base station applications. This design places the high-band antenna (HBA) beneath the low-band antenna (LBA) to achieve complete aperture sharing. However, it was found that this layout would cause a severe shielding effect on the HBA, leading to a deterioration in its radiation performance and impedance matching. To address this issue, the authors introduced a low-pass characteristic PRS structure to form an air-filled quasi-Fabry–Pérot cavity above the HBA, thereby compensating for the radiation loss of the HBA with minimal impact on the LBA. To further expand the high-frequency bandwidth, a second layer of PRS was also introduced. The ultimately designed antenna achieved broad bandwidths (with impedance bandwidths of approximately 43.7% and 45%), high gain (about 8 dBi), and stable radiation patterns at both low (0.68–1.07 GHz) and high frequencies (1.7–2.7 GHz). The antenna subarray developed for 2G/3G/4G base stations demonstrated compact structure and superior performance.
Feng et al. [28] explored the energy-saving potential, key challenges, and solutions of base station switching techniques in 5G wireless networks. The article points out that 5G networks will densely deploy a large number of small base stations to enhance coverage and capacity, leading to a significant increase in total energy consumption. Dynamically turning off low-load base stations can effectively save energy, but the new features of 5G networks—such as new physical layer technologies, heterogeneous architecture, millimeter-wave communication, cloud radio access network (C-RAN) [29], and device-to-device (D2D) communication—introduce new challenges for the design of base station switching strategies, including interoperability, scalability, information acquisition, latency, and the balance of Quality of Service (QoS). The paper systematically reviews the research progress on switching mechanisms under different network scenarios and points out that there are still many open issues in emerging application scenarios such as D2D, millimeter-wave, mobile edge computing (MEC) [30], wireless caching, and machine-to-machine (M2M) communication. Future work will need to further optimize the trade-off between energy efficiency and performance by integrating methods such as machine learning and Quality of Experience (QoE)-aware scheduling.
Yong et al. [31] proposed a method for assessing the dispatchable capacity of backup batteries in 5G base stations within the power distribution network, aiming to utilize the base station backup batteries as a flexible resource for the power system. The paper first established a reliability model for base stations that considers the impact of power distribution network interruptions and backup batteries. Based on semi-Markov analysis, it derived an analytical relationship between the base station availability index and backup duration, thereby determining the minimum backup energy capacity to meet reliability requirements (e.g., 99.999%). On this basis, considering the traffic-sensitive power consumption characteristics of 5G base stations, it dynamically divided the battery capacity into “reserved part” and “dispatchable part,” assessing their dispatchable energy and power capacity under different times and network topologies. Case studies demonstrated that this method can effectively quantify the scheduling potential of base stations and reduce base station electricity costs by participating in day-ahead optimal scheduling, achieving a win–win situation for the power grid and communication operators.
Alam et al. [32] proposed the concept of using high altitude platform stations (HAPS) as super macro base stations (HAPS-SMBS) to build a future integrated space–air–ground vertical heterogeneous network (VHetNet). HAPS-SMBS, deployed at an altitude of 20–50 km, offers advantages such as quasi-stationary, wide coverage, low latency, and high visibility probability, capable of providing enhanced communication, computing, caching, and data offloading services for scenarios such as high-density urban areas, temporary large-capacity events, the Internet of Things, and intelligent transportation systems. The paper focuses on exploring the application potential of HAPS-SMBS in key technologies such as millimeter-wave communication, massive MIMO, and free-space optical communication and analyzes the challenges it faces in interference management, resource allocation, network control, and constellation networking, looking forward to its key role in 6G and future networks.
Previous research has sought to enhance the coverage range and capacity of traditional terrestrial base station networks by increasing hardware facilities and adjusting switching technologies. However, such methods may lead to challenges such as environmental impact, power supply issues, resource consumption, and spatial utilization pressure, and in complex terrains like mountainous areas, network complexity increases and maintenance costs rise. Therefore, this paper converts terrestrial base stations into aerial drones, using drones as mobile base stations to dynamically adjust spatial positions, effectively avoiding terrain obstructions and responding in real time to users’ changing signal demands.

2.2. UAV Path Planning

UAV path planning is a core technical support to ensure their safe, efficient, and accurate completion of flight missions. By pre-planning or real-time planning of the optimal or feasible flight trajectories, path planning cannot only effectively avoid static obstacles such as buildings, terrain, no-fly zones, and dynamic threats from other aircraft, greatly enhancing flight safety and preventing accidents, but it can also take into account multiple factors such as mission time, energy consumption, and route length, significantly improving operational efficiency and economic viability, which is crucial for applications such as logistics delivery, agricultural protection, power inspection, and aerial surveying and mapping.
Debnath et al. [33] systematically reviewed the path planning algorithms and obstacle avoidance methods of UAVs in remote sensing applications, covering both single and multi-UAV platforms. The paper categorizes path planning algorithms into global path planning, such as A* [34], genetic algorithms [35], particle swarm optimization [36], etc., and local path planning, such as rapidly exploring random tree (RRT) [37], artificial potential field (APF) [38], fuzzy logic [39], neural networks [40], reinforcement learning [41], etc., and analyzes various optimization and learning algorithms for collaborative path planning of multiple UAVs. In addition, the paper delves into obstacle detection and avoidance strategies based on vision, laser, simultaneous localization and mapping (SLAM) [42], deep learning [43], and other sensors and algorithms and evaluates the applicability, optimization capabilities, and computational efficiency of these methods in remote sensing scenarios such as precision agriculture, urban surveying, and environmental monitoring. Finally, the paper points out that current research still faces challenges in real-time performance, dynamic environment adaptability, and multi-UAV collaboration and proposes future research directions to enhance the autonomy and mission execution effectiveness of UAVs in complex environments.
Li et al. [44] proposed a path planning method based on a greedy allocation strategy and an improved ant colony optimization algorithm for multi-UAV target coverage tasks in dynamic environments. This method first determines the optimal number of UAVs and assigns target points through a greedy strategy then introduces a variable pheromone enhancement factor and evaporation coefficient to improve the traditional ant colony algorithm to enhance path search efficiency and convergence speed while also supporting real-time path replanning when new target points emerge during the mission. Simulation results show that this algorithm is superior to traditional ant colony optimization (ACO) [45], genetic algorithms, and other improved algorithms in terms of solution accuracy and operational efficiency and is suitable for real-world application scenarios where tasks change dynamically.
Salehi et al. [46] proposed a UAV base station trajectory optimization method combining multi-channel irregular repeated slotted and Q-learning algorithms, aiming to provide ultra-reliable low latency communication (URLLC) services for industrial IoT (IIoT) devices in outdoor hard-to-reach areas. By dynamically clustering based on Mahalanobis distance to reduce UAV communication energy consumption, and using Q-learning to optimize its flight path to reduce mechanical energy consumption, simulation results show that this method can significantly reduce UAV energy consumption by 19% to 31% compared to random service and other benchmark methods when flying at a fixed height while meeting the reliability and latency requirements of URLLC.
Phung et al. [47] introduced a new algorithm called spherical vector-based particle swarm optimization (SPSO) to solve the path planning problem of UAVs in complex environments. The algorithm transforms the path planning problem into an optimization problem and uses SPSO to effectively search the configuration space of UAVs to find the optimal path that minimizes the cost function. The paper demonstrates the performance advantages of SPSO over other optimization algorithms such as classical particle swarm optimization (PSO), phase angle encoding PSO [48], quantum behavior PSO [49], genetic algorithm (GA), artificial bee colony (ABC) [50], and DE [51] in various scenarios. In addition, the paper also verifies the effectiveness of the generated path through real UAV operations.
Previous research has addressed UAV path planning issues by optimizing evolutionary algorithms, sensors, and obstacle detection and avoidance strategies. However, under the framework of deep reinforcement learning, the joint optimization of energy consumption and base station layout in complex mountainous terrains remains a challenge. Therefore, this paper models the energy consumption and movement routes of UAVs, deeply analyzes the relationship between the two, and achieves minimum energy consumption while maintaining optimal paths.

2.3. Deep Reinforcement Learning

Deep reinforcement learning ingeniously combines the perceptual capabilities of deep learning with the decision-making capabilities of reinforcement learning. Its core concept is to train an autonomous entity known as an “agent” to learn the optimal behavior strategy by continuously interacting with the environment through trial and error. In this process, the agent performs an “action” in a specific “state,” and the environment provides a “reward” signal (positive rewards indicate encouragement, while negative rewards indicate punishment) and transitions to a new state. Deep reinforcement learning can use complex deep neural networks to approximate functions that are difficult to handle in traditional reinforcement learning, such as the value function (assessing the long-term desirability of states or actions) or the policy function (directly mapping states to actions), enabling the agent to make fine-grained decisions in large or even continuous state and action spaces.
Klaine et al. [52] proposed a distributed reinforcement learning (Q-learning)-based method for intelligent UAV small base station positioning to dynamically optimize the three-dimensional position of UAVs in emergency communication networks. The algorithm treats each UAV as an independent agent, learning online and interacting with the environment to autonomously explore the best position to maximize the number of covered users while also considering user mobility, differentiated quality of service requirements, and resource constraints of the wireless access network and backhaul links. Compared to traditional fixed deployment strategies or offline optimization methods such as PSO, this approach has stronger environmental adaptability and real-time response capabilities, enabling rapid deployment and continuous optimization of network coverage after disasters, significantly improving user connection rates and overall system performance.
Zhang et al. [53] developed a deep reinforcement learning algorithm that combines Adaptive Exploration (AE) and Value-based Action Selection (VAS) strategies for the automatic and efficient deployment of multiple UAV base stations (UAV-BS) in dynamic environments. The algorithm optimizes the three-dimensional position of UAVs to adapt to the mobility of ground users and ensures the quality of service requirements for user throughput and drop rate in mission-critical (MC) scenarios by integrating DRL with integrated access and backhaul (IAB) technology. Additionally, a decentralized architecture was proposed to support collaboration among multiple UAV base stations, enabling effective communication and coordination without central control, thereby enhancing the scalability and robustness of the algorithm.
Previous research on deep reinforcement learning algorithms mostly used fixed values for algorithm parameters. As decisions are executed, the state space changes constantly, which does not adapt well to changing environments. Moreover, the integration of deep reinforcement learning with heuristic algorithms is mostly unidirectional. Therefore, this paper proposes a dynamic weight adaptation mechanism that dynamically adjusts parameters by analyzing the static complexity and fluctuation index of the environment. A bidirectional information interaction channel is introduced, establishing an expert experience buffer to achieve bidirectional transfer of experience between deep reinforcement learning algorithms and heuristic algorithms, thereby enhancing the effectiveness of algorithm collaboration.

3. Model Description

For the wireless communication scenario in mountainous areas, a multi-dimensional modeling system has been constructed, encompassing elements such as base stations, UAVs, and users. A comprehensive reward function has been designed to optimize the communication system’s coverage performance, resource utilization efficiency, and energy consumption, providing support for subsequent algorithm development.

3.1. Background

In mountainous regions, the population is sparsely distributed and there is a significant variation in signal requirements. Different users have distinct needs for signal strength, hence it is necessary to consider the specific requirements of various users and plan the layout of base stations accordingly. Users are not stationary points but rather move freely within a small area; therefore, it is essential to utilize the flexibility of UAVs to meet the signal demands of users. Additionally, it is important to plan the flight paths of UAVs in a way that minimizes energy consumption. This is illustrated specifically in Figure 1.

3.2. Methodology

This paper addresses the challenge of 6G communication coverage optimization in mountainous areas. The methodology begins with constructing a multi-dimensional model based on realistic mountainous environments. Terrain elevation is simulated by superimposing Gaussian functions onto random noise, while signal attenuation is characterized using a log-distance path loss model. User mobility patterns are described by a Markov chain, and UAV energy consumption is formulated using a multi-component model. These elements collectively form an integrated Terrain-Base Station-UAV-User scenario model, providing a realistic environmental basis for subsequent optimization.
The modeling phase specifically accounts for mountainous characteristics. The significant signal occlusion caused by rugged terrain is addressed by establishing a 3D coverage model to accurately calculate the effective coverage volume of both base stations and UAVs. Furthermore, multiple physical constraints are defined, including the minimum installation height, transmit power, and coverage overlap ratio for base stations; the flight speed, altitude, and energy consumption for UAVs; and the mobility range and multi-tier Signal-to-Noise Ratio (SNR) requirements for users.
The research on UAV–base station coordinated layout optimization is currently facing the following main issues. First, the limitations of traditional two-dimensional coverage models in complex terrains have become the main bottleneck in improving the accuracy of communication coverage in mountainous areas. Klaine et al. [52] empirically demonstrated that traditional terrestrial base stations, constrained by fixed locations and terrain obstructions, struggle to achieve effective coverage. Debnath et al. [33] further pointed out that two-dimensional path-planning models cannot accurately reflect the signal-propagation characteristics in the three-dimensional terrain of mountainous areas, leading to the creation of coverage blind spots. This limitation is particularly prominent in mountainous scenarios, necessitating the development of a dedicated three-dimensional coverage model. Second, the contradiction between the limited endurance of UAVs and the demand for wide-area coverage seriously restricts the practicality of UAV-assisted communication. Salehi et al. [46] experimentally analyzed that limited onboard energy significantly affects the UAVs’ ability to provide continuous coverage services. This contradiction is particularly evident in the vast areas of mountainous regions. Third, the dynamic coverage demand brought by user mobility poses a severe challenge to traditional static deployment strategies. Zhang et al. [53] showed that the spatiotemporal changes in user locations lead to highly dynamic signal-demand characteristics, necessitating real-time adjustment of network resource allocation. Li et al. [44] demonstrated the necessity of real-time path replanning through multi-UAV target-coverage tasks. In addition, Su et al. [26] pointed out that precise control of the overlap rate of adjacent base-station coverage is crucial to ensuring communication quality and avoiding co-channel interference.
Based on the above-mentioned models and constraints, this study focuses on solving three core problems: (1) The inadequacy of traditional 2D coverage models in complex terrains is overcome by developing a dedicated 3D signal propagation and coverage model. (2) The conflict between limited UAV endurance and extensive coverage demands is mitigated by jointly optimizing UAV flight trajectories and base station placement. (3) The dynamic nature of user-induced signal demands is accommodated by designing an adaptive optimization mechanism that balances performance with computational efficiency, ultimately achieving robust 6G communication coverage in mountainous regions.

3.3. Terrain Model

In real-world communication scenarios, topography is a pivotal determinant of wireless signal propagation. Micro-scale surface undulations, such as rocks and vegetation, can alter the paths of signal reflection and diffraction. In contrast, macro-scale landforms, like hills and basins, may directly cause signal blockage. Constructing a terrain model that closely mirrors reality is a prerequisite for evaluating network coverage performance and optimizing node deployment. To emulate the micro-scale characteristics of natural terrain, this model employs standard normal distribution random noise as the terrain foundation:
b a s e ( x , y ) N ( μ = 0 , σ = 1 )
where the coordinate pair ( x , y ) denotes the grid position on the horizontal plane; N represents the normal distribution; μ = 0 is the mean of the distribution, ensuring the terrain fluctuations oscillate around a baseline elevation; and σ = 1 is the standard deviation.
Mountains, hills, and other uplifted terrains typically exhibit a gradual variation, with higher centers and lower edges, and multiple mountain ranges exhibit competitive growth characteristics in space. This model uses a two-dimensional Gaussian function to simulate the shape of a single hill and employs a maximum value fusion strategy to achieve spatial superposition of multiple hills.
The elevation distribution of a single hill satisfies:
G ( x , y ; x 0 , y 0 , σ , A ) = A · e ( x x 0 ) 2 + ( y y 0 ) 2 2 σ 2
where ( x 0 , y 0 ) represents the coordinates of the center of the hill; σ is the Gaussian standard deviation, controlling the horizontal scale of the hill; and A is the amplitude parameter, controlling the height of the hill.
If a simple addition method is used to superimpose multiple hills, it would lead to a meaningless accumulation of height in the overlapping areas, forming extremely high peaks that far exceed natural laws. To address this issue, this model employs a maximum value fusion strategy:
t e r r a i n m o u n d s ( x , y ) = max G 1 ( x , y ) , G 2 ( x , y ) , , G N ( x , y )
where N denotes the number of hill formations.
By superimposing the foundational noise upon the hill terrain, a primal terrain field is constructed:
h t e r r a i n ( x , y ) = t e r r a i n m o u n d s ( x , y ) + b a s e ( x , y )
In practical applications, the coordinates for elevation queries are often not integer grid points but rather continuous spatial locations. If the elevation of the nearest grid point to the query point is directly taken as the elevation of that point, it would lead to abrupt changes in elevation values between adjacent query points, resulting in a noticeable stair-stepping effect. To address this issue, our model employs a bilinear interpolation algorithm. This algorithm utilizes the elevation values of the four integer grid points surrounding the query point and performs a weighted average calculation to ensure that the elevation between adjacent points is consistent with real-world conditions.

3.4. Base Station Model

The status of a base station is determined by five parameters: b i = { x i , y i , h i , p i , f i } . The coordinates ( x i , y i ) represent the planar position of the base station; the vertical position z i of the base station is determined by its planar coordinates ( x i , y i ) ; h i is the elevation above sea level of the base station; p i denotes the transmission power of the base station; f i is the operating frequency band of the base station.
The five parameters of the base station must satisfy certain constraints to ensure effective signal coverage. The signal, particularly in high-frequency bands, has weak diffraction capabilities. If the height is lower than the surrounding terrain or buildings, the signal will be obstructed, leading to a significant reduction in coverage range. Therefore, the base station must meet the height constraint conditions, being higher than the terrain by more than h meters, to reduce the probability of signal obstruction and ensure that the signal can cover the target area with minimal loss:
h i max { h t e r r a i n ( x i , y i ) + h , h m i n }
where h t e r r a i n is the terrain elevation at the deployment point; h m i n is the minimum installation height of the base station to avoid being obstructed by buildings.
The value of the height parameter h is determined by considering the altitude distribution of user activities in mountainous scenarios and the wireless propagation geometry between the UAV-BS and ground terminals. This setting aims to balance the practical relevance of the coverage model with the computational complexity of 3D spatial volume calculations while ensuring both the rationality of the simulation evaluation and computational efficiency.
In addition to terrain factors, frequency bands also directly affect network performance. The same frequency band is often shared among multiple base stations. If the power spectral density (PSD) of a base station is too high, i.e., the transmission power within a unit bandwidth is too great, it can cause strong interference to users in adjacent areas using the same frequency band, leading to a decrease in signal-to-noise ratio (SNR) and even communication interruption. Therefore, when deploying base stations, the PSD constraint must be satisfied:
P S D = p i B P S D max
where B is the channel bandwidth; P S D max is the spectrum ceiling.
To ensure coverage continuity, there must be a certain degree of overlap between the coverage areas of adjacent base stations to prevent signal dead zones and to ensure seamless handover for users during their mobility. If the overlap rate is too high, a large number of users will be within the common coverage area of multiple base stations, potentially receiving multiple signals simultaneously, which can lead to co-channel interference. Therefore, coverage overlap is a critical factor affecting the continuity and communication quality of mobile networks and must satisfy the following constraints:
ρ i j = S o v e r l a p ( b i , b j ) S c o v e r ( b i ) θ
where ρ i j represents the overlap ratio between the coverage areas of base stations b i and b j , which should be less than or equal to θ ; S o v e r l a p ( b i , b j ) denotes the area of overlap between the coverage areas of base stations b i and b j ; S c o v e r ( b i ) signifies the total coverage area of base station b i .

3.5. Drones Model

The real-time operational status of an Unmanned Aerial Vehicle (UAV) is determined by six parameters u i ( t ) = { x i ( t ) , y i ( t ) , z i ( t ) , e i ( t ) , p i ( t ) , v i ( t ) } . The three-dimensional coordinates x i ( t ) , y i ( t ) , z i ( t ) reflect the UAV’s real-time spatial position; the UAV’s endurance is limited, where e i ( t ) represents the residual energy of the UAV, with an initial value e i , 0 , and decreases continuously as energy is consumed during flight and communication processes; p i ( t ) is the dynamically adjustable transmission power; v i ( t ) denotes the flight velocity, which is influenced by the UAV’s hardware and atmospheric resistance.
The energy consumption of the UAV is a central issue in UAV path planning. The residual energy e i ( t ) directly determines the UAV’s endurance. If energy consumption is not precisely controlled, it may lead to the UAV being unable to complete its mission due to energy depletion or even cause safety risks such as crashes. At the same time, energy optimization is one of the core objectives of UAV mission planning. By clarifying the correlation between energy consumption and various factors, adjustments can be made to the flight path, control of hover duration, and optimization of transmission power to enhance the UAV’s mission execution efficiency and stability. The total energy consumption E U A V over a mission period can be calculated by summing up the energy consumption components in multiple dimensions:
E U A V = k 1 · 0 T x ˙ ( t ) 2 + y ˙ ( t ) 2 + z ˙ ( t ) 2 d t + k 2 · T h o v e r + k 3 · P U A V · T
where E U A V is the total energy consumption of the UAV; k 1 is the flight energy consumption coefficient, which is related to the UAV’s mass and air resistance; k 2 is the hovering energy consumption coefficient, as the UAV’s rotors need to continuously consume energy to counteract gravity during hovering; k 3 is the communication energy consumption coefficient, with higher transmission power leading to higher communication energy consumption; x ˙ ( t ) , y ˙ ( t ) , z ˙ ( t ) are the UAV’s velocity components in the x , y , z directions at time t; T is the total mission time; T hover is the hovering time of the UAV.
The UAV must meet certain constraints when flying in space, which can be defined by trajectory constraints to limit the UAV’s position, velocity, and acceleration during flight, thereby preventing overshoot or instability while also avoiding no-fly zones. The specific constraints are as follows:
z min z ( t ) z max x ˙ ( t ) 2 + y ˙ ( t ) 2 v max | z ˙ ( t ) | v z max
where z ( t ) is the UAV’s altitude, subject to restrictions from no-fly zones and complex terrain; v max represents the maximum horizontal speed of the UAV, limited by x ˙ ( t ) 2 + y ˙ ( t ) 2 ; v z max represents the UAV’s maximum vertical velocity, limited by | z ˙ ( t ) | .

3.6. User Model

The status of a user is determined by four parameters, e i = { x i , y i , z i , p i } , where x i and y i jointly determine the user’s horizontal position, and z i is calculated based on terrain information. p i represents the user’s SNR requirement, and only areas that meet the user’s SNR requirements are recognized as effective coverage areas when calculating the coverage volume.
In practical application scenarios, users are typically not in a static state but move within a limited range. Movement is not random but constrained by environmental barriers, population density, behavioral habits, and other factors. If these movement patterns are not reasonably constrained, it may lead to users moving across areas in an extremely short time, which does not conform to real-world physical scenarios.
For N users, initialize their positions randomly, along with the corresponding radii R = { R 1 , R 2 , R 3 , , R N } . Divide the terrain’s horizontal plane into a grid of 1000 × 1000 points, and users can reach positions within the grid points that are within the radius R range.
Figure 2 illustrates the movable range of 3 users, where the blue circles represent the movement range of each user, and the yellow dot represents the position that user 1 can move to in the next state.
The position of a user at the next moment is only related to their current position, which complies with the Markovian property of being memoryless. A Markov chain is employed to construct a user position transition model. The user activity area is gridded, and each grid unit is considered a state. The state space is defined as S = { s 1 , s 2 , , s n } , where n is the number of grid units in the user activity area.
Based on historical mobility data, the probability p i j that a user transitions from the current state s i to the next state s j is statistically calculated:
P i j = P ( X t + 1 = s j | X t = s i )
This forms the transition probability matrix P = [ P i j ] n × n . At each time step, based on the current state s i of the user and the transition probability matrix P, the next state s j is determined by random sampling, thereby realizing the user’s movement to the grid unit corresponding to s j at the next moment.
In Figure 3, the coordinate of User 1 moves from a blue point to a pink point according to the arrow, and the corresponding activity area of the user also changes.
In diverse application scenarios, users exhibit heterogeneous Quality-of-Service (QoS) requirements. We therefore partition traffic demands into three ordinal priority classes, each associated with a minimum signal-to-noise ratio (SNR) threshold drawn from the set SNR = { S 1 , S 2 , S 3 } . These thresholds are stochastically instantiated to emulate the empirical distribution of real-world service requests. Priority-1 traffic, exemplified by instant messaging and voice telephony, is guaranteed a baseline SNR of S 1 . Priority-2 traffic—encompassing video telephony and conventional live-streaming services—mandates an SNR S 2 . Priority-3 traffic, characteristic of large-scale concert uplinks and mission-critical emergency response operations that are acutely sensitive to link quality, demands an SNR S 3 .
S N R k = S 1 , k = 1 S 2 , k = 2 S 3 , k = 3

3.7. Path Loss Model

In wireless communication systems, electromagnetic waves experience energy attenuation as they propagate from the transmitter to the receiver due to factors such as propagation distance extension, environmental obstructions, and multipath effects. The path loss model for a given distance integrates both distance-dependent attenuation and environmental interference factors. Ground-based stations are limited by fixed heights and are easily obstructed by buildings and trees, whereas UAVs can circumvent most ground obstructions through aerial flight paths by incorporating shadowing components, effectively distinguishing signal attenuation characteristics between these two scenarios.
The logarithmic distance path loss model takes the path loss under the near-range line-of-sight propagation condition as the reference and establishes the mathematical characterization of the path loss at any transmission distance by introducing the attenuation term proportional to the logarithmic distance and the random shadow attenuation term:
L ( d ) = L 0 + 10 n log 10 d d 0 + X σ
where L ( d ) represents the total path loss at a transmission distance d; L 0 is the reference path loss at a reference distance d 0 ; n is the path loss exponent; d 0 is the reference distance; X σ represents the shadow attenuation.

3.8. Signal Calculation Model

In the UAV–base station collaborative optimization model, the received power of a user consists of signals from both ground base stations and UAVs. The signals from ground base stations and UAVs are subject to log-distance path loss from the transmitter to the user’s receiver. Assuming that user u receives signals from n base stations and m UAVs, the received power formula for user u is given by:
P r e c , u = i = 1 m P U A V · 10 L U A V , u / 10 + j = 1 n P B S · 10 L B S , u / 10
where P r e c , u is the reception power of user u; P B S is the transmission power of the base station; P U A V is the transmission power of the UAV; L B S , u and L U A V , u are the path losses from the base station and UAV to user u, respectively.

3.9. Signal Detection Range

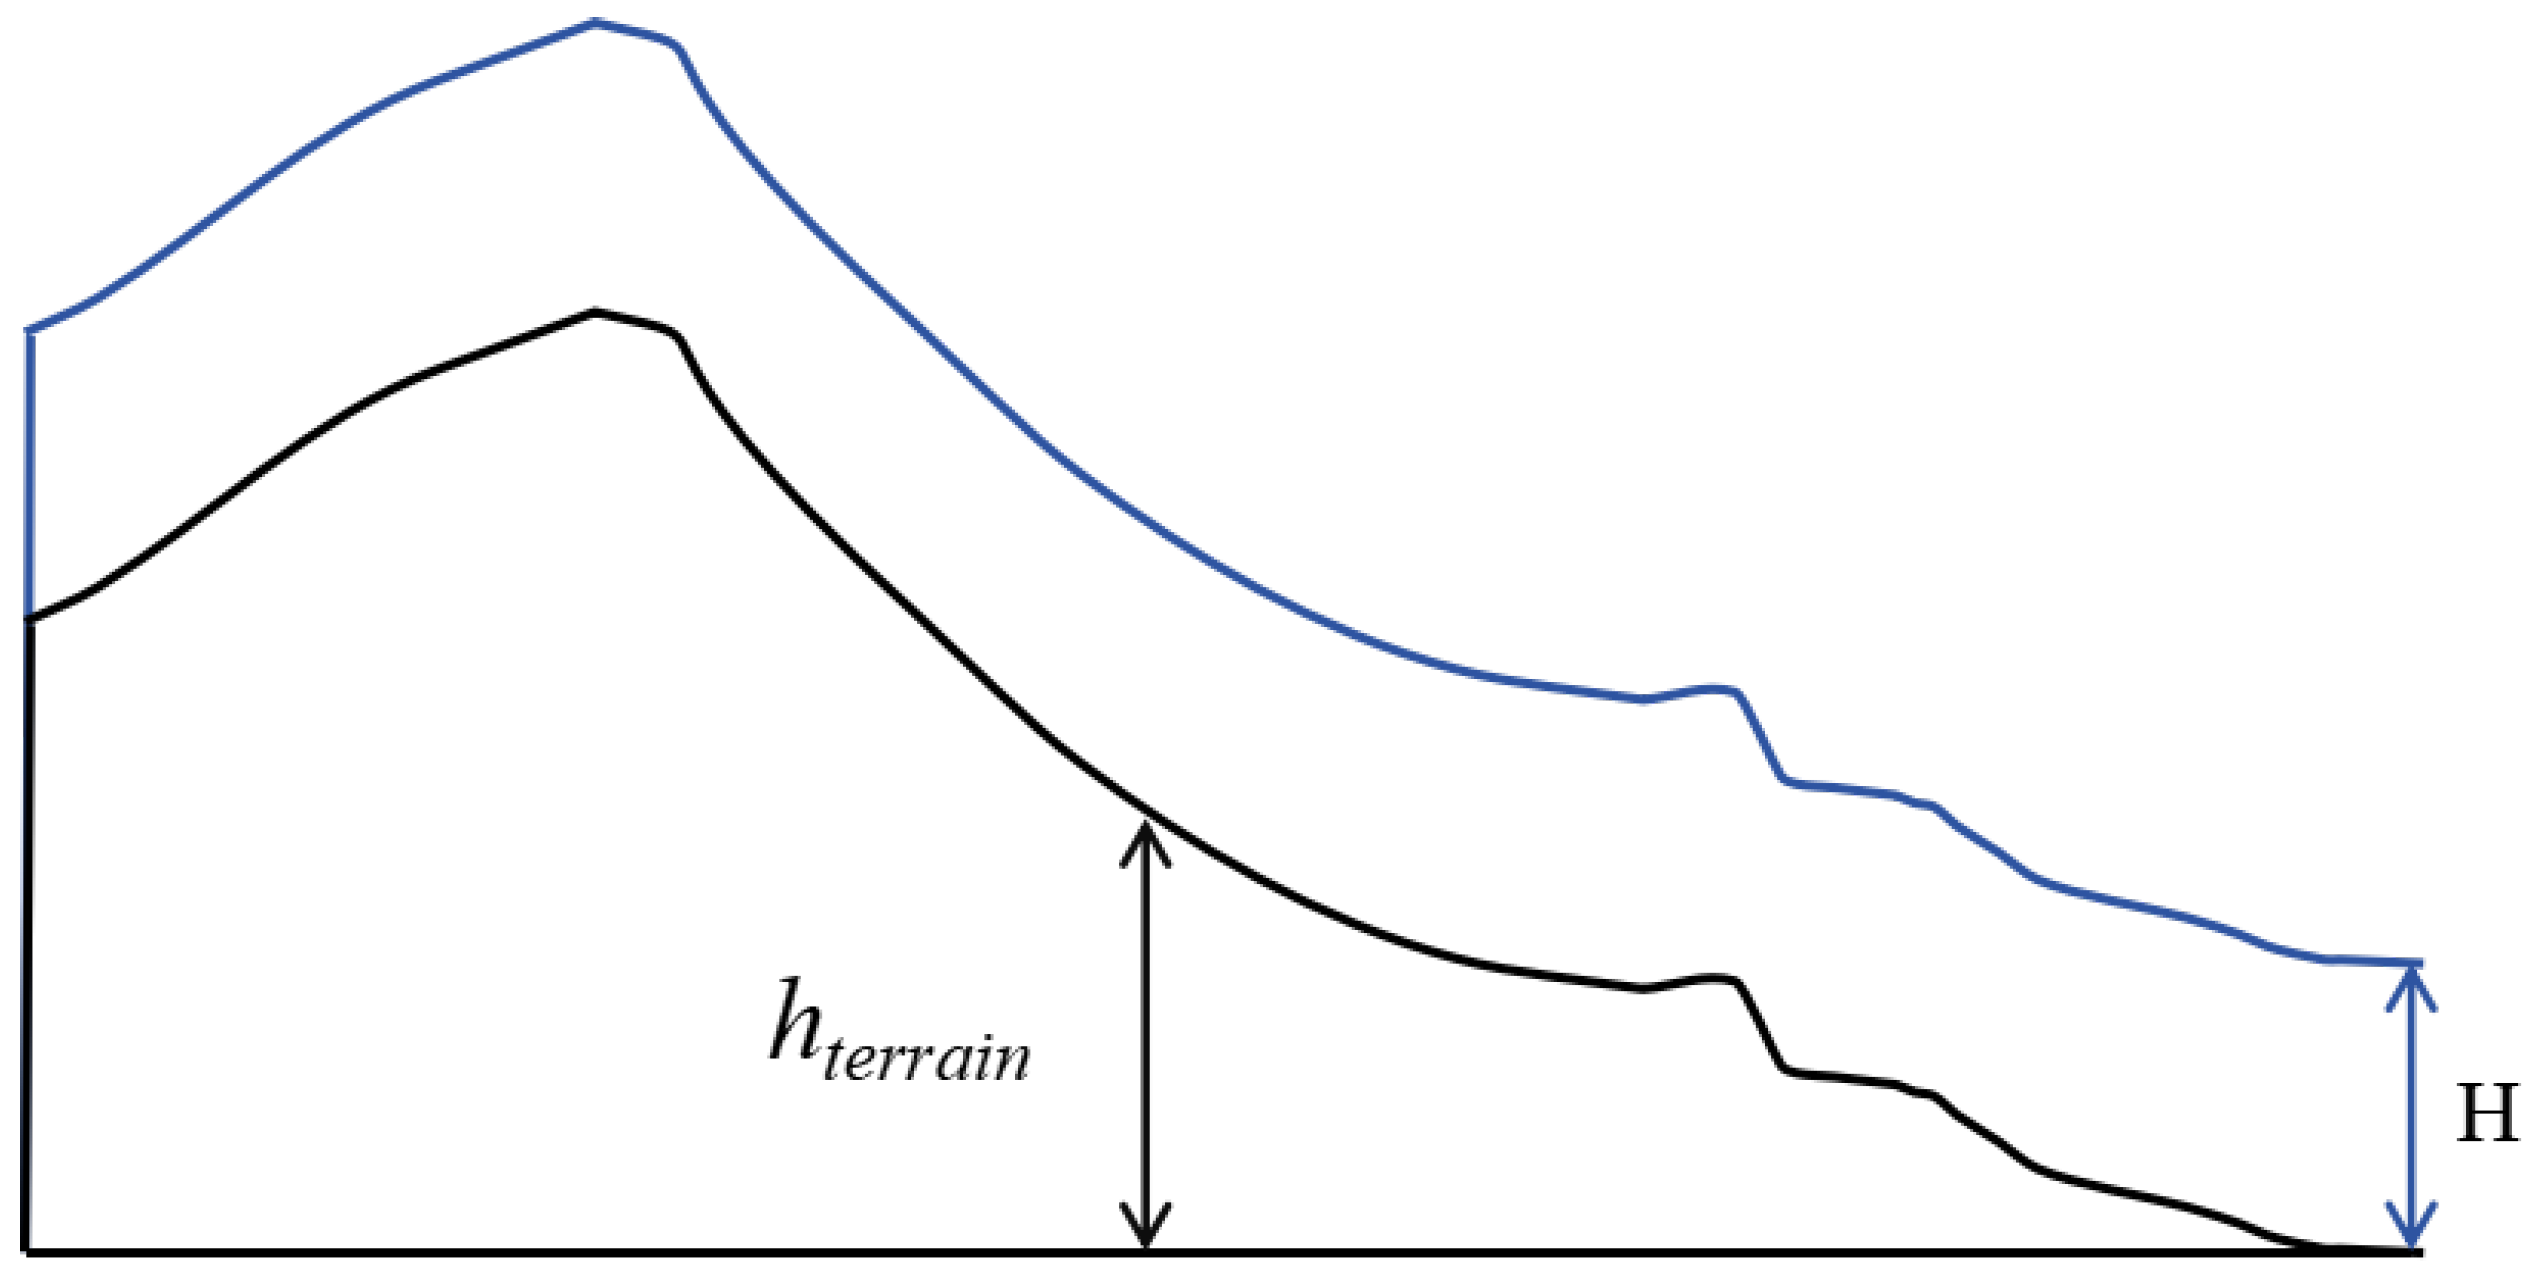
The spatial scope of signal coverage must be defined in conjunction with actual communication requirements to prevent interference from ineffective spaces in the calculation results. There is no practical communication demand for the area below the mountainous surface, and thus there is no need for wireless signal coverage from base stations. Consequently, this area should not be included in the calculation of the coverage domain when assessing coverage rates. The demand for signals in high-altitude airspace is minimal and is not a focal area for base station deployment considerations; hence, it should also be excluded from the calculations. The signal coverage range is defined from the surface height  h t e r r a i n to a height H above the ground surface.
Figure 4 shows the mountain profile [54]. The black lines represent the mountain ridges, and the area enclosed by both the black and blue lines denotes the signal-coverage detection zone.

3.10. Coverage Radius Calculation

The coverage radius refers to the maximum distance at which a communication node can provide effective service while meeting the minimum SNR requirements. For user areas, the SNR must satisfy the corresponding priority level requirements. For areas without users, the minimum SNR requirement is set to 10 dB.
In wireless communication, the SNR at the receiver is calculated using the following formula:
S N R = P r x P n o i s e
where P r x is the receiver signal power, and P n o i s e is the noise power at the receiver.
For computational convenience, power is converted to the unit of decibel milliwatt (dBm), and the SNR in dB form is given by:
S N R d B = P r x , d B m P n o i s e , d B m
According to the path loss model for a given distance, the relationship between the receiver signal power and the transmitter power is:
S N R d B = P t x , d B m L ( d ) P n o i s e , d B m
where P t x , d B m is the transmitter power in dBm, and L ( d ) is the path loss at a distance d. Combining the logarithmic distance path loss model, the formula for calculating the coverage radius d max is derived as:
d max = 10 P t x , d B m ( P n o i s e , d B m + S N R t h ) L 0 10 n

3.11. Coverage Detection

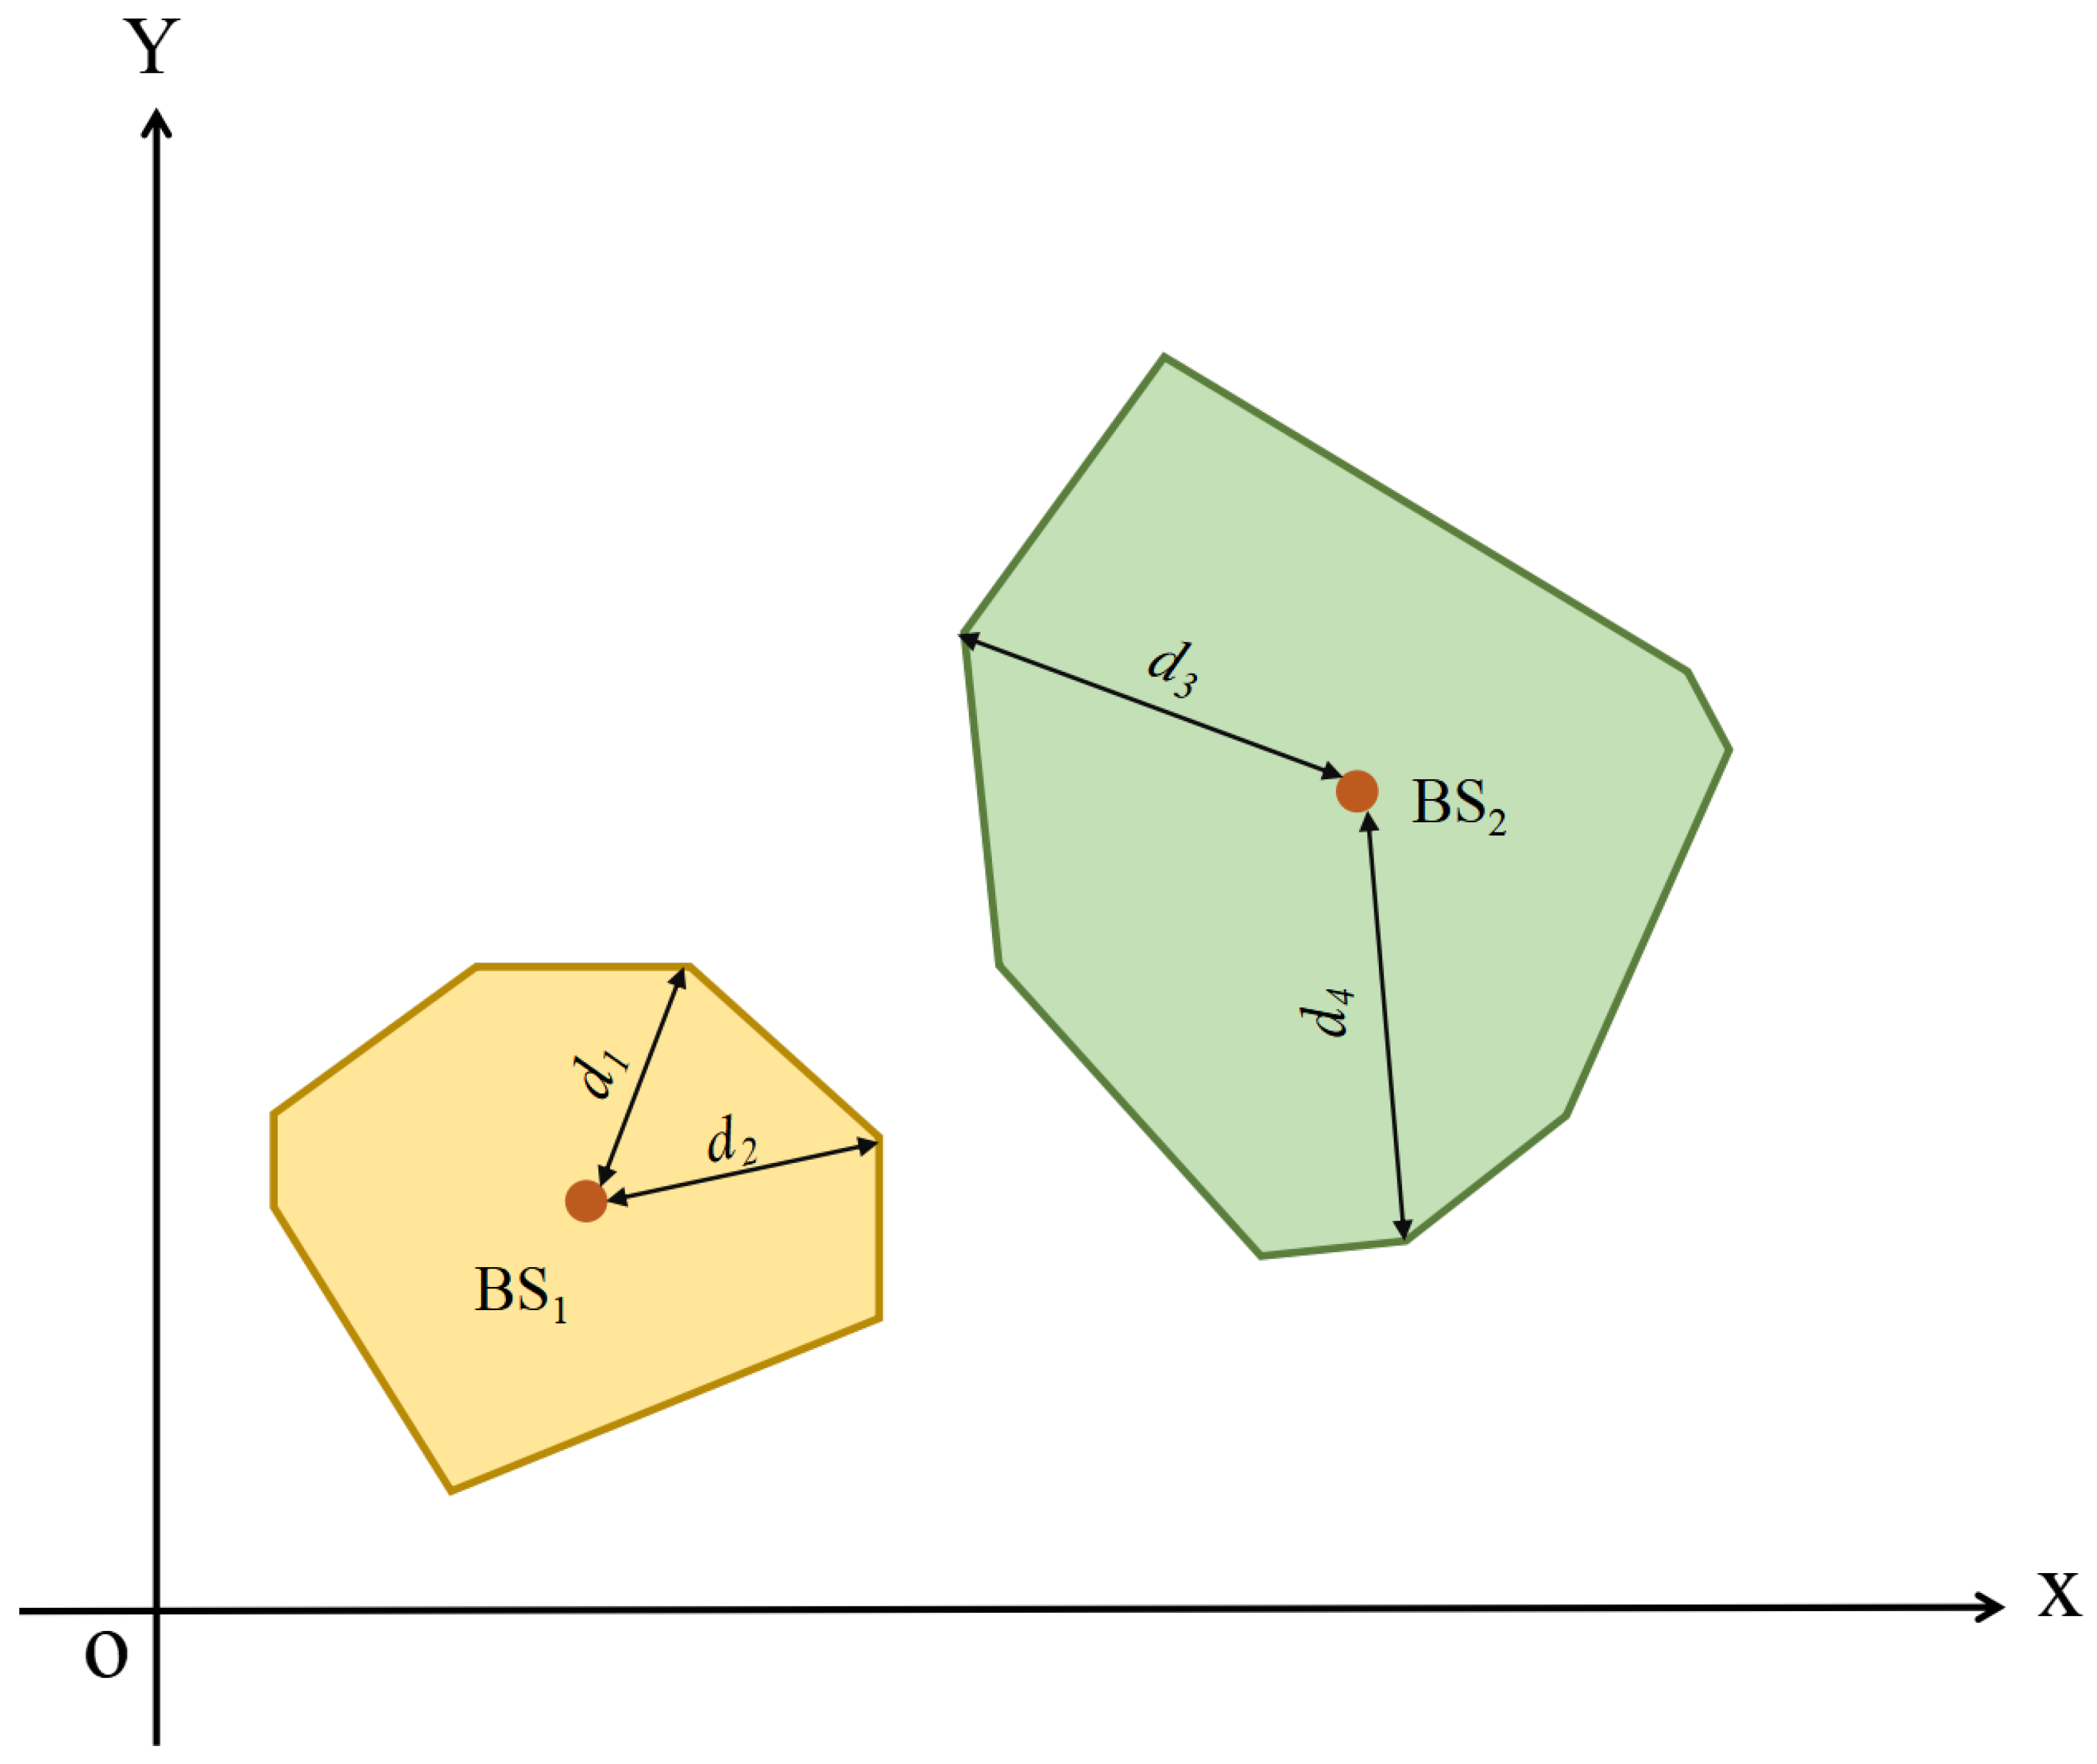
Figure 5 shows the XOY sectional view of the signal coverage range of two base stations BS 1 and BS 2 . It can be seen from Figure 5 that the coverage radius d of the base station in each direction is different.

4. Function Description

4.1. State Space

The state vector S represents the overall state of the multi-UAV, multi-base station, and multi-user communication system. The parameters are normalized to eliminate quantization errors. The specific form is as follows:
S = p u a v , l t e r r a i n , v u a v , l v max , e u a v , l e max , UAV - state , p u s e r , l t e r r a i n , S N R l S 3 , I ( S N R l S N R t h , l ) , User - state , p b s , l t e r r a i n , , 0 , , M M max BS - state
where p u a v , l t e r r a i n represents the position of the UAV, combined with terrain parameters; v u a v , l v max indicates the UAV’s velocity; e u a v , l e max represents the UAV’s energy; p u s e r , l t e r r a i n indicates the user’s position; S N R l S 3 represents the user’s signal-to-noise ratio, with S 3 being the highest SNR threshold for users; I represents the coverage state indicator function, used to mark how many users meet the SNR threshold; p b s , l t e r r a i n represents the position of the deployed base station; 0 indicates the undeployed base station symbol; M M max represents the ratio of deployed base stations to the maximum number of base stations.

4.2. Action Space

The action vector is a control command issued by the intelligent agent, transforming the optimized strategy into executable specific actions. The action space consists of UAV motion actions and base station deployment actions, as shown below:
a = Δ v x , 1 , Δ v y , 1 , Δ v z , 1 , , UAV d e p l o y , c a n d i d a t e BS
here, the UAV module contains three parameters responsible for controlling the UAV’s velocity. Δ v x , 1 represents the velocity change in the x-axis for the first UAV, and Δ v y , 1 , Δ v z , 1 follow the same logic. The base station deployment module includes two actions: d e p l o y (to deploy the signal) and c a n d i d a t e (to select the candidate location). The parameter c a n d i d a t e is only meaningful when d e p l o y equals 1.

4.3. Reward Function

To efficiently optimize the performance of UAV and base station communication systems, a comprehensive reward function is designed by integrating various factors to optimize multiple objectives such as user coverage, spatial coverage, resource utilization, and energy consumption. This reward function is derived from multiple sub-rewards that are weighted and then summed. The weights are dynamically adjusted according to the changes in the core metric of user coverage rate to adapt to different optimization stages.
User coverage reward is the core of the reward function, which requires the system to prioritize user coverage and comprehensively considers the total number of users and the demand priority of different users. Through the indicator function, it determines whether the real-time SNR of users reaches the demand threshold:
R c o v = k = 1 K w k · I ( S N R k S N R k , t h ) k = 1 K w k
where K is the number of users, w k is the priority weight of user k (with high priority w = 3 , medium priority w = 2 , and low priority w = 1 ), and I ( · ) is the indicator function (equals 1 when the condition is met, otherwise 0).
The volumetric coverage reward encourages the base station to expand its effective coverage range in three-dimensional space. If the user area has already met the SNR requirement threshold, it can then focus on uncovered signal areas to eliminate coverage gaps:
R v o l = V c o v e r e d V t o t a l × 100 %
where V c o v e r e d is the volume of the covered space, considering only the space up to H meters above the ground; V t o t a l = t e r r a i n × t e r r a i n × H is the total spatial volume.
The base station dispersion reward is used to encourage the dispersion of base stations to achieve a rational layout, thereby avoiding the overlap and waste caused by resource concentration. By calculating the average distance between all deployed base stations and then normalizing it with the maximum possible distance, we obtain the minimum value:
R s p r e a d = min d ¯ d max ¯ , 1
where d ¯ represents the average distance between base stations, M is the number of base stations, and d max ¯ = 2 × t e r r a i n is the maximum possible distance.
The coverage uniformity reward focuses on the stability of signal quality in userless areas, avoiding the creation of signal blind spots or interference due to excessively large or small distances between adjacent base stations, and the optimal signal overlap rate is around 30%:
R u n i = max 1 min σ S N R η , 1 , 0
where σ S N R is the standard deviation of SNR in the userless area, and η is an empirical threshold value.
The total reward function is the weighted sum of the aforementioned sub-rewards, costs, and penalty items and is divided into two ends based on whether R c o v reaches 90%. When R c o v T c o v e r a g e , it is preferred to cover the user demand area; when R c o v > T c o v e r a g e , it encourages the dispersion of base stations to reduce coverage blind spots. The specific reward function is set as follows:
R = 15 R c o v + 2 R v o l + 3 R s p r e a d + R u n i 0.001 E 3 R o v e r l a p C b s , R c o v < T c o v e r a g e 8 R c o v + 8 R v o l + 4 R s p r e a d + 4 R u n i 0.001 E 4 R o v e r l a p C b s , R c o v T c o v e r a g e
where E is the total energy consumption of the UAV; R o v e r l a p is the coverage overlap rate; C b s = 0.3 × M is the base station deployment cost, aiming to minimize the deployment of base stations while satisfying the coverage rate improvement.

5. Proposed Algorithm

5.1. Core Algorithm Foundation

5.1.1. Twin Delayed Deep Deterministic Policy Gradient Algorithm

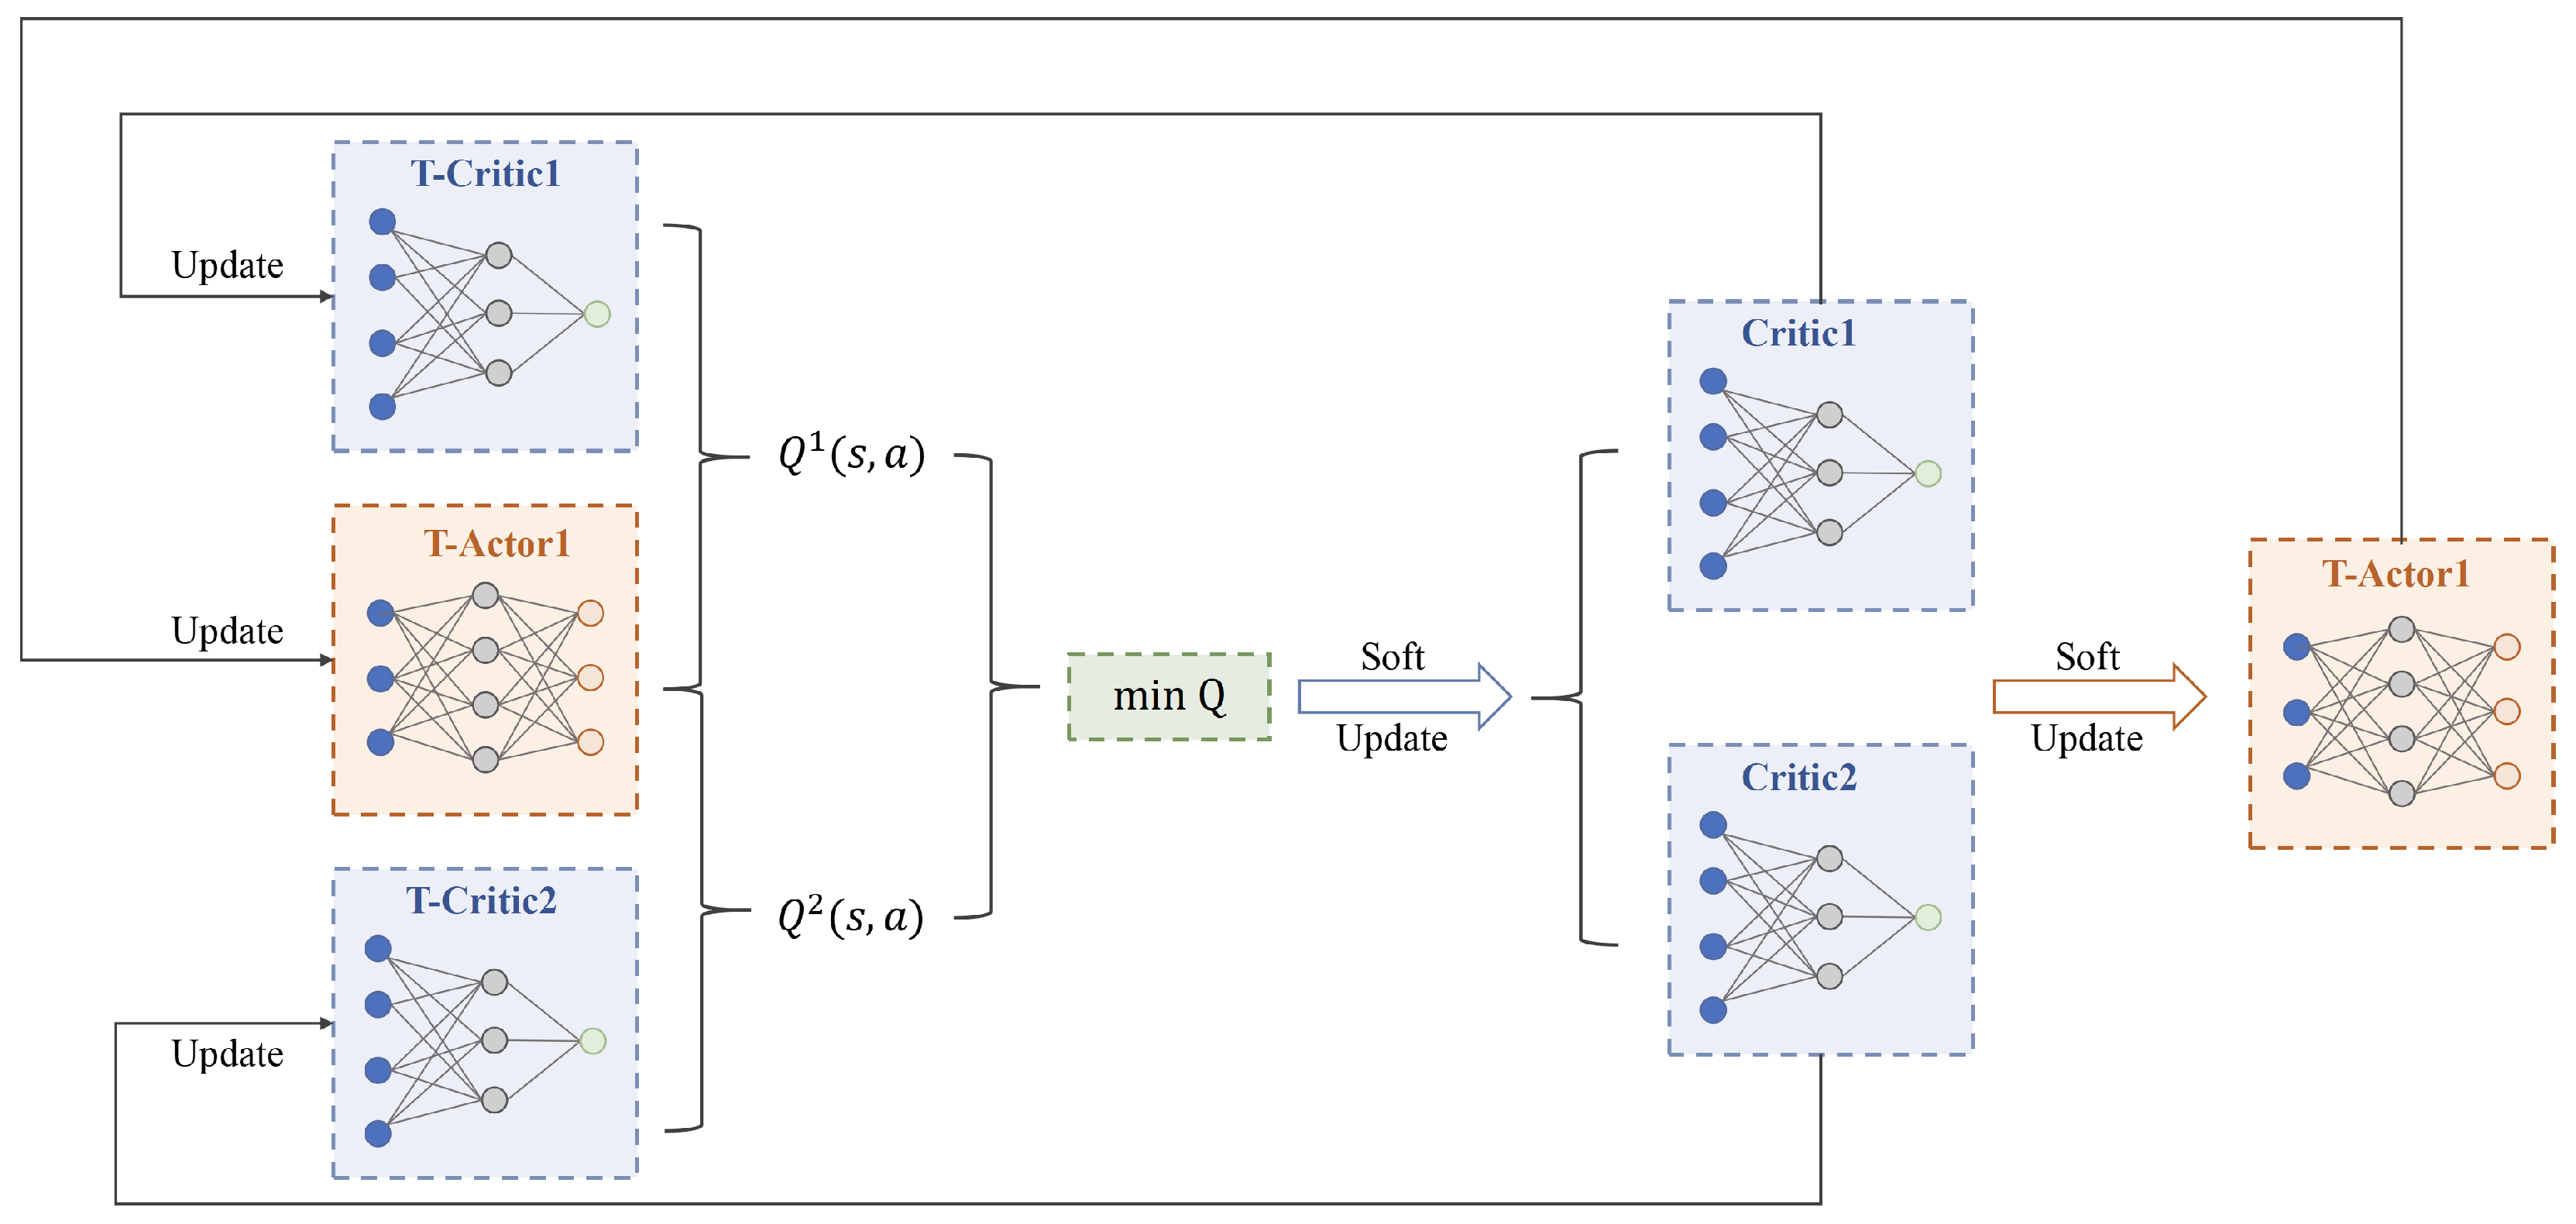
The Twin Delayed Deep Deterministic policy gradient algorithm (TD3) is an improved version based on Deep Deterministic policy gradient (DDPG), demonstrating excellent performance in solving high-dimensional continuous action space problems. Compared to the single Q-network used in traditional DDPG and Deep Q-Network (DQN) for value estimation, this algorithm employs a dual Q-network structure, simultaneously training two independently parameterized Q value estimation networks, T-Critic1 and T-Critic2, and selecting the minimum value as the target Q value calculation basis. It also updates the Critic1 and Critic2 networks, effectively mitigating the overestimation bias issues prevalent in traditional single Q-networks. TD3 introduces a policy delay update mechanism, setting the update frequency of the policy network T-Actor to 1 K of the Q-network, allowing the value estimation to fully converge before strategy parameter updates, thus avoiding disturbances to strategy optimization from value estimation fluctuations. The TD3 algorithm optimizes noise by adding clipped noise to target actions, ensuring sufficient exploration while avoiding unstable value estimation due to action mutations. Compared to other deep reinforcement learning algorithms, TD3 achieves more efficient convergence and more stable strategy performance in complex continuous control tasks. The structure diagram of the TD3 algorithm is shown in Figure 6.
Based on the aforementioned core design principles of the TD3 algorithm, its complete training procedure is illustrated in the pseudocode of Algorithm 1.
Algorithm 1 Twin Delayed Deep Deterministic Policy Gradient (TD3)
Input: 
Environment e n v , maximum training steps T, replay buffer size D s i z e , target update rate τ , policy noise σ , noise clip c, policy frequency d, discount factor γ
Output: 
Trained policy network π ϕ , value networks Q θ 1 , Q θ 2
  1:
Initialize policy network π ϕ and value networks Q θ 1 , Q θ 2
  2:
Initialize target networks: π ϕ π ϕ , Q θ 1 Q θ 1 , Q θ 2 Q θ 2
  3:
Initialize replay buffer D
  4:
t 0
  5:
for  t = 1 to T do
  6:
      Observe state s t
  7:
      Select action with exploration noise: a t = π ϕ ( s t ) + ϵ , where ϵ N ( 0 , σ ) , clipped to [ a m a x , a m a x ]
  8:
      Execute a t , observe reward r t and next state s t + 1
  9:
      Store transition ( s t , a t , r t , s t + 1 , done ) in D
10:
      if  | D | batch size  then
11:
           Sample random batch B = { ( s , a , r , s , done ) } from D
12:
           Compute target actions with smoothed noise:
13:
            ϵ N ( 0 , σ ) , clipped to [ c , c ]
14:
            a = π ϕ ( s ) + ϵ
15:
           Compute target Q-values:
16:
            Q t a r g e t = r + γ · min ( Q θ 1 ( s , a ) , Q θ 2 ( s , a ) ) · ( 1 done )
17:
           Update critics by minimizing:
18:
            L ( θ 1 ) = MSE ( Q θ 1 ( s , a ) , Q t a r g e t )
19:
            L ( θ 2 ) = MSE ( Q θ 2 ( s , a ) , Q t a r g e t )
20:
           Update θ 1 , θ 2 via gradient descent
21:
           if  t mod d = 0  then
22:
                 Update actor by maximizing:
23:
                  L ( ϕ ) = E [ Q θ 1 ( s , π ϕ ( s ) ) ]
24:
                 Update ϕ via gradient descent
25:
                 Update target networks:
26:
                  θ 1 τ θ 1 + ( 1 τ ) θ 1
27:
                  θ 2 τ θ 2 + ( 1 τ ) θ 2
28:
                  ϕ τ ϕ + ( 1 τ ) ϕ
29:
           end if
30:
      end if
31:
end for

5.1.2. DE Algorithm

Differential Evolution (DE) is a global optimization algorithm based on population evolution, simulating mutation, crossover, and selection operations in biological evolution to approximate the optimal solution. By leveraging the differential mutation mechanism, the DE algorithm can effectively escape local optima and exhibits low sensitivity to initial solutions and parameter settings, demonstrating stability in complex spaces.
DE can meet the needs for real-time adjustment of UAV trajectories in dynamic environments. Based on the initial actions output by the TD3 algorithm, DE quickly fine-tunes to enhance coverage efficiency. Through the information sharing mechanism among particles, it supports collaborative optimization among multiple UAVs, effectively avoiding conflicts between individual trajectories and maximizing overall coverage range.
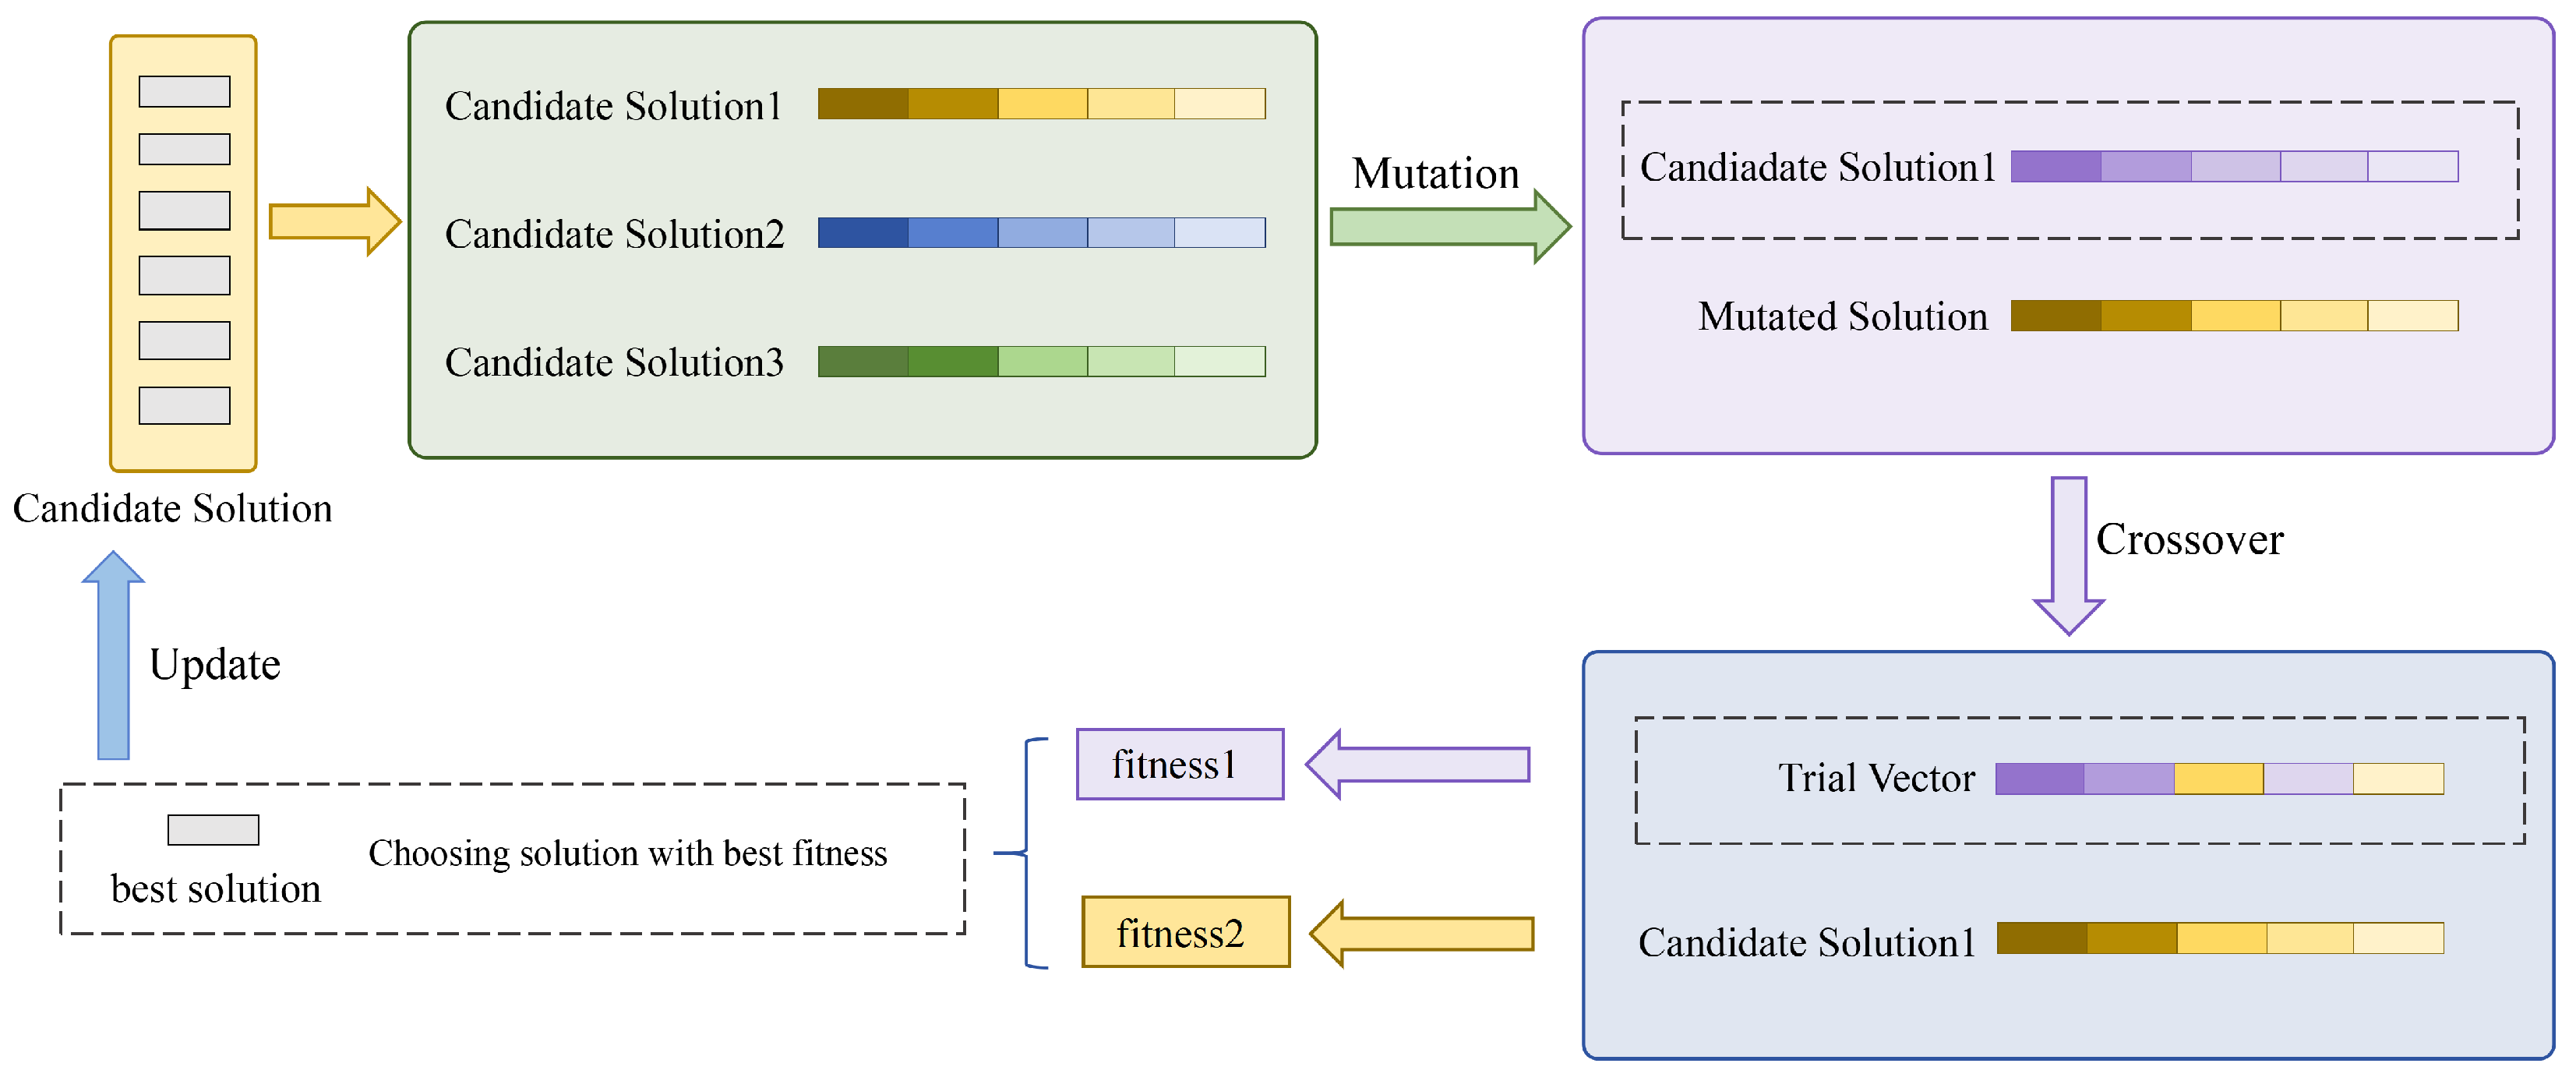
In the context of base station deployment optimization, the DE algorithm can accommodate dispersed and mixed variables, directly treating base station candidate points and other decentralized decision variables as population individuals. Through crossover operations, it achieves combinatorial optimization of candidate points. Addressing complex scenarios such as terrain obstruction and uneven user distribution, DE demonstrates superior global search capability, capable of identifying the globally optimal deployment plan from a large-scale candidate set, effectively avoiding coverage gaps caused by local signal blind spots. The structure diagram of the DE algorithm is shown in Figure 7.
Based on the aforementioned core design principles of the DE algorithm, its complete optimization procedure is illustrated in the pseudocode of Algorithm 2.
Algorithm 2 Differential Evolution (DE) Algorithm
Input: 
Population size N P , bounds B, scale factor F, crossover rate C R , max iterations M, objective function f
Output: 
Best solution x * , best fitness f * , fitness history H
  1:
Initialize population P { }
  2:
for  i = 1 to N P  do
  3:
      for  j = 1 to dim do
  4:
             x j random ( B j min , B j max )
  5:
      end for
  6:
       P P { x }
  7:
end for
  8:
x * None , f * , H { }
  9:
for  k = 1 to M do
10:
      for  i = 1 to N P  do
11:
             f i f ( P i )
12:
      end for
13:
       i min arg min ( f )
14:
      if  f i min < f *  then
15:
             x * P i min , f * f i min
16:
      end if
17:
       H H { f * }
18:
       P new { }
19:
      for  i = 1 to N P  do
20:
            Randomly select three distinct individuals a , b , c from P excluding P i
21:
             v a + F · ( b c )
22:
             u P i
23:
             J rand random integer ( 1 , dim )
24:
            for  j = 1 to dim do
25:
                  if  rand ( ) < C R or j = J rand  then
26:
                         u j v j
27:
                  end if
28:
            end for
29:
            for  j = 1 to dim do
30:
                   u j max ( B j min , min ( B j max , u j ) )
31:
            end for
32:
            if  f ( u ) < f ( P i )  then
33:
                   P new P new { u }
34:
            else
35:
                   P new P new { P i }
36:
            end if
37:
      end for
38:
       P P new
39:
end for
40:
return  x * , f * , H

5.2. Motivation

In traditional hybrid algorithm frameworks, reinforcement learning and heuristic algorithms typically adopt a fixed division of labor, which renders the system inadequate for adapting to dynamic and complex communication environments. This leads to limitations such as insufficient decision-making flexibility, a single time-scale perspective, and knowledge isolation between algorithms. To address these issues, this paper proposes an Adaptive Multi-scale Bidirectional TD3 (AMB-TD3) algorithm, whose core is an integrated optimization framework that combines a Dynamic Weight Adaptive Mechanism (DWAM), Multi-time Scale Coordination Mechanism (MTS-COM), and a Bidirectional Information Exchange Channel (BIEC). The multi-scale characteristic of the algorithm stems from the MTS-COM, which decomposes the optimization task into long-, medium-, and short-term time scales, enabling TD3 and DE to focus on long-term policy learning and medium/short-term real-time optimization, respectively. This allows for a hierarchical response to various dynamic challenges in mountainous scenarios, ranging from instantaneous user mobility to persistent terrain blockages. The bidirectional characteristic is realized through the BIEC, which breaks through the conventional unidirectional structure by establishing two-way knowledge transfer and co-evolution between TD3 and DE, thereby effectively leveraging heuristic expert experience to enhance the generalization and convergence capabilities of the reinforcement learning policy. Building upon this, the DWAM dynamically adjusts the decision-making weights of TD3 and DE based on the real-time state of the environment, achieving an optimal match between algorithmic strengths and the dynamic conditions. The synergistic action of these three components collectively enhances coverage performance and resource utilization efficiency in dynamic networks.

5.3. Integration Optimization Mechanism

5.3.1. Dynamic Weight Adaptation Mechanism (DWAM)

The operation of DWAM is divided into two phases: In the initialization phase, the environmental static complexity (ESC) is assessed to configure the initial strategic inclination of the algorithm; subsequently, after each action execution, the dynamic environmental volatility index (EVI) is evaluated in real time to dynamically adjust the decision-making weights of TD3 and DE, as illustrated in Figure 8.
Environmental static complexity (ESC) is a static metric that can be calculated after the initialization of the simulation, used to characterize the inherent physical difficulty of the environment. Complex terrain can cause more obstructions and reflections of wireless signals, significantly increasing the challenge of network coverage. ESC is defined as the standard deviation of the terrain elevation data, calculated as follows:
E S C = 1 N i = 1 N ( h i h ¯ ) 2
where h i represents the elevation of the i-th grid point in the terrain; h ¯ denotes the average elevation of all grid points; N represents the total number of grid points in the terrain. A higher ESC value indicates more complex terrain. Under such complex terrain conditions, it is necessary to adjust the weight base value of the DE algorithm appropriately. The weight base value w d e , b a s e should be set higher to enhance its fine search and global exploration capabilities in complex terrains.
Environmental volatility index (EVI) is quantified to reflect user mobility, signal quality fluctuations, and terrain complexity. The EVI is calculated as:
E V I t = α · 1 N u i = 1 N u p i , t p i , t 1 + β · σ S N R
where p i , t represents the position of user i at time t; σ S N R is the standard deviation of the user’s SNR value; α ,   β are weighting coefficients, satisfying α + β = 1 . A higher EVI value indicates that the environment is rapidly changing, requiring algorithms capable of rapid response to sequential decision-making.
The final weights of each algorithm are determined by both static base weights and dynamically adjusted weights. The TD3 weight w t d 3 increases monotonically with the environmental volatility index E V I t , calculated as follows:
w t d 3 = w t d 3 , b a s e + ( 1 w t d 3 , b a s e ) · E V I t
where w t d 3 , b a s e is the base weight of TD3.
The DE weight is responsible for refined exploration when the environment is stable, and its weight decreases as E V I t increases. To ensure optimization effectiveness, a lower bound w min is set for its weight. The DE weight w d e is calculated as:
w d e = max { w min , w d e , b a s e · ( 1 E V I t ) }
Normalization of all weights is performed.
w t d 3 + w d e = 1

5.3.2. Multi-Time Scale Collaborative Optimization Method (MTS-COM)

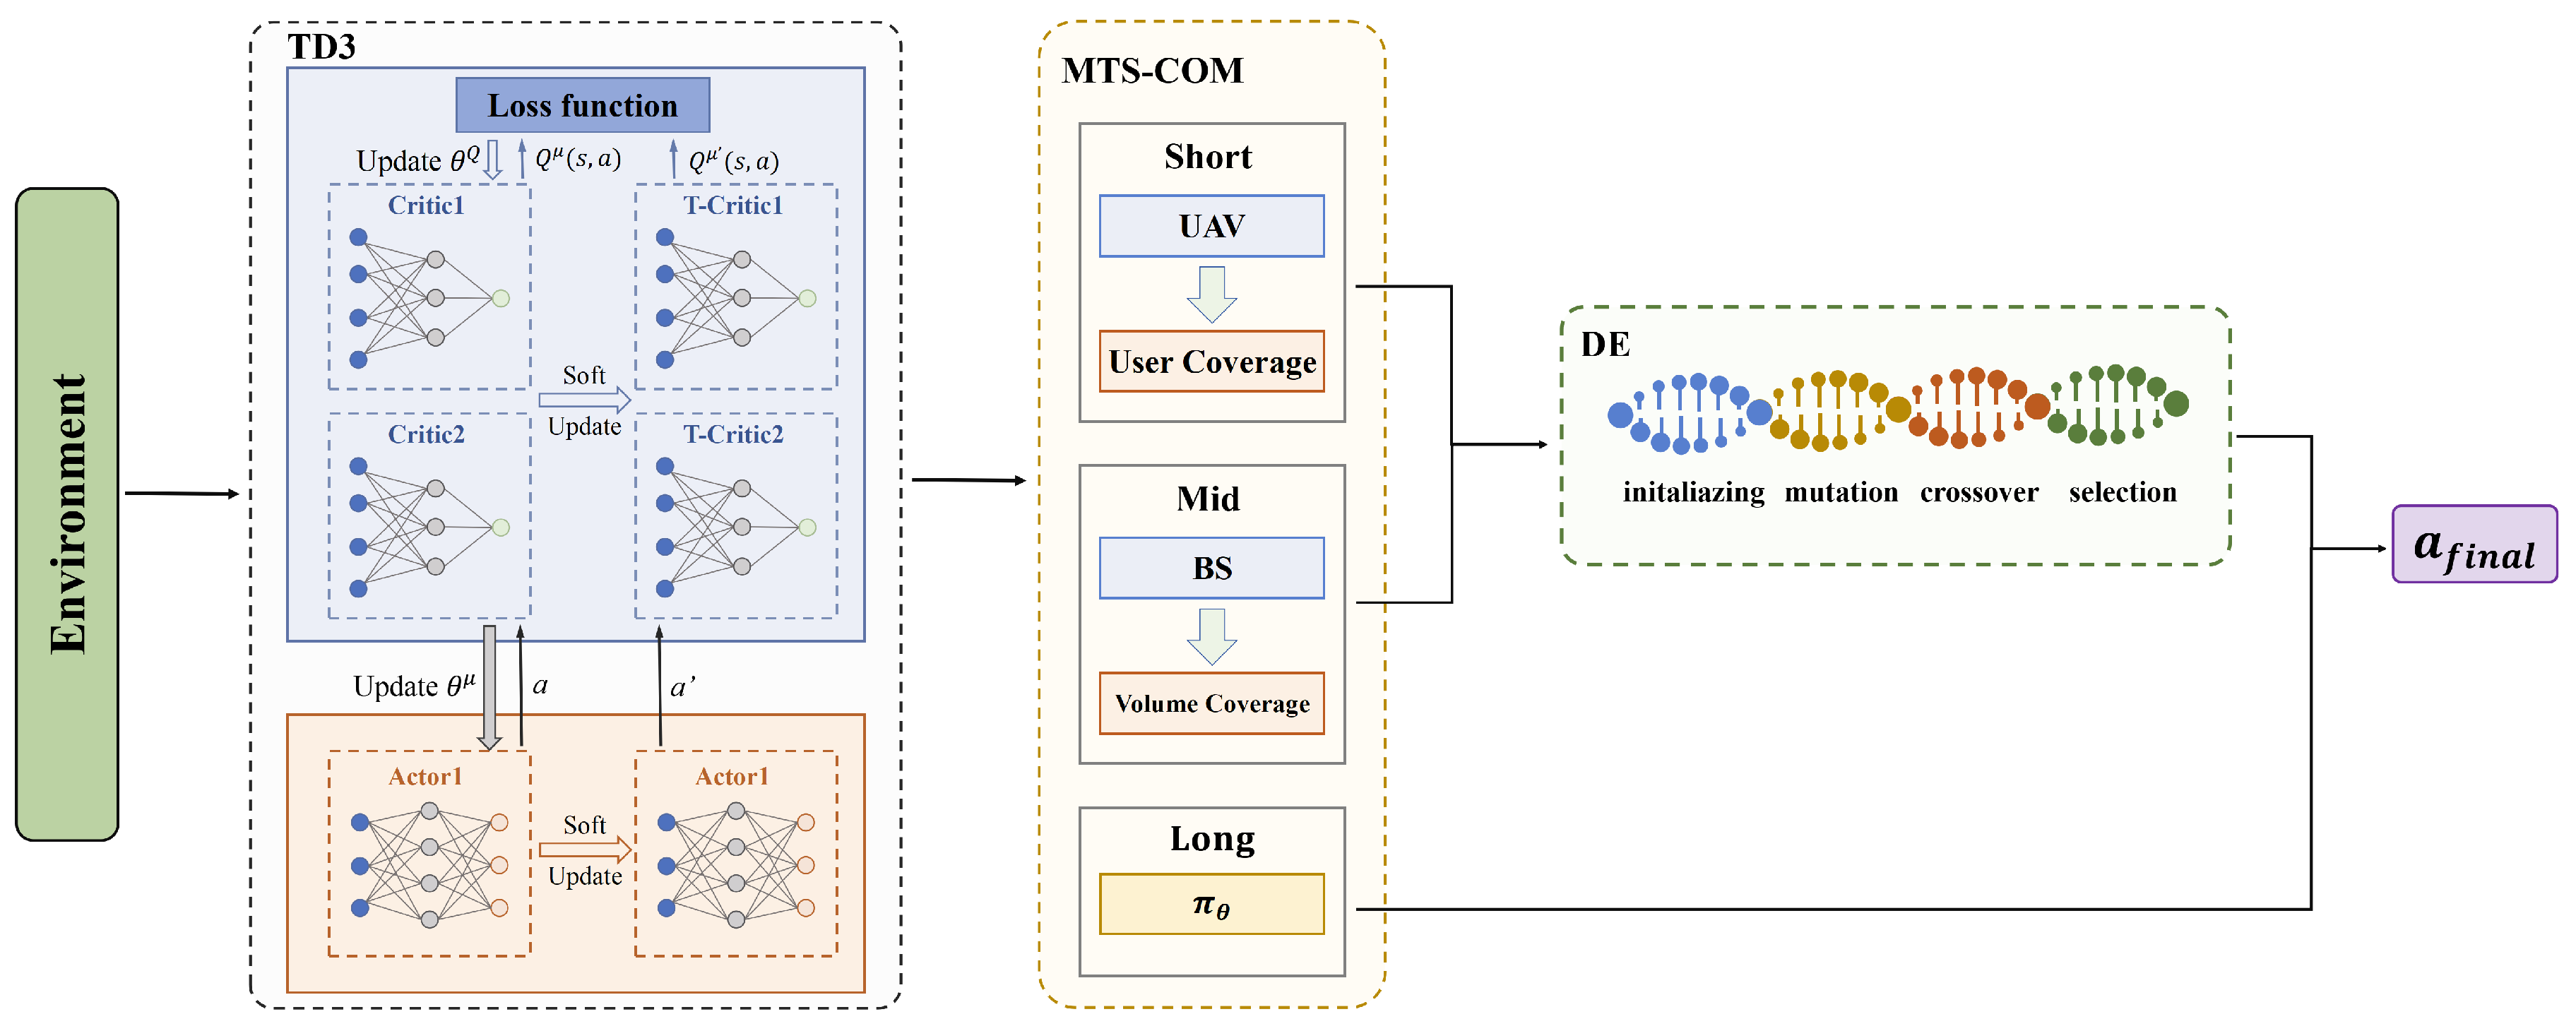
The architecture of MTS-COM is illustrated in the Figure 9, with its core being the allocation of distinct optimization tasks across short-term, medium-term, and long-term time scales, and achieving synchronization through collaborative interfaces.
The objective of short-term optimization is to rapidly respond to instantaneous coverage demand changes at the millisecond scale (e.g., SNR degradation due to user mobility), by conducting online fine-tuning of UAV positions using the DE algorithm. The short-term optimization objective function is defined as:
F s h o r t ( X u a v ) = u U u n c o v e r e d S N R r e q , u S N R c u r r e n t , u S N R r e q , u 2 + λ 1 · Δ X u a v 2
where X u a v is the position matrix of the UAV swarm; U u n c o v e r e d represents the set of currently uncovered users; S N R r e q , u denotes the SNR requirement threshold for user u; S N R c u r r e n t , u represents the current SNR value for user u; λ 1 is the weight coefficient for the trajectory smoothness penalty term.
Short-term optimization is executed at each time step, leveraging the efficient local search capability of DE to perform fine-tuning based on the initial actions output by TD3.
a s h o r t = D E o p t i m i z e ( F s h o r t , a T D 3 [ 0 : 3 N u a v ] )
where a T D 3 represents the base action output by TD3, F s h o r t is the short-term optimization objective function, and a s h o r t is the short-term optimized action obtained after DE optimization.
Medium-term optimization operates at the minute-level time scale. When it is detected that uncovered areas persist for a duration exceeding the threshold time T t h r e s , the DE algorithm is utilized to re-optimize the base station deployment plan from the candidate set. The medium-term optimization trigger condition is defined as:
T u n c o v e r e d >   T t h r e s | U u n c o v e r e d | | U | >   η t h r e s
where T u n c o v e r e d represents the duration for which uncovered areas persist; η t h r e s denotes the user uncoverage threshold.
The medium-term optimization objective function simultaneously considers coverage effectiveness and deployment cost:
F m i d ( X b s ) = u U S N R a c h i e v e d , u + λ 2 · N d e p l o y e d + λ 3 · D i v e r s i t y ( X b s )
where X b s represents the base station deployment positions; N deployed denotes the number of deployed base stations; D i v e r s i t y ( X b s ) indicates the diversity index of base station distribution; λ 2 , λ 3 are weight coefficients.
Long-term optimization is implemented through the TD3 algorithm, with its core being the learning of a global strategy π θ , which can coordinate optimization strategies across different time scales. The long-term reward function is designed as:
R l o n g = t = 0 T γ t R c o v e r α · C d e p l o y β · C m o v e m e n t
where R c o v e r represents the immediate coverage reward; C d e p l o y denotes the base station deployment cost; C m o v e m e n t indicates the UAV movement energy cost; α , β are discount coefficients, mapping short-term costs into long-term rewards.
The final action is determined by the outputs of the three time scales:
a f i n a l = a s h o r t + a m i d + π θ ( s t )
where the action fusion adopts a weighted summation approach, with weights calculated by the dynamic weight adaptation mechanism.
Below is the pseudocode of MTS-COM—Algorithm 3.
Algorithm 3 MTS-COM
Input: 
T, maximum time steps; π θ , TD3 policy.
Output: 
a f i n a l , Actor Networks, Critic Networks.
  1:
for  t = 1 , 2 , 3 , , T   do
  2:
        a T D 3 π θ ( s t )
  3:
        a D E Update actions using DE based on F s h o r t
  4:
       if Meet the triggering conditions then
  5:
              a D E Update actions using DE based on F m i d t
  6:
       end if
  7:
        a f i n a l = a s h o r t + a m i d + π θ ( s t )
  8:
       take action a f i n a l
  9:
        s t + 1 s t
10:
       if  t mod 10 = 0  then
11:
             Experience replay and learning
12:
       end if
13:
       Update the Actor and Critic Networks
14:
end for

5.3.3. Bidirectional Information Exchange Channel (BIEC)

As demonstrated by the reinforcement learning-driven heuristic optimization framework proposed by Cai et al. [55], in traditional hybrid algorithms, heuristic methods typically serve merely as auxiliary tools for passive optimization within reinforcement learning systems. This model has two main drawbacks:
(1)
The optimization experience of heuristic algorithms cannot effectively feedback to reinforcement learning strategies;
(2)
TD3 cannot learn valuable expert knowledge from the optimization process of heuristic algorithms.
To address these issues, this paper designs a Bidirectional Information Exchange Channel (BIEC), achieving bidirectional knowledge transfer and collaborative evolution between TD3 and DE.
Figure 10 illustrates the overall architecture of the bidirectional information exchange channel, including both forward and backward information flow directions. The forward information flow from TD3 to DE uses the initial action output by TD3 as the optimization starting point for the heuristic algorithm, providing a preliminary decision direction:
a i n i t = π θ ( s t ) a D E = D E o p t i m i z e ( a i n i t [ 3 N u a v : ] , F m i d )
This forward information transfer ensures that the heuristic algorithm’s search remains within a reasonable strategy space, avoiding meaningless global random searches and enhancing optimization efficiency.
The backward information flow from DE to TD3 is achieved through high-value experience prioritization feedback and expert demonstration guidance.
Traditional experience replay uses uniform sampling, ignoring the quality differences among various experiences. This paper designs a priority-based experience allocation mechanism based on optimization gain, making the high-value experiences after heuristic algorithm improvement more likely to be sampled, thereby accelerating TD3’s strategic learning.
p = ( r i + η · G o p t i m , i + ϵ ) α j ( r j + η · G o p t i m , j + ϵ ) α G o p t i m = F ( a f i n a l ) F ( a i n i t ) | F ( a i n i t ) | + ϵ
where r i is the original reward value; G o p t i m , i is the optimization gain brought by the heuristic algorithm; η is the optimization gain weight coefficient; α controls the distribution shape of the priority level.
The globally optimized solution obtained by the DE algorithm is considered as an expert demonstration with higher value, guiding the training process of the TD3 strategy network and thereby providing information feedback to TD3.
Expert demonstrations guide the learning direction of the strategy network through the loss function by directly indicating the current strategy output and the expert action difference. The loss function is calculated as follows:
L e x p e r t = λ 1 · E s D π θ ( s ) a e x p e r t 2
where a e x p e r t is the optimal action sampled from the expert demonstration buffer; λ 1 is the loss weight coefficient.
Utilizing the strategy distillation mechanism to migrate the “knowledge” of expert strategies to the TD3 strategy network, the expert strategy distribution is obtained through the estimation of the nuclear density of multiple expert actions under a given state, reflecting the probability distribution of expert decision-making under the given state:
L d i s t i l l = λ 2 · K L ( π θ ( s )   π e x p e r t ( s ) )
To avoid over-reliance on expert demonstrations leading to a lack of autonomy in the strategy network, an adaptive weight decay mechanism is adopted:
λ ( t ) = λ m a x · e t / T d e c a y
where λ m a x is the initial maximum weight, and T d e c a y is the decay time constant. In the early training phase, expert guidance plays a major role; as training progresses, the expert weight index decays, and TD3 gradually learns to make autonomous decisions; in the later training phase, the strategy network fully realizes autonomous exploration.
Below is the pseudocode of BIEC—Algorithm 4.
Algorithm 4 BIEC
Input: 
T, maximum training steps; e n v , environment instance; D, experience replay buffer; D e x p e r t , expert demonstration buffer
Output: 
π θ , Q ϕ
  1:
for  t = 1 , 2 , 3 , , T   do
  2:
        a T D 3 π θ ( S t )
  3:
        a D E Update actions using DE based on F s h o r t
  4:
       if Meet the triggering conditions then
  5:
              a D E Update actions using DE based on F m i d t
  6:
       end if
  7:
        a f i n a l = a s h o r t + a m i d + π θ ( S t )
  8:
       take action a f i n a l , observed r
  9:
        S t + 1 S t
10:
       Calculate G o p t i m according to Equation (37)
11:
       Calculate p according to Equation (37)
12:
       Add ( S t , a f i n a l , r , S t + 1 , p ) to D
13:
       if  G o p t i m > δ e x p e r t  then
14:
             Add ( S t , a f i n a l , G o p t i m ) to D e x p e r t
15:
       end if
16:
       if  t mod 10 = 0  then
17:
             Choose experience from D , D e x p e r t
18:
             Calculate L T D 3 , L e x p e r t , L d i s t i l l
19:
              L t o t a l L T D 3 + λ 1 L e x p e r t + λ 2 L d i s t i l l
20:
              θ θ θ L t o t a l , ϕ ϕ ϕ L t o t a l
21:
       end if
22:
end for

6. Simulation Experiments and Analysis

To further verify the feasibility and effectiveness of the AMB-TD3 algorithm in base station deployment, this section will validate the advantages of the AMB-TD3 algorithm in three-dimensional base station deployment issues based on randomly generated terrain and user locations by comparing it with other base station layout algorithms in recent years, as well as through ablation experiments.

6.1. Experimental Setup

All simulations were implemented in Python 3.8 and executed on a workstation equipped with an Intel® Core Ultra 7 155H CPU and an NVIDIA GeForce RTX 4060 Laptop GPU. The proposed AMB-TD3 algorithm was developed in PyCharm Community Edition 2024.2.4 using PyTorch 2.1.0.

6.2. Experimental Procedure

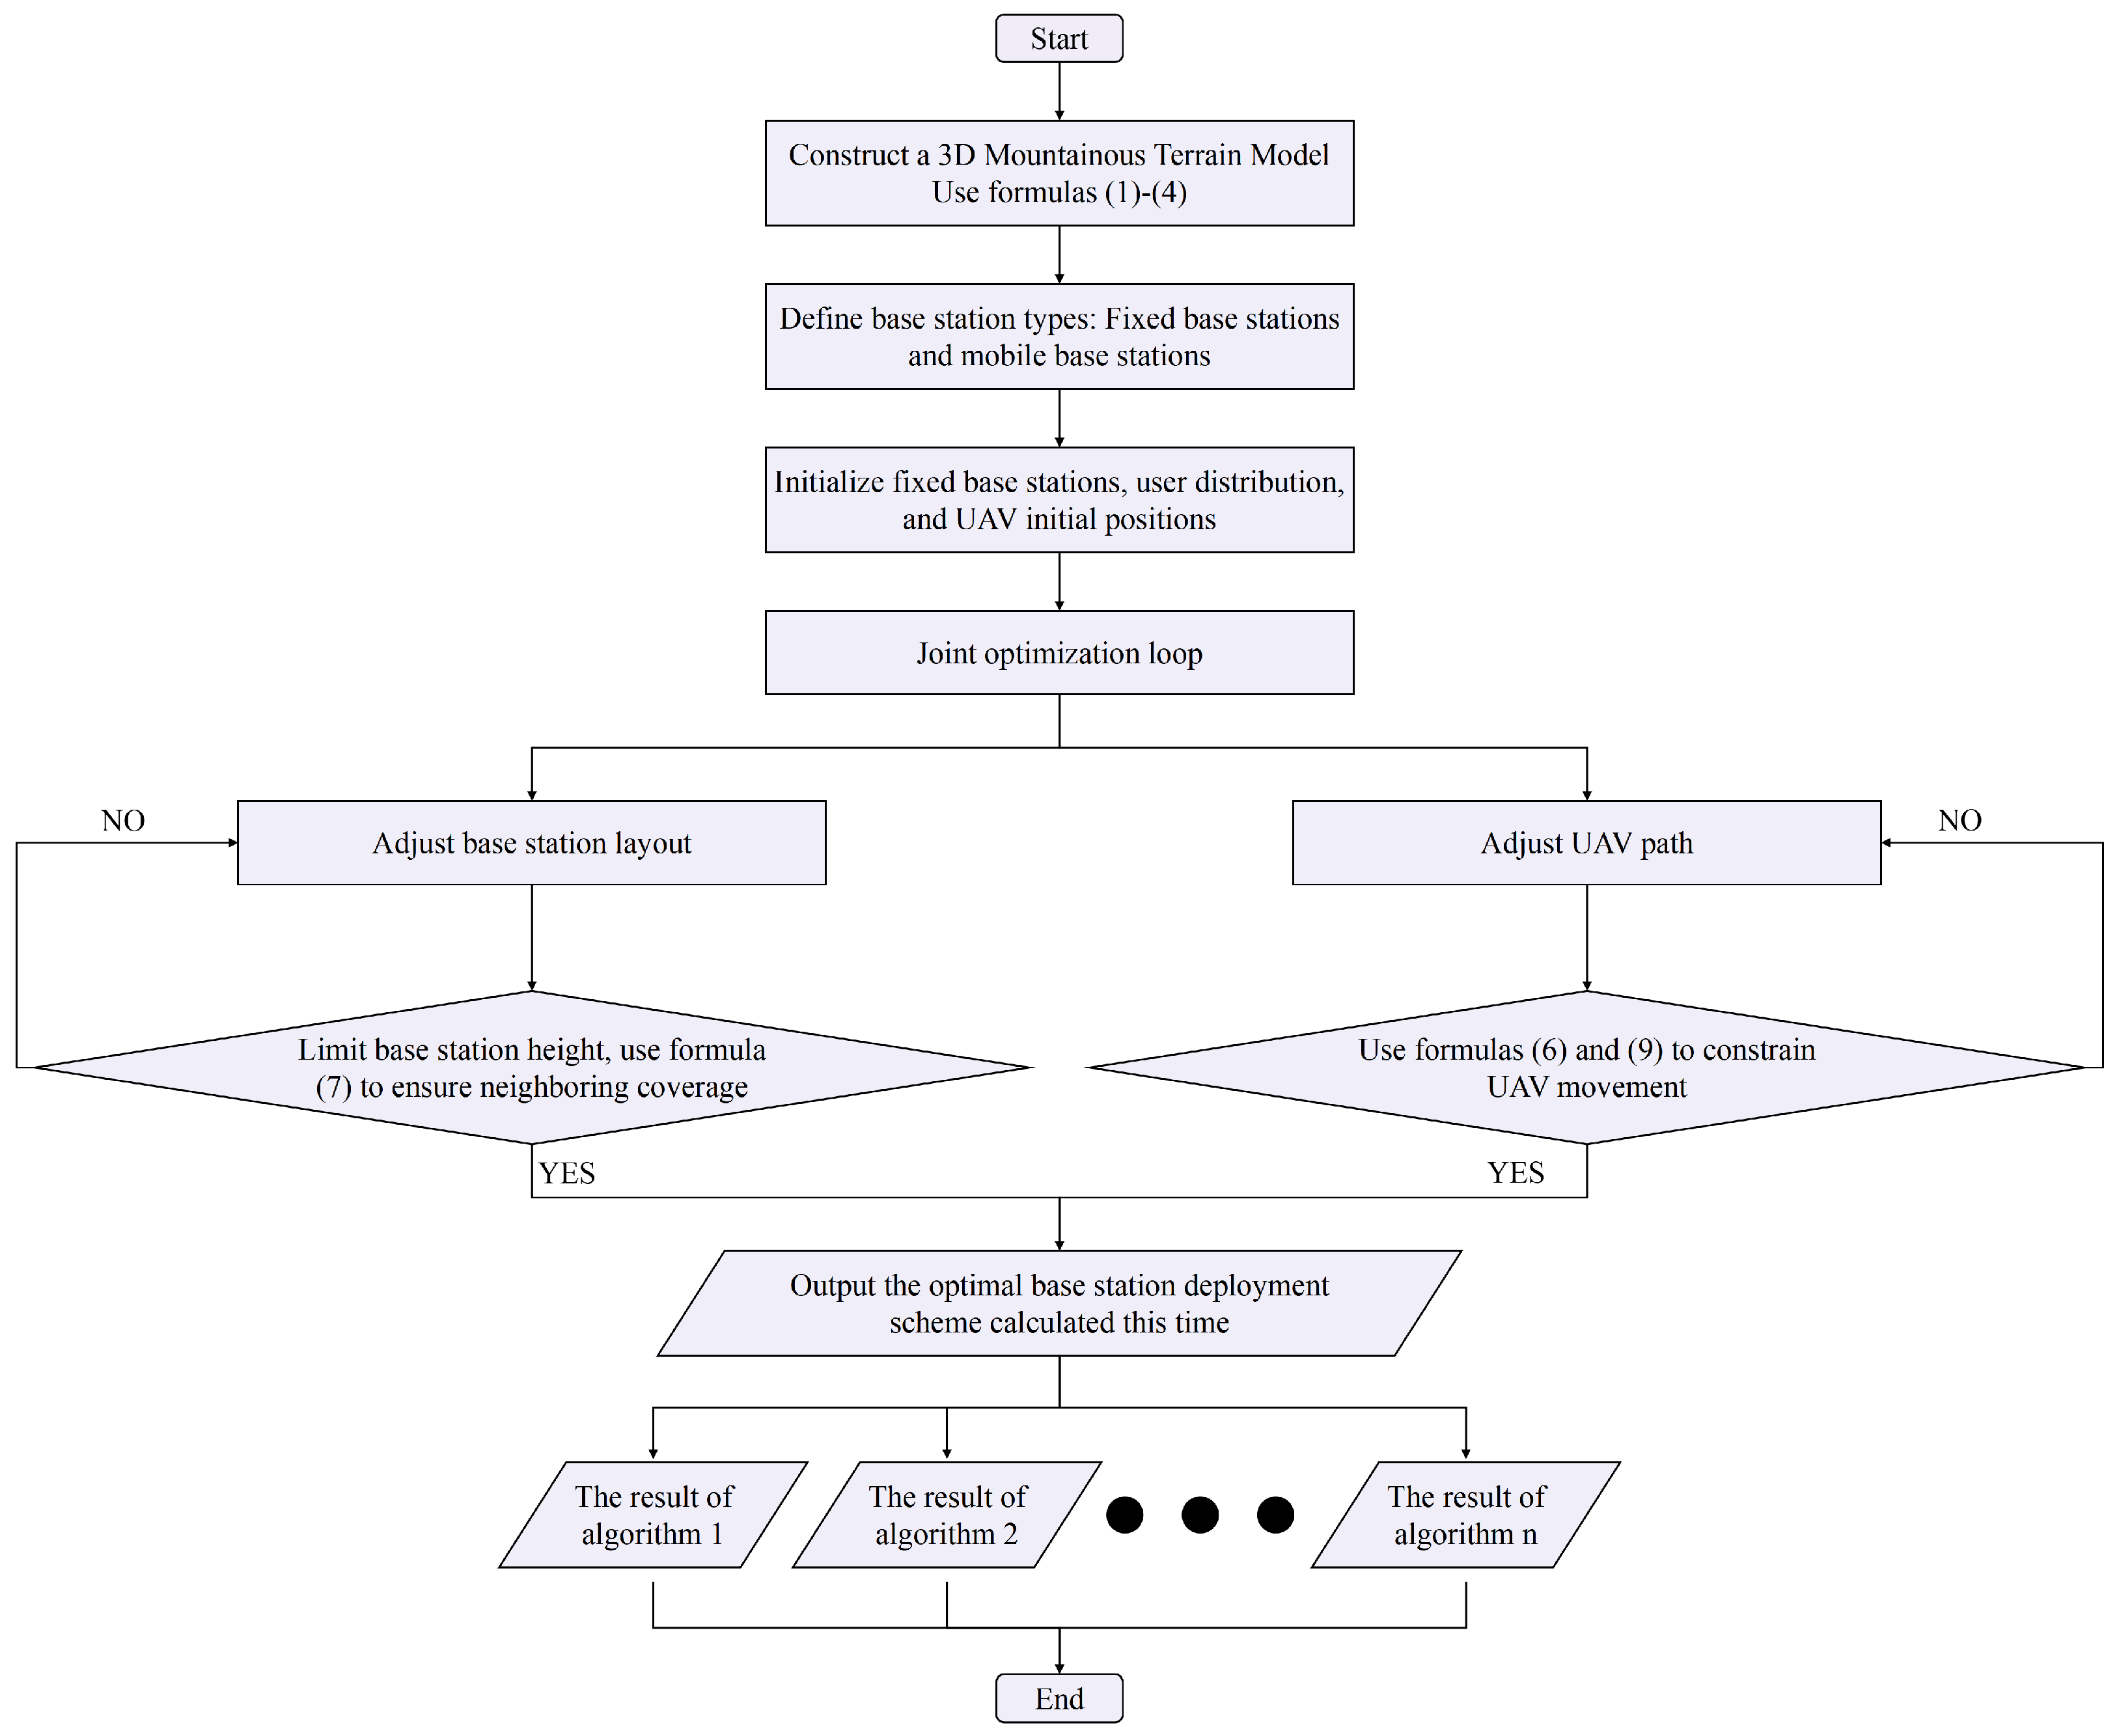
Firstly, a three-dimensional mountainous terrain model is constructed according to Equations (1)–(4), with a map size of 1000 × 1000 × 1000. Two types of base stations are defined: fixed base stations and mobile base stations. Then, the positions of the fixed base stations are initialized, and the deployment positions of the mobile base stations and the UAV flight trajectories are jointly optimized using the AMB-TD3 algorithm, in conjunction with the user distribution and terrain characteristics. Through multiple iterations, the base station layout and the UAV’s three-dimensional path are gradually adjusted to maximize signal coverage and minimize energy consumption. Comparative algorithms such as Q-learning and DQN are also applied to obtain deployment and path planning results under different methods. During the optimization process, Equation (5) is used to limit the height of the base stations to avoid terrain obstruction, Equation (7) ensures the continuity of the coverage areas of adjacent base stations, Equation (13) is used to calculate the received power of user u, and the volume coverage rate is calculated using Equation (21) based on the signal detection range (a space from the ground to a height H meters above the ground). Meanwhile, the UAV’s motion constraints are applied using Equations (8) and (9), planning its dynamic flight trajectory in each iteration to ensure that the total energy consumption is reduced while meeting communication requirements. All algorithms run for 200 rounds, with parameter settings as shown in Table 1. The specific procedure is illustrated in Figure 11.

6.3. Experimental Results

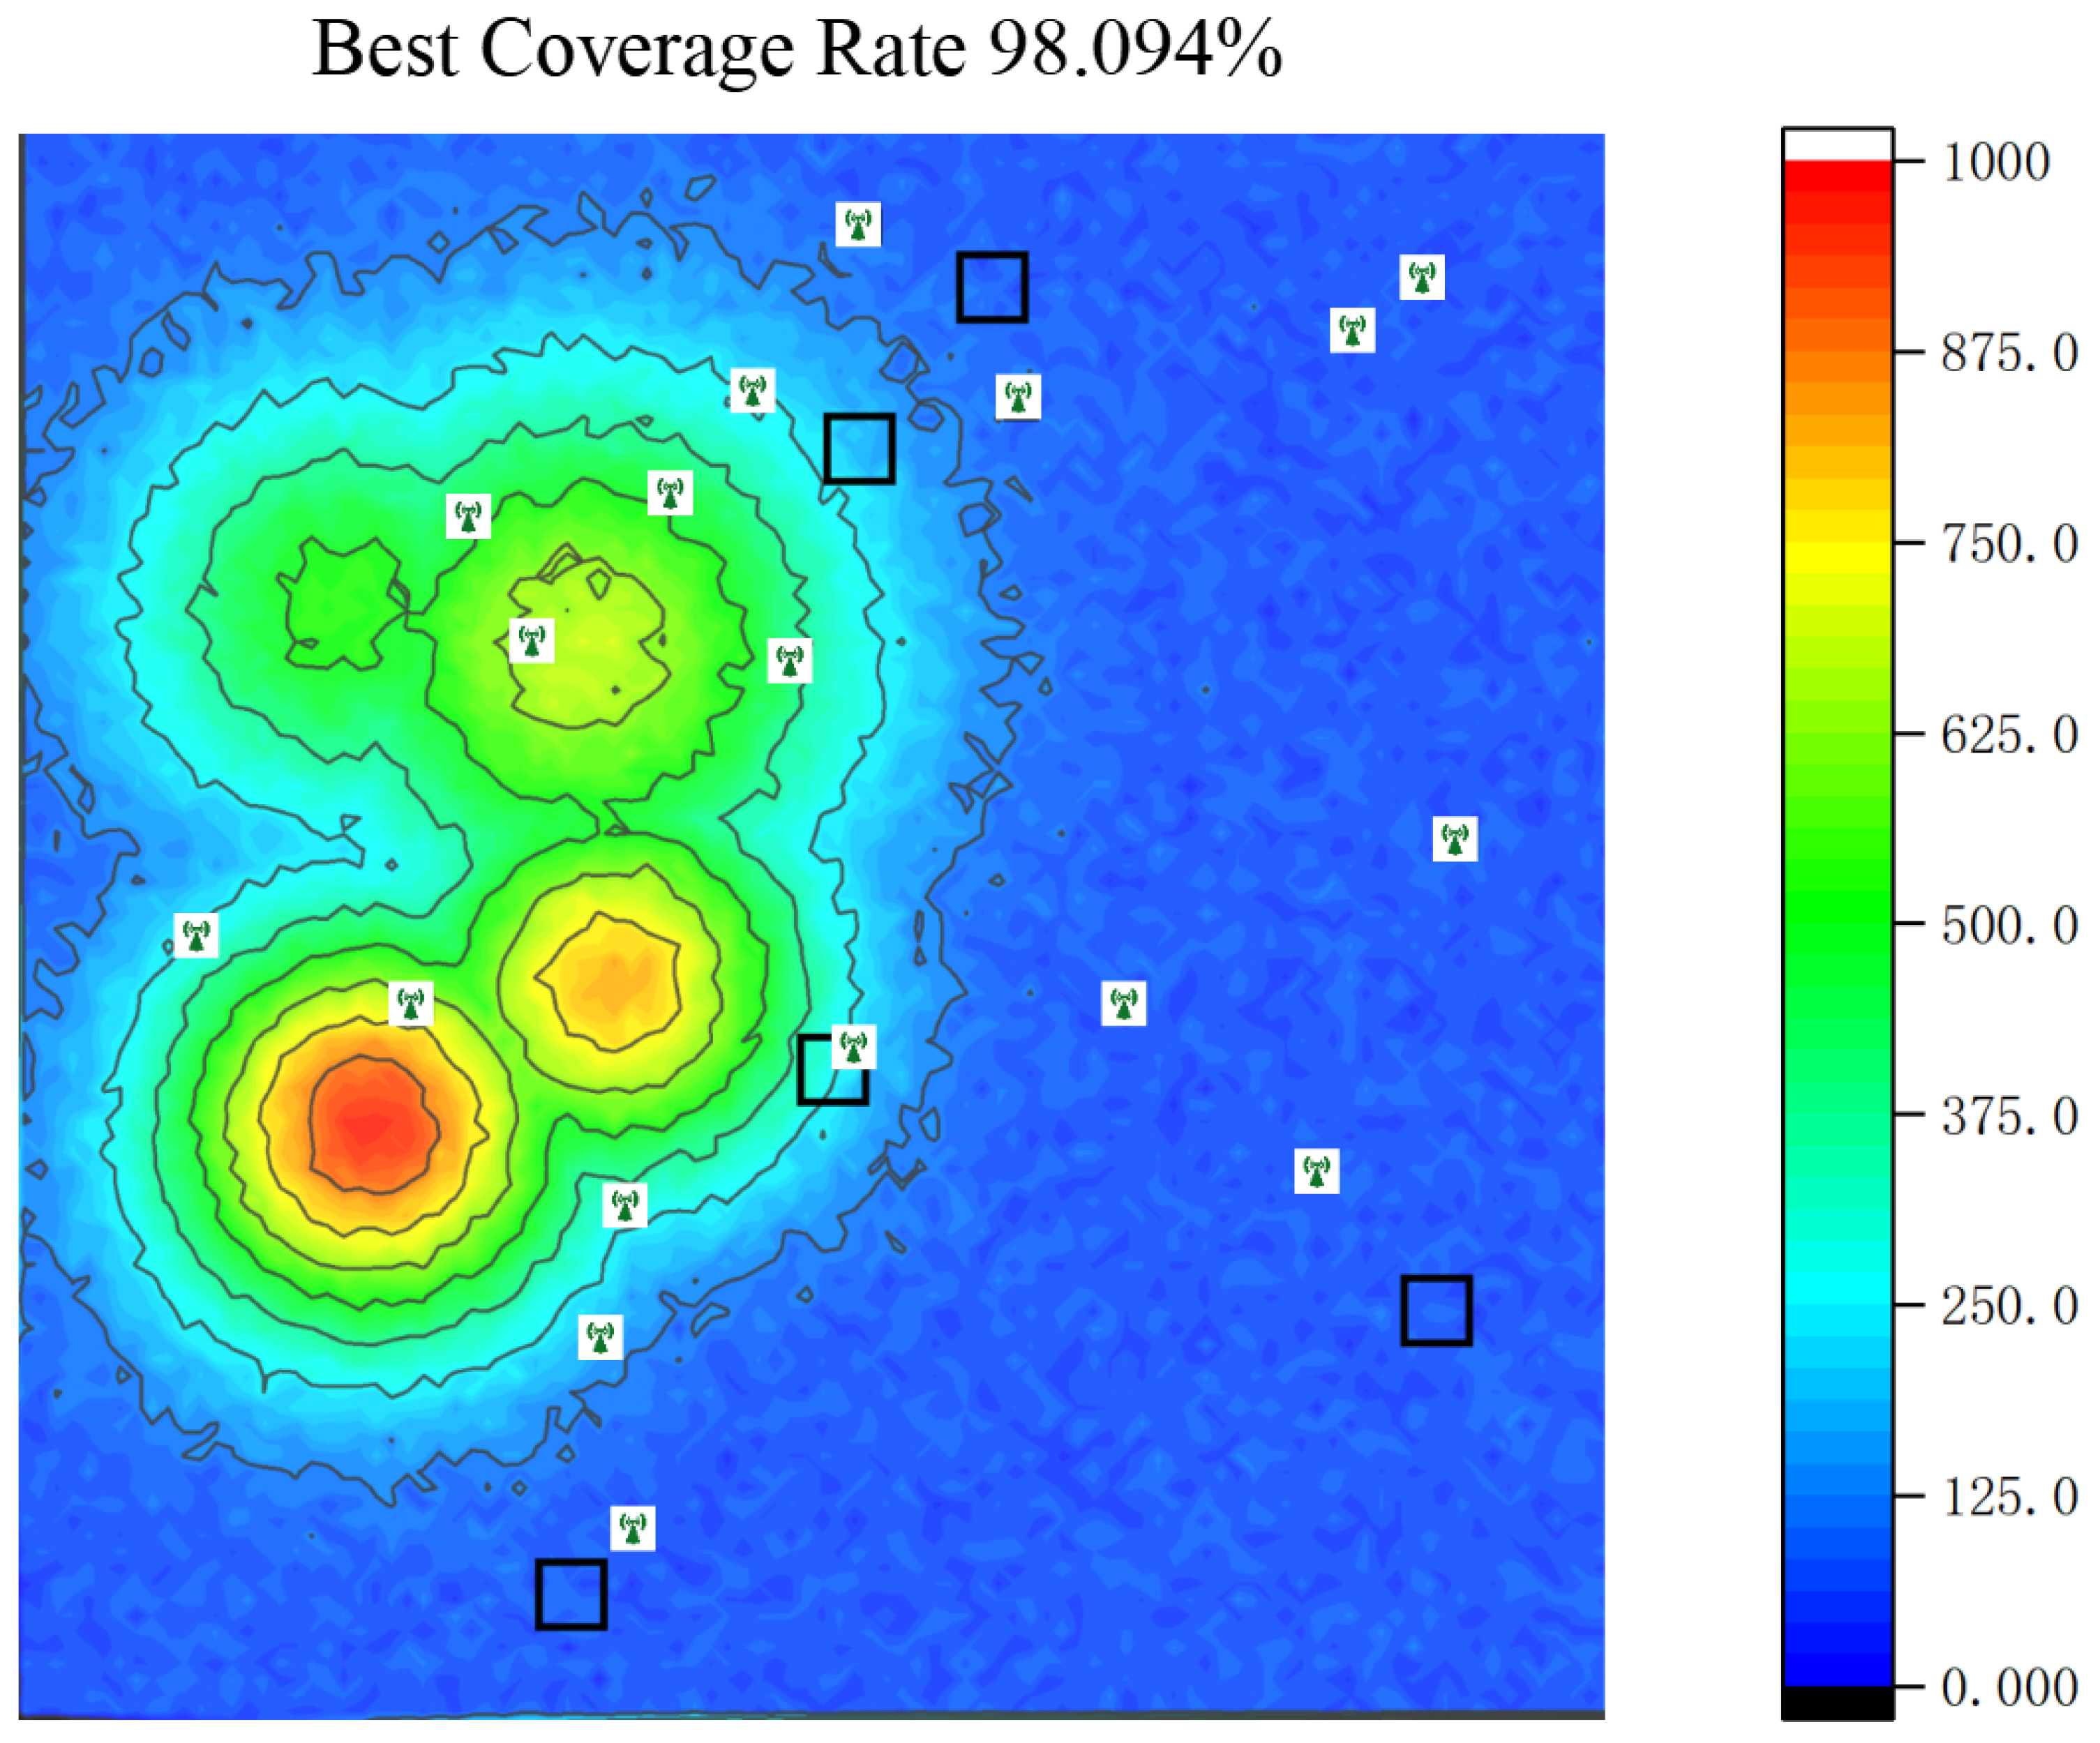
The AMB-TD3 algorithm was executed independently 20 times to analyze and visualize the optimal values of the algorithm, thereby verifying the feasibility of the AMB-TD3 results. The best coverage rate obtained from these 20 runs was 98.094%, with the base station deployment positions shown in Table 2 and Figure 12. The UAV trajectory is illustrated in Figure 13.
As shown in Figure 12, where the black rectangles denote the users’ activity area, the optimized base-station deployment achieves comprehensive coverage through strategically positioned stations at topographical high points, effectively overcoming signal-blockage challenges in complex terrain.
Figure 13 reveals that the three-dimensional flight trajectories fully demonstrate the algorithm’s ability to balance energy consumption and coverage requirements. Figure 13a shows an effective spatial division of labor among the three UAVs: each vehicle is responsible for a distinct sub-region, thus avoiding redundant coverage and unnecessary energy expenditure. Specifically, Figure 13b illustrates that UAV-1 follows a periodic cruising pattern between two primary user clusters, bridging coverage across different areas. In contrast, Figure 13c indicates that UAV-2 performs more frequent hovering and fine-grained position adjustments, suggesting its role in providing targeted reinforcement to a coverage-weak zone. Figure 13d demonstrates that UAV-3 covers the largest area and undertakes extensive patrol duties. All trajectories are smooth and continuous, satisfying the UAVs’ dynamic constraints, which confirms that the path-planning module significantly reduces flight energy consumption while simultaneously meeting coverage demands.

6.4. Comparative Experiments

We have meticulously selected a comprehensive suite of reinforcement learning algorithms for comparative analysis to rigorously evaluate the performance and innovation of the proposed AMB-TD3 framework from multiple dimensions. The selected baselines encompass foundational RL methods (e.g., Q-learning [52]) and established deep RL approaches (e.g., Deep Q-Network, DQN [56]), which serve as essential benchmarks to quantify fundamental performance gains. The comparison is further extended to advanced policy optimization techniques such as Phasic Policy Gradient (PPG) [57], enabling a critical assessment of the efficacy of our integrated actor–critic architecture coupled with evolutionary fine-tuning. Moreover, we include several state-of-the-art algorithms specifically tailored for base station deployment optimization: DRL-based Energy-efficient Control for Coverage and Connectivity (DRL-EC3) [58] is incorporated as a direct competitor addressing the critical trade-off between coverage and energy efficiency; Simulated Annealing with Q-learning (SA-Q) [59] and Double DQN with State Splitting Q Network (DDQN-SSQN) [60] are employed to juxtapose our hybrid framework against alternative algorithmic fusion paradigms and advanced network architectures; Decentralized Reinforcement Learning with Adaptive Exploration and Value-based Action Selection (DecRL-AE & VAS) [53] provides a contrasting perspective on multi-agent coordination strategies. Finally, the hybrid learning-evolutionary framework DERL [61] is included to contextualize AMB-TD3 within the landscape of contemporary approaches that synergistically combine reinforcement learning with evolutionary algorithms. The specific parameter configurations for all algorithms are detailed in Table 3.
To ensure the fairness of the evaluation and clearly demonstrate the advantages and limitations of AMB-TD3 compared to other methods, we adopted the following standardized evaluation protocol:
All algorithms were tested under identical environmental settings, including consistent terrain models, user distributions, and signal propagation characteristics. For all reinforcement learning methods, we maintained exactly the same state space (Equation (18)) and action space (Equation (19)) as AMB-TD3, ensuring that all methods operate within the same decision-making structure and environmental constraints, thereby eliminating performance variations due to interface inconsistencies.
All algorithms employed the unified reward function (Equation (24)), with coverage efficiency, energy consumption, and deployment costs serving as common optimization objectives. This ensures direct comparability of results across different methods.
To avoid bias against algorithms with different convergence characteristics that might result from using identical iteration counts, we implemented a fixed computational budget strategy: all algorithms were allocated equal training episodes (200 episodes). This ensures that regardless of each algorithm’s inherent complexity or convergence speed, optimization occurs under equal resource conditions, guaranteeing evaluation fairness.
Each algorithm was iterated for 200 rounds, and each was independently executed 20 times. The optimal values (Best), worst values (Worst), and standard deviations (Std) were calculated for each algorithm. If the AMB-TD3 algorithm achieved the best values, these will be highlighted in bold. To further verify the transparency and significance of the data differences, a Wilcoxon signed-rank test for 20 sets of data was conducted with a one-tailed significance level set at 0.05. If the p-value is less than 0.05, it indicates a significant difference between the two algorithms; otherwise, the difference is not significant. The direction marker is attached to the p-value; if it is (-), it represents that the performance of the AMB-TD3 algorithm is significantly better than the other algorithms. The specific optimization deployment results are shown in Table 4.
From Table 4 and Figure 14, it is evident that AMB-TD3 demonstrates superior performance in base station layout optimization. In terms of coverage rate, the best coverage rate of the AMB-TD3 algorithm significantly exceeds that of other algorithms, being the only one to surpass 98%, with a worst coverage rate of 92.379%, second only to the DRL-EC3 algorithm. Although the PPG and DecRL-AE&VAS algorithms also achieve a best coverage rate of over 95%, their worst coverage rates are only around 85%, indicating greater variability. Regarding stability, AMB-TD3 has a smaller standard deviation, consistently yielding excellent solutions across different scenarios. The DQN also has a minimal standard deviation of only 1.706%, but its best and worst coverage rates are comparatively lower.
Observing the convergence from Figure 15, the red squares representing our algorithm are distinctly higher than those of other algorithms. Moreover, the convergence rate is faster, achieving complete convergence to the optimal solution within 50 iterations. Other algorithms, such as DecRL-AE&VAS and DDQN-SSQN, although converging more rapidly than AMB-TD3, do not achieve final convergence results as superior as those of AMB-TD3.
Figure 16 compares the performance of different algorithms in terms of energy consumption. It is evident from the boxplot that the position of the box for AMB-TD3 is significantly lower than that of the other algorithms, indicating that the AMB-TD3 algorithm provides a more rational path planning for the UAVs, resulting in lower energy consumption. Although the minimum energy consumption point of Q-learning is lower than that of the AMB-TD3 algorithm, the box for Q-learning is longer, signifying greater instability, and its mean value is notably higher than that of the AMB-TD3 algorithm. Other algorithms, such as PPG and DDQN-SSQN, exhibit relatively stable energy consumption.
In terms of best coverage rate, stability of coverage, UAV energy consumption, and stability of energy consumption, the AMB-TD3 algorithm proposed in this paper has demonstrated excellent performance, confirming its significant advantages in base station layout optimization and showcasing its potential and practical value in such application scenarios. The best solutions for each algorithm have been visualized, as shown in Figure 17.
Experimental results demonstrate that the proposed AMB-TD3 algorithm exhibits significant superiority in the joint optimization problem of base station deployment and UAV path planning in mountainous areas.
From the perspective of fundamental reinforcement learning methods, the performance of Q-learning and DQN is constrained by their inherent architectures. Both algorithms rely on discrete action spaces, which hinders fine-grained continuous control of UAV trajectories and high-precision deployment of base station positions in complex three-dimensional environments. As shown in Table 4, the best coverage rates achieved by Q-learning and DQN are 92.704% and 95.833%, respectively, both significantly lower than AMB-TD3’s 98.094%. Furthermore, Q-learning exhibits a high standard deviation of 5.208%, indicating considerable performance instability, which is visualized in the box plot of Figure 14 as an exceptionally long box with numerous outliers. Although DQN shows improved stability, its post-convergence coverage rate, as depicted in Figure 15, remains substantially inferior.
The PPG algorithm operates within a continuous policy space, thereby avoiding errors associated with discretization. However, its performance is limited by its single-timescale optimization strategy and the lack of effective integration with heuristic search algorithms. This makes it difficult to adapt to the dynamically changing coverage demands in mountainous terrain. The significant gap between its best coverage rate (96.527%) and worst coverage rate (86.834%), as recorded in Table 4, confirms its vulnerability to environmental fluctuations.
The decentralized framework employed by DecRL-AE&VAS offers good scalability. However, since each agent makes decisions based solely on local information without a global perspective, the agent behavior becomes myopic, leading to poor system-level coordination. This coordination failure is visually apparent in the base station distribution map shown in Figure 17g, where the layout fails to form an effective cooperative coverage network, exhibiting obvious coverage gaps and resource overlap. This ultimately limits its performance ceiling, with a best coverage rate of 96.685%.
The DDQN-SSQN algorithm introduces a more sophisticated value estimation mechanism through double Q-learning and state splitting. Nevertheless, it remains fundamentally a value-based method, and its performance upper bound is constrained by the fundamental challenge of discretizing the continuous action space in complex control tasks. Although its best coverage rate (96.896%) is comparable to PPG and DecRL-AE&VAS, its worst coverage rate (85.693%) is among the lowest of all compared algorithms, indicating insufficient stability.
Methods like SA-Q and DRL-EC3 demonstrate the potential of combining reinforcement learning with heuristic search or energy-aware components. However, their hybrid architectures are essentially unidirectional. For instance, the simulated annealing in SA-Q acts merely as a passive optimizer for the reinforcement learning agent’s output, forming an open-loop system. This lack of bidirectional feedback prevents the reinforcement learning policy from learning and adapting based on the expert knowledge of the heuristic algorithm, thereby limiting further performance gains. While DRL-EC3 emphasizes energy efficiency, its coverage performance (best 96.338%) still lags behind AMB-TD3.

6.5. Ablation Experiments

To thoroughly investigate the individual roles and necessity of the three core innovative modules in the AMB-TD3 algorithm—namely, the Dynamic Weight Adaptation Mechanism (DWAM), the Multi-Timescale Collaborative Optimization Method (MTS-COM), and the Bidirectional Information Exchange Channel (BIEC)—we designed systematic ablation studies. These three modules do not exist in isolation but rather form a synergistic and integrated optimization framework: DWAM is responsible for dynamic strategy selection at the algorithmic level, MTS-COM decouples complex optimization tasks across the temporal dimension, and BIEC achieves deep integration of the two optimization paradigms at the knowledge level. Together, they address the core challenges faced by traditional hybrid algorithms in dynamic and complex environments, such as rigid decision-making, singular optimization focus, and knowledge isolation.
To precisely quantify the contribution of each module, we constructed three variant algorithms by sequentially removing these key components for comparative analysis. Specifically, (1) The TD3-1 algorithm removes the Multi-Timescale Collaborative Optimization Method (MTS-COM). This means the algorithm loses its capability for hierarchical optimization across short-, medium-, and long-term timescales, reverting to a single-timescale optimization framework. This variant is used to validate the critical role of MTS-COM in coordinating immediate responses with long-term planning. (2) The TD3-2 algorithm removes the Bidirectional Information Exchange Channel (BIEC), severing the bidirectional knowledge transfer between TD3 and the Differential Evolution (DE) algorithm. This prevents the optimization experience of DE from feeding back into the policy learning process of TD3, regressing to a traditional unidirectional hybrid architecture. This variant aims to assess the value of BIEC in facilitating co-evolution between algorithms. (3) The TD3-3 algorithm removes the Dynamic Weight Adaptation Mechanism (DWAM), fixing the decision weights of TD3 and DE, thereby rendering the algorithm incapable of adapting the dominant strategy based on environmental dynamics. This variant is used to examine the necessity of DWAM in enhancing the environmental self-adaptability of the algorithm.
By comparing these variants against the complete AMB-TD3 algorithm under identical experimental conditions, we can clearly isolate the specific impact of each innovative module on the final performance, thereby confirming their indispensability in the overall algorithm design.
Each of these algorithms was independently executed 20 times, and the specific optimization results are presented in Table 5.
The data from Table 5 indicates that AMB-TD3 consistently achieves the highest best and worst coverage rates, followed by TD3-2, which lacks the expert buffer, and TD3-3, which lacks the adaptive weight mechanism. The algorithm with the least effective performance is TD3-1, which has removed the multi-timescale mechanism. This suggests that all three innovative aspects contribute to performance enhancements over the original TD3, with the multi-timescale optimization mechanism providing the most significant improvement. However, when analyzing the runtime, the execution duration of AMB-TD3 and TD3-2 and TD3-3 is significantly longer than that of TD3-1, indicating that the multi-timescale optimization mechanism is more time-consuming and represents the core optimization mechanism.
We plot the box plot of the best coverage rate over 20 rounds, as well as the convergence graph, as shown in Figure 18 and Figure 19. From Figure 18, it can be observed that AMB-TD3 consistently achieves the highest coverage rate, and the relatively short box indicates that AMB-TD3 is more stable, yielding excellent solutions each time. The algorithm without the adaptive weight mechanism, TD3-3, has a longer box and significantly lower best and worst coverage rates compared to TD3-1 and TD3-2, demonstrating the importance of the adaptive weight optimization mechanism for enhancing the stability of the original TD3 algorithm. The convergence graph from Figure 19 of the ablation study also shows that the AMB-TD3 algorithm, represented by the gray line, converges earlier compared to other algorithms, around 50 iterations, followed by TD3-1 and TD3-2, around 80 iterations, and TD3-3 converges the slowest, around 125 iterations. Moreover, the final average best coverage rate converges to the highest for AMB-TD3, followed by TD3-1, TD3-2, and finally TD3-3, indicating that the adaptive weight mechanism can greatly improve the convergence speed and effectiveness of the original TD3 algorithm, better matching dynamic environments. Overall, the AMB-TD3 algorithm exhibits excellent performance in enhancing capabilities, confirming the effectiveness of combining these two optimization strategies.

6.6. Computational Complexity and Scalability Analysis

Algorithmic computational complexity is a key metric for evaluating the applicability of algorithms in large-scale mountain communication scenarios. This section analyzes the time complexity of the AMB-TD3 algorithm. The time complexity of AMB-TD3 is composed of its foundational components TD3 and DE along with the innovative mechanisms: Dynamic Weight Adaptive Mechanism, Multi-Time Scale Collaborative Optimization Method, and Bidirectional Information Exchange Channel.
The computational core of TD3 involves parameter updates for the actor policy network and the twin critic value networks. The actor network, with an input dimension of D s t a t e and an output dimension of D a c t i o n , has a time complexity for forward propagation and backward gradient calculation of O ( D s t a t e × D a c t i o n + D a c t i o n ) . Each of the twin critic networks contains L c r i t i c hidden layers; the forward and backward computation complexity for a single network is O ( L c r i t i c × ( D s t a t e × N n e u r o n + N n e u r o n 2 + N n e u r o n ) ) , resulting in a total overhead of 2 × O ( L c r i t i c × ( D s t a t e × N n e u r o n + N n e u r o n 2 + N n e u r o n ) ) for both networks. Combined with the experience replay mechanism, where B experience samples are drawn per round, the time complexity of TD3 per iteration can be expressed as:
O TD 3 = B × D s t a t e × D a c t i o n + 2 L c r i t i c × ( D s t a t e × N n e u r o n + N n e u r o n 2 ) .
The computation of DE focuses on mutation, crossover, and selection operations, all related to the population size N p o p and the decision variable dimension D a c t i o n . The mutation operation requires traversing all individuals in the population to generate mutation vectors, with a complexity of O ( N p o p × D a c t i o n ) . The crossover operation involves stochastic crossover decisions for each of the D a c t i o n decision variables per individual, with a complexity of O ( N p o p × D a c t i o n ) . The selection operation requires calculating the fitness of each individual, which relies on user SNR evaluation and coverage range calculation, with a complexity of O ( N u s e r ) , leading to a total overhead of O ( N p o p × N u s e r ) . The time complexity of DE per iteration is thus:
O DE = O ( N p o p × ( 2 D a c t i o n + N u s e r ) ) .
The Dynamic Weight Adaptive Mechanism requires calculating the Environmental Static Complexity (ESC) and the Environmental Volatility Index (EVI). ESC is based on the elevation standard deviation of N g r i d terrain grid points, with a computational complexity of O ( N g r i d ) . EVI is based on the position changes and SNR standard deviation of N u s e r users, with a complexity of O ( N u s e r ) . Since the computational magnitudes of N g r i d and N u s e r are significantly lower than the iterative overhead of the foundational components, the additional overhead of this mechanism can be approximated as O ( 1 ) , having no significant impact on the overall complexity.
In the Multi-Time Scale Coupling mechanism, short-term optimization invokes DE for fine-tuning UAV positions. Medium-term optimization is only triggered when coverage blind spots persist beyond a threshold T t h r e s (where T t h r e s 1 , e.g., set to T t h r e s = 10 in experiments). Long-term optimization relies on the global strategy of TD3. The average per-round overhead of medium-term optimization can be expressed as O DE / T t h r e s . Given that T t h r e s is large, this cost can be integrated into the average per-round overhead of DE.
The Bidirectional Information Exchange Channel facilitates knowledge transfer between TD3 and DE via an expert buffer. Its core overhead involves priority calculation for high-value experiences (based on the optimization gain G o p t i m of B experiences), with a complexity of O ( B ) , which is on the same order of magnitude as the batch size B in TD3’s experience replay and can thus be incorporated into the OTD3 calculation.
In summary, the total time complexity of AMB-TD3 over T i t e r iterations can be expressed as:
O AMB - T D 3 = T i t e r × O T D 3 + O DE × 1 + 1 T t h r e s .
Substituting the specific expressions for O T D 3 and O DE , and considering T t h r e s 1 (so 1 T t h r e s 0 ), this can be further simplified to:
O AMB - T D 3 T i t e r × B × D s t a t e × D a c t i o n + 2 L c r i t i c × ( D s t a t e × N n e u r o n + N n e u r o n 2 ) + N p o p × ( 2 D a c t i o n + N u s e r )
Due to the integration of DE’s global search capability, AMB-TD3 has a slightly higher complexity than the standalone TD3 algorithm. However, it is significantly lower than traditional heuristic algorithms, such as the Genetic Algorithm, which has a complexity of O ( T i t e r × N p o p 2 × D a c t i o n ) . The actual runtime cost of AMB-TD3 is balanced by its performance improvements, validating its applicability in complex mountain environments.
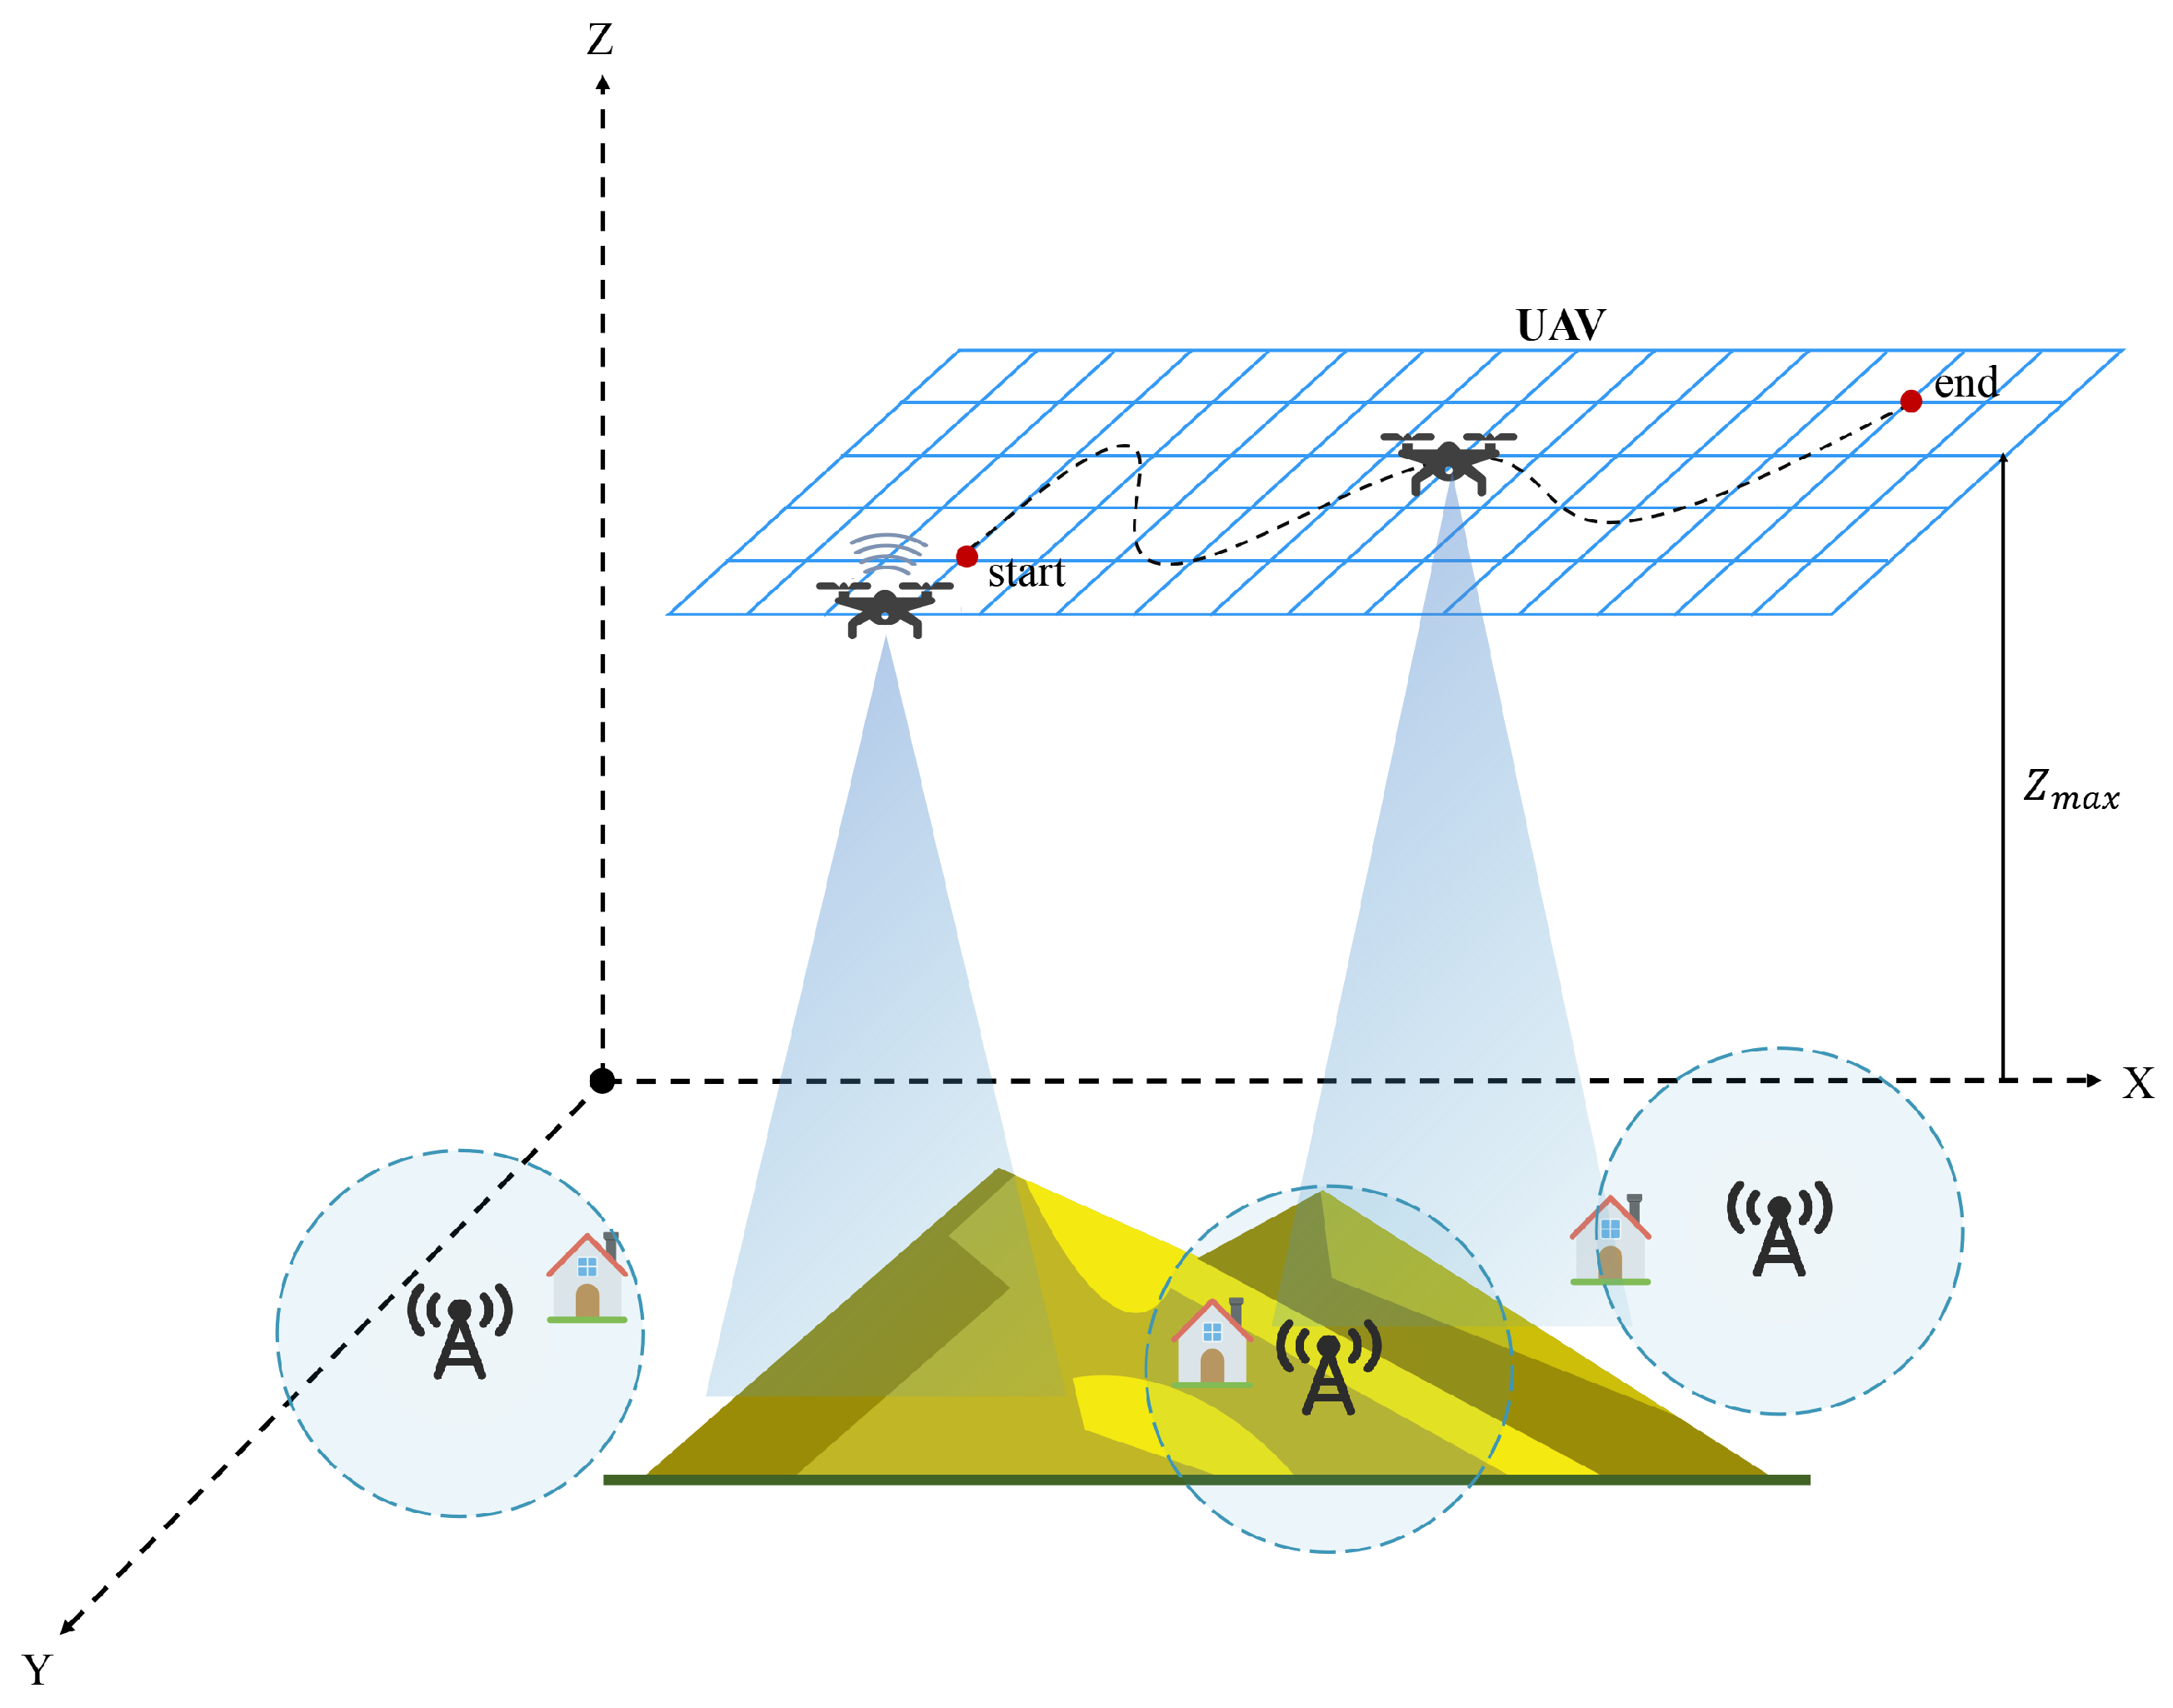
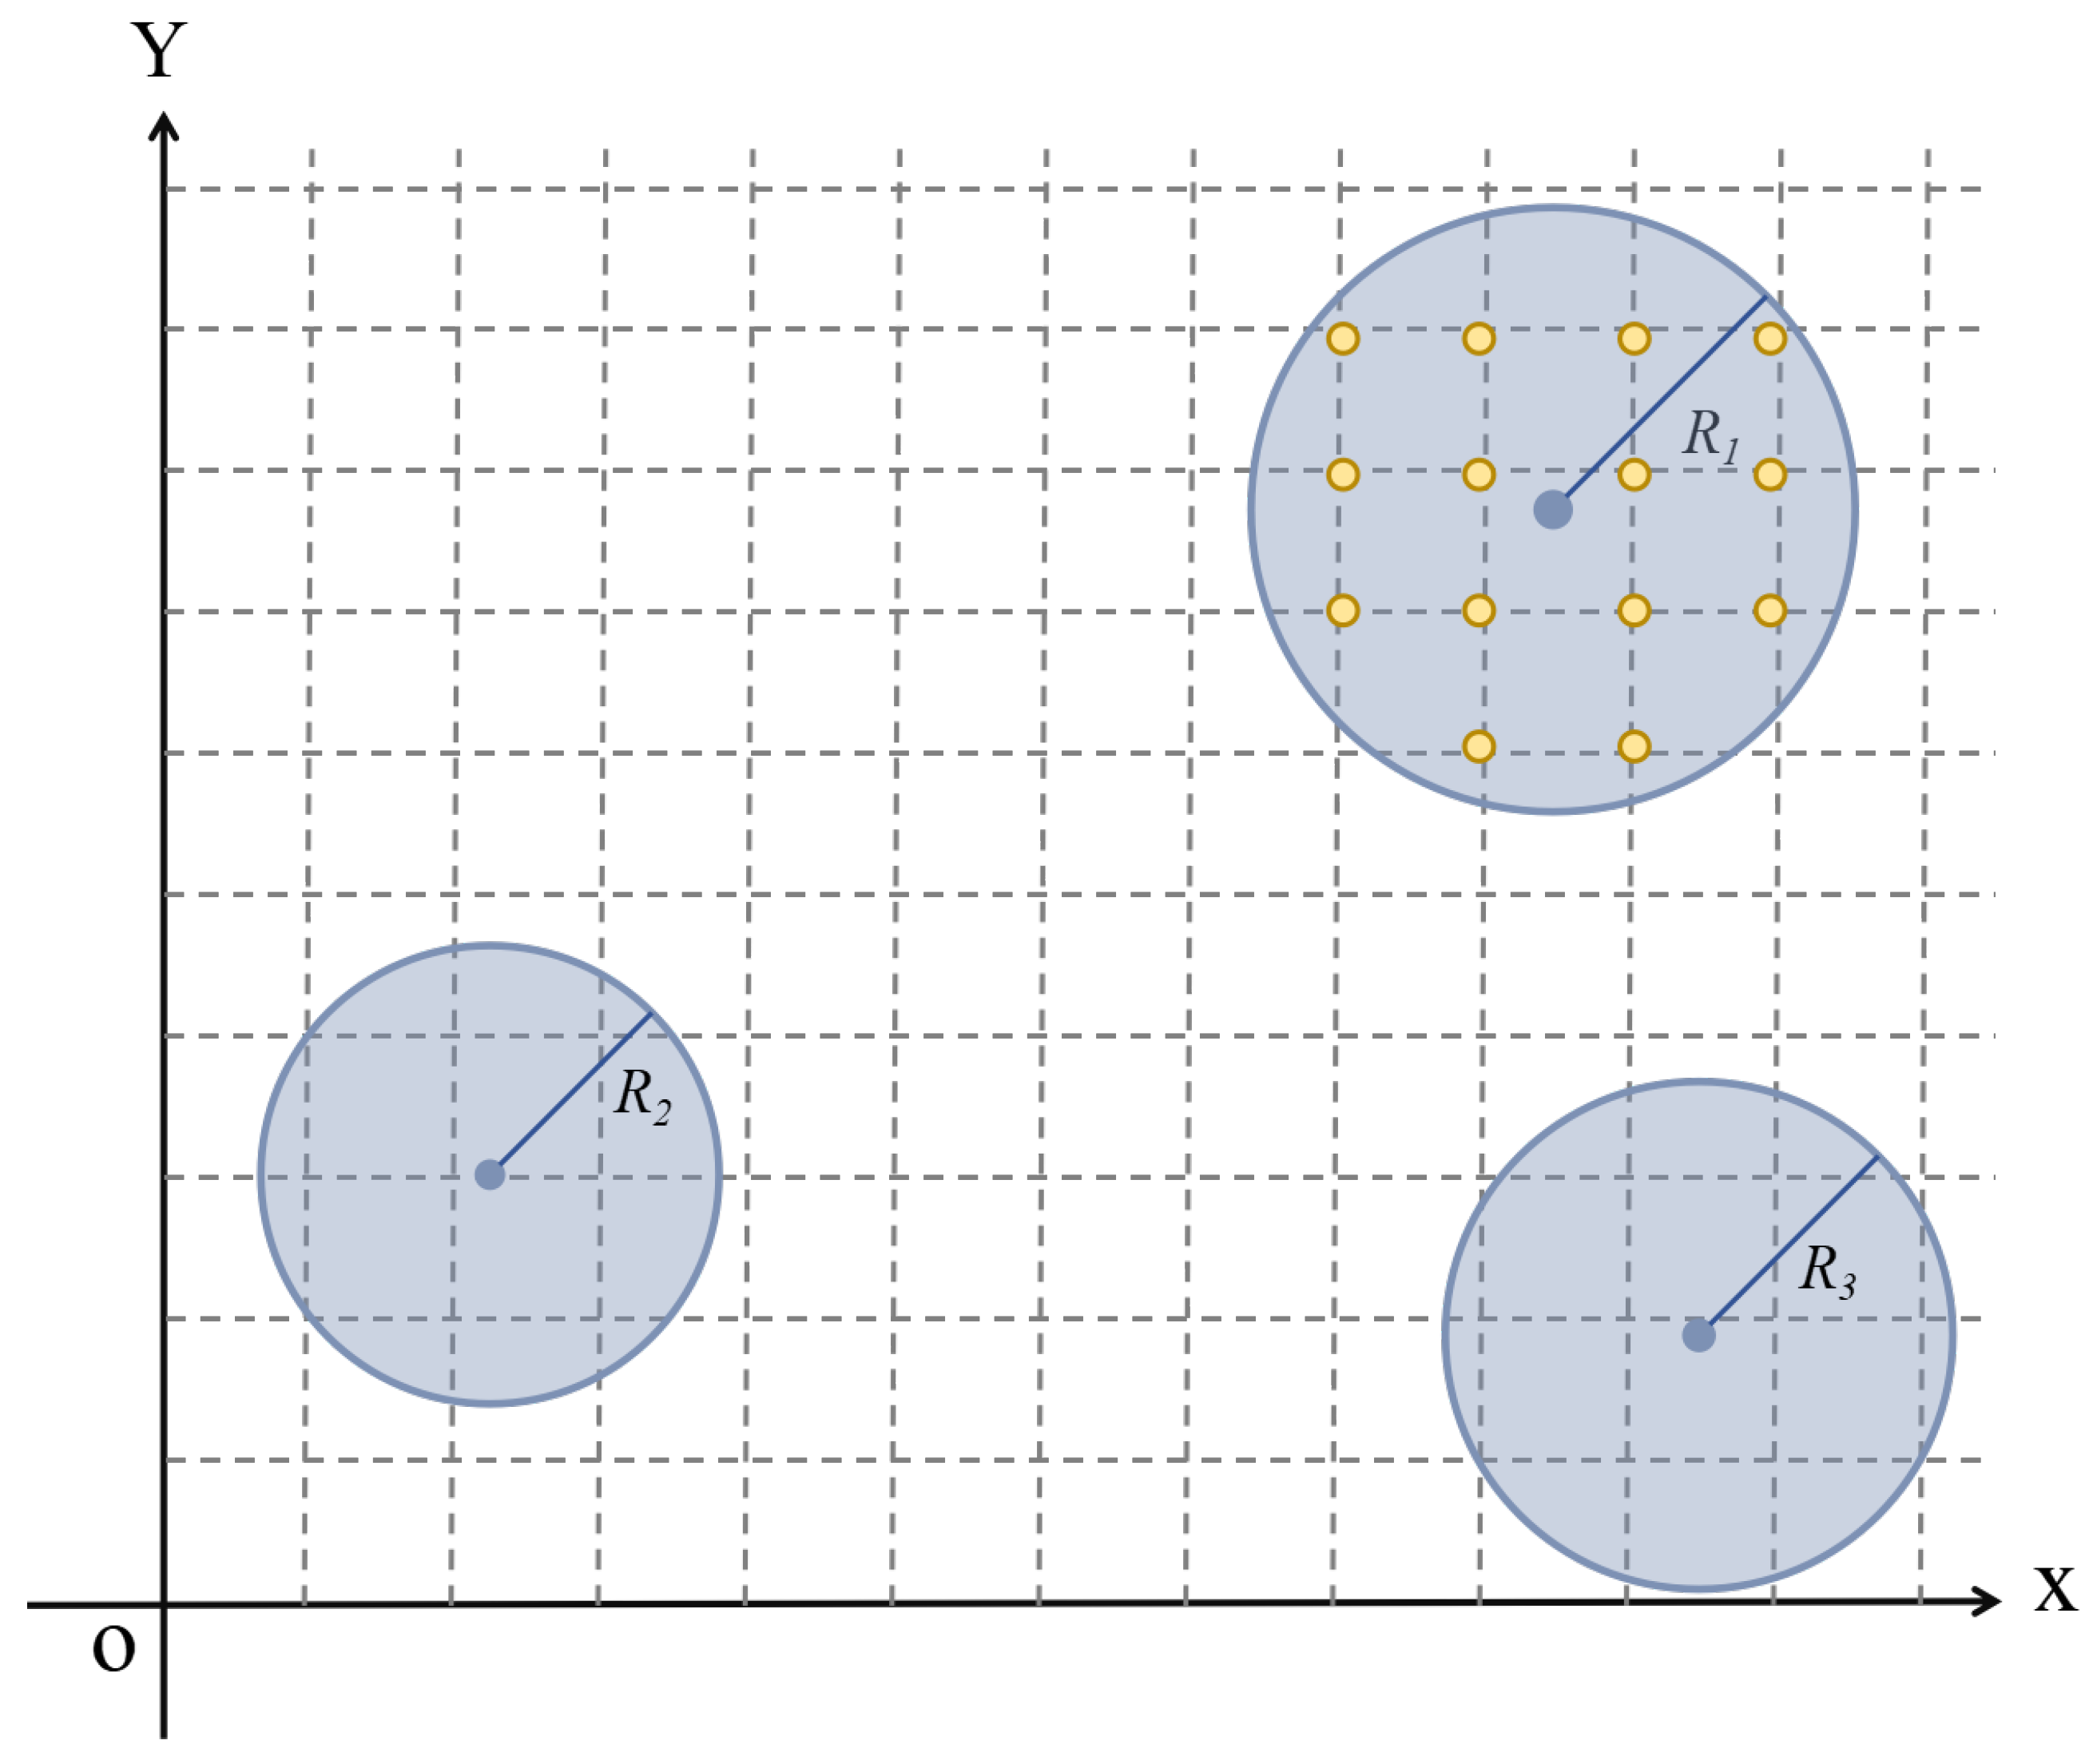
7. Conclusions and Future Work

This paper proposes an Adaptive Multi-scale Bidirectional TD3 (AMB-TD3) algorithm, which ingeniously combines the efficient decision-making capabilities of deep reinforcement learning TD3 with the collective search advantages of Differential Evolution (DE) through a dynamic weight adaptation mechanism, multi-timescale coupling strategy, and bidirectional information exchange channels. This innovative design significantly enhances the collaborative operational capabilities between UAVs and base stations. In comparative experiments, AMB-TD3 demonstrates remarkable advantages in both signal coverage rate and UAV energy consumption, validating its practical value.
Although the AMB-TD3 algorithm has achieved satisfactory performance in simulation experiments, it still faces several challenges and limitations in practical applications. First, the integration of TD3 and Differential Evolution, coupled with the introduction of complex mechanisms such as the Dynamic Weight Adaptation Mechanism (DWAM) and the Multi-Timescale Collaborative Optimization Method (MTS-COM), results in high computational complexity. This may hinder its ability to meet the demands of real-time decision-making in large-scale network scenarios. Second, the current model does not fully account for real-world environmental factors, such as wind and air currents, which can disturb the UAV’s flight attitude, trajectory stability, and signal propagation, thereby limiting the algorithm’s deployment robustness. Furthermore, discrepancies exist between the simulation environment and the real world; for instance, sensor measurement errors and communication link delays are not modeled, which could adversely impact the algorithm’s practical performance. While existing studies such as Klaine et al. [52] and Zhang et al. [53] often optimize specific aspects like dynamic environment adaptability or algorithmic architecture fusion, our work, despite significant improvements through multi-scale and bidirectional mechanisms, still has room for enhancement in real-time performance, adaptability to dynamic environments, and hardware deployment feasibility. To address these limitations, future work will focus on (1) introducing model compression or distributed computing frameworks to reduce the computational burden; (2) incorporating real-time meteorological data and high-precision channel estimation to enhance the model’s environmental awareness; and (3) conducting field experiments to validate and optimize the algorithm’s robustness and effectiveness in real-world physical environments.

Author Contributions

Conceptualization, L.W. and J.T.; methodology, L.W. and J.T.; software, L.W. and J.T.; validation, H.G., S.E., and C.Z.; investigation, H.G., L.W., and J.T.; resources, S.E. and C.Z.; data curation, L.W. and J.T.; writing—original draft preparation, L.W. and J.T.; writing—review and editing, H.G., S.E., and C.Z.; visualization, L.W. and J.T.; supervision, C.Z.; project administration, S.E.; funding acquisition, S.E. and C.Z. All authors have read and agreed to the published version of the manuscript.

Funding

This research has been funded by the National Natural Science Foundation of China (Nos. 62272418, 62102058), Zhejiang Provincial Natural Science Foundation Major Project (No. LD24F020004), the Major Open Project of Key Laboratory for Advanced Design and Intelligent Computing of the Ministry of Education (No. ADIC2023ZD001), and National Undergraduate Training Program on Innovation and Entrepreneurship (No. 202510345042).

Data Availability Statement

The datasets generated during and analysed during the current study are available from the corresponding author on reasonable request.

Conflicts of Interest

The authors declare no conflicts of interest.

References

  1. Liu, H.; An, J.; Jia, X.; Gan, L.; Karagiannidis, G.K.; Clerckx, B.; Cui, T.J. Stacked Intelligent Metasurfaces for Wireless Communications: Applications and Challenges. IEEE Wirel. Commun. 2025, 32, 46–53. [Google Scholar] [CrossRef]
  2. Zhao, W.; Weng, T.; Ruan, Y.; Liu, Z.; Wu, X.; Zheng, X.; Kato, N. Quantum Computing in Wireless Communications and Networking: A Tutorial-Cum-Survey. IEEE Commun. Surv. Tutor. 2025, 27, 2378–2419. [Google Scholar] [CrossRef]
  3. Liu, Y.F.; Chang, T.H.; Hong, M.; Wu, Z.; So, A.M.C.; Jorswieck, E.A.; Yu, W. A Survey of Recent Advances in Optimization Methods for Wireless Communications. IEEE J. Sel. Areas Commun. 2024, 42, 2992–3031. [Google Scholar] [CrossRef]
  4. Akbar, M.S.; Hussain, Z.; Ikram, M.; Sheng, Q.Z.; Mukhopadhyay, S.C. On Challenges of Sixth-Generation (6G) Wireless Networks: A Comprehensive Survey of Requirements, Applications, and Security Issues. J. Netw. Comput. Appl. 2025, 233, 104040. [Google Scholar] [CrossRef]
  5. Pandi, S.; Albert, A.J.; Thapa, K.N.K.; Krishnaprasanna, R. A Novel Enhanced Security Architecture for Sixth Generation (6G) Cellular Networks Using Authentication and Acknowledgement (AA) Approach. Results Eng. 2024, 21, 101669. [Google Scholar]
  6. Matinmikko-Blue, M.; Yrjölä, S.; Ahokangas, P. Multi-Perspective Approach for Developing Sustainable 6G Mobile Communications. Telecommun. Policy 2024, 48, 102640. [Google Scholar] [CrossRef]
  7. Zawish, M.; Dharejo, F.A.; Khowaja, S.A.; Raza, S.; Davy, S.; Dev, K.; Bellavista, P. AI and 6G Into the Metaverse: Fundamentals, Challenges and Future Research Trends. IEEE Open J. Commun. Soc. 2024, 5, 730–778. [Google Scholar] [CrossRef]
  8. Chataut, R.; Nankya, M.; Akl, R. 6G Networks and the AI Revolution—Exploring Technologies, Applications, and Emerging Challenges. Sensors 2024, 24, 1888. [Google Scholar] [CrossRef]
  9. Alhammadi, A.; Shayea, I.; El-Saleh, A.A.; Azmi, M.H.; Ismail, Z.H.; Kouhalvandi, L.; Saad, S.A. Artificial Intelligence in 6G Wireless Networks: Opportunities, Applications, and Challenges. Int. J. Intell. Syst. 2024, 2024, 8845070. [Google Scholar] [CrossRef]
  10. Liu, F.; Cui, Y.; Masouros, C.; Xu, J.; Han, T.X.; Eldar, Y.C. Integrated Sensing and Communications: Toward Dual-Functional Wireless Networks for 6G and Beyond. IEEE J. Sel. Areas Commun. 2022, 40, 1728–1767. [Google Scholar] [CrossRef]
  11. Jiang, W.; Zhou, Q.; He, J.; Habibi, M.A.; Melnyk, S.; El-Absi, M.; Han, B.; Renzo, M.D.; Schotten, H.D.; Luo, F.; et al. Terahertz Communications and Sensing for 6G and Beyond: A Comprehensive Review. IEEE Commun. Surv. Tutor. 2024, 26, 2326–2381. [Google Scholar] [CrossRef]
  12. Arena, F.; Collotta, M.; Pau, G.; Termine, F. An Overview of Augmented Reality. Computers 2022, 11, 28. [Google Scholar] [CrossRef]
  13. Paulsen, L.; Dau, S.; Davidsen, J. Designing for Collaborative Learning in Immersive Virtual Reality: A Systematic Literature Review. Virtual Real. 2024, 28, 63. [Google Scholar] [CrossRef]
  14. Gong, T.; Gavriilidis, P.; Ji, R.; Huang, C.; Alexandropoulos, G.C.; Wei, L. Holographic MIMO Communications: Theoretical Foundations, Enabling Technologies, and Future Directions. IEEE Commun. Surv. Tutor. 2023, 26, 196–257. [Google Scholar] [CrossRef]
  15. Singh, S.P.; Kumar, N.; Kumar, G.; Balusamy, B.; Bashir, A.; Al-Otaibi, Y.D. A Hybrid Multi-Objective Optimization for 6G-Enabled Internet of Things (IoT). IEEE Trans. Consum. Electron. 2025, 71, 1307–1318. [Google Scholar] [CrossRef]
  16. Tera, S.P.; Chinthaginjala, R.; Pau, G.; Kim, T.H. Towards 6G: An Overview of the Next Generation of Intelligent Network Connectivity. IEEE Access 2025, 13, 925–961. [Google Scholar] [CrossRef]
  17. He, P.; Lei, H.; Wu, D.; Wang, R.; Cui, Y.; Zhu, Y. Nonterrestrial Network Technologies: Applications and Future Prospects. IEEE Internet Things J. 2025, 12, 6275–6299. [Google Scholar] [CrossRef]
  18. Femenias, G.; Riera-Palou, F. From Cells to Freedom: 6G’s Evolutionary Shift with Cell-Free Massive MIMO. IEEE Trans. Mob. Comput. 2024, 24, 812–829. [Google Scholar] [CrossRef]
  19. McEnroe, P.; Wang, S.; Liyanage, M. A Survey On the Convergence of Edge Computing and AI for UAVs: Opportunities and Challenges. IEEE Internet Things J. 2022, 9, 15435–15459. [Google Scholar] [CrossRef]
  20. Li, J.; Kacimi, R.; Liu, T.; Wang, S.; Ma, X.; Dhaou, R. Non-Terrestrial Networks-Enabled Internet of Things: UAV-Centric Architectures, Applications, and Open Issues. Drones 2022, 6, 95. [Google Scholar] [CrossRef]
  21. Yuan, B.; He, R.; Ai, B.; Chen, R.; Zhang, H.; Liu, B. Service Time Optimization for UAV Aerial Base Station Deployment. IEEE Internet Things J. 2024, 11, 38000–38011. [Google Scholar] [CrossRef]
  22. Romero, D.; Viet, P.Q.; Shrestha, R. Aerial Base Station Placement via Propagation Radio Maps. IEEE Trans. Commun. 2024, 72, 5349–5364. [Google Scholar] [CrossRef]
  23. Li, S.; Li, G.; Xi, Y.; Wang, A. Energy Efficiency Optimization of Aerial Intelligent Reflecting Surface-Assisted Communications Based on Multi-Agent Deep Reinforcement Learning. Comput. Netw. 2025, 272, 111722. [Google Scholar] [CrossRef]
  24. Aldossary, M.; Alzamil, I.; Almutairi, J. Enhanced Intrusion Detection in Drone Networks: A Cross-Layer Convolutional Attention Approach for Drone-to-Drone and Drone-to-Base Station Communications. Drones 2025, 9, 46. [Google Scholar] [CrossRef]
  25. Yakunin, K.; Kuchin, Y.; Muhamedijeva, E.; Symagulov, A.; Mukhamediev, R.I. An Algorithm for Planning Coverage of an Area with Obstacles with a Heterogeneous Group of Drones Using a Genetic Algorithm and Parameterized Polygon Decomposition. Drones 2025, 9, 658. [Google Scholar] [CrossRef]
  26. Su, Y.; Gao, Z.; Du, X.; Guizani, M. User-Centric Base Station Clustering and Resource Allocation for Cell-Edge Users in 6G Ultra-Dense Networks. Future Gener. Comput. Syst. 2023, 141, 173–185. [Google Scholar] [CrossRef]
  27. Qin, Y.; Li, R.; Xue, Q.; Zhang, X.; Cui, Y. Aperture-Shared Dual-Band Antennas With Partially Reflecting Surfaces for Base-Station Applications. IEEE Trans. Antennas Propag. 2021, 70, 3195–3207. [Google Scholar] [CrossRef]
  28. Feng, M.; Mao, S.; Jiang, T. Base Station ON-OFF Switching in 5G Wireless Networks: Approaches and Challenges. IEEE Wirel. Commun. 2017, 24, 46–54. [Google Scholar] [CrossRef]
  29. Zhang, H.; Wang, H.; Li, Z.; Wu, D.; Wang, R.; Hu, Y. Latency Guarantee for Task Computation in Wireless-Powered Cloud Radio Access Networks. IEEE Wirel. Commun. 2023, 10, 19199–19207. [Google Scholar] [CrossRef]
  30. Alkaabi, S.R.; Gregory, M.A.; Li, S. Multi-Access Edge Computing Handover Strategies, Management, and Challenges: A Review. IEEE Access 2024, 12, 4660–4673. [Google Scholar] [CrossRef]
  31. Yong, P.; Zhang, N.; Hou, Q.; Liu, Y.; Teng, F.; Ci, S. Evaluating the Dispatchable Capacity of Base Station Backup Batteries in Distribution Networks. IEEE Trans. Smart Grid 2021, 12, 3966–3979. [Google Scholar] [CrossRef]
  32. Alam, M.S.; Kurt, G.K.; Yanikomeroglu, H.; Zhu, P.; Đào, N.D. High Altitude Platform Station Based Super Macro Base Station Constellations. IEEE Trans. Smart Grid 2021, 59, 103–109. [Google Scholar] [CrossRef]
  33. Debnath, D.; Vanegas, F.; Sandino, J.; Hawary, A.F.; Gonzalez, F. A Review of UAV Path-Planning Algorithms and Obstacle Avoidance Methods for Remote Sensing Applications. Remote Sens. 2024, 16, 4019. [Google Scholar] [CrossRef]
  34. Lin, Z.; Wu, K.; Shen, R.; Yu, X.; Huang, S. An Efficient and Accurate A-Star Algorithm for Autonomous Vehicle Path Planning. IEEE Trans. Veh. Technol. 2023, 73, 9003–9008. [Google Scholar] [CrossRef]
  35. Debnath, D.; Vanegas, F.; Boiteau, S.; Gonzalez, F. An Integrated Geometric Obstacle Avoidance and Genetic Algorithm TSP Model for UAV Path Planning. Drones 2024, 8, 302. [Google Scholar] [CrossRef]
  36. Yu, Z.; Si, Z.; Li, X.; Wang, D.; Song, H. A Novel Hybrid Particle Swarm Optimization Algorithm for Path Planning of UAVs. IEEE Internet Things J. 2022, 9, 22547–22558. [Google Scholar] [CrossRef]
  37. Yu, J.; Chen, C.; Arab, A.; Yi, J.; Pei, X.; Guo, X. RDT-RRT: Real-Time Double-Tree Rapidly-Exploring Random Tree Path Planning for Autonomous Vehicles. Expert Syst. Appl. 2024, 240, 122510. [Google Scholar] [CrossRef]
  38. Han, Q.; Ma, X.; Liu, H.; Xu, Y.; Xie, Y.; Yang, Q.; Meng, F. Improved Artificial Potential Field Method for UAV Path Planning. IEEE Access 2025, 13, 177537–177547. [Google Scholar] [CrossRef]
  39. Hentout, A.; Maoudj, A.; Aouache, M. A Review of the Literature on Fuzzy-Logic Approaches for Collision-Free Path Planning of Manipulator Robots. Artif. Intell. Rev. 2023, 56, 3369–3444. [Google Scholar] [CrossRef]
  40. Niu, Y.; Yan, X.; Wang, Y.; Niu, Y. 3D Real-Time Dynamic Path Planning for UAV Based on Improved Interfered Fluid Dynamical System and Artificial Neural Network. Adv. Eng. Inform. 2024, 59, 102306. [Google Scholar] [CrossRef]
  41. Zhang, Y.; Zhao, W.; Wang, J.; Yuan, Y. Recent Progress, Challenges and Future Prospects of Applied Deep Reinforcement Learning: A Practical Perspective in Path Planning. Neurocomputing 2024, 608, 128423. [Google Scholar] [CrossRef]
  42. Placed, J.A.; Strader, J.; Carrillo, H.; Atanasov, N.; Indelman, V.; Carlone, L. A Survey on Active Simultaneous Localization and Mapping: State of the Art and New Frontiers. IEEE Trans. Robot. 2023, 39, 1686–1705. [Google Scholar] [CrossRef]
  43. Reda, M.; Onsy, A.; Haikal, A.Y.; Ghanbari, A. Path Planning Algorithms in the Autonomous Driving System: A Comprehensive Review. Robot. Auton. Syst. 2024, 174, 104630. [Google Scholar] [CrossRef]
  44. Li, J.; Xiong, Y.; She, J. UAV Path Planning for Target Coverage Task in Dynamic Environment. IEEE Internet Things J. 2023, 10, 17734–17745. [Google Scholar] [CrossRef]
  45. Heng, H.; Ghazali, M.H.M.; Rahiman, W. Exploring the Application of Ant Colony Optimization in Path Planning for Unmanned Surface Vehicles. Ocean. Eng. 2024, 311, 118738. [Google Scholar] [CrossRef]
  46. Salehi, S.; Eslamnour, B. Improving UAV base station energy efficiency for industrial IoT URLLC services by irregular repetition slotted-ALOHA. Comput. Netw. 2021, 199, 108415. [Google Scholar] [CrossRef]
  47. Phung, M.D.; Ha, Q.P. Safety-enhanced UAV path planning with spherical vector-based particle swarm optimization. Appl. Soft Comput. 2021, 107, 107376. [Google Scholar] [CrossRef]
  48. Xue, D.; Pang, S.Y.; Liu, N.; Liu, S.K.; Zheng, W.M. Phase-Angle-Encoded Snake Optimization Algorithm for K-Means Clustering. Electronics 2024, 13, 4215. [Google Scholar] [CrossRef]
  49. Fallahi, S.; Taghadosi, M. Quantum-Behaved Particle Swarm Optimization Based on Solitons. Sci. Rep. 2022, 12, 13977. [Google Scholar] [CrossRef] [PubMed]
  50. Ibrahim, A.O.; Elfadel, E.M.E.; Hashem, I.A.T.; Syed, H.J.; Ismail, M.A.; Osman, A.H.; Ahmed, A. The Artificial Bee Colony Algorithm: A Comprehensive Survey of Variants, Modifications, Applications, Developments, and Opportunities. Arch. Comput. Methods Eng. 2025, 32, 3499–3533. [Google Scholar] [CrossRef]
  51. Luo, J.; Tian, Y.; Wang, Z. Research on Unmanned Aerial Vehicle Path Planning. Drones 2024, 8, 51. [Google Scholar] [CrossRef]
  52. Klaine, P.V.; Nadas, J.P.B.; Souza, R.D.; Imran, M.A. Distributed Drone Base Station Positioning for Emergency Cellular Networks Using Reinforcement Learning. Cogn. Comput. 2018, 10, 790–804. [Google Scholar] [CrossRef]
  53. Zhang, H.; Qi, Z.; Li, J.; Aronsson, A.; Bosch, J.; Olsson, H.H. 5G Network on Wings: A Deep Reinforcement Learning Approach to the UAV-Based Integrated Access and Backhaul. IEEE Trans. Mach. Learn. Commun. Netw. 2024, 2, 1109–1126. [Google Scholar] [CrossRef]
  54. Zhu, D.; Shen, J.; Zhang, Y.; Li, W.; Zhu, X.; Zhou, C.; Cheng, S.; Yao, Y. Multi-Strategy Particle Swarm Optimization with Adaptive Forgetting for Base Station Layout. Swarm Evol. Comput. 2024, 91, 101737. [Google Scholar] [CrossRef]
  55. Cai, Q.; Hang, W.; Mirhoseini, A.; Tucker, G.; Wang, J.; Wei, W. Reinforcement Learning Driven Heuristic Optimization. In Proceedings of the 1st Workshop on Deep Reinforcement Learning for Knowledge Discovery (DRL4KDD ’19), Anchorage, AK, USA, 5 August 2019; ACM: New York, NY, USA, 2019. 4p. [Google Scholar]
  56. Wu, J.; He, H.; Peng, J.; Li, Y.; Li, Z. Continuous Reinforcement Learning of Energy Management with Deep Q Network for a Power Split Hybrid Electric Bus. Appl. Energy 2018, 222, 799–811. [Google Scholar] [CrossRef]
  57. Wu, G.; Jia, W.; Zhao, J.; Li, Y.; Li, Z. Dynamic Deployment of Multi-UAV Base Stations with Deep Reinforcement Learning. Electron. Lett. 2021, 57, 600–602. [Google Scholar] [CrossRef]
  58. Liu, C.H.; Chen, Z.; Tang, J.; Xu, J.; Piao, C. Energy-Efficient UAV Control for Effective and Fair Communication Coverage: A Deep Reinforcement Learning Approach. IEEE J. Sel. Areas Commun. 2018, 36, 2059–2070. [Google Scholar] [CrossRef]
  59. Ghanavi, R.; Sabbaghian, M.; Yanikomeroglu, H. Q-learning based aerial base station placement for fairness enhancement in mobile networks. In Proceedings of the 2019 IEEE Global Conference on Signal and Information Processing (GlobalSIP), Ottawa, ON, Canada, 11–14 November 2019; pp. 1–5. [Google Scholar]
  60. Zhao, J.; Gan, Z.; Liang, J.; Wang, C.; Yue, K.; Li, W.; Li, Y.; Li, R. Path Planning Research of a UAV Base Station Searching for Disaster Victims’ Location Information Based on Deep Reinforcement Learning. Entropy 2022, 24, 1767. [Google Scholar] [CrossRef] [PubMed]
  61. Gupta, A.; Savarese, S.; Ganguli, S.; Li, F.-F. Embodied intelligence via learning and evolution. Nat. Commun. 2021, 12, 5721. [Google Scholar] [CrossRef]
Figure 1. Schematic diagram of base station UAV collaborative optimization.
Drones 09 00805 g001
Figure 2. Schematic diagram of user activity areas.
Drones 09 00805 g002
Figure 3. User mobility diagram.
Drones 09 00805 g003
Figure 4. Schematic diagram of signal detection range.
Drones 09 00805 g004
Figure 5. Two-dimensional map of signal coverage area.
Drones 09 00805 g005
Figure 6. TD3 algorithm structure diagram.
Drones 09 00805 g006
Figure 7. DE algorithm structure diagram.
Drones 09 00805 g007
Figure 8. Environmental assessment structure diagram.
Drones 09 00805 g008
Figure 9. MTS-COM structure diagram.
Drones 09 00805 g009
Figure 10. Schematic diagram of BIEC.
Drones 09 00805 g010
Figure 11. Algorithm layout optimization process.
Drones 09 00805 g011
Figure 12. Distribution map of base stations.
Drones 09 00805 g012
Figure 13. Flight path of drones. (a) Trajectory of three drones. (b) UAV-1 trajectory. (c) UAV-2 trajectory. (d) UAV-3 trajectory.
Drones 09 00805 g013
Figure 14. Coverage rate box plot.
Drones 09 00805 g014
Figure 15. Convergence images for comparative experiments.
Drones 09 00805 g015
Figure 16. Box diagram of experimental energy consumption.
Drones 09 00805 g016
Figure 17. Distribution map of base stations for comparison algorithm. (a) Q-learning. (b) DQN. (c) PPG. (d) DRL-EC3. (e) DDQN-SSQN. (f) SA-Q. (g) DecRL-AE&VAS. (h) DERL.
Drones 09 00805 g017
Figure 18. Box plot of ablation experiments.
Drones 09 00805 g018
Figure 19. Convergence image of ablation experiment.
Drones 09 00805 g019
Table 1. Experimental parameter settings.
ParameterValue
S t e r r a i n 1000 × 1000 × 1000
N m o u n t a i n 4
f c 2.4 GHz
c 3 × 10 8 m/s
α b s , α u a v 3.4, 3.2
N b s , i n i t , N u a v , N u s e r , N b s m a x 3, 3, 5, 12
v h m a x , v v m a x 10 m/s, 5 m/s
Table 2. Coordinates of base stations.
Base Station TypeIndexBase Station Coordinates
Fixed Base Station1(639.324, 201.168, 425.569)
2(924.830, 372.622, 179.021)
3(730.089, 994.566, 201.231)
Variable Base Station4(948.862, 206.286, 195.486)
5(414.942, 694.779, 188.964)
6(391.683, 856.531, 182.615)
7(868.008, 672.758, 215.291)
8(413.459, 171.502, 244.622)
9(847.181, 58.780, 186.463)
10(533.602, 406.899, 690.687)
11(779.643, 106.990, 229.274)
12(987.502, 460.750, 176.640)
13(706.012, 571.335, 555.129)
14(382.947, 68.828, 190.776)
15(510.390, 240.972, 335.773)
Table 3. The internal parameters of each algorithm.
AlgorithmParameters
AMB-TD3F = 0.5, CR = 0.7, γ = 0.95 , τ = 0.005 , σ = 0.2 , c = 0.5, d = 2
Q-learning α = 0.1 , γ = 0.95 , ε = 0.9 , κ = 0.995
DQN α = 0.1 , γ = 0.95 , ε = 0.9 , κ = 0.995
PPG γ = 0.95 , τ = 0.005 , α π = 0.0003 , α V = 0.001 , β = 1.0 ,
DRL-EC3 γ = 0.95 , τ = 0.005 , σ = 0.2 , c = 0.5, d = 2
SA-Q γ = 0.95 , τ = 0.005 , α = 0.001 , ε = 0.995
DDQN-SSQN γ = 0.95 , τ = 0.005 , α = 0.001 , ε = 0.995
DecRL-AE&VAS γ = 0.95 , τ = 0.005 , α = 0.001 , T init = 1.0 , T final = 0.1 , η = 0.995
DERLF = 0.6, CR = 0.8, γ = 0.95 , τ = 0.005 , σ = 0.2 , α = 0.1 , ϵ = 0.995
Table 4. Optimized results of AMB-TD3 and other algorithms.
AlgorithmBestWorstStdp
AMB-TD398.094%92.379%1.701%-
Q-learning92.704%69.132%5.208%1.436 × 10 34 (-)
DQN95.833%90.349%1.706%1.458 × 10 34 (-)
PPG96.527%86.834%2.690%1.432 × 10 34 (-)
DRL-EC396.338%92.827%1.120%2.254 × 10 34 (-)
DDQN-SSQN96.896%85.693%2.431%7.549 × 10 25 (-)
SA-Q96.336%90.136%1.767%1.436 × 10 34 (-)
DecRL-AE&VAS96.685%85.862%2.309%1.903 × 10 25 (-)
DERL96.442%91.376%1.3936%2.032 × 10 25 (-)
Table 5. Results table of ablation experiments.
AlgorithmBestWorstStdTimes (s)Rank
AMB-TD398.094%92.379%1.701%13,386.8432.184
TD3-195.582%90.701%1.527%6877.8232.658
TD3-297.159%90.187%2.062%11,733.6692.816
TD3-396.659%84.963%3.337%13,167.1773.158
Disclaimer/Publisher’s Note: The statements, opinions and data contained in all publications are solely those of the individual author(s) and contributor(s) and not of MDPI and/or the editor(s). MDPI and/or the editor(s) disclaim responsibility for any injury to people or property resulting from any ideas, methods, instructions or products referred to in the content.