Article

Design and Validation of a 3D-Printed Drone Chassis Model Through Static and Transient Nonlinear FEM Analyses and Experimental Testing

by
Basil Mohammed Al-Hadithi
1,2,* and
Sergio Alcón Flores
3
1
Intelligent Control Group, Universidad Politécnica de Madrid, Centre for Automation and Robotics UPM-CSIC, C/J. Gutierrez Abascal, 2., 28006 Madrid, Spain
2
Department of Electrical, Electronics, Control Engineering, School of Industrial Design and Engineering, Universidad Politécnica de Madrid, C/Ronda de Valencia, 3., 28012 Madrid, Spain
3
Department of Mechanical Engineering, School of Industrial Design and Engineering, Universidad Politécnica de Madrid, C/Ronda de Valencia, 3., 28012 Madrid, Spain
*
Author to whom correspondence should be addressed.
Drones 2025, 9(11), 789; https://doi.org/10.3390/drones9110789 (registering DOI)
Submission received: 27 August 2025 / Revised: 26 October 2025 / Accepted: 5 November 2025 / Published: 12 November 2025

Highlights

What are the main findings?
  • A screwless FPV drone chassis with interlocking, interchangeable arms inspired by Japanese joinery was designed in Autodesk Inventor, analyzed through a hierarchical simulation philosophy combining global static analyses validated by simplified linear models, and nonlinear transient simulations for crash and maximum acceleration scenarios using Inventor Nastran.
  • The structure was 3D printed in PETG as a rapid prototype to validate the design and analysis methodology, with planned production in carbon fiber to achieve final performance and durability goals.
What are the implications of the main findings?
  • The proposed design and validation workflow offer a comprehensive pathway for developing lightweight, crash-resilient sub-250 g UAVs.
  • This approach bridges theoretical FEM modeling with real-world performance, enhancing the structural and functional reliability of micro aerial vehicles.

Abstract

This work presents the structural analysis and validation of a sub-250 g FPV drone chassis, emphasizing both theoretical rigor and practical applicability. The novelty of this contribution lies in four complementary aspects. First, the structural philosophy introduces a screwless frame with interchangeable arms, joined through interlocking mechanisms inspired by traditional Japanese joinery. This approach mitigates stress concentrations, reduces weight by eliminating fasteners, and enables rapid arm replacement in the field. Second, validation relies on nonlinear static and transient FEM simulations, explicitly including crash scenarios at 5 m/s, systematically cross-checked with bench tests and instrumented flight trials. Third, unlike most structural studies, the framework integrates firmware (Betaflight), GPS, telemetry, and real flight performance, linking structural reliability with operational robustness. Finally, a practical materials pathway was implemented through a dual-track strategy: PETG for rapid, low-cost prototyping, and carbon fiber composites as the benchmark for production-level performance. Nonlinear transient FEM analyses were carried out using Inventor Nastran under multiple load cases, including maximum motor acceleration, pitch maneuvers, and lateral impact at 40 km/h, and were validated against simplified analytical models. Experimental validation included bench and in-flight trials with integrated telemetry and autonomous features such as Return-to-Home, demonstrating functional robustness. The results show that the prototype flies correctly and that the chassis withstands the loads experienced during flight, including accelerations up to 4.2 G (41.19 m/ s 2 ), abrupt changes in direction, and high-speed maneuvers reaching approximately 116 km/h. Quantitatively, safety factors of approximately 5.3 under maximum thrust and 1.35 during impact confirm sufficient structural integrity for operational conditions. In comparison with prior works reviewed in this study, the key contribution of this work lies in unifying advanced, crash-resilient FEM simulations with firmware-linked flight validation and a scalable material strategy, establishing a distinctive and comprehensive workflow for the development of sub-250 g UAVs.

1. Introduction

In recent years, the rapid advancement of unmanned aerial vehicles (UAVs) has led to a surge in the development of compact and efficient drone platforms, particularly in the FPV (First-Person View) community. Among these, sub-250 g drones have gained special attention due to their regulatory advantages, reduced risk profiles, and portability [1]. Many civil aviation authorities, including the FAA and EASA, classify drones under 250 g as exempt from certain registration and operational restrictions, which further motivates both hobbyists and researchers to explore this category of UAVs [2]. However, minimizing weight while maintaining structural integrity and functionality presents significant design challenges, particularly in the context of dynamic flight manoeuvres and potential collisions.
Structural reliability is a critical factor in drone performance, especially for applications involving high-speed FPV racing or autonomous navigation in complex environments. Lightweight UAVs are especially vulnerable to high-frequency vibrations, fatigue-induced cracking, and impact damage, all of which may compromise flight safety and efficiency [3]. Traditional design approaches often rely on empirical testing or oversimplified models, which may not fully capture the nonlinear and transient mechanical behavior of lightweight drone frames. Therefore, integrating modern simulation tools such as Finite Element Method (FEM) analysis into the design workflow becomes essential for predicting structural performance under realistic operating conditions [4]. In this context, digital twin frameworks and multi-physics simulations have been increasingly adopted to shorten development cycles and enhance structural reliability in UAV applications [5].
This article aims to bridge the gap between theoretical structural analysis and practical drone design by conducting a comprehensive evaluation of a sub-250 g FPV drone frame. Nonlinear static and transient simulations were carried out using Autodesk Inventor Nastran 2025, and the results were compared with simplified analytical models to verify their accuracy and reliability. In addition, the physical prototype was fabricated using 3D printing technologies and integrated with Betaflight firmware 4.5.1, enabling autonomous features such as Return-to-Home (RTH) [6]. Beyond validation, such a workflow demonstrates the potential of simulation-driven design for rapid iteration in UAV development [7].
To facilitate rapid prototyping and accessible fabrication, the frame was initially designed for 3D printing using PETG filament. PETG offers a good balance between mechanical strength, flexibility, and ease of use with consumer-grade FDM printers, making it suitable for iterative development in a home or laboratory setting. Its moderate impact resistance and durability allowed for functional testing of the structural concept without specialized manufacturing equipment. However, for high-performance or production versions, carbon fiber composites represent a more appropriate material choice. PETG-based designs—even when reinforced with short carbon fibers—offer improved mechanical properties (e.g., approximately 23% increase in yield strength over neat PETG) but remain substantially inferior in specific stiffness and vibration resistance compared to pure carbon fiber frames [1]. A carbon fiber composite structure delivers significantly higher Young’s modulus and strength-to-weight ratio, which are critical for improving flight dynamics, energy efficiency, and crash resilience in FPV drones, despite its greater fabrication complexity and cost [8].
The main objective of this work is to develop and validate a structurally optimized, lightweight FPV drone frame capable of withstanding demanding mechanical stresses during flight. The outcomes contribute not only to the design methodology of small UAVs but also to the understanding of lightweight structural behavior in dynamic applications. Furthermore, this research highlights how combining additive manufacturing with advanced composite materials can expand the design space for sub-250 g UAVs in both hobbyist and professional domains [9]. A video demonstration of the prototype in autonomous flight is provided to illustrate the effectiveness of the proposed design approach.
To provide a clear roadmap for the reader, the specific research objectives of this study are summarized as follows:
  • To analyze and model the structural behavior of a sub-250 g FPV drone frame using both analytical methods and Finite Element Methods.
  • To evaluate the performance of additively manufactured (PETG-based) and composite (carbon fiber) frames under realistic flight and impact conditions.
  • To validate simulation results through experimental testing and prototype flight performance.
  • To propose a simulation-driven workflow that integrates FEM and digital twin concepts for lightweight UAV design optimization.
  • Regulatory motivation: Operating below the 250 g threshold has significant implications under both EASA and FAA frameworks. Under the EASA Open Category, as defined in Commission Implementing Regulation (EU) 2019/947 and Delegated Regulation (EU) 2019/945, UAS with a Maximum Take-Off Mass (MTOM) of <250 g (Class C0) may be flown in subcategory A1 with minimal training requirements and, in many cases, without operator registration. Similarly, under FAA regulations (14 CFR Part 48), drones weighing less than 0.55 lb (≈250 g) used for recreational purposes are not required to be registered. Designing for the sub-250 g segment therefore enables broader and less encumbered deployment; however, the reduced mass budget imposes strict structural efficiency demands, justifying advanced simulation, material selection, and integrated performance validation.
Finally, the organization of this paper is as follows: Section 2 details the methodological framework, including prior work positioning, design tools, simulation environment, and validation protocols. Section 3 presents the outcomes of the chassis design, modeling, and fabrication, together with the structural analyses conducted through the Finite Element Method (FEM) under different flight conditions. Section 4 discusses the main limitations of the study, addressing modeling assumptions, experimental scope, and material constraints that may influence the generalization of results. Section 5 summarizes the main findings of this work, highlighting the validated structural performance of the proposed sub-250 g FPV drone, and outlines future research directions aimed at improving materials, integration, and autonomous flight capabilities.

2. Materials and Methods

This section details the methodological framework adopted to design, simulate, and validate the proposed FPV sub-250 g UAV frame. The approach combines a review of prior work with comparative positioning, followed by the specification of the design tools, material assumptions, simulation environment, fabrication workflow, and validation protocols. Through this structure, the methodology ensures both theoretical consistency and practical relevance, bridging numerical models with experimental testing and real-flight performance.

2.1. Positioning and Contributions Relative to Prior Work

The work presented in [10] published in (MDPI, 2022), is an important reference within UAV chassis design and validation. Its main contribution lies in demonstrating, through linear static analysis and comparison of 3D-printable materials (PLA, ABS, ASA), the feasibility of modular lightweight structures in general UAV contexts [10]. This conceptual approach has provided a methodological baseline for subsequent developments, underlining the importance of considering both structural design and material properties from the early stages [11].
Much of the academic literature on UAV frames has followed a similar path, focusing on static or modal FEM, topology optimization, or comparative studies of polymers and composites [12]. Contributions as [13] have been essential to establish a reference framework, yet in many cases they remain primarily theoretical, with limited experimental validation or integration into actual flight systems [14].

2.1.1. Specific Orientation of This Research

This work builds on this foundation while advancing a differentiated approach, tailored to the sub-250 g FPV segment, where regulatory constraints and performance demands are uniquely stringent. It contributes several defining aspects:
  • Structural philosophy: A frame with interchangeable arms assembled without screws, using joinery-inspired interlocks reminiscent of Japanese marquetry. This design mitigates stress concentrations, reduces weight by eliminating fasteners, and enables rapid arm replacement in the field.
  • Methodology of validation: Nonlinear static and transient FEM simulations, including crash scenarios at ∼5 m/s, validated against physical bench tests and instrumented flight trials.
  • Integration of system operation: Unlike most structural studies, our design and validation explicitly consider firmware (Betaflight), GPS, telemetry, and real-flight performance.
  • Practical materials pathway: Accessible PETG for rapid prototyping and iteration, combined with CFRP for the production-ready high-performance frame.
  • Regulatory motivation: Operating below the 250 g threshold has significant implications under both EASA and FAA frameworks [15]. Under the EASA Open Category, as defined in Commission Implementing Regulation (EU) 2019/947 and Delegated Regulation (EU) 2019/945, UAS with a Maximum Take-Off Mass (MTOM) of <250 g (Class C0) may be flown in subcategory A1 with minimal training requirements and, in many cases, without operator registration. Similarly, under FAA regulations (14 CFR Part 48), drones weighing less than 0.55 lb (≈250 g) used for recreational purposes are not required to be registered. Designing for the sub-250 g segment therefore enables broader and less encumbered deployment; however, the reduced mass budget imposes strict structural efficiency demands, justifying advanced simulation, material selection, and integrated performance validation [16].

2.1.2. Comparison of the Proposed Method with Other Works

The work given in [10] provides a valuable baseline that integrates linear static FEA and additive manufacturing within a coherent workflow. Our work complements that contribution by extending the analysis to nonlinear dynamics and crash transients with experimental and in-flight validation. In [12], an elegant unibody approach is proposed via topology optimization and DFAM to reduce assembly weight and complexity. In contrast, though complementary, our chassis emphasizes interchangeability and maintainability with screwless joints. Widely cited studies such as [11,13] provide essential baselines through FEM of conventional or 3D-printed frames, which are generally static and simulation-driven; our work expands this by adding transient, impact-oriented FEM tied to flight data. The CogniFly platform illustrates collision-resilient design with semi-rigid joints, while the suggested work differs by channeling impact energy through joinery-inspired arm interfaces to diffuse stresses and enable quick replacement [17]. Finally, recent integrated workflows of topology optimization and AM highlight the importance of computational geometry, while our contribution adds the practical axis of repairability and dynamic validation [14].
When compared along four main axes—frame philosophy, analysis scope, validation/evidence, and materials and manufacturing—these distinctions become clearer. From the perspective of frame philosophy, our proposed work (FPV sub-250 g) adopts a repair-first design with interchangeable arms and screwless joints inspired by Japanese joinery. A modular CAD-based philosophy is presented with 3D-printed prototypes in [10], while a unibody/monocoque layout exploiting DFAM is developed in [12]. In [11], plate-and-arm assemblies are applied. A 3D-printed configuration is explored in [13]. A collision resilience is emphasized in [17], and the authors of [14] opted for optimization-driven geometries.
In terms of analysis scope, our work extends beyond static checks into nonlinear transient FEM that couples structural analysis with firmware and FPV flight constraints. The work developed in [10] is restricted to linear static FEA, while the one given in [12] focused on topology optimization. Static and modal/explicit FEM is included in [11]. The authors in [13] confined themselves to CAD and static FEM feasibility. In [17], empirical crash design is prioritized and an integrated topology optimization without FPV dynamics is used in [14].
For validation, our approach uniquely integrates bench-loading and in-flight telemetry, directly correlating FEM predictions with flight performance. In [10], CAD/FEA trade-offs and fabrication demos are presented; meanwhile, in [12], they are validated through AM demos and structural targets. The works [11,13] presented mainly simulation-driven results. Resilience up to 7 m/s crashes is verified in [17], while a validated methodology without dynamic flight tests is presented in [14].
Finally, regarding materials and manufacturing, our dual-track strategy employs PETG for rapid, low-cost prototyping and CFRP as a production benchmark. Thermoplastic AM is emphasized in [10,13]. The work in [12] focused on DFAM-driven AM structures, while in [11] conventional materials are considered. Leveraged low-cost resilient plastics are used in [17] and optimization methodologies anchored in AM are developed in [14].
Taken together, these comparative insights are synthesized visually in Table 1, which condenses the landscape into a structured format.
Summary of contributions.
  • Screwless, interchangeable-arm frame inspired by Japanese joinery.
  • Nonlinear transient FEM for FPV-realistic maneuvers and crash impacts.
  • Dual-track materials strategy: PETG for low-cost prototyping, with CFRP as production benchmark.
  • Bench and in-flight validation with telemetry, GPSm and firmware integration.

2.2. Design and Simulation Environment

The FPV drone frame was designed using Autodesk Inventor Professional 2025. The model was parametrically constructed to optimize weight and structural integrity while complying with the sub-250 g regulatory requirement. Finite Element Method (FEM) analysis was conducted in Autodesk Inventor Nastran 2025, enabling nonlinear static and transient simulations. The Von Mises yield criterion was applied to assess failure risk under various loading scenarios, including dynamic impacts and sustained thrust loads.

2.3. Material Properties and Assumptions

Frames were fabricated via FDM (Fused Deposition Modeling) using PETG filament. The mechanical properties of PETG are anisotropic due to layer-dependent behavior. Specifically, properties along the XY plane (parallel to print layers) are superior to those along the Z axis (perpendicular to layers) because of reduced interlayer bonding. For conservative and simplified analysis, isotropic behavior was assumed using the minimum values from the XY plane.
In reality, FDM-printed PETG exhibits marked anisotropy, as tensile and shear strengths in the Z-direction may be up to 40–60% lower than those in the XY plane due to weaker interlayer adhesion [18]. The bonding quality depends on extrusion temperature, print speed, and layer height, leading to orthotropic mechanical behavior. A more accurate representation would therefore employ an orthotropic or transversely isotropic model, capturing the directional dependence of stiffness and failure modes such as layer delamination or shear failure between deposited layers. However, the isotropic simplification adopted here provides a conservative lower-bound estimate of frame stiffness and strength, suitable for preliminary structural validation and ensuring safety under all flight conditions.
Table 2 presents a comparison between PETG and the typical values of carbon fiber composites commonly used in FPV drone frames. The CFRP material considered corresponds to a quasi-isotropic laminate composed of unidirectional (UD) carbon fiber/epoxy prepreg layers arranged in a [0/90/±45]s layup [19]. This configuration provides balanced in-plane stiffness, which is representative of typical FPV frame plates manufactured by CNC milling from cured composite sheets [20].
The relatively low modulus and strength of PETG compared to carbon fiber result in lower stiffness and impact resistance, which must be considered in high-performance applications. Nevertheless, PETG provides advantages in ease of fabrication, prototyping flexibility, and cost, making it suitable for iterative development. All structural components were 3D-printed with their main load-bearing axes aligned parallel to the XY plane of the printer bed, ensuring that the filament deposition direction coincides with the principal stress paths and thus maximizes in-plane strength and stiffness. Failure analysis employed the Von Mises criterion using the minimum mechanical values to ensure conservative structural predictions.
Although the analyses were carried out using PETG, the final production configuration is intended to be manufactured in carbon fiber composite. The use of PETG provides a conservative lower-bound validation of the mechanical behavior while simplifying computation and experimental testing. Since carbon fiber exhibits significantly higher stiffness and strength (as shown in Table 2), any design that meets safety requirements in PETG will present even lower deformation and higher safety margins when produced in carbon fiber. To support this assumption, an additional static simulation using the quasi-isotropic CFRP layup has been included, confirming the expected reduction in displacement and increase in the safety factor.

2.4. Simulation Parameters and Load Cases

Finite element meshes used tetrahedral elements with local refinement in stress concentration zones. Static simulations modeled thrust and motor-induced torsion, while transient dynamic analyses simulated impact events at 5 m/s against rigid boundaries. Convergence analysis ensured mesh independence. Loads were calculated based on the expected thrust-to-weight ratios of FPV drones under typical flight conditions.

2.5. Fabrication and Assembly

The frame was printed using an Artillery Genius FDM printer with 100% infill, 0.2 mm layer height, and a 0.4 mm nozzle. Slicing and print preparation were conducted using Ultimaker Cura 5.8. Post-print finishing was minimal to preserve dimensional fidelity. The assembled drone included the following:
  • Flight Controller (FC): SpeedyBee F405 AIO
  • Firmware: Betaflight 4.5.2
  • GPS Module: M10 series
  • Digital Video Transmitter (VTX): DJI-compatible system
  • Audible Beeper for fail-safe events
Firmware configuration included enabling autonomous Return-to-Home (RTH) and fail-safe protocols using Betaflight Configurator. PID tuning was adjusted for low-mass dynamics and frame-specific resonance.

2.6. Experimental Validation

Static tests involved controlled loading of the frame using known weights at key points to validate FEM predictions. Flight testing evaluated frame response under typical FPV manoeuvres, including high-speed turns, ascents, and controlled impacts. GPS telemetry and flight logs were recorded for analysis.

2.7. Ethical and Data Availability Statements

No human or animal testing was involved. All CAD models, simulation files, and firmware configurations are available upon request and will be published in an open-access repository prior to publication. No restrictions apply to the sharing of materials or data.

3. Results

The design of a customized chassis for unmanned aerial systems (UAS) demands the seamless integration of mechanical, functional, and electronic requirements. This chapter presents a comprehensive account of the design, modeling, manufacturing, and structural assessment of such a chassis, tracing its development from initial CAD conception to final validation through finite element analysis (FEA).
In Section 3.1, this work addresses the 3D modeling stage, carried out using Autodesk Inventor, and outlines the design rationale, imposed constraints, and the spatial arrangement of the electronic components. Particular emphasis is placed on the modular architecture adopted to facilitate both assembly and maintenance of the drone.
Through Section 3.2, this article describes the manufacturing and 3D printing process based on Fused Deposition Modeling (FDM), including slicing strategies, printing profiles, and the assembly sequence of the physical structure.
The structural performance of the chassis is then examined in Section 3.3 using Finite Element Method (FEM) simulations. This section defines the applied load conditions, details the mechanical properties of the PETG material, and specifies the failure criteria employed to assess the robustness of the design.
Finally, Section 3.4 present a series of case studies together with their corresponding results analysis, evaluating the chassis under representative operational scenarios such as hover, maximum thrust, lateral impact, and dynamic manoeuvres.

3.1. CAD Modeling of the Custom Chassis

The three-dimensional modeling stage constitutes a fundamental phase in the chassis development process because it defines the base geometry onto which the drone’s various modules will be integrated. Using CAD tools—specifically Autodesk Inventor—both the overall structural arrangement and the specific construction details were precisely defined.
Individual part files (.ipt) were developed and subsequently assembled into .iam assembly files, producing a digital mock-up of the system. This virtual model enables the validation of dimensional compatibility between components and anticipates potential interferences, fastening requirements, and cable routing paths.
This subsection presents the principal design considerations applied during modeling, together with the modular integration philosophy that characterizes the chassis. It also refers to the most relevant structural and electronic elements. It anticipates their functional behavior, which will be evaluated later in the sections dedicated to physical fabrication and structural simulation analysis.

3.1.1. Design Considerations

The 3D design and modeling of the chassis and its components were carried out using Autodesk Inventor. This procedure enabled an accurate representation of each part’s geometry and its correct mutual interaction within the global system. Part files (.ipt) were progressively assembled into .iam assemblies using geometric constraints (constraints) to ensure alignment, contact, and appropriate relative positioning.
The primary objective of the 3D model is to facilitate the correct placement of electronic and mechanical components within the chassis, enabling secure fixation, optimization of available space and interference assessment. This approach allows a pre-assembly validation that reduces potential integration errors during the real assembly stage.
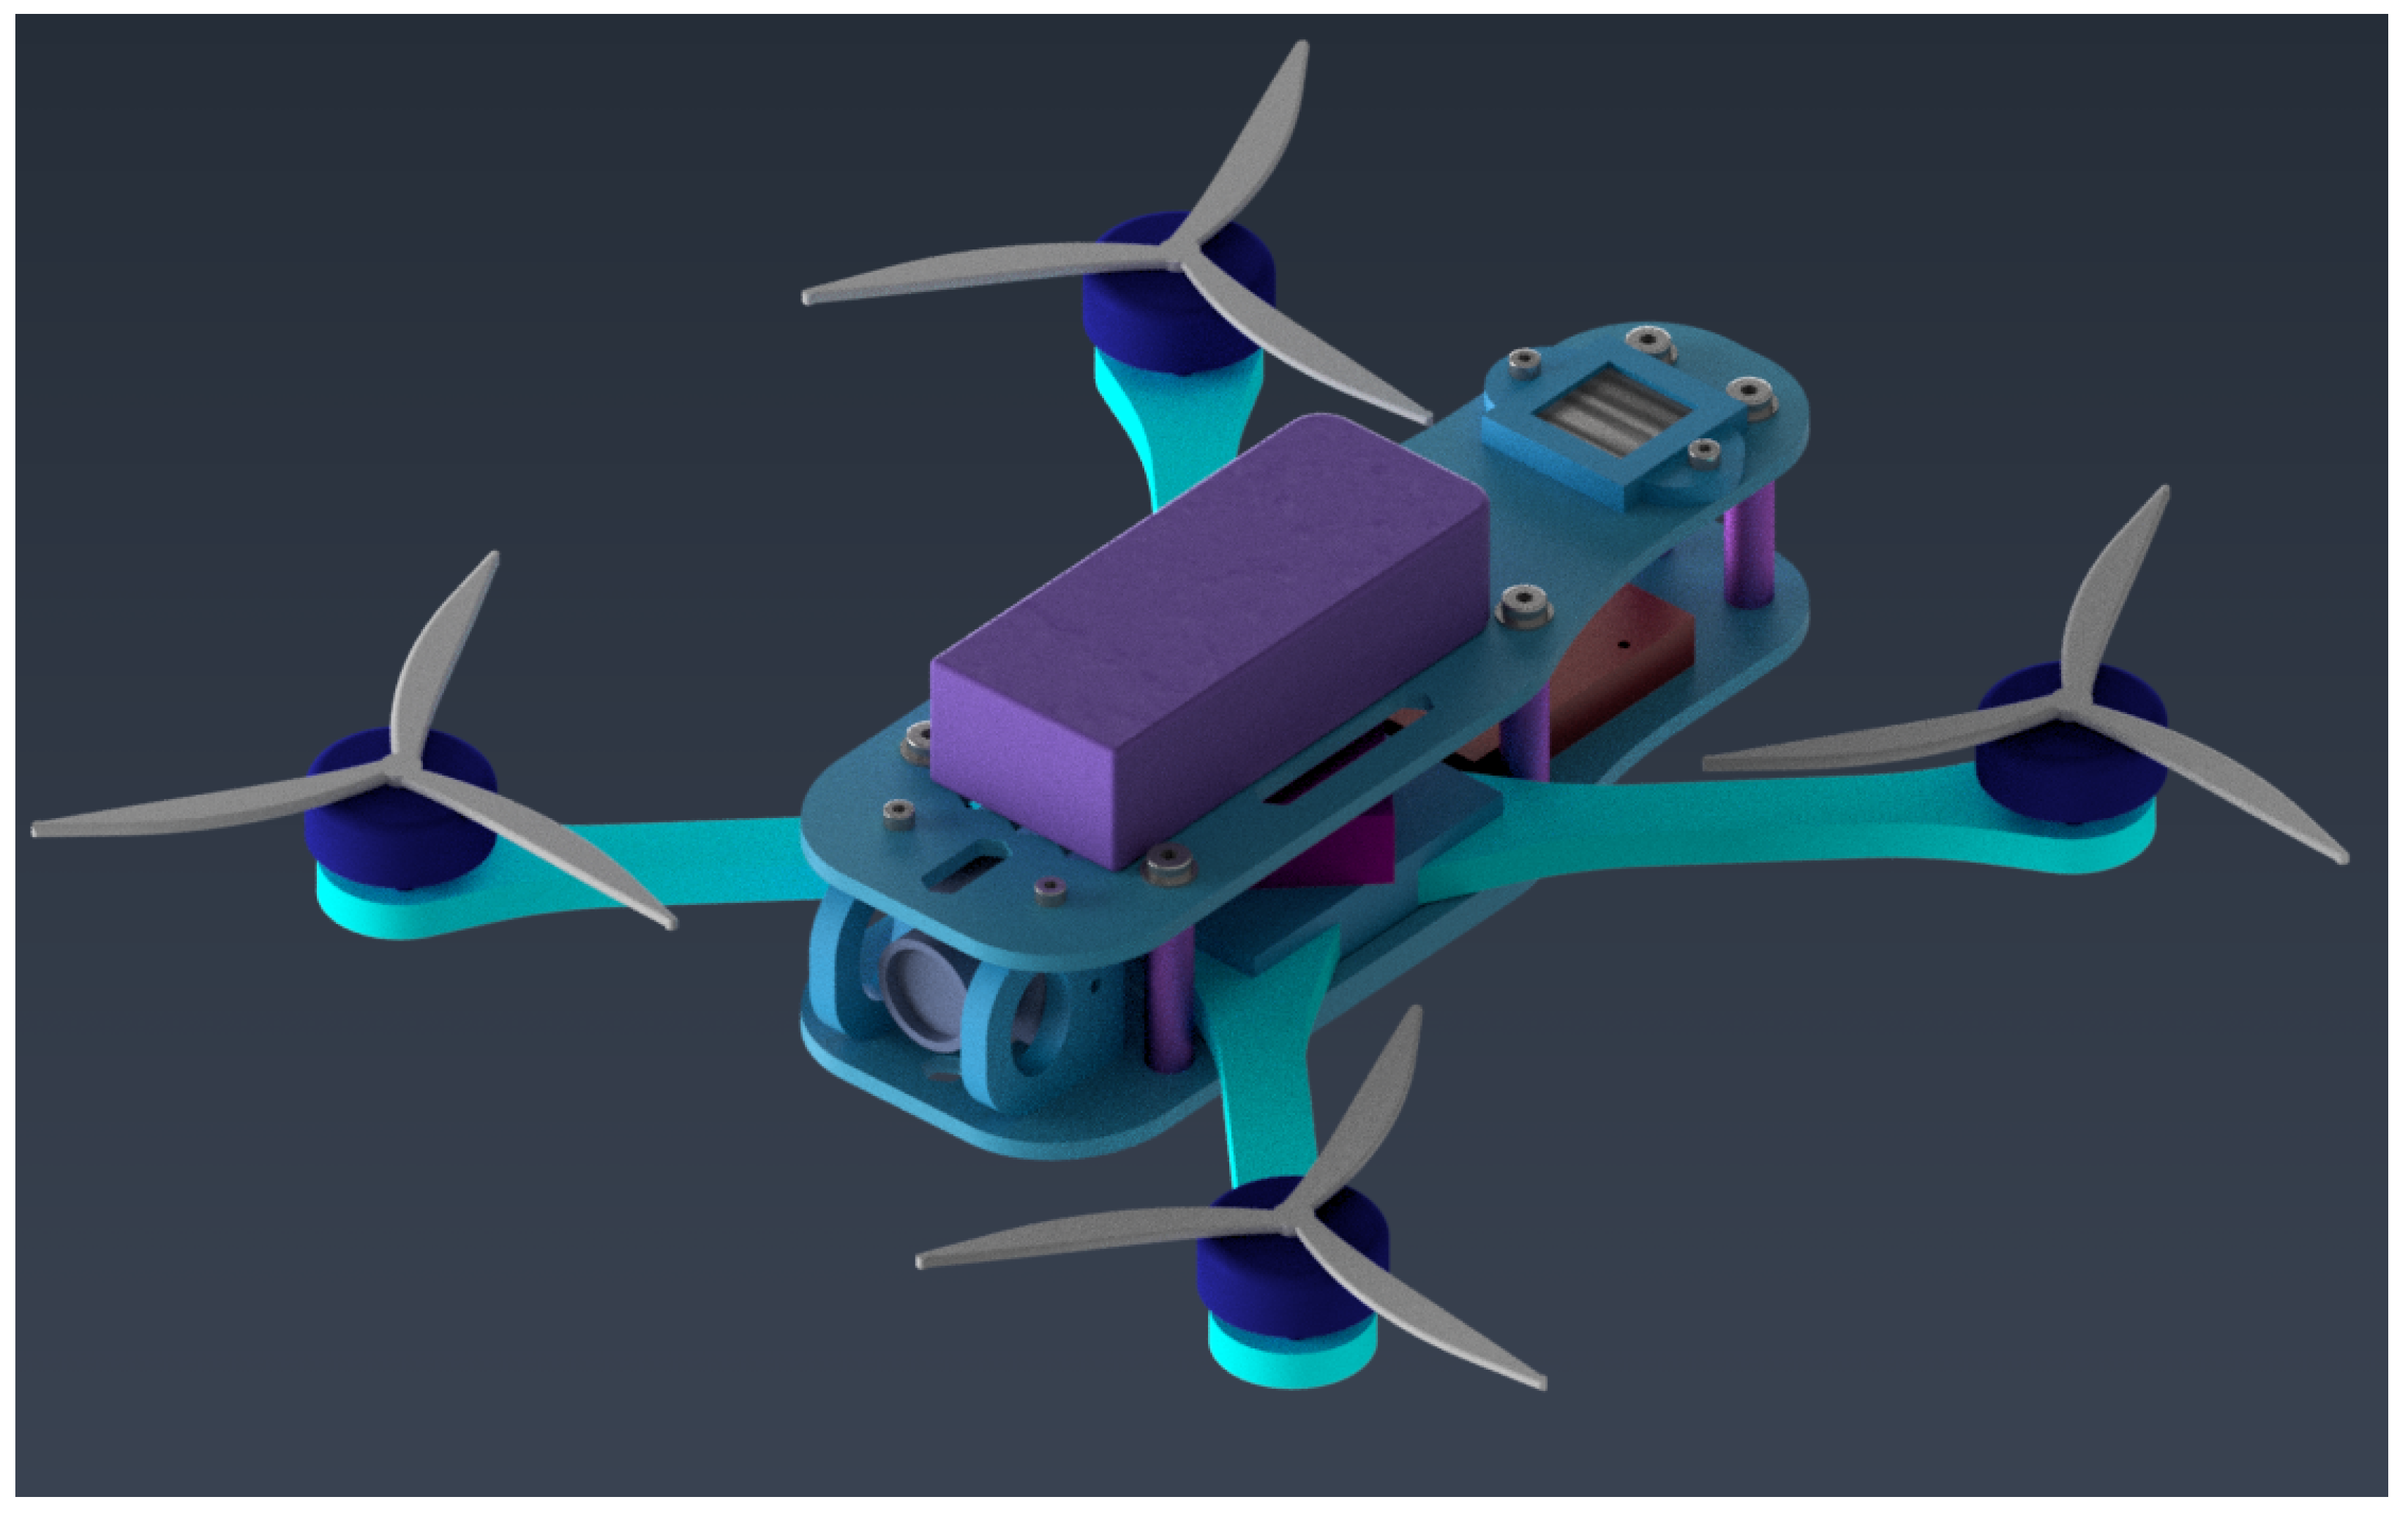
In Figure 1, the general assembly of the drone is shown, illustrating the layout of the various elements on the modeled chassis. The overall drone frame has a diagonal motor-to-motor distance of 200 mm, and the final assembled weight including the battery is 245 g.
The GPS Module is mounted on the upper plate of the chassis, enclosed within a screwed support that provides mechanical protection and ensures optimal orientation for satellite signal reception. This fastening also reduces the risk of vibration or displacement that could impair its operation. Similarly, the radio receiver (Rx) has been placed on the underside of the upper plate and secured using a custom structure.
The Video Transmitter (VTX) is located on the lower plate of the chassis and is fixed by an additional bracket specifically designed to permit ventilation and to minimize contact with other critical parts. This strategic positioning improves heat dissipation and mitigates potential electromagnetic interference with other modules.
The chassis was designed following a philosophy of modularity and simplified maintenance. To this end, 25 mm aluminum hexagonal standoffs are used to join the upper and lower plates quickly and firmly. This system provides structural stiffness without sacrificing accessibility for maintenance or component replacement.
The FPV camera is mounted on an independent bracket that includes two lateral protective arms whose geometry cushions frontal or lateral impacts. Furthermore, the bracket design allows manual adjustment of the camera tilt angle, which is essential to adapt the view for different flight configurations or conditions.
The drone arms are inserted into a central frame that is fixed to the lower plate using standard M3 fasteners. This frame also houses the Flight Controller (FC), positioned slightly forward on the chassis to shift the center of gravity (CoG) forward. This configuration promotes a small positive pitch attitude in flight, improving forward-flight response. Both the frame and the arms are offset towards the front relative to the longitudinal midplane, consistent with this mass distribution. Additionally, holes have been avoided in the arms themselves to prevent stress concentrations and possible structural weak points that could compromise mechanical integrity.
The main battery is mounted on the upper plate and secured with a Velcro strap that passes through purpose-designed recesses. Electrical connection is provided via an XT30 connector embedded in a cavity on the upper plate to ensure immobility and facilitate quick connection/disconnection.
Both chassis plates incorporate strategically distributed hexagonal cutouts whose dual functions are as follows: (i) to allow passive ventilation of internal components (particularly the VTX); and (ii) to reduce total weight by removing non-functional material without compromising structural integrity.

3.1.2. CAD Design and Component Assembly

The main assembly file (.iam) was organized hierarchically to structure the different functional sub-assemblies of the drone. This hierarchy facilitated both the design process and the verification of the complete model. Principal sub-assemblies include the Core Assembly, the Fastening Block, the Chassis Assembly and the Complete Assembly. This modular distribution allows logical isolation of components, simplifying editing, review, and technical documentation.
During assembly in the Autodesk Inventor environment, specific geometric constraints (mate, flush, insert, and angle) were used to guarantee precise alignment and correct spatial disposition of components. Care was taken to avoid redundant constraints that could produce over-constrained systems, thus ensuring predictable model behavior.
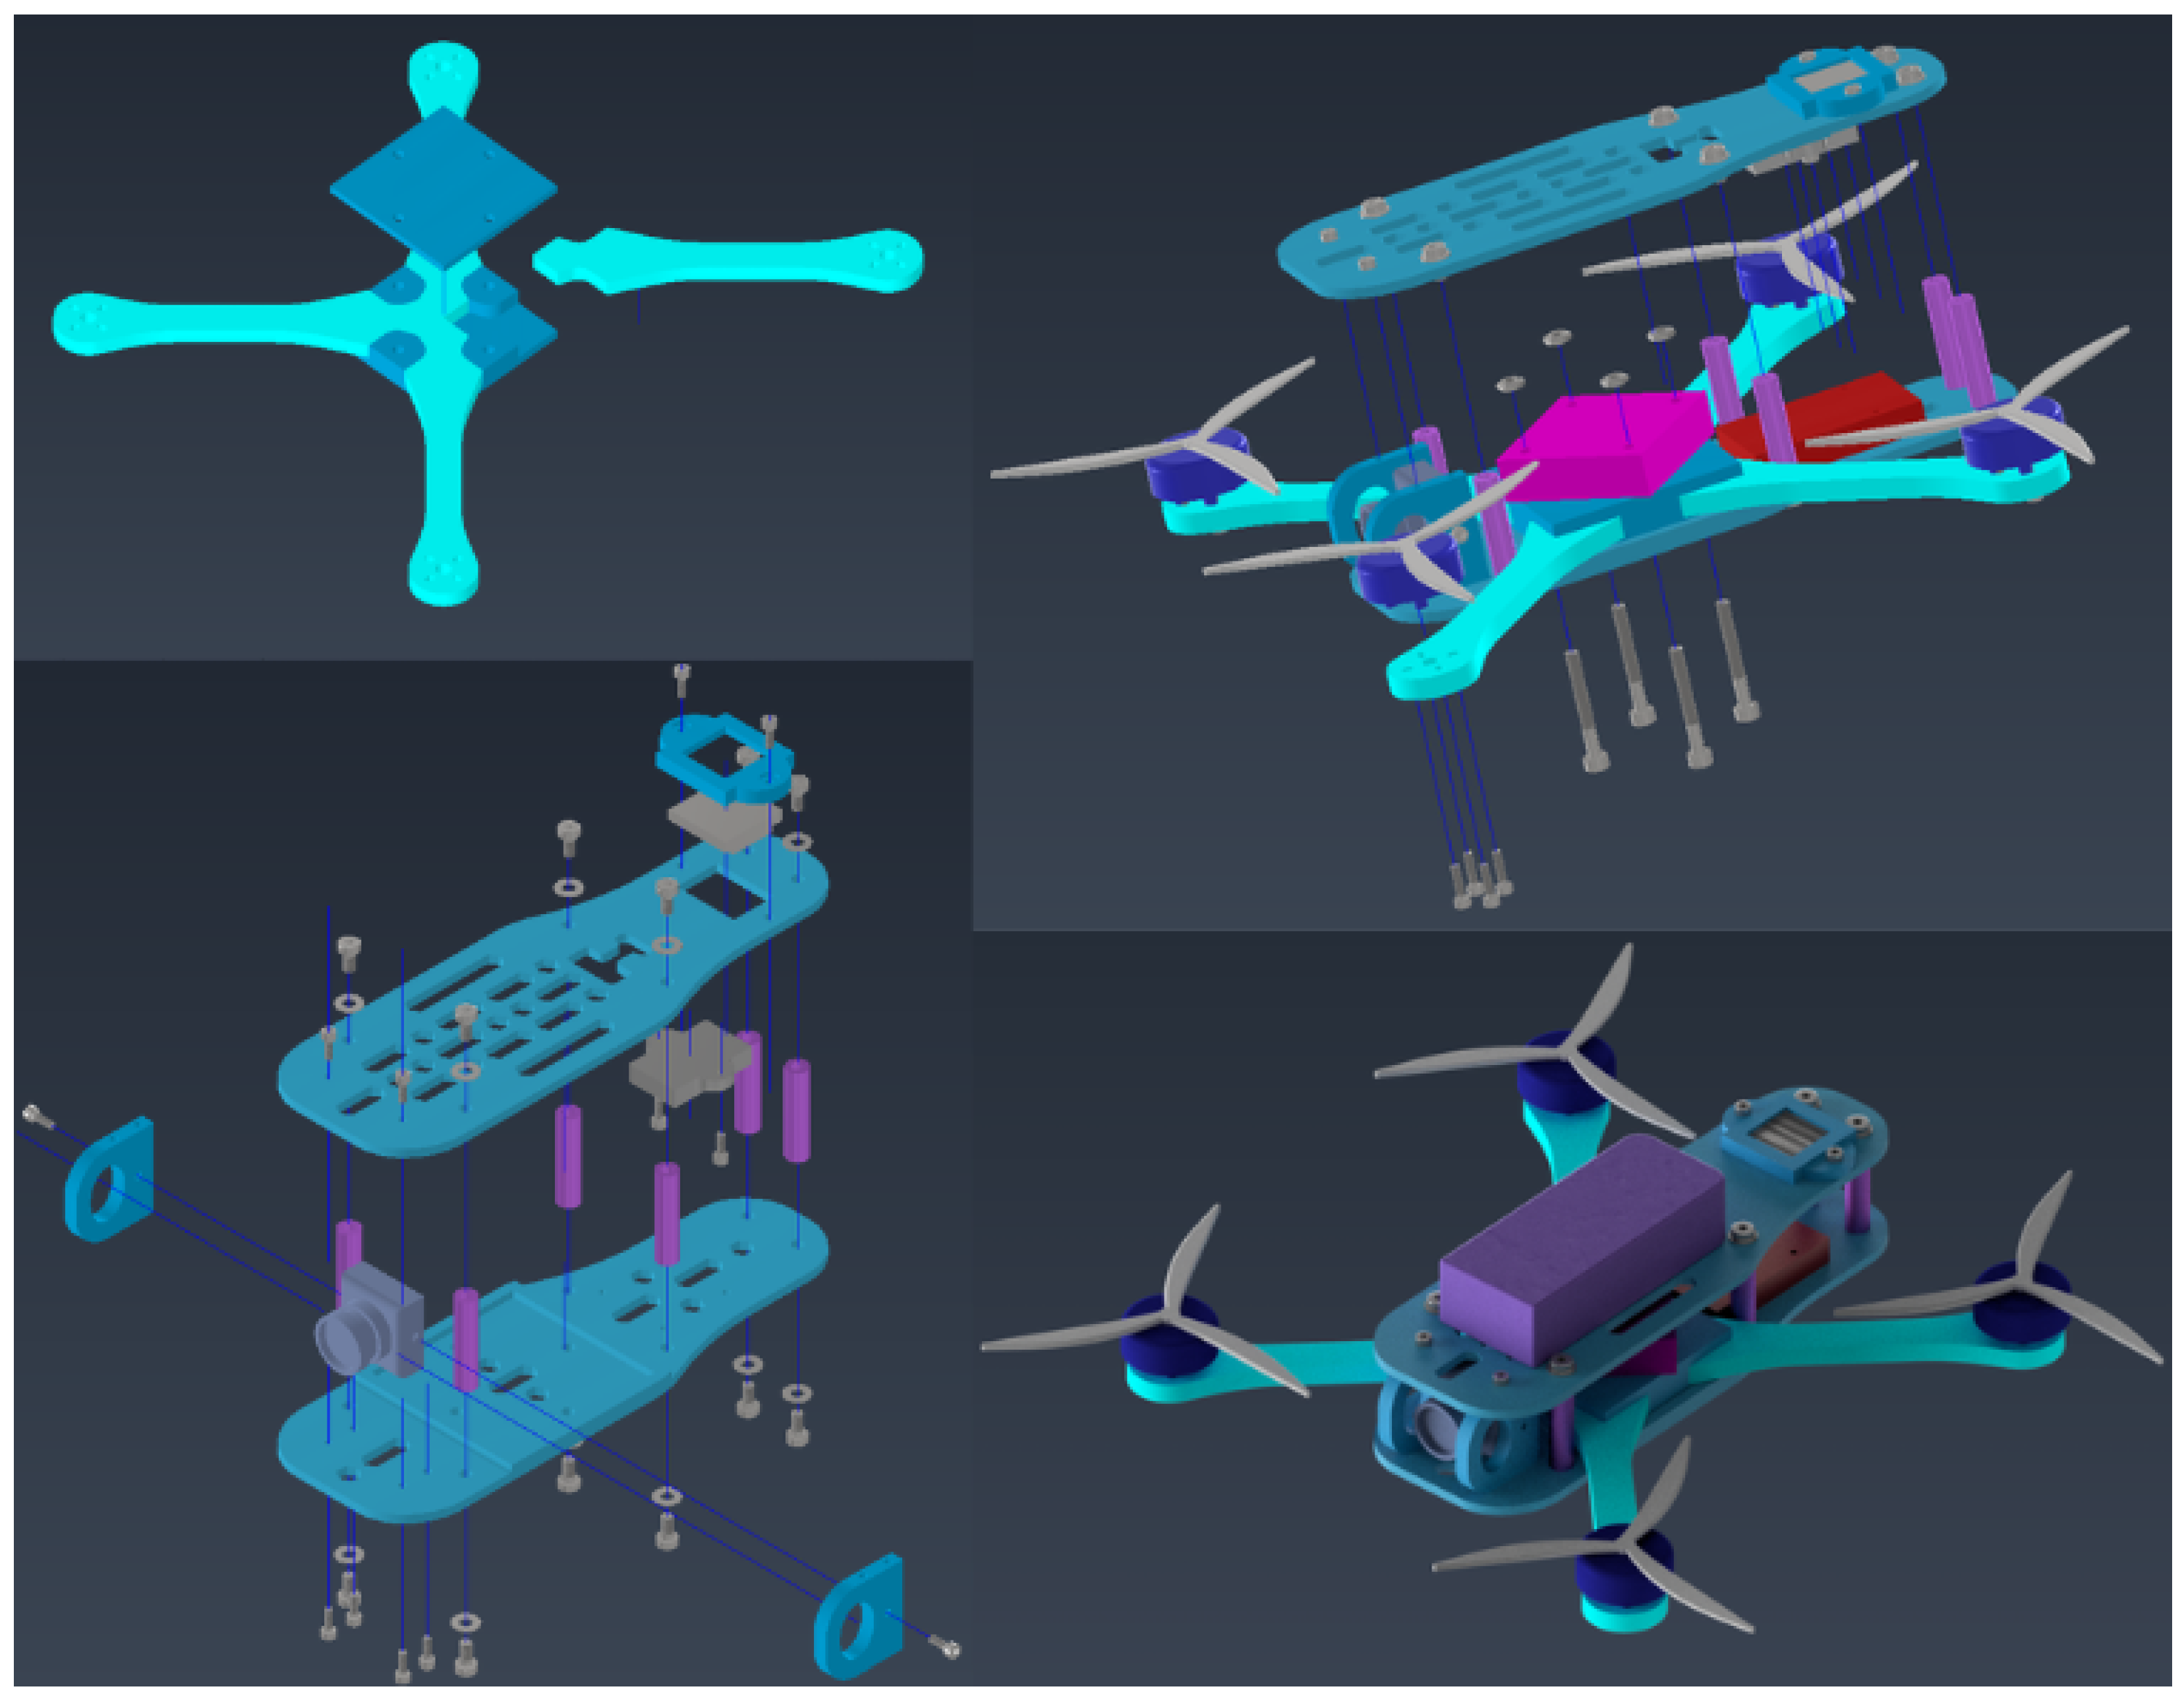
To guarantee the feasibility of physical assembly, systematic collision and interference checks were performed using the CAD software’s native tools. Exploded views and sectional cuts were also generated to facilitate inspection of internal critical areas and to support the later generation of assembly documentation.
Dimensional considerations were incorporated from this stage. Functional tolerances were defined in contact and mechanical fastening zones—particularly where sensitive electronic components are inserted or where concentrated loads act, such as at the arm–frame joints. These tolerances are reflected in the technical drawings generated from the assembled model.
The exploded views of the main sub-assemblies, along with the final assembled CAD model, are presented in Figure 2, offering a complete visualization of the UAV’s structural configuration.

3.2. Fabrication and 3D Printing via FDM Additive Manufacturing

Additive manufacturing, commonly known as 3D printing, has revolutionized manufacturing processes in recent years. Among the different available technologies, Fused Deposition Modeling (FDM) stands out for its accessibility, versatility, and low cost. This subsection describes the complete fabrication process of a custom drone chassis using FDM 3D printing, covering the preparation of digital files through to the final assembly of the device.

3.2.1. Slicing and Print Profiles

Prior to printing, the digital model must be prepared through a process known as slicing. This procedure divides the three-dimensional model into successive layers, thereby generating the instructions that the printer will follow during fabrication. Additionally, the appropriate selection of print profiles—parameters such as temperature, speed, and material type—is essential to guarantee the quality and strength of the final part. This subsection details the tools and key considerations for efficient slicing and optimal print profile configuration.The main 3D printing parameters used for the fabrication of the arms are summarized in Table 3.
In contrast to the arms, the drone base was designed prioritizing weight reduction without compromising the structural stiffness required to support electronic components. To achieve this, the print profile parameters were adjusted mainly by reducing infill density. This strategy produces a lighter part, reducing material consumption and print time—both critical in UAS design where total weight is a limiting parameter. The main 3D printing parameters used for the fabrication of the base are summarized in Table 4.
The remainder of the chassis components were printed following a strategy similar to that used for the base, employing moderate infill density and optimized parameters to reduce total weight without compromising functionality or structural integrity. This consistency in print configuration ensures homogeneous mechanical behavior of the assembled frame and greater efficiency in the fabrication process.

3.2.2. Assembly and Drone Construction

Once all parts composing the chassis and the structural elements have been printed, the assembly and construction phase of the drone is initiated. This stage is crucial, as it is where the electronic components responsible for the system’s overall operation are integrated.
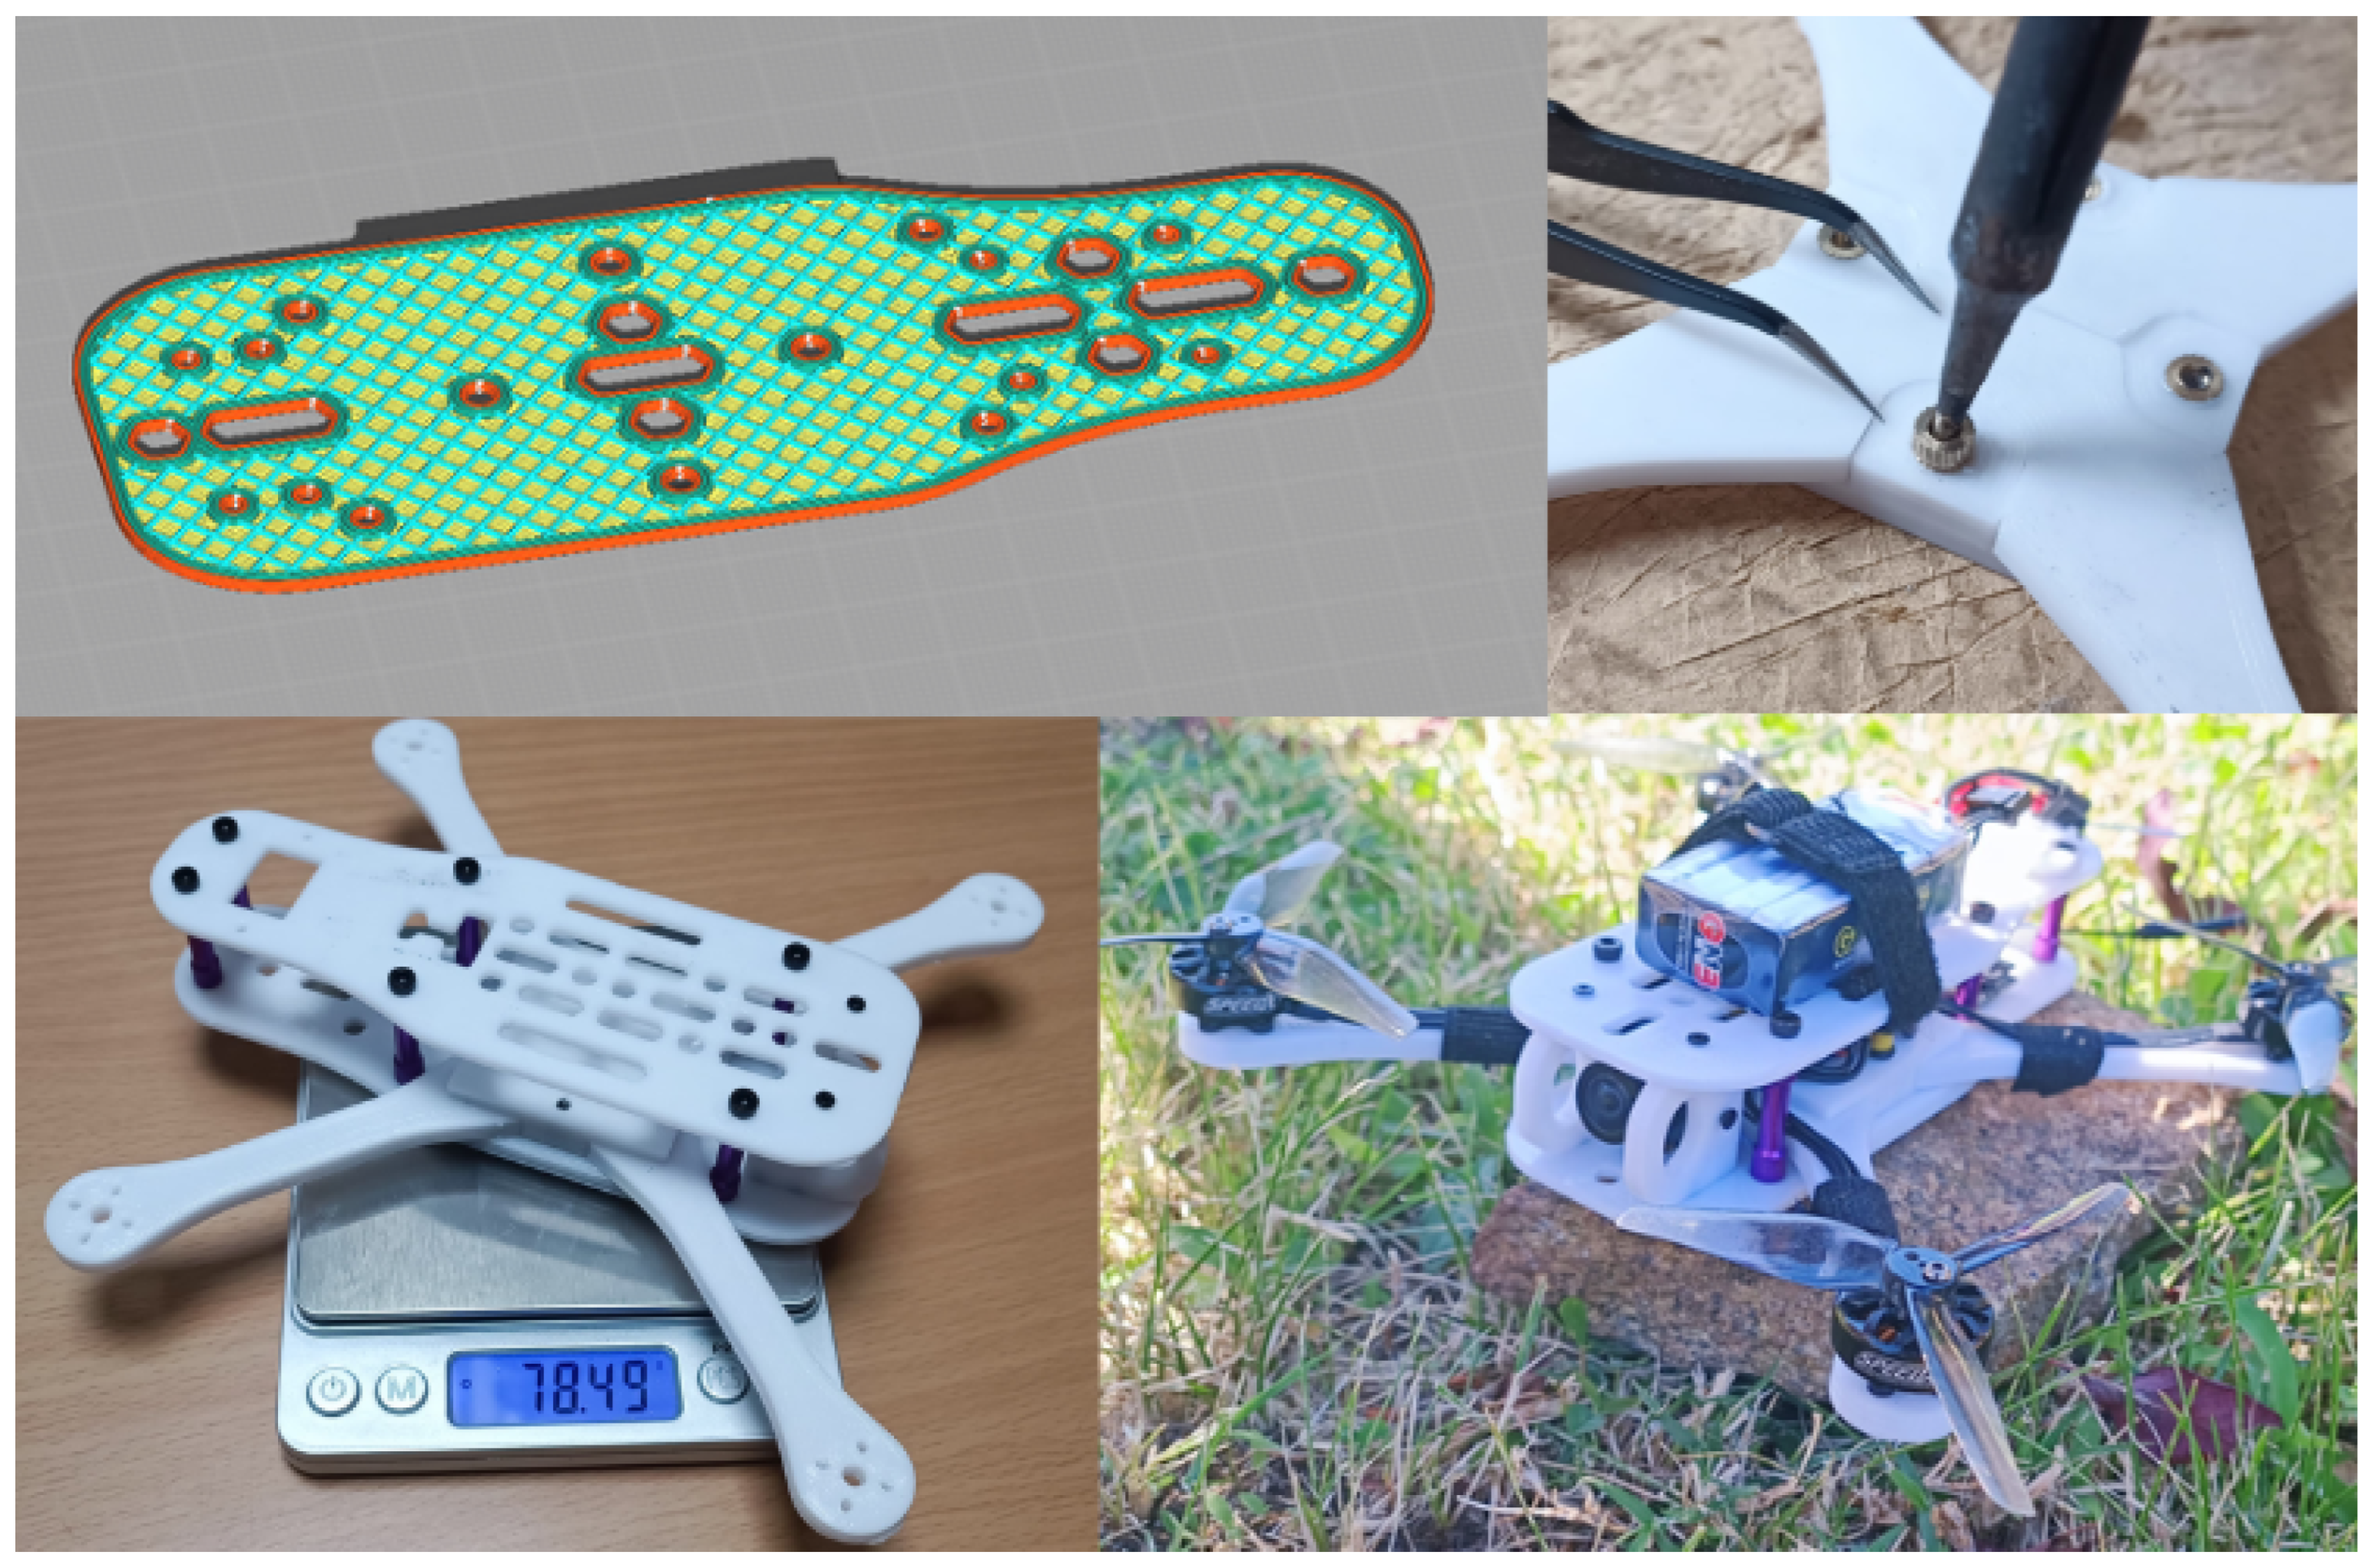
The process begins with the mechanical completion of the printed chassis. The total weight of the assembled frame is 78 g. A general view of the final printed assembly is shown in Figure 3, which illustrates the robustness of the printed structure and the quality of the FDM process prior to the integration of electronic subsystems.
After the successful fabrication and verification of the printed chassis, the next step consists of completing the drone assembly by integrating the electronic subsystems. This phase is crucial, since it transforms the printed structure into a functional aerial platform.
The process begins with the installation of the All-in-One Flight Controller (Flight Controller AIO), which centralizes functions such as stabilization, motor control, sensor reading, and command processing. The radio frequency receiver is then installed to capture the pilot’s control input, followed by the GPS Module required for advanced navigation, positioning, and Return-to-Home functions.
Subsequently, the Video Transmitter (VTX) is installed to provide the real-time video feed from the onboard camera to FPV goggles or an operator’s display. Finally, the motors are fixed to the arms and connected to the electronic speed controllers (ESCs), which may either be integrated into the AIO board or implemented externally.
All electronic connections were carried out in accordance with the wiring specifications provided by the manufacturers of each component, including the Flight Controller, receiver, VTX, and GPS. Following these guidelines ensured system compatibility and reduced the risk of faulty wiring.
During this phase, the use of specific tools—precision screwdrivers, a fine-tip soldering iron, a multi-meter, and anti-static tweezers—is recommended. It is also essential to pay attention to cable routing and cleanliness, ensuring solid connections protected against vibration to guarantee optimal performance in flight and to minimize the risk of failures during operation. The fully assembled drone can be seen at Figure 3.

3.3. Structural Analysis of the Chassis by Finite Element Simulation (FEM)

The objective of this work is to analyze the mechanical behavior of the primary structure of a quad-X configuration drone chassis, focusing on the cross-shaped structural element formed by the arms and the central frame that joins them. This part is responsible for transmitting aerodynamic loads and impacts. The remainder of the frame—comprising the platforms where components such as the battery and controllers are mounted—is bolted in a sandwich arrangement over this cross but does not contribute significantly to the load-bearing function. This supporting platform has therefore been excluded from the model to simplify and accelerate calculations without compromising the validity of the analysis.
The analysis was performed using the Finite Element Analysis (FEA) method. FEA allows subdivision of a complex geometry into simpler elements where equilibrium equations are solved to obtain stress, strain, and displacement fields. This methodology is especially suitable for complex geometries, anisotropic materials, such as 3D-printed plastics, and variable loading conditions, as in the case of a drone [21,22]. FEA enables the prediction of material behavior prior to manufacture, reducing test costs and development time [23].

3.3.1. Model and General Conditions

The chassis cross was modeled as an .iam assembly with motion constraints applied to its components—it was effectively treated as a solid assembly whose mechanical properties correspond to PETG. The following simplifications were considered:
  • The model excludes motors and electronics, which are represented as equivalent concentrated loads.
  • The mesh is refined in critical regions: joints, arm ends and the base of the frame, following best practices in FEM with Inventor Nastran [24,25].

3.3.2. PETG Material Properties

FDM-printed plastics exhibit anisotropic behavior; mechanical properties vary with build orientation. For example, studies show that the “Young’s modulus” and “tensile strength” differ significantly between XY and Z directions [26,27,28]. Likewise, process parameters such as “extrusion temperature, printing speed, layer height, and infill density” strongly affect the mechanical performance [28]. Finite element modeling and homogenization techniques have also been applied to derive effective stiffness matrices, demonstrating that PETG can be described as a “transversely isotropic material” [27,29]. Other works focus on “reinforced PETG composites,” investigating tensile, flexural, and compressive behavior, with validation by both simulation and experiments [30]. More recently, reviews emphasize the influence of parameters such as “nozzle temperature, bed temperature, speed, layer height, and infill density” on mechanical strength [31].
A summary of the material properties used is presented in Table 5.

3.3.3. Failure Criteria Employed

Three methods were employed to evaluate the potential for structural failure depending on the loading type and analysis objective:
  • Von Mises criterion: useful to predict yielding in ductile materials. Applied mainly under multi-axial stress states such as impacts or manoeuvres with acceleration [32].
  • Maximum principal stress criterion: more conservative, used in uniaxial loading conditions or to verify areas with high stress concentrations [32].
  • Maximum strain criterion: particularly relevant for anisotropic materials like 3D-printed plastics, where excessive deformation in the Z-direction can cause layer delamination [33,34,35].
The component is considered to have failed if the following occur:
  • The Von Mises stress exceeds the material’s yield strength in the corresponding direction [32].
  • The strain in the Z-direction surpasses 5% [33,34].

3.4. Study Cases

The structural evaluation of the drone chassis was conducted under representative flight conditions using the Finite Element Method (FEM). Different load cases were simulated in order to determine the structural integrity, stress distribution, and deformation of the printed frame. The first case corresponds to hovering flight, which establishes a reference baseline for subsequent analyses under more demanding manoeuvres.

3.4.1. Hovering Flight Analysis

In this scenario, the drone is simulated under steady hovering conditions, where the lift force generated by the rotors exactly balances the vehicle’s weight. This represents the baseline structural load case and serves as a reference for more complex operational scenarios. The load distribution is assumed to be uniform across the four arms, enabling a straightforward evaluation of stresses, displacements, and the safety factor using the Finite Element Method (FEM).
  • FEM Study For this condition, the drone’s total mass of 250 g is evenly distributed among the four arms:
Mass per arm = Total mass 4 = 250 g 4 = 62.5 g = 0.0625 kg
Applying Newton’s second law, the equivalent force acting on each arm is:
F = m · g = 0.0625 kg · 9.81 m / s 2 = 0.613 N
The total force generated by the four rotors is therefore:
F total = 4 · 0.613 N = 2.452 N
The resulting vertical acceleration is:
a = F total m drone = 2.452 0.250 = 9.81 m / s 2
a G = a g = 9.81 9.81 = 1.0 G
This case corresponds to a hovering flight condition with a vertical acceleration of 1.0 G representing static lift equilibrium. The parameters applied in the simulation are summarized in Table 6.
The PETG used for the 3D-printed chassis has an approximate yield strength of:
σ limit = 40 MPa
The maximum Von Mises stress obtained in this case is:
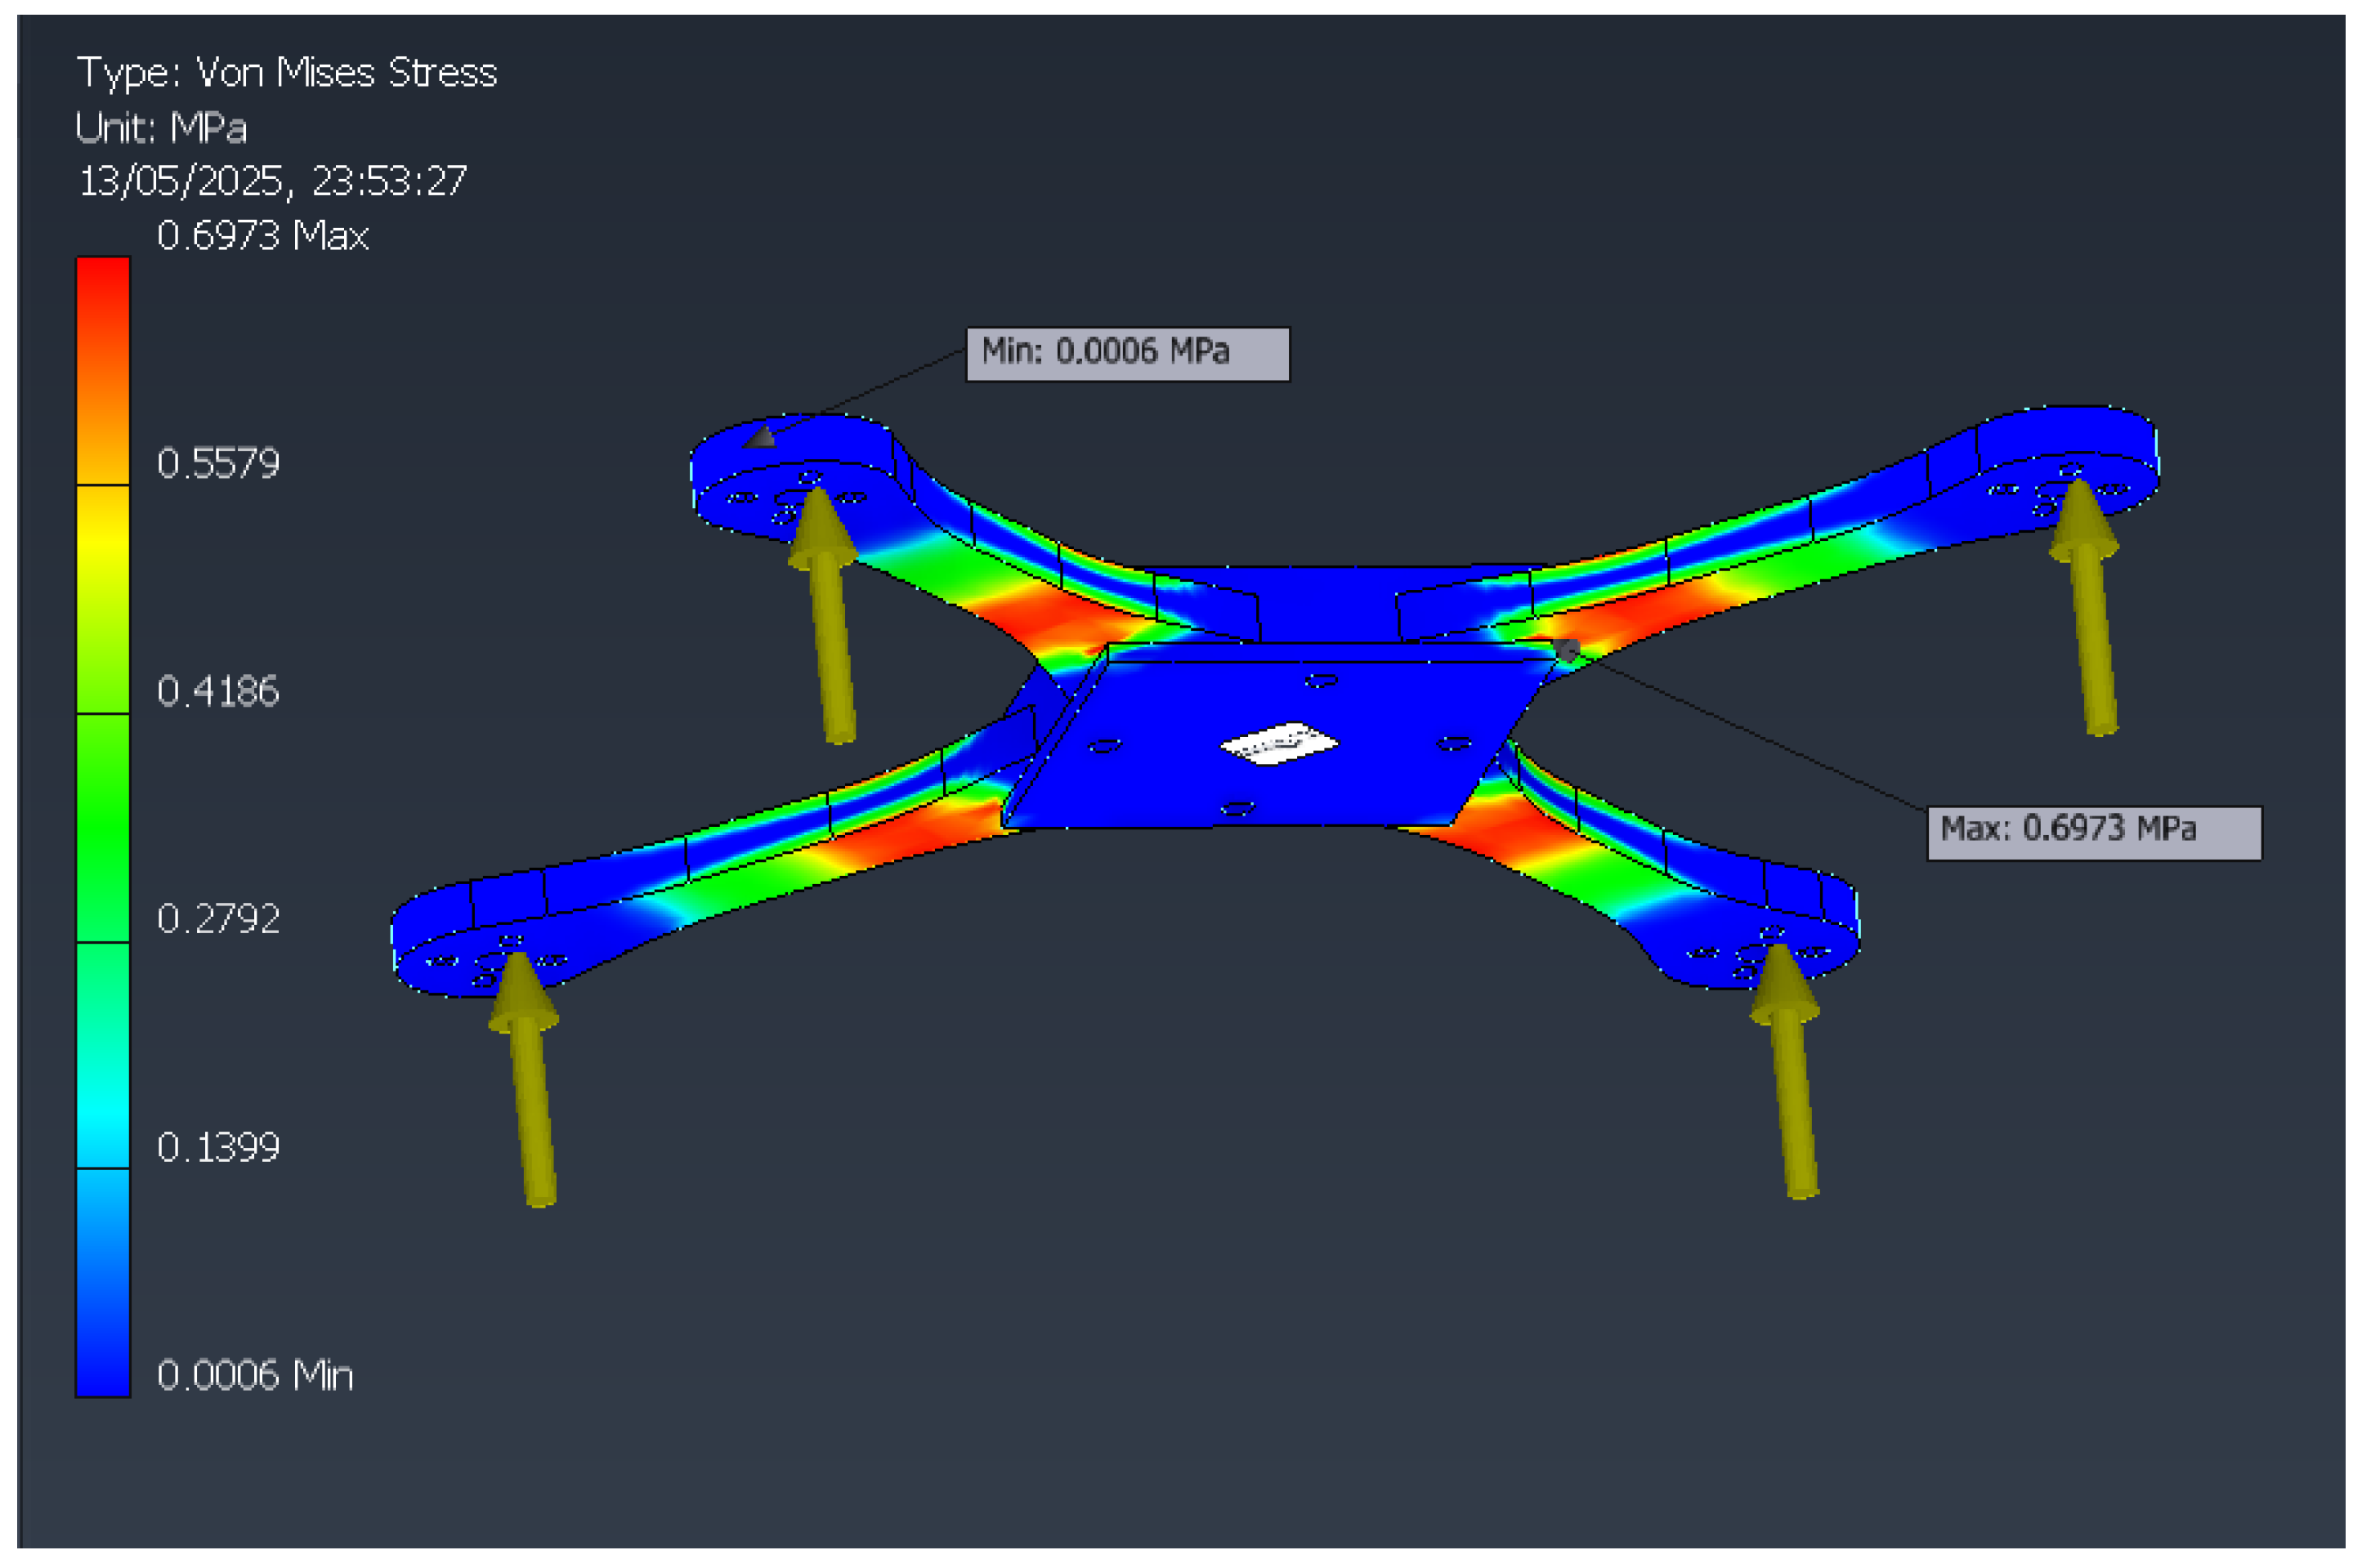
σ VM = 0.6973 MPa
The resulting safety factor is:
SF = σ limit σ VM = 40 0.6973 57.36
This indicates that, under normal hovering conditions, the structure operates far below its material limit, with a very wide safety margin (Table 7).
  • Results Analysis
Figure 4 shows the distribution of Von Mises stresses, with maximum concentrations at the arm–chassis junction. Figure 5 indicates that the maximum displacement ( 0.234  mm) occurs at the free ends of the arms.
  • Simplified beam model validation
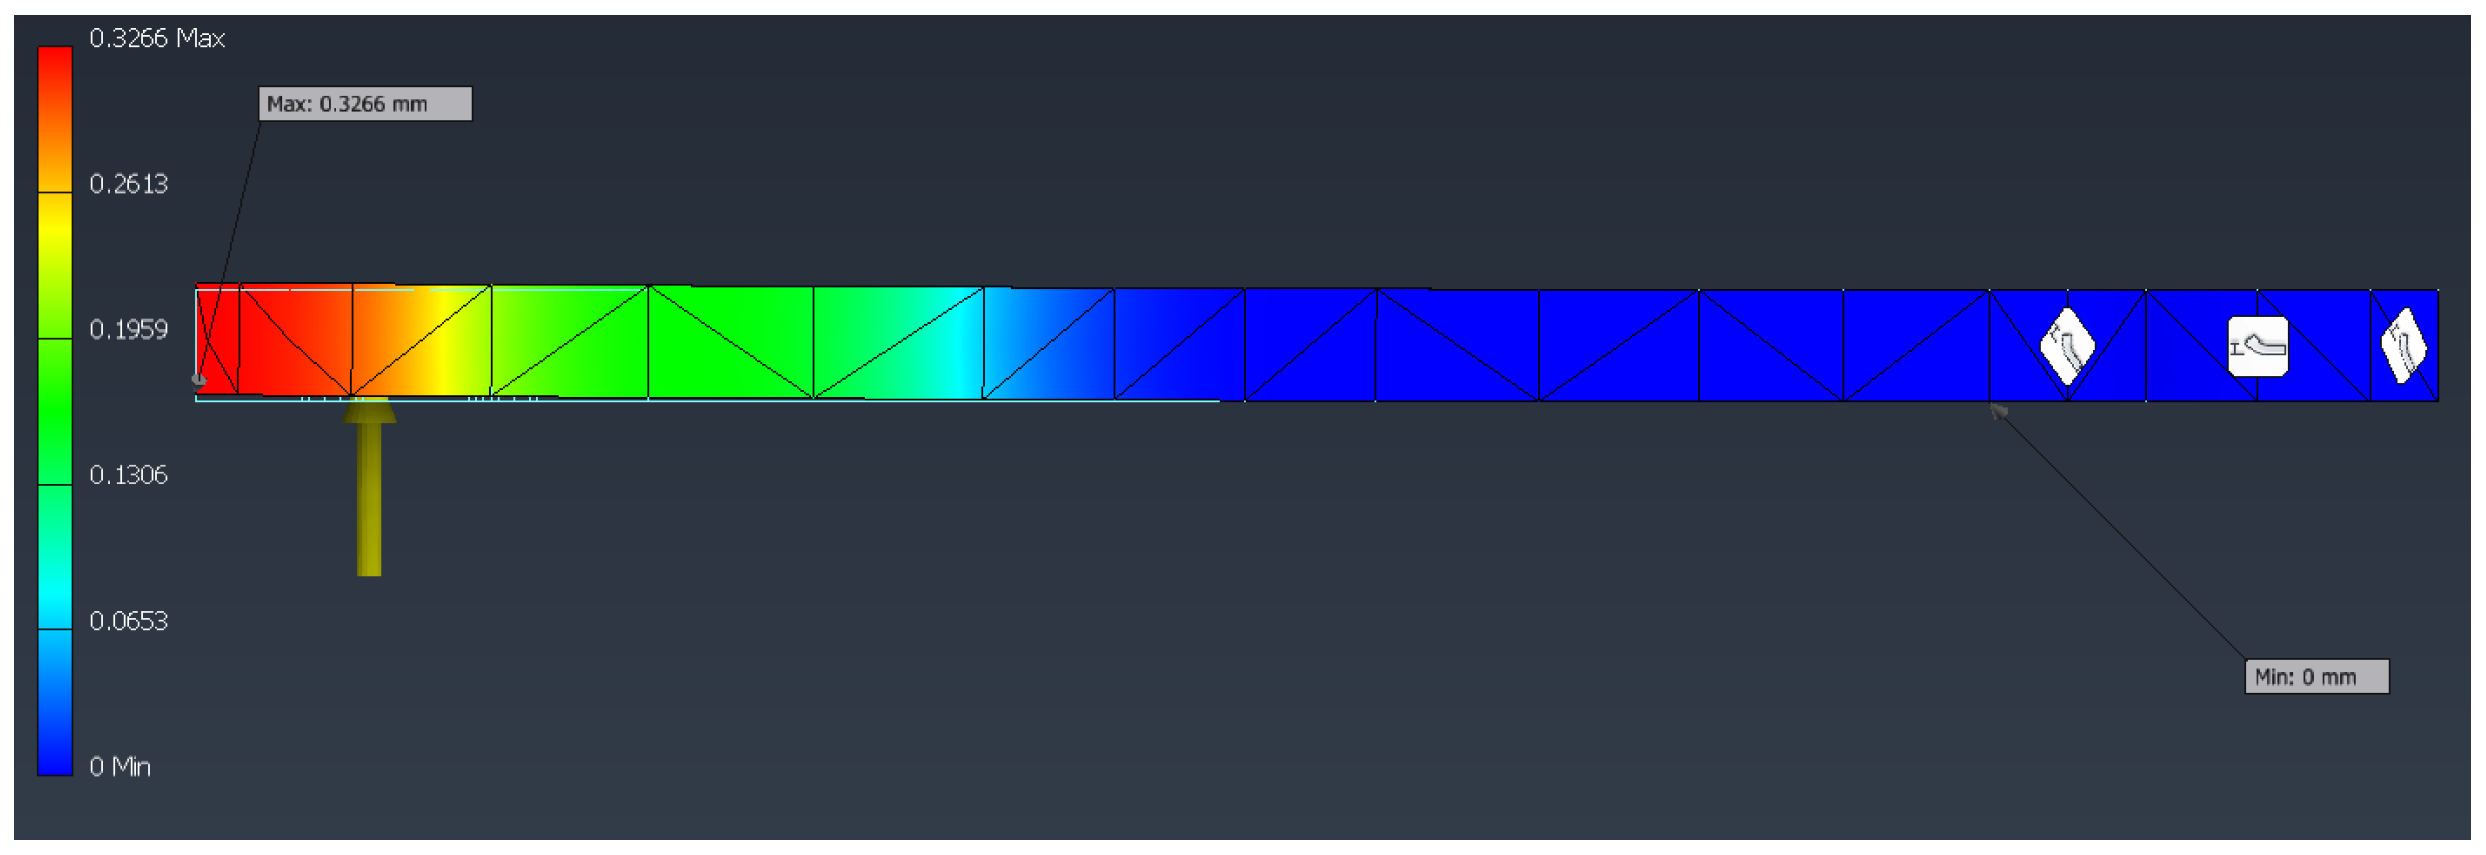
To validate the numerical simulations, a simplified theoretical model was implemented, representing the drone arm as a cantilever beam with an equivalent rectangular cross-section. This approximation provides a first-order estimation of stresses and displacements and allows comparison with the results obtained from FEM simulations of both the individual arm and the fully assembled structure.
Model data:
  • Cantilever beam with rectangular cross-section
  • Length: L = 70 mm
  • Width: b = 10 mm
  • Height: h = 5 mm
  • Point load: F = 0.625 N applied at the free end in + Z direction
  • Young’s modulus (PETG): E = 2.1 × 10 9 Pa
Calculations
I = b h 3 12 = 1.0417 × 10 10 m 4
δ max = F L 3 3 E I 0.327 mm
M max = F · L = 0.04375 Nm
σ max = M max · c I = 1.05 MPa
σ vm = | σ | = 1.05 MPa
Comparison of results: To compare the simplified model against numerical simulations, a load of 0.625 N was applied, corresponding to the thrust generated by a single motor under hovering conditions. Table 8 summarizes the results.
The simplified beam model provides a conservative estimate of stresses and displacements. As expected, the inclusion of the actual geometry and the structural connection of the arm to the chassis increases stiffness, thereby reducing both stresses and deflections under identical load conditions. The difference between the individual arm and the assembled model is mainly attributed to the boundary conditions: in the assembled configuration, the frame corner acts as a stiffer constraint, reducing the effective bending moment.
The results obtained from the mechanical and static analyses confirm the validity of the PETG model under the expected operating conditions. The relatively low applied loads, the limited Von Mises stresses, and the small displacements observed indicate that the structure operates well within safe limits, thus validating the chosen manufacturing process and material assumptions. Consequently, these findings support the feasibility of future production using carbon fiber composites, which, due to their significantly higher stiffness and strength, would further enhance the structural performance and reliability of the final design.
The FEM results for the individual arm under hovering load are shown in Figure 6 and Figure 7.

3.4.2. FEM Structural Study at Maximum Motor Thrust (10.4 G)

This analysis evaluates the structural behavior of the 3D-printed frame under the most demanding loading scenario: the maximum thrust is delivered by the motors at full throttle. Unlike the hovering condition, this case does not represent a realistic steady flight state but rather an idealized vertical acceleration situation, introduced to assess the structural safety margins of the chassis under extreme conditions.
  • FEM Study
When the motors operate at 100% throttle, each motor produces a thrust of approximately 650 g (647 g according to the manufacturer’s data sheet). The model assumes that the total thrust acts directly on the arms, while the central base of the frame is fully constrained. This conservative simplification allows a direct evaluation of the maximum stresses and displacements that the structure could undergo. A summary of the simulation conditions can be found in Table 9.
Thrust per arm = 650 g = 0.650 kg
F = m · g = 0.650 kg · 9.81 m / s 2 = 6.38 N
F total = 4 · 6.38 N = 25.51 N
a = F total m drone = 25.51 0.250 102.02 m / s 2 10.4 G
  • Results
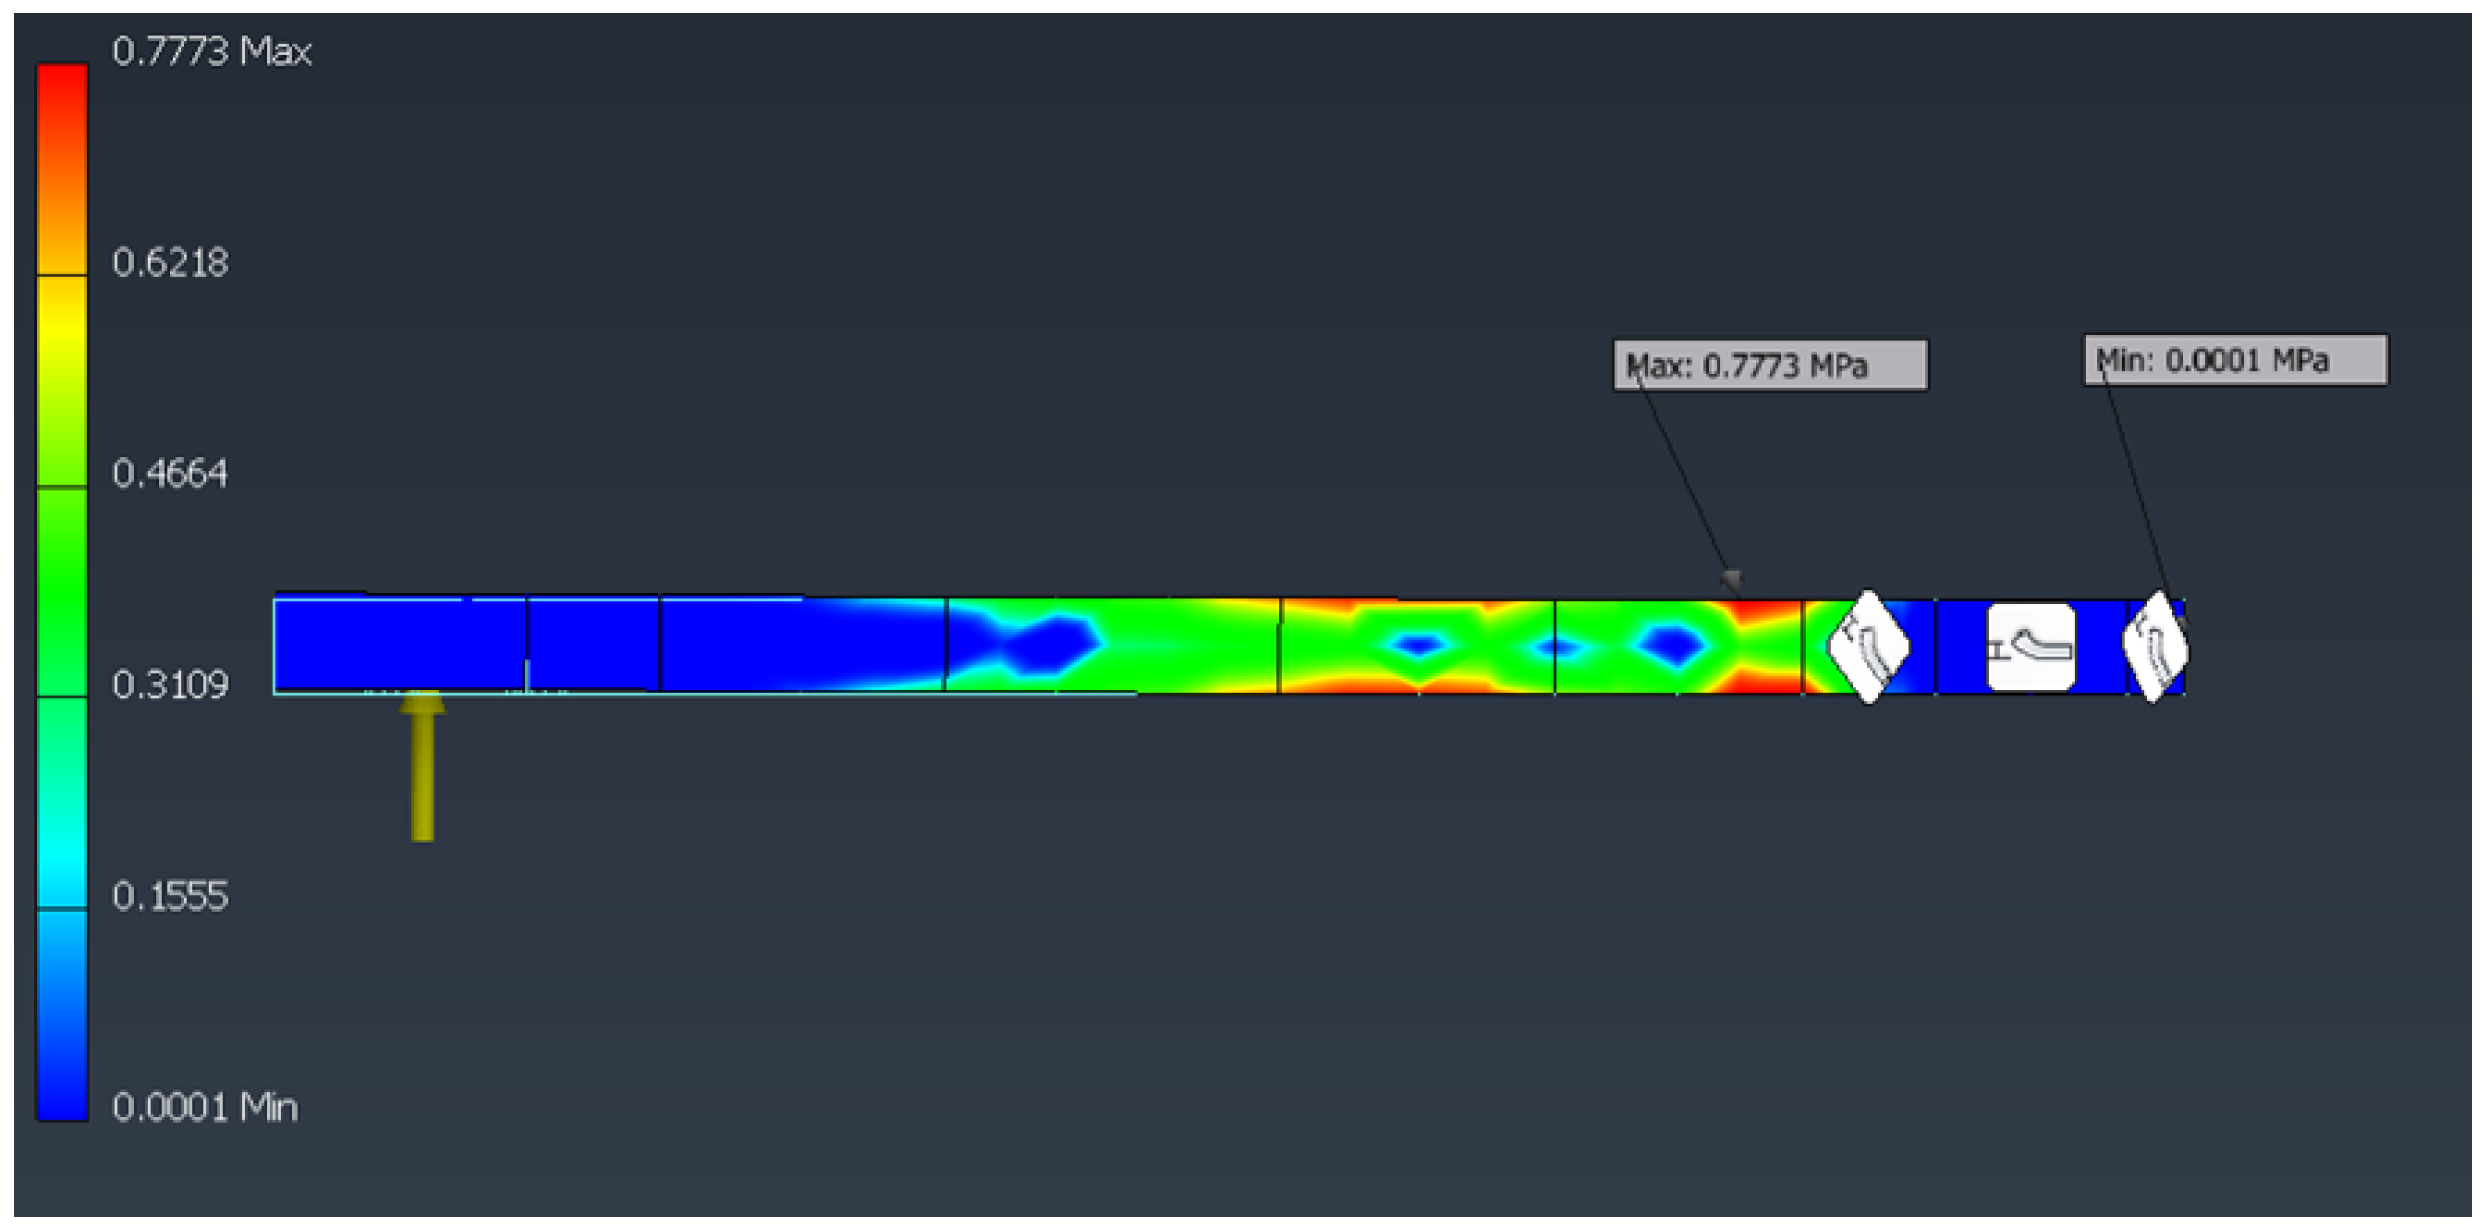
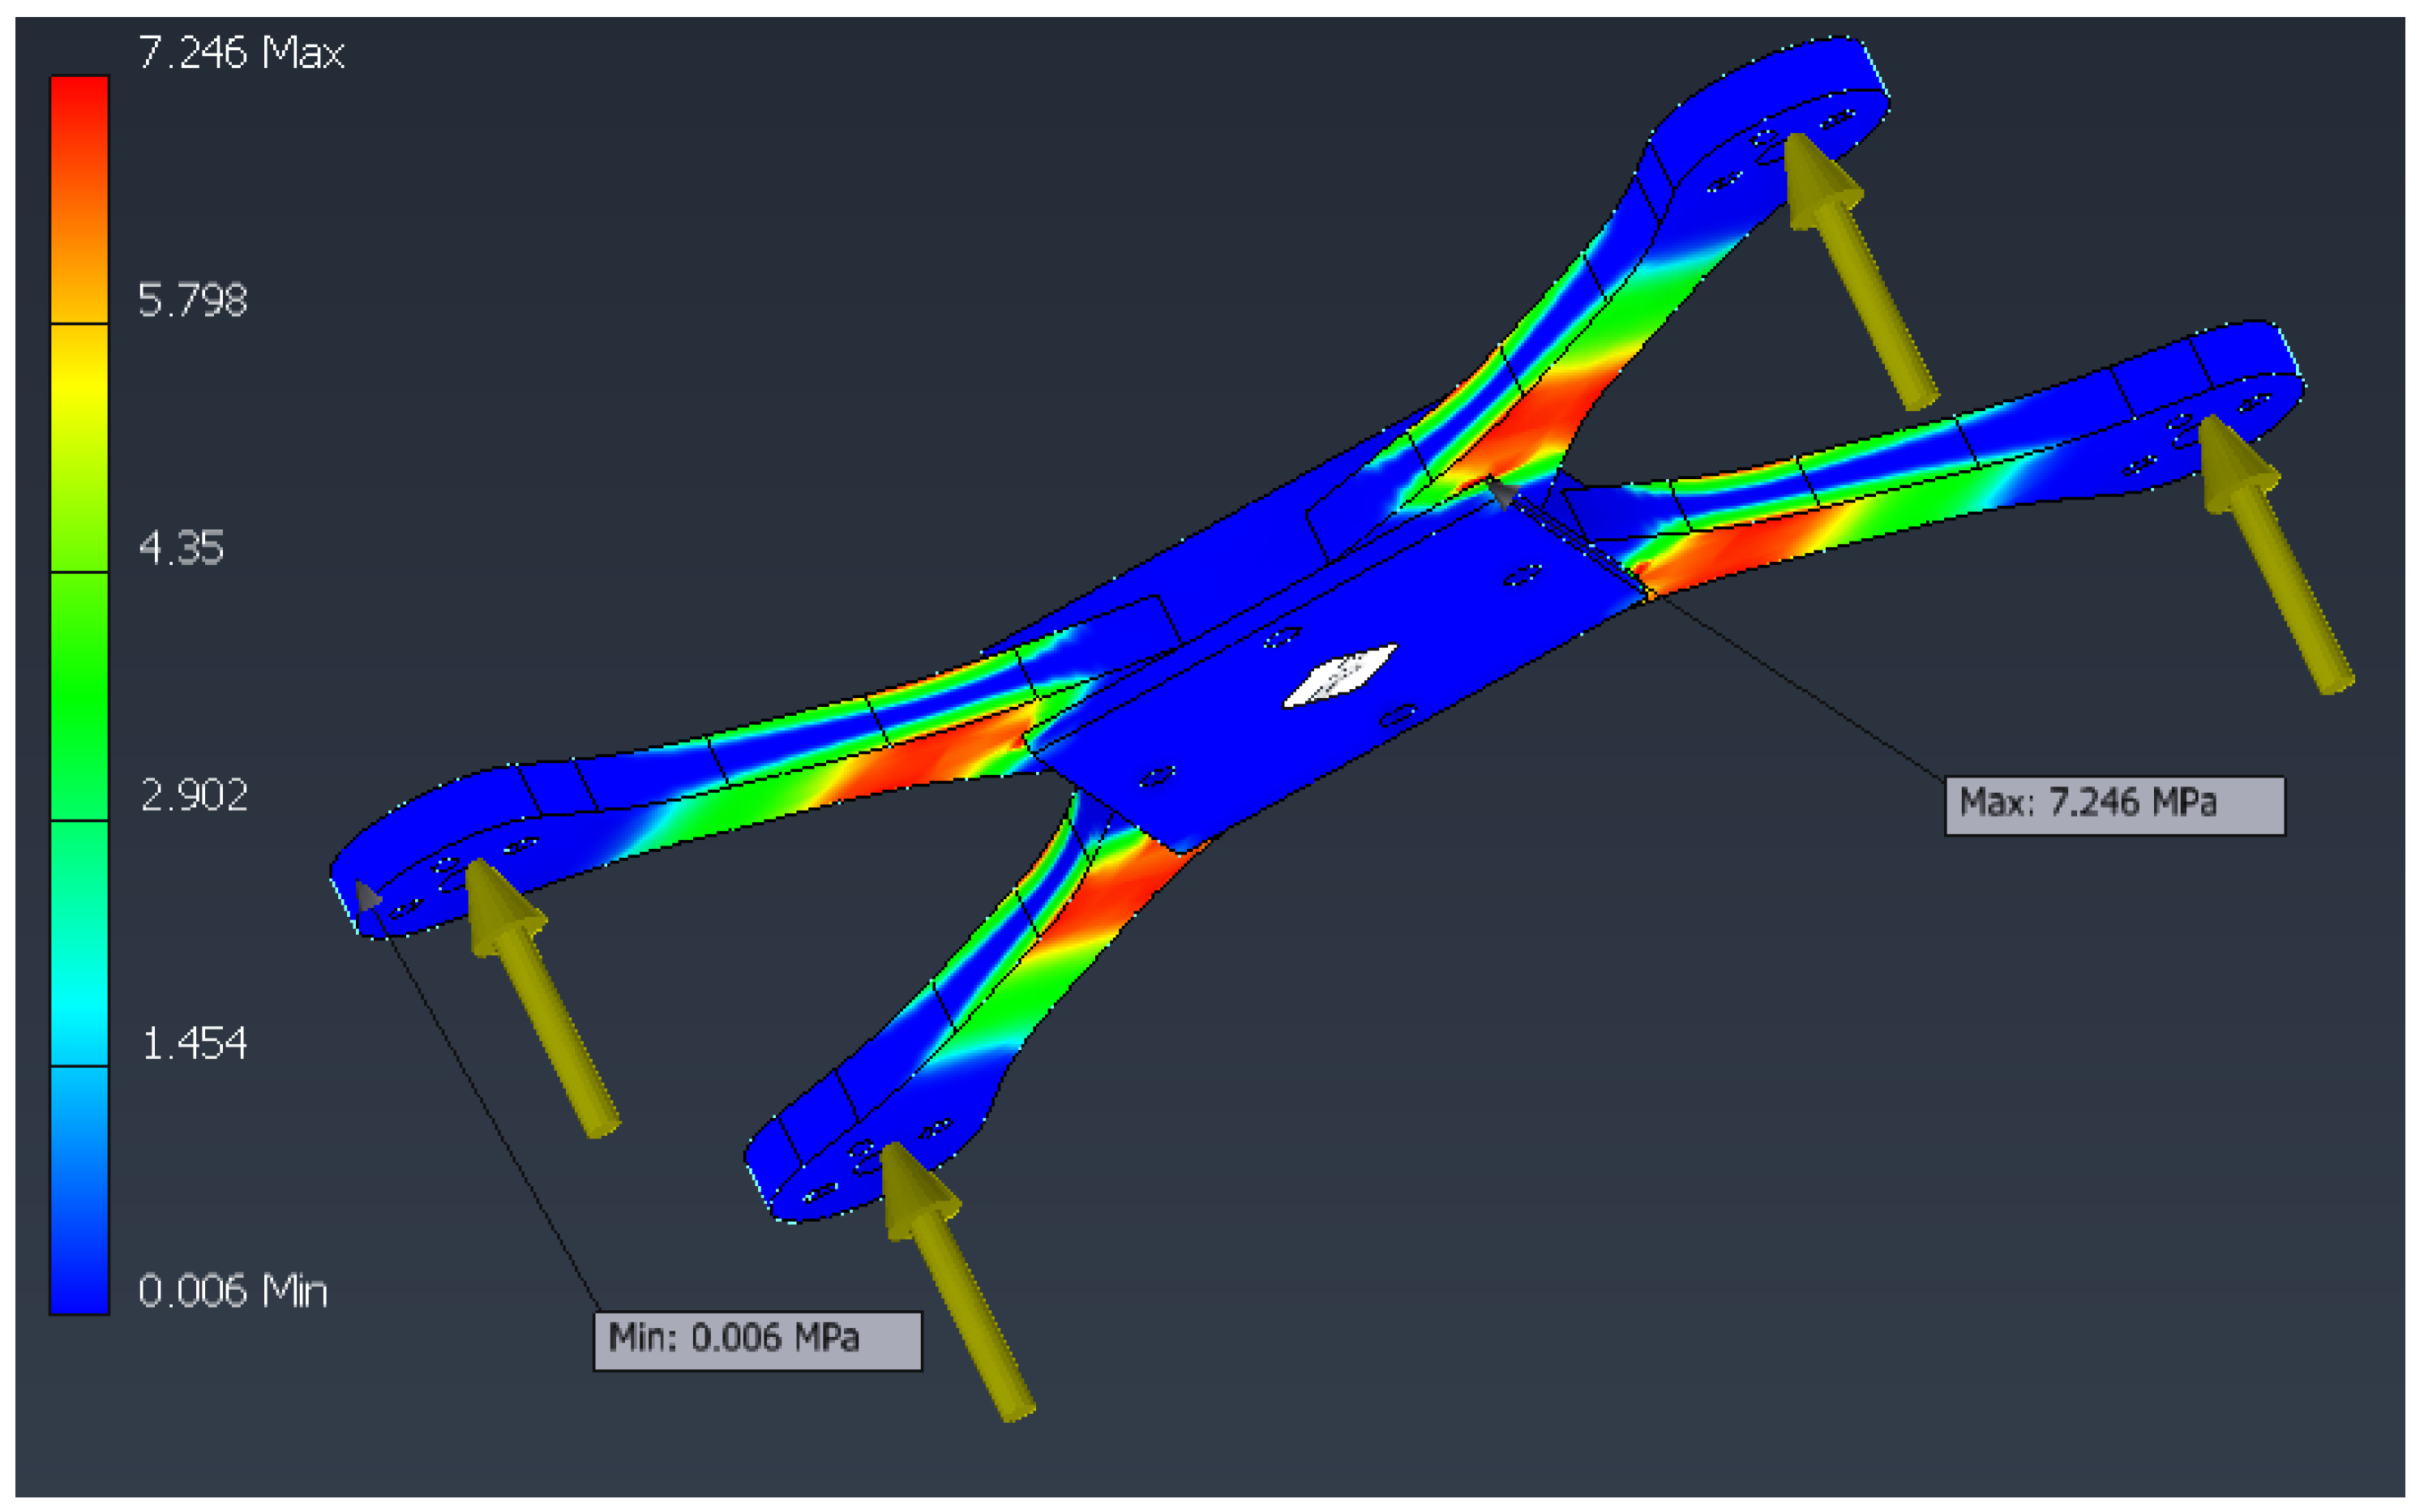
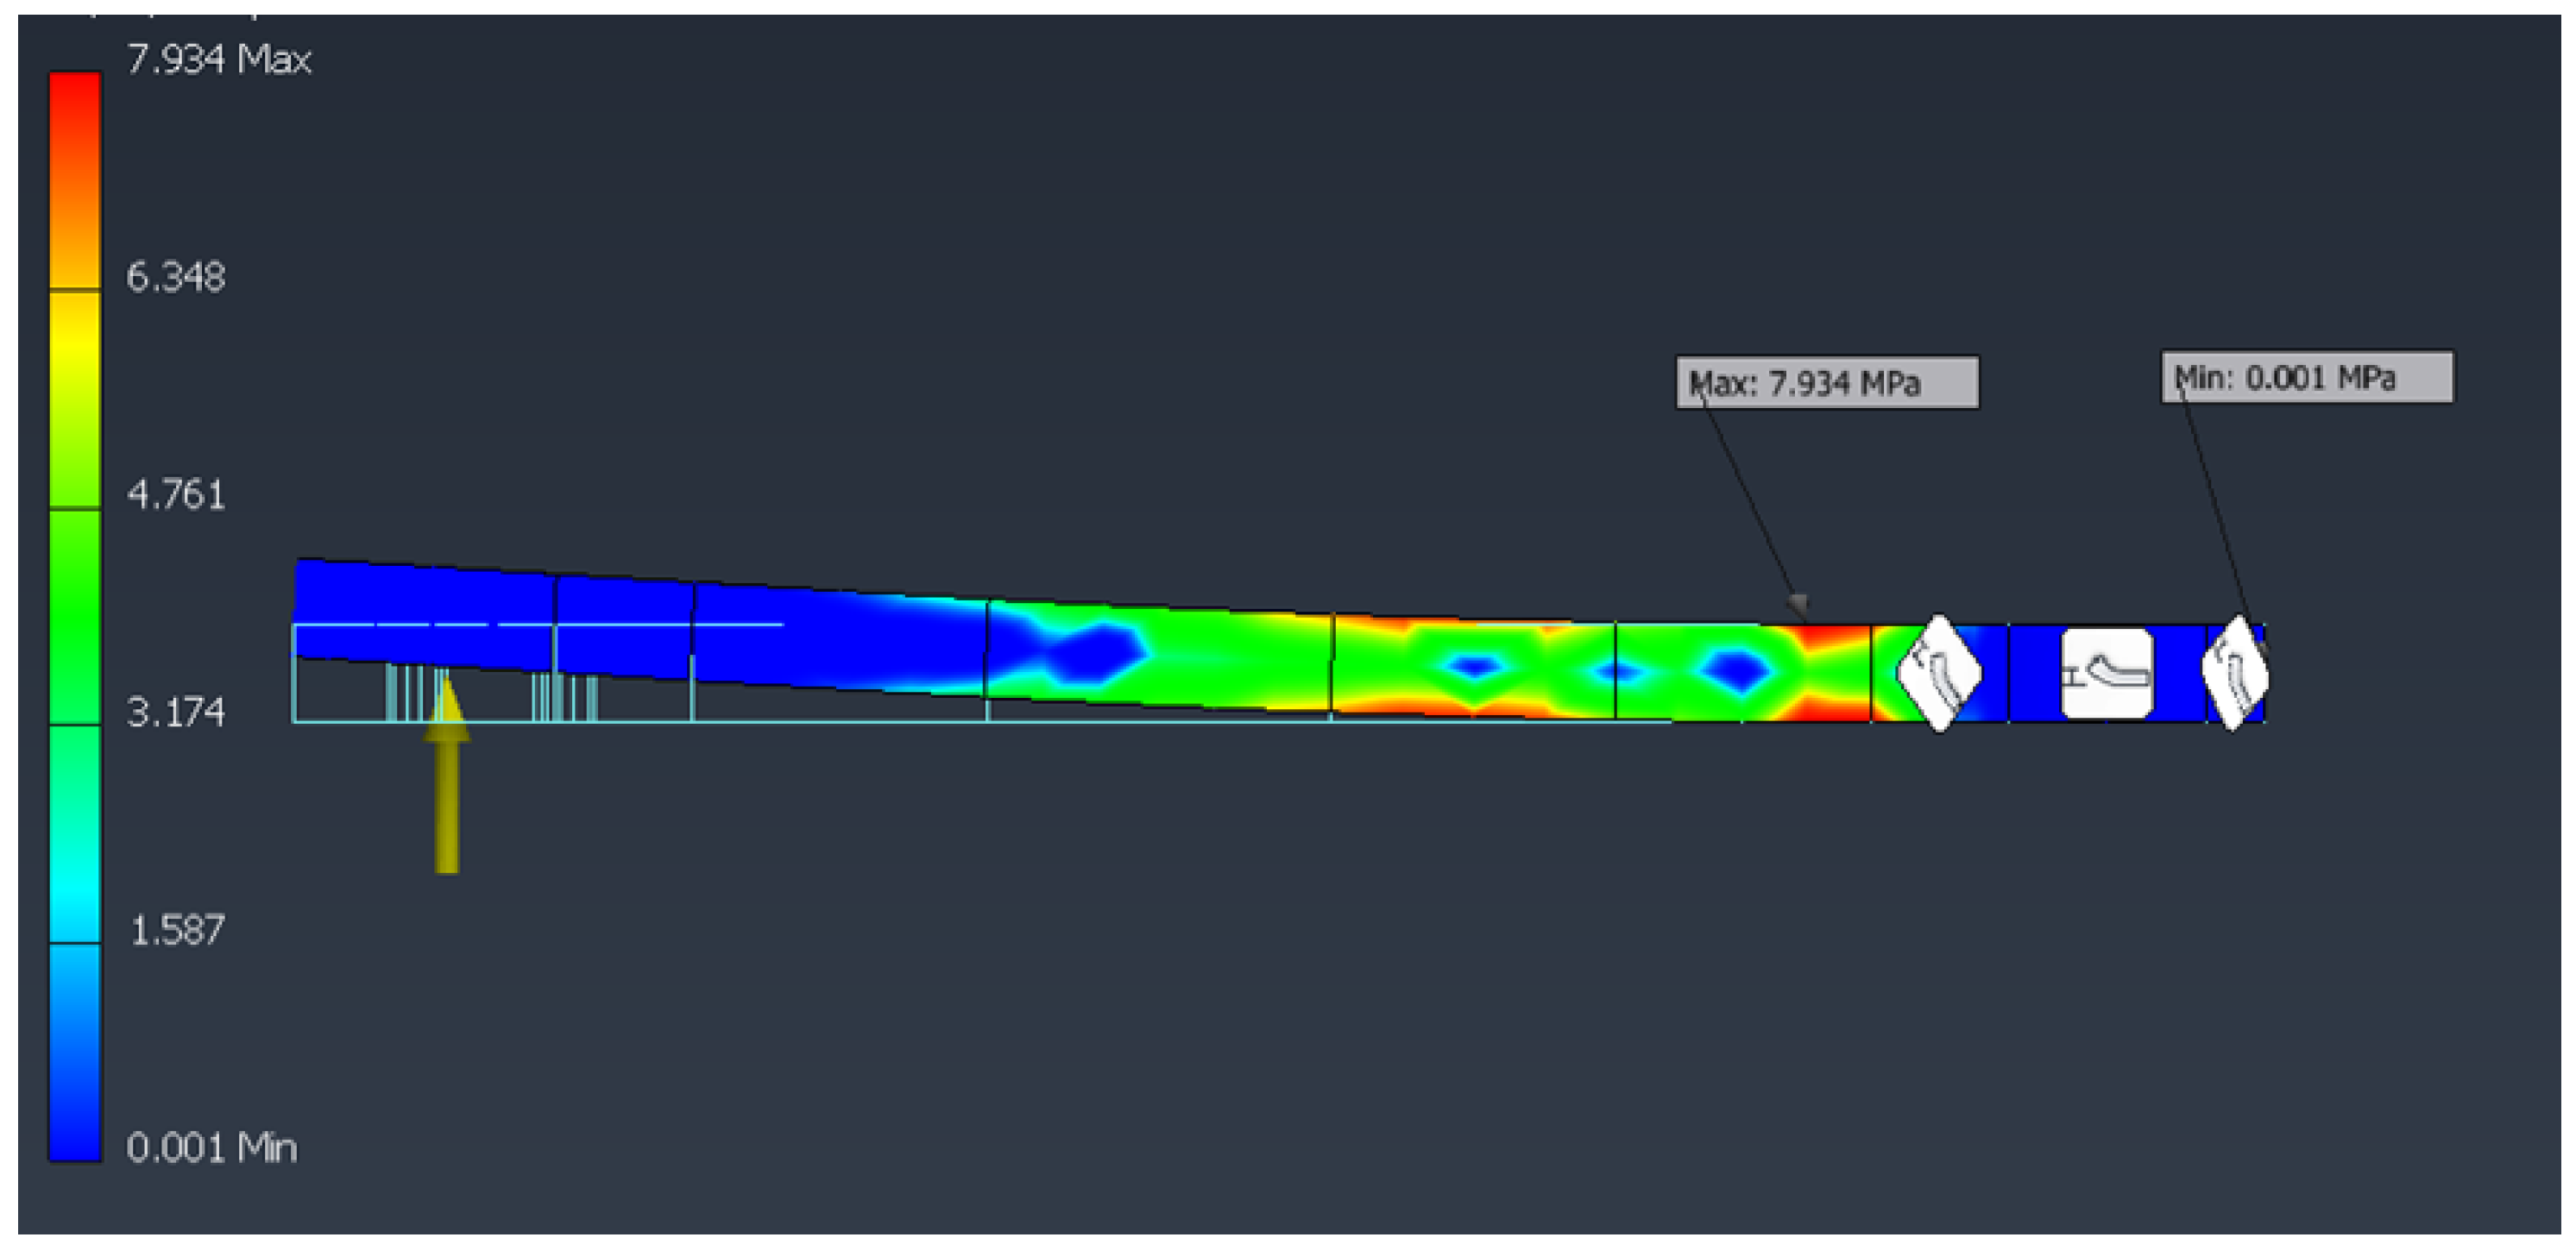
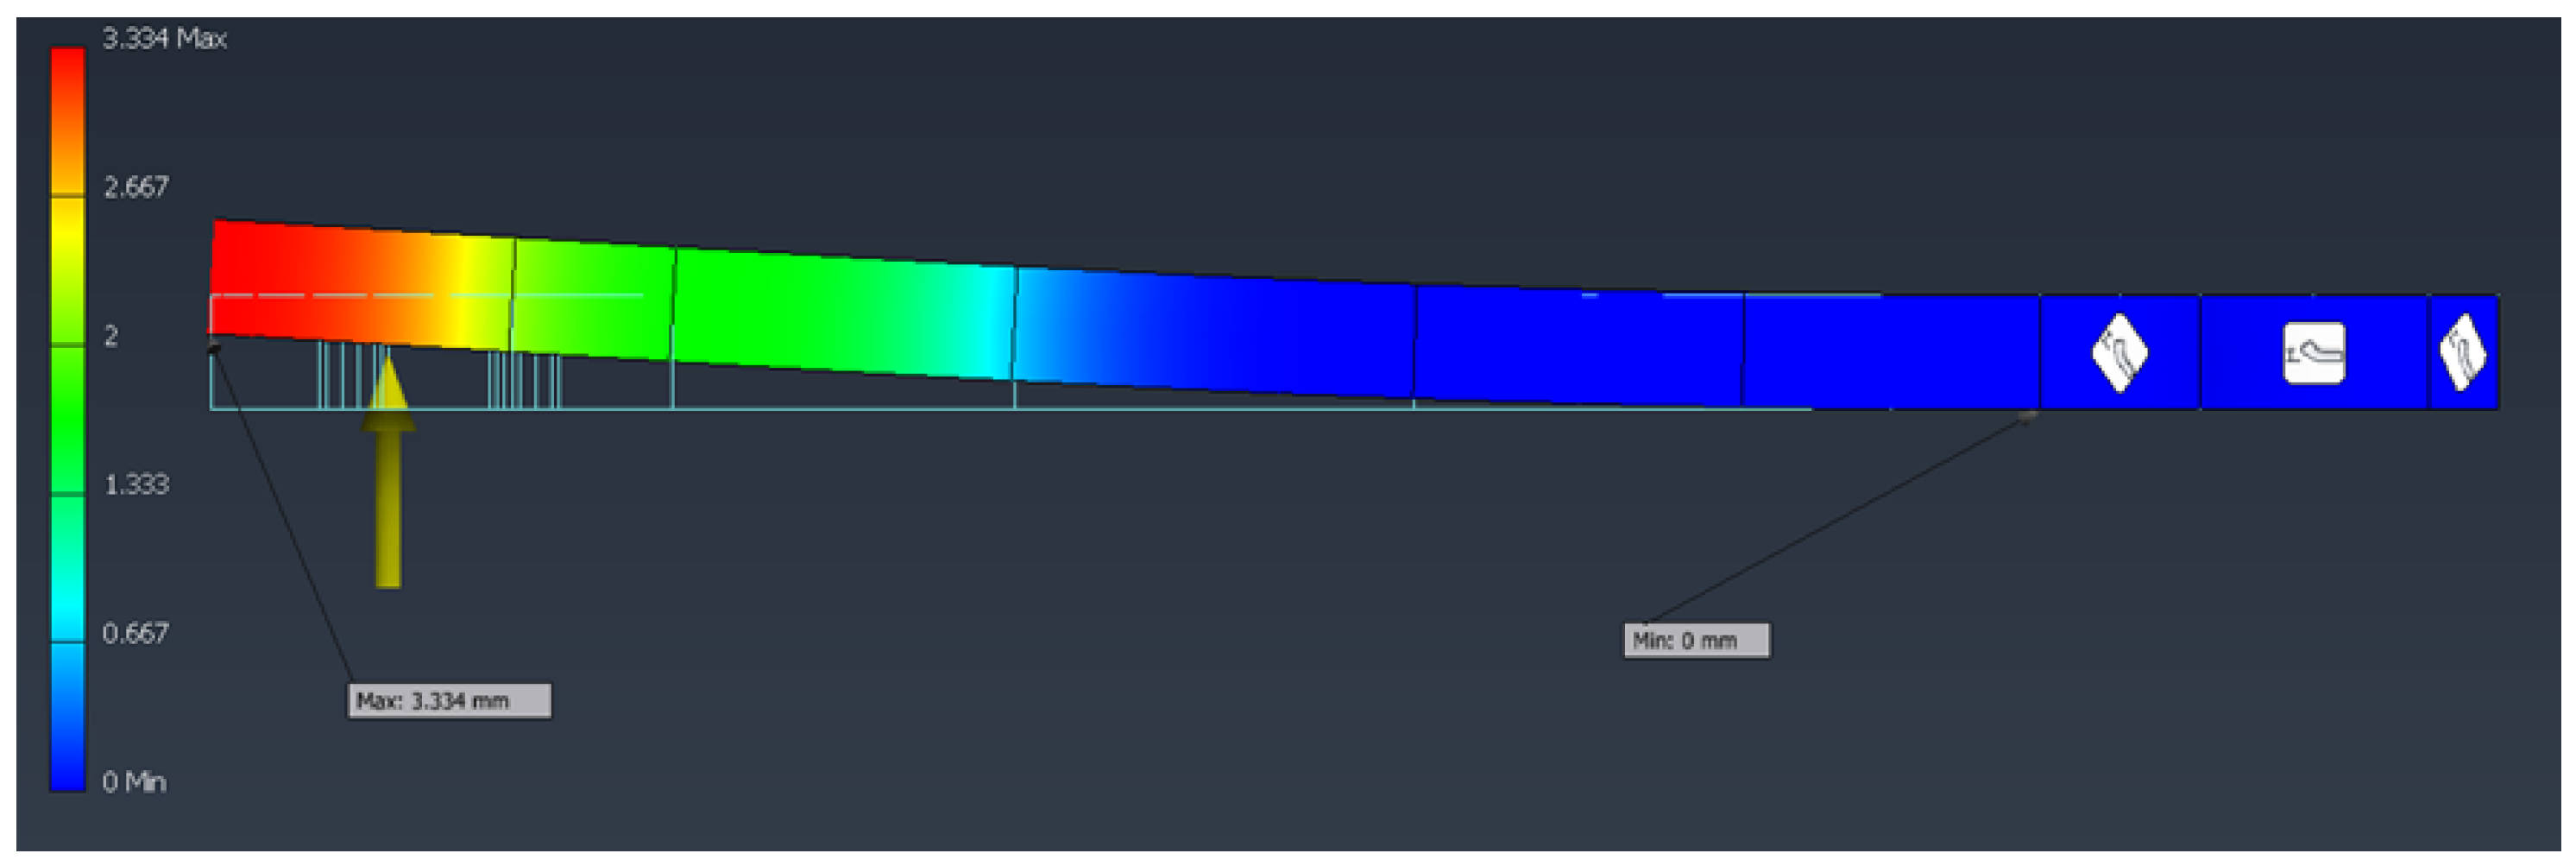
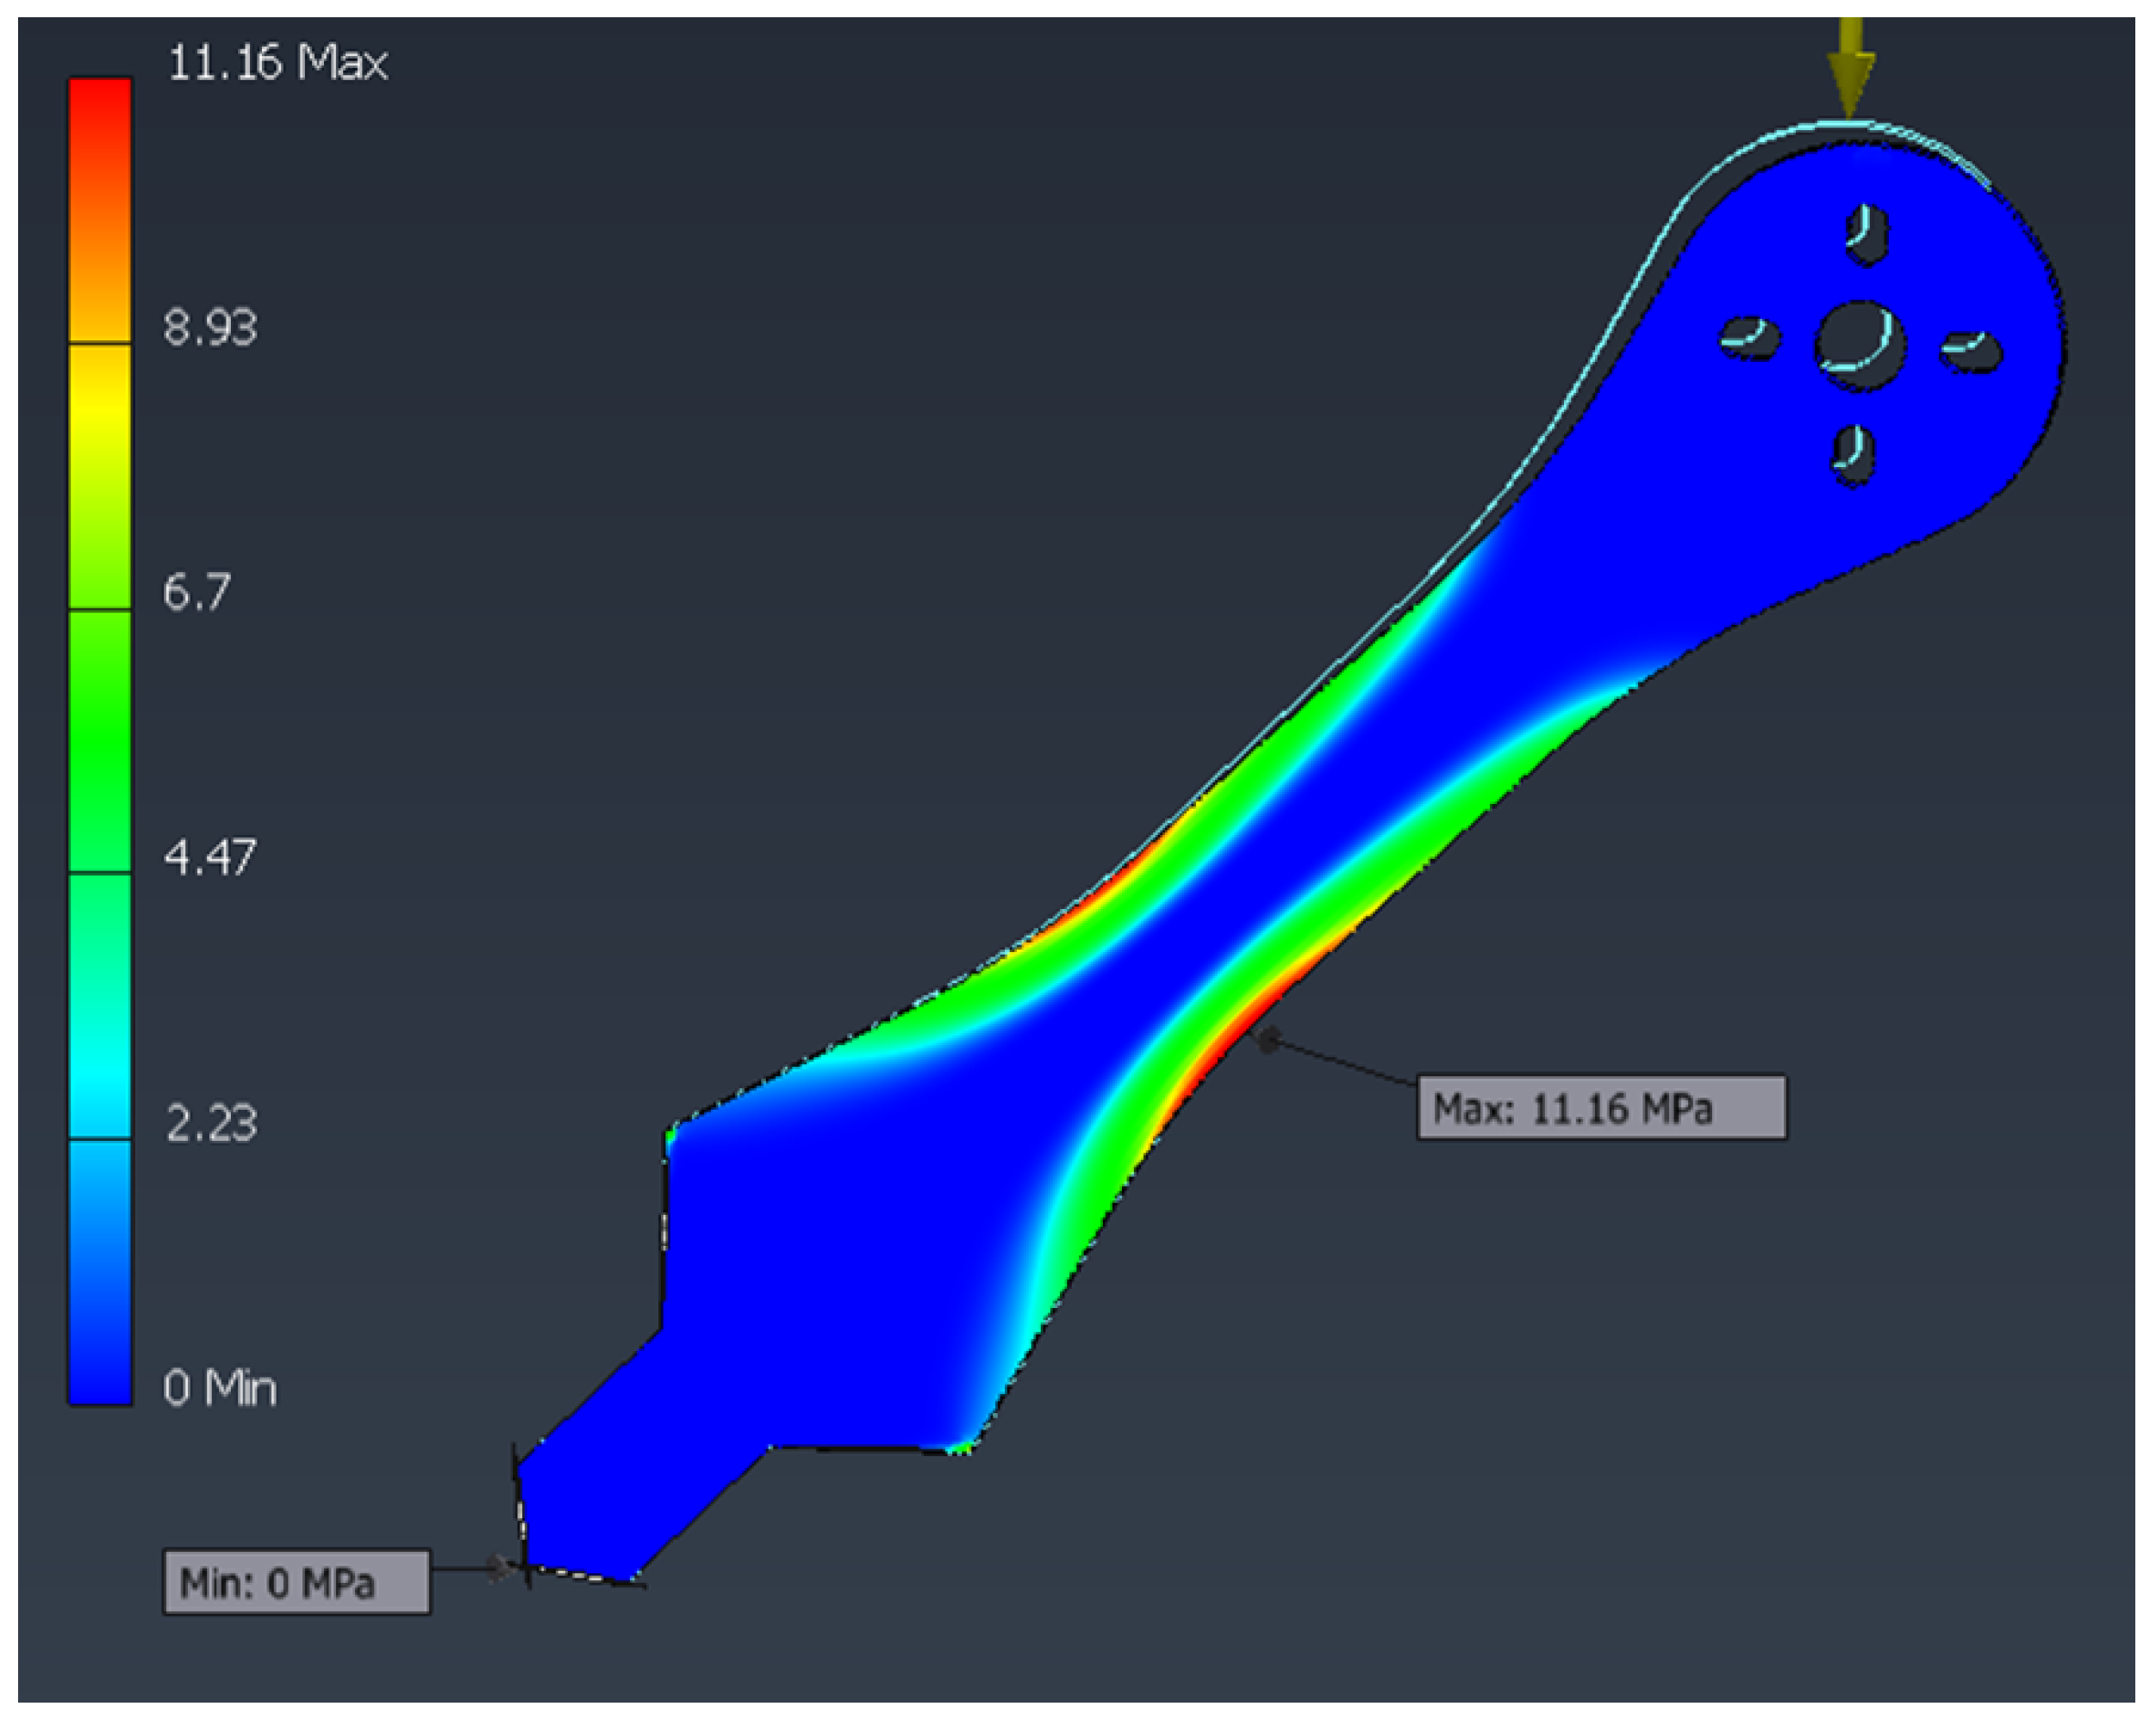
From the FEM simulation, the maximum Von Mises stress was observed at 7.25 MPa, concentrated near the arm–frame junction (Figure 8). The maximum displacement, 2.43 mm, occurs at the free end of the arms (Figure 9). Considering the PETG yield strength of 40 MPa, the safety factor is:
SF = σ yield σ VM = 40 7.25 5.52
A summary of the simulation results can be found in Table 10.
  • Simplified beam model validation
The simplified cantilever beam model was tested under the same extreme condition of 6.38 N applied at the free end. The objective is to validate the order of magnitude of stresses and displacements compared with the CAD-based FEM simulation.
Model data:
  • Cantilever beam with rectangular cross-section.
  • Length: L = 70 mm.
  • Width: b = 10 mm.
  • Height: h = 5 mm.
  • Point load: F = 6.38 N in + Z direction.
  • Young’s modulus (PETG): E = 2.1 × 10 9 Pa.
Calculations:
I = b h 3 12 = 1.0417 × 10 10 m 4
δ max = F L 3 3 E I 3.34 mm
M max = F · L = 0.4466 Nm
σ max = M max · c I 10.71 MPa
σ vm = | σ | = 10.71 MPa
The comparison under high-load conditions is summarized in Table 11.
As in the hovering case, the simplified model predicts slightly higher stresses than the CAD simulations. This difference is explained by the stiffening features of the real arm geometry, which help reduce stresses under the same load.The Von Mises stress and displacement distributions are shown in Figure 10 and Figure 11, respectively.
  • Comparative Results PETG–Carbon Fiber
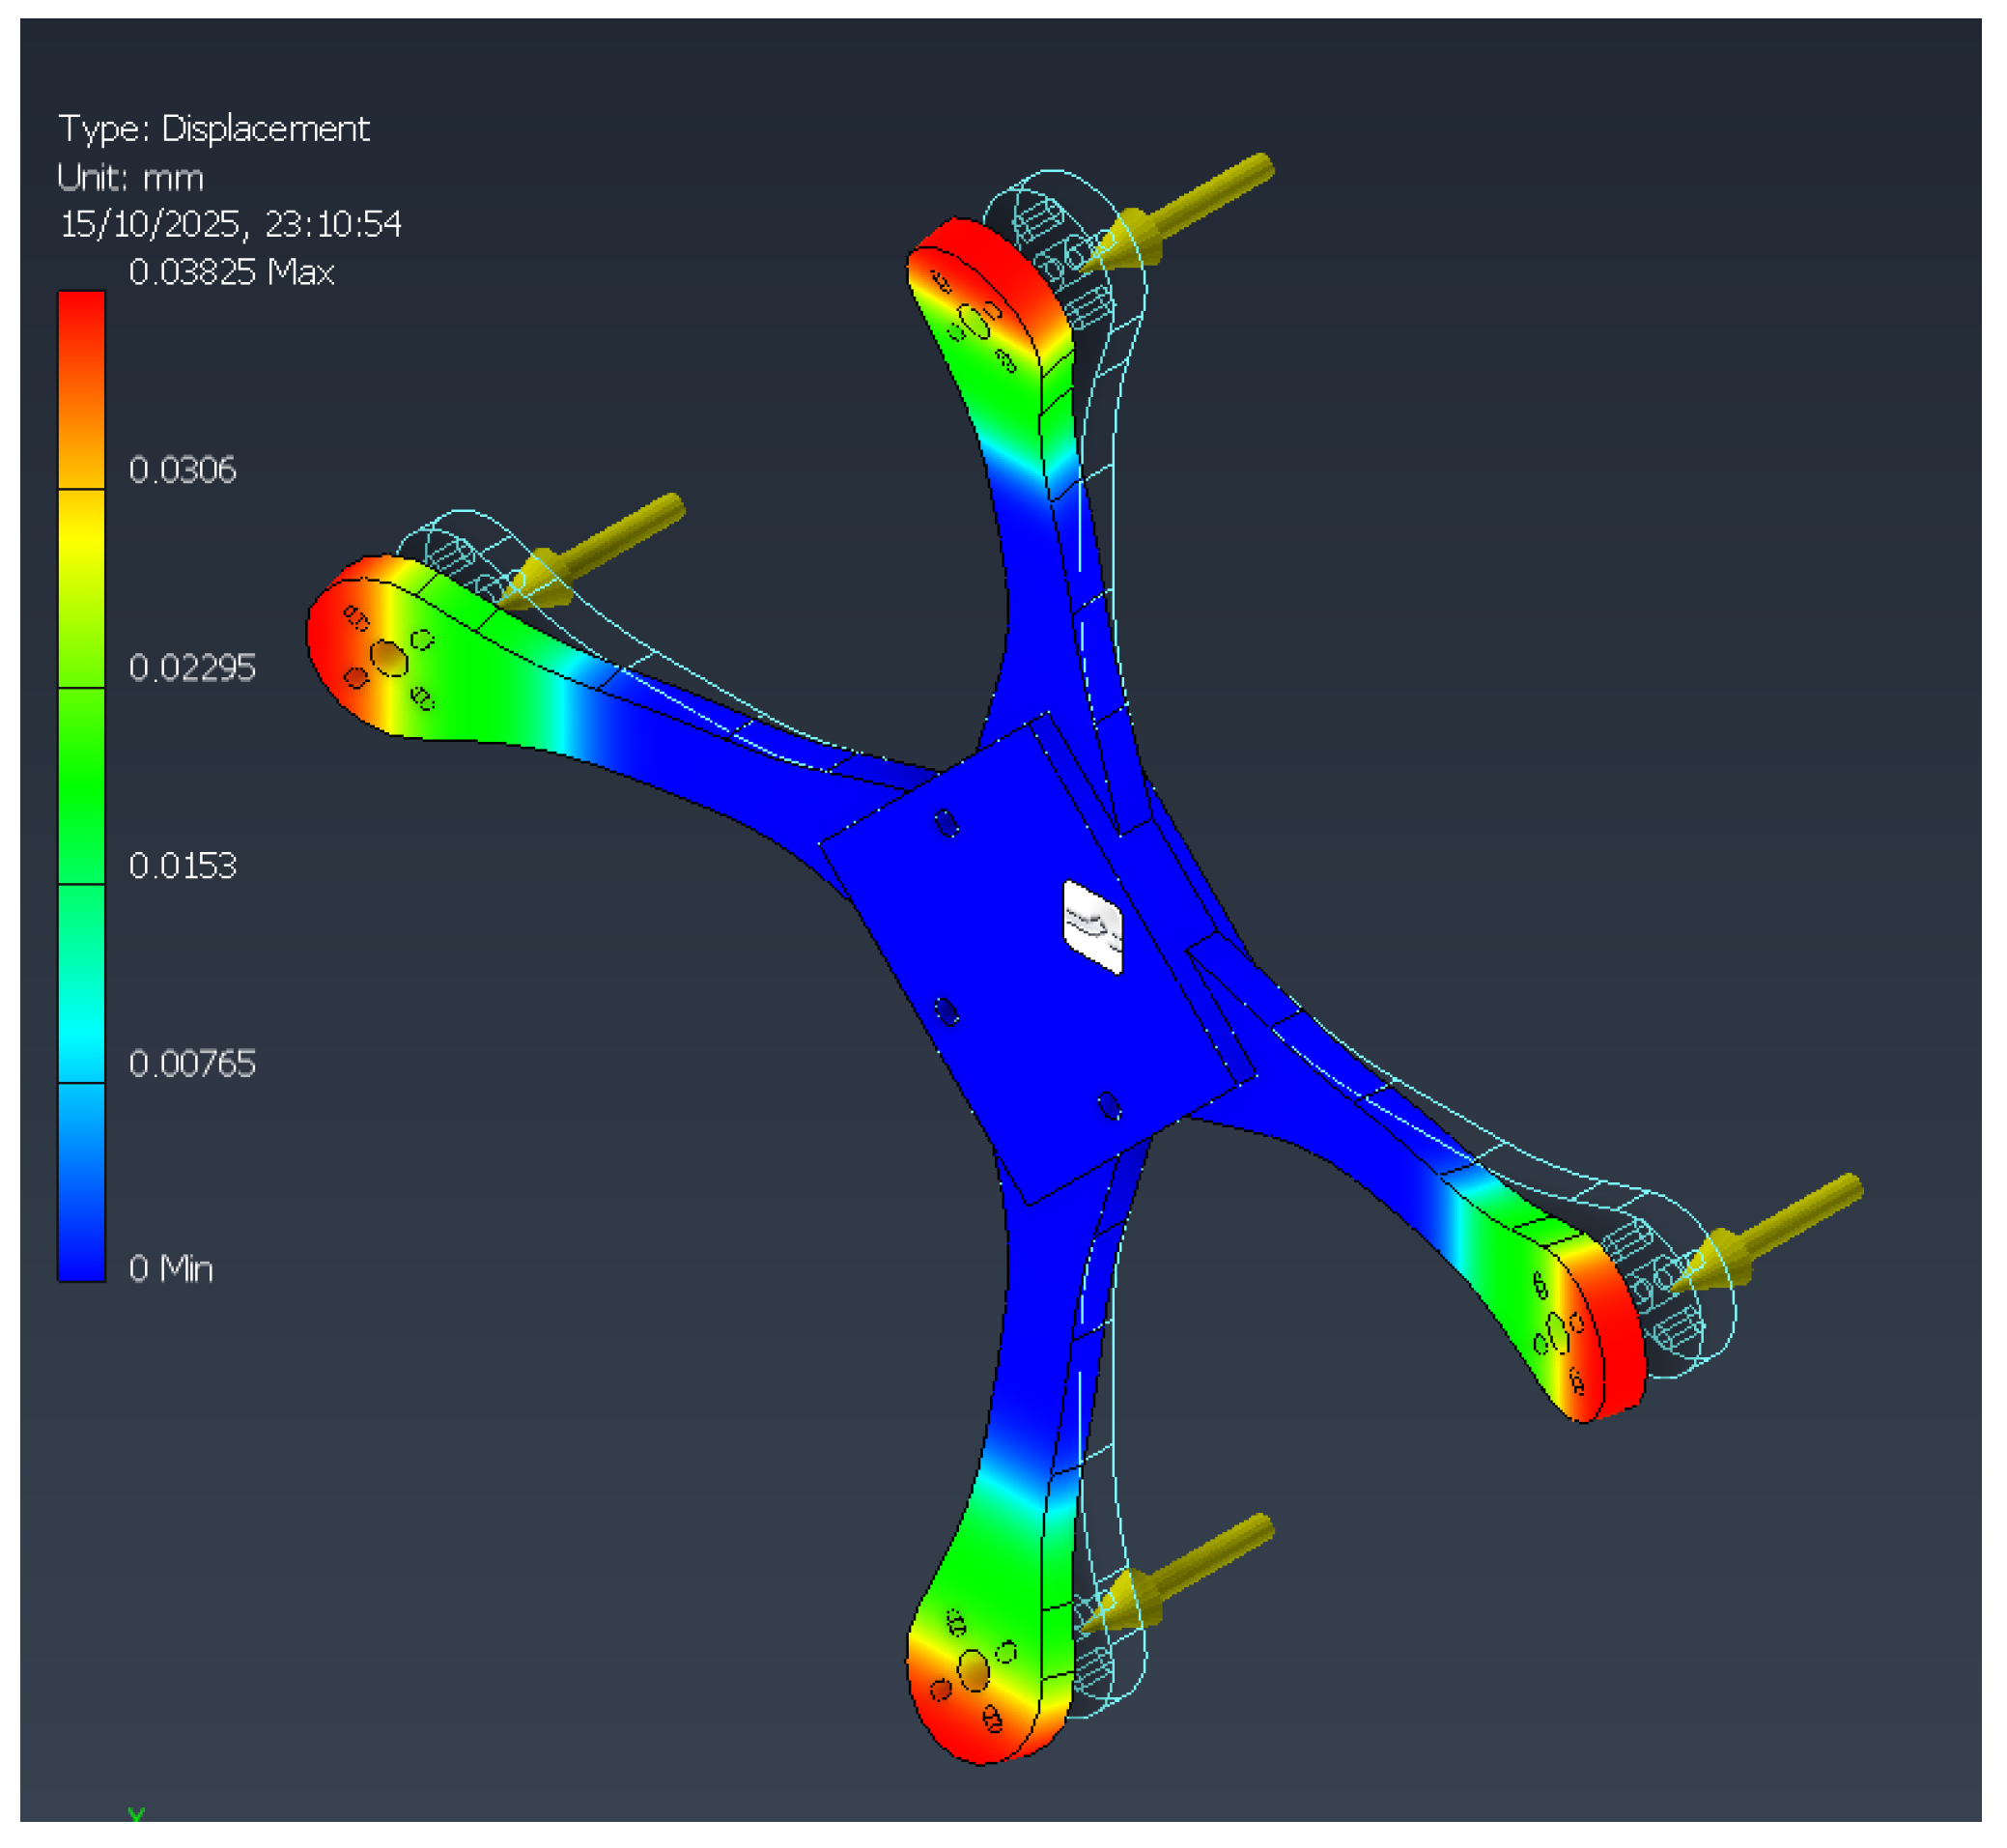
The FEM simulations for PETG and carbon fiber under the same loading conditions reveal substantial differences in mechanical performance, primarily due to the superior stiffness and strength of the carbon fiber material, while the stress levels remain similar between both cases, the displacement and safety factor show remarkable improvements when using carbon fiber. Table 12 summarizes the comparison between the analyzed materials.
Considering the carbon fiber yield strength of 300 MPa, the safety factor is calculated as follows:
SF = σ yield σ VM = 300 7.25 = 41.38
The maximum Von Mises stress remains constant at 7.25 MPa for both materials, as the geometry and load conditions are identical. However, the maximum displacement decreases from 2.43 mm with PETG to only 0.038 mm with carbon fiber, representing a drastic improvement in stiffness and deformation control.
The safety factor increases from 5.52 to 41.38 due to the significantly higher yield strength of carbon fiber (300 MPa vs. 40 MPa). These results demonstrate that, although both materials experience similar stress distributions, the structural response of the carbon fiber model is far superior in terms of rigidity and safety margin. As shown in Figure 12, the deformation in the carbon fiber structure is minimal compared to the PETG case, while Figure 13 highlights the distribution of principal stresses, confirming similar stress patterns but significantly reduced strain magnitudes.
In conclusion, replacing PETG with carbon fiber substantially enhances the structure’s mechanical performance, reducing deformation by more than 98% and increasing safety by a factor of approximately 7.5, confirming carbon fiber as a more suitable material for high-performance structural applications.
Experimental validation
To validate the numerical FEM results, a preliminary experimental test was performed using a single arm segment of the drone frame. The objective of this test was not to obtain statistically representative data, but rather to verify the order of magnitude of the deformation predicted by the simulations under a controlled static load. The arm was rigidly fixed at one end, replicating the boundary conditions used in the FEM analysis, setup can be observe in Figure 14. A static punctual load equivalent to 625 was applied at the free end, corresponding to a force as follows:
F = m · g = 0.625 kg × 9.81 m / s 2 = 6.13 N
This value represents the load generated by the arm under an acceleration of approximately 10 G, as simulated in the maximum thrust FEM scenario. For practical implementation, a physical weight of 625 g was suspended from the tip of the printed arm to reproduce the equivalent vertical force.
The resulting vertical displacement was measured manually with a precision of 1 mm. Due to the small magnitude of deformation and the absence of dedicated strain measurement instrumentation (e.g., LVDT or digital displacement sensors), the obtained value represents an approximate observation.
The measured displacement was approximately 1.8 mm, compared with the 3.34 mm predicted by the FEM simulation under the same loading and boundary conditions. This difference is primarily due to the intentionally conservative nature of the FEM analysis, in which the PETG material properties were underestimated (yield strength set to 40 MPa) to ensure a safety margin against printing defects, local stress risers, or interlayer weaknesses.
This conservative modeling approach was chosen to guarantee that, if the simulated model remains within safe limits under these restrictive assumptions, the real printed prototype will also perform safely under actual conditions. Thus, the FEM model acts as a lower-bound validation of structural integrity. Table 13 summarizes the experimental results of the single-arm setup.
Given the limited precision of the setup and the absence of strain instrumentation, this test should be interpreted only as a qualitative validation confirming that the experimental and numerical deformations are of the same order of magnitude. The results support the validity of the conservative FEM model and demonstrate that the printed structure operates safely within the predicted elastic range.
In summary, this preliminary single-arm static test supports the general validity of the FEM approach while highlighting the need for future tests using precise displacement sensors and multiple samples to improve quantitative correlation.

3.4.3. Structural Response to Lateral Impact at the Arm Tip (40 km/h)

The purpose of this simulation is to study the structural behavior of the drone when it impacts a rigid object (representing a tree) at a speed of 40 km/h or 11 m/s. The collision occurs at the tip of one of the drone’s arms, which allows the analysis of the localized response in the structurally most critical area during a crash.
  • Analysis Setup
The simulation is configured as a nonlinear transient dynamic response with large displacements enabled (PARAM, LGDISP, 1). Rayleigh damping coefficients are applied ( α = 1.0 × 10 3 , β = 1.0 × 10 3 ) to model internal energy dissipation.
The integration step is 1 × 10 6 s, with 1000 iterations per step, and a total duration of 0.01 s. This ensures high temporal resolution of the impact response.
A summary of the main parameters is presented in Table 14.
To properly characterize the system’s response during and after the impact, multiple output variables were enabled, as detailed in Table 15. These allow evaluation of the most relevant physical magnitudes such as displacements, stresses, and internal forces.
  • FEM Study
For the simulation, Inventor software 2025 in the Nastran environment is used, which enables transient testing. The model assembly and the meshed drone, composed of triangular elements refined in the impact region, are shown in Figure 15. The tree is represented by a meshed cylinder with rigid properties and completely constrained motion. The adaptive mesh, with higher density in the impact zone, ensures adequate spatial resolution of stresses. A detailed view is shown in Figure 16, where the increase in nodes on the arm under study can be observed, especially on the impact surface.
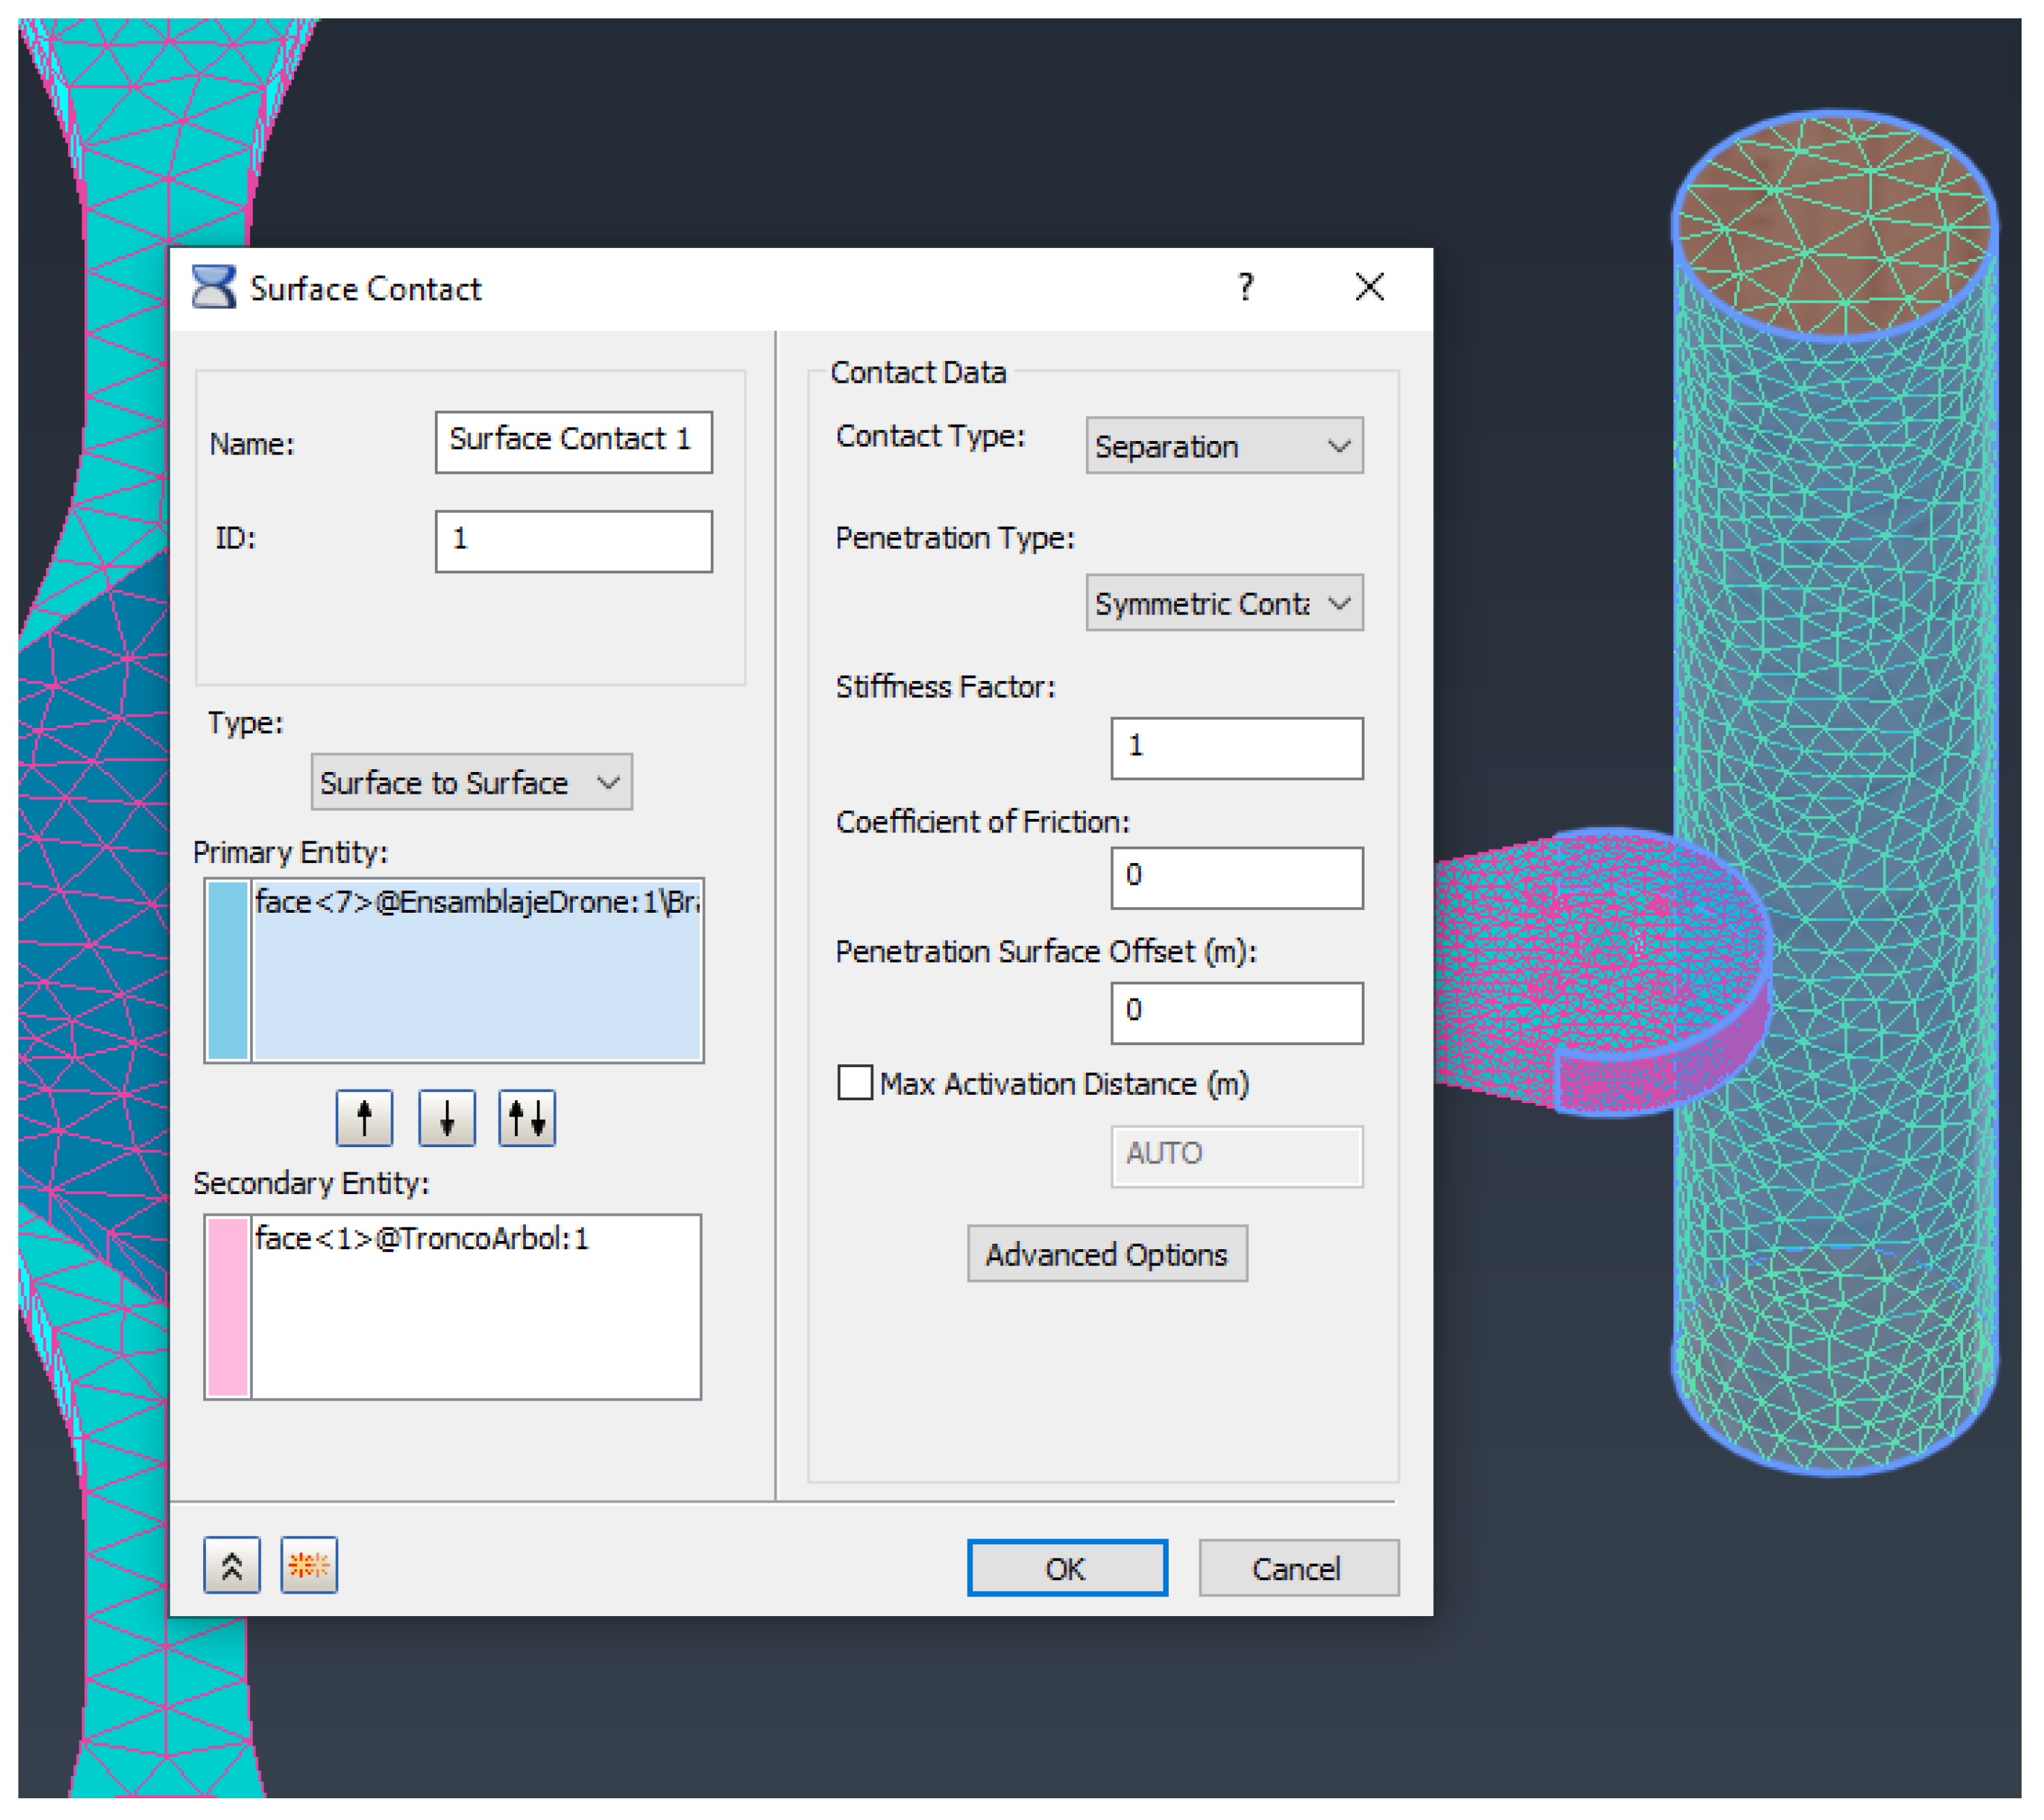
The contact between both geometries is defined by non-penetration collision conditions through a boundary contact condition between the arm face and the cylinder simulating the tree, as shown in Figure 17. The boundary conditions ensure the following:
  • Type of penetration: symmetric contact—both surfaces (drone and tree) act interchangeably as master or slave surfaces, improving numerical stability and contact detection accuracy.
  • Stiffness factor: 1—maintains physical accuracy without artificial rebounds or numerical penetrations.
  • Coefficient of friction: 0—friction neglected due to the short collision time and dominance of normal forces.
  • Penetration Surface Offset: 0 m—accurate meshing and alignment require no offset.
  • Max activation distance: enabled (automatic mode)—the solver determines activation distance dynamically to avoid false contacts.
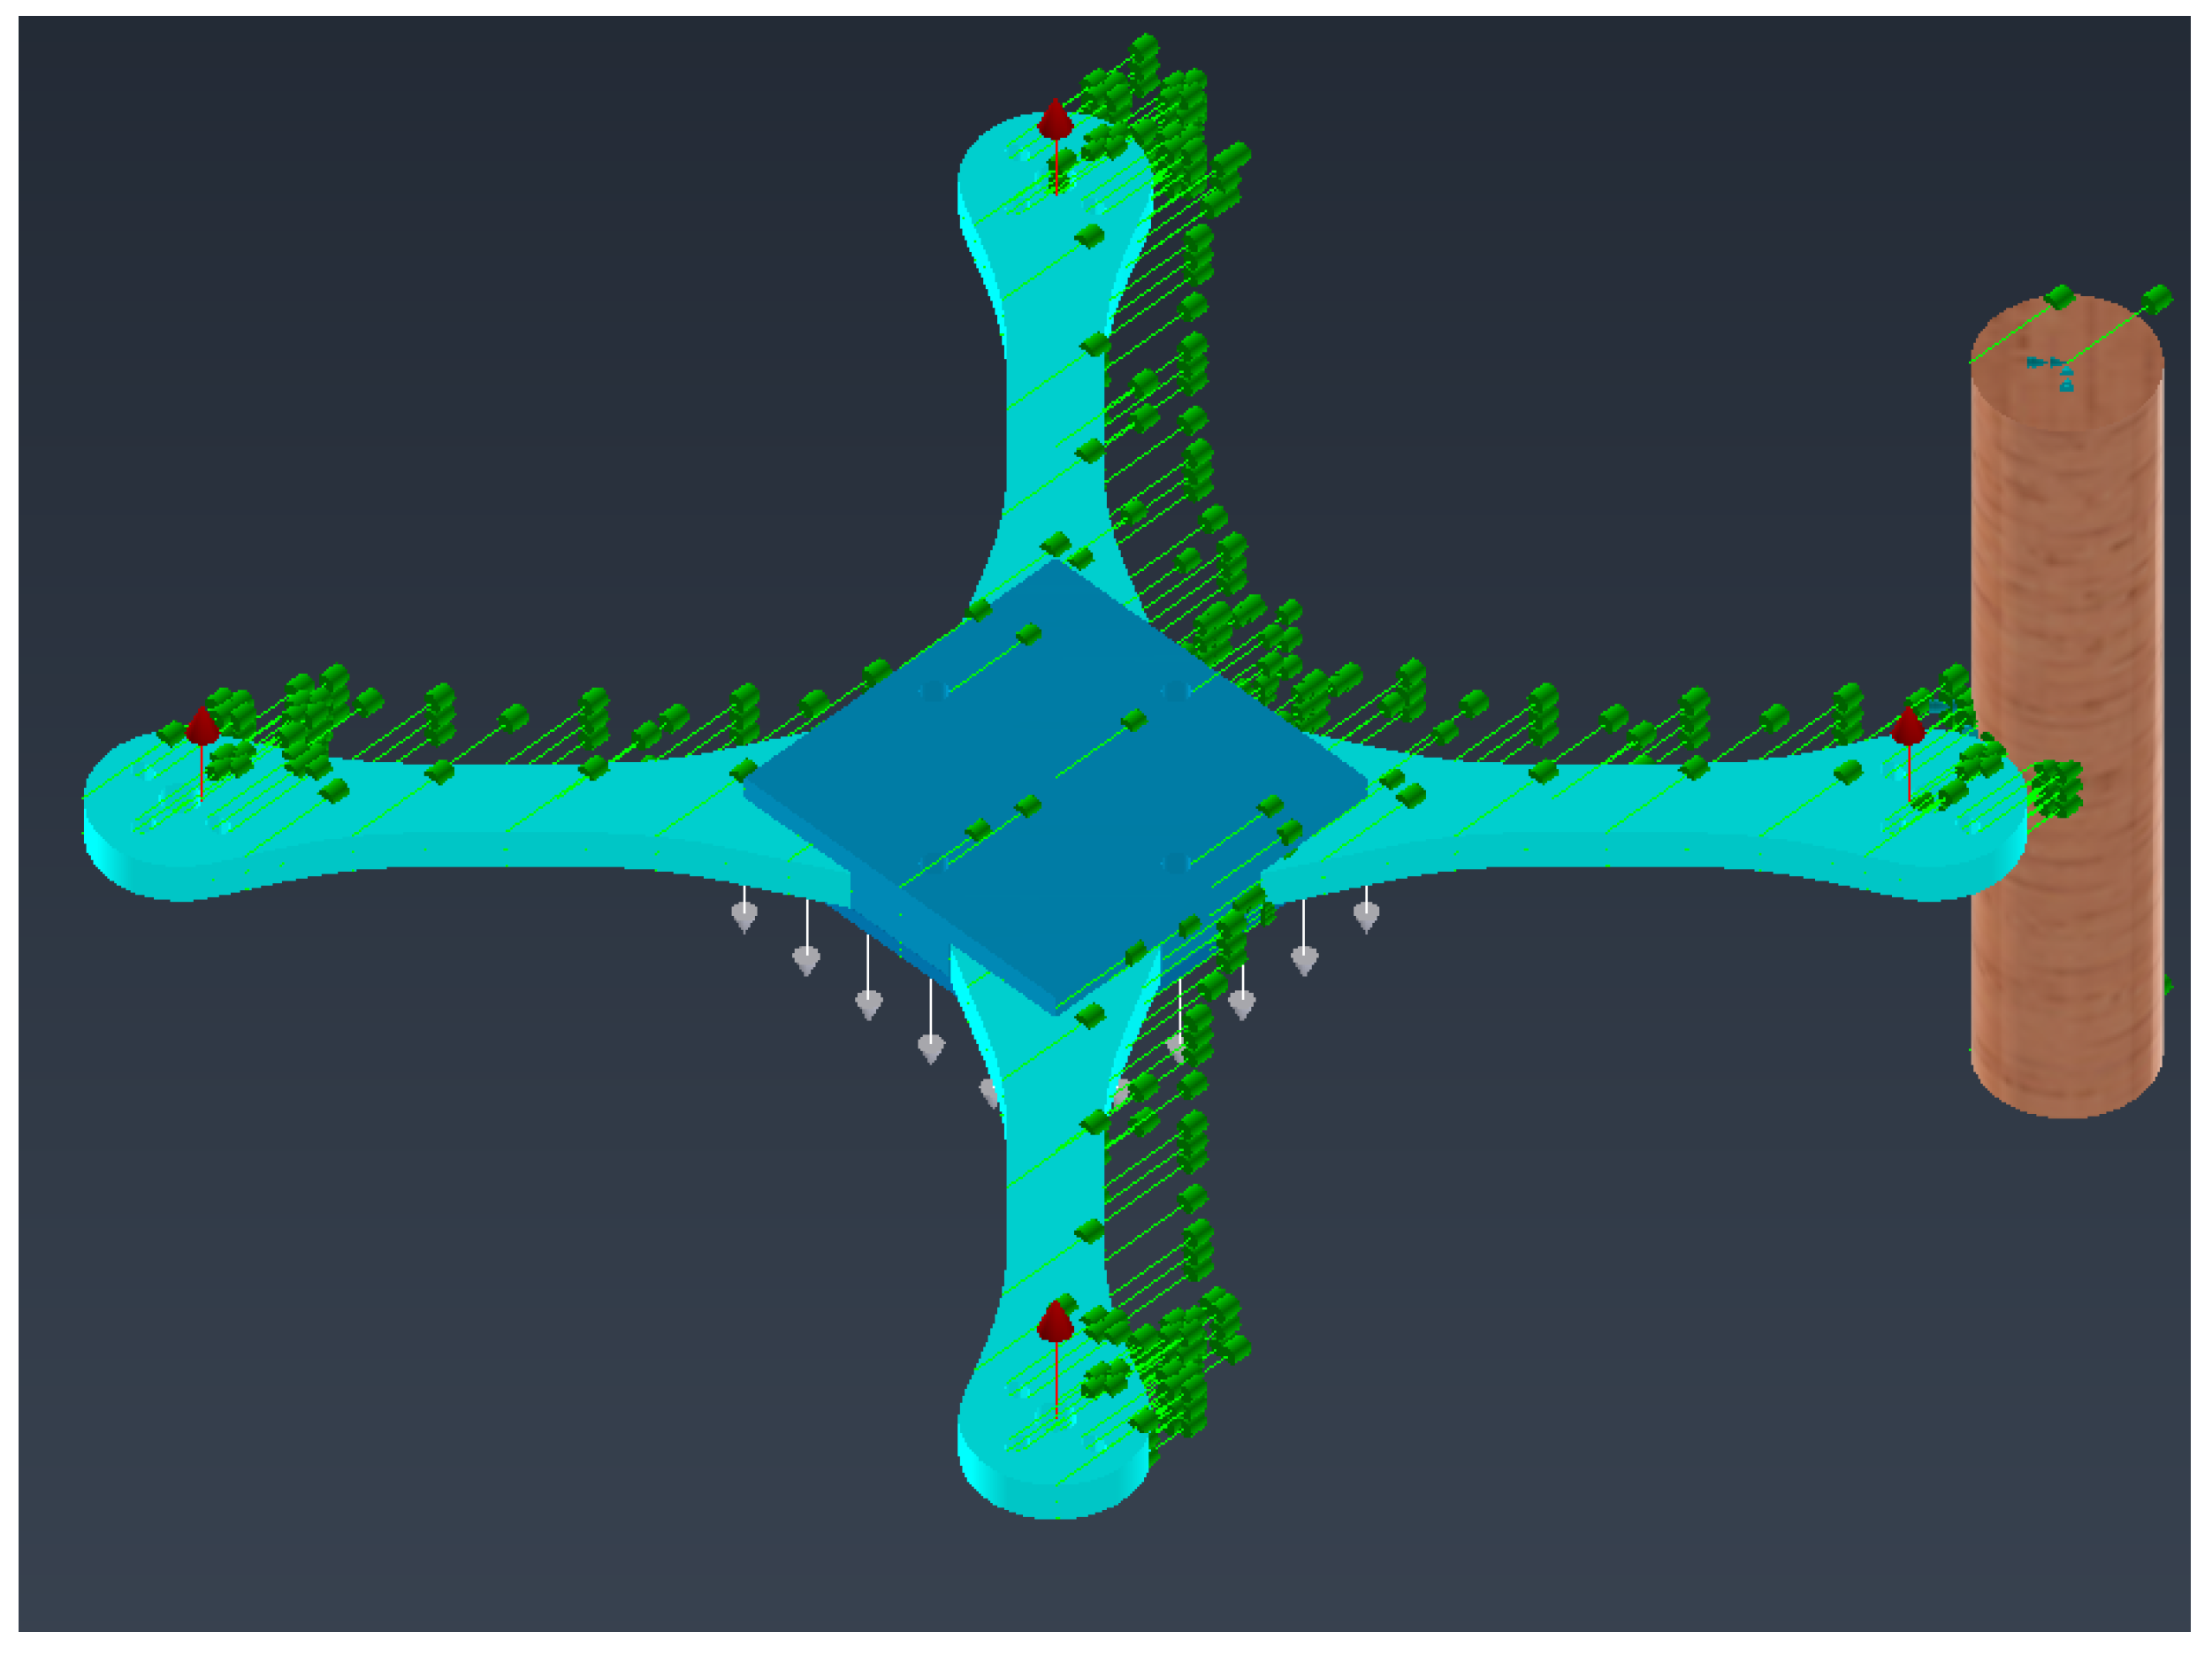
The details of the applied forces can be seen in Figure 18. The thrust of the motors is simulated by red loads of 0.625 N, the total weight of 250 g by the white load at the bottom of the chassis, and the 11 m/s displacement by green velocity-type loads. The fixed supports of the trunk can also be observed, keeping it immobile.
Finally, the set of boundary conditions (SPC = 1) properly restricts the degrees of freedom not involved in the collision. The nonlinear controlled time step (TSTEPNL = 1) ensures numerical stability in the transient domain. This configuration provides an accurate and realistic representation of the drone’s mechanical behavior during impact, enabling the identification of potential structural failures and critical damage zones.
  • Results
Two simulations were performed to evaluate the structural response of the drone’s frame during the collision: the first at t = 0.01 s , corresponding to the initial impact, and the second at t = 1 s , to analyze subsequent energy absorption and redistribution.
At t = 0.01 s , the stress distribution shown in Figure 19 indicates that the most loaded area coincides with a joint node, an artificial stress concentration caused by mesh discretization (see Figure 20), reaching a maximum value of 29.68 MPa. The diagonal arms (front left and rear right) show tensile and bending stresses at their ends, induced by impact inertia, while the rear left arm remains unloaded, indicating that the frame has not yet fully absorbed the impact energy. It is therefore recommended to extend the simulation to later times.
The maximum recorded displacement is 2.393 mm (see Figure 21), concentrated in the cross arms, which move forward generating the stresses mentioned above.
  • Test at t = 1 s:
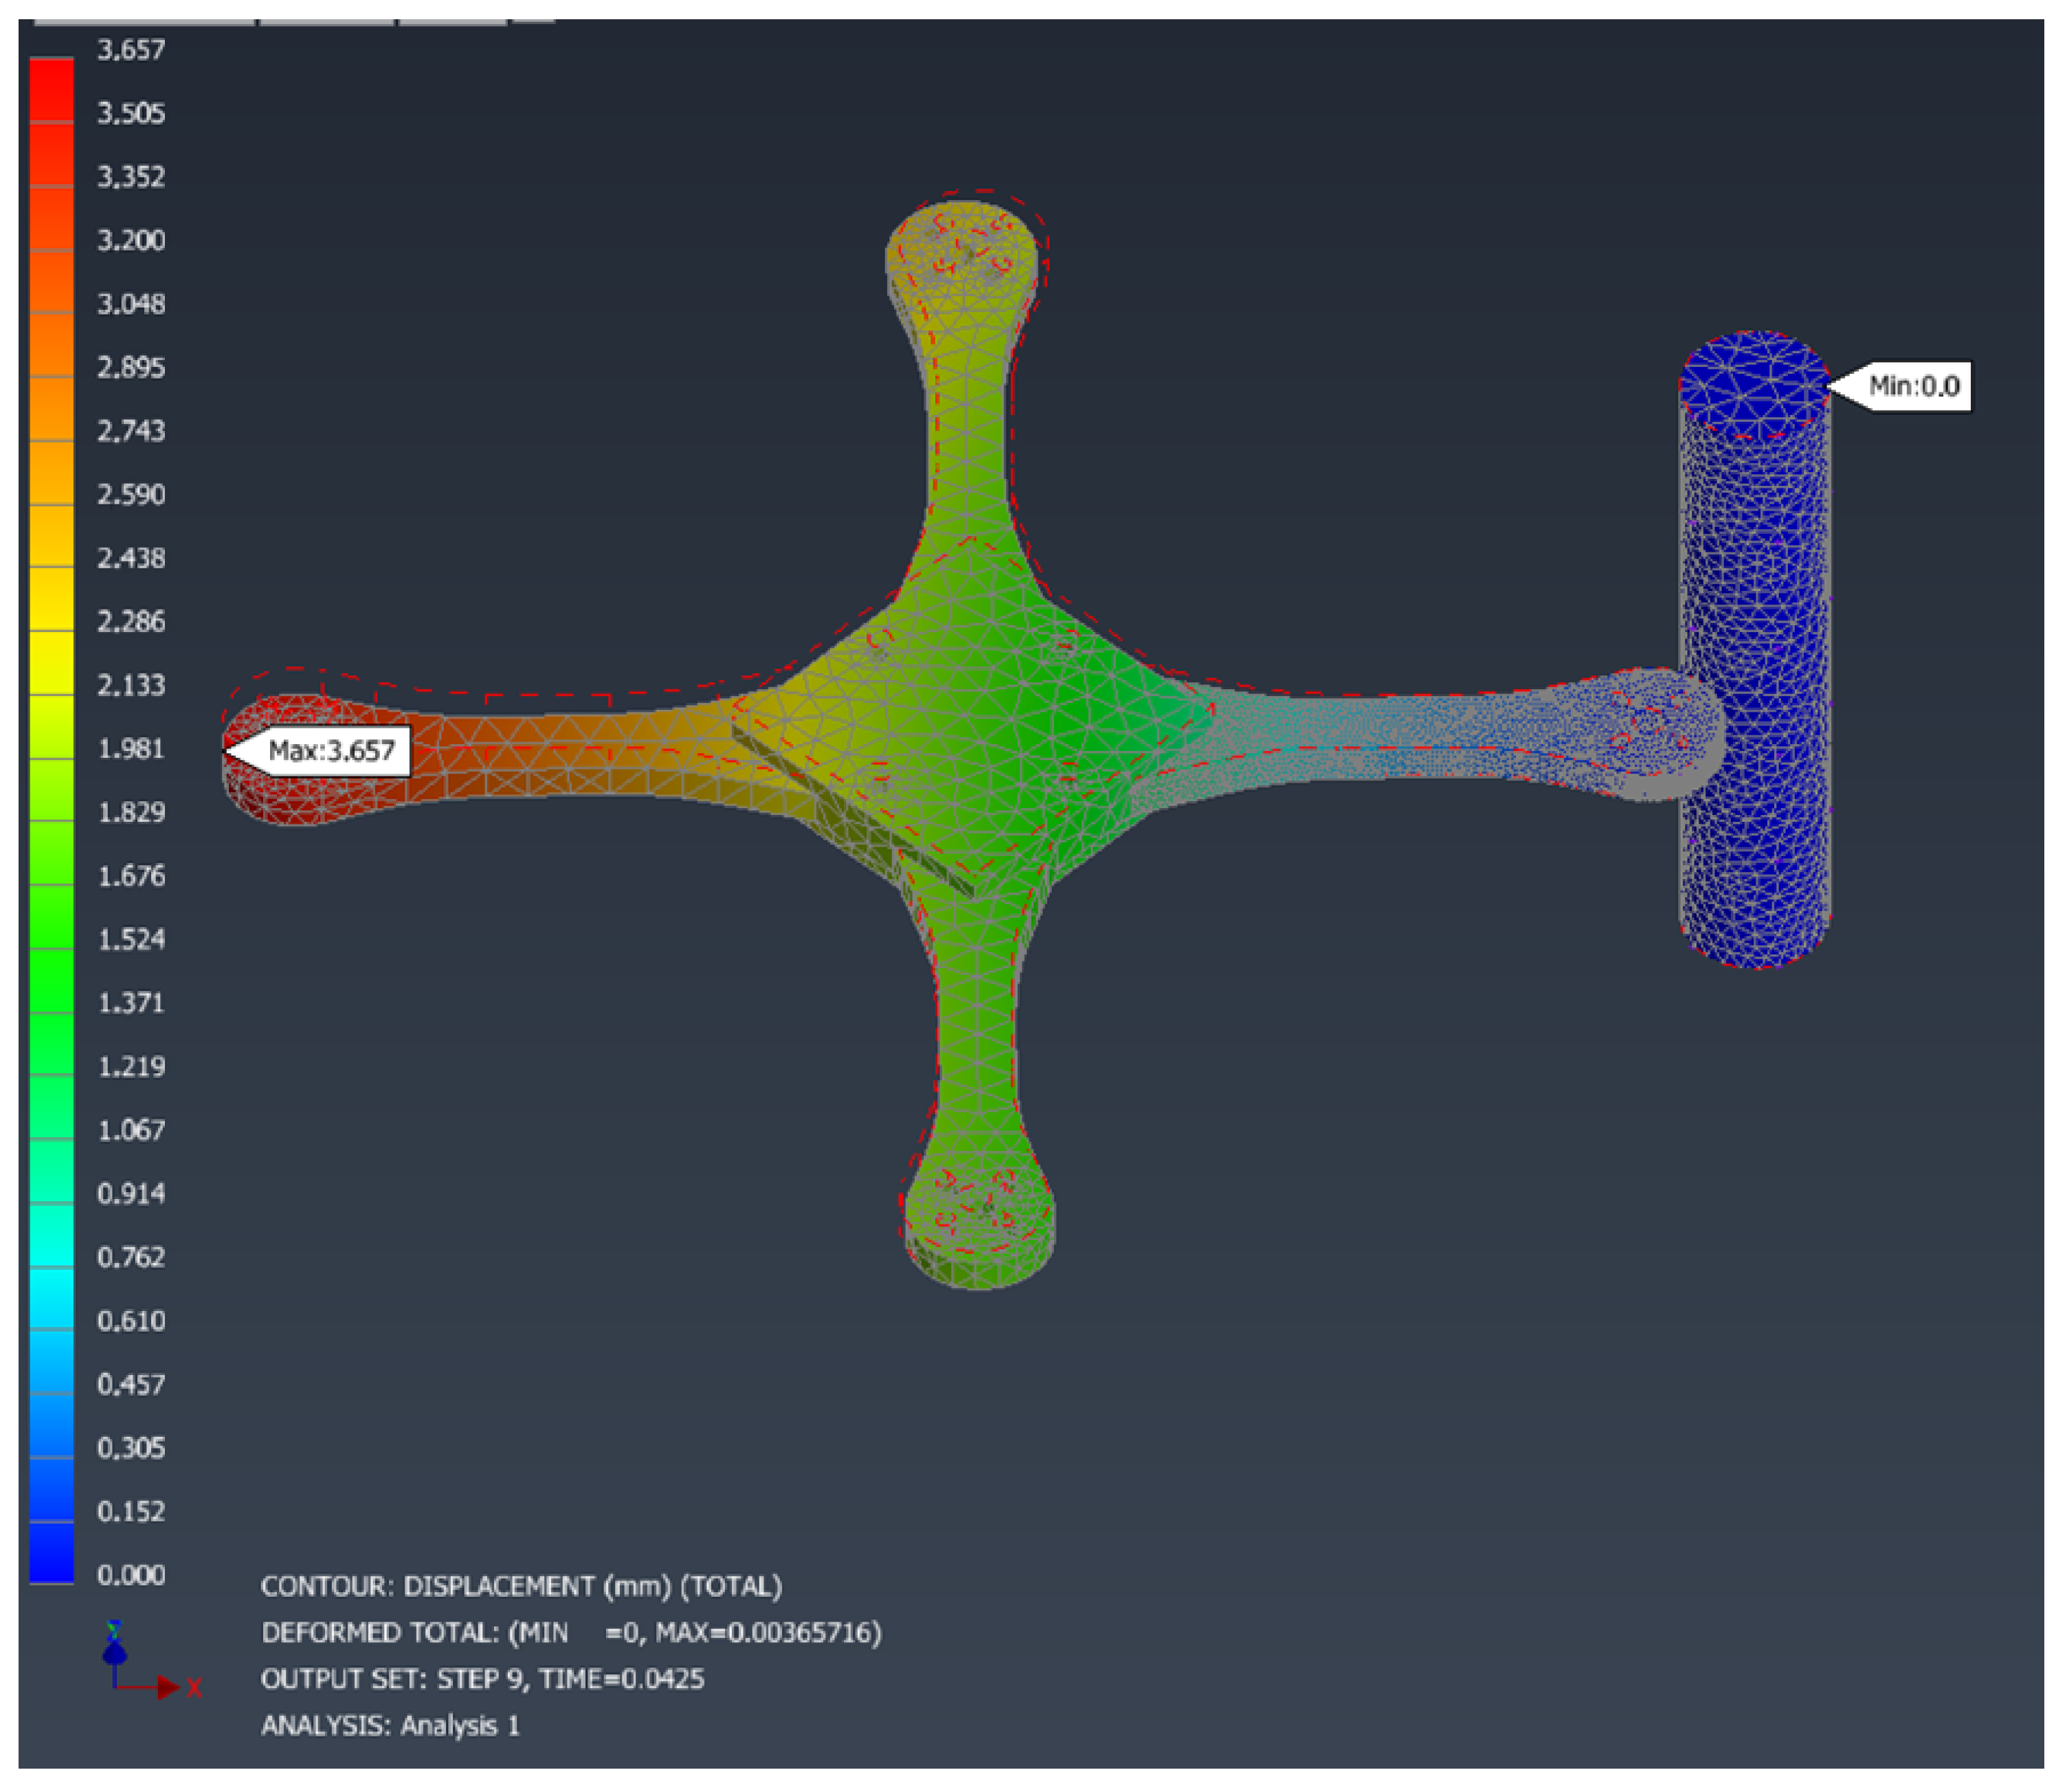
To validate the hypothesis regarding the progressive absorption of impact energy, an additional simulation was carried out at t = 1 s , keeping the rest of the parameters unchanged. At this stage, it is observed that the rear-left arm presents a maximum displacement of 3.657 mm in the upward direction (see Figure 22), indicating that the drone has pitched forward as a consequence of the initial impact. This rotation is consistent with the expected dynamic behavior after a frontal collision.
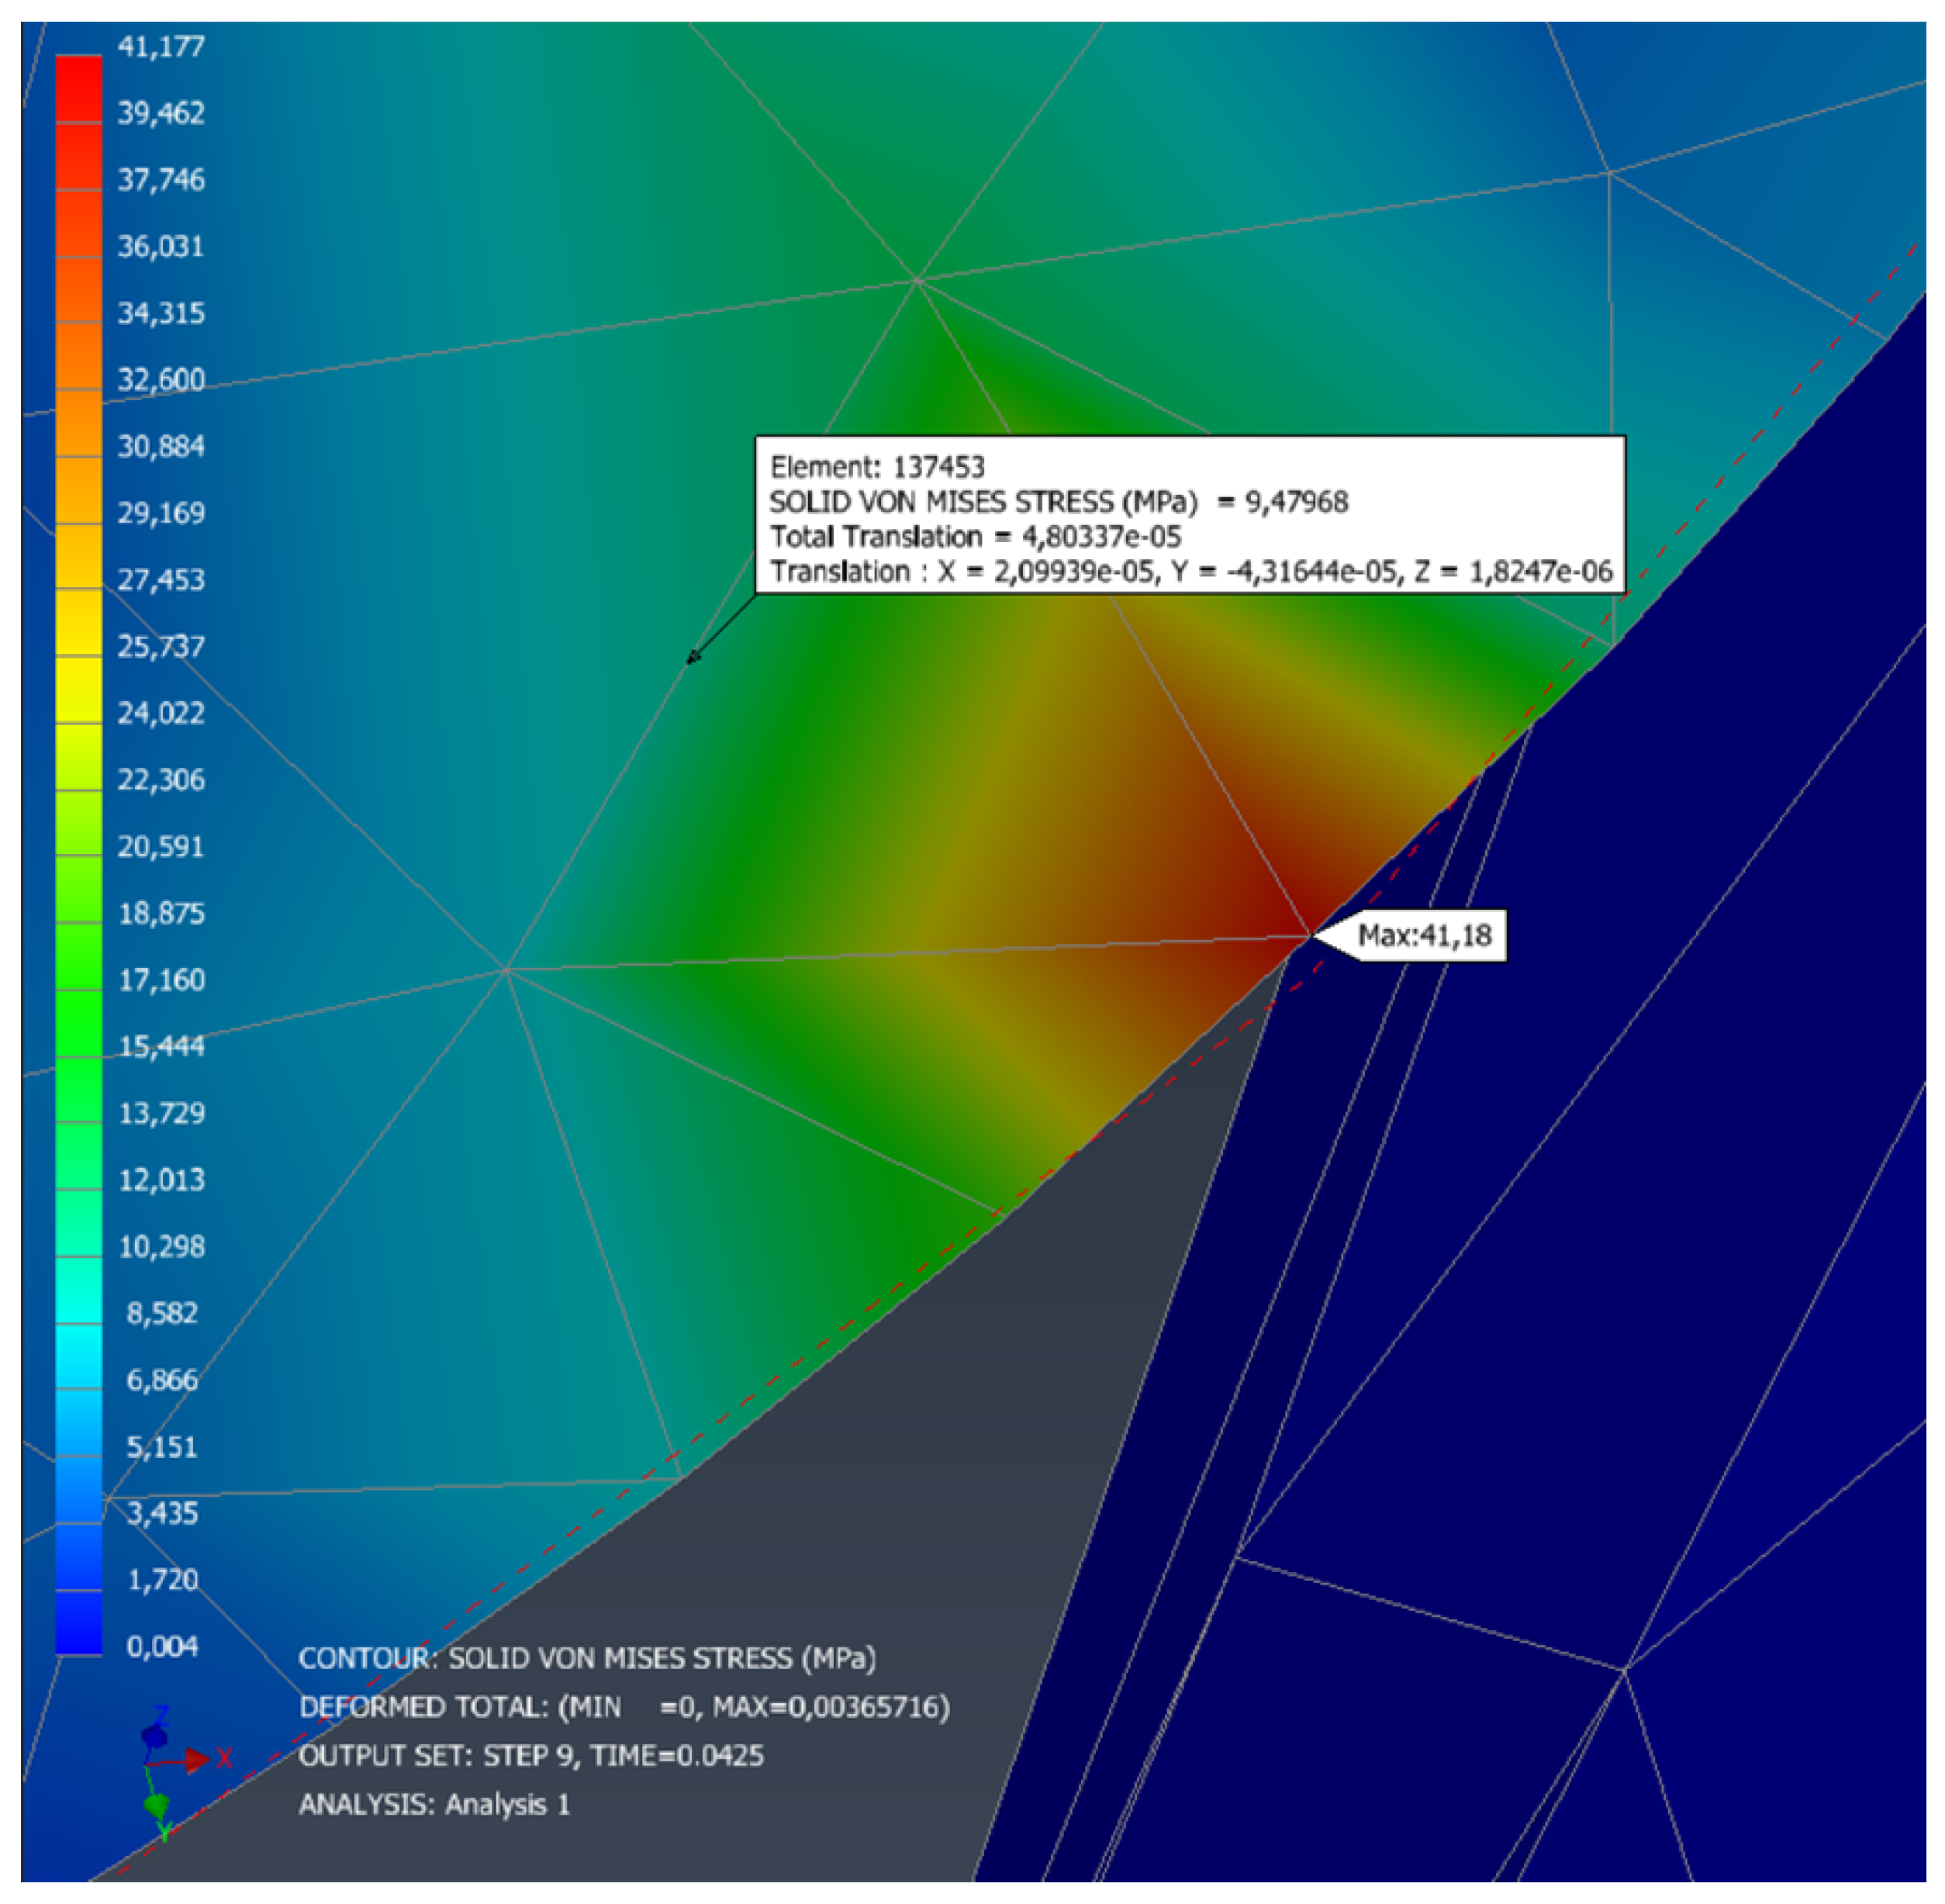
The Von Mises stress reaches a maximum value of 41.78 MPa, located at the same point previously identified as a mesh stress concentration zone (see Figure 23 and Figure 24). This increase confirms that this node continues to absorb most of the residual impact energy. On the other hand, the three arms not directly involved in the crash are completely unloaded, showing that the energy has been almost entirely absorbed by the impacted arm. This evolution confirms the initial hypothesis: the drone’s structure channels the energy toward the front arm, enabling localized dissipation that protects the rest of the system.
It is worth noting that the node corresponding to element 137453, located in the impact zone, has been highlighted in order to analyze the origin of the maximum stress point observed in both simulations. This point coincides with the vertex of a region where the mesh converges sharply, generating an artificial geometric discontinuity that acts as a stress concentrator. In both analyzed instants ( t = 0.01 s , see Figure 20 and t = 1 s , see Figure 24), this element shows a Von Mises stress of 9.47 MPa, supporting the hypothesis that the high stress concentration recorded in that node is mainly due to the mesh configuration, and not to a real physical condition of the system. This analysis reinforces the need to refine the mesh in critical areas to avoid misinterpretations of structural behavior.
In Table 16, a comparative summary of the maximum displacements and stresses obtained in the two analyzed instants is presented, considering PETG as the base material with a yield strength of 40 MPa.
At t = 0.01 s , the Von Mises stress reaches 29.68 MPa, resulting in a safety factor of 1.35, which is acceptable though close to the limit. However, at t = 1.00 s , the maximum stress rises to 41.78 MPa, implying a safety factor of 0.96, i.e., slightly exceeding the yield strength of the material. It should be noted that this stress, as previously analyzed, is again concentrated in element 137453, a zone where the mesh forms a sharp vertex. This configuration induces an artificial stress concentration. Therefore, it is concluded that the frame, from a structural point of view, would be safe were it not for this meshing anomaly. A further local mesh refinement in this region is recommended to avoid exaggerated stress readings that do not reflect the real behavior of the material. The safety factors have been calculated based on the PETG yield strength ( σ adm = 40 MPa ):
SF 0.01 s = σ adm σ Von Mises = 40 29.68 = 1.35
SF 1.00 s = σ adm σ Von Mises = 40 41.78 = 0.96
  • Simplified beam model validation
To validate the FEM results, a simplified estimation of the impact force was performed using the linear momentum principle:
F = Δ p Δ t = m ( v f v i ) Δ t
where m = 0.25 kg, v i = 11 m/s, v f = 0 m/s, and Δ t = 0.1 s. The resulting average force is:
F = 0.250 · ( 0 11 ) 0.1 = 27.5 N
F = 27.5 N
This value was applied in a static beam model: a cantilever of length L = 70 mm, rectangular cross-section b = 10 mm, h = 5 mm, subject to a 45 ° inclined load of 27.5 N.
The equivalent bending moment is:
M eq = 1.924 Nm
which leads to a maximum stress:
σ max = 23.08 MPa
and maximum deflection:
δ max = 2.55 mm
A comparison with FEM simulations is provided in Table 17. The theoretical beam model yields conservative results, with higher stresses and deflections than observed in the full drone assembly, highlighting the structural reinforcement provided by geometry and joints. The corresponding Von Mises stress and displacement distributions are shown in Figure 25 and Figure 26, respectively.
Experimental validation
To validate the numerical FEM model under a frontal impact condition equivalent to 40 km/h, a simplified experimental test was performed on a representative segment of the structural frame. The objective of this test was to confirm the order of magnitude of the deformation predicted by the simulations, rather than to obtain statistically representative data.
In the simplified FEM model, the dynamic impact was represented by a punctual load of 27.5 N, applied at an angle of 45° with respect to the horizontal axis. To replicate this in a static experimental setup, the applied load was decomposed into its components. The effective force acting along the principal direction of deformation is given by the following:
F eff = 27.5 N · cos ( 45 ° ) = 27.5 × 0.7071 = 19.44 N
This corresponds to the force exerted by a mass of approximately
m = F eff g = 19.44 9.81 = 1.98 kg
Therefore, a physical load of 2 kg was used in the test, as shown in Figure 27.
The test configuration reproduced the same boundary conditions used in the FEM analysis: one end of the structure was rigidly clamped, and the load was applied at the opposite free end. The displacement was measured manually using a precision caliper, yielding a vertical deflection of approximately 1.25 mm.
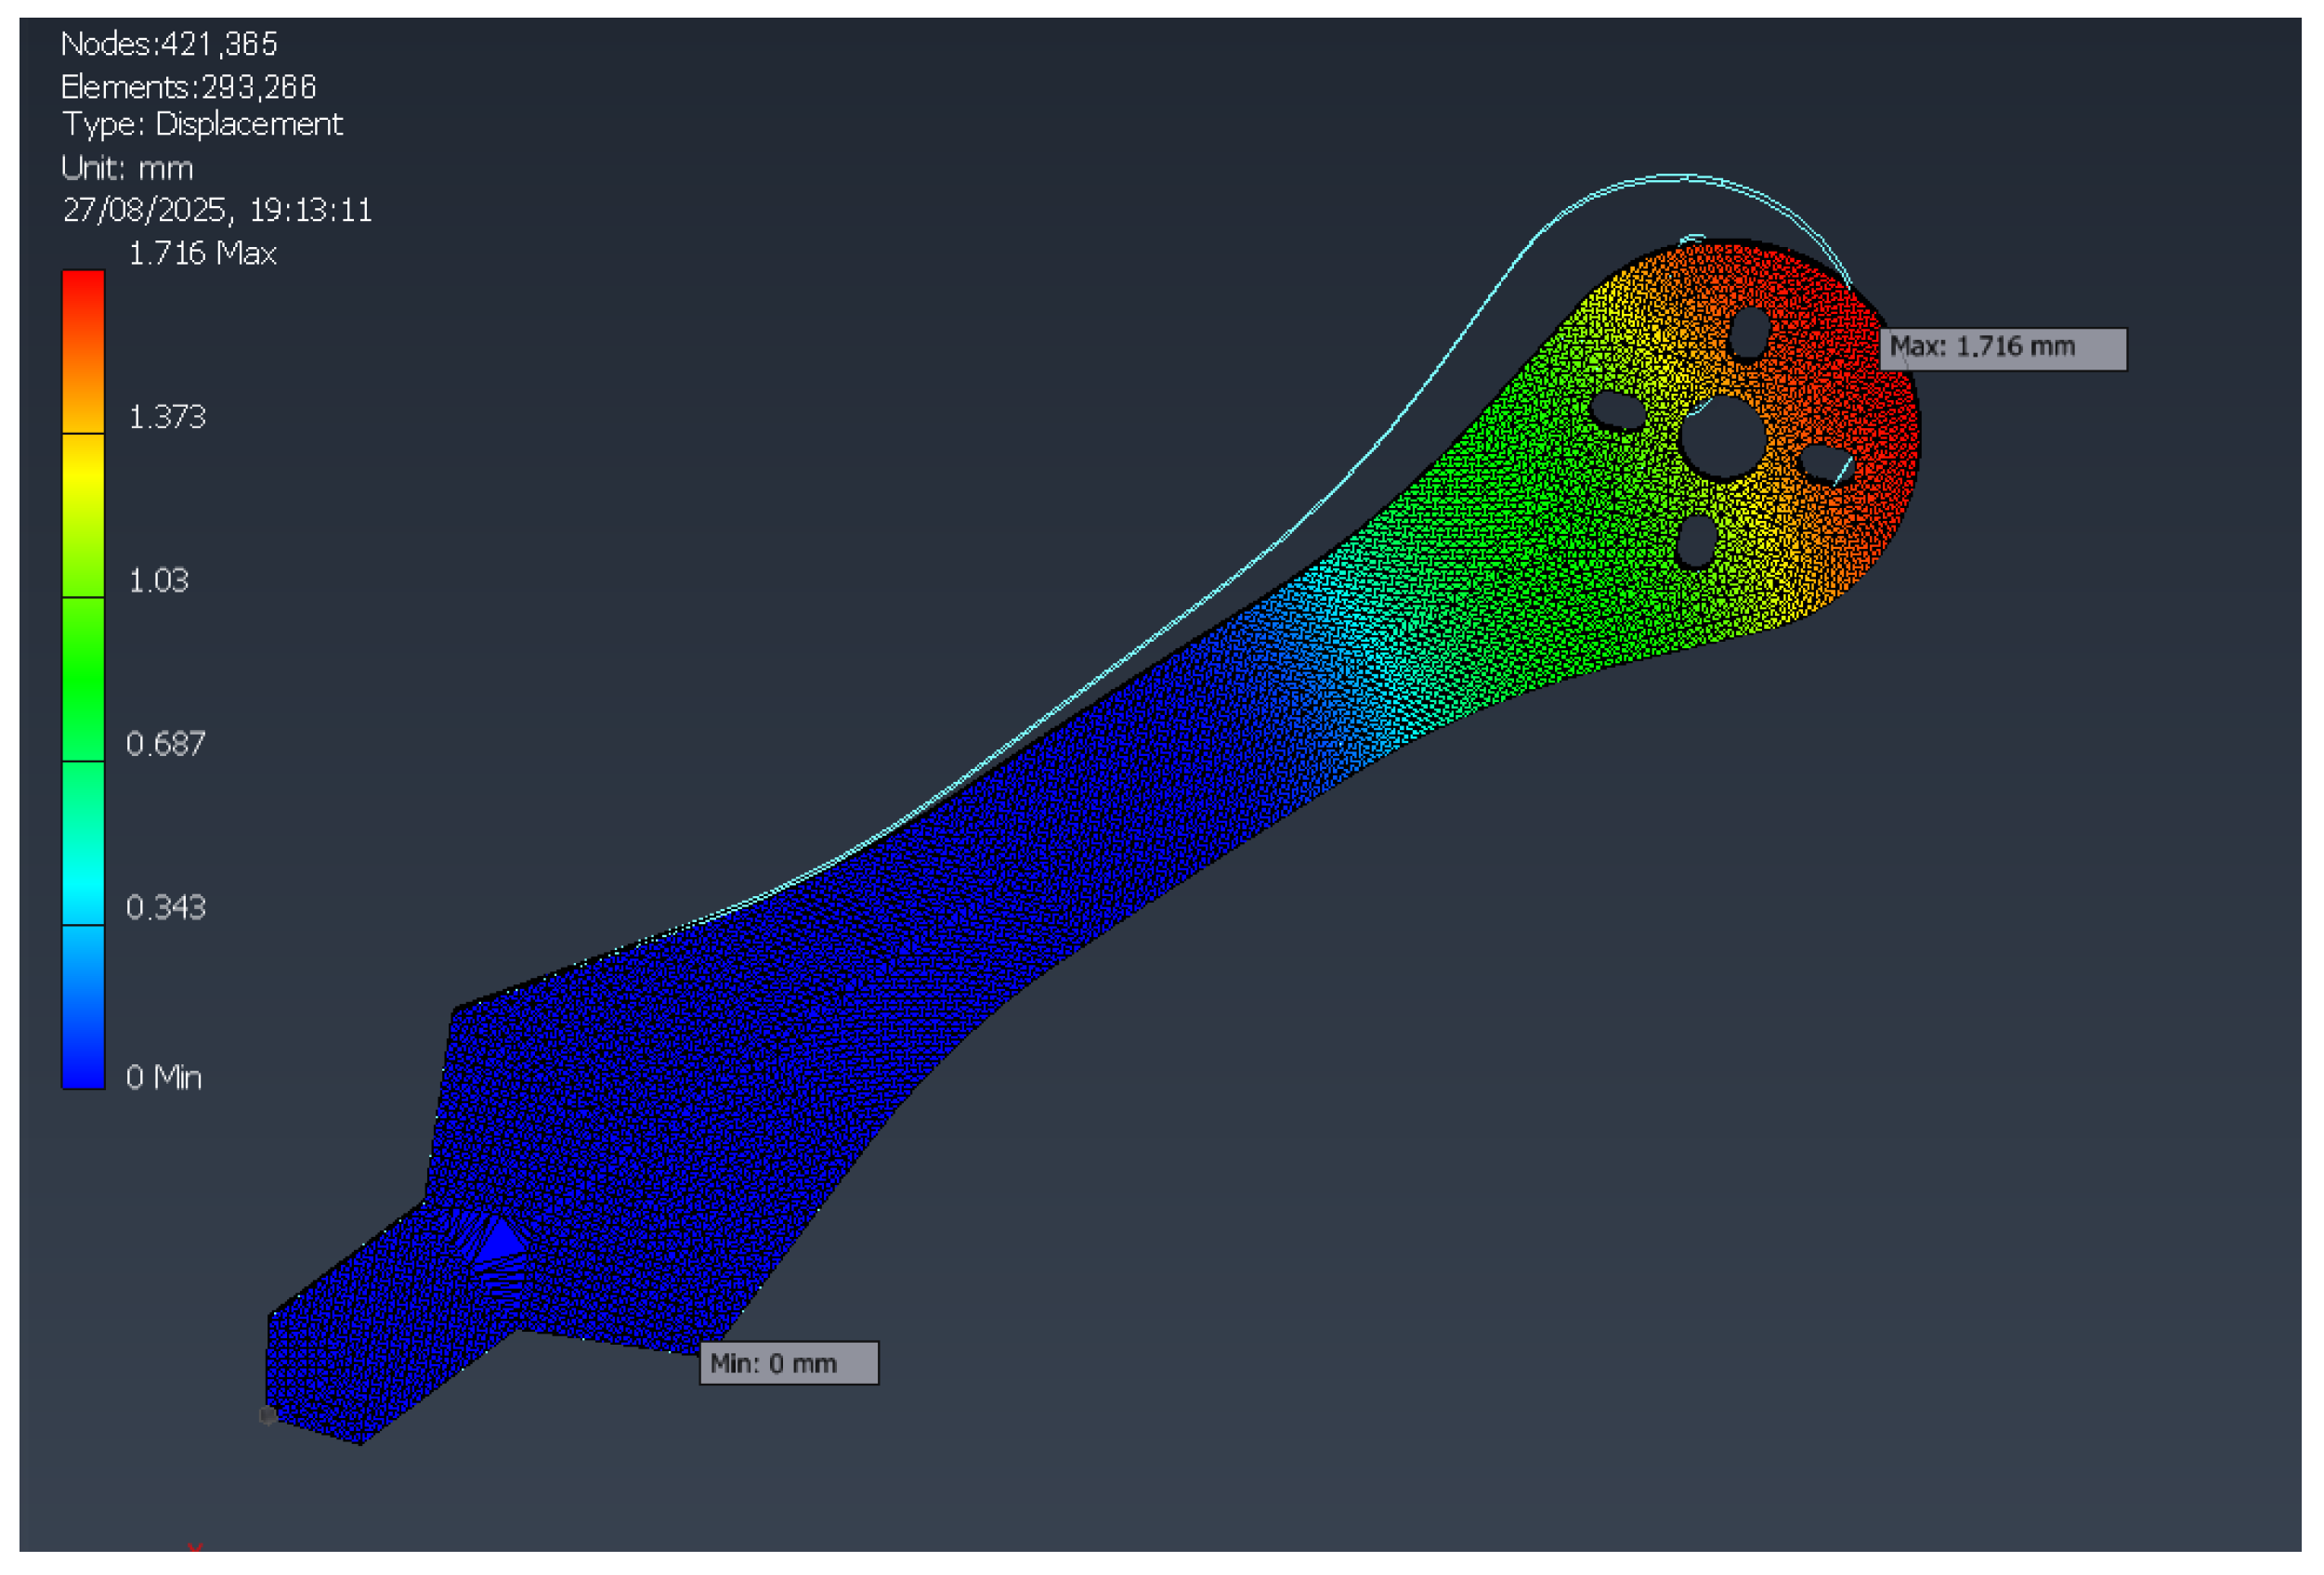
In comparison, the FEM simulation under identical loading conditions predicted a maximum displacement of 1.716 mm. The deviation between experimental and numerical results can be attributed to the conservative assumptions made in the numerical model, where the material yield strength was intentionally underestimated to account for potential manufacturing imperfections and local stress concentrations. The comparison between the experimental and numerical results is summarized in Table 18.
Although this test does not reproduce the transient nature of a real crash, it provides a reliable validation of the FEM predictions in terms of stiffness and deformation magnitude. The close agreement between experimental and numerical data supports the adequacy of the simplified modeling approach and confirms that the structure remains within the elastic regime for loads representative of a 40 km/h frontal impact scenario.
In conclusion, this preliminary static test demonstrates the robustness of the FEM model and its capacity to predict realistic deformation levels under equivalent impact conditions, while emphasizing the need for future dynamic testing to capture transient stress distributions and damping effects.
Conclusions
As a conclusive result, the analysis identified the maximum tension point (node) as the most critical location for evaluating the structural integrity of the drone frame. This node is located on the inner face of the arm subjected to bending stress during the frontal impact, where the highest Von Mises stress value of 21.78 MPa was recorded (see Figure 24).
Considering the PETG material’s yield strength of approximately 40 MPa, the safety factor is calculated as:
S F = σ y σ V M = 40 21.78 1.84
This value confirms that the frame remains within the elastic regime under the simulated conditions, providing a sufficient safety margin to prevent structural failure.
A summary of the most critical stress condition is presented in Table 19. The comparison between the nonlinear transient FEM model and the simplified static FEM model reveals significant differences in the predicted stress distribution and deformation response. The simplified model applies a static point load, which does not account for the inertial effects generated by the drone’s mass during the impact event. Consequently, it overlooks the dynamic load transfer and energy absorption mechanisms that occur under real collision conditions. These discrepancies underline the necessity of performing a nonlinear transient analysis, capable of capturing the combined influence of inertia, time-dependent loading, and geometric nonlinearity, thus providing a more accurate and physically consistent representation of the structural behavior during impact.

3.4.4. Nonlinear Transient Analysis: Free Take-Off of the Drone

This section presents the setup and results of the Finite Element Method (FEM) simulation, detailing the modeling approach, applied loads, and boundary conditions used to evaluate the drone’s structural response during take-off.
  • FEM Study
In this dynamic analysis, the structural behavior of the drone frame is studied under realistic take-off conditions. Unlike the previous maximum-thrust simulation case, the base of the model is unconstrained, allowing the system to accelerate vertically as a natural response to motor thrust.
Forces of 6.38 N per motor are applied (see Table 20), corresponding to the maximum thrust according to the data sheet. The total mass of the drone is 0.250 kg, and is coherently distributed in the model by the density adjustments described below.
The analysis is performed in Inventor Nastran using a nonlinear transient scheme, capturing accelerations, deformations, and both material and geometric nonlinear effects.
The analysis was configured using the numerical parameters listed in Table 21, where the applied mass adjustments are also presented.
Mass distribution: although only part of the drone (core and arms) was simulated, densities were adjusted so that the model faithfully represents the total 250 g mass:
  • Mass of arms and original cover: 38 g
  • PETG density: 1.27 g/ cm 3
  • To balance the total mass, the density of the core cover was artificially increased to 22.352 g/ cm 3 , achieving a total mass of 250 g without using non-physical external gravity loads.
  • Results
The peak values obtained during the analysis are summarized in Table 22. Maximum acceleration, velocity, and displacement are lower than predicted by theoretical models because part of the energy is absorbed by elastic deformations in the arms during ascent.
The maximum Von Mises stress obtained was 7.576 MPa. Considering the PETG yield strength of 40 MPa, the safety factor is calculated as follows (see Table 23):
SF dynamic = 40 MPa 7.576 MPa = 5.28
In Figure 28, the Von Mises stresses, the first and third principal stresses, as well as the maximum deformation in the drone arms during free take-off, can be observed.
Table 24 compares the main mechanical results of a static fixed-base model versus the dynamic free-takeoff model.
The comparison between the static and nonlinear transient analyses reveals that, although the Von Mises equivalent stress remains nearly unchanged in magnitude, the internal stress distribution experiences a marked transformation. In the transient case, the third principal stress ( σ 3 )—associated with local compression—increases significantly (from approximately 7.9 MPa in the static analysis to about 10.3 MPa ), while the total displacement is substantially reduced due to the free-base condition during take-off. Consequently, the safety factor decreases slightly, from 5.52 to 5.28, reflecting a more realistic and demanding load scenario.
This behavior can be explained by the dynamic response of the structure when it is allowed to move freely. Under transient conditions, part of the external load is converted into acceleration rather than deformation, so the system exhibits lower global strain but higher localized stresses. The inertial resistance of the mass acts to oppose deformation, concentrating compressive and shear stresses in specific regions such as the central hub and arm roots. Additionally, geometric reorientation and mode coupling between bending and torsion during motion generate complex triaxial stress states that amplify σ 3 .
The fact that the Von Mises stress remains almost constant indicates that the total strain energy stored in the structure is similar between both analyses. However, its directional composition changes substantially: dynamic effects redistribute the load in space and time, producing higher compressive peaks without a proportional increase in the overall energy density. This explains why the transient case shows stronger local compression but comparable global stress magnitude.
In summary, the nonlinear transient analysis captures the realistic dynamic load redistribution that occurs during take-off: inertia reduces deformation but enhances local compression, modifying the internal stress balance and slightly reducing the global safety factor. This highlights the importance of performing transient dynamic simulations to accurately predict stress concentrations and potential critical regions in lightweight aerospace structures.
  • Simplified beam model validation
This subsection validates the nonlinear transient analysis results by comparison with an analytical rigid-body model without damping, assuming instantaneous thrust application at t = 0 .
Total thrust from four motors:
F total = 4 · 6.38 = 25.52 N
Drone weight:
P = m g = 0.25 · 9.81 = 2.4525 N
Net upward force:
F net = F total P = 25.52 2.4525 = 23.0675 N
Resulting constant acceleration:
a = F net m = 23.0675 0.25 = 92.27 m / s 2
Velocity after 0.15 s:
v ( 0.15 ) = a · t = 92.27 · 0.15 = 13.84 m / s
Vertical displacement:
δ ( 0.15 ) = 1 2 a t 2 = 1 2 · 92.27 · ( 0.15 ) 2 = 1.038 m
Simulation results (t = 0.15 s) using nonlinear transient analysis:
a sim = 89.285 m / s 2
v sim = 13.396 m / s
δ sim = 1.00713 m
A comparison between the analytical rigid-body calculations and the nonlinear transient simulation results is presented in Table 25, highlighting the differences in acceleration, velocity, and displacement of the drone during take-off.
The comparison shows very good agreement between the nonlinear transient FEM simulation and the simplified analytical model. Slight differences are observed due to:
  • Elastic deformation of the arms absorbing part of the thrust energy.
  • Dynamic redistribution of mass in the flexible structure.
  • Time integration and damping effects in the FEM solver.
Overall, the FEM model provides realistic results with a safety factor above 5, confirming the structural adequacy of the drone frame for take-off conditions.

3.4.5. Forward Flight Simulation: Pitch–Moment Maneuver

  • FEM Study
To analyze the dynamic behavior of the drone during a forward manoeuvre, a nonlinear transient simulation was carried out in which a differential thrust is applied between the front and rear motors. This condition generates a pitch moment that tilts the drone forward, replicating the real operational mode during horizontal flight.
For this analysis, different forces are applied to the front and rear motors:
  • Front motors (front left and right): 3.00 N.
  • Rear motors (rear left and right): 4.00 N.
Given that the maximum thrust per motor is 6.38 N, the relative throttle percentage applied to each pair of motors is as follows:
Throttle front = 3.00 6.38 · 100 47.0 %
Throttle rear = 4.00 6.38 · 100 62.7 %
This thrust difference generates a net moment around the lateral axis (pitch), causing a forward tilt. In a real drone, this type of differential control is used precisely to induce forward movement while maintaining dynamic equilibrium.
During the simulation, the frame is fully released (no rigid constraints), allowing the free evolution of the system over time under these unbalanced forces. A nonlinear transient analysis is again employed to capture the interaction between inertia, acceleration, and structural deformation.
This scenario evaluates both the structural behavior of the frame under asymmetric dynamic conditions and the design feasibility during real control manoeuvres. The observed tilt in the simulation confirms that the model responds correctly to the applied moment, reproducing an initial forward trajectory as expected in real operation.
The simulation was performed with the same parameters as the maximum thrust study, using a time step of 0.001 s up to a total time of 0.15 s. The results at that instant are as follows:
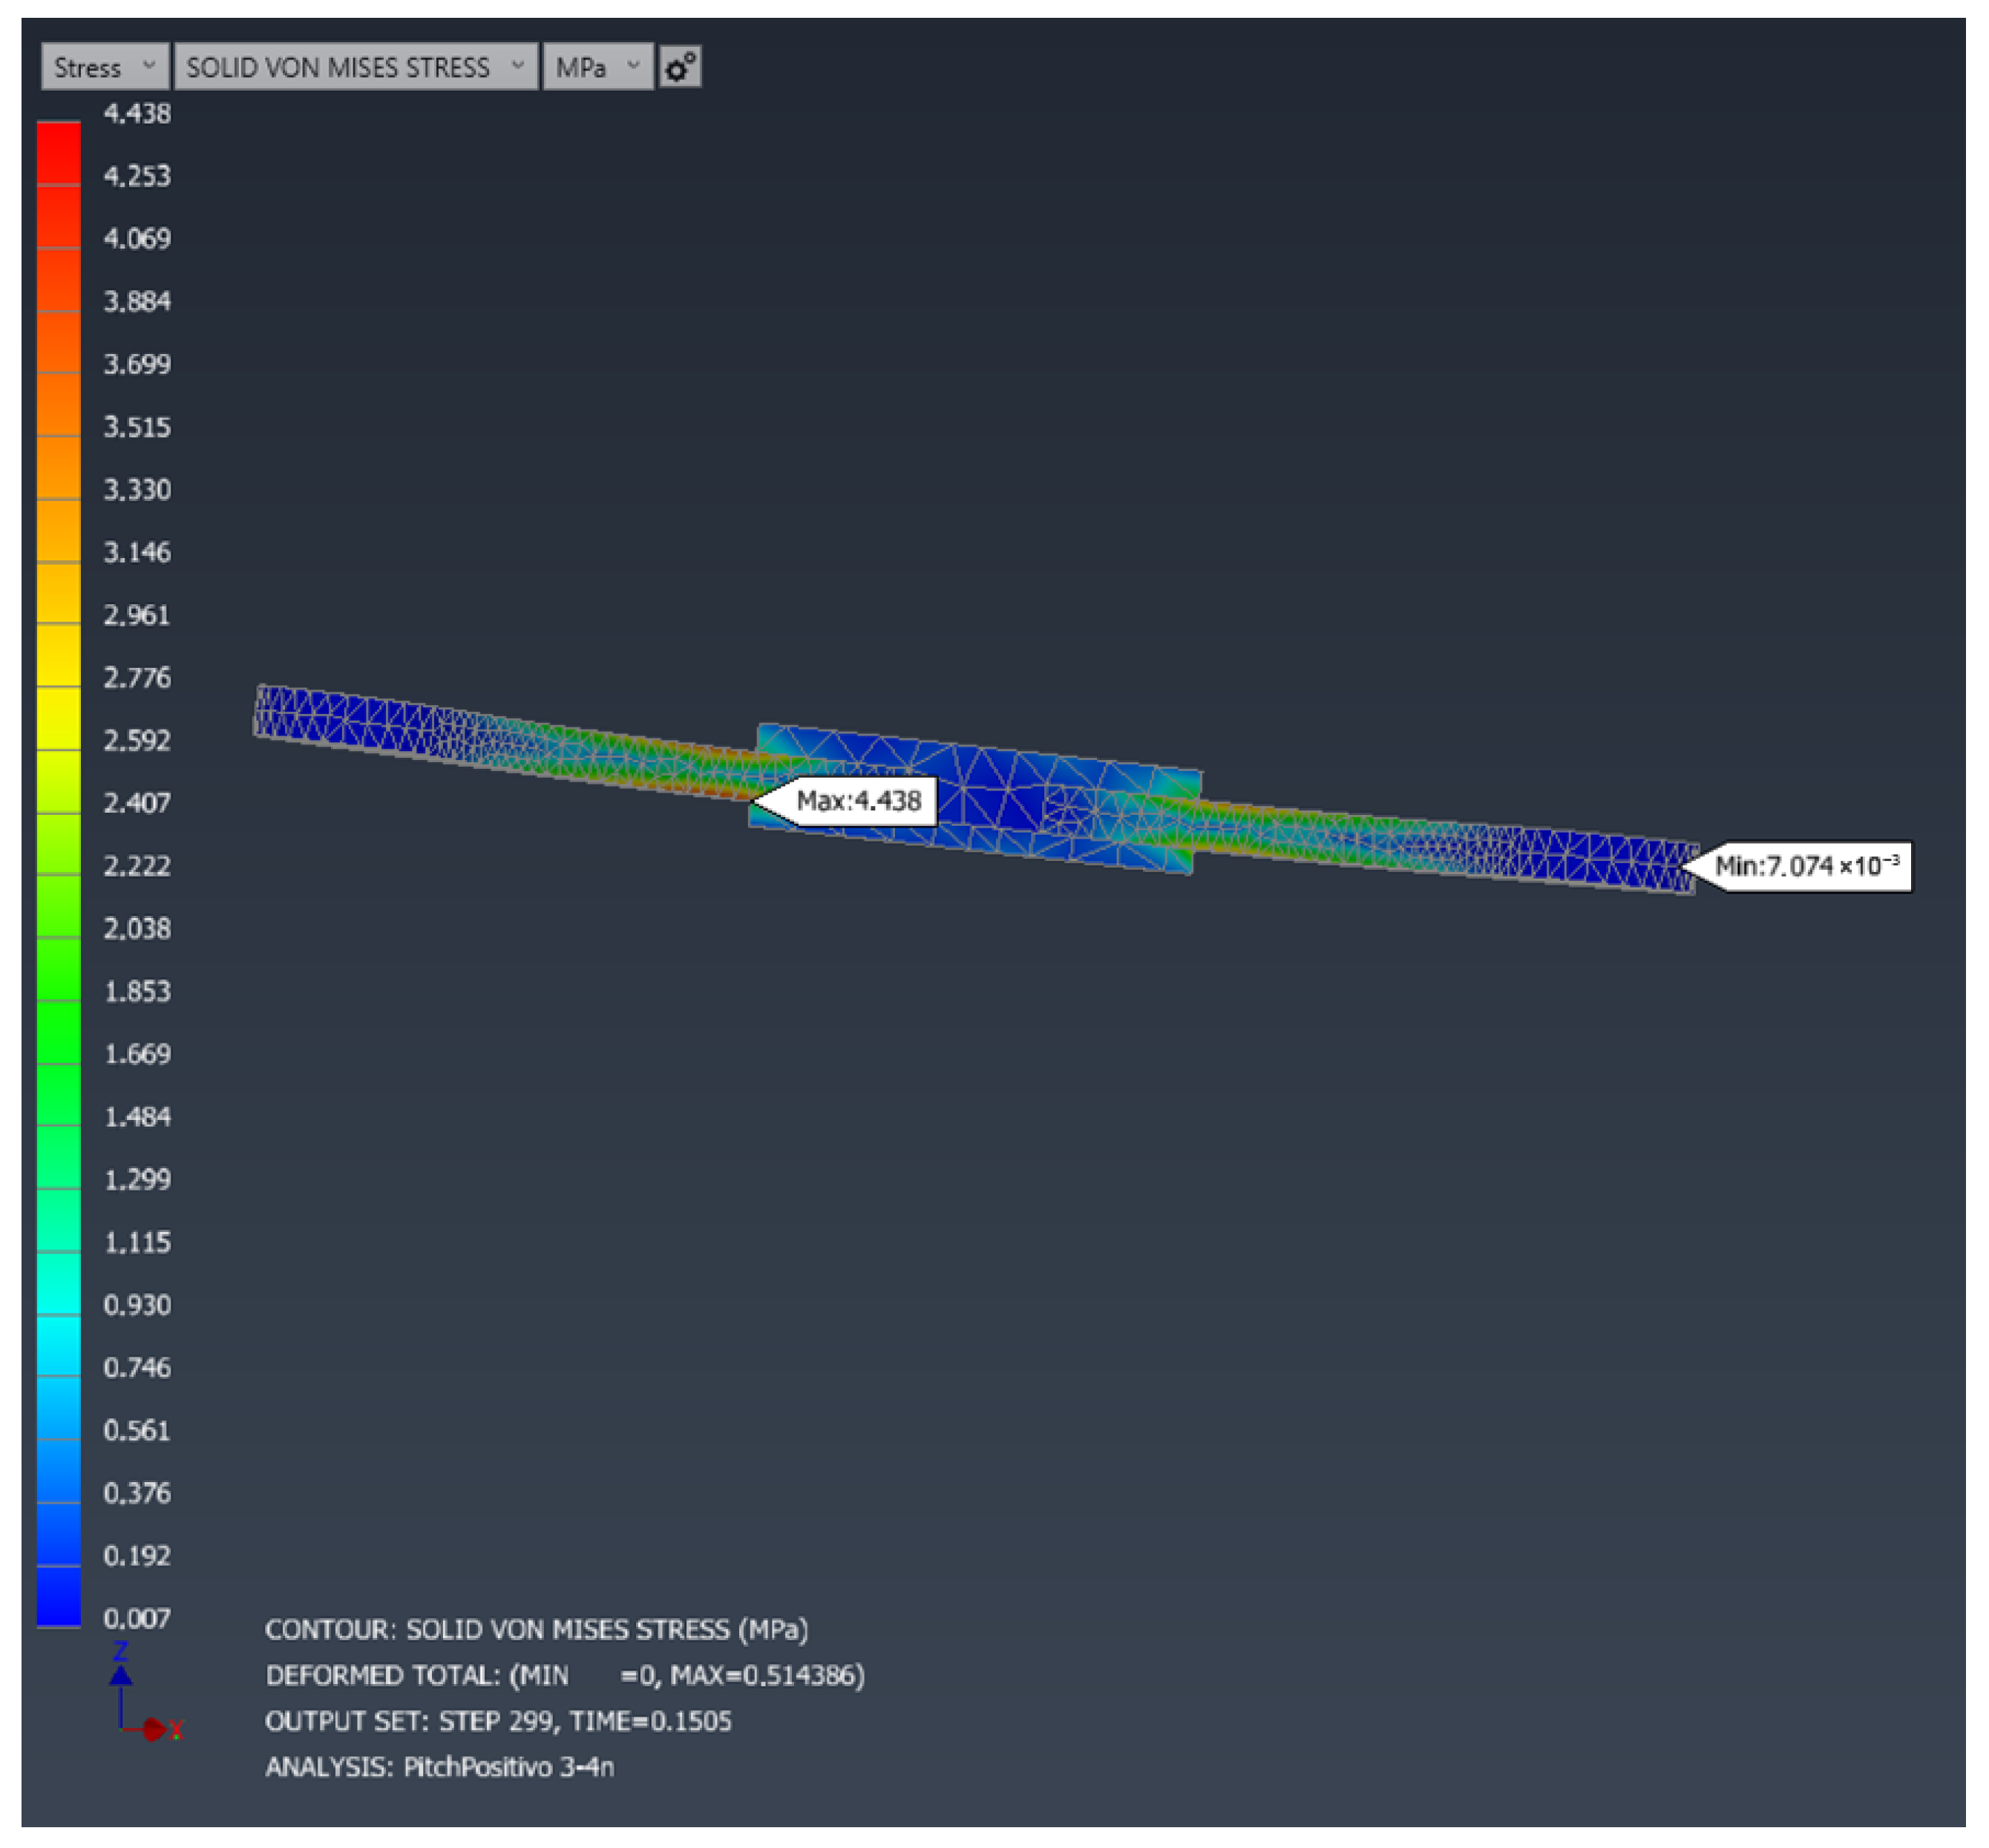
  • Maximum Von Mises stress: 4.438   M Pa .
  • Estimated safety factor: 22.0 4.438 4.96 .
  • Final velocity: 6.731   m / s 1 .
  • Approximate average acceleration: 44.67   m / s 2 .
  • Z-axis displacement: 0.514   m .
  • X–Y plane displacement: 0.5   m m .
These results match the expected behavior: the differential thrust causes a slight tilt of the drone, but the applied throttle percentage is not sufficient to generate significant forward motion. Most of the displacement occurs along the vertical axis (Z), while horizontal translation (X–Y) is minimal. It is concluded that, at this thrust level, the induced pitch does not produce significant forward movement, indicating that a higher thrust difference or longer impulse duration would be necessary to achieve effective forward motion.
The simulation conditions for the pitch maneuver are summarized in Table 26, and a representative image of the FEM simulation is shown in Figure 29.
  • Results
  • Simplified beam model validation
This section extends the model validation to a more complex control manoeuvre: a forward pitch ascent. Asymmetric thrust forces are applied instantaneously to the front and rear motors, generating both vertical acceleration and angular rotation. The objective is to compare the results with a rigid-body, undamped analytical model, evaluating both translational and rotational behavior of the drone, and to validate the fidelity of the nonlinear transient FEM simulation. The corresponding displacement field obtained from the simulation is shown in Figure 30.
At t = 0 , the rear motors apply 4 N each, while the front motors apply 3 N each, generating a total thrust and a net pitching moment:
F total = 2 · 4 + 2 · 3 = 14   N
The drone weight is as follows:
P = m g = 0.25 · 9.81 = 2.4525   N
The net vertical force is therefore
F net = F total P = 14 2.4525 = 11.5475   N
Producing an ideal vertical acceleration of
a z = F net m = 11.5475 0.25 = 46.19   m   s 2
After 0.15   s , the corresponding velocity and displacement are as follows:
v z ( 0.15 ) = a z · t = 46.19 · 0.15 = 6.93   m   s 1
δ z ( 0.15 ) = 1 2 a z t 2 = 1 2 · 46.19 · ( 0.15 ) 2 = 0.519   m
The asymmetric thrust produces a torque about the pitch axis. Considering the front–rear distance L = 0.127   m , the resulting moment is as follows:
τ pitch = ( F rear F front ) · L 2 = ( 8 6 ) · 0.0635 = 0.127   N   m
With a moment of inertia I = 0.003   k g   m 2 , the angular acceleration is as follows:
α = τ I = 0.127 0.003 = 42.33   rad   s 2
Integrating over the time interval t = 0.15   s gives the following:
ω ( 0.15 ) = α · t = 42.33 · 0.15 = 6.35   rad   s 1
θ ( 0.15 ) = 1 2 α t 2 = 1 2 · 42.33 · ( 0.15 ) 2 = 0.475   rad = 27.2 °
Hence, the inclination angle after 0.15   s is approximately 27.2 ° . Using this value, the horizontal acceleration becomes as follows:
a x = a z · sin ( θ ) = 46.19 · sin ( 27.2 ° ) = 21.1   m   s 2
and the corresponding horizontal displacement at t = 0.15   s is as follows:
δ x ( 0.15 ) = 1 2 a x t 2 = 1 2 · 21.1 · ( 0.15 ) 2 = 0.237   m
The simulation was carried out in Inventor Nastran under the same conditions as those used in the previous section, but the thrusts were modified according to the asymmetric configuration (4 N rear, 3 N front). The results at t = 0.15   s were as follows:
a z , sim = 44.67   m   s 2
v z , sim = 6.73   m   s 1
δ z , sim = 0.514   m
δ x , sim = 0.214   m
The comparison between the analytical and FEM simulation results is shown in Table 27.
The differences between analytical and FEM results remain below 10%, confirming the physical consistency of the model. The small deviations are mainly attributed to the structural flexibility of the drone arms, which absorb part of the mechanical energy during thrust application. This causes slightly lower accelerations and displacements compared to the ideal rigid-body prediction, a behavior consistent with real physical response.
The results demonstrate that the structural model behaves coherently under asymmetric thrust, reproducing both the expected vertical motion and the onset of pitch rotation. The good agreement between analytical and numerical results confirms the model’s validity for simulating dynamic manoeuvres, supporting its application to more complex control and flight analyses.
3.5. Flight Tests

To complement the numerical and simulation analyses presented in previous sections, experimental flight tests were conducted with the PETG prototype. These tests aimed to verify the dynamic behavior, stability, and performance of the system under both GPS-assisted and manual aggressive flight conditions.
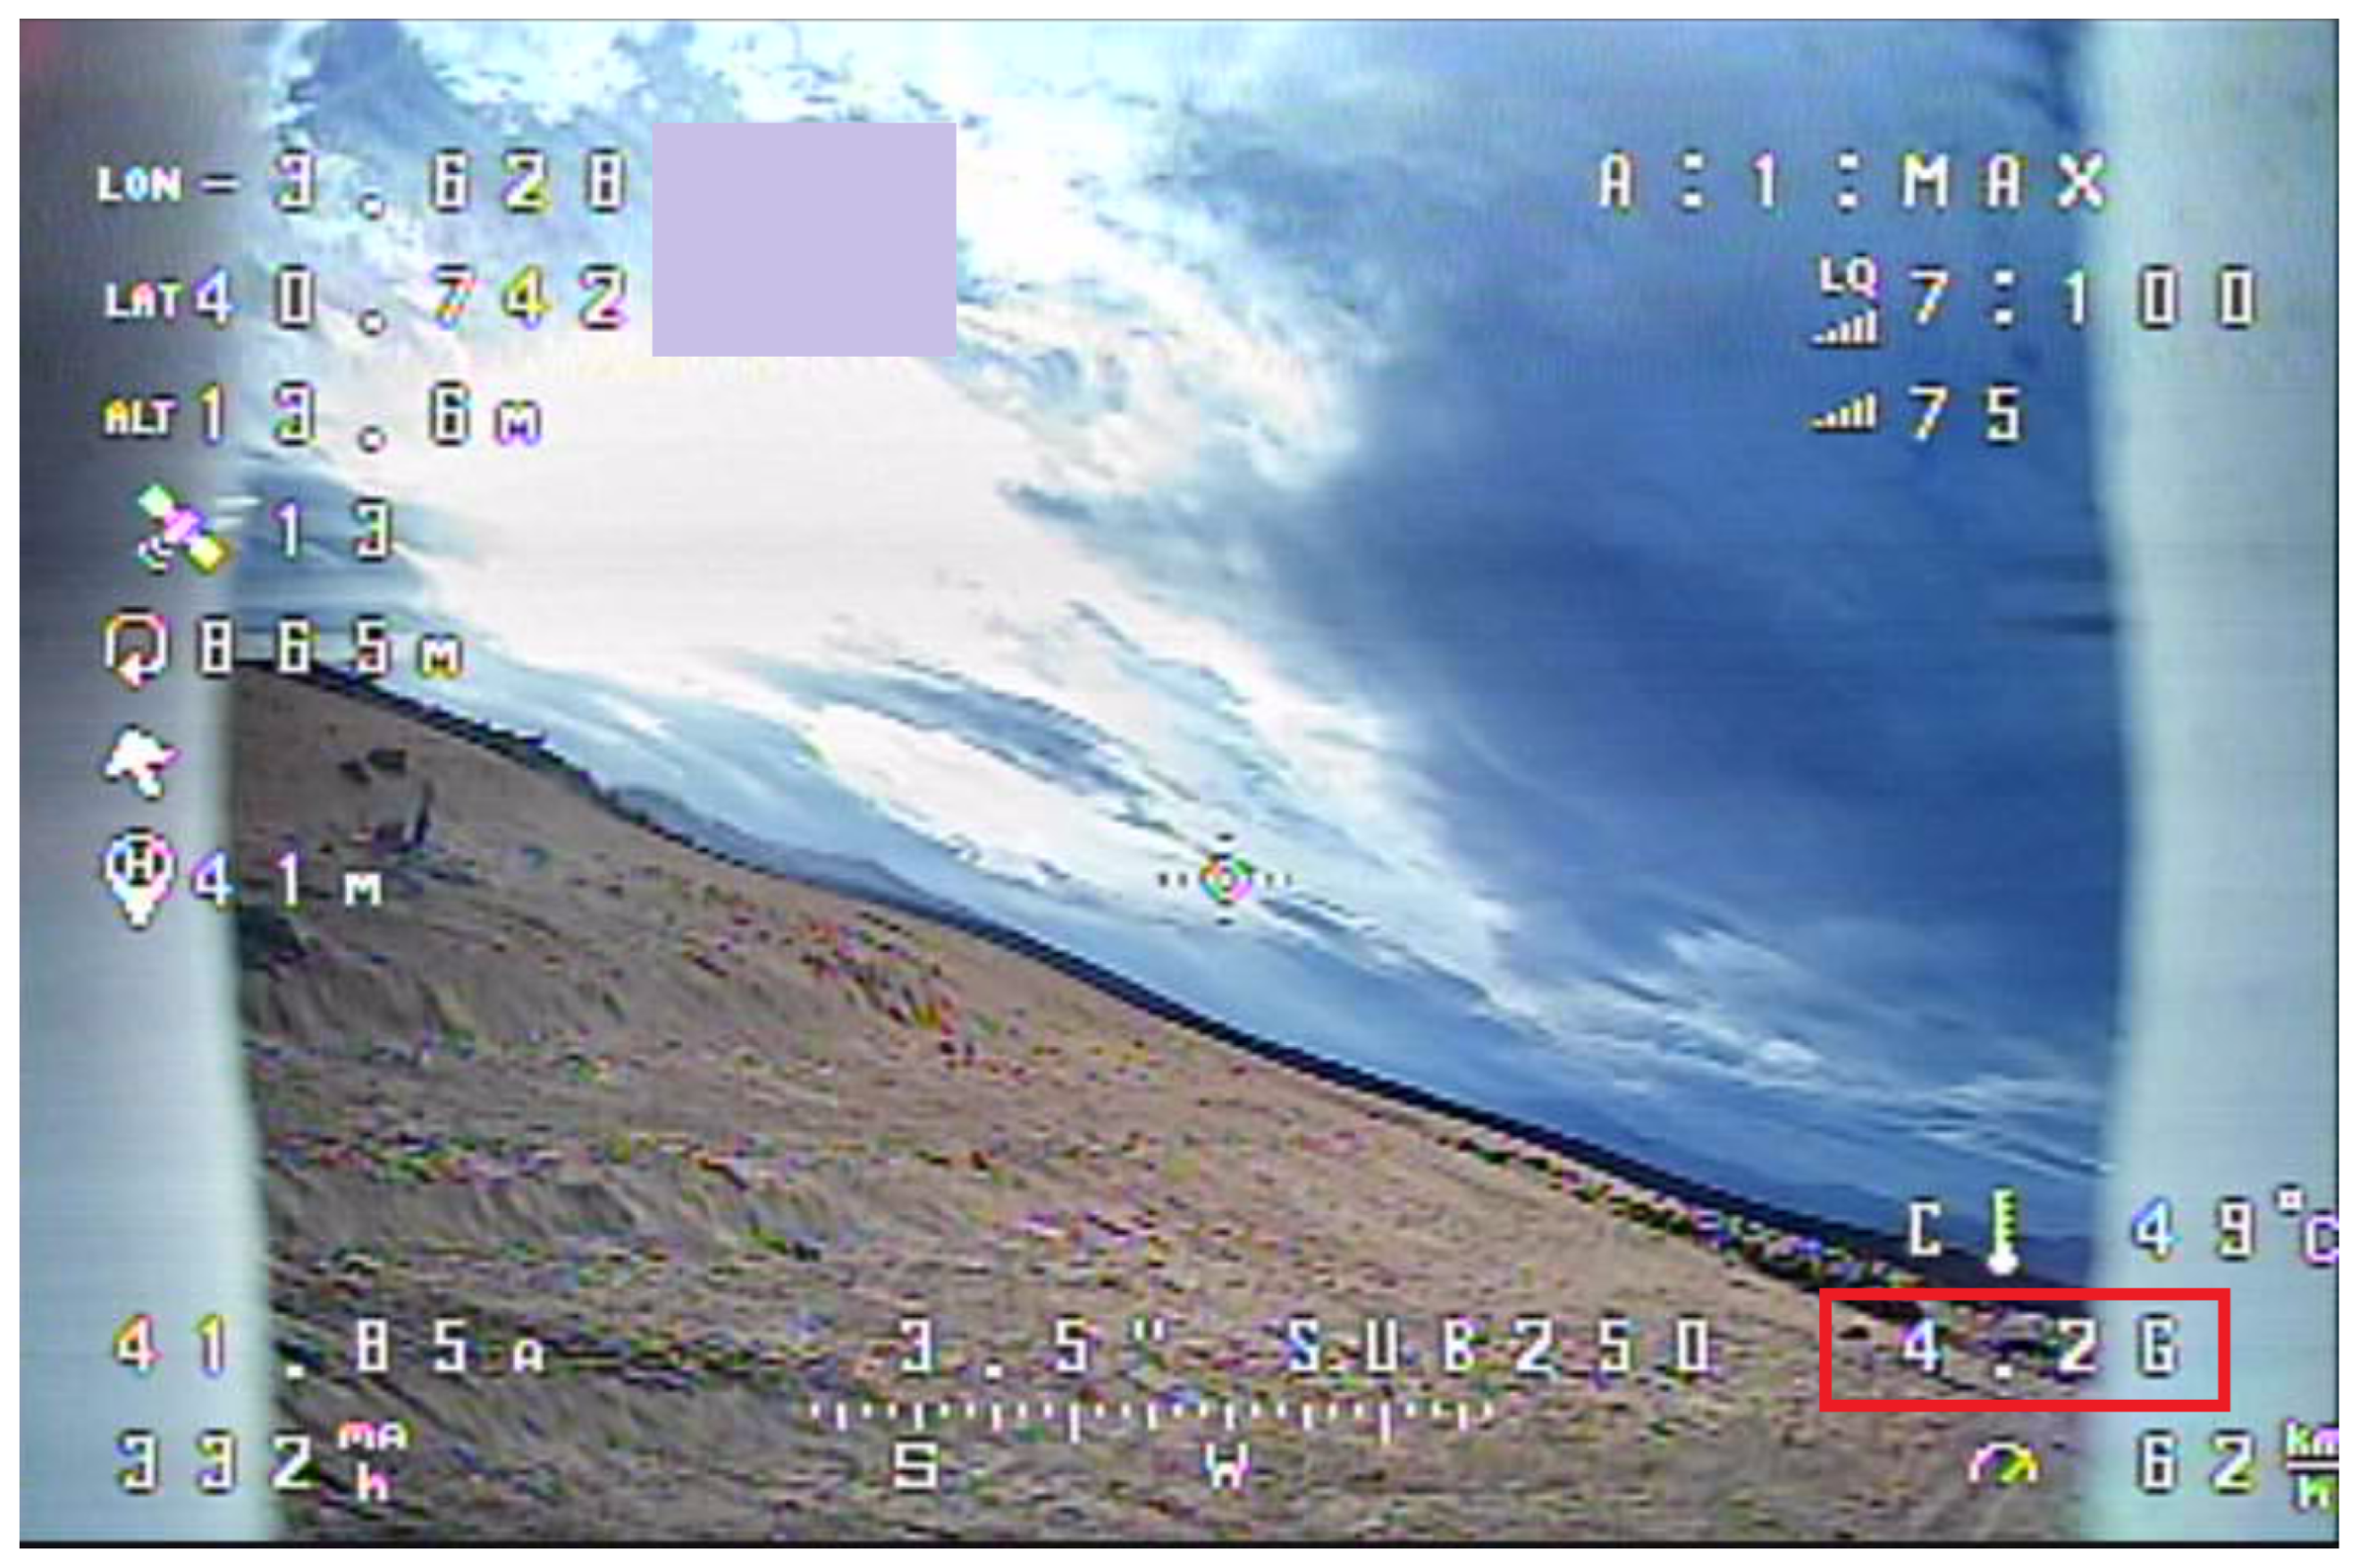
The flight data were obtained through onboard logs recorded by the Flight Controller and post-processed to extract representative velocity and acceleration profiles. Figure 31 shows the GPS-based velocity traces recorded during a typical test flight, while Figure 32 illustrates the measured peak accelerations achieved during high-thrust maneuvers
The prototype flies correctly and the chassis withstands the loads experienced during flight, including accelerations up to 4.2 g ( 41.19   m   s 2 ), abrupt changes in direction, and high-speed maneuvers reaching approximately 116 k m   h 1 .
These flight results further substantiate the proposed model and provide practical evidence of the prototype’s reliability and robustness under realistic conditions. The images presented correspond to captures from the analog On-Screen Display (OSD) of the onboard Video Transmitter (VTX), directly recorded during the test flights. An extra video is available in the Supplementary Materials.

4. Study Limitations

Despite the comprehensive methodology and validation workflow implemented in this study, several limitations should be acknowledged. First, the finite element analyses were based on an isotropic approximation of PETG mechanical properties, while FDM-printed polymers exhibit marked anisotropy depending on print orientation and process parameters. Although this assumption provided a conservative lower-bound estimate of stiffness and strength, it does not fully capture interlayer delamination or shear failure modes, which could influence real-world crash performance.
Second, while experimental validation was conducted through static bench tests and flight trials, the number of samples was limited and did not include statistical variability or long-term fatigue evaluation. Fatigue, thermal aging, and repeated impact behavior remain unexplored and could significantly affect the service life of the chassis, especially in PETG prototypes.
Third, impact simulations were performed under idealized boundary conditions, assuming a rigid obstacle and neglecting aerodynamic damping and energy dissipation through attached components such as motors and propellers. This simplification might overestimate stress magnitudes at localized regions. Furthermore, the nonlinear transient FEM used mesh discretization that introduced artificial stress concentrations, as identified in the analysis of the impact node, potentially skewing maximum stress values.
Another limitation lies in the scope of materials considered. The study focused on PETG for prototyping and quasi-isotropic carbon fiber composites for production, but did not explore intermediate or hybrid materials such as carbon-fiber-reinforced polymers with adjustable layups, which could optimize the trade-off between manufacturability and performance.
Lastly, aerodynamic effects, vibration coupling with electronic components, and control feedback dynamics were not included in the structural model. These factors could alter resonance frequencies and load distributions during real flight, requiring future integration of multi-physics co-simulation frameworks (structural–aerodynamic–control).
Addressing these limitations through extended experimental campaigns, fatigue and vibration testing, anisotropic material modeling, and coupled multi-physics simulations would enhance the robustness and predictive accuracy of future designs.

5. Conclusions

This work presented the complete design, fabrication, and structural validation of a sub-250 g FPV drone chassis through an integrated workflow combining CAD modeling, additive manufacturing, and advanced finite element simulations. The chassis was developed using FDM 3D printing in PETG, enabling low-cost and iterative prototyping, while nonlinear static and transient FEM analyses—including impact simulations at 5 m/s—provided a realistic assessment of its structural performance.
Experimental validation through static and flight tests confirmed that the proposed frame withstands operational stresses with safety factors above acceptable limits, demonstrating functional robustness during high-speed manoeuvres and impact conditions. The comparison with carbon fiber composite simulations further established the feasibility of transitioning toward lightweight, high-stiffness production models, achieving over 98% reduction in deformation and a seven-fold increase in safety margins relative to PETG.
The proposed design philosophy—screwless, modular, and inspired by traditional joinery—proved effective for maintenance, interchangeability, and structural resilience. Moreover, the workflow integrates firmware-linked validation, bridging the gap between numerical prediction and real-flight performance.
In conclusion, this study delivers a validated and scalable methodology for developing lightweight UAV structures that unite simulation-driven design, experimental verification, and practical manufacturability, setting a foundation for subsequent research in advanced materials, anisotropic modeling, and coupled aero-structural–control simulations.

Supplementary Materials

The following supporting information can be downloaded at: https://www.mdpi.com/article/10.3390/drones9110789/s1, Video S1: Return-to-Home Autonomous Flight Test., Video S2: Peak Acceleration, Velocity, and Hard Maneuver Tests.

Author Contributions

Conceptualization, B.M.A.-H. and S.A.F.; methodology, B.M.A.-H. and S.A.F.; software, S.A.F.; validation, B.M.A.-H.; formal analysis, B.M.A.-H. and S.A.F.; investigation, B.M.A.-H. and S.A.F.; resources, S.A.F.; data curation, S.A.F.; writing—original draft preparation, B.M.A.-H. and S.A.F.; writing—review and editing, B.M.A.-H. and S.A.F.; visualization, B.M.A.-H.; supervision, B.M.A.-H.; project administration, B.M.A.-H. and S.A.F. All authors have read and agreed to the published version of the manuscript.

Funding

This research received no external funding.

Data Availability Statement

The original contributions presented in this study are included in the article/Supplementary Materials. Further inquiries can be directed to the corresponding author.

Conflicts of Interest

The funders had no role in the design of the study; in the collection, analyses, or interpretation of data; in the writing of the manuscript; or in the decision to publish the results.

Abbreviations

The following abbreviations are used in this manuscript:
AIOAll-in-One
BECBattery Eliminator Circuit
BLDCBrushless Direct Current
BrushlessBrushless Motor
CDGCenter of Gravity (Spanish: Centro de Gravedad)
COGCenter of Gravity
ELRSExpress Long-Range System
ESCElectronic Speed Controller
FEAFinite Element Analysis
FDMFused Deposition Modeling
PETGPolyethylene Terephthalate Glycol-modified
CFRPCarbon Fiber Reinforced Polymer
FCFlight Controller
FEMFinite Element Method
femElectromotive Force (Spanish: Fuerza Electromotriz)
FRAMEDrone Frame (drone structure)
FPVFirst Person View
IMUInertial Measurement Unit
MCUMicrocontroller Unit
MOSFETMetal–Oxide–Semiconductor Field-Effect Transistor
PIDProportional Integral Derivative
PWMPulse Width Modulation
QUADQuadcopter (four-propeller drone)
UAVUnmanned Aerial Vehicle
VTXVideo Transmitter
WiFiWireless Fidelity
CADComputer-Aided Design
CLICommand Line Interface
OSDOn-Screen Display
VDCVolt Direct Current
TxTransmitter
RxReceiver
RSSIReceived Signal Strength Indicator
DVRDigital Video Recorder
TMCThermal Motor Coefficient
STLStereolithography File Format
.iptCAD Part File (Autodesk Inventor)
.iamCAD Assembly File (Autodesk Inventor)
.idw2D Drawing File (Autodesk Inventor)

References

  1. Kumar, V.; Singh, H.; Kumar, R. PETG/carbon fiber composites with different structures produced by 3D printing. Polym. Test. 2023, 117, 107003. [Google Scholar]
  2. Floreano, D.; Wood, R.J. Science, technology and the future of small autonomous drones. Science 2015, 349, 1–6. [Google Scholar] [CrossRef] [PubMed]
  3. Zhao, Y.; Chen, J.; Wang, X.; Yang, Q. Dynamic response and vibration analysis of lightweight UAV structures made of composites. Compos. Struct. 2019, 220, 802–812. [Google Scholar]
  4. Ammar, A.; Benali, A.; Naceur, H. Mechanical performances of printed carbon fiber-reinforced PLA and PETG composites. J. Compos. Mater. 2024, 238, 1488–1499. [Google Scholar] [CrossRef]
  5. Goyal, R.; Gupta, S.; Reddy, P.S. Digital twin-based structural health monitoring for unmanned aerial vehicles. Aerosp. Sci. Technol. 2021, 118, 107023. [Google Scholar]
  6. Wahid, K.A.; Iqbal, M.W.; Khan, M.A. A review of lightweight materials for UAV airframes. Mater. Today Proc. 2021, 47, 3832–3838. [Google Scholar]
  7. Wang, L.; Zhang, H.; Zhou, M. Simulation-driven design optimization of UAV structures manufactured by additive manufacturing. Addit. Manuf. 2020, 34, 101200. [Google Scholar]
  8. Li, X.; Sun, Y.; Zhou, Y.; Huang, G. Mechanical performance of carbon fiber composites for lightweight UAV applications. Mater. Des. 2022, 214, 110400. [Google Scholar]
  9. Pérez, J.; Martín, A.; Rodríguez, F. Lightweight structural optimization and validation of UAV composite frames. J. Intell. Robot. Syst. 2023, 107, 75. [Google Scholar]
  10. MohamedZain, A.O.; Chua, H.; Yap, K.; Uthayasurian, P.; Jiehan, T. Novel Drone Design Using an Optimization Software with 3D Model, Simulation, and Fabrication in Drone Systems Research. Drones 2022, 6, 97. [Google Scholar] [CrossRef]
  11. Singh, R.; Kumar, R.; Mishra, A.; Agarwal, A. Structural Analysis of Quadcopter Frame. Mater. Today Proc. 2020, 22, 3320–3329. [Google Scholar] [CrossRef]
  12. Nvss, S.; Esakki, B.; Yang, L.-J.; Udayagiri, C.; Vepa, K.S. Design and Development of Unibody Quadcopter Structure Using Optimization and Additive Manufacturing Techniques. Designs 2022, 6, 8. [Google Scholar] [CrossRef]
  13. Shelare, S.D.; Aglawe, K.R.; Khope, P.B. Computer Aided Modeling and Finite Element Analysis of 3-D Printed Drone. Mater. Today Proc. 2021, 47, 3375–3379. [Google Scholar] [CrossRef]
  14. Al-Haddad, L.A.; Jaber, A.A.; Giernacki, W.; Khan, Z.H.; Ali, K.M.; Tawafik, M.A.; Humaidi, A.J. Quadcopter Unmanned Aerial Vehicle Structural Design Using an Integrated Approach of Topology Optimization and Additive Manufacturing. Designs 2024, 8, 58. [Google Scholar] [CrossRef]
  15. Federal Aviation Administration (FAA). Remote Identification of Unmanned Aircraft; Final Rule. Fed. Regist. 2023, 88, 430–456. [Google Scholar]
  16. European Union Aviation Safety Agency (EASA). Easy Access Rules for Unmanned Aircraft Systems (Regulations (EU) 2019/947 and 2019/945). EASA Publ. 2023. [Google Scholar]
  17. Azambuja, R.d.; Fouad, H.; Bouteiller, Y.; Sol, C.; Beltrame, G. When Being Soft Makes You Tough: A Collision-Resilient Quadcopter Inspired by Arthropods’ Exoskeletons. arXiv 2021, arXiv:2103.04423. [Google Scholar]
  18. Lanzotti, A.; Martorelli, M.; Staiano, G. The Influence of FDM Process Parameters on Tensile Strength of PETG Parts. Materials 2021, 14, 2623. [Google Scholar] [CrossRef]
  19. ASM International. ASM Handbook, Volume 21: Composites, 2nd ed.; ASM International: Materials Park, OH, USA, 2019. [Google Scholar]
  20. Huang, J.; Zhang, D.; Liu, W. Mechanical Characterization of Quasi-Isotropic Carbon Fiber/Epoxy Laminates for UAV Frame Applications. J. Compos. Mater. 2020, 54, 2765–2778. [Google Scholar]
  21. Akano, T.T.; Soremekun, G.A.; Shitta, M.B.; Oke, S.A. The Deformation Response of a Functional Four-Cylinder Reciprocating Engine using FEM and a Surrogate Model. J. Eng. Sci. Technol. Rev. 2023, 16, 59–65. [Google Scholar] [CrossRef]
  22. Doğan, S.Ö.; Anık, B.G.; Göktaş, U. Vertical Water Silo Design and Analysis. Int. J. Comput. Exp. Sci. Eng. (IJCESEN) 2023, 9, 313–319. [Google Scholar]
  23. Ghimouz, C.; Kenné, J.P.; Hof, L.A. On Sustainable Design and Manufacturing for the Footwear Industry—Towards Circular Manufacturing. Mater. Des. 2023, 233, 112224. [Google Scholar] [CrossRef]
  24. Mereuta, V. Static Analysis of Wheel Rim Using Inventor Software. Int. J. Res. Appl. Sci. Eng. Technol. (IJRASET) 2021, 9, 516–521. [Google Scholar] [CrossRef]
  25. Mereuta, V. Analysis of Torsen Differential Using Autodesk Inventor Nastran. Int. J. Res. Appl. Sci. Eng. Technol. (IJRASET) 2023, 11, 829–835. [Google Scholar] [CrossRef]
  26. Sepahi, M.; Abusalma, H.; Jovanovic, V.; Eisazadeh, H. Mechanical Properties of 3-D-Printed Parts Made of Polyethylene Terephthalate Glycol. J. Mater. Eng. Perform. 2021, 30, 4813–4823. [Google Scholar] [CrossRef]
  27. Özen, A.; Ganzosch, G.; Barchiesi, E.; Auhl, D.W.; Müller, W.H. Investigation of Deformation Behaviour of PETG-FDM-Printed Metamaterials. SAGE Open Eng. 2021, 10, 1–14. [Google Scholar]
  28. Kumar, S.; Singh, R.; Ahuja, I.P.S. Effect of Printing Parameters on the Thermal and Mechanical Properties of 3D-Printed PLA and PETG Using Fused Deposition Modeling. Polymers 2021, 13, 1758. [Google Scholar] [CrossRef]
  29. Özen, A.; Auhl, D.A. Modeling of the Mechanical Properties of Fused Deposition Modeling (FDM) Printed Fiber-Reinforced Thermoplastic Composites. SAGE Open Eng. 2022, 12, 1–13. [Google Scholar] [CrossRef]
  30. Zhang, Y.; Chen, H.; Li, J.; Wang, P. Mechanical Properties and Numerical Simulation of FDM 3D-Printed PETG/Carbon Composite Unit Structures. J. Mater. Res. Technol. 2023, 23, 656–669. [Google Scholar]
  31. Ahmed, H.; Zhao, Y.; Kumar, R. Evaluation of Mechanical Properties of 3D-Printed PETG and Polyamide (6) Polymers. Chem. Phys. Impact 2024, 8, 100491. [Google Scholar]
  32. Seibel, S.; Kiendl, T. A finite element approach for modelling the fracture. In Progress in Additive Manufacturing; Springer: Berlin/Heidelberg, Germany, 2025. [Google Scholar]
  33. Somireddy, M.; Czekanski, A.; Atre, S. Modelling of Failure Behaviour of 3D-Printed Composite Parts. Appl. Sci. 2022, 12, 10724. [Google Scholar] [CrossRef]
  34. Gonabadi, H.; Zamani Miandashti, M.; Oila, A. Micro-mechanical characterisation of 3D-printed composites via nano-indentation and finite-element homogenization techniques. In Progress in Additive Manufacturing; Springer: Berlin/Heidelberg, Germany, 2025. [Google Scholar]
  35. Chen, Y.; Ye, L. Path-Dependent Progressive Failure Analysis for 3D-Printed Continuous Carbon Fibre Reinforced Composites. Chin. J. Mech. Eng. 2024, 37, 72. [Google Scholar] [CrossRef]
Figure 1. General view of the drone 3D assembly in Autodesk Inventor.
Drones 09 00789 g001
Figure 2. Partial exploded views and final assembly figure.
Drones 09 00789 g002
Figure 3. Steps of the fabrication process for the UAV structure.
Drones 09 00789 g003
Figure 4. Von Mises stress distribution during hovering flight.
Drones 09 00789 g004
Figure 5. Total displacement map during hovering flight.
Drones 09 00789 g005
Figure 6. Von Mises stress distribution in the individual drone arm under a 0.625 N load.
Drones 09 00789 g006
Figure 7. Displacement field in the individual drone arm under a 0.625 N load.
Drones 09 00789 g007
Figure 8. Von Mises stress distribution under maximum thrust. Stress concentration is observed at the arm–frame junction.
Drones 09 00789 g008
Figure 9. Total displacement map under maximum thrust. Maximum displacement of 2.43 mm occurs at the free ends of the arms.
Drones 09 00789 g009
Figure 10. Von Mises Stress analysis of a single drone arm under 6.38 N load.
Drones 09 00789 g010
Figure 11. Displacement analysis of a single drone arm under 6.38 N load.
Drones 09 00789 g011
Figure 12. Total displacement distribution for the carbon fiber structure under maximum thrust. Maximum displacement of 0.038 mm occurs at the free end of the arms.
Drones 09 00789 g012
Figure 13. Third principal stress distribution in the carbon fiber model under maximum thrust, showing compression zones near the arm–frame junction.
Drones 09 00789 g013
Figure 14. Deformation test.
Drones 09 00789 g014
Figure 15. Meshed drone model in Inventor Nastran, with boundary and contact conditions against a rigid cylinder.
Drones 09 00789 g015
Figure 16. Detail of the adaptive meshing.
Drones 09 00789 g016
Figure 17. Boundary conditions between the drone’s arm and the cylinder.
Drones 09 00789 g017
Figure 18. Loads applied to the model.
Drones 09 00789 g018
Figure 19. Von Mises stress representation of the frame at t = 0.01 s .
Drones 09 00789 g019
Figure 20. Detail of Von Mises stresses of the frame at t = 0.01 s .
Drones 09 00789 g020
Figure 21. Frame displacement representation at t = 0.01 s .
Drones 09 00789 g021
Figure 22. Frame displacement representation at t = 1 s .
Drones 09 00789 g022
Figure 23. Von Mises stress representation of the frame at t = 1 s .
Drones 09 00789 g023
Figure 24. Detail of Von Mises stresses of the frame at t = 1 s .
Drones 09 00789 g024
Figure 25. Von Mises stresses of the static analysis with F = 27.5 N at 45 ° .
Drones 09 00789 g025
Figure 26. Displacements from static analysis with F = 27.5 N at 45 ° .
Drones 09 00789 g026
Figure 27. Static test setup reproducing the equivalent load of a 40 km/h frontal impact (2 kg ≈ 19.4 N).
Drones 09 00789 g027
Figure 28. Stress, deformation distribution, and deformation during free take-off.
Drones 09 00789 g028
Figure 29. Von Mises stress distribution during forward manoeuvre.
Drones 09 00789 g029
Figure 30. Total displacement map during forward manoeuvre.
Drones 09 00789 g030
Figure 31. GPS-based max velocity of 116 km/h recorded during flight tests.
Drones 09 00789 g031
Figure 32. Measured peak acceleration of 4.2G during aggressive flight maneuvers.
Drones 09 00789 g032
Table 1. Comparison of the proposed method with other works.
WorkFrame PhilosophyAnalysis ScopeValidation/EvidenceMaterials/Mfg. Focus
Proposed work (FPV sub-250 g)Interchangeable arms; screwless, Japanese-joinery-inspired interfaces; repair-first designNonlinear transient FEM; static checks; firmware/flight constraintsBench loading vs. FEM; in-flight telemetry validationPETG for prototyping; CFRP for production
MohamedZain et al. (2022) [10]Modular via generative CAD; 3D-printed prototypesLinear static FEACAD/FEA trade-off; fabrication demoThermoplastic AM
Nvss et al. (2022) [12]Unibody/monocoque; DFAM for reduced assemblyTopology optimizationAM demo; structural targetsAdditive manufacturing focus
Singh et al. (2020) [11]Conventional plate-and-armFEM (static; modal/
explicit parts)
Simulation-driven, limited experimentsGeneric manufacturing
Shelare et al. (2021) [13]3D-printed droneCAD and static FEMNumerical with print feasibilityThermoplastic AM
CogniFly (Azambuja et al., 2021) [17]Collision-resilient, semi-rigidEmpirical design, crash focusSurvives ≤7 m/s collisionsLow-cost materials
Al-Haddad et al. (2024) [14]Optimization-driven frame layoutTopology optimization and AMMethod validation (no FPV flight dynamics)AM methodology
Table 2. Mechanical properties of PETG (FDM-printed) vs. carbon fiber composite (CFRP, quasi-isotropic layup [0/90/±45]s).
PropertyPETG (XY Plane)CFRP (Quasi-Isotropic [0/90/±45]s)Units
Young’s Modulus (E)2100135,000MPa
Tensile Strength50600MPa
Yield Strength (0.2% offset)40320MPa
Elongation at Break151.8%
Density12701550kg/m3
Poisson’s Ratio0.380.33
Shear Modulus76054,000MPa
Plastic BehaviorElastic—perfectly plasticLinear elastic
Table 3. Principal printing parameters of the profile used for the arms.
No.ParameterValueDescription
1Layer height0.2 mmThickness of each layer. Balance between quality and speed.
2Line width0.66 mmWider extrusion line to improve strength.
3Infill density100%Solid printing suitable for functional, load-bearing parts.
4Infill patternGridGrid pattern for greater structural uniformity.
5Nozzle temperature230 °CExtruder temperature suitable for filaments such as PLA+ or PETG.
6Bed temperature70 °CImproves first-layer adhesion and reduces warping.
7Print speed60 mm/sMedium speed—compromise between quality and time.
8Wall speed30 mm/sHalf the general speed for better surface finish.
9Initial layer speed15 mm/sReduced speed to ensure good base adhesion.
10CoolingEnabledLayer fan active for rapid solidification.
11Bed adhesionNoneNo brim, raft, or skirt used.
12SupportsNoThe part does not require support structures.
Table 4. Main printing parameters used for the drone base.
No.ParameterValueDescription
1Layer height0.2 mmGood balance between detail and printing speed.
2Line width0.66 mmConsistent with the rest of the chassis to maintain strength.
3Infill density40%Partial infill to lighten the base plate.
4Infill patternGridBalanced distribution of material for stiffness.
5Nozzle temperature230 °CAdjusted for good interlayer adhesion.
6Bed temperature70 °CGuarantees good initial adhesion.
7Print speed60 mm/sStandard printing speed.
8Wall speed30 mm/sReduces visible edge imperfections.
9Initial layer speed15 mm/sFacilitates first-layer adhesion.
10CoolingEnabledImproves surface finish and prevents distortions.
11Bed adhesionNoneAdequate without additional aids.
12SupportsNoGeometry optimized to print without supports.
Table 5. Minimum mechanical properties for PETG printed by FDM used in the analysis.
PropertyPlane XYPlane Z
Young’s modulus E [MPa]21001600
Tensile strength [MPa]5035
Yield strength (0.2% offset) [MPa]4025
Elongation at break [%]155
Density [kg/ m 3 ]1270
Poisson’s ratio0.38
Plastic behaviorElastic—perfectly plastic
Table 6. Simulation conditions for hovering flight.
ParameterValue
Total drone mass250 g
Load per arm0.613 N
Total force2.452 N
Total acceleration9.81 m/s2
Total acceleration (G)1.0 G
Load directionVertical upward
ConstraintsChassis base fixed
Analysis typeLinear static
Failure criterionVon Mises (maximum stress)
Mesh size0.1 mm
Table 7. Structural results during hovering flight.
MagnitudeMinimumMaximum
Von Mises stress0.00056 MPa0.70 MPa
First principal stress−0.05 MPa0.80 MPa
Third principal stress−0.76 MPa0.11 MPa
Total displacement0 mm0.234 mm
Safety factor57.00N/A
Table 8. Comparison of Von Mises stresses and maximum displacements under hovering load ( 0.625 N).
CaseVon Mises Stress (MPa)Max. Displacement (mm)
Simplified cantilever beam1.050.327
Individual arm
(CAD model)
0.770.3266
Assembled arm0.690.234
Table 9. Simulation conditions under maximum motor thrust.
ParameterValue
Thrust per motor650 g
Force per arm6.38 N
Total force25.51 N
Drone mass250 g
Total acceleration102.02 m/s2
Acceleration (G)10.4 G
Load directionVertical upward
Boundary conditionFrame base fixed
Analysis typeLinear static
Failure criterionVon Mises (maximum stress)
Mesh size0.1 mm
Table 10. Structural results under maximum motor thrust.
MagnitudeMinMax
Von Mises stress0.0059 MPa7.25 MPa
First Principal stress−0.52 MPa8.34 MPa
Third Principal stress−7.88 MPa1.19 MPa
Total displacement0 mm2.43 mm
Safety factor5.52N/A
Table 11. Comparison of Von Mises stress and maximum displacements under elevated load (6.38 N).
Case AnalyzedVon Mises Stress (MPa)Max Displacement (mm)
Simplified beam (theoretical model)10.713.34
Individual arm
(CAD model)
7.933.34
Arm in full drone assembly7.252.43
Table 12. Comparison of structural results between PETG and carbon fiber under maximum thrust.
MagnitudePETGCarbon Fiber
Von Mises stress (max)7.25 MPa7.25 MPa
First Principal stress (max)8.34 MPa8.38 MPa
Third Principal stress (min)−7.88 MPa−7.91 MPa
Total displacement (max)2.43 mm0.038 mm
Yield strength40 MPa300 MPa
Safety factor5.5241.38
Table 13. Experimental validation of a single arm under static load equivalent to 625 g (6.13 N), corresponding to a 10 G acceleration.
SampleApplied Load (N)Measured Disp. (mm)FEM Disp. (mm)Error (%)
16.131.83.3446.1
Table 14. Main parameters used in the analysis.
Analysis typeSOL 129—Nonlinear transient response
Large displacementsEnabled (PARAM, LGDISP, 1)
UnitsInternational System (m, kg, s)—PARAM, UNITS, M
Rayleigh damping α = 1.0 × 10 3 , β = 1.0 × 10 3
MaterialPETG: E = 2.1 × 10 3 MPa, ν = 0.36 , ρ = 1270 kg / m 3
Initial velocity11 m/s through initial conditions (IC)
CollisionAgainst rigid cylinder (tree), without penetration
External forcesForce of 2.5 N at the base in -Z direction (drone weight of 250 g) and four forces of 0.625 N at the motors in +Z direction (lift)
Integration parametersTime step: 1 × 10 6 s; iterations: 1000; duration: 0.01 s
Table 15. Physical variables extracted during the analysis.
VariableConfigured Output
Nodal displacementDISPLACEMENT(PLOT) = ALL
VelocityVELOCITY(PLOT) = ALL
AccelerationACCELERATION(PLOT) = ALL
Corner stressSTRESS(PLOT,CORNER) = ALL
Corner strainSTRAIN(PLOT,CORNER) = ALL
Internal forcesFORCE(PLOT) = ALL
Table 16. Comparison of stresses and displacements at the analyzed instants (material: PETG).
Instant (s)Maximum Displacement (mm)Max. Von Mises (MPa)Safety Factor (SF)
0.012.39329.681.35
1.003.65741.780.96
Table 17. Comparison of stresses and displacements under inclined static load of 27.5 N.
CaseVon Mises Stress (MPa)Max. Displacement (mm)
Simplified beam (theory)23.082.55
Individual arm (FEM)11.161.716
Table 18. Comparison between experimental and FEM displacements under equivalent frontal impact load (19.44 N ≈ 2 kg).
SampleApplied Load (N)Measured Disp. (mm)FEM Disp. (mm)Error (%)
119.441.251.71627.1
Table 19. Summary of maximum stress and safety factor for the most critical node.
Critical PointVon Mises Stress [MPa]Safety Factor (SF)
Maximum tension point (inner arm face)21.781.84
Table 20. Simulation conditions of the nonlinear transient analysis.
ParameterValue
Thrust per motor6.38 N
Total applied force25.52 N
Drone mass250 g
Analysis typeNonlinear transient
Analysis duration0.15 s
ConstraintsFree body
Failure criterionVon Mises
Table 21. Numerical parameters used in the simulation.
ParameterValue
Time step size0.001 s
Number of steps150
Rayleigh damping α 0.001
Rayleigh damping β 0.001
Table 22. Final results of the nonlinear transient analysis.
QuantityResultUnit
Final velocity13.396m/s
Maximum acceleration89.285m/ s 2
Total displacement1.007m
Table 23. Safety factor with respect to Von Mises stress.
QuantityResultUnit
Maximum Von Mises stress7.576MPa
PETG yield strength40MPa
Safety factor5.28
Table 24. Comparison between static and dynamic analysis results.
QuantityStatic (fixed)Dynamic (Take-Off)Relative Difference
Max. Von Mises stress7.25 MPa7.576 MPa+4.49%
First Principal stress (max.)8.34 MPa10.346 MPa+24.03%
Third Principal stress (max.)1.19 MPa2.722 MPa+128.66%
Max. total deformation2.43 mm0.45 mm-81.48%
Safety factor5.525.28–4.35%
Table 25. Comparison between analytical rigid-body model and nonlinear transient simulation.
QuantityAnalyticalSimulationRelative Difference
Acceleration [m/ s 2 ]92.2789.285−3.23%
Velocity [m/s]13.8413.396−3.17%
Displacement [m]1.0381.007−2.97%
Table 26. Simulation conditions for forward maneuver with pitch moment.
ParameterValue
Front thrust (per motor)3.00 N
Rear thrust (per motor)4.00 N
Front throttle (%)47.0 %
Rear throttle (%)62.7 %
Load directionVertical (unbalanced)
Expected resultForward tilt (positive pitch)
ConstraintsNone (free body)
Analysis typeNonlinear transient
Simulation duration0.15 s
Integration step0.001 s
Table 27. Comparison between analytical model and FEM simulation for the pitch manoeuvre.
QuantityAnalyticalSimulationDifference (%)
Vertical acceleration ( m / s 2 )46.1944.673.3
Vertical velocity ( m / s )6.936.732.9
Vertical displacement ( m )0.5190.5141.0
Horizontal displacement ( m )0.2370.2149.7
Pitch angle (°)27.225.85.2
Disclaimer/Publisher’s Note: The statements, opinions and data contained in all publications are solely those of the individual author(s) and contributor(s) and not of MDPI and/or the editor(s). MDPI and/or the editor(s) disclaim responsibility for any injury to people or property resulting from any ideas, methods, instructions or products referred to in the content.