Abstract
Natural disasters often compromise telecommunications infrastructure, leading to unstable services or complete communication blackouts that hinder rescue operations and exacerbate victims’ distress. Rapidly deployable alternatives are, therefore, critical to sustaining reliable connectivity in affected regions. This work proposes a self-organizing multi-Unmanned Aerial Vehicle (UAV) swarm network capable of providing stand-alone and temporary coverage to both victims and emergency personnel in areas with compromised infrastructure through access points installed onboard UAVs. To address the challenges of partial observability in decentralized coordination, we introduce the Soft Transformer Recurrent Graph Network (STRGN), a novel encoder–decoder architecture inspired by the transformer model and extending the Soft Deep Recurrent Graph Network (SDRGN). By leveraging multi-head and cross-attention mechanisms, the STRGN captures higher-order spatiotemporal relationships, enabling UAVs to integrate information about neighbor proximity and ground user density when selecting actions. This facilitates adaptive positioning strategies that enhance coverage, fairness, and connectivity under dynamic conditions. Simulation results show that transformer-based approaches, including STRGN, the Soft Transformer Graph Network, and the Transformer Graph Network, consistently outperform SDRGN, and the Soft Deep Graph Network, and Deep Graph Network baselines by approximately across core metrics, while also demonstrating improved scalability across diverse terrains and swarm sizes. These findings highlight STRGN’s potential as a resilient framework for UAV-assisted communications in disaster response.
1. Introduction
Natural and man-made disasters frequently degrade or destroy terrestrial communications infrastructure, creating coverage gaps that hinder situational awareness, coordination, and victim assistance. Rapidly deployable, low-altitude Unmanned Aerial Vehicles (UAVs) can restore basic connectivity by flying above debris to establish favorable air-to-ground (A2G) links that serve affected populations during the early response window [1,2].
Large single UAVs have been used as airborne relays [3], but they are difficult to deploy and offer limited data rates. Recent work shows that swarms of small UAVs can cooperate to form self-organizing communication networks [4,5,6].
This study addresses the temporary replacement of damaged terrestrial infrastructure for ground users (GUs), including first responders and victims, by deploying a standalone Flying Ad Hoc Network (FANET) formed by self-organizing UAV swarms equipped with wireless access points. The simulated environment includes only UAV-GU and UAV-UAV links. No surviving ground base stations, backhaul capacity, or end-to-end latency constraints are instantiated at this stage.
Figure 1 illustrates (i) mobile ground users (victims and first responders) and (ii) a self-organizing UAV swarm that provides local access while maintaining intra-swarm connectivity. An optional mobile base station or perimeter gateway is shown to contextualize real deployments that may bridge to an external network; it is conceptual in this work and not simulated. Consequently, all connectivity metrics refer exclusively to the UAV-UAV graph.
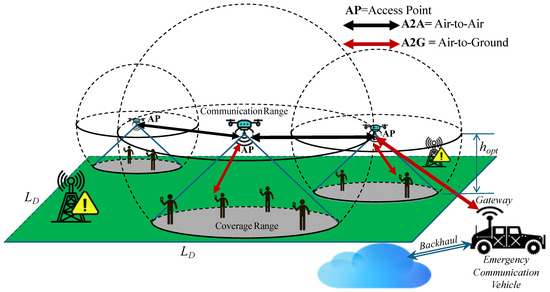
Figure 1.
Problem and scope. A self-organizing UAV swarm provides standalone coverage to ground users (victims and first responders) in a disaster-affected area. The swarm learns to maintain intra-swarm connectivity while repositioning according to ground-user density. The perimeter gateway is conceptual only and not instantiated in our simulator.
We adopt a probabilistic A2G model that distinguishes line-of-sight (LoS) and non-LoS (NLoS) conditions with elevation dependence—an established approach for low-altitude platforms in urban and suburban settings. As a minimum quality-of-service (QoS) motivation, we target voice-grade traffic (e.g., VoIP) for time-sensitive communications in urban disaster scenarios. Although end-to-end latency is not enforced in our simulator, ITU-T guidance recommending one-way delays of ≲150 ms [7] motivates our emphasis on sustained coverage and robust intra-swarm connectivity under partial observability.
Disaster environments are dynamic and partially observable: GU density varies, occlusions evolve, and each UAV observes only its local state and messages from neighbors. Attention-based neural networks, particularly Transformer architectures originally proposed for language processing [8], employ self-attention to model interactions among multiple entities. Adapted to UAV swarms, these models encode UAV positions, link qualities, and trust metrics to support coordinated decision-making under partial observability.
Building on graph-based reinforcement learning for multi-UAV coverage [9], we propose a decentralized attention-driven framework that operates on local subgraphs and reallocates UAVs toward high-demand regions while preserving swarm cohesion through a multi-objective reward. We introduce two policies within this framework: the STRGN, which augments attention with recurrent memory for partial observability, and the Soft Transformer Graph Network (STGN), a non-recurrent variant. Each UAV processes its local subgraph to predict the next action, guided by a multi-objective reward that balances GU coverage, fairness, and inter-UAV connectivity. Analogous to attention in natural language models, STRGN/STGN compute affinity scores between UAVs and regions of high user density, dynamically reallocating aerial resources while preserving network structure.
Our central hypothesis is that a self-organizing UAV swarm trained via decentralized deep reinforcement learning (DRL) can sustain robust service for mobile users while adapting to environmental uncertainty. Accordingly, the main objectives of this work are (i) to evaluate ground-user coverage (fraction of users served), fairness across UAVs via Jain’s index, and intra-swarm connectivity (giant-component size of the UAV graph); (ii) to design a UAV mobility policy that balances multiple objectives under decentralized control; (iii) to benchmark STRGN/STGN against strong graph-based baselines and evaluate scalability across varying swarm sizes and GU distributions; and (iv) to conduct factorial analyses to identify the DRL parameters and reward weights that most influence performance.
Each UAV is equipped with 2.4 GHz Wi-Fi transceivers and operates at a fixed altitude, which simplifies control and favors LoS conditions. UAVs act as aerial relays to enhance the quality of service under a decentralized design in which each agent makes decisions from local observations, ensuring scalability and robustness under partial observability.
1.1. Contributions
The main contributions of this paper are as follows:
- A standalone, decentralized multi-UAV swarming framework for emergency communication coverage with an attention-based control policy inspired by Transformer architectures. The policy operates on local observations and graph-structured inter-agent messages, using multi-head self-attention and cross-attention between local-state embeddings and neighbor–message embeddings.
- A probabilistic LoS/NLoS A2G modeling setup paired with voice-grade QoS targets, and a multi-objective reward balancing coverage, fairness, and intra-swarm connectivity.
- A comprehensive evaluation, including sensitivity and scalability analyses (varying swarm sizes and GU distributions), and benchmarking against strong graph-based baselines.
1.2. Organization
The remainder of this paper is organized as follows. Section 2 reviews related work and key concepts in UAV swarm deployment and DRL-based control. Section 3 introduces the system model and simulation environment. Section 4 presents the proposed STRGN/STGN architectures, and Section 5 describes the experimental methodology. Section 6 reports the results and comparative evaluations, which are analyzed in Section 7. Finally, Section 8 conclude the paper and outline directions for future research.
2. Literature Review
UAV swarms have emerged as a promising solution to restore communications in disaster scenarios when ground infrastructure is compromised. UAVs can rapidly deploy as aerial base stations or relay nodes to provide network coverage for affected civilians and first responders [3]. These drone networks, often termed Flying Ad Hoc Networks (FANETs), operate autonomously and can self-organize. However, UAV swarms face unique challenges such as limited bandwidth, high mobility, intermittent links, and strict energy constraints. Ensuring reliable and resilient communication under these conditions is an open research problem. In fact, Phadke and Medrano [10] note that truly resilient UAV swarm networks have yet to be realized, highlighting the need for advances in inter-UAV communication, coordinated movement, security, and overall swarm robustness. This work focuses on the communication aspect, in particular, maintaining ground user coverage and network connectivity in a self-organizing UAV swarm deployed for emergency services.
2.1. Standards and Networking Techniques for Emergency Communications
A solution intended for emergency response should align with current cellular and non-terrestrial standards. 3GPP TS 23.501 specifies the 5G System (5GS) architecture, including slice selection and service isolation, which allow differentiated KPIs and priority handling [11]. In practice, cloud native orchestration at the edge enables dynamic instantiation and scaling of mission-critical slices during incidents [12]. This provides a clear path for a restored UAV cell to interoperate with any surviving RAN/core resources. When on-scene coordination must continue despite partial outages, NR sidelink supports discovery, group communication, and resource configuration. Architectural hooks appear in TS 23.287 and RRC procedures in TS 38.331 [13,14]. Sidelink complements UAV-assisted access by sustaining local voice/data among responders and devices during restoration. Release 17 introduced new radio (NR)–non-terrestrial networks (NTNs), enabling integration with Low Earth Orbit (LEO) and Geostationary Earth Orbit (GEO) satellites and high-altitude platforms. Stage 2 descriptions and study/solution reports chart the evolution toward space–air–ground integration [15,16,17]. While our simulator operates standalone, these hooks frame realistic backhaul options in deployment.
2.2. Aerial Networking Primitives for Emergencies
Incident-area networking relies on aerial meshes and relays. Di Felice et al. showed that repair UAVs can self-organize into a mesh and reconnect isolated users in urban topologies using distributed mobility control [18]. For time-sensitive sensing/IoT traffic, UAV relays must coordinate trajectory, bandwidth, and power under deadline and buffer constraints. Analyses compare half- and full-duplex relaying and quantify how these choices affect timely delivery and the number of served devices [3]. These primitives justify action spaces with 3D placement, role switching (access/relay), and power control, and reward terms that account for both connectivity and timeliness. From a broader perspective, maintaining robust communication underpins the success of mission-critical networks. Beyond the UAV domain, recent research on 5G and beyond-5G systems emphasizes technologies like network slicing, edge computing, and intelligent orchestration to guarantee connectivity and low latency in emergency or overload conditions. For example, Spantideas et al. [12] present an architectural framework for smart mission-critical service management that can dynamically allocate network resources and migrate services at the network edge to cope with infrastructure failures or surges in demand. They achieve 93% accurate predictions of network overloads using machine learning, triggering proactive scaling or relocation of services to preserve QoS. Surveys of service migration strategies (e.g., Toumi et al. [19]) further underscore that autonomous network reconfiguration, moving services, or adjusting topology in response to user mobility and failures is key to future resilient networks. These trends align with the needs of UAV swarm networks in disaster scenarios, where the “service” is wireless coverage itself that must seamlessly follow the users and withstand node failures (drone outages or link breaks).
2.3. Coverage Paradigms: Area vs. Ground User Focus
There are two main implementation paradigms for multi-UAV communication networks. The first is the Area Coverage Problem, where a swarm spreads out to cover a wide geographic area. This approach assumes a virtually stationary environment and attempts to cover the entire region with connectivity. For example, Chuyu et al. [20] addressed area coverage by positioning multiple UAVs to cover fixed points on a plane while preserving inter-UAV connectivity, applying a Grey Wolf Optimizer variant. Similarly, Mou et al. [21] tackled 3D terrain coverage by a swarm, scaling their solution to irregular real-world landscapes using DQN and CNN-based observation embeddings. These area-focused strategies can be effective for static coverage, but tend to require a very large number of drones to cover every corner of the disaster zone. The hardware demand grows impractically as the area expands, making pure area coverage costly in large-scale emergencies.
The second paradigm is the Ground User Coverage Problem (GUCP), which focuses on dynamically tracking mobile users to maintain quality of service. Rather than uniformly covering an entire area, the swarm adjusts its topology to the users’ location, ensuring the connection of each victim or device. This approach requires greater complexity, as UAVs must continually reposition themselves based on moving targets, but it is resource-efficient, as the drones concentrate only where needed. As technology advances, GUCP-based solutions become viable and attractive for post-disaster scenarios. A key early work in this regard is that of He et al. [22], who applied unsupervised machine learning to drone positioning in emergency networks. They formulated a deployment optimization to minimize the total transmit power of UAVs while covering the connectivity and speed requirements of all users, respecting the capacity and coverage radius of each drone. Their method uses a modified k-means clustering to determine the number of drones and an optimal altitude, and then assigns the minimum transmit power per UAV. Simulation results showed that even if more UAVs are deployed than a basic k-means clustering would suggest, the speed of all users can be guaranteed, and network energy consumption minimized. This highlights how combining classical clustering with domain-specific constraints can generate efficient initial configurations for UAV swarms in emergencies. However, purely heuristic or static deployment methods present difficulties once user or network conditions begin to change rapidly. This has led researchers to investigate adaptive and intelligent control policies for UAV swarms, as described below.
2.4. Deep Reinforcement Learning for UAV Swarms
DRL has become a natural choice for UAV swarms operating in dynamic, only partially observed environments. DRL combines neural function approximation with trial-and-error optimization to learn policies in high-dimensional state spaces [23]. Value-based methods, such as DQN, established that deep networks can approximate action values in discrete domains [24]. For continuous 3D motion and power control, actor–critic methods like DDPG learn deterministic policies end-to-end [25]. In multi-agent settings, MADDPG extends these ideas with centralized training and decentralized execution (CTDE), using a centralized critic that observes joint information during training to mitigate nonstationarity while keeping decentralized actors at test time [26]. To reduce sample complexity, parameter sharing across homogeneous agents can further stabilize learning and speed convergence [27].
A core challenge for swarms is partial observability: each UAV perceives only a local slice of the scene, so the global process is better modeled as a POMDP. Policy sharing for identical agents has proved effective under such constraints, with policy-gradient methods outperforming simpler baselines when trained on local observations and collective experience [28]. State representation also matters: simply concatenating neighbor observations is sensitive to ordering and team size, whereas permutation-invariant embeddings (e.g., mean embeddings) improve stability and generalization [29]. Broader surveys synthesize algorithmic trade-offs for DRL and multi-agent DRL in these settings [30,31].
In emergency communications, DRL has been used not only for motion but also for access-layer scheduling. Elsayed and Erol-Kantarci show that learned schedulers can reduce uplink latency for mission-critical flows while maintaining fairness, illustrating how latency awareness can be embedded into the control stack [32]. That said, decentralized learning with independent agents often suffers from slow or unstable convergence due to moving-target critics and nonstationary teammates. CTDE addresses part of this issue by training a centralized critic (with full or aggregated information) and deploying lightweight, observation-based actors on board. In our context, this maps well to swarms: actors run with local sensing and limited inter-UAV messaging, while training can exploit richer state information in simulation.
2.5. Graph- and Attention-Based Self-Organizing Approaches
Recently, graph-based neural policies and self-attention have been adopted for UAV-swarm control to better cope with partial observability. The Transformer architecture by Vaswani et al. [8] formalized self-attention as a way to weight information sources without fixed positional assumptions. In multi-UAV settings, the swarm is naturally modeled as an interaction graph (UAVs as nodes, wireless links as edges), so attention can be applied over each agent’s neighborhood to prioritize the most informative peers while down-weighting distractors. This yields a decentralized controller (only local exchanges are required) that reduces the local-information bias of purely local views and adapts gracefully to changing neighborhood size. Within this framing, graph-based reinforcement learning has gained traction for coordinating actions across the swarm under limited sensing and communication.
A representative line of work is due to Dai et al. [33], who proposed a deep graph network (DGN) to coordinate UAVs toward multiple objectives in disaster scenarios. The policy aggregates information via graph convolution/attention layers over each drone’s neighborhood on the communication graph, producing node embeddings that guide local actions. In reported evaluations, DGN outperformed non-graph baselines (e.g., a standard DQN and a random movement policy), yielding higher global rewards and improvements in fairness and energy use. These results indicate that structured message passing over the inter-UAV graph can effectively exploit neighbor observations for decentralized coordination.
Ye et al. [9] propose a recurrent graph-attention policy for multi-UAV coverage under partial observability. The architecture stacks graph attention layers over the inter-UAV communication graph (expanding each agent’s effective receptive field beyond a single hop) and augments them with gated recurrent units (GRUs) to capture temporal context from recent trajectories and actions. In their evaluations, the learned policy improves coverage and fairness against strong baselines, indicating that attention to interaction graphs, combined with memory, can help agents prioritize informative neighbors while retaining decentralized execution. One limitation of our setting is that network connectivity is neither an explicit objective nor a primary evaluation metric in that work. Dispersion that increases the number of users served could also weaken the relay graph. This motivates our emphasis on connectivity-aware objectives and graph-level metrics alongside coverage and fairness.
2.6. Connectivity Preservation
Maintaining a connected inter-UAV communication graph is critical in emergencies: a disconnected UAV cannot relay traffic and may isolate users. Many studies acknowledge this by adding soft penalties for broken links or by rewarding connectivity, yet few optimize connectivity as a primary objective or report dedicated metrics over time. For example, centralized or actor–critic controllers have been proposed to improve user rates and energy use (with recharging decisions when needed), but explicit comparisons on graph connectivity are uncommon (Oubbati et al. [34]). Other works introduce connectivity incentives in the reward for 3D positioning/resource control and observe gains in coverage or energy against non-graph baselines; however, the fraction of mission time that the swarm remains connected (or related graph measures) is often not reported [35,36].
On the decentralized side, multi-agent (e.g., MADDPG-style) formulations treat coverage, fairness, and energy alongside connectivity via composite rewards and centralized training with decentralized execution. Reported improvements over heuristic or non-cooperative baselines are encouraging, but connectivity is typically a secondary term rather than a monitored outcome, and explicit graph-level metrics (e.g., size of the largest connected component over time, algebraic connectivity, routing feasibility) are rarely included in the evaluation [37,38]. Overall, connectivity remains under-examined relative to coverage/throughput: penalizing splits helps, but resilience in field deployments calls for connectivity-aware objectives and explicit graph metrics reported alongside coverage and fairness.
In summary, the literature shows a clear evolution toward intelligent and decentralized control of UAV swarms for emergency communications. Early heuristic implementations gave way to DRL policies that allow managing complex trade-offs in coverage, fairness, and energy consumption. The introduction of graph-based neural networks and self-attention has significantly improved how drones share information, allowing better handling of partial observability and coordination. The remaining challenge, and the focus of our work, is to integrate network connectivity preservation into this framework. By using transformer-based self-attention and carefully designing reward functions that penalize network splits, we seek to address this deficiency. The proposed approach builds on previous techniques, adding mechanisms to keep the UAV swarm connected without sacrificing coverage performance. The following sections detail our transformer-based architecture and how it powers a self-organizing UAV swarm to maintain reliable communication services in disaster environments.
Table 1 organizes prior work by system enablement, coverage strategies, DRL tooling, graph/attention controllers, and connectivity preservation, contrasting execution style, how connectivity is treated, and the scalability lens. Our contribution stands out by combining Graph/Attention with CTDE to deliver local-degree (neighbor-bounded) execution and making connectivity a first-class objective with reported graph-level metrics.

Table 1.
Literature review classification and how this study is positioned.
3. System Model
The operational area is represented as a two-dimensional discrete grid of size , corresponding to a physical region of . At the start of each simulation episode, U ground users (GUs) are deployed according to a clustered spatial pattern. The first cluster center is placed randomly, while each subsequent cluster center is positioned within a predefined Cluster Center Separation Radius of an existing center.
Within each cluster, the number of GUs is sampled randomly, and their positions are uniformly distributed inside a Cluster Radius around the cluster center. GU mobility follows a stochastic process in which Gaussian random variables determine both movement magnitude and direction. Clusters may shift collectively or have members move independently, with mobility parameters updated at each time step. The UAV swarm has no prior knowledge of GU dynamics and must adapt to these changes through a decentralized policy.
A swarm of N UAVs is deployed to provide communication coverage over T discrete time slots. All UAVs operate at a fixed altitude , selected to maximize A2G communication performance. Before deployment, a reconnaissance stage using Simultaneous Localization and Mapping (SLAM) [39] identifies the initial GU distribution. The first UAV is positioned at the centroid of all cluster centers, while the remaining UAVs are placed evenly with a maximum inter-agent separation of in both horizontal directions.
3.1. Signal Model
3.1.1. Air-to-Ground (A2G) Communication Model
For the A2G link, each UAV is assumed to carry an ESP32-based Wi-Fi transceiver (Espressif Systems Co., Ltd., Shanghai, China) operating at with a transmission power of . This device was selected for its low cost, versatility, and widespread availability. The A2G propagation model follows Hourani et al. [40], accounting for both LoS and NLoS conditions. The corresponding path-loss equations are
where f is the carrier frequency, d is the UAV-GU distance, c is the speed of light, and , are the mean excess losses for LoS and NLoS propagation, respectively.
The average path loss is expressed as the weighted sum of both components, with weights determined by the LoS and NLoS occurrence probabilities and :
This can be rewritten in a simplified form as
where and . The optimal elevation angle depends on both propagation conditions and environment-specific S-curve parameters a and b. It is obtained by solving the following condition [41]:
We chose this model because it is a widely used first-order baseline for low-altitude UAV links. It captures the dominant dependence of LoS on elevation through a small set of environment parameters, enabling fair controller comparisons without committing to a specific city map or a site-specific calibration campaign.
For voice over IP (VoIP) services, IEEE 802.11b deployment guidelines specify a minimum received power of to maintain acceptable quality of service [42]. With a transmission power of , the maximum allowable path loss is .
Using Hourani’s model for an urban environment with [41,43], the maximum coverage radius is found to be , and the optimal UAV altitude is approximately .
3.1.2. Air-to-Air (A2A) Communication Model
For inter-UAV communication, we assume free-space propagation at the optimal altitude , with no obstacles in the flight plane [44]. The maximum communication distance between UAVs is obtained from the Friis free-space equation:
By setting , the maximum inter-UAV range is calculated as . This represents the maximum distance at which two UAVs can maintain reliable communication under the adopted system parameters.
3.2. Environment Definition
The operational area has a physical size of , discretized into a grid of points per dimension, resulting in discrete cells. The physical communication ranges are mapped into the following virtual grid: the coverage radius corresponds to 26 units, and the inter-UAV communication radius corresponds to 44 units.
The main physical and communication parameters of the environment are summarized in Table 2.
Table 2.
Physical and communication parameters of the simulation environment.
As a representative platform, consider a DJI Matrice 200-series UAV (SZ DJI Technology Co., Ltd., Shenzhen, China) with maximum horizontal speed [45]. We assess whether this is sufficient for the STRGN controller to execute micro-repositioning for emergency coverage using 2.4 GHz access links at fixed altitude. Let a GU cluster drift laterally by over a control interval . The tracking condition is
which is readily satisfied under realistic pedestrian dynamics. Typical velocities for walking people in evacuation in urban settings are [46,47,48], resulting in a speed margin (order of magnitude lateral advantage).
For practical intercept times, the horizon to re-center over a demand shift of radius R satisfies
For , this gives , well within the temporal scales at which GU clusters evolve. Accordingly, STRGN’s incremental, decentralized actions (micro-repositioning and load balancing) can be executed promptly without pursuing fast vehicles. The controller maintains coverage and connectivity over slowly drifting pedestrian clusters.
Finally, at a fixed altitude, the A2G link benefits from a higher probability of LoS with elevation angle, as captured by standard A2G path-loss models [40,49]. When combined with the kinematic margin of the Matrice 200-series platform, this enables one-hop access at 2.4 GHz to support STRGN’s required repositioning in emergency-coverage scenarios.
3.3. UAV Swarm Local Observations and Action Space
Each UAV agent can detect neighboring UAVs within and ground users (GUs) within . The environment is discretized into grid points.
Neural networks require fixed-size input vectors. To satisfy this constraint, the UAV’s observation space is discretized within circular perimeters of radius (for GU detection) and (for neighbor detection). All grid points inside these radii are indexed in a fixed order (left to right, bottom to top) relative to the UAV’s position. This indexing remains consistent as the UAV moves, encoding detected entities into two maps: the ground-user observation map and the neighbor–UAV observation map , shown in Figure 2a.
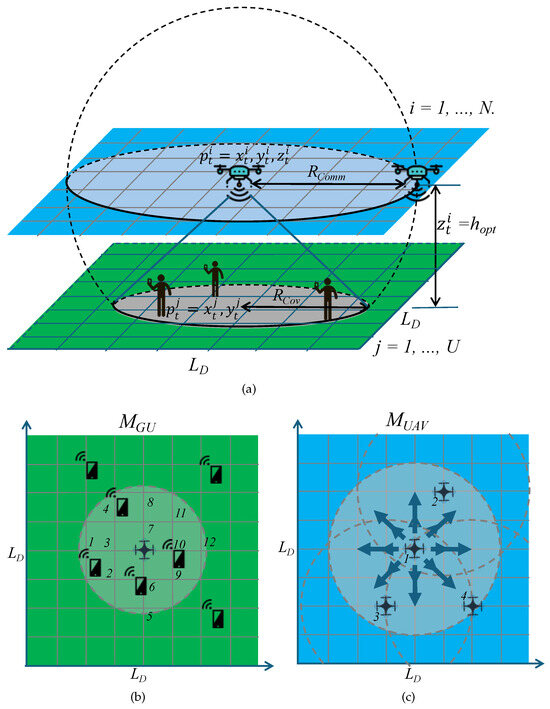
Figure 2.
Ground-user observation map () and neighbor–UAV observation map (). (a) Ground user observation map () and neighbor UAV observation map (), perspective. (b) , describe UAV observations. (c) , Agent’s action space encoded directions.
Figure 2b illustrates a case where a UAV at with observes 12 discrete points within range, approximated by
The local observation vector for UAV i at timeslot t is
Equation (10) concatenates (i) the UAV’s quantized position , (ii) the ordered GU-occupancy stencil within , (iii) the ordered neighbor-occupancy stencil within , (iv) the normalized speed , and (v) a compact density/degree proxy (e.g., the size of the one-hop subgraph normalized by ). This construction provides a fixed-length input that (a) is linked to the agent translation (the stencil is centered and consistently indexed), (b) is permutation-independent with respect to neighbor ordering (information is placed by grid index, not by agent ID), and (c) scales well numerically via normalization. In practice, and may be binary (presence) or multi-channel (e.g., counts, received power, link quality). The indexing guarantees that identical local geometry maps to identical input positions as the UAV moves.
For centralized training, global graph properties (e.g., number of components) can be computed to shape rewards or stabilize critics. In decentralized execution, only local information is used. If approximations of global signals are required, they must be derived by distributed routines (e.g., DFS over ). The set of observations available to UAV i from its one-hop neighbors is
where denotes the communication subgraph of i at time t.
Each UAV selects its next position using a policy that maps local observations to actions , guided by a Q-value function trained to maximize cumulative reward. The action space consists of force vectors with x and y components. According to Newton’s second law, these forces update the velocity and thus the position. Figure 2c shows the discrete motion directions used in the experiments.
3.4. System Performance Metrics
Coverage: This metric measures the proportion of ground user (GU)–timeslot pairs in which a GU j is successfully connected to the UAV network. Let denote the number of times GU j has been covered up to timeslot t. The cumulative coverage ratio is defined as
where U is the total number of ground users.
Fairness: To prevent the system from dense GU clusters and neglecting sparsely located users, we quantify equity with Jain’s index in the following manner [50]:
Here, counts how many times GU j has been served up to time t. The ratio compares the square of the total service to the “energy” (sum of squares) of its per-user distribution; , where 1 means perfectly even service and smaller values indicate growing imbalance. A fairness score of indicates perfectly uniform coverage across all users, while lower values reflect coverage imbalance.
Network Connectivity: Reliable operation requires maintaining connectivity among UAVs. Let denote the number of connected components in the UAV communication graph at timeslot t. Connectivity is quantified as the running average of the inverse component count:
A fully connected swarm yields and thus . For instance, in a two-timeslot episode with and , the connectivity score is .
3.5. Use-Case Scenario and Operational Constraints
The target of this study was an urban disaster area with inoperative terrestrial infrastructure. A standalone FANET of small UAVs at fixed altitude provides temporary access to mobile ground users (first responders and civilians). The environment is dynamic and partially observable: user flows and occlusions evolve over time, and each UAV senses only local state and neighbor beacons. We study swarm sizes and ground-user densities . The communication radius induces a bounded local degree , which defines the one-hop subgraph that each UAV processes online under CTDE. At each control step, UAV i executes a local forward pass on , yielding action . The end-to-end decision time is
where is policy inference latency. We adopt a practical budget for reactive control (voice-grade targets). As reported in Section 6, remains in a ∼5–10 ms band across all tested, leaving slack for sensing/commit. Online inference is per-UAV and neighbor-only. With H heads, model width d, and FFN width , the per-layer cost is
since attention is restricted to and the FFN is position-wise and parallel. The sequential depth per layer is constant; runtime thus scales with local degree k, not with global N.
A precedence safety layer filters commanded motions to guarantee a minimum inter-UAV separation , independently of the policy. We report the near-collision rate (fraction of steps with any pair ). Formation is preserved via (i) a connectivity-aware reward that promotes a large giant component and bounded diameter, and (ii) a neighbor cap . We report giant-component size, degree statistics , and a normalized connectivity proxy. We jointly report (i) Latency, the fraction of steps with and the distribution of (median/P95); (ii) Safety, near-collision rate, and minimum separation; and (iii) Formation, giant component and degree profile, together with coverage/fairness outcomes.
3.6. Partially Observable Markov Decision Process (POMDP) Formulation and Reward Design
The Ground User Coverage Problem can, in principle, be formulated as a Markov Decision Process (MDP), where a centralized controller with full knowledge of the environment optimizes UAV trajectories to maximize coverage, fairness, and network connectivity. In practice, however, centralized control is infeasible. Real UAV swarms operate under partial observability, where each agent perceives only a limited and noisy view of its surroundings. Communication delays, limited scalability, and the exponential growth of computational complexity with swarm size further hinder centralized decision-making.
To address these challenges, we adopt a Decentralized Partially Observable Markov Decision Process (Dec-POMDP) formulation, in which each UAV acts as an autonomous agent based on local observations [51]. A Dec-POMDP is defined by the tuple , where is the global state space, the joint observation space, the joint action space, the state transition function, R the reward function, N the number of agents, and the discount factor. In our setting
- Joint Observation : Local observations from each UAV’s neighborhood subgraph .
- Joint Action : The actions executed by all UAVs.
- Joint Reward : Individual rewards, which can be aggregated to reflect swarm-level objectives.
- Next Observation : Updated local observations derived from the next global state .
- Transition Function : The probability of moving to state , considering and .
The optimization problem is expressed as
subject to the following operational constraints:
Equation (17) states that each UAV i learns a decentralized policy that maps local observations to actions to maximize its discounted return, with the expectation taken over trajectories induced by the joint policy and the environment dynamics. The factor balances immediate and future rewards. The constraints – specify the admissible state–action set by enforcing planar motion, bounded workspace, at least one-hop connectivity, and range-feasible edges. Training follows CTDE: A centralized critic may exploit global summaries to stabilize learning, whereas execution on each UAV uses only local observations (and one-hop messages, if enabled).
The corresponding action–value function is
where denotes the global state (available only during training). This Q-function guides each agent to select actions that maximize long-term cumulative rewards while operating in a decentralized manner.
Reward Heuristic Function
Since global performance metrics (coverage, fairness, connectivity) cannot be directly computed under partial observability, we design a heuristic reward function that correlates local agent behavior with global objectives, following the approach of Ye et al. [9]. For UAV i, the reward comprises the following three components:
- Individual term: The number of ground users covered exclusively by UAV i:
- Teamwork term: The average number of ground users covered by UAV i’s one-hop neighbors:
- Connectivity penalty: Penalizes disconnection from the swarm:
The total reward is defined as
where balances cooperative and individual performance. This reward structure incentivizes UAVs to maximize local coverage, support neighbors in covering underserved users, and maintain a connected swarm topology.
3.7. Training Algorithms
We investigate two DRL algorithms under the CTDE paradigm. The first is a multi-agent Q-learning approach based on DQN [24]. The second is an entropy-regularized variant, Soft Q-Learning (SQL) [52]. Both methods operate on local observations and optimize the reward defined in Equation (22).
3.7.1. Multi-Agent Q-Learning (MARL-Q)
Each UAV i learns an action–value function . To stabilize training and reduce temporal correlations, we use experience replay and a slowly updated target network [24,53]. The optimal action–value satisfies the Bellman equation
DQN approximates with and minimizes the mean–squared temporal-difference (TD) error using a one-step bootstrap target:
where B is the mini-batch size and the replay buffer. In (24), is fitted so that its prediction at matches the semi-fixed target . Treating as constant respect to (via ) stabilizes bootstrapping. Mini-batches drawn i.i.d. from reduce temporal correlation. Terminal transitions are handled by masking the bootstrap (set if is terminal). Agents act -greedily, store , and update from mini-batches. Target parameters are refreshed every steps. In the independent MARL setting, each agent treats teammates as part of the environment [54]. (Optionally, double DQN replaces the hard max by to reduce overestimation bias).
3.7.2. Multi-Agent Soft Q-Learning (MARL-SQ)
Soft Q-Learning augments the objective with an entropy term to encourage exploration and prevent brittle deterministic policies [52]. The soft state value is computed using a log–sum–exp over these target Q-values:
which leads to the soft temporal-difference (TD) loss:
During execution, actions are sampled stochastically according to the softmax policy:
where the temperature parameter controls the exploration–exploitation trade-off.
3.7.3. Shared Training Settings
Both methods share the same environment dynamics, reward structure, and neural network architectures. They differ only in the definition of the loss function and the action–selection strategy. Key implementation details are summarized as follows:
- Experience replay: Joint swarm trajectories are stored in a buffer and subsequently split into per-agent samples using adjacency information.
- Target network updates: every steps.
- Exploration: -greedy in MARL-DQN; entropy-driven stochastic sampling in MARL-Soft Q-Learning, controlled by the temperature .
- CTDE: Training leverages centralized information, while execution is fully decentralized on each UAV.
This design enables a direct comparison of deterministic policies (MARL-Q) and entropy-regularized (MARL-SQ) under identical task and environment conditions.
4. Transformer Architecture
While the MARL-Q and MARL-SQ baselines provide effective decentralized policies, their ability to capture long-range dependencies between agents is inherently limited by the locality of the observation space. Additionally, conventional DRL architectures struggle to jointly reason about spatial swarm topology and heterogeneous ground user distributions.
To overcome these limitations, we propose a Transformer-based architecture, termed STRGN, which employs multi-head and cross-attention mechanisms to capture high-order relational patterns across the swarm. This design allows each UAV to integrate information on both neighbor proximity and local user density when estimating Q-values, thereby enhancing coordination and adaptability in dynamic, partially observable environments.
4.1. Model Architecture and Building Blocks
The Transformer architecture, originally introduced for machine translation [8], inspires the proposed approach. In its canonical form, an Encoder processes input sentences from the source language to capture semantic relationships through a self-attention mechanism, while a Decoder processes the target language. A cross-attention module aligns these contextual representations to identify word-level correspondences.
In this work, we adapt this principle to the Ground User Coverage Problem. The encoder path processes spatial information about UAV swarm positions, enabling the model to attend to actions that minimize inter-agent separation, an implicit strategy for preserving network connectivity under decentralized execution. The Decoder path processes the local observations of each UAV to identify neighbors with a high density of ground users. A Cross-Attention block combines both representations, allowing the model to discover affinities between the swarm topology and the user distribution, which, in turn, guides the selection of actions.
During execution, attention operates on the local subgraph . Per layer, the online cost is with constant sequential depth, making per-step inference degree-bounded rather than N-sequential.
The complete model, termed STRGN, integrates all the proposed building blocks (Figure 3). Although STRGN incorporates all modules, variants can be derived by isolating specific components. The architecture is divided into three sequential modules, highlighted in blue.
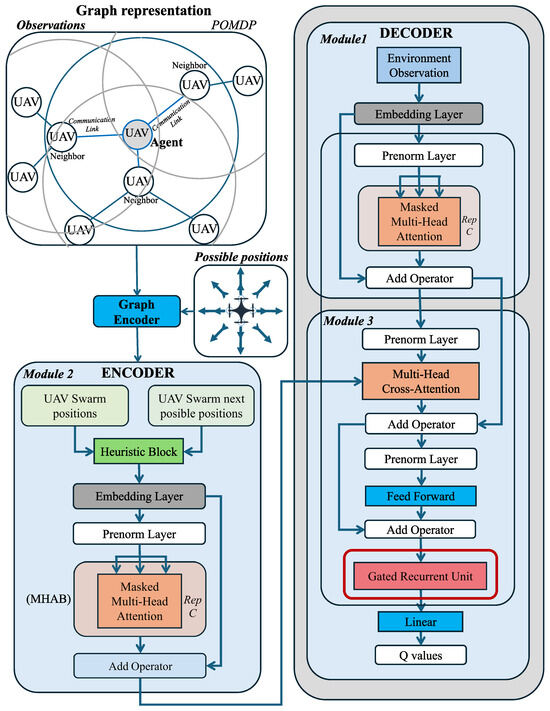
Figure 3.
Architecture of STRGN. Blue frames mark core modules. The Graph Encoder builds the swarm graph from observations. The Encoder embeds current and candidate positions and produces a memory. The Decoder applies masked self-attention, cross-attention to the encoder memory, feed-forward layers, and a GRU to aggregate temporal context; a final linear layer outputs Q-values.
4.2. Module 1: Decoder
The local observation vector of each UAV is transformed into an embedding that serves as input to a multi-head attention block (MHAB). A residual (skip) connection bypasses the MHAB, allowing the network to learn residual functions and mitigate vanishing gradient issues in deep networks. The MHAB applies self-attention, treating UAVs as nodes in a communication graph where edges represent available links. This mechanism enables each agent to attend selectively to relevant neighbor features, improving decision-making under partial observability. Query (Q), Key (K), and Value (V) matrices are learned to identify and propagate the most informative features from neighboring agents.
4.3. Module 2: Encoder
The Encoder processes current UAV swarm positions at time t alongside potential positions at generated by a heuristic block. This information captures neighborhood proximity and anticipated movement patterns. After feature embedding, an MHAB filters the data to retain only the neighbor features most correlated with reward improvement, as defined by the heuristic reward function. Gradient backpropagation adjusts the attention weights to favor proximity patterns that jointly improve coverage and connectivity.
4.4. Module 3: Cross-Attention Mechanism and Output Layer
The Cross-Attention Block receives query vectors from the Decoder (user density features) and key/value vectors from the Encoder (neighbor proximity features). This alignment identifies agents whose spatial relationships and user densities suggest high reward potential. The output is passed through a feed-forward block (two hidden layers) and a Gated Recurrent Unit layer to retain temporal dependencies. A final linear projection maps the processed features to the action space, yielding Q-values for all candidate actions in the current state.
4.5. STRGN Inference Flow
At each control step, the agent-centered communication graph (neighbors within and their links) and the discretized set of possible positions are first embedded by the Graph Encoder. This produces two token sets that form the encoder memory: the current positions of the UAV swarm (one-hop neighborhood) and the next possible positions of the UAV swarm (candidate moves for the agent). A lightweight heuristic allows candidates to be narrowed down or scored before training, and all tokens are normalized and projected by the embedding and prenorm layers. The encoder then applies masked multi-head attention with residual connections, restricting attention to the local subgraph. Because masking limits keys/values to one hop, the online cost of this spatial aggregation scales with the local degree k rather than the global swarm size N.
In parallel, the agent’s fixed-size observation (Section 3.3) is embedded and prenormalized in the decoder stream. A masked multi-head attention block extracts an instantaneous representation of the observation sequence that is aligned with the encoder’s tokenization. The decoder then queries the encoder memory through multi-head cross-attention: the observation-driven queries select the most informative neighborhood and candidate-move tokens, after which a residual feed-forward block refines the fused representation. Up to this point, the computation captures spatial structure at the current step while remaining degree-bounded through masking.
To cope with partial observability and fast scene changes, the fused vector is passed to a gated recurrent unit (GRU) that updates the hidden state from the previous step. The GRU’s update and reset gates retain slowly varying structures, such as motion trends of ground-user clusters and the evolving layout of neighbors, while discarding transient artifacts caused by occlusions or brief message loss. This temporal integration supplies short-term memory without introducing a dependency on N: its per-agent cost is determined by the model width and, therefore, complements the degree-bounded attention path.
Finally, the GRU output is mapped by a linear head to per-action Q values over the discrete possible positions. During training, MARL-Q or MARL-SQ losses (Section 3.7) are applied under CTDE. At execution, the agent selects a motion command (greedy or temperature-controlled), and a safety filter enforces workspace limits and minimum separation. In summary, masked attention provides instantaneous spatial selectivity on the local graph, the GRU supplies temporal consistency across steps, and the overall inference is bounded by neighborhood size and fixed model widths—properties that directly support low-latency, scalable control in rapidly changing emergency scenarios.
4.6. Computational Complexity
We formalize the per–control-step costs of STRGN/STGN at decentralized execution (on-agent) and under CTDE training. Let be the local degree (neighbors within ), H the number of attention heads, d the model width, the feed-forward width, C the number of encoder–decoder repeats, and the number of discrete actions. The fixed observation stencil size is (Section 3.3).
4.6.1. Execution Complexity (Per Agent, Per Step)
One-hop masked neighborhood attention is degree-bounded with per-block cost
while residuals/normalization are and the position-wise FFN is . Decoder self-attention over the fixed observation tokens is per repeat (constant once and are fixed). Cross-attention that queries the encoder memory (neighbors + candidate actions) adds . The GRU update is and the linear Q-head is . Collecting terms yields
which, under a fixed design , depends only on k. With fixed and spatial density, k does not grow with the swarm size N, so online inference is local-degree bounded and independent of N.
4.6.2. Communication and Memory
One-hop messages of width yield per-step communication
again degree-bounded. The inference-time footprint per agent is
dominated by attention and FFN projections; it is independent of N and linear in .
4.6.3. Training Complexity (CTDE)
With mini-batch size B and truncated BPTT length for the GRU,
plus negligible replay sampling and target-network update overhead. Per-agent backprop remains degree-bounded due to masked one-hop attention.
4.6.4. Implications
Relative to STGN, STRGN adds the GRU term. Removing attention drops the and terms but forfeits neighborhood selectivity. Equations (30)–(33) explain the empirical latency stability across (Section 6.5): with fixed design and communication radius, execution time scales linearly in the local degree k, not in the global N.
5. Methodology
The experimental study was conducted in three stages. First, a factorial design was applied to identify the most relevant hyperparameters for both the proposed architecture and the DRL training process. Second, we evaluated the contribution of key architectural components and regularization methods to the Ground User Coverage Problem. Finally, we compared four heuristic strategies for the Encoder’s Heuristic Block to determine the most appropriate choice for subsequent experiments.
5.1. Computational Environment
All models were implemented in PyTorch (v1.10.1) with CUDA (v11.3) and trained on a Windows 11 workstation (Microsoft Corporation, Redmond, WA, USA) equipped with an AMD Ryzen 9 3950X 16-core CPU at 3.50 GHz (Advanced Micro Devices, Inc., Santa Clara, CA, USA), 64 GB DDR4 RAM, and an NVIDIA RTX A5000 GPU, 24 GB (NVIDIA Corporation, Santa Clara, CA, USA). Experiments were executed in a Conda environment (Anaconda, Inc., Austin, TX, USA) running Python 3.7.16.
We profile wall-clock inference in release builds, discarding warm-up (first five steps per run). Per step, we record ; per episode, we store the mean. Boxplots aggregate 100 episodes per , hide fliers, and trim the upper 1% to focus on the steady state. We also compute the fraction of steps meeting ms.
5.2. Hyperparameter Selection
Both RL and DL models involve tunable parameters that strongly influence performance. To systematically explore their effect, we treated each hyperparameter as an experimental factor and applied a factorial design to assess main effects and interactions. The configuration yielding the most stable training dynamics and the highest average performance across coverage, fairness, and network connectivity was adopted as the baseline. Table 3 summarizes the selected values.
Table 3.
Selected hyperparameters for the baseline configuration.
Here, the hidden dimension defines the embedding size within transformer blocks, the number of heads specifies parallel attention mechanisms, the learning rate governs gradient updates, and the batch size controls the number of trajectories sampled per training step. The group reward and connectivity weights adjust the influence of cooperative behavior and network preservation in the reward heuristic.
5.3. Architecture Component Selection
We next assessed the effect of key architectural and regularization components using a variant of the proposed model (STGN) as the baseline. The following factors were evaluated:
- Prenorm Layers: Including prenorm stabilized gradient evolution and preventing divergence; this configuration was therefore retained.
- Feed-Forward Blocks (FFWDB): Inspired by the original transformer [8], we tested the following three ablations: (i) removing the encoder FFWDB, (ii) removing the decoder FFWDB, and (iii) removing both. The most stable and accurate performance occurred when retaining only the decoder FFWDB.
- Dropout: To improve generalization in a high-parameter setting, we tested multiple dropout values. A value of achieved the best trade-off between stability and performance.
- Action Space Size: Two discretizations were compared: 33 actions (coarser) and 65 actions (finer), both including a hover option. The 65-action configuration reduced link disconnections and provided smoother swarm movement and was therefore selected.
- Multi-Head Cross-Attention Mapping: We compared two mappings: (i) query from decoder and key/value from encoder (canonical transformer) versus (ii) the inverse. Statistical tests showed no significant differences, so the canonical mapping was retained.
Table 4 summarizes the adopted architectural configuration.
Table 4.
Final architectural configuration for the baseline model.
We fix Transformer widths across experiments H (heads), d (model width), and (FFN width). Thus, online complexity depends only on the empirical local degree k (bounded by radio range), supporting the degree-bounded inference claim in Section 3.5.
5.4. Heuristic Selection
The Encoder’s Heuristic Block (Figure 4) was designed to embed spatial information from UAV swarm positions, with the option to include projected next-step positions. The following four heuristic strategies were defined:
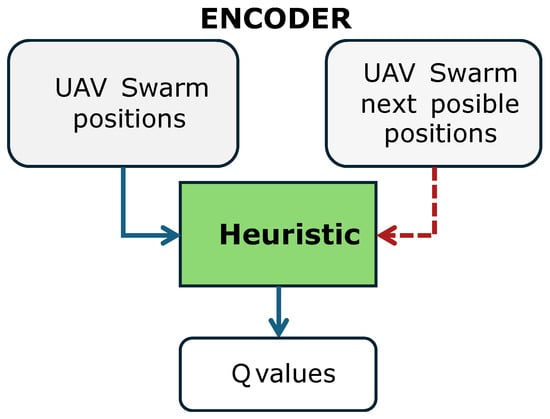
Figure 4.
Heuristic block in the encoder. Blue: current UAV positions; red dotted: projected positions for the next time step.
- UAV Swarm Distance to Neighbors: Computes distances between current UAV positions and neighbors.
- Swarm Possible New Positions to Neighbors: Considers both current and projected UAV positions, minimizing neighbor distance under candidate actions.
- Agent’s Separation Control: Maintains a target separation radius defined as .
- Next Possible Positions’ Separation Control: Evaluates projected UAV positions against current neighbor positions to enforce separation margins.
All four heuristics were trained for 10,000 episodes and evaluated on 40 controlled but randomized ground user scenarios. ANOVA and Fisher’s LSD tests showed no statistically significant differences across coverage, fairness, or connectivity. Nevertheless, we selected Swarm Possible New Positions to Neighbors (Model 2) for subsequent experiments due to its slightly higher mean coverage while maintaining competitive fairness and connectivity.
The baseline configuration for all subsequent experiments combines (i) the hyperparameters in Table 3, (ii) the architectural design in Table 4, and (iii) the heuristic Swarm Possible New Positions to Neighbors. This unified setup ensures consistency, reproducibility, and performance stability in all further evaluations.
6. Results
This section presents the confirmatory experiments conducted to validate the effectiveness of our proposed transformer-based architectures. The analysis proceeds in three stages. First, we apply statistical variance analysis to assess whether STRGN or STGN achieve significant improvements compared with SDRGN. Second, we benchmark the proposed models (STRGN, STGN, TGN) against state-of-the-art baselines (SDRGN, SDGN, DGN) on coverage, fairness, and connectivity. Finally, we evaluate the scalability of our approach to different ground-user mobility patterns, numbers of users, and UAV swarm sizes.
6.1. Experimental Configuration Parameters
Table 5 and Table 6 summarize the configuration used across all experiments, including scalability and latency analyses. Unless stated otherwise in a figure caption, these defaults apply.
Table 5.
Environment and scenario parameters.
Table 6.
Model architecture and training hyperparameters.
6.2. Analysis of Variances of STRGN, STGN, and SDRGN
This stage evaluates whether the proposed architectures achieve statistically significant improvements in performance. By analyzing variance across multiple training runs, we identify which models consistently outperform others under the proposed metrics.
6.2.1. Setup
STRGN and STGN were benchmarked against SDRGN [9]. Training two models with identical architectures, reward functions, and environmental settings can still yield slightly different results, partly due to the stochasticity of soft action selection in the output layer. To account for this variability and ensure a fair comparison, we trained 30 models for each architecture over 10,000 episodes. This extensive setup, although computationally demanding, minimizes variance and leverages the Central Limit Theorem to justify the use of normality-based statistical tests.
Each trained model was evaluated over 100 randomly selected and controlled steps, and the mean performance across these steps was treated as a single observation. Consequently, each architecture was represented by 30 independent observations, allowing for a robust comparison. We then applied three analysis of variance (ANOVA) tests to determine whether mean differences existed among the architectures for coverage, fairness, and network connectivity.
6.2.2. Analysis
Figure 5a shows that STRGN consistently provides higher coverage than both STGN and SDRGN. In terms of fairness (Figure 5b), STRGN again outperforms the other two models, while STGN delivers better average performance than SDRGN. For network connectivity (Figure 5c), STGN achieves the highest performance, followed by SDRGN, whereas STRGN performs slightly lower. It is important to note that the coverage, fairness, and network connectivity indices are dimensionless, as described in Section 3.4. These visual observations are supported by the quantitative results in Table 7, which report mean values, standard deviations, and confidence intervals.
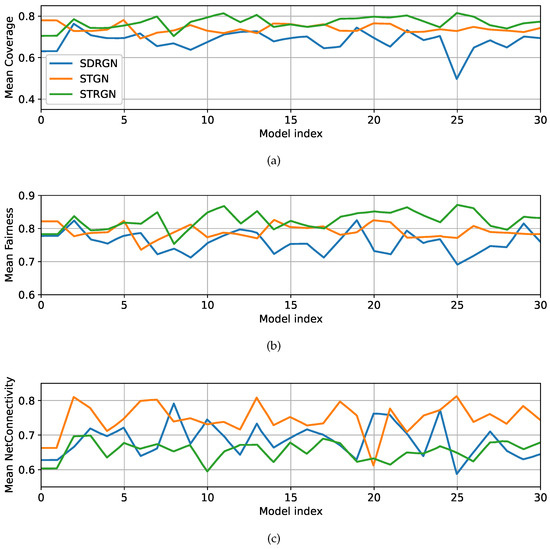
Figure 5.
Experiment results for coverage, fairness, and network connectivity performance of 30 trained models classified by model architecture, evaluated in 100 steps. (a) STRGN, STGN, and SDRGN coverage performance. (b) STRGN, STGN, and SDRGN fairness performance. (c) STRGN, STGN, and SDRGN connectivity performance.
Table 7.
Model architecture’s benchmark for the following metrics: coverage, fairness, and network connectivity.
To validate these observations, we conducted Bartlett’s test for homogeneity of variances (Table 8). The results reject the null hypothesis of equal variances in all metrics, necessitating the use of a variance-robust ANOVA. We therefore employed Welch’s ANOVA, which revealed statistically significant differences among model means in coverage, fairness, and connectivity (all , Table 9).
Table 8.
Equal variance hypotheses and the test values (Bartlett method).
Table 9.
Difference of means hypotheses and the test values.
Subsequently, we used the Games–Howell post hoc test, which does not assume equal variances, to perform pairwise comparisons (Figure 6). The results demonstrate the following:
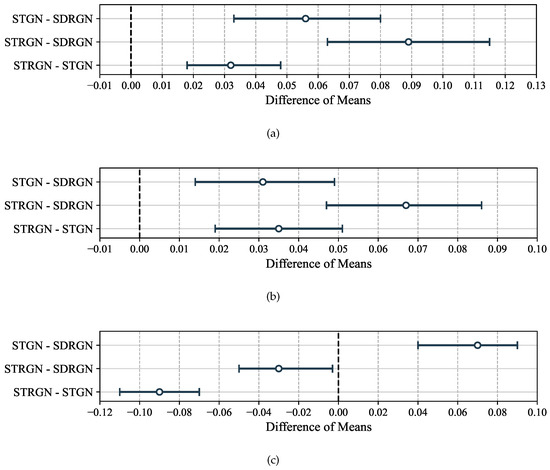
Figure 6.
Games–Howell difference of means comparison for benchmark architectures, based on coverage (a), fairness (b), and network connectivity (c).
- STRGN significantly outperforms both SDRGN and STGN in coverage and fairness.
- STGN surpasses SDRGN across all three metrics, confirming its robustness.
- For connectivity, STGN achieves the best performance, while STRGN performs significantly worse than both SDRGN and STGN.
Overall, these findings highlight that STGN provides the most balanced improvement across metrics, while STRGN excels in coverage and fairness at the cost of reduced connectivity.
6.3. Performance Comparison
This test benchmarks the proposed architectures (STRGN and STGN) against the state-of-the-art models (SDRGN and SDGN). The objective is to assess their ability to distributively position the UAV swarm to maximize ground user coverage while preserving connectivity.
6.3.1. Setup
A swarm of three UAVs was deployed to provide service to 20 ground users, organized into three spatial clusters. Network design parameters, trainer hyperparameters, and the evaluation procedure (100 randomly selected steps) were kept identical to the previous experiment. For STRGN, STGN, and SDRGN, a randomly chosen trained model from the prior stage was used. In contrast, SDGN was trained for 10,000 episodes before being evaluated.
6.3.2. Analysis
Figure 7 illustrates the cumulative rewards during training. STRGN, STGN, and SDRGN converge toward comparable reward levels, while SDGN converges prematurely at lower values. Figure 8a–c report average coverage, fairness, and network connectivity, respectively. STRGN, STGN, and SDRGN achieve coverage levels between 0.5 and 0.9, whereas SDGN remains considerably lower. A similar trend is observed for fairness: STRGN, STGN, and SDRGN maintain values between 0.5 and 1.0, while SDGN achieves lower scores. In contrast, SDGN excels in connectivity, consistently sustaining values near 0.9, although this comes at the expense of limited coverage.
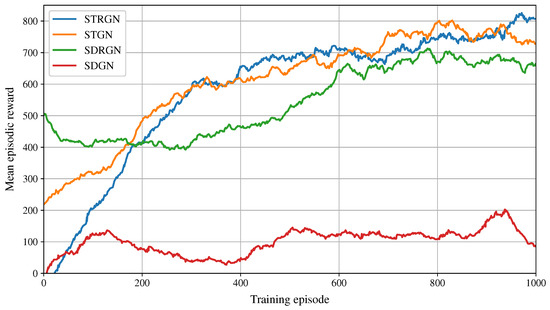
Figure 7.
Cumulative rewards during the training phase.
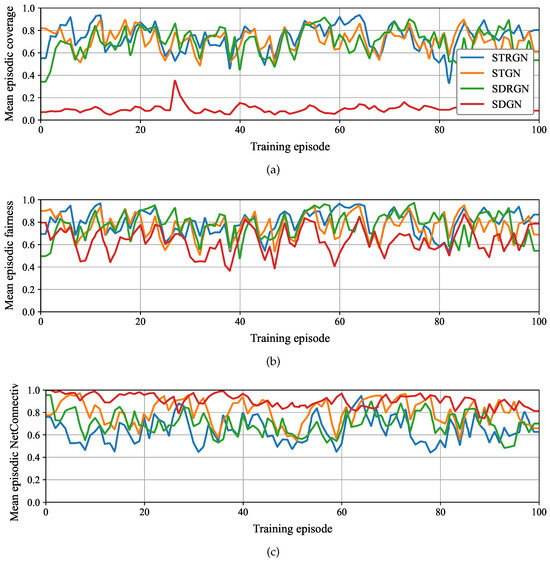
Figure 8.
Performance of benchmark models across 100 evaluation steps. (a) Mean Coverage. (b) Mean Fairness. (c) Mean Network Connectivity.
Table 10 presents the mean evaluation metrics. STRGN achieves the highest coverage (0.745) and fairness (0.806); therefore, those values are highlighted in bold and underlined. STGN achieves a strong balance, with coverage (0.715), fairness (0.768), and connectivity (0.807), highlighting its robustness. By contrast, SDGN provides the best connectivity (0.906), which is highlighted in bold and underlined, but at the cost of poor coverage (0.100). These results reinforce the trade-off between objectives: models prioritizing connectivity tend to sacrifice user coverage, while those optimizing coverage risk intermittent disconnections.
Table 10.
Average evaluation metrics of benchmarked models.
Overall, STRGN excels in maximizing coverage and fairness, STGN offers the most balanced trade-off across all metrics, and SDGN provides strong connectivity but very limited user service. The variability observed across evaluation steps further highlights the effect of partial observability: UAVs may initially fail to detect ground user clusters, leading to fluctuations in coverage until new users are discovered. This confirms the importance of robust exploration policies to mitigate worst-case scenarios.
6.4. Scalability
In practical deployments, the number of UAVs and the characteristics of the ground environment can vary significantly depending on operational demands and available resources. To examine the robustness of the proposed architecture, three scalability tests were conducted using the STGN model: (i) varying the GU movement distance, (ii) changing the number of GUs, and (iii) scaling the size of the UAV swarm.
6.4.1. Setup
The STGN model was retrained in a modified environment configuration, summarized in Table 11; the network design settings are in Table 12; and the DRL trainer settings are in Table 13. Training was performed for 30,000 episodes (taking approximately 8 h to finish the simulation).
Table 11.
STGN training environment settings.
Table 12.
Network design settings.
Table 13.
DRL trainer settings.
Each sub-experiment modified a single parameter while keeping all others fixed:
- GU Movement Distance: Tested five displacement magnitudes , and . The trained model was evaluated over 100 time slots in randomly generated environments, averaging performance across mission duration.
- Number of GUs: Tested deployments of , and 46 GUs. Since the number of users changes the ground topology, replicability across steps is not guaranteed, but these tests provide insights into model adaptability to different demand scales.
- Number of UAVs: Tested swarm sizes , and 14 UAVs. We compared the retrained model (STGN V2) with previously trained STRGN, STGN, and TGN models to assess how well training in one configuration generalizes to different swarm sizes.
6.4.2. Analysis
- GU Movement Distance: Figure 9a,c,e show that coverage declines as GU displacement increases, dropping from 0.78 at to 0.76 at (−2.08%). With very low GU movement (0.001), clusters are almost stationary, and the policy allocates UAVs evenly, yielding a Jain fairness index of 0.81. A small increase to 0.004 introduces minor boundary perturbations that briefly concentrate demand on one UAV while a neighbor lags, reducing the fairness 0.86% to a minimum. Beyond this, it remains near 0.8 under small, uniform fluctuations. Connectivity is the most affected metric, ranging from 0.34 to 0.48, with a peak at , as a consequence of how moderate GU mobility interacts with partial observability, the policy’s reward shaping, and the swarm’s graph-based coordination.
- Number of GUs: Figure 9b,d,f show that as the number of GUs increases, coverage and fairness both improve sharply, reaching 0.9 at 41 users. Connectivity, however, exhibits a non-monotonic pattern due to GU mobility variations: the best performance (0.54) occurs at 35 users, while the lowest (0.29) is observed at 29 users. In proximity-defined networks, where links form only if inter-UAV separation exceeds a feasibility threshold, small changes in the spatial configuration can toggle critical relay links, switching the topology between a single connected backbone and a fragmented state.
- Number of UAVs: Figure 10 illustrates that all models maintain coverage above 0.6, even with only two UAVs. STGN V2 consistently dominates, achieving 0.88–0.97 coverage across swarm sizes, with STRGN as a strong second. Fairness follows similar trends, with STGN V2 and STRGN alternating as top performers. Connectivity reveals the trade-off with coverage: TGN performs best in small (2 UAVs, 0.73) and large (14 UAVs, 0.67) swarms, while STGN variants dominate in mid-sized deployments (4–9 UAVs, often reaching near-perfect connectivity).

Figure 9.
Impact of varying GU movement distance and the number of ground users on coverage, fairness, and network connectivity. (a) GU movement distance in coverage. (b) Number of GUs in coverage. (c) GU movement distance in fairness. (d) Number of GUs in fairness. (e) GU movement distance in network connectivity. (f) Number of GUs in network connectivity.
Overall, these experiments highlight that STGN V2 scales robustly across dynamic GU mobility and swarm sizes, maintaining balanced performance in coverage and fairness. However, network connectivity remains the most sensitive metric, emphasizing the importance of balancing topology preservation with user coverage in highly dynamic scenarios.
The scalability experiments demonstrate that the proposed STGN architecture maintains robust performance across diverse operating conditions. As GU mobility increases, coverage degrades only marginally, while fairness remains stable and connectivity fluctuates more strongly, underscoring the trade-off between user service and topology preservation. Increasing the number of GUs consistently enhances both coverage and fairness, although connectivity is sensitive to mobility variations. Finally, scaling the UAV swarm shows that STGN V2 adapts well to different deployment sizes, consistently outperforming baseline models in coverage and fairness while preserving acceptable levels of connectivity. These results confirm that the architecture generalizes effectively to different mission scales, although maintaining network connectivity remains the most challenging aspect in highly dynamic or large-scale deployments.

Figure 10.
Experiment results for coverage, fairness, and network connectivity performance of 30 trained models classified by model architecture, evaluated in 100 steps. (a) Impact of the change in the number of UAVs on coverage. (b) Impact of the change in the number of UAVs on fairness. (c) Impact of the change in the number of UAVs in coverage.
In Figure 11, we analyze the 95% confidence interval (CI) on the number of UAVs . The mean coverage is around . The narrow coverage CIs indicate that, despite differences between methods, the mean coverage provided by controllers is consistently strong. In other words, adding UAVs does not degrade coverage. Fairness (Jain index) is already high with few UAVs and adjusts to as N grows. The tight CIs here mean that the distribution of served users becomes more even as density increases, and this is robust across methods. But connectivity shows larger mean CI widths. It tends to peak around a moderate value of . Then it declines for in the average across all methods, reflecting that some methods prioritize GU coverage and fairness, even if this weakens the A2A structure at higher densities. This is the main disadvantage shown by the error bars: policies may keep coverage and fairness stable, but A2A cohesion is more method-dependent.
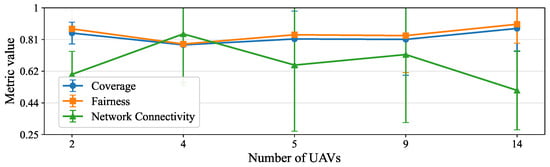
Figure 11.
A 95% confidence interval analysis across the number of UAVs, for coverage, fairness (Jain’s index), and network connectivity.
6.5. Latency
We define the per-decision (policy) inference latency as the elapsed wall-clock time to compute one forward pass of the learned policy on a single UAV, mapping its local observation (including neighbor-encoded features) to a discrete action. In our plots, each box aggregates, over 100 episodes, the per-episode mean of (in milliseconds). Thus, the box median approximates the typical per-step forward-pass time under a given condition.
We produced four boxplots in Figure 12, one per ground-user density , each showing the distribution of per-episode mean as the swarm size varies . The warm-up outliers were excluded to focus on steady-state inference. Across all four user densities, the medians and interquartile ranges change only slightly as N increases. This indicates that is not a sequential function of the global swarm size, but instead depends primarily on the local degree (size of the subgraph attended by the UAV). This is consistent with (i) the Transformer’s multi-head attention, which executes attention heads in parallel and minimizes sequential operations, and (ii) restricted/self-attention over neighborhoods of size r, whose per-layer complexity and sequential depth depend on r rather than on the global sequence length n [8]. In our setting, r corresponds to the expected number of neighbors within the communication radius.
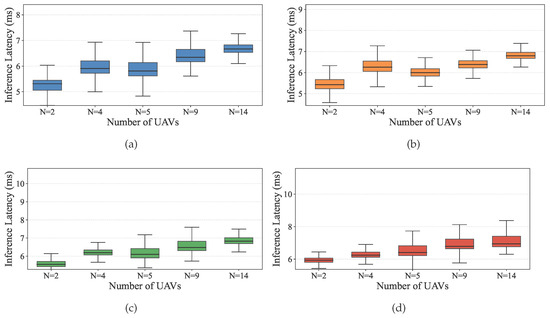
Figure 12.
Inference latency vs. swarm size (no. UAVs). (a) Inference latency vs. no. UAVs (no. GUs = 24). (b) Inference latency vs. no. UAVs (no. GUs = 29). (c) Inference latency vs. no. UAVs (no. GUs = 35). (d) Inference latency vs. no. UAVs (no. GUs = 46).
7. Discussion
7.1. Analysis of Variances
The variance analysis confirmed that the proposed STGN model provides statistically significant improvements in network connectivity for mobile ground users when compared with the baseline SDRGN. For coverage and fairness, both STRGN and STGN consistently outperformed SDRGN, with STRGN achieving higher coverage but at the cost of reduced connectivity. In contrast, STGN maintained balanced performance across all three objectives, demonstrating its ability to better manage the inherent trade-offs of the Ground User Coverage Problem (Figure 5). These results suggest that STGN offers a more reliable compromise between maximizing coverage and fairness while safeguarding network connectivity, a balance that is essential for emergency communication scenarios.
7.2. Model Performance Comparison
In the benchmark comparison (Figure 8), STGN again surpassed SDRGN in both coverage and network connectivity while maintaining comparable fairness, although its policies showed higher variability. This variability across evaluation steps reflects the effect of partial observability: if ground users are not detected during early deployment phases, they remain excluded from service until discovered, which reduces performance consistency. Visual inspection of simulation runs confirmed this explanation, highlighting the sensitivity of all models to incomplete information. This finding reinforces the importance of designing mechanisms that improve information sharing or predictive modeling under partial observability, as such mechanisms could significantly reduce outcome variability.
7.3. Scalability
The scalability experiments revealed how changes in ground user density and UAV swarm size influence model behavior (Figure 10). Increasing the number of ground users improved coverage and fairness up to a saturation point, after which additional users did not yield significant gains. However, connectivity did not follow a stable pattern, indicating that mobility dynamics introduce variability in swarm link maintenance. Based on these results, terrains with around 35 users appear to offer an effective balance between coverage and connectivity, serving as a useful guideline for deployment scenarios.
When scaling UAV swarm size, STGN V2 and STRGN achieved the best coverage and fairness, while STGN and TGN performed better in connectivity. These outcomes confirm that DRL-based models implicitly prioritize reward components differently depending on their training environment. In particular, STGN V2 outperformed the original STGN in coverage and fairness, while the latter retained an advantage in connectivity. This highlights the importance of training environment design, as it effectively acts as a parameter that influences how objectives are weighted during policy optimization.
Overall, TGN offered a balanced response across varying conditions, suggesting that it generalizes well to unseen environments. Nonetheless, hypothesis testing on larger training samples is required to statistically confirm these trends. Importantly, the observed trade-offs underscore that scaling UAV-assisted networks is not a matter of uniformly improving all objectives; instead, models must negotiate between maintaining connectivity and maximizing service coverage. This finding provides a strong direction for future work on adaptive reward shaping and transfer learning strategies to improve generalization across heterogeneous mission requirements.
7.4. Latency
In emergencies, both the topology and the wireless channel evolve rapidly; therefore, the decision latency must be tight and predictable. Our experiments show that the policy inference latency exhibits low sensitivity to the total swarm size N at a fixed user density U, which is operationally valuable: the addition or loss of UAVs (due to battery depletion or failures) does not significantly slow down the per-decision response. This degree-bounded behavior is due to the use of restricted subgraph attention (one-hop neighborhood) and a fixed-depth transformer stack, such that the number of sequential operations per layer is kept low and independent of N, while parallel matrix multiplications predominate [8].
For real-time emergency networking, STRGN’s inference latency is effectively degree-bounded: as long as the communication radius (and thus expected neighbor count) is held within practical limits, increasing N does not degrade decision latency. This property enables elastic swarm sizing without jeopardizing responsiveness.
The flat trend of versus N follows from CTDE with neighbor-only attention/GAT: per-layer cost and constant sequential depth. Small offsets between boxes arise from (i) variation in empirical k across episodes as geometry changes, (ii) minor differences in per-step feature preparation at higher U, and (iii) runtime jitter. These second-order effects preserve the main conclusion: inference latency is degree-bounded (in k) and stays in the low-ms range across , enabling timely reactions in dynamic emergency scenarios.
7.5. Limitations
We summarize the main limitations that bound the interpretation of our findings. Our simulator models a standalone aerial network with only UAV–GU and UAV–UAV links. Survivable ground/RAN core, NTN backhaul, and segment-aware orchestration are out of scope. Consequently, the latency figures we report correspond to agent-side policy inference (pass-through) rather than end-to-end application latency across a full PHY/MAC stack and core. The wireless layer uses a probabilistic A2G LoS/NLoS model with elevation dependence and a range-based A2A graph, without protocol-precise PHY/MAC behaviors (e.g., carrier sensing, rate adaptation, queueing, contention).
We are aware that a dynamically feasible UAV model is not included. Specifically, we employ a fixed-altitude, planar kinematic model with discrete force-vector actions rather than a full six degrees of freedom (DoF) rigid-body model with actuator limits, aerodynamic effects, and wind disturbances. As a result, maneuverability and policy-execution latency should be interpreted as kinematic upper bounds rather than guarantees under real flight dynamics. Connectivity is optimized and evaluated via graph-level metrics (e.g., giant component and a normalized inverse component score). Routing load, algebraic connectivity, and path-level performance are not reported, so our claims address graph cohesion rather than end-to-end transportation. We are aware that the current study employs a soft connectivity penalty (weight 0.05) instead of a hard k-connectivity constraint and does not emulate user-plane packet delivery or gateway backhaul. This is a deliberate simplification consistent with decentralized POMDP training and will be addressed in follow-up work. We also omit an energy model (battery discharge and recharge logistics) and formal safety guarantees. Separation is enforced by simple rules rather than verified controllers.
As with most deep MARL approaches, we provide empirical performance without convergence or stability proofs. Our scalability statements refer to online inference being local-degree bounded (one-hop masked attention and fixed-width GRU) and to the tested regimes of swarm size and user load. Extreme densities, highly non-stationary mobility, and out-of-distribution maps were not exhaustively explored. Similarly, a realistic GU mobility model that captures post-disaster behavior (road following, obstacle or high-risk zone avoidance, and group psychology) is not considered. We deliberately adopt a stochastic family of 2D Gaussian random walks as a baseline generator to induce high-entropy demand and to isolate controller behavior under partial observability. Lastly, hardware timing reflects the software/hardware configuration reported in Section 6.1. Embedded software on chips under sensor/I/O contention or thermal throttling was not profiled.
These limitations suggest a clear roadmap: integrate protocol-accurate PHY/MAC (Wi-Fi/NR sidelink) and slice-aware backhaul to measure end-to-end QoS; extend to full 3D dynamics with wind and sensor noise; incorporate energy models and safety-certified separation; add routing/load metrics alongside graph cohesion; validate local-degree-bounded inference on embedded software on chips (CPU/GPU/NPU) under realistic sensor/I/O timing; and broaden scenario diversity (trace-driven and behaviorally realistic mobility) to test generalization.
8. Conclusions
This work highlights the importance of self-organizing multi-UAV swarm networks to provide resilient communication services to mobile ground users in the aftermath of natural disasters. We introduced STRGN, a novel DRL-based model that addresses partial observability constraints by integrating neighboring UAV observations. The architecture leverages an encoder to process relative positional information and a decoder to extract ground user density features, which are fused through a cross-attention mechanism. This design enables UAVs to develop more effective strategies that maximize user coverage while maintaining swarm connectivity.
A key contribution of this study is the explicit consideration of network connectivity as a performance metric. Existing state-of-the-art models typically prioritize coverage and fairness but overlook the risks associated with disconnected UAV subgraphs, which jeopardize reliable communication for ground users. By penalizing disconnections during training and incorporating a dedicated connectivity metric, our models encourage more robust swarm behavior.
Statistical validation through ANOVA demonstrated that the proposed STGN model consistently outperforms SDRGN in coverage, fairness, and connectivity, confirming its competitiveness with state-of-the-art alternatives. Importantly, our experiments revealed inherent conflicts among objectives: models achieving high coverage often sacrifice connectivity. STRGN, for instance, achieved the best coverage and fairness but lagged in connectivity, whereas STGN maintained a stronger balance across all objectives. These findings underscore the multi-objective nature of the problem and open avenues for further research using explicit multi-objective optimization techniques.
Scalability experiments provided additional validation by varying both environmental configurations and swarm sizes. Our results showed that performance generally improves with increasing numbers of ground users and UAVs, although symptoms of network fragmentation persist under certain conditions. This suggests that while the models scale reasonably well, further improvements are needed to ensure robustness across heterogeneous terrains and larger deployments.
Finally, evaluation variability revealed the sensitivity of model performance to UAV deployment positions. Ground user clusters that remain undiscovered during initial steps effectively remain invisible to the swarm, limiting coverage until they are encountered later in the mission. This highlights the importance of designing initialization strategies or predictive exploration mechanisms to mitigate partial observability in practice.
We also note that the discretized training environment differs substantially from real-world conditions, where UAVs operate in continuous space and must handle richer dynamics. Bridging this gap remains a critical step toward real deployment.
Future efforts will focus on adapting the proposed models to continuous environments and testing them in multi-physics simulators such as AirSim, ROS, or Gazebo. These platforms will enable evaluation under more realistic conditions, including UAV aerodynamics, control accuracy, and wireless communication models. We also plan to extend the action space from discrete to continuous, potentially employing on-policy algorithms such as DDPG or Proximal Policy Optimization. Such approaches will enable UAVs to execute smoother and more precise maneuvers, thereby improving their real-world applicability.
In addition, we envision integrating transfer learning and adaptive reward shaping to enhance generalization across diverse terrains and mission requirements. Exploring hybrid architectures that combine transformer-based modules with graph reinforcement learning could further improve scalability and robustness. Ultimately, these directions aim to bring self-organizing UAV swarm communication networks closer to reliable deployment in real-world emergency response scenarios.
Author Contributions
I.L.-V. and K.J.M.-G.: Writing—original draft, Writing—review and editing, Methodology, Validation, Visualization, Formal analysis. J.I.-R.: Writing—review and editing, Conceptualization, Supervision. D.C.-G.: Writing—Software and graphics. H.G.G.-H.: Writing—review and editing, Conceptualization, Supervision. R.B.-B.: Writing—review and editing, Supervision, Project administration. All authors have read and agreed to the published version of the manuscript.
Funding
This research received no external funding.
Data Availability Statement
The original contributions presented in the study are included in the article; further inquiries can be directed to the corresponding author.
Acknowledgments
This work was supported by the following scholarships: Secretaría de la Defensa Nacional (Isaac López-Villegas); Tecnológico de Monterrey (Kevin J. Medina-Gómez, and Daniel Colin-García); and the Secretaría de Ciencia, Humanidades, Tecnología e Innovación (SECIHTI). Scholarship IDs: 162978, 1238801, and 1227127, respectively.
Conflicts of Interest
The authors declare that they have no known competing financial interests or personal relationships that could have appeared to influence the work reported in this paper.
References
- Zheng, X.; Sun, G.; Li, J.; Wang, J.; Wu, Q.; Niyato, D.; Jamalipour, A. UAV Swarm-Enabled Collaborative Post-Disaster Communications in Low Altitude Economy Via a Two-Stage Optimization Approach. IEEE Trans. Mob. Comput. 2025, 24, 11833–11851. [Google Scholar] [CrossRef]
- Zeng, Y.; Wu, Q.; Zhang, R. Accessing From the Sky: A Tutorial on UAV Communications for 5G and Beyond. Proc. IEEE 2019, 107, 2327–2375. [Google Scholar] [CrossRef]
- Tran, D.H.; Nguyen, V.D.; Chatzinotas, S.; Vu, T.X.; Ottersten, B. UAV Relay-Assisted Emergency Communications in IoT Networks: Resource Allocation and Trajectory Optimization. IEEE Trans. Wirel. Commun. 2022, 21, 1621–1637. [Google Scholar] [CrossRef]
- Orfanus, D.; de Freitas, E.P.; Eliassen, F. Self-Organization as a Supporting Paradigm for Military UAV Relay Networks. IEEE Commun. Lett. 2016, 20, 804–807. [Google Scholar] [CrossRef]
- Gao, T.; Lang, F.; Guo, N. An Emergency Communication System Based on UAV-assisted Self-Organizing Network. In Proceedings of the 2016 10th International Conference on Innovative Mobile and Internet Services in Ubiquitous Computing (IMIS), Fukuoka, Japan, 6–8 July 2016; IEEE: New York, NY, USA, 2016; pp. 90–95. [Google Scholar] [CrossRef]
- Liu, Y.; Xie, J.; Xing, C.; Xie, S.; Luo, X. Self-Organization of UAV Networks for Maximizing Minimum Throughput of Ground Users. IEEE Trans. Veh. Technol. 2024, 73, 11743–11755. [Google Scholar] [CrossRef]
- ITU-T. Recommendation G.114: One-Way Transmission Time; ITU-T Recommendation G.114; International Telecommunication Union (ITU): Geneva, Switzerland, 2003. [Google Scholar]
- Vaswani, A.; Shazeer, N.; Parmar, N.; Uszkoreit, J.; Jones, L.; Gomez, A.N.; Kaiser, L.; Polosukhin, I. Attention Is All You Need. arXiv 2017, arXiv:1706.03762. [Google Scholar]
- Ye, Z.; Wang, K.; Chen, Y.; Jiang, X.; Song, G. Multi-UAV Navigation for Partially Observable Communication Coverage by Graph Reinforcement Learning. IEEE Trans. Mob. Comput. 2023, 22, 4056–4069. [Google Scholar] [CrossRef]
- Phadke, A.; Medrano, F.A. Towards Resilient UAV Swarms-A Breakdown of Resiliency Requirements in UAV Swarms. Drones 2022, 6, 340. [Google Scholar] [CrossRef]
- System Architecture for the 5G System (5GS). 3GPP Technical Specification TS 23.501, 3rd Generation Partnership Project (3GPP), (v 19.5.0). 2023. Available online: https://www.3gpp.org/dynareport/23501.htm (accessed on 15 October 2025).
- Spantideas, S.T.; Giannopoulos, A.E.; Trakadas, P. Smart Mission Critical Service Management: Architecture, Deployment Options, and Experimental Results. IEEE Trans. Netw. Serv. Manag. 2025, 22, 1108–1128. [Google Scholar] [CrossRef]
- Architecture Enhancements for 5G System (5GS) to Support Vehicle-to-Everything (V2X) Services. v16.3.0 Release 16 3GPP Technical Specification TS 23.287, 3rd Generation Partnership Project (3GPP). 2024. Available online: https://www.etsi.org/deliver/etsi_ts/123200_123299/123287/16.03.00_60/ts_123287v160300p.pdf (accessed on 15 October 2025).
- NR; Radio Resource Control (RRC) Protocol Specification. 3GPP Technical Specification TS 38.331, 3rd Generation Partnership Project (3GPP), 2024. Rel-17 Version Contains Sidelink RRC Procedures. (v19.0.0). Available online: https://portal.etsi.org/webapp/workprogram/Report_WorkItem.asp?WKI_ID=76252 (accessed on 15 October 2025).
- NR; Overall Description; Stage 2. 3GPP Technical Specification TS 38.300, 3rd Generation Partnership Project (3GPP). 2024. Release 17 (v17.0.0) to Anchor NR-NTN Features. Available online: https://www.etsi.org/deliver/etsi_ts/138300_138399/138300/17.00.00_60/ts_138300v170000p.pdf (accessed on 15 October 2025).
- Study on New Radio (NR) to Support Non-Terrestrial Networks (NTN). 3GPP Technical Report TR 38.811, 3rd Generation Partnership Project (3GPP), 2019. Pre-Normative Study Report; Useful Background for NR-NTN. Release 15 (v15.4.0). Available online: https://portal.3gpp.org/desktopmodules/Specifications/SpecificationDetails.aspx?specificationId=3234 (accessed on 15 October 2025).
- Solutions for NR to Support Non-Terrestrial Networks (NTN). 3GPP Technical Report TR 38.821, 3rd Generation Partnership Project (3GPP), 2021. Solution Report Preceding Release-16 (v16.2.0) Normative Specs. Available online: https://portal.3gpp.org/desktopmodules/Specifications/SpecificationDetails.aspx?specificationId=3525 (accessed on 15 October 2025).
- Di Felice, M.; Trotta, A.; Bedogni, L.; Chowdhury, K.R.; Bononi, L. Self-organizing aerial mesh networks for emergency communication. In Proceedings of the 2014 IEEE 25th Annual International Symposium on Personal, Indoor, and Mobile Radio Communication (PIMRC), Washington, DC, USA, 2–5 September 2014; IEEE: New York, NY, USA, 2014; pp. 1631–1636. [Google Scholar] [CrossRef]
- Toumi, N.; Bagaa, M.; Ksentini, A. Machine Learning for Service Migration: A Survey. IEEE Commun. Surv. Tutor. 2023, 25, 1991–2020. [Google Scholar] [CrossRef]
- Hu, C.; Ding, L.; Liu, B.; Ding, S.; Huang, J.; Wang, H.; Liu, Y.; Tan, M. Multi Unmanned Aerial Vehicle Area Coverage Control Based on Enhanced Alpha-Guided Grey Wolf Optimizer. In Proceedings of the 2021 International Conference on Electronic Information Technology and Smart Agriculture (ICEITSA), Huaihua, China, 10–12 December 2021; pp. 410–415. [Google Scholar] [CrossRef]
- Mou, Z.; Zhang, Y.; Gao, F.; Wang, H.; Zhang, T.; Han, Z. Deep Reinforcement Learning Based Three-Dimensional Area Coverage With UAV Swarm. IEEE J. Sel. Areas Commun. 2021, 39, 3160–3176. [Google Scholar] [CrossRef]
- He, J.; Wang, J.; Zhu, H.; Gomes, N.J.; Cheng, W.; Yue, P.; Yi, X. Machine Learning based Network Planning in Drone Aided Emergency Communications. In Proceedings of the IEEE 91st Vehicular Technology Conference (VTC2020-Spring), Antwerp, Belgium, 25–28 May 2020. [Google Scholar] [CrossRef]
- Sutton, R.; Barto, A. Reinforcemente Learning: An Introduction; The MIT Press: Cambridge, MA, USA, 2018. [Google Scholar]
- Mnih, V.; Kavukcuoglu, K.; Silver, D. Human-level control through deep reinforcement learning. Nature 2015, 518, 529–533. [Google Scholar] [CrossRef]
- Lillicrap, T.P.; Hunt, J.J.; Pritzel, A.; Heess, N.; Erez, T.; Tassa, Y.; Silver, D.; Wierstra, D. Continuous control with deep reinforcement learning. arXiv 2019, arXiv:1509.02971. [Google Scholar]
- Lowe, R.; Wu, Y.; Tamar, A.; Harb, J.; Abbeel, P.; Mordatch, I. Multi-Agent Actor-Critic for Mixed Cooperative-Competitive Environments. arXiv 2020, arXiv:1706.02275. [Google Scholar]
- Pan, Y.; Jiang, H.; Yang, H.; Zhang, J. A Novel Method for Improving the Training Efficiency of Deep Multi-Agent Reinforcement Learning. IEEE Access 2019, 7, 137992–137999. [Google Scholar] [CrossRef]
- Gupta, J.K.; Egorov, M.; Kochenderfer, M. Cooperative Multi-agent Control Using Deep Reinforcement Learning. In Autonomous Agents and Multiagent Systems; Sukthankar, G., Rodriguez-Aguilar, J.A., Eds.; Springer: Cham, Switzerland, 2017; pp. 66–83. [Google Scholar]
- Hüttenrauch, M.; Šošić, A.; Neumann, G. Deep Reinforcement Learning for Swarm Systems. arXiv 2019, arXiv:1807.06613. [Google Scholar] [CrossRef]
- Nguyen, T.T.; Nguyen, N.D.; Nahavandi, S. Deep Reinforcement Learning for Multiagent Systems: A Review of Challenges, Solutions, and Applications. IEEE Trans. Cybern. 2020, 50, 3826–3839. [Google Scholar] [CrossRef] [PubMed]
- Li, Y. Deep Reinforcement Learning: An Overview. arXiv 2017, arXiv:1701.07274. [Google Scholar] [CrossRef]
- Elsayed, M.; Erol-Kantarci, M. Deep Reinforcement Learning for Reducing Latency in Mission Critical Services. In Proceedings of the IEEE Global Communications Conference (GLOBECOM), Abu Dhabi, United Arab Emirates, 9–13 December 2018. [Google Scholar] [CrossRef]
- Dai, A.; Li, R.; Zhao, Z.; Zhang, H. Graph Convolutional Multi-Agent Reinforcement Learning for UAV Coverage Control. In Proceedings of the 2020 International Conference on Wireless Communications and Signal Processing (WCSP), Nanjing, China, 21–23 October 2020; pp. 1106–1111. [Google Scholar] [CrossRef]
- Oubbati, O.S.; Badis, H.; Rachedi, A.; Lakas, A.; Lorenz, P. Multi-UAV Assisted Network Coverage Optimization for Rescue Operations using Reinforcement Learning. In Proceedings of the 2023 IEEE 20th Consumer Communications & Networking Conference (CCNC), Las Vegas, NV, USA, 8–11 January 2023; pp. 1003–1008. [Google Scholar] [CrossRef]
- Qi, H.; Hu, Z.; Huang, H.; Wen, X.; Lu, Z. Energy Efficient 3-D UAV Control for Persistent Communication Service and Fairness: A Deep Reinforcement Learning Approach. IEEE Access 2020, 8, 53172–53184. [Google Scholar] [CrossRef]
- Liu, C.H.; Chen, Z.; Tang, J.; Xu, J.; Piao, C. Energy-Efficient UAV Control for Effective and Fair Communication Coverage: A Deep Reinforcement Learning Approach. IEEE J. Sel. Areas Commun. 2018, 36, 2059–2070. [Google Scholar] [CrossRef]
- Liu, C.H.; Ma, X.; Gao, X.; Tang, J. Distributed Energy-Efficient Multi-UAV Navigation for Long-Term Communication Coverage by Deep Reinforcement Learning. IEEE Trans. Mob. Comput. 2020, 19, 1274–1285. [Google Scholar] [CrossRef]
- Nemer, I.A.; Sheltami, T.R.; Belhaiza, S.; Mahmoud, A.S. Energy-Efficient UAV Movement Control for Fair Communication Coverage: A Deep Reinforcement Learning Approach. Sensors 2022, 22, 1919. [Google Scholar] [CrossRef] [PubMed]
- Qin, H.; Meng, Z.; Meng, W.; Chen, X.; Sun, H.; Lin, F.; Ang, M.H. Autonomous Exploration and Mapping System Using Heterogeneous UAVs and UGVs in GPS-Denied Environments. IEEE Trans. Veh. Technol. 2019, 68, 1339–1350. [Google Scholar] [CrossRef]
- Al-Hourani, A.; Kandeepan, S.; Jamalipour, A. Modeling air-to-ground path loss for low altitude platforms in urban environments. In Proceedings of the 2014 IEEE Global Communications Conference, Austin, TX, USA, 8–12 December 2014; pp. 2898–2904. [Google Scholar] [CrossRef]
- Al-Hourani, A.; Kandeepan, S.; Lardner, S. Optimal LAP Altitude for Maximum Coverage. IEEE Wirel. Commun. Lett. 2014, 3, 569–572. [Google Scholar] [CrossRef]
- Cisco Systems. Enterprise Mobility 3.0 Design Guide; Text Part Number: OL-11573-01; VoWLAN Design Recommendations; Cisco Systems: San Jose, CA, USA, 2008; Chapter 11. [Google Scholar]
- Alzenad, M.; El-Keyi, A.; Lagum, F.; Yanikomeroglu, H. 3-D Placement of an Unmanned Aerial Vehicle Base Station (UAV-BS) for Energy-Efficient Maximal Coverage. IEEE Wirel. Commun. Lett. 2017, 6, 434–437. [Google Scholar] [CrossRef]
- Paris, B.P. Lecture Notes in Mobile Communication Systems; Department of Electrical and Computer Engineering, George Mason University: Fairfax, VA, USA, 2018. [Google Scholar]
- DJI. Support for Matrice 200 Series: Specifications. Max Speed up to 82.8 km/h Depending on Configuration. 2018. Available online: https://www.dji.com/support/product/matrice-200-series (accessed on 15 October 2025).
- Giannoulaki, M.; Christoforou, Z. Pedestrian Walking Speed Analysis: A Systematic Review. Sustainability 2024, 16, 4813. [Google Scholar] [CrossRef]
- Seyfried, A.; Steffen, B.; Klingsch, W.; Boltes, M. The fundamental diagram of pedestrian movement revisited. J. Stat. Mech. Theory Exp. 2005, 2005, P10002. [Google Scholar] [CrossRef]
- Cao, S.; Liu, X.; Chraibi, M.; Zhang, P.; Song, W. Characteristics of pedestrian’s evacuation in a room under invisible conditions. Int. J. Disaster Risk Reduct. 2019, 41, 101295. [Google Scholar] [CrossRef]
- Moraitis, N.; Psychogios, K.; Panagopoulos, A.D. A Survey of Path Loss Prediction and Channel Models for Unmanned Aerial Systems for System-Level Simulations. Sensors 2023, 23, 4775. [Google Scholar] [CrossRef]
- Khan, U.U.; Dilshad, N.; Rehmani, M.H.; Umer, T. Fairness in Cognitive Radio Networks: Models, measurement methods, applications, and future research directions. J. Netw. Comput. Appl. 2016, 73, 12–26. [Google Scholar] [CrossRef]
- Bai, Y.; Zhao, H.; Zhang, X.; Chang, Z.; Jäntti, R.; Yang, K. Toward Autonomous Multi-UAV Wireless Network: A Survey of Reinforcement Learning-Based Approaches. IEEE Commun. Surv. Tutor. 2023, 25, 3038–3067. [Google Scholar] [CrossRef]
- Haarnoja, T.; Tang, H.; Abbeel, P.; Levine, S. Reinforcement learning with deep energy-based policies. In Proceedings of the 34th International Conference on Machine Learning-Volume 70, Sydney, NSW, Australia, 6–11 August 2017; ICML’17. JMLR.org: Norfolk, MA, USA, 2017; pp. 1352–1361. [Google Scholar]
- Lin, L.J. Self-improving reactive agents based on reinforcement learning, planning and teaching. Mach. Learn. 1992, 8, 293–321. [Google Scholar] [CrossRef]
- Lee, K.M.; Ganapathi Subramanian, S.; Crowley, M. Investigation of Independent Reinforcement Learning Algorithms in Multi-Agent Environments. Front. Artif. Intell. 2022, 5, 805823. [Google Scholar] [CrossRef] [PubMed]
Disclaimer/Publisher’s Note: The statements, opinions and data contained in all publications are solely those of the individual author(s) and contributor(s) and not of MDPI and/or the editor(s). MDPI and/or the editor(s) disclaim responsibility for any injury to people or property resulting from any ideas, methods, instructions or products referred to in the content. |
© 2025 by the authors. Licensee MDPI, Basel, Switzerland. This article is an open access article distributed under the terms and conditions of the Creative Commons Attribution (CC BY) license (https://creativecommons.org/licenses/by/4.0/).