Article

Bearing-Only Passive Localization and Optimized Adjustment for UAV Formations Under Electromagnetic Silence

National Key Laboratory of Information Systems and Engineering, National University of Defense Technology, Changsha 410073, China
*
Author to whom correspondence should be addressed.
Drones 2025, 9(11), 767; https://doi.org/10.3390/drones9110767
Submission received: 31 August 2025 / Revised: 3 November 2025 / Accepted: 3 November 2025 / Published: 6 November 2025

Highlights

What are the main findings?
  • A comprehensive framework for bearing-only passive localization and adjustment of UAV formations under electromagnetic silence is proposed, comprising three core models: geometric trilateration, hierarchical emitter identification, and a cyclic cooperative strategy (PEJE) optimized by an improved genetic algorithm (GA-IADNS).
  • The cyclic cooperative strategy (PEJE) enables high-precision formation convergence with negligible positional errors (e.g., maximum radial deviation <0.0001 m, angular deviation <0.00013°) and demonstrates strong robustness across varying initial deviations (up to 30%R).
What is the implication of the main finding?
  • This research enables autonomous and collaborative UAV formation control in electromagnetically silent environments, enhancing stealth, anti-interference capability, and operational safety without relying on active signal emission.
  • The integration of dynamic role-switching and optimized signal scheduling provides a scalable and systematic solution for real-world applications in surveillance, search and rescue, and other fields requiring strict electromagnetic compliance.

Abstract

Existing research has made significant strides in UAV formation control, particularly in active localization and certain passive methods. However, these approaches face substantial limitations in electromagnetically silent environments, often relying on strong assumptions such as fully known and stationary emitter positions. To overcome these challenges, this paper proposes a comprehensive framework for bearing-only passive localization and adjustment of UAV formations under strict electromagnetic silence constraints. We systematically develop three core models: (1) a geometric triangulation model for scenarios with three known emitters, enabling unique target positioning; (2) a hierarchical identification mechanism leveraging an angle database to resolve label ambiguity when some emitters are unknown; and (3) a cyclic cooperative strategy, Perceive-Explore-Judge-Execute (PEJE), optimized via an improved genetic algorithm with adaptive discrete neighborhood search (GA-IADNS), for dynamic formation adjustment. Extensive simulations demonstrate that our proposed methods exhibit strong robustness, rapid convergence, and high adjustment accuracy across varying initial deviations. Specifically, after adjustment, the maximum radial deviation of all UAVs from the desired position is less than 0.0001 m, and the maximum angular deviation is within 0.00013°; even for the 30 % R initial deviation scenario, the final positional error remains negligible. Furthermore, comparative experiments with a standard Genetic Algorithm (GA) confirm that GA-IADNS achieves superior performance: it reaches stable peak average fitness at the 6th generation (vs. no obvious convergence of GA even after 20 generations), reduces the convergence time by over 70 % , and improves the final adjustment accuracy by more than 95 % relative to GA. These results significantly enhance the autonomous collaborative control capability of UAV formations in challenging electromagnetic conditions.

1. Introduction

In recent years, drone formation flying has demonstrated significant potential for application and value across multiple fields, including surveillance, search and rescue, and monitoring. In practical applications, multiple sensors frequently need to collaborate in specific geometric formations to achieve drone positioning. Circular formations have been employed in a variety of scenarios involving the encirclement, capture, protection, and monitoring of targets. In the event that a drone deviates from its designated position, the formation’s geometry becomes irregular, which can potentially result in collision risks, communication interference, and mission failure. Therefore, adjusting the formation’s position information is crucial for ensuring the overall stability and mission execution capability of the formation [1]. The current state of drone formation control can be categorized into two distinct classifications: motion coordination and coverage coordination. The process of formation maintenance is critical for ensuring the stability of the drone formation, constituting the fundamental aspect of motion coordination. In scenarios where communication capabilities are constrained in electronic countermeasures [2], the maintenance of drone formation through precise drone positioning and position adjustment in the presence of electromagnetic silence conditions, as well as the attainment of coordinated motion among drones, is imperative for ensuring anti-interference and the safety of the drone formation.
In order to control multiple drones in a specific formation, accurate localization of each drone is essential. In early research on drone localization, methods were primarily based on active localization techniques [3]. These approaches involve the active transmission of electromagnetic signals to perform ranging or angle measurements, thereby enabling drone positioning and navigation. However, such methods increase the electromagnetic emissions of the formation, making it more susceptible to detection and external interference. This not only compromises localization accuracy but also limits practicality in scenarios requiring electromagnetic silence [4]. To overcome these drawbacks, passive localization methods have attracted growing attention in recent years. In contrast to active methods, passive localization does not require the transmission of signals; instead, it relies solely on received electromagnetic emissions to locate and track radiation sources. Based on the signal information received by the drones, various passive localization schemes have been developed [4]. In practical applications, common passive positioning technologies include Time Difference of Arrival (TDOA), Received Signal Strength (RSS), Frequency Difference of Arrival (FDOA), Angle of Arrival (AOA), as well as hybrid algorithms that combine these measures [5].
Target localization based solely on directional measurements represents one of the most widely adopted approaches in passive localization systems [6], with origins tracing back to submarine and ship tracking in underwater warfare [7]. Compared to other types of sensors, direction-finding sensors operate passively, making them less vulnerable to electronic jamming. This characteristic enhances their survivability in complex modern electromagnetic environments and underscores their strategic importance. As a result, pure azimuth passive positioning offers notable advantages in terms of anti-jamming capability and stealth, making it highly valuable for both military and civilian applications. By leveraging bearing-only measurements to locate and adjust the positions of UAVs, this method enables precise formation control with minimal electromagnetic emission.This study focuses on a two-dimensional pure azimuth passive positioning technique to localize and adjust UAV positions for stable formation flight. In the proposed framework, certain UAVs act as signal emitters, while others passively receive these signals and extract directional information for self-localization and positional adjustment. Unlike active positioning systems, the pure azimuth passive approach requires no signal transmission from the receiving drones—they merely capture and process incoming signals from a limited number of sources to determine angle-related data. This significantly reduces the system’s electromagnetic footprint, improves stealth and anti-interference performance, and alleviates computational and communication overhead.Nevertheless, existing pure azimuth passive positioning strategies for drone formations face three major challenges:
(i)
Positioning ambiguity: When only a limited number of transmitters are available, the geometric constraints provided by angle-of-arrival measurements are generally insufficient to uniquely determine the target location. As a result, the estimated position of the drone may converge to one of several feasible solutions, leading to ambiguity and unreliable positioning outcomes.
(ii)
Emitter dependency: Most existing studies presume that the emitter’s position is both fixed and precisely known. In practical scenarios, however, the emitter location may be partially uncertain or subject to dynamic variation, potentially introducing significant errors in angle matching and subsequent position correction.
(iii)
Regarding position adjustment in drone swarms, existing strategies often lack a systematic mechanism to determine which drones should act as signal transmitters or receivers at each iteration step, or rely solely on fixed adjustment schedules. This limitation gives rise to two major issues: first, unplanned assignment of signal roles may leave drones with larger initial positional deviations without sufficient angular references, resulting in error accumulation; second, fixed iterative procedures are unable to adapt to the dynamic deviation states of individual drones, leading to prolonged convergence times, redundant corrective actions, and ultimately a failure to achieve an optimal balance between real-time responsiveness and formation accuracy.
Against this backdrop, this paper systematically examines the limitations of existing research and proposes an integrated framework for passive bearing-only positioning and adjustment of drone formations. The main contributions of this work are as follows:
  • Trilateration Localization A polar coordinate-based geometric model is established for scenarios where three drones with fully known emission source positions are present within the formation. This model effectively eliminates positional ambiguity and enables unique localization of the receiving drone.
  • Hierarchical Emitter Identification and Localization Model: For scenarios involving partially unknown emission sources, a hierarchical decision strategy based on an angle database is proposed. This approach precomputes all possible expected direction angles between transmitters and receivers and compares them with measured angle data. As a result, it effectively resolves positional ambiguities in drone localization caused by uncertain emission sources and enhances the reliability of emitter identification.
  • Multi-UAV Signal Interaction-Based Iterative Strategy for Cooperative Position Adjustment(PEJE): To address formation adjustment under dynamic emission source conditions, a perception–exploration–judgment–execution (PEJE) cycle is proposed, allowing each drone to iteratively switch between transmitter and receiver roles. Integrated with an improved genetic algorithm (GA-IADNS) for optimizing signal transmission and reception sequences, this strategy ensures both convergence speed and adjustment accuracy during the cooperative positioning process.
The remainder of this paper is organized as follows: Section 2 (“Literature Review”) surveys the state of the art in UAV formation control, passive localization, and bearing-based cooperative control, highlighting the limitations of current approaches. Section 3 (“Problem Statement”) formalizes the scenario assumptions, defines key variables, and introduces three types of localization and adjustment problems. Section 4 (“Mathematical Modeling”) presents the trilateration model, the hierarchical emitter identification mechanism, and the PEJE cycle-based cooperative adjustment strategy tailored to each problem category. Section 5 (“Improved Optimization Algorithm”) describes the proposed GA-IADNS method for optimizing signal transmission-reception sequences. Section 6 (“Simulation Experiments”) validates the robustness, convergence behavior, and accuracy of the proposed models and algorithms through comprehensive simulations, including parameter sensitivity analysis, initial deviation tests, and performance comparison with a standard Genetic Algorithm (GA). Finally, Section 7 (“Conclusions”) summarizes the main findings, discusses limitations, and suggests directions for future research.

2. Literature Review

2.1. UAV Formation Control

Previous studies have extensively investigated the maintenance of UAV formations, which can be broadly categorized based on their information transmission architectures. The first category employs centralized control strategies, wherein a central control unit synchronizes positional information across the formation and distributes control commands to individual drones. For instance, in [8], a Multi-Layer Control Scheme (MLCS) was proposed for trajectory tracking in centralized UAV formations. This approach utilizes dedicated modules to perform tasks such as desired path generation, robot posture specification, and control signal formulation. Similarly, the study in Ref. [9] introduced a UAV formation control protocol based on an enhanced consensus algorithm to handle challenging conditions including asymmetric communication interference and network congestion. Simulation results demonstrated the protocol’s capability to achieve rapid convergence of formation states and maintain stable configurations. In Ref. [10], the Prim algorithm was applied to eliminate redundant communication links and construct spanning trees for topology optimization within a multi-leader multi-agent formation control system. The proposed modifications were validated via numerical simulations. The authors of [11] analyzed kinematic constraints in fixed-wing UAV rigid formations, derived parameter requirements for wingman UAVs, and obtained a closed-form representation of the leader’s operational region in terms of speed and turn radius. These results were likewise verified through simulation, providing a foundation for maneuver design.Furthermore, authors of [12] presented a leader-following consensus framework integrated with a robust observer. By combining Lyapunov stability theory and the H∞ criterion, the control gains were derived through linear matrix inequality (LMI) formulations. The method was shown to effectively maintain formation under wind disturbances in simulation environments.It is worth noting that leader-follower architectures, as seen in Refs. [10,11,12], designate certain drones as leaders while the remaining followers adjust their positions based on interactions with nearby leaders. Although widely adopted, these methods exhibit limitations in robustness under dynamic or uncertain conditions.To address these issues, several decentralized strategies have been developed. For example, in [13], authors proposed a behavior-based decentralized approach for formation maneuvers, designing three distinct control strategies whose efficacy was confirmed through hardware experiments. In Ref. [14], a distributed formation control strategy based on the Virtual Structure approach was introduced for nonholonomic multi-UAV systems and validated in simulation. Additionally, in [15], authors put forward a distributed cooperative control framework leveraging structural potential functions to achieve collision-free stable formations under undirected communication topologies.

2.2. UAV Formation Maintenance and Passive Localization

In the field of UAV formation maintenance and passive localization, extensive research has been conducted to address diverse application scenarios and technical requirements, leading to the development of numerous innovative algorithms and methodologies.In a holistic approach beyond isolated solutions, a scheme that integrates localization and motion planning was proposed to address the formation accuracy loss caused by their complex coupling in [16]. This framework employs a bidirectional process, combining near-optimal motion planning to mitigate localization uncertainties with resource allocation optimized for maximizing formation accuracy.For electromagnetic silent environments, ref. [2] proposed a scalable distributed bearing-only passive formation maintenance algorithm that relies solely on angular measurements without requiring precise positional information. The study established theoretical convergence guarantees and derived the associated convergence radius. Similarly, authors in [17] developed an adjustment model incorporating individual UAV behavior, directed node graphs, and Markov Decision Processes (MDP) for electromagnetic stealth conditions. Their approach introduced a “phase angle” force vector to guide UAV movement and established a conical formation positioning model based exclusively on azimuth information.Building on this, a subsequent study [17] constructed individual UAV adjustment models, formation directed graphs, and MDP strategy models to address deviations in conical formations under electromagnetic silence, validating the effectiveness of their pure azimuth passive positioning algorithm through simulations.Building upon the foundation of electromagnetic stealth, a subsequent study [18] explicitly addressed the system-level electromagnetic compatibility (EMC) requirement. It proposed a self-adjustment model for UAV swarms characterized by “internally active communication and externally silent operation”. This model optimizes UAV positions by iteratively minimizing the deviation from a standard reference while adhering to formation geometry and, crucially, EMC constraints that limit electromagnetic radiation interference. For electromagnetic silent environments, in [2] authors proposed a scalable distributed bearing-only passive formation maintenance algorithm that relies solely on angular measurements without requiring precise positional information. The study established theoretical convergence guarantees and derived the associated convergence radius. The authors of [1] investigated pure azimuth-based passive positioning and adjustment for circular UAV formations, proposing a trilateration method in polar coordinates to localize receiving drones. Their findings indicated that two additional signal-emitting drones are necessary for effective positioning. A subsequent study on circular formations in ref. [19] established a polar coordinate system with geometric analysis to solve the pure azimuth passive localization problem, demonstrating that two signal-emitting UAVs suffice for unique localization and enabling precise formation redistribution with minimal angular error through optimization algorithms.Addressing the need for electromagnetic silence in formations, another study [20] specifically investigated a circular formation of 10 UAVs, employing a three-point positioning method based on the angle formed by signals from two transmitting UAVs to determine the position of receiving UAVs and ensure positional accuracy under measurement errors.Extending this concept to maritime environments, a study on unmanned surface vehicles (USVs) [21] addressed formation robustness under communication constraints. It developed a circular formation positioning model using a three-point triangulation method with bearing-only information, enhanced by an improved least squares filter for accuracy. By integrating a virtual-leader-follower approach and distributed state estimation into a distributed model predictive control (DMPC) framework, the strategy significantly improved convergence speed and trajectory tracking robustness, demonstrating substantial performance gains in deviation adjustment and robustness maintenance under various motion states. In [22], authors presented a circular formation adjustment strategy integrating pure azimuth passive positioning with deep Q-networks (DQN) for forest fire monitoring applications. This approach formulates a passive positioning model using triangular edge-angle relationships and selects positioning points based on proximity to ideal locations. Further expanding the algorithmic approaches for formation orchestration, a pure azimuth passive positioning model based on dynamic programming algorithm in ref. [23] was established to arrange UAV formations of different shapes and study position orchestration under various conditions. Further, authors of [24] examined optimal deployment strategies for multi-target azimuth-only localization within circular formations. In the domain of swarm passive localization, ref. [3] introduced a method inspired by ant colony pheromone mechanisms. This technique combines pseudo-linear estimation (PLE) for initial target localization with a pheromone-based optimization process, achieving localization accuracy approaching the Cramér-Rao Lower Bound (CRLB) under low-noise conditions. In [25], authors investigated multi-UAV localization and encirclement control strategies for moving targets.Regarding formation control with specific technical features, authors proposed a dual-circle positioning model accompanied by a two-step adjustment strategy. The model characterizes receiving UAV deviations in polar coordinates and supports simultaneous angle measurements from multiple transmitters. Further advancing this direction, in ref. [4], a novel swarm formation method introduced a two-circle positioning model described by trigonometric functions in polar coordinates and a two-step adjustment strategy, which was demonstrated to significantly reduce the total formation length compared to existing methods. Ref. [26] designed a bearing-only formation controller that operates without relative position or linear velocity measurements. Alternative localization architectures have also been explored. Authors in [27] proposed a two-station localization method independent of baseline length, leveraging time difference and azimuth measurement redundancy to derive baseline-free solutions. In [28], authors developed a cooperative positioning system (COPS) based on geometric azimuth and inclination angles, utilizing radio direction finding for relative angle acquisition and selecting optimal reference sets. The method enhances accuracy through a constant acceleration model integrated with an Extended Kalman Filter (EKF) and incorporates a fault-tolerant algorithm for GPS-denied environments. For GNSS-degraded settings, authors of [29] introduced an adaptive simulated annealing particle swarm optimization (SA-PSO) algorithm for cooperative localization in heterogeneous UAV swarms, incorporating adaptive weights and simulated annealing to avoid local optima. Lastly, ref. [5] presented a high-precision passive localization method using dual UAVs equipped with optoelectronic platforms, establishing error transfer models for angle of arrival (AOA) and UAV positions, and designing a Weighted Least Squares (WLS) estimator.

2.3. Cooperative Control of UAV Formation Based on Bearing Information

For UAV formations operating in two-dimensional space, in [30], authors introduced a distributed control law specifically designed for four-agent quadrilateral formations. This approach relies exclusively on relative bearing measurements in local coordinate systems and pairwise inter-agent angle constraints. Ref. [31] proposed a bearing-only control law to stabilize a group of constant-speed ground robots into a balanced circular formation. Experimental validation on real Scarab robots demonstrated the effectiveness of the strategy, offering valuable insights for bearing-based circular formation control in UAVs.The authors of [32] addressed the bearing-only triangular formation control problem for three agents. They developed a distributed relaxed control law that allows each agent to independently select its heading within a broad range rather than adhering to fixed control inputs. Theoretical analysis confirmed that this control law ensures global exponential convergence to the desired formation shape while naturally preventing inter-agent collisions. In [33], the problem of forming a triangular configuration between two mobile agents and a static beacon was investigated. The control objective, based solely on angular constraints, was transformed into mixed angle and distance constraints, enabling the design of a decoupled control law via orthogonal decomposition. Ref. [34] incorporated the concept of bearing rigidity—originally developed for robot and sensor network localization—into mobile formation shape control. Theoretical analyses revealed that bearing-rigid formations exhibit uniform scalability, allowing formation scale to be controlled by adjusting the distance between the first and second leaders.The authors focused on bearing-only control for leader-follower-follower (LFF) formations with single-integrator dynamics. It was proven that bearing equivalence implies bearing congruence in such formations, ensuring the uniqueness of the resulting formation shape [35].
To achieve rapid convergence within a scheduled time, ref. [36] proposed a finite-time bearing-only formation control scheme based on distributed global orientation estimation. The orientation estimation law achieves almost global finite-time convergence under both undirected and rooted acyclic directed graph topologies. The accompanying formation control law ensures exponential finite-time convergence to the desired shape, significantly reducing convergence duration. In [37], two distributed position estimation strategies were developed—using either neighbor distance measurements or leader absolute positions. The resulting position-based formation control law enables global exponential convergence to the target configuration. In [38], authors designed a control law for second-order integrator agents that integrates bearing measurements with static environmental features. In a related vein, ref. [39] proposed a distributed gradient control law for stiff formations—a generalization of rigid formations—subject to mixed bearing and distance constraints. This law is derived from a unified stiffness constraint matrix that integrates both distance and bearing control within a single framework. A significant advance in global stability was achieved in [40] through the combined use of distance and bearing measurements. This method avoids local convergence pitfalls inherent in earlier works and operates without requiring a global coordinate frame.Finally, the authors of [41] addressed bearing-based formation maneuvering with time-varying translation and scaling—an aspect previously underexplored in the literature. Their work provides important contributions to the dynamic control of formations under realistic operational conditions.

2.4. Research Gap

Although existing research has made significant progress in areas such as drone formation control, passive localization, and the application of pure azimuth information, there remains a notable research gap regarding the specific problem of pure azimuth passive collaborative localization and adjustment in an electromagnetic silent environment. Most existing methods rely on certain strong assumptions or lack systematic signal interaction mechanisms to address dynamic and partially unknown environments. The research work in this paper aims to fill these gaps, and its core differences from representative existing research are compared as shown in Table 1.
This study addresses the practical, systematic, and anti-interference limitations of existing approaches, providing a novel solution for autonomous collaborative control of UAV formations in complex electromagnetic environments.

3. Problem Statement

3.1. Problem Description

When performing formation flight, drone swarms should minimize the emission of electromagnetic signals to avoid external interference. To maintain formation, a pure azimuth passive positioning method will be used to adjust the position of the drones. This involves several drones in the formation emitting signals, while the remaining drones passively receive the signals. By extracting the azimuth information from the signals, the position of the drones can be adjusted.
As shown in Figure 1, the drone formation studied in this paper consists of 10 drones arranged in a circular formation. Nine drones (numbered F Y 01 F Y 09 ) are evenly distributed along a circumference, while the remaining drone (numbered F Y 00 ) is positioned at the center of the circle. Each UAV maintains the same altitude based on its own altitude information. Within the formation, each UAV has its own number. Each UAV receives only angle information and the number of the UAV from which the signal originates, if known. The UAV formation must now adjust its position through signal transmission and reception to maintain the corresponding formation. Therefore, a model must be established to solve the following problem:
For drones that are off-center in a certain position, we need to figure out how to position or adjust them in three different situations:
1.
The central drone and two drones positioned on the circumference transmit signals to determine the position of the drone receiving the signals.
2.
The central drone, one drone with a fixed position on the circle, and at least one drone with an uncertain position on the circle transmit signals to determine the position of the drone receiving the signals.
3.
The central drone and up to three drones in a variable formation, which are not necessarily in a circle but have specific numbers, transmit signals. The remaining drones receive the signals, adjust their positions, and reach their desired locations.
The variables used in the models and solutions established in this paper to solve drone positioning or adjustment problems in different situations are provided in Table 2.

3.2. Assumption

1.
Each drone knows its own number and it knows its approximate position. In this paper, it is assumed that the positions of each drone are slightly offset. It is assumed that the drones are distributed in a circle with the correct position as the center and a radius of R. The size of R is related to the size of the formation. In this paper, it is set to 20 % of the radius of the circular formation.
2.
The range of direction angle (also known as bearing angle) information received by the drone is defined as the angle rotated when the line connecting the drone transmitting the signal (also known as the transmitter) and the drone receiving the signal (also known as the receiver) is rotated counterclockwise from the line connecting the drone with the smaller number and the drone receiving the signal to the line connecting the drone with the larger number and the drone receiving the signal. The time taken for the drone to adjust its position is ignored.
3.
All drones maintain the same altitude based on their own altitude information;
4.
All drones that need to be located can only rely on the information data received from the source drone, and drones cannot share data with each other.

4. Mathematical Model

4.1. Trilateration Localization Model with Three Known Emitters

This paper first studies the positioning problem of three transmitter drones. Based on the assumption that the position of each drone can only be determined using the information received by the drone itself, the position information of the drones transmitting signals (also known as transmitter sources) in the formation is shown in Table 3.
As shown in Figure 2, assume that F Y 0 X 1 is F Y 01 , F Y 0 X 2 is F Y 02 , and F Y 0 K is F Y 09 . From assumption 5, we can obtain F Y 00 | F Y 09 | F Y 02 = 50 ° , where is the angle θ 2 and F Y 00 | F Y 09 | F Y 01 = 70 ° is the angle θ 1 . Then, we have α 1 = 2 π θ 1 and α 2 = 2 π θ 2 . A represents the circumscribed circle of drones F Y 00 , F Y 09 , F Y 01 , and with segment | F Y 00 | | F Y 01 | as the chord and θ 1 as the inscribed angle, and B represents the circumscribed circle of drones F Y 00 , F Y 09 , F Y 02 , and with segment | F Y 00 | | F Y 02 | as the chord and θ 2 as the inscribed angle. We can see that A and B have two intersection points, one of which is drone F Y 00 , and the other is drone F Y 09 , which is the drone whose position needs to be determined in trilateration localization model. Thus, given that three drones in a known drone formation have transmitted signals from their known positions, a drone receiving these signals can determine its own position using the corresponding angle information obtained.
Under the condition that the transmission signals of the drones are known, for a specific drone that needs to be located, it will receive signals transmitted by three drones in the formation and confirm its own position through the received information. In the drone formation, when viewed from the counterclockwise direction, there are a total of A 3 3 = 6 different possible arrangements for the three numbered drones. Due to the symmetry of the circle, this paper uses the drones with number 0 , 1 , X as the signal source as an example to describe the localization model. The drone receiving the signal is numbered F Y 0 K , and the angle rotated from segment | F Y 00 | | F Y 0 K | to segment | F Y 01 | | F Y 0 K | in the counterclockwise direction is defined as α 1 , and the angle rotated from segment | F Y 00 | | F Y 0 K | to segment | F Y 0 X | | F Y 0 K | in the counterclockwise direction is defined as α 2 .
In the analysis of trilateration localization model, this paper has already proven from a geometric perspective that under the condition of three known launch sources, the solution for the position of the UAV to be located is unique. Therefore, by obtaining the central angles θ 1 and θ 2 corresponding to the two segments | F Y 00 | | F Y 01 | and | F Y 00 | | F Y 0 X | , one can solve the corresponding system of equations to determine the coordinates of the UAV to be located. The data used in this paper primarily consists of angular data, so the polar coordinate system is adopted to describe the coordinates of points.

4.1.1. Calculation of the UAV Direction Angle

Since the angle information received by the drone receiving the signal α 1 and α 2 is greater than π , it is inconvenient to calculate. In the actual calculation, this paper considers using the two smallest acute angles θ 1 , θ 2 , as shown in Figure 3.
In trilateration localization model, let’s assume that the drone receiving the signal has the number K = 7 . For different positions of the drone F Y 0 K receiving the signal, the calculation results for θ 1 , θ 2 are shown in Table 4. The counterclockwise numbering order in Table 4 is based on establishing polar coordinates with drone F Y 0 K as the pole and the horizontal right direction as the polar axis. The corresponding counterclockwise sorting relationship of the drones is obtained based on the magnitude of the polar angles of drones F Y 00 , F Y 01 , and F Y 0 X in the polar coordinates. According to assumption (1), for the drone F Y 07 that needs to confirm its own position, its location is distributed within F Y 07 centered at the correct position with a radius of R 1 . The size of the radius R 1 is related to the radius of the circular formation of the drones, where R 1 = 20 % R in this paper. Figure 3 illustrates the geometric relationship between the positioning calculation angles θ 1 , θ 2 and α 1 , α 2 when the counterclockwise numbering order of the drones serving as the transmission source is 1 0 X .

4.1.2. Localization of the UAV

Let the polar coordinates of the drone F Y 0 K to be located be K ( ρ , θ ) . This paper takes K = 7 as an example, as shown in Figure 4.
From the sine theorem, we obtain Equations (1) and (2), where r 1 and r 2 represent the distances between drone F Y 00 and drone F Y 01 and drone F Y 04 , respectively.
sin θ 1 r 1 = sin β 1 ρ
sin θ 2 r 2 = sin β 2 ρ
Then, by the exterior angle theorem of triangles, we have:
θ 1 + θ 2 + β 1 + β 2 = γ
Combining Equations (1) to (3) yields the following system of equations for calculating the coordinates of the UAV F Y 0 K :
sin θ 1 r 1 = sin β 1 ρ sin θ 2 r 2 = sin β 2 ρ θ 1 + θ 2 + β 1 + β 2 = γ
In Equation (4), θ 1 , θ 2 can be obtained from the receiving signal drone FY0K and are known. r 1 , r 2 are of definite magnitude when the transmitting signal drone is positioned without deviation. γ is the central angle formed by the three transmitting source drones. When the signal source numbers are determined, the magnitude of this angle can be calculated. In this paper, the drone numbers of the signal sources are F Y 00 , F Y 01 and F Y 0 X , respectively. Therefore, this central angle can be expressed as:
γ = ( X 1 ) 2 π 9 , 2 X 9
Combining Equations (4) and (5), we find that the three equations in Equation (4) have only three unknowns β 1 , β 2 , ρ . Combining them, we can solve for:
β 1 = arccot r 1 sin θ 2 r 2 sin θ 1 cos ( γ θ 1 θ 2 ) sin ( γ θ 1 θ 2 )
β 2 = arccot r 2 sin θ 1 r 1 sin θ 2 cos ( γ θ 1 θ 2 ) sin ( γ θ 1 θ 2 )
ρ = sin ( γ θ 1 θ 2 ) sin 2 θ 1 r 1 2 + sin 2 θ 2 r 2 2 + 2 cos ( γ θ 1 θ 2 ) sin θ 1 sin θ 2 r 1 r 2
In this paper, after obtaining the polar radius of the drone to be located in polar coordinates through a system of simultaneous equations, it is necessary to further solve for the polar angle information of the drone to be located. The calculation methods for the polar angles of drones with different source drone numbers also differ. Through analysis, this paper finds that the calculation method for the polar angle of the drone to be located is solely related to the relative positional relationship between the source drones F Y 0 X and F Y 00 . Since the relative positional relationship between F Y 0 X and F Y 00 can be determined by the magnitude of α 2 , this paper uses the magnitude of α 2 to distinguish the calculation of the polar angle of the drone to be located under different conditions. Based on geometric relationships, the polar angle calculation results for the polar coordinates K ( ρ , θ ) of the drone to be located are shown in Table 5.
Based on the above analysis and calculations, given the known information regarding the drone numbers and positions of the three transmitter sources, the result for the polar coordinates K ( ρ , θ ) of the drone F Y 0 K to be located in trilateration localization model is shown in Equation (9).
ρ = sin ( γ θ 1 θ 2 ) sin 2 θ 1 r 1 2 + sin 2 θ 2 r 2 2 + 2 cos ( γ θ 1 θ 2 ) sin θ 1 sin θ 2 r 1 r 2 θ = π + γ + α 2 π | α 2 π | ( β 2 + θ 2 )

4.2. Hierarchical Emitter Identification and Localization Model with Partially Unknown Emitters

In hierarchical emitter identification and localization model, the known launch source refers to a drone with a known ID number, and its position in the formation is unbiased. Therefore, the position of this drone launch source in space is known. As described in Figure 2, an inscribed circle can be constructed using the information from two known launch sources: the central drone and a drone with a determined position on the circumference. For an unknown-numbered drone launch source, it is only known that this launch source belongs to one of the remaining seven drones, excluding the signal-receiving drone and the two known launch source drones, and its position within the formation is unbiased. Hereinafter, such drones are collectively referred to as unknown sources.
In Section 4.1, this paper has already addressed the drone positioning problem under the condition of three known transmitter drones. In hierarchical emitter identification and localization model, the central drone, one drone with a known position on the circle, and at least one drone on the circle but with an unknown position transmit signals. To determine the position of the receiving drone, it is necessary to solve for the drone number of any one of the unknown transmitter drones, after which the drone positioning model in Section 4.1 can be used to achieve drone positioning. In hierarchical emitter identification and localization model, the position information of the drones emitting signals within the formation is shown in Table 6.

4.2.1. Analysis of Receiver Direction Angle with Deviation-Free UAV Formation Positioning

The article first studies the database of directional angle α information when any drone in a formation receives a signal transmitted by the source drone, assuming that the positions of all drones in the formation are correct.
Here, the drone receiving the signal is F Y 0 Y , and the unknown transmission source is F Y 0 X . Since the numbers and location information of drones F Y 00 and F Y 01 are known, the following conditions can be obtained:
2 X 9 2 Y 9 X Y
Since all drones in the formation are currently positioned along the circumference, any triangle formed by connecting two peripheral drones to the central drone F Y 00 is an isosceles triangle. To determine the angle α 2 —defined in the trilateration localization model as the angle at F Y 0 Y between signals received from F Y 0 X and F Y 00 —it suffices to compute the central angle FY 0 X | FY 00 | FY 0 Y , and then solve using geometric relationships. Figure 5 illustrates the calculation process for α 2 under the condition X Y < 4 , where the angular quantities γ , θ and β are defined as follows:
γ = 2 π + 2 π 9 ( X Y )
θ = β = π γ 2 = π 2 π 9 ( X Y )
According to the definition of the diagonal α 2 in trilateration localization model with three Known emitters, we can determine that
α 2 = 2 π θ = 5 π 2 + π 9 ( X Y )
Similarly, based on different values of XY, the value of α 2 under different conditions can be obtained according to the corresponding geometric relationship. The calculation results are shown in Equation (14).
α 2 = 5 π 2 + π 9 ( X Y ) , X Y < 4 π 2 + π 9 ( X Y ) , 4 X Y < 0 3 π 2 + π 9 ( X Y ) , 0 < X Y 4 π 2 + π 9 ( X Y ) , X Y > 4
Since there are 56 possible combinations of X and Y values in the drones F Y 0 X and F Y 0 Y , the values of receiver α 2 when all drones in the formation are positioned without deviation can be calculated as shown in Table 7.

4.2.2. Receiver Direction Angle Analysis in the Presence of UAV Positioning Errors

In Table 7, for the same drone number F Y 0 Y , the α 2 values of the two adjacent transmitter drones F Y 0 X differ by 20 ° . Therefore, this paper considers using 20 ° as the determination interval. That is, when the receiving drone F Y 0 Y receives a signal from the signal source drone and obtains any α 2 , the angle data corresponding to the F Y 0 X in the column where F Y 0 Y is located in Table 7 that is closest to α 2 can be considered as the angle α 2 corresponding to the transmission source drone F Y 0 X .
Based on assumption (1), when there is a deviation in the position of the drone receiving the signal, the drone’s position should be randomly distributed within a circle with a radius of 20 % R centered on its correct position. Through simulation analysis, when the drone FY 0 Y is randomly distributed around its correct position, compared with the correct value of α 2 in Table 7, when there is a deviation in the position of the drone F Y 0 Y , the actual range of values of α 2 at different positions is shown in Table 8.
According to the results in Table 8, when α 2 is within the range [ 55.92 , 61.05 ] or [ 298.95 , 304.08 ] , the corresponding value of α 2 may have two solutions, resulting in two corresponding source drones. When α 2 is within other value ranges, it corresponds one-to-one with the α 2 value obtained when there is no positional deviation. Figure 6 illustrates the situation where two corresponding source drones appear when F Y 0 Y = F Y 07 .
In Figure 6, the radius of the red circle C is 20 % R . Point W lies on this circle. If the F Y 07 drone is actually at point W, the unknown signal source is F Y 05 , and the angle F Y 00 | W | F Y 05 = 60 . 06 ° . According to Table 7, the corresponding correct angle α 2 should be 50 ° , but if the measured angle F Y 00 | V | F Y 06 = 60 . 06 ° , then based on the results in Table 7, the unknown signal source would be incorrectly identified as the F Y 06 drone, leading to the F Y 07 drone mistakenly determining its position to be on the circumcircle corresponding to triangle F Y 00 | V | F Y 06 .
Based on the analysis in Section 4.2.1 and Section 4.2.2, if we simply use the size of α 2 to determine the unknown launch source drone number, when α 2 is within the range [ 55.92 , 61.05 ] or [ 298.95 , 304.08 ] , there will be two possible solutions for the unknown transmitter source drone number, which is not universally applicable. More information needs to be considered to determine the unknown transmitter source number, and the method for confirming the unknown transmitter source needs to be improved and optimized.

4.2.3. Localization of UAV Using a Second Unknown Emitter

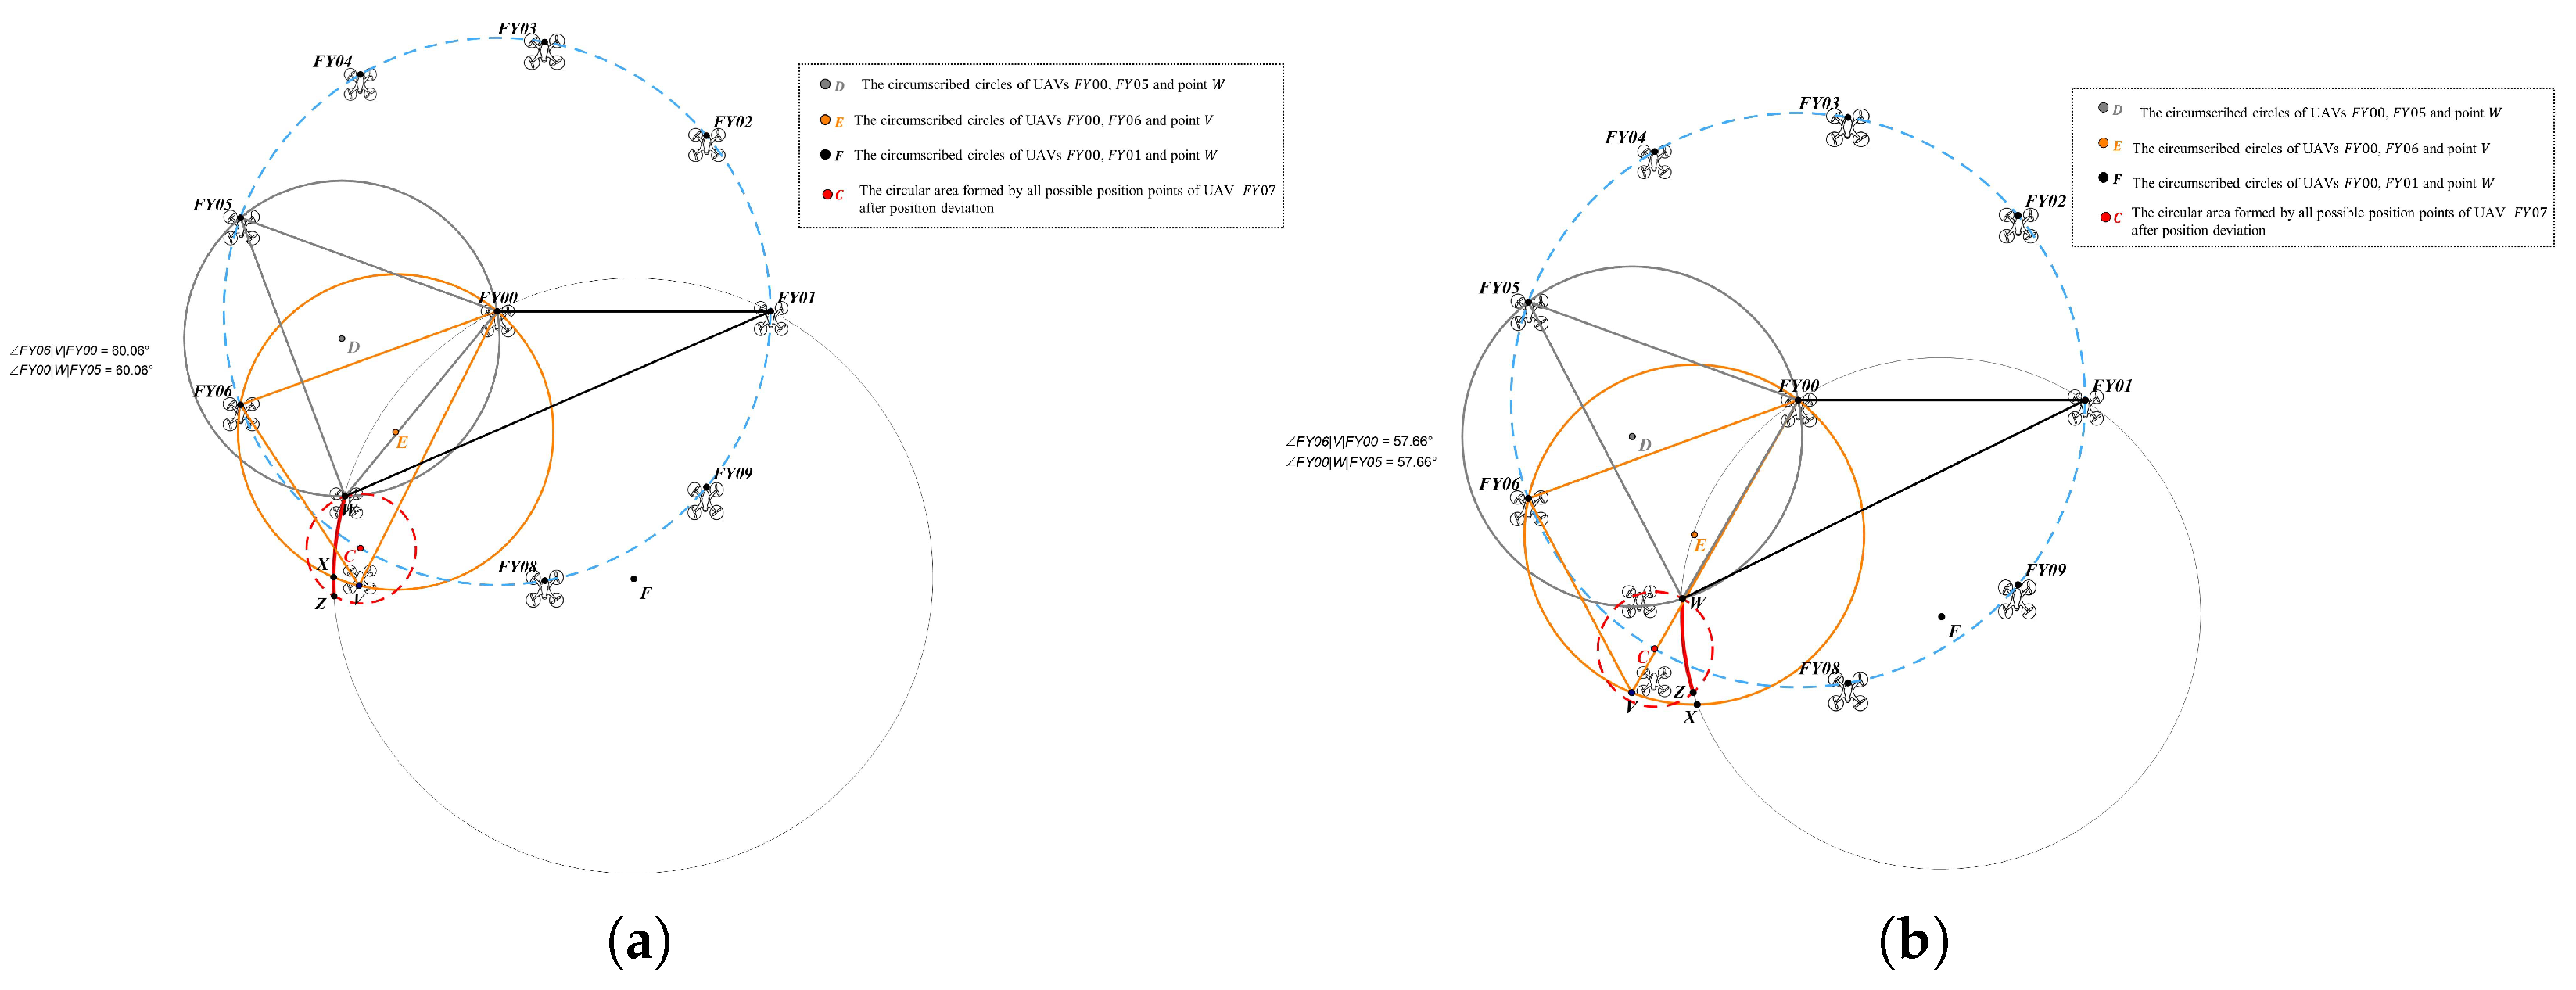
In the basic unknown source identification methods outlined in Section 4.2.1 and Section 4.2.2, this study identifies the drone number of the unknown source based only on the magnitude of angle α 2 . However, it should be noted that angle α 1 also plays a crucial role. As illustrated in Figure 7a, taking F Y 0 Y = F Y 07 as an example, once α 1 is fixed, the possible positions of drone F Y 07 are constrained from points within a circular area to points lying along a circular arc. This arc is referred to as the value domain arc, represented by the red arc W X Z in Figure 7a. Here, point W corresponds to the measured value of α 2 = 60 . 06 ° and serves as an endpoint of the value domain arc. Notably, point V does not lie on arc W X Z in this configuration. The circumcircle E of triangle F Y 00 | V | F Y 06 is constructed, and its intersection with circle F —which contains the value domain arc—is denoted as point X. Additionally, the intersection between the position circle C of drone F Y 07 and circle F is designated as point Z.
From the geometric relationship, we know that the following relationship exists between point X and point W:
α 1 X = α 1 W
α 2 X = α 2 W
Through analysis, it can be determined that, under the condition of an unknown third drone source, only by obtaining α 1 , α 2 , the position of drone FY07 can be determined to be one of the two points X and W. However, it can also be seen that in Figure 7a, point X is also located on the value domain arc, so it is still impossible to determine whether the position of drone FY07 is at point X or point W. As shown in Figure 7b, if the range of deviation of the F Y 07 drone from its correct position is slightly reduced, point X no longer lies on the value domain arc, and the value domain arc becomes the arc W Z . At this point, it can be directly determined that the drone’s position is at point W.
In summary, even if the information of angle α 1 is added to the method for determining the unknown source drone, it is still impossible to completely determine the position of the unknown source drone. Therefore, this paper considers receiving information from a fourth source to locate the drone.
According to the results in Table 7, it can be seen that for the drone F Y 0 Y that needs to be located, if the position of the source cannot be determined after measuring α 2 based on the source, then the corresponding unknown source drone F Y 0 X 1 must satisfy the following relationship:
| X 1 Y | 2
Due to the symmetry of the α 2 value range, this paper first studies the case where α 2 [ 55.92 , 61.05 ] , i.e., X 1 { Y 1 , Y 2 } . The analysis is the same for α 2 [ 298.95 , 304.08 ] . Therefore, the following analysis focuses on the drone localization problem under two different values of X 1 . Here, this paper still assumes that F Y 0 Y = F Y 07 .
1.
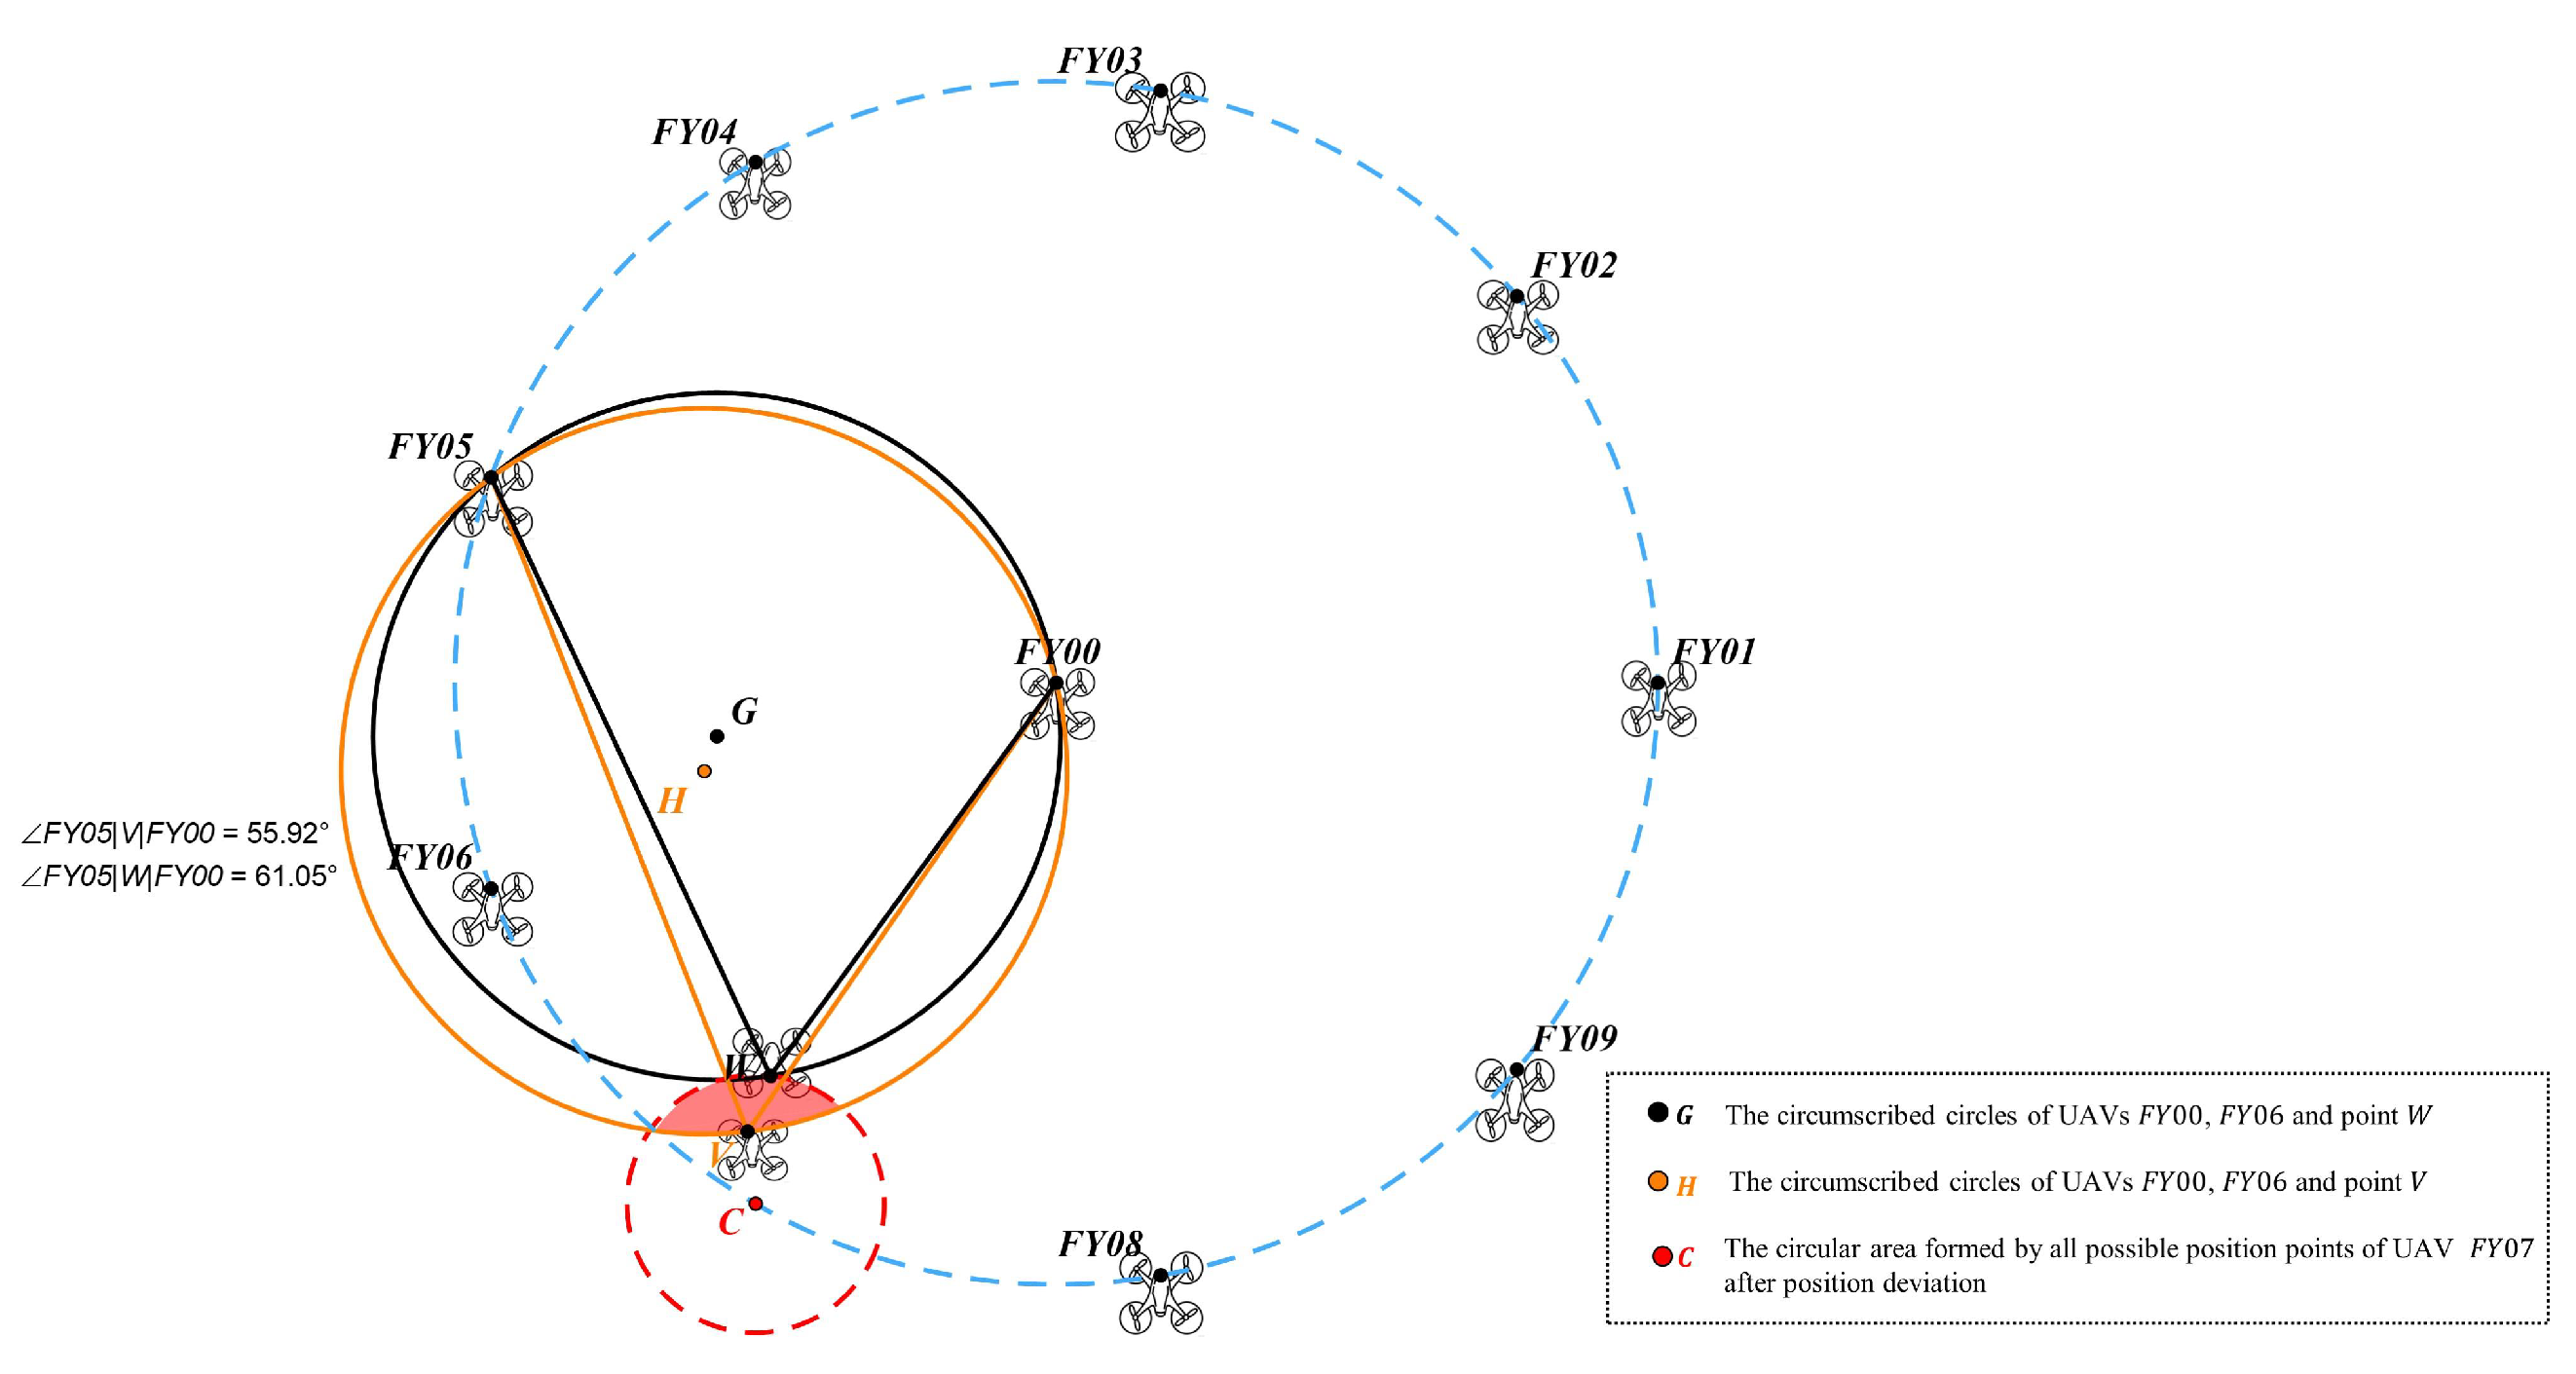
Analysis of UAV localization under the condition of X 1 = Y 1 ; As shown in Figure 8, when F Y 0 Y = F Y 07 , X 1 = 6 . Under the constraint that α 2 [ 55.92 , 61.05 ] , an inscribed circle is constructed using 55 . 92 ° and 61 . 05 ° as the central angles, corresponding to the inscribed circles of F Y 06 | V | F Y 00 and F Y 06 | W | F Y 00 , respectively, denoted as H and G . At this point, the position of the F Y 0 Y drone should be located within the common area where the region formed by H and G intersects with C , i.e., the red shaded area in Figure 8.
Further analysis reveals that for the red shaded area in Figure 8, a second unknown transmitter source F Y 0 X 2 (the fourth transmitter source) is introduced. The drone F Y 0 X 2 transmits a signal to F Y 0 Y , and combined with the signal transmitted by drone F Y 00 , the corresponding direction angle α 3 is obtained. Through simulation and exhaustive analysis, it is found that for drones where X 2 Y + 1 , the α 3 measured by F Y 0 Y does not belong to the range [ 55.92 , 61.05 ] [ 298.95 , 304.08 ] . At this point, the drone F Y 0 X 2 ’s ID can be directly confirmed using the simple unknown source confirmation method described in Section 4.2.1 and Section 4.2.2, thereby achieving receiver localization. However, for the case where X 2 = Y + 1 , the situation where α 3 [ 298.95 , 304.08 ] still occurs, making it impossible to determine the ID of the transmitter F Y 0 X 2 . Further improvements and optimizations to the localization method are therefore required.
2.
Analysis of UAV localization under the condition of X 1 = Y 2 . As shown in Figure 9, under the interval restriction α 2 [ 55.92 , 61.05 ] , X 1 = 5 at this time. Again, draw a circumscribed circle with 55 . 92 ° and 61 . 05 ° as the circumference angles, i.e., the circumscribed circles corresponding to F Y 05 | V | F Y 00 and F Y 05 | W | F Y 00 , also denoted as H and G . As discussed earlier, the position of the F Y 0 Y drone should be located within the region formed by H and G and the intersection with circle C , i.e., the red shaded area in Figure 9.
Further analysis reveals that for points within the red shaded region in Figure 9, introducing a second unknown transmitter source (the fourth transmitter source) drone F Y 0 X 2 to transmit signals to F Y 0 Y yields α 3 . Consistent with the results discussed earlier, simulation-based analysis reveals that for drones where X 2 Y + 2 , the α 3 measured by F Y 0 Y does not fall within the range [ 55.92 , 61.05 ] [ 298.95 , 304.08 ] , meaning that the receiver’s positioning can be directly achieved at this point. However, for the case where X 2 = Y + 2 , α 3 may also fall within the range [ 298.95 , 304.08 ] , making it impossible to locate the drone F Y 0 Y .
3.
Analysis of UAV localization under the condition of X 1 + X 2 = 2 Y .
Based on the analysis of the above two points, under the condition that | X 1 Y | 2 , if X 1 + X 2 = 2 Y , the F Y 0 Y drone still cannot determine the identification number of the source drone using angles α 2 or α 3 , nor can it determine its own position. However, for the F Y 0 Y drone, if it can confirm that α 2 and α 3 belong to the range [ 55.92 , 61.05 ] [ 298.95 , 304.08 ] , then it can be concluded that the values of the two unknown-numbered source drones F Y 0 X 1 and F Y 0 X 2 can only be one of the two cases in Equation (17).
X 1 = Y 1 X 2 = Y + 1 X 1 = Y 2 X 2 = Y + 2
Therefore, if it is possible to determine which of these two situations applies through computational analysis, the values of X 1 and X 2 can be determined simultaneously, thereby achieving drone positioning. Considering that the information regarding the back angle α 1 has not yet been utilized after introducing the second unknown transmitter source for positioning, this paper proposes to further utilize the value of α 1 for additional analysis.
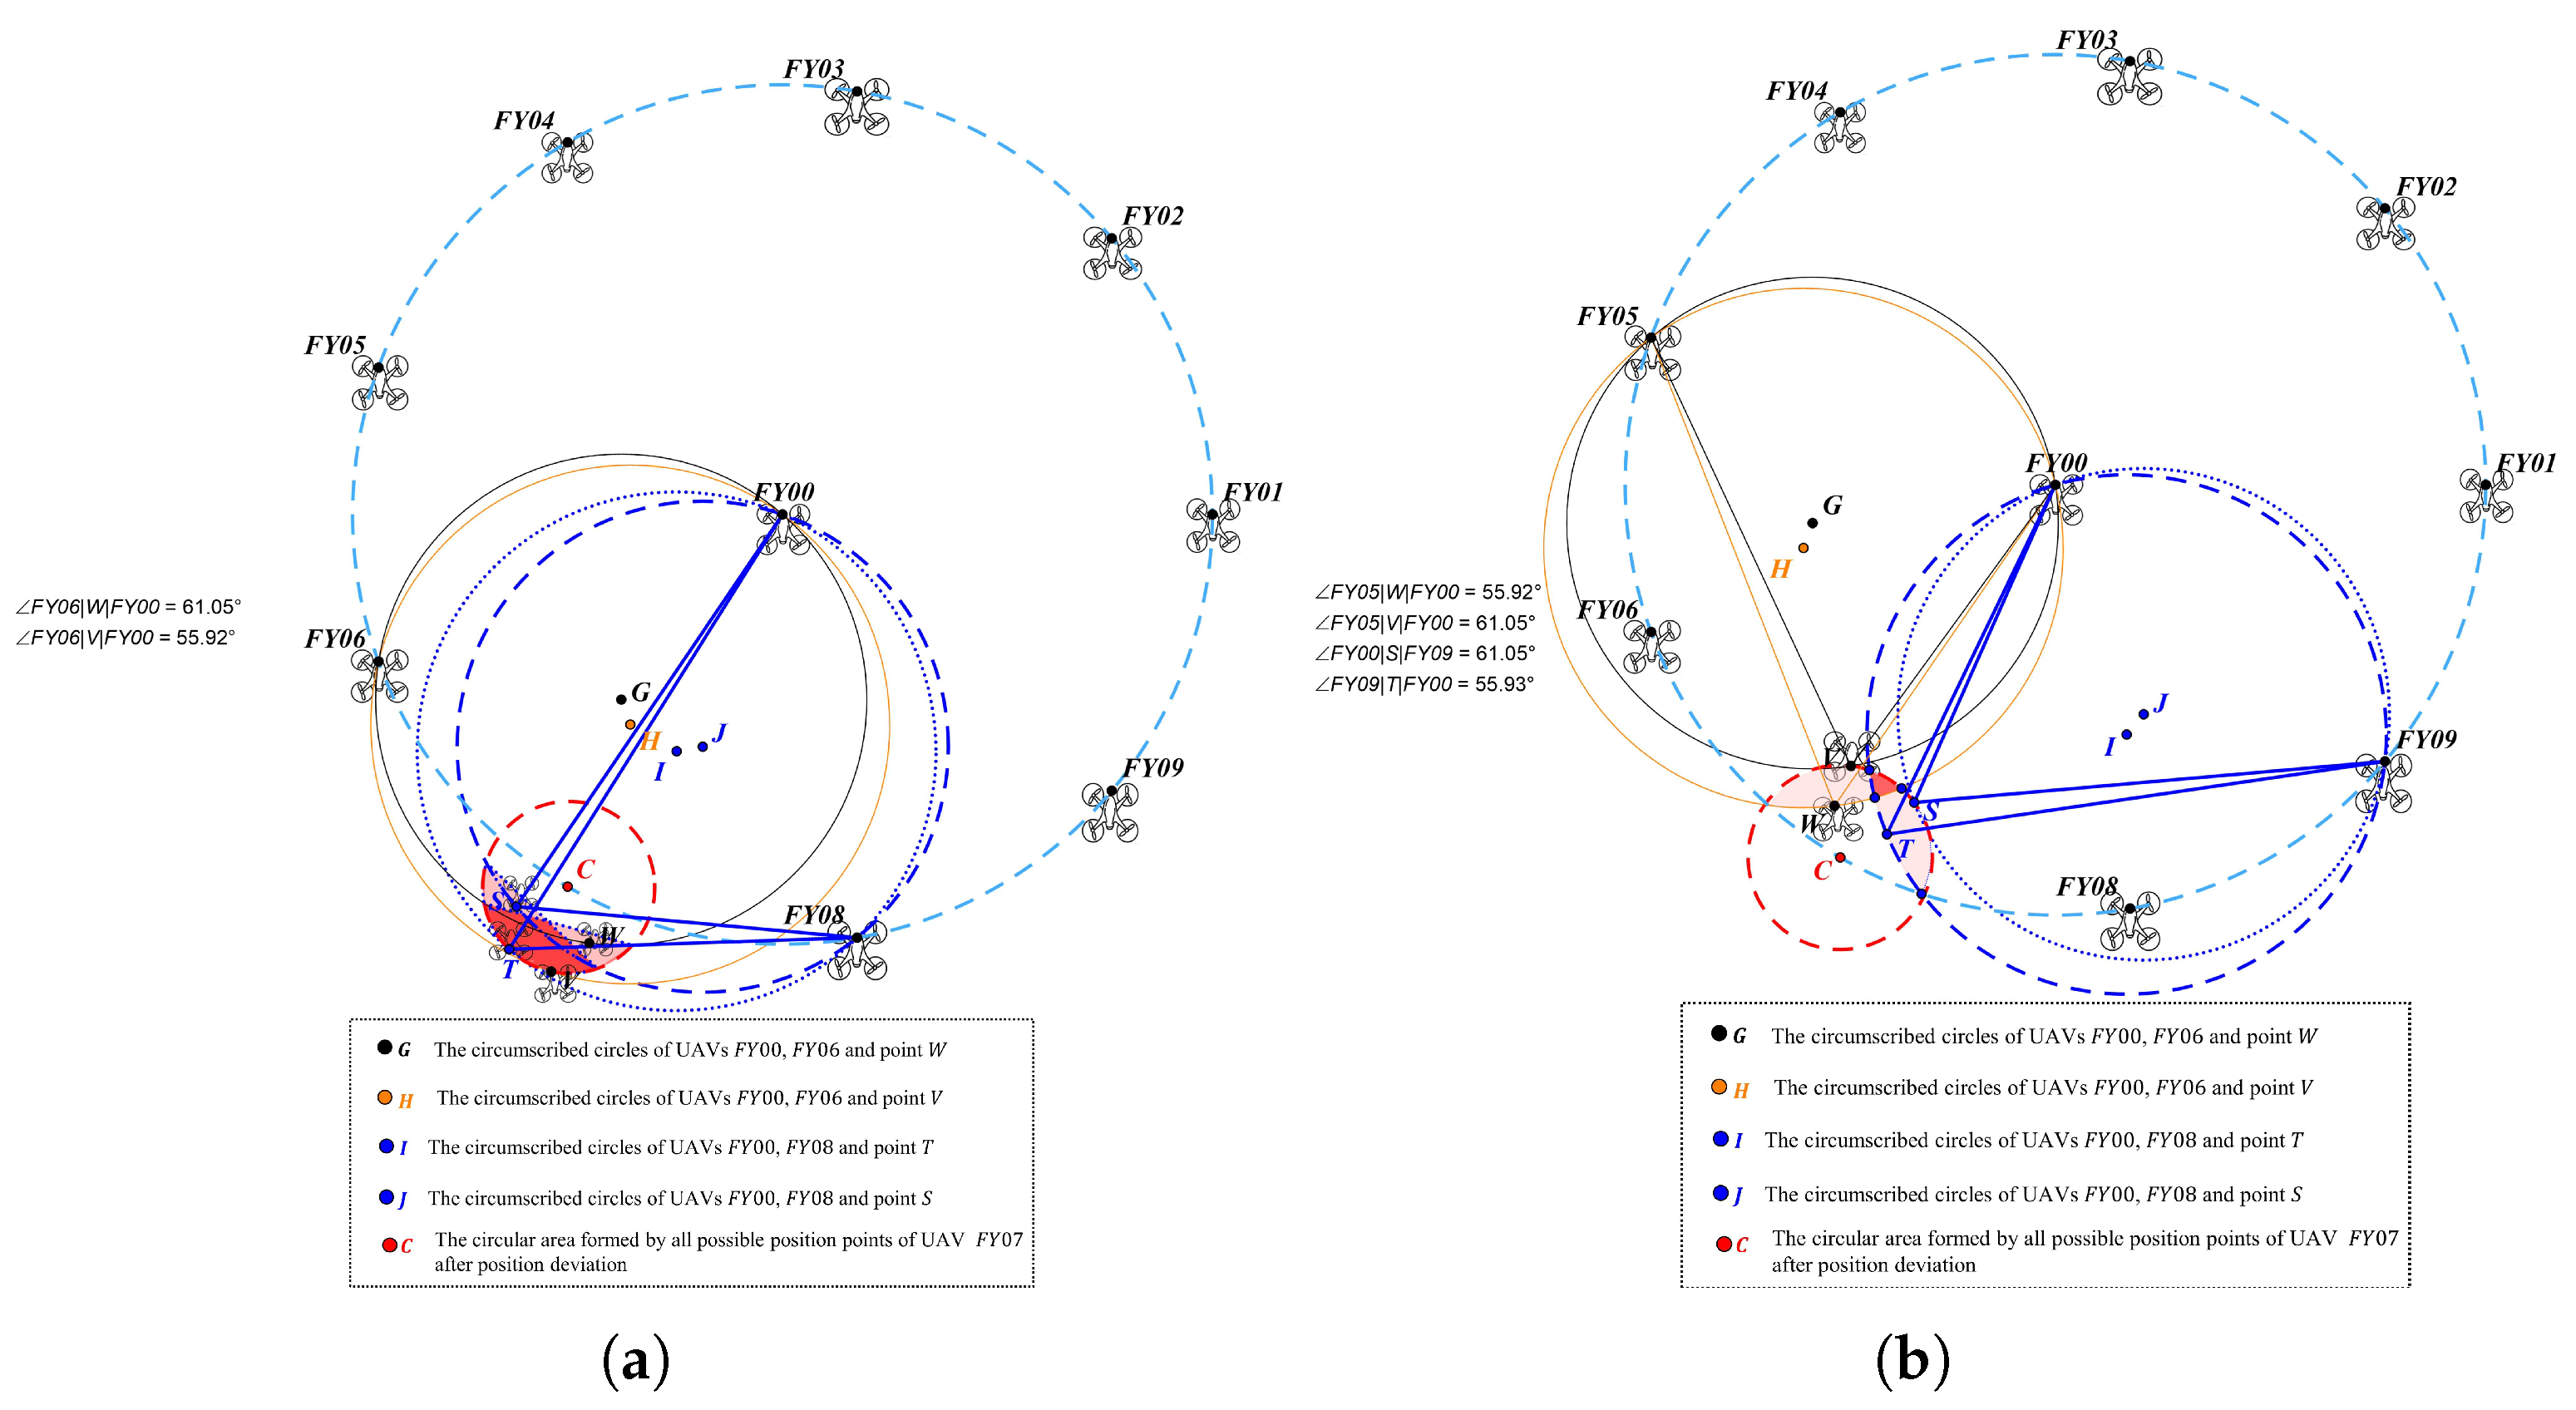
As shown in Figure 10a, when X 1 = Y 1 and X 2 = Y + 1 , based on Figure 8, draw the drone F Y 0 Y position range corresponding to α 3 [ 298.95 , 304.08 ] . Based on the definition of angle α in this paper, the circumscribed circles are still drawn using 55 . 92 ° and 61 . 05 ° as the central angles, i.e., the circumscribed circles corresponding to F Y 08 | S | F Y 00 and F Y 08 | T | F Y 00 , denoted as J and I , respectively. At this point, the position of the F Y 0 Y drone should be located in the intersection of the region formed by H and G and the region formed by J and I , both of which are inside C , i.e., the red highlighted region in Figure 10. This region represents the position range of the drone when X 1 = Y 1 and X 2 = Y + 1 .
As shown in Figure 10b, when X 1 = Y 2 and X 2 = Y + 2 , draw the position range of drone F Y 0 Y corresponding to α 3 [ 298.95 , 304.08 ] based on Figure 9. Similarly, construct the circumscribed circles corresponding to F Y 09 | S | F Y 00 and F Y 09 | T | F Y 00 , denoted as J and I , respectively. Similarly, the position range of drone F Y 0 Y at this time is the red highlighted area in Figure 10b.
The positional regions of the drone F Y 0 Y under both conditions in Equation (17) are depicted in the same diagram, as shown in Figure 11. The red cross-hatched shaded area represents the positional range of the drone F Y 0 Y when X 1 = Y 1 and X 2 = Y + 1 . The blue shaded area represents the positional range of the drone F Y 0 Y when X 1 = Y 2 and X 2 = Y + 2 . Now, consider determining whether the drone F Y 0 Y is located within the red shaded area or the blue shaded area based on the value of angle α 1 . Suppose F Y 0 Y is at point N within the red shaded area. Constructing the circumcircle of F Y 00 | N | F Y 01 through point N yields K . It can be observed that point M within the blue shaded area also lies on K . This indicates that the angle α 1 measured by the drone F Y 0 Y at points M and N is equal. Thus, even when incorporating a l p h a 1 information, it remains impossible to determine whether F Y 0 Y is in the red or blue shaded area, and the receiver positioning problem remains unsolved.

4.2.4. Localization of UAV Using a Second Unknown Emitter

Under the conditions introduced in Section 4.2.3, where a second unknown transmitter drone F Y 0 X 2 is introduced, utilizing all angular information still fails to resolve the receiver’s positioning problem. Therefore, this paper considers introducing a third unknown transmitter F Y 0 X 3 (the fifth transmitter) to achieve drone positioning. Following the discussions in Section 4.2.1, Section 4.2.2 and Section 4.2.3, regardless of which drone F Y 0 X 3 is introduced as the unknown transmitter, X 3 does not belong to { Y 1 , Y + 1 , Y 2 , Y + 2 } . Consequently, based on the magnitude of the obtained angle α 4 and the analysis in Section 4.2.1, the identification number of drone FY0 X 3 can be directly determined. Subsequently, the positioning problem for drone F Y 0 Y can be solved using the trilateration localization model.
Based on the above analysis, for the UAV F Y 0 Y requiring positioning, under the conditions of knowing the identification numbers of two transmitter-source drones with no positional deviation and several unidentified transmitter-source drones, the drone positioning flowchart is shown in Figure 12.

4.3. Cyclic Cooperative Adjustment Strategy for Formation Convergence

In cyclic cooperative adjustment strategy for formation convergence of this study, according to the drone formation requirements, one drone is positioned at the center of a circle, while the remaining nine drones are distributed along a circular path with a radius of 100 m. Each drone exhibits a certain deviation from its desired position. Multiple adjustments are required, with each iteration selecting drone F Y 00 and up to three additional drones along the circular path to transmit signals. The remaining drones adjust their positions based on the received azimuth information to align with their desired locations, ultimately achieving uniform distribution of all nine drones along the circular path. Table 9 presents the polar coordinates of each drone at the initial moment and the polar coordinates of the desired drone positions. Based on the initial position data, only drones F Y 00 and F Y 01 are positioned on the formation circle without deviation. All other drones exhibit deviations from their desired positions. Therefore, during each adjustment cycle, drones F Y 00 and F Y 01 are consistently assigned to transmit signals. Receiving drones calculate their corresponding direction angles from the signals emitted by F Y 00 and F Y 01 . This direction angle imposes constraints on the position of the signal-receiving drone, preventing cumulative error effects from causing positional errors to escalate. Consequently, all drones can return to their desired positions more rapidly.

4.3.1. A Multi-UAV Signal Interaction-Based Iterative Strategy for Cooperative Position Adjustment (PEJE)

Since the receiving drone can only obtain the magnitude of the direction angle α , this paper proposes determining a signal transmission and reception adjustment sequence T. In the formation, some drones perform signal transmission tasks while the remaining drones receive signals and adjust their positions. This enables the receiving drones to make multiple corresponding adjustments based on the comparison between the actual direction angle and the desired direction angle, thereby reaching the desired position. The desired direction angle α 2 information remains as shown in Table 7.
Because the positions of the drones in F Y 02 F Y 09 deviated from their expected positions within the circular formation, the direction angles received by the actual drones did not match those that would be received by the same transmitter drone at its intended position. However, constrained by the direction angles obtained by receivers after signals are transmitted by the F Y 00 and F Y 01 drones (which have no positional deviation), as the position adjustment process progresses, gradually aligning the receiver’s actual position with its desired position can make the actual direction angle closer to the desired direction angle. Through continuous role switching between signal-receiving drones and signal-transmitting drones, signal interaction is established among all drones, creating a continuous feedback loop to achieve coordinated adjustment of the drone formation.
Therefore, this paper proposes a periodic drone position coordination adjustment strategy (PEJE) based on multi-UAV signal interaction. Specifically:
1.
Perceive: The signal-receiving UAV acquires real-time direction angle information from both stationary ( F Y 00 , F Y 01 ) and moving signal sources, serving as raw data for position assessment.
2.
Explore: The receiver centers on its current position and, within a preset neighborhood, employs an adaptive discrete neighborhood search algorithm to move to different discrete points. It instantly measures the actual direction angle relative to the transmitter source at each point, forming multiple sets of angular data samples.
3.
Judge: The receiver compares the actual direction angle detected with the desired direction angle. By evaluating the quality of each discrete point through an objective function, it identifies the optimal position P with the smallest deviation.
4.
Execute: Based on the analysis results, the receiver adjusts its position to point P, completing this round of adjustment. Subsequently, according to the signal transmission and reception adjustment sequence T, some UAVs switch transmission/reception states and enter the next cycle, continuing until the entire formation converges to the desired position. These four steps form a critical closed-loop mechanism in the UAV position adjustment process, known as the PEJE loop.
As shown in Figure 13, as the signal transmission and reception status of the drones changes, the P E J E loops of each drone transition between the interrupted and active states. This enables the drones to continuously cycle their respective P E J E loops through signal interaction, forming a tightly coupled relationship between all components.
Therefore, when addressing the drone formation adjustment problem in cyclic cooperative adjustment strategy, this paper transforms the problem into designing a signal transmission and reception adjustment sequence T such that the final positions of all drones after cyclic adjustments converge to the desired positions.
This paper proposes determining a signal transmission and reception adjustment sequence T, enabling the receiving drone to perform multiple corresponding adjustments based on the comparison between its actual heading angle and the desired heading angle, thereby reaching the target position. For each adjustment, F Y 00 and F Y 01 consistently perform signal transmission tasks, allowing the states of the eight drones F Y 02 F Y 09 to be modified during each adjustment.
Each adjustment corresponds to an 8-bit binary code (hereafter referred to as the “one-time adjustment scheme” ( O T S ) to represent the status of drones F Y 02 F Y 09 . Drones with a corresponding code of 1 perform signal transmission tasks, while those with a code of 0 perform signal reception tasks. Given the constraint that no more than three drones may perform transmission tasks simultaneously within the restricted perimeter, and that the F Y 01 drone must perform transmission, the sum of all codes for any single adjustment must not exceed 2. The mathematical model is expressed as follows: where x i = 1 indicates the corresponding drone is performing signal transmission, and x i = 0 indicates that the corresponding drone is performing signal reception.
O T S = [ x 1 , x 2 , , x 8 ] ,
S.t.
x i { 0 , 1 } , i { 1 , 2 , 3 , , 8 } ,
i = 1 8 x i 2 .
This paper assumes the receiver serial number is r e s and the transmitter serial number on the circle is l a u . At this point, the receiver receives the actual direction angle information α r e s , l a u , with the receiver as the angular vertex and the transmitters on the circle and the center transmitter as the two side vertices. Simultaneously, the direction angle information α r e s , l a u at the desired position of the UAV is calculated. The actual direction angle of the target position after a single adjustment is closer to the desired direction angle.
Therefore, for a single adjustment, this paper assumes that for F Y 02 F Y 09 , the receiver serial number set is R E S = { r e s 01 , r e s 02 , , r e s 0 m } and the transmitter serial number set is L A U = { l a u 01 , l a u 02 , , l a u 0 n } . For receiver r e s 0 i , it must find a point within the position adjustment domain such that at this point, the deviation evaluation function (weighted sum of squared angular deviations) is minimized. The evaluation function E v a l is shown in Equation (22).
E v a l = j = 1 n α r e s 0 i , l a u 0 j α r e s 0 i , l a u 0 j 2 + n α r e s 0 i , 01 α r e s 0 i , 01 2 , i = 2 , 3 , , 9
This evaluation function ensures that the receiver assigns greater weight to direction angle information from the bias-free transmitter at positions F Y 00 and F Y 01 . This drives the entire adjustment process, guiding the UAV’s polar path relative to F Y 00 toward the desired radius, while also enabling drones F Y 02 F Y 09 to correct each other’s positions through signal interaction as the single-adjustment code changes. This allows all eight drones to progressively approach their desired positions within the circular formation as required.
From the receiver’s perspective, since each adjustment takes negligible time, it only needs to search within a certain surrounding area. By comparing the acquired directional information, it locates the optimal position that minimizes the evaluation function under the current state.
Therefore, the model for this problem can be summarized as follows:
Argmin C A S S j = 1 n α r e s 0 i , l a u 0 j α r e s 0 i , l a u 0 j 2 + n α r e s 0 i , 01 α r e s 0 i , 01 2 , i = 2 , 3 , , 9
S.t.
C A S = [ O T S 1 , O T S 2 , , O T S N a d j ]
O T S j = [ x 1 , x 2 , , x 8 ] , j { 1 , 2 , , N a d j }
x i { 0 , 1 } , i { 1 , 2 , 3 , , 8 }
i = 1 8 x i 2
Here, S denotes the set of all possible complete adjustment schemes. Equation (22) indicates that the model aims to find a complete adjustment scheme (CAS) that minimizes the bias evaluation function. Equation (23) shows that a complete adjustment scheme consists of N a d j single adjustment codes. Equations (25) and (26) represent the constraints on the single adjustment codes.

4.3.2. Adaptive Discrete Neighborhood Search Algorithm

For the receiver, the optimal position within the current location neighborhood can be determined through corresponding calculations, where this optimal position minimizes the angular deviation evaluation function. To compute the corresponding direction angle in the model described by Equation (22), this paper further models the adjustable positional neighborhood space of the receiver and calculates the adjusted receiver coordinates. Therefore, an adaptive discretized neighborhood search algorithm is designed to describe the receiver’s search process, aiming to find the location point within the current neighborhood of the UAV that minimizes the evaluation function. Some parameters describing this method are shown in Table 10.
For the drone with serial number k, the specific steps of the method are as follows:
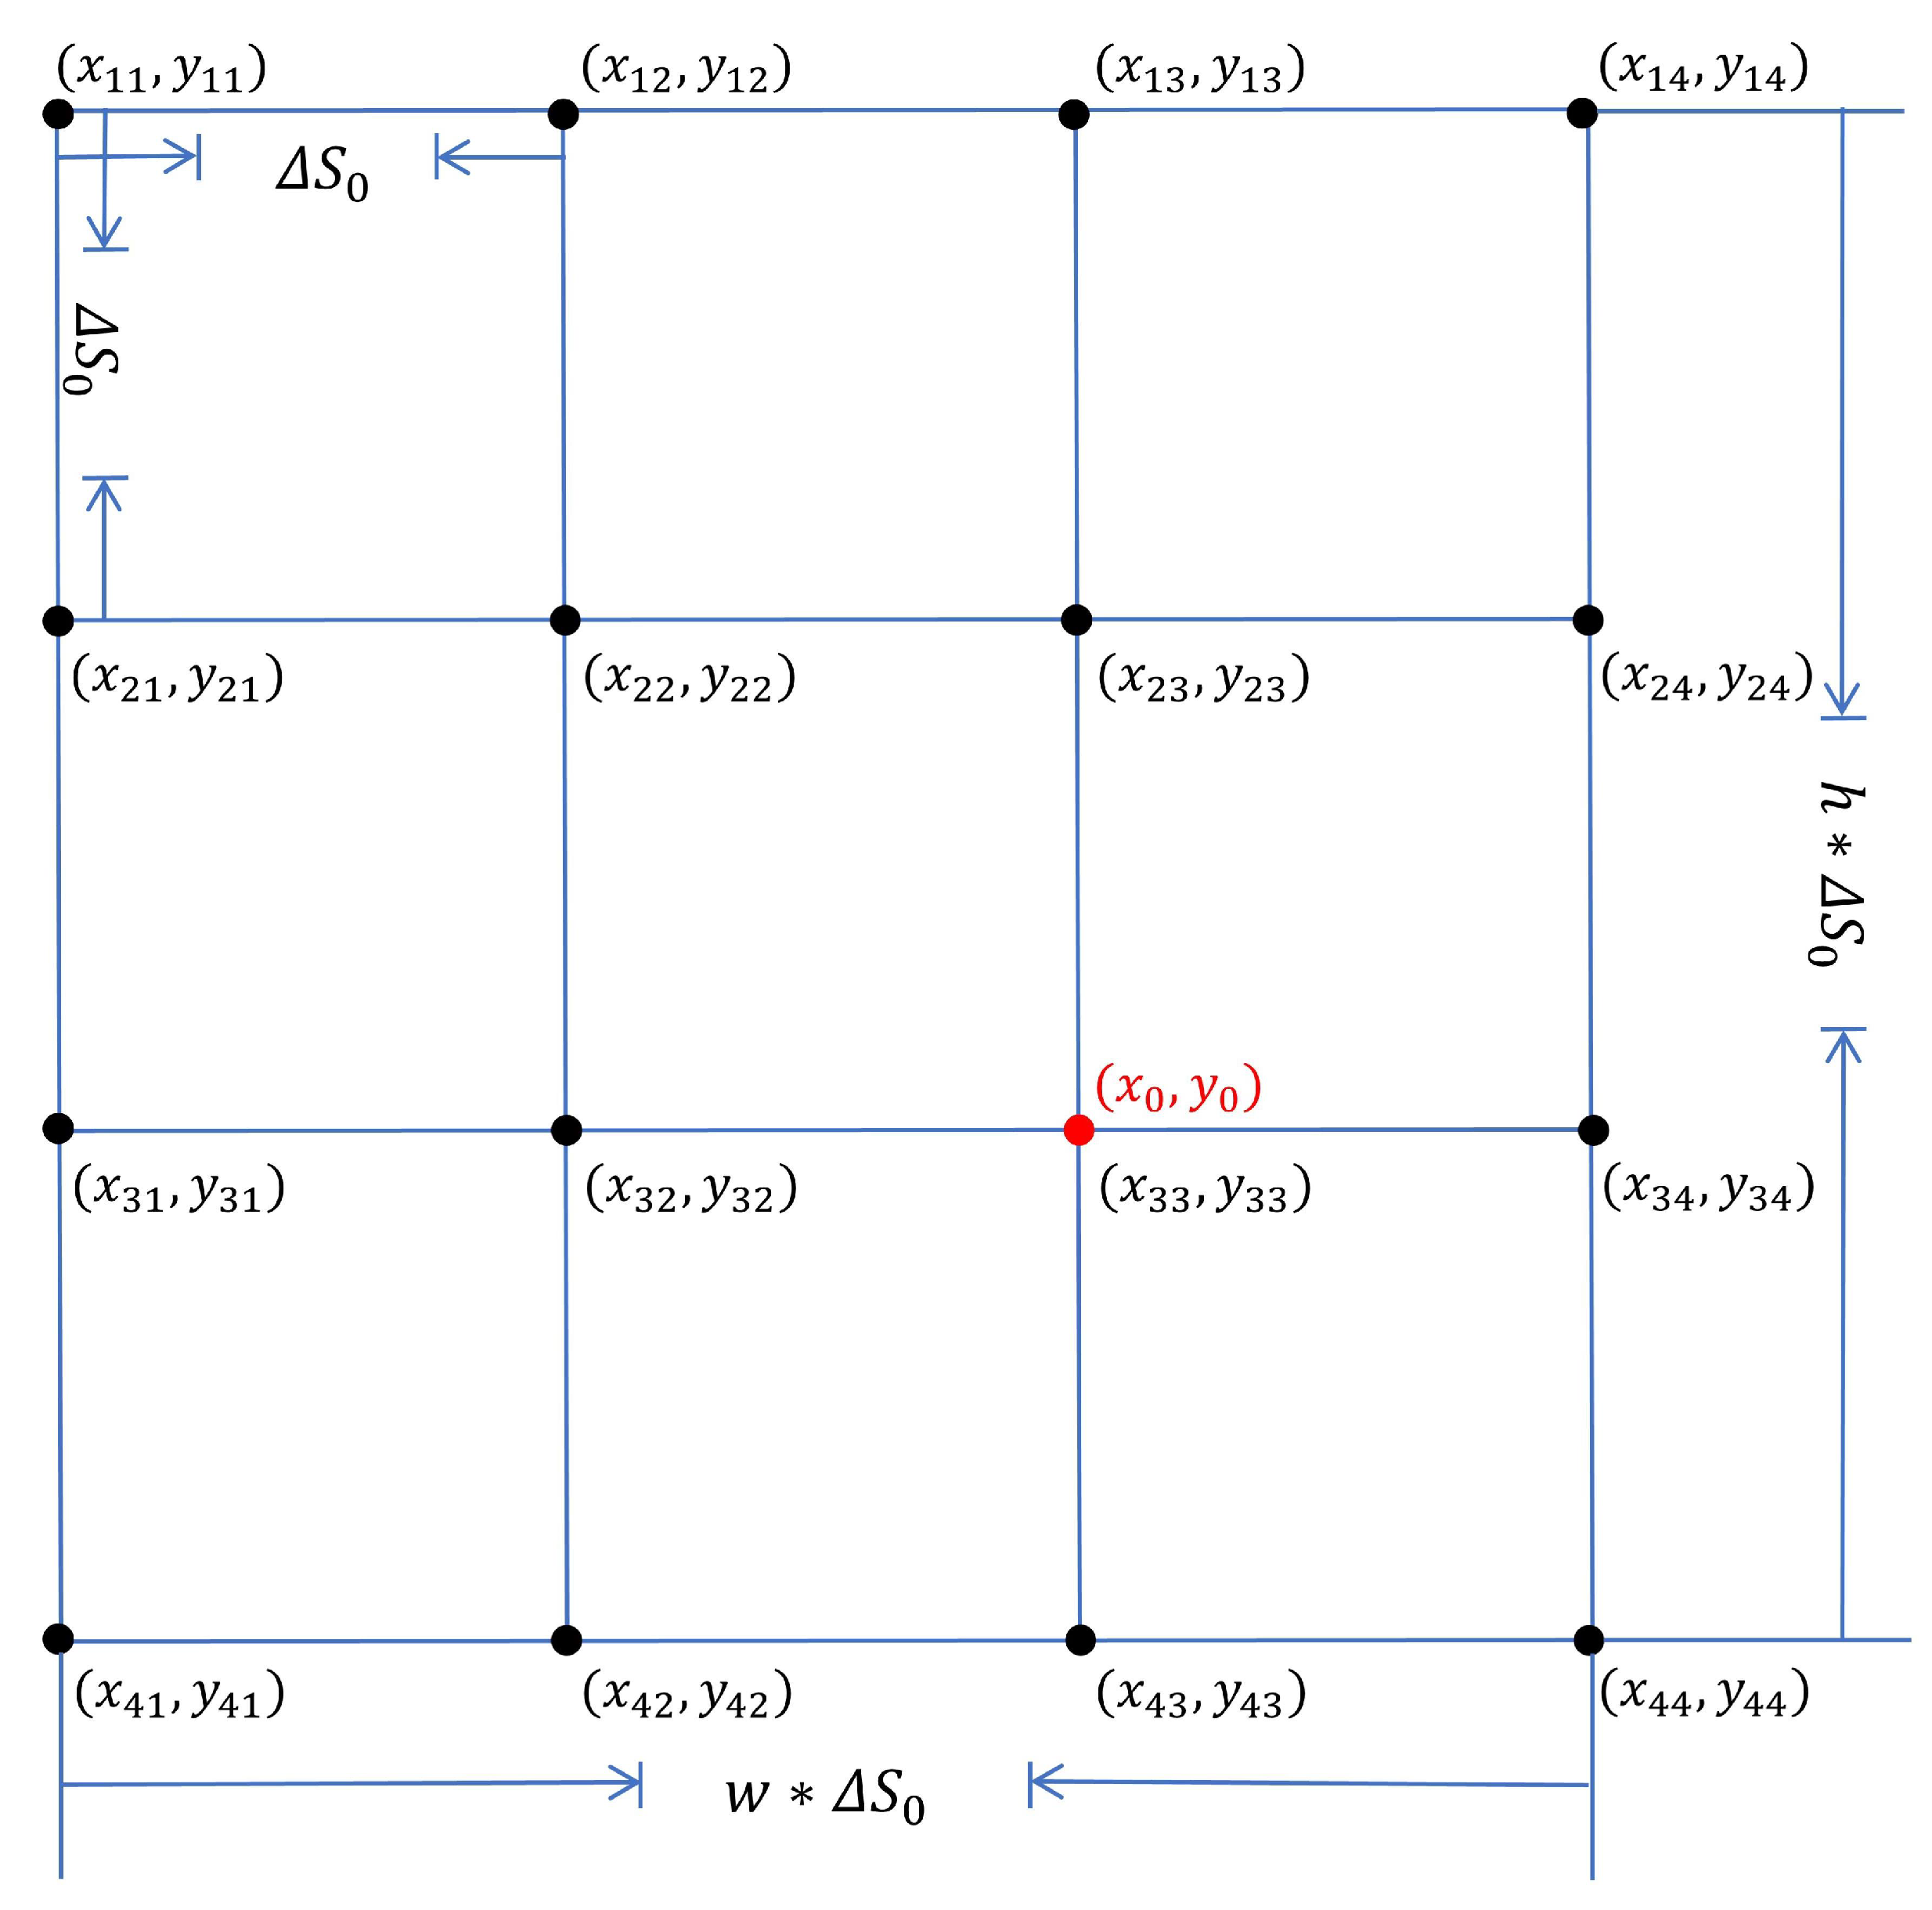
Step 1: Set the initial discretization interval Δ S 0 , the number of grid divisions in the horizontal direction w, the number of grid divisions in the vertical direction h, the step reduction coefficient within a single adjustment scheme η i n t e r , the search depth within a single adjustment scheme N i n t e r , the step reduction coefficient between complete adjustment schemes η o u t e r , the number of single adjustments in a complete scheme N a d j , the initial solution as the current drone’s initial position ( x 0 , y 0 ) , the counter within a single adjustment scheme k i n t e r = 0 , and the counter for the number of complete adjustment schemes k o u t e r = 0 . As shown in Figure 14.
Step 2: Centered at the coordinates ( x 0 , y 0 ) of the drone requiring position adjustment, create a discretized grid with Δ S 0 × η i n t e r k i n t e r × η o u t e r k o u t e r as the grid side length, yielding the set of discretized points { ( x i j , y i j ) , i { 1 , 2 , , w + 1 } , j { 1 , 2 , , h + 1 } } . As shown in Figure 15, where in Δ S m n , m denotes k i n t e r and n denotes k o u t e r .
Step 3: Calculate the actual direction angle of the current drone at each discrete coordinate point within the discrete grid point set. Select the point among all discrete coordinate points that minimizes the evaluation function, and use this point as the drone’s new adjusted position ( x k , y k ) .
Step 4: k i n t e r + = 1 . If k i n t e r < N i n t e r , return to Step 2. Otherwise, k o u t e r + = 1 and set k i n t e r = 0 . If k o u t e r < N a d j , wait until all receivers complete adjustment before proceeding to the next adjustment cycle and returning to Step 2. Otherwise, proceed to Step 5.
Step 5: Obtain the adjusted position of the drone ( x k f , y k f ) .
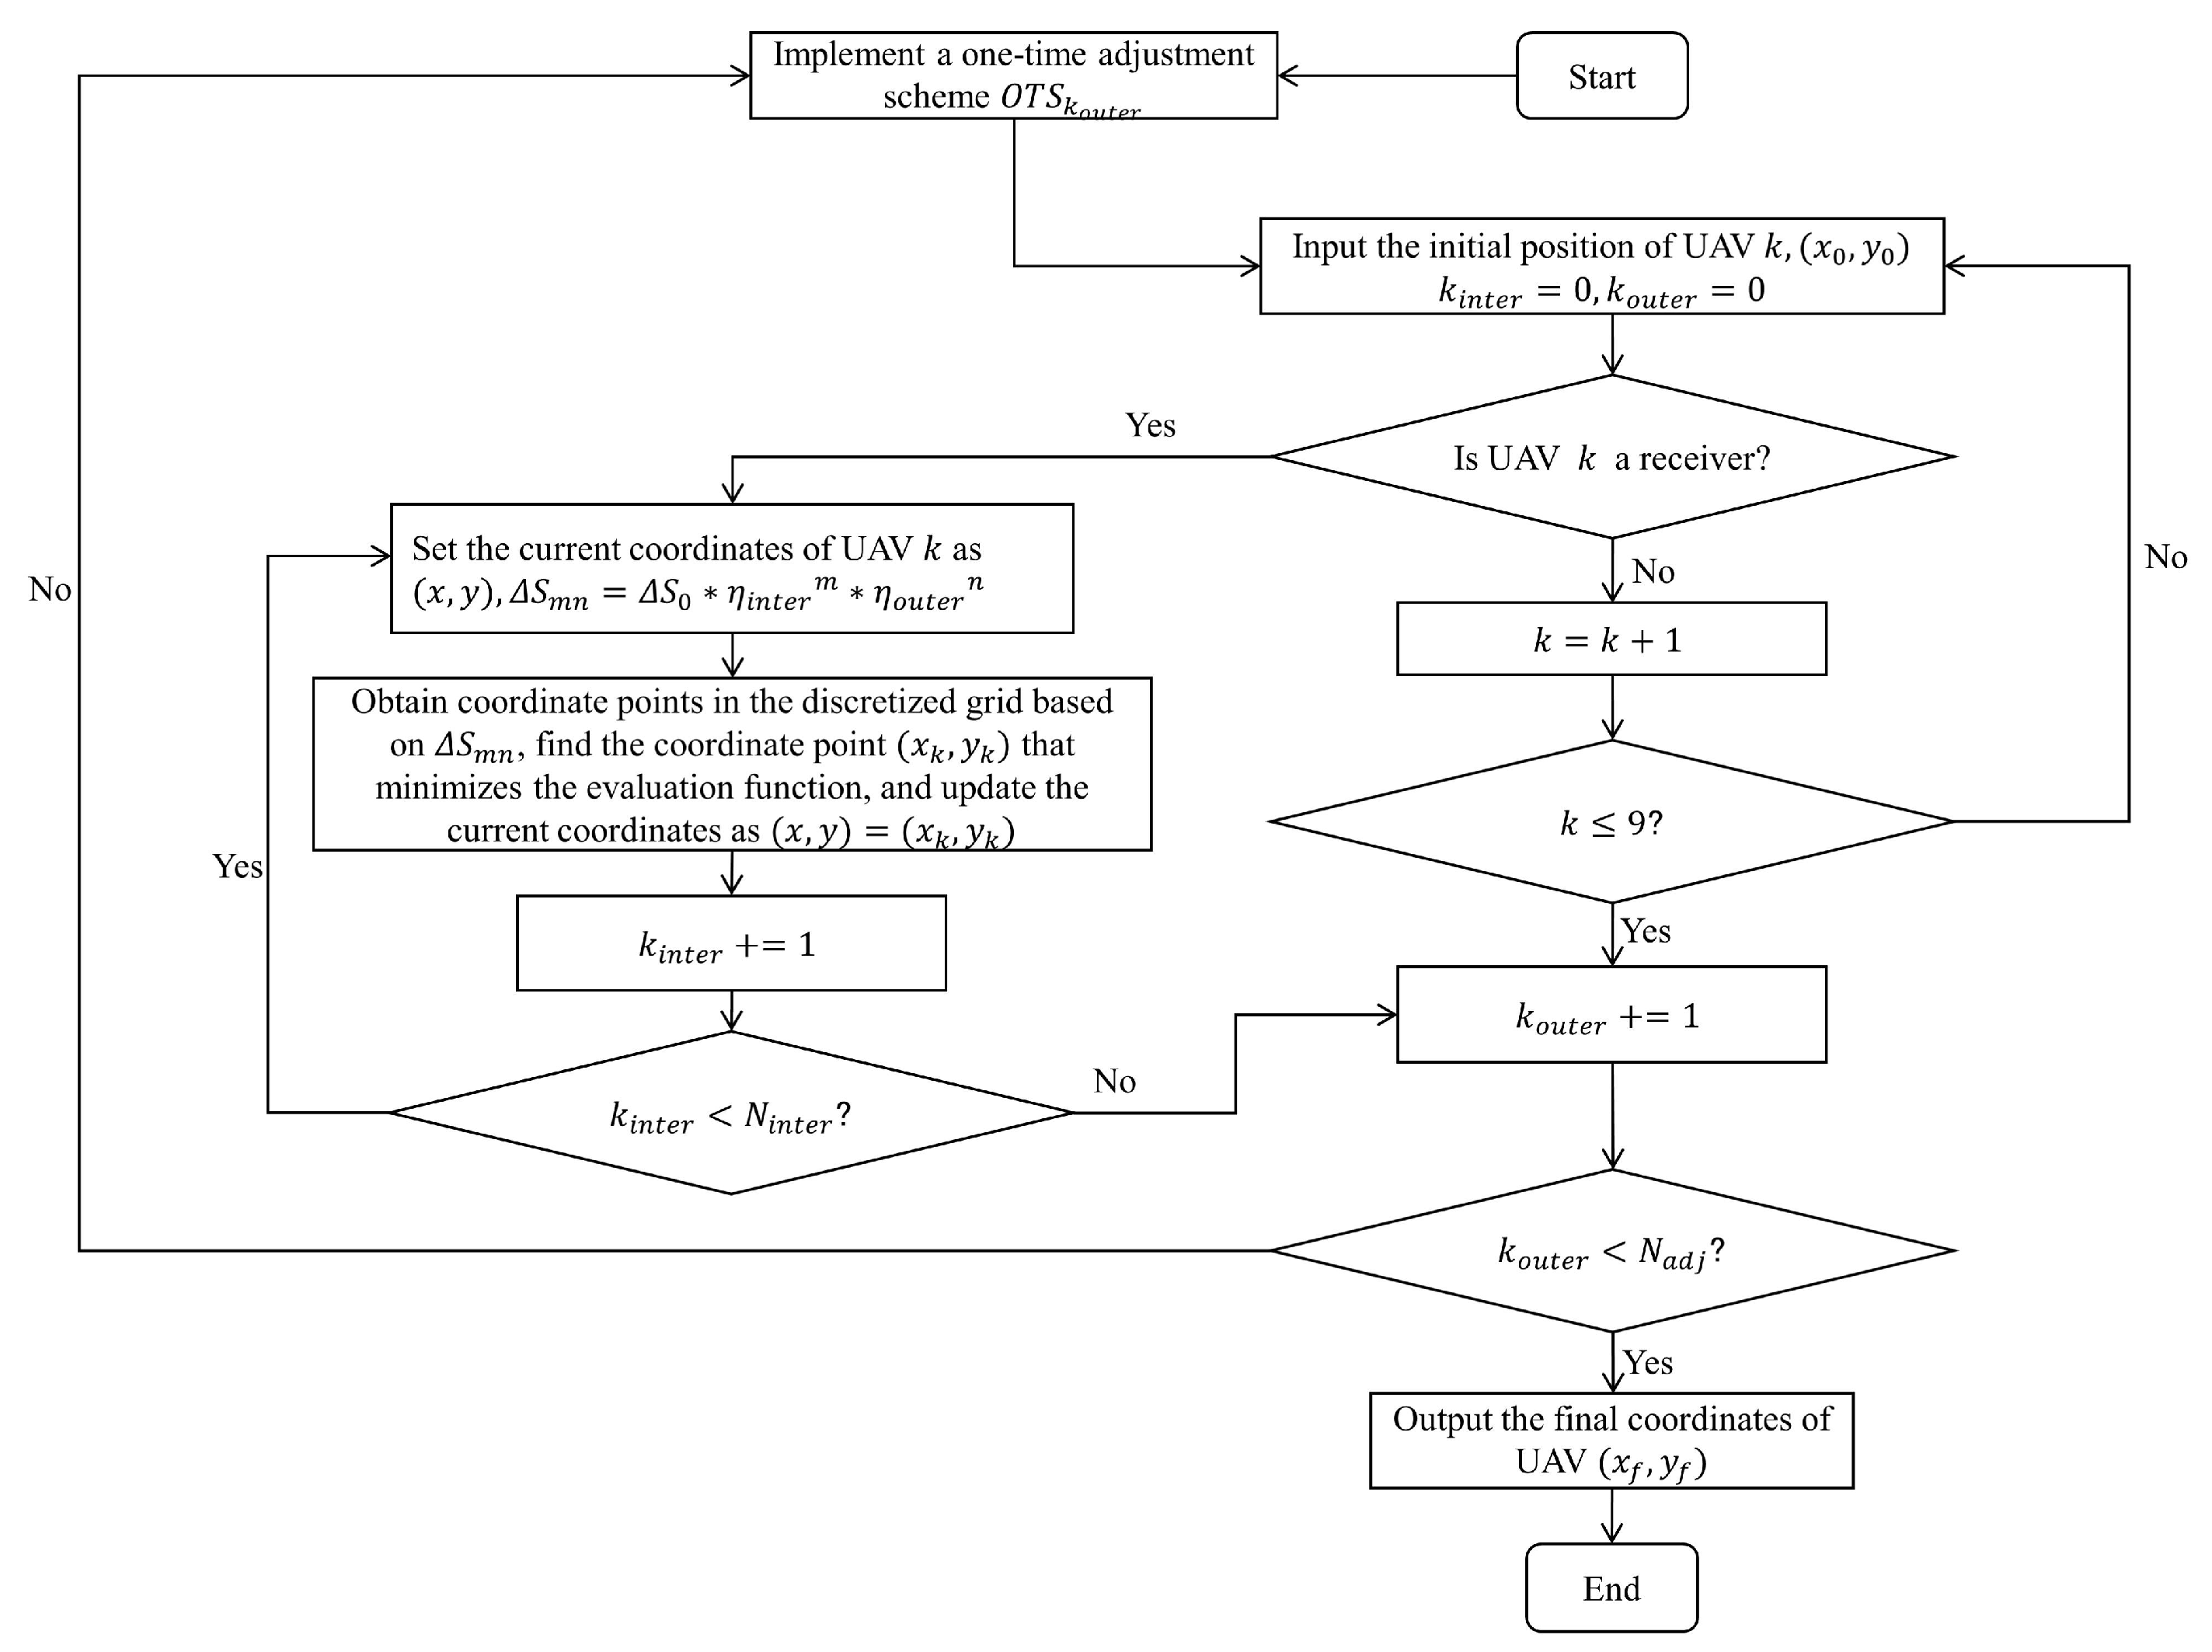
The algorithm flowchart is shown in Figure 16.
Algorithm pseudocode is shown in Algorithm 1.
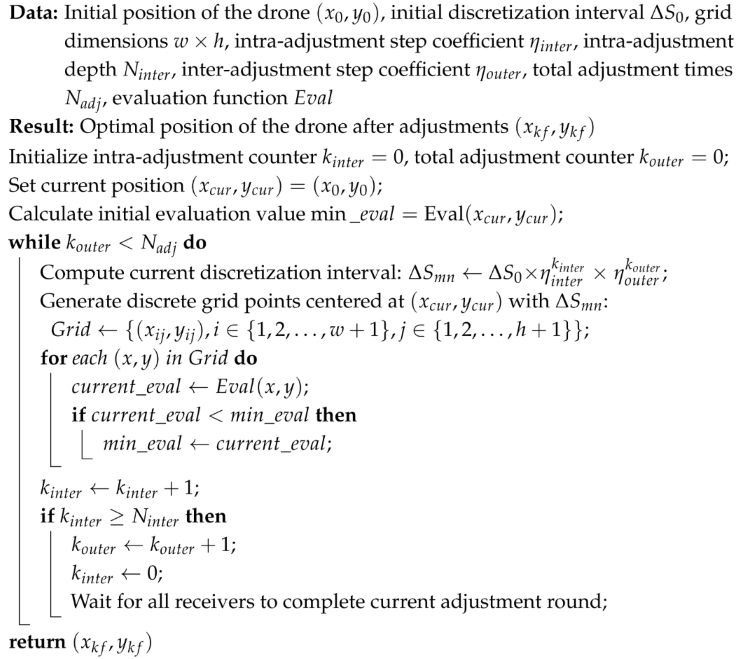
Algorithm 1: Adaptive Discrete Neighborhood Search Algorithm
Drones 09 00767 i001

5. An Improved Optimization Method for Cyclic Cooperative Adjustment Strategy (PEJE) for Formation Convergence

In cyclic cooperative adjustment strategy for formation convergence, designing a signal transmission and reception adjustment sequence T spanning to drones F Y 02 F Y 09 involving the scheduling of signal transmission and reception states for eight drones and the planning of multiple adjustment sequences. The solution space grows exponentially with dimensions, far exceeding the processing capacity of exact algorithms. Additionally, the optimization objective requires considering the cumulative error after multiple adjustments rather than static optimization of a single state, constituting a dynamic combinatorial optimization problem. Exact algorithms are prone to getting stuck in local optima in multi-peak problems; for instance, an optimal single adjustment step may increase the global cumulative error. Intelligent optimization algorithms, however, leverage population evolution and random search mechanisms to efficiently navigate the solution space, rapidly converging toward the global optimum while maintaining solution diversity and global evaluation. This approach enables escape from local minima to identify globally optimal strategies. Its iterative optimization process can be synchronized with the dynamic adjustments of UAVs (via loop interaction), enabling simultaneous adjustment and optimization. Therefore, this paper employs an improved genetic algorithm—Genetic Algorithm Integrating Adaptive Discrete Neighborhood Search (GA-IADNS) to optimize and solve this problem.

5.1. Encoding Rules in GA-IADNS

For each position adjustment of the drones, drones F Y 00 and F Y 01 consistently perform signal transmission tasks. Consequently, this procedure can modify the status of the eight drones F Y 02 F Y 09 each time.
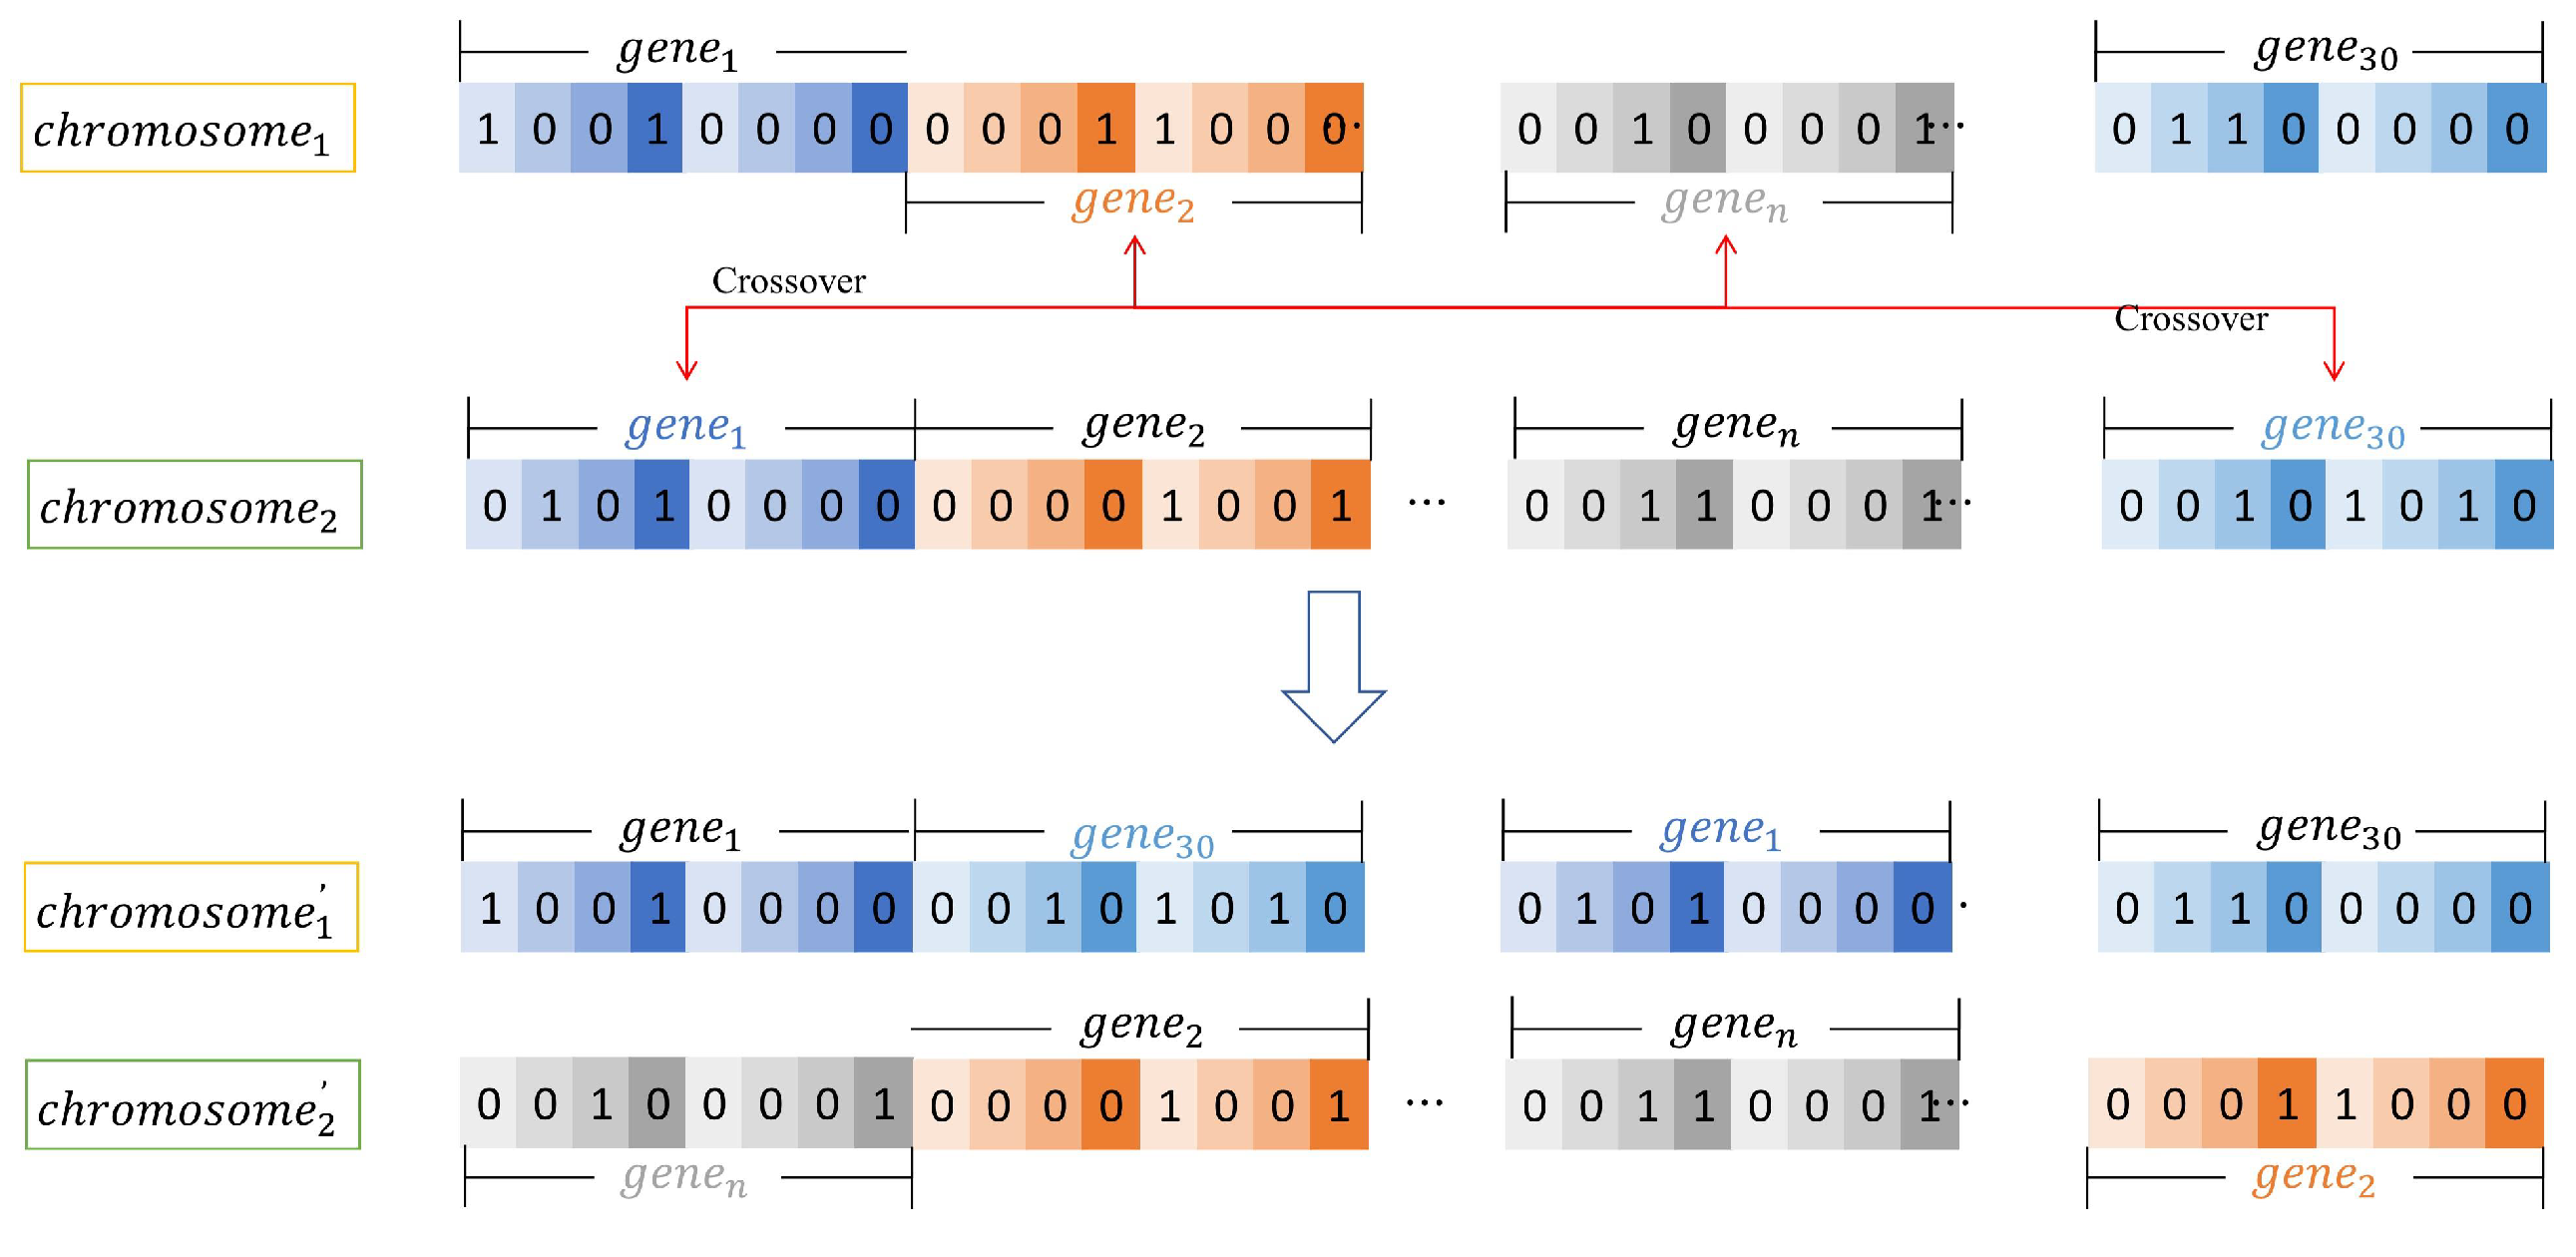
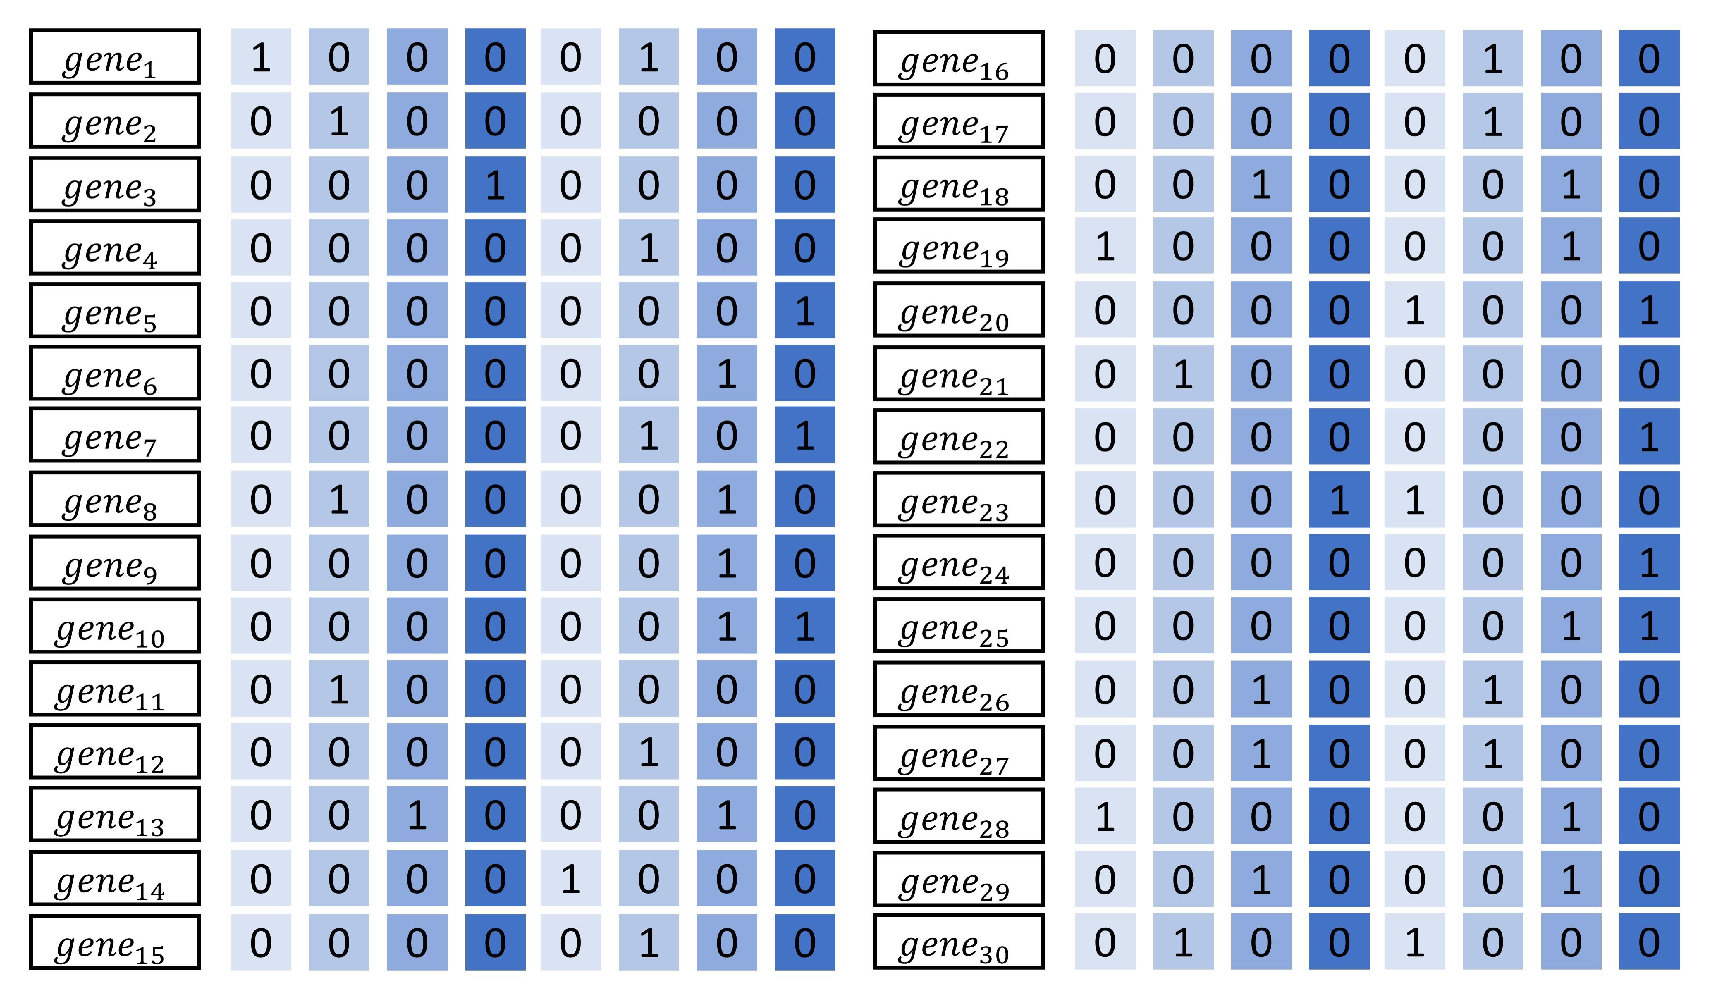
From Equation (19), this paper proposes representing a single adjustment scheme using an 8-bit binary code, i.e., a single adjustment code. Drones corresponding to a code value of 1 perform signal transmission tasks, while those corresponding to a code value of 0 perform signal reception tasks. The single-adjustment code O T S is incorporated into the genetic algorithm as a gene. Each complete scheme has an adjustment frequency a d j _ t i m e = 30 . Therefore, aligning with the format of the complete adjustment scheme C A S in Equation (24), this paper represents the chromosome as c h r o m o s o m e = { g e n e 1 , g e n e 2 , , g e n e 30 } , corresponding to the complete adjustment scheme C A S . The gene encoding and chromosome encoding processes are illustrated in Figure 17 and Figure 18.

5.2. Fitness Function in GA-IADNS

For a given adjustment scheme c h r o m o s o m e , after all drones complete positional adjustments, the adjusted positions of all drones F Y 0 k are set as { ( x k f , y k f ) } k { 0 , 1 , 2 , , 9 } . The sum of squared residuals between each drone’s current position and its desired position coordinates { ( x k t , y k t ) } , k { 0 , 1 , 2 , , 9 } is calculated, as shown in Equation (28).
Δ d = k = 0 9 ( x k f x k t ) 2 + ( y k f y k t ) 2
This paper selects the square of the reciprocal of the sum of squares of residuals between the adjusted UAV position coordinates and the desired position coordinates as the fitness function in the genetic algorithm, as shown in Equation (29). The smaller the deviation between the adjusted UAV position and the desired position, the better the effectiveness of the adjustment scheme, and the larger the fitness function value.
f ( c h r o m o s o m e ) = 1 Δ d 2

5.3. Mutation in GA-IADNS

Individual genes within a c h r o m o s o m e undergo random mutations according to their coding patterns, with mutations occurring independently across different genes. The probability of mutation for a single gene is denoted as P 0 . The mutation process is shown in Figure 19.

5.4. Crossover in GA-IADNS

Within a population, gene segments from different c h r o m o s o m e are exchanged at the gene level to generate new chromosomes in the offspring. The mutation process is shown in Figure 20.

5.5. Procedure of the GA-IADNS

The pseudocode for the improved genetic algorithm is shown in Algorithm 2.
Algorithm 2: Genetic Algorithm Integrating Adaptive Discrete Neighborhood Search
Drones 09 00767 i002

6. Simulation Experiments

6.1. Experiment Setup

To systematically validate the performance of the proposed bearing-only passive cooperative localization models and adjustment algorithms, a simulation experimental platform was built based on Python 3.10. The hardware environment consisted of a computer equipped with a 13th Gen Intel Core i9-13980HX processor (2.20 GHz) and 64.0 GB RAM. The simulation scenario was a two-dimensional circular formation with a radius of 100 m, comprising 10 UAVs, with F Y 00 at the center and specific initial coordinates of F Y 01 F Y 09 are provided in Table 9.
In the simulations for the cooperative adjustment strategy (PEJE) in cyclic cooperative adjustment strategy for formation convergence, the GA-IADES was employed to optimize the signal transceiver sequence. The core algorithm parameters were set as follows: population size S = 20 , maximum iterations G = 20 , mutation probability P v = 0.01 , step size reduction factor within a single adjustment step η i n t e r = 0.5 and step size reduction factor between consecutive adjustment steps η o u t e r = 0.8 .
The simulation experiments conducted in this study primarily include the following five parts:
1.
Analysis of Adjusted UAV Coordinates under the Optimal Scheme: Presenting the deviation between the converged positions of all UAVs and their desired positions under the optimal signal sequence found by GA-IADES.
2.
Process Analysis of UAV Position Adjustment: Plotting the variation curves of the polar radius and angle for each UAV during the adjustment process to observe the convergence trend.
3.
Sensitivity Analysis of Algorithm Parameters: Investigating the impact of key parameters (population size, mutation probability, and step size coefficients) on algorithm performance, measured by average fitness.
4.
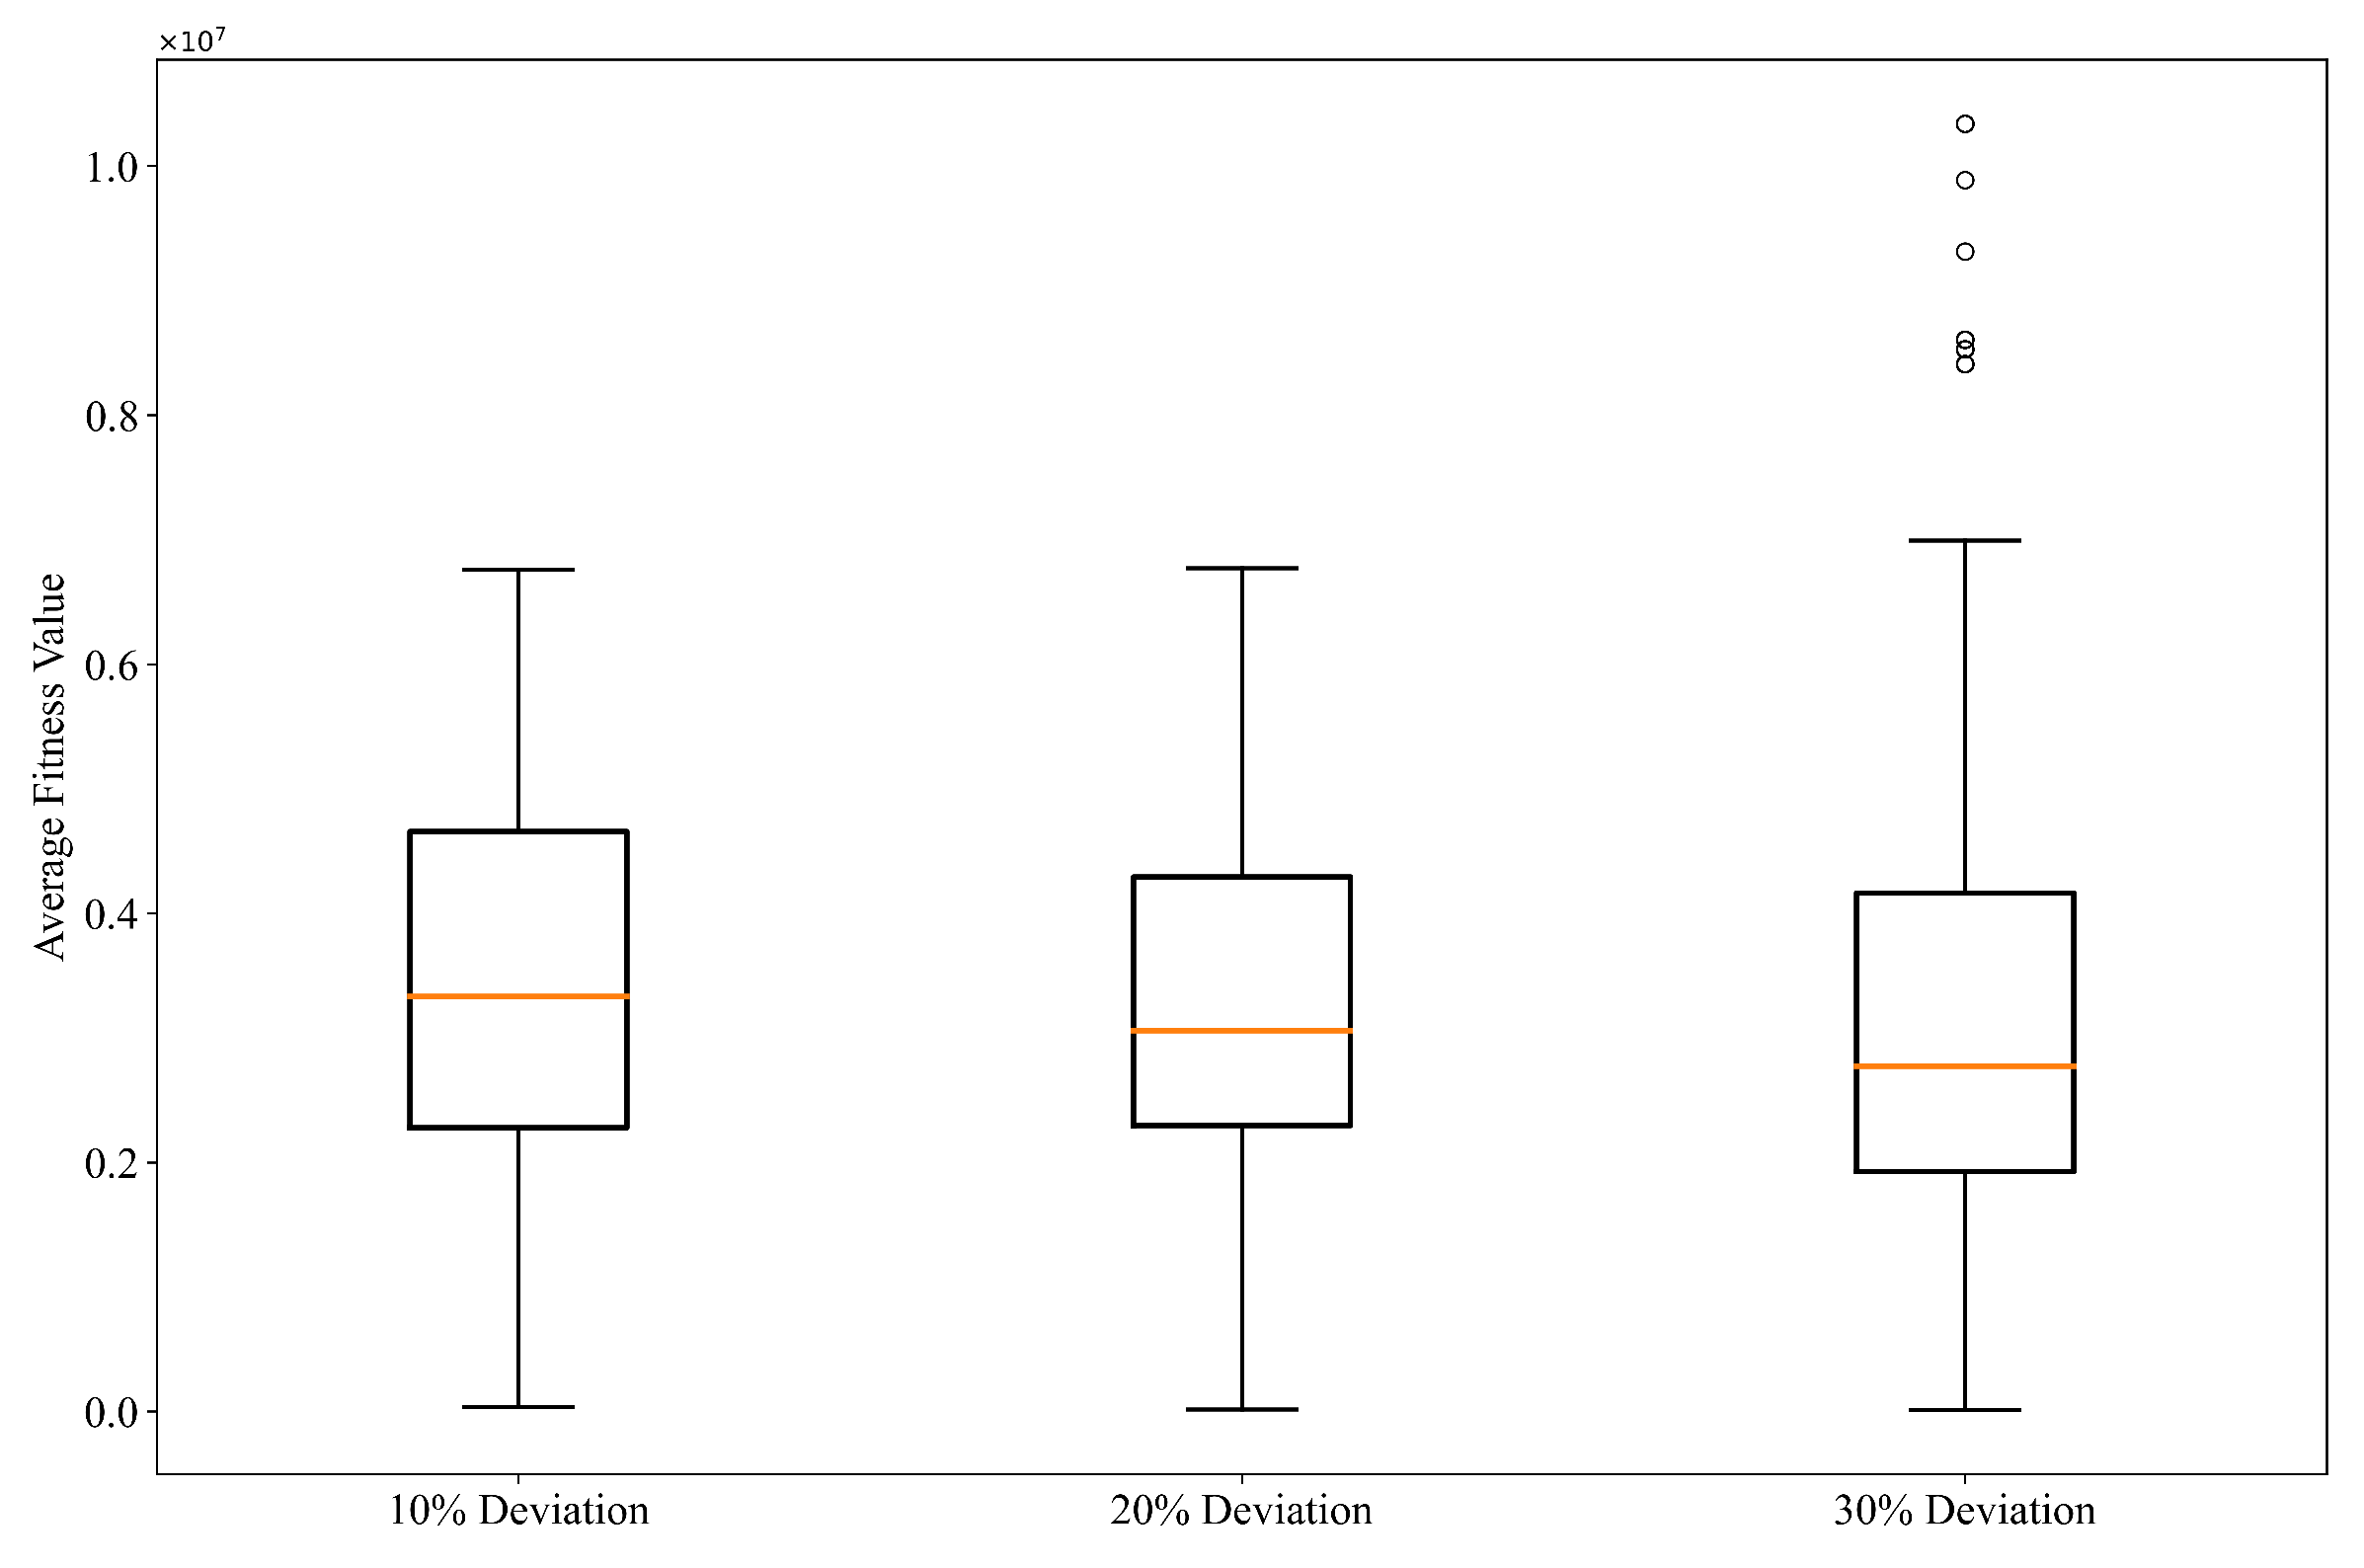
Robustness Verification to Initial Position Deviations: To assess the algorithm’s sensitivity to initial conditions, an experiment with 50 randomly generated initial configurations was conducted for each of three initial deviation levels: 10 % R , 20 % R , 30 % R . The distribution of final positional errors was statistically analyzed to comprehensively evaluate the algorithm’s stability and robustness.
5.
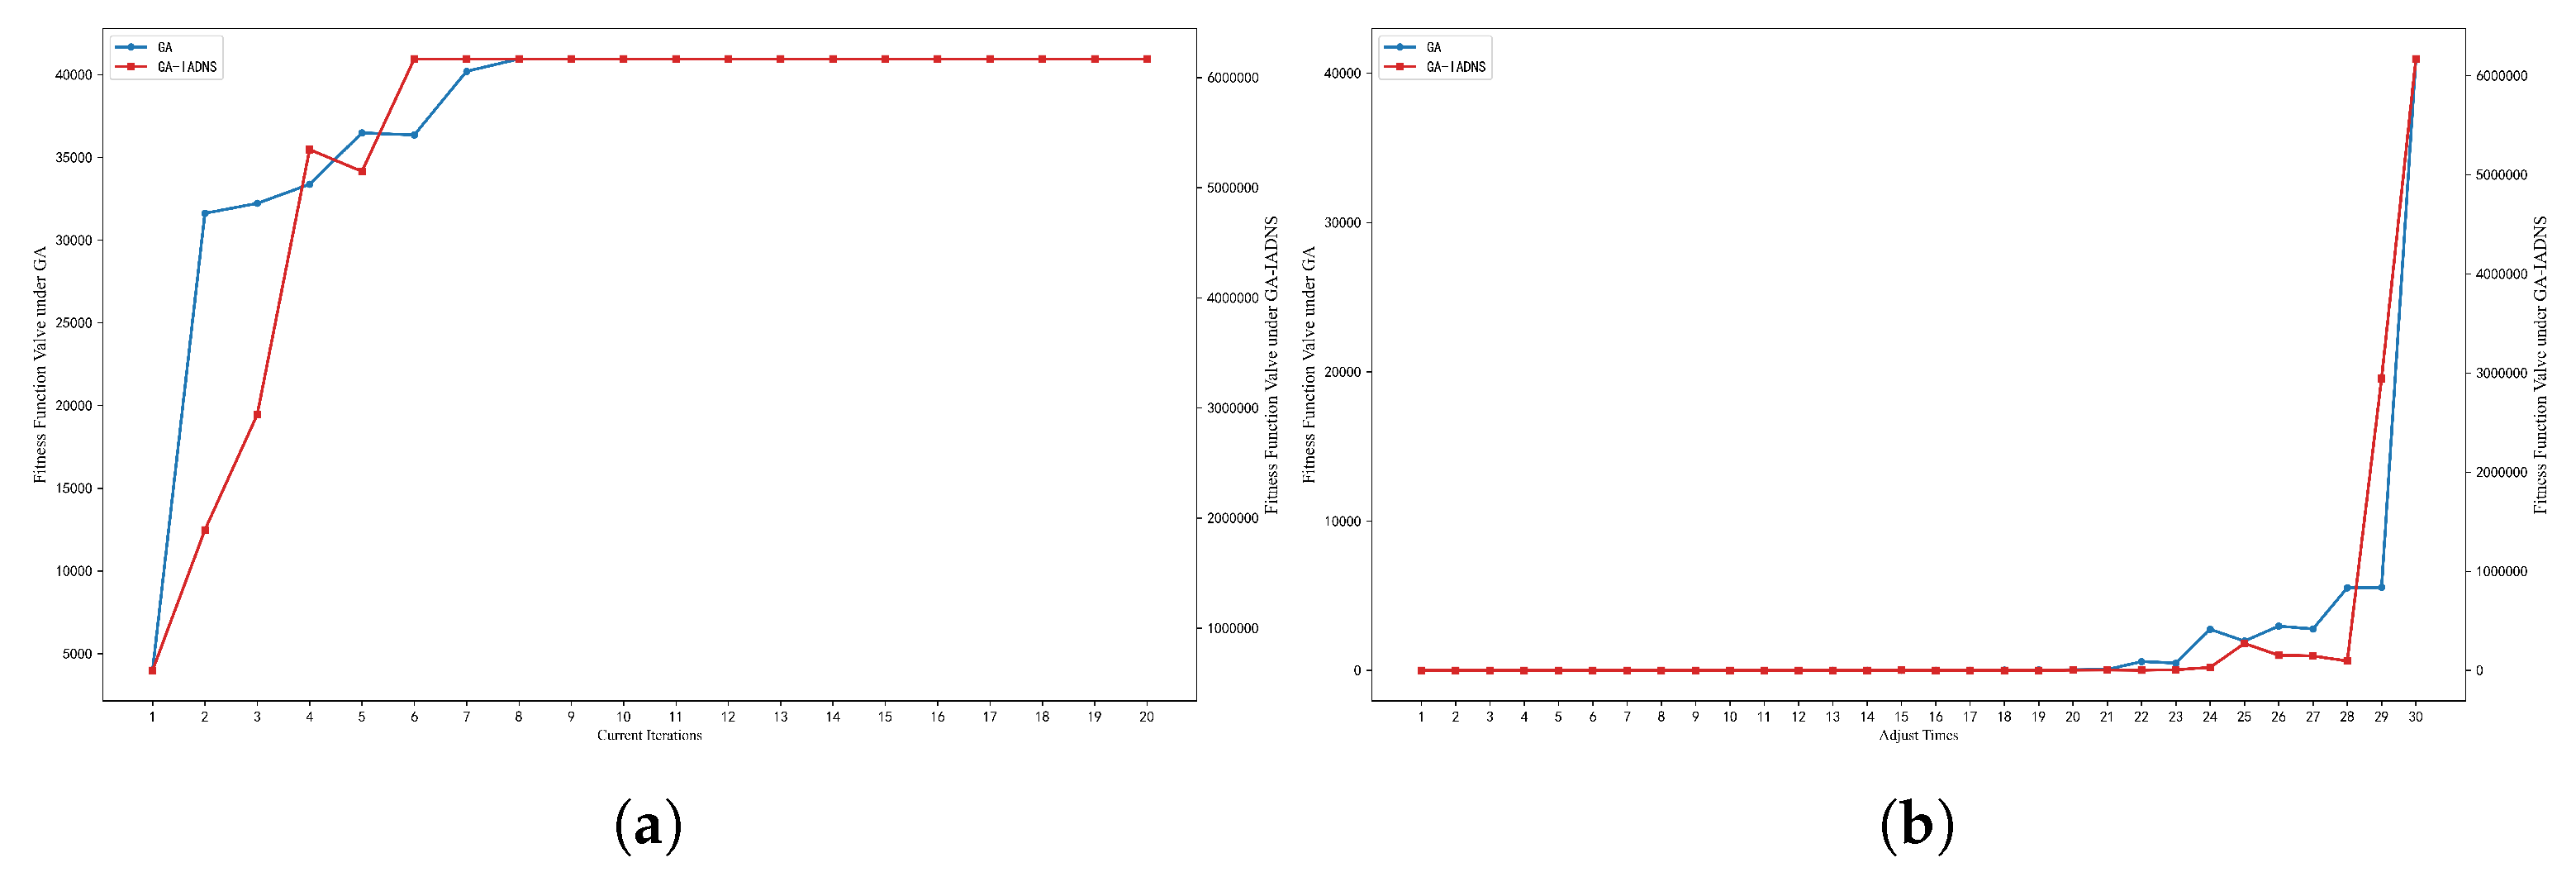
Performance Comparison with a Standard Genetic Algorithm: To further validate the superiority of the proposed GA-IADES, a comparative experiment with a standard Genetic Algorithm (GA) is conducted. The standard GA utilizes the same encoding and fitness function but lacks the integrated adaptive discrete neighborhood search mechanism. The comparison focuses on convergence speed, solution quality and stability across multiple runs, under the same initial conditions and computational budget.

6.2. Analysis of Adjusted UAV Coordinates

Initialize algorithm parameters: population size S = 20 , maximum iteration count G = 20 , mutation probability P v = 0.01 . To obtain the signal transmission and reception adjustment sequence T, the GA-IADES underwent iterative runs.
After algorithmic solution, the adjusted actual coordinates and desired coordinates for each UAV in both polar and Cartesian coordinate systems are presented in Table 11 and Table 12. Here, “Actual final position under GA-IADES” denotes the actual coordinates obtained after each UAV undergoes adjustment via the GA-IADES algorithm proposed in this paper, while “Desired Position” represents the target coordinates for each UAV. “Deviation” indicates the difference between the actual and desired coordinates. Bolded entries represent deviations between actual and desired coordinates, where upward arrows denote values where the actual coordinate exceeds the desired coordinate, and downward arrows denote values where the desired coordinate exceeds the actual coordinate. By comparing the actual and desired coordinates, it is evident that the deviation between the drone’s actual final position and its desired final position is negligible. This demonstrates the effectiveness of the proposed model and algorithm.

6.3. Process Analysis of UAV Position Adjustment

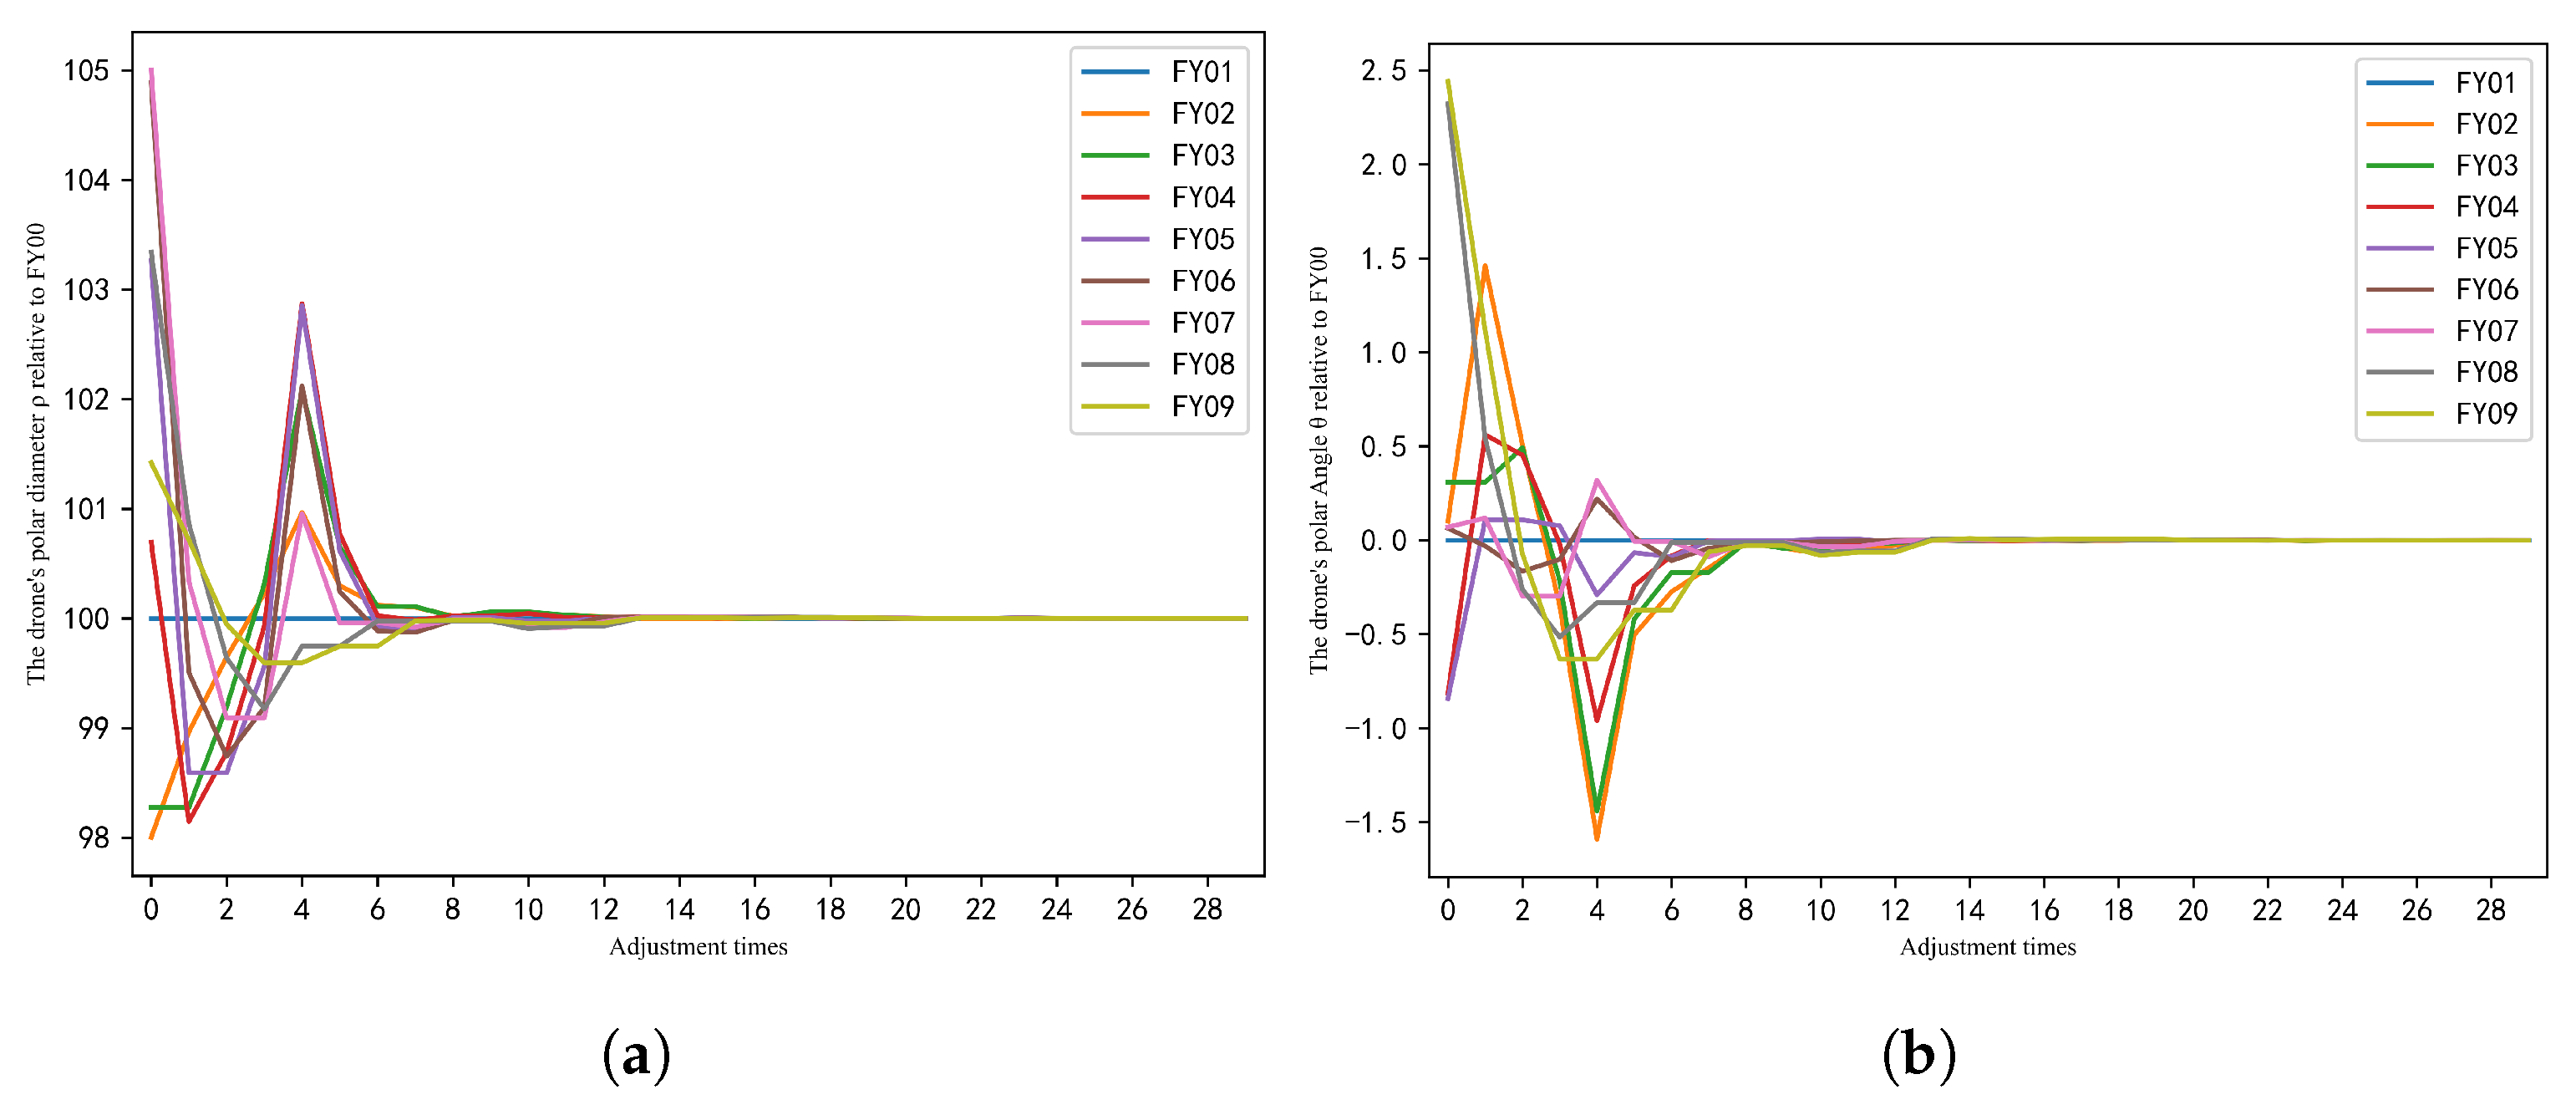
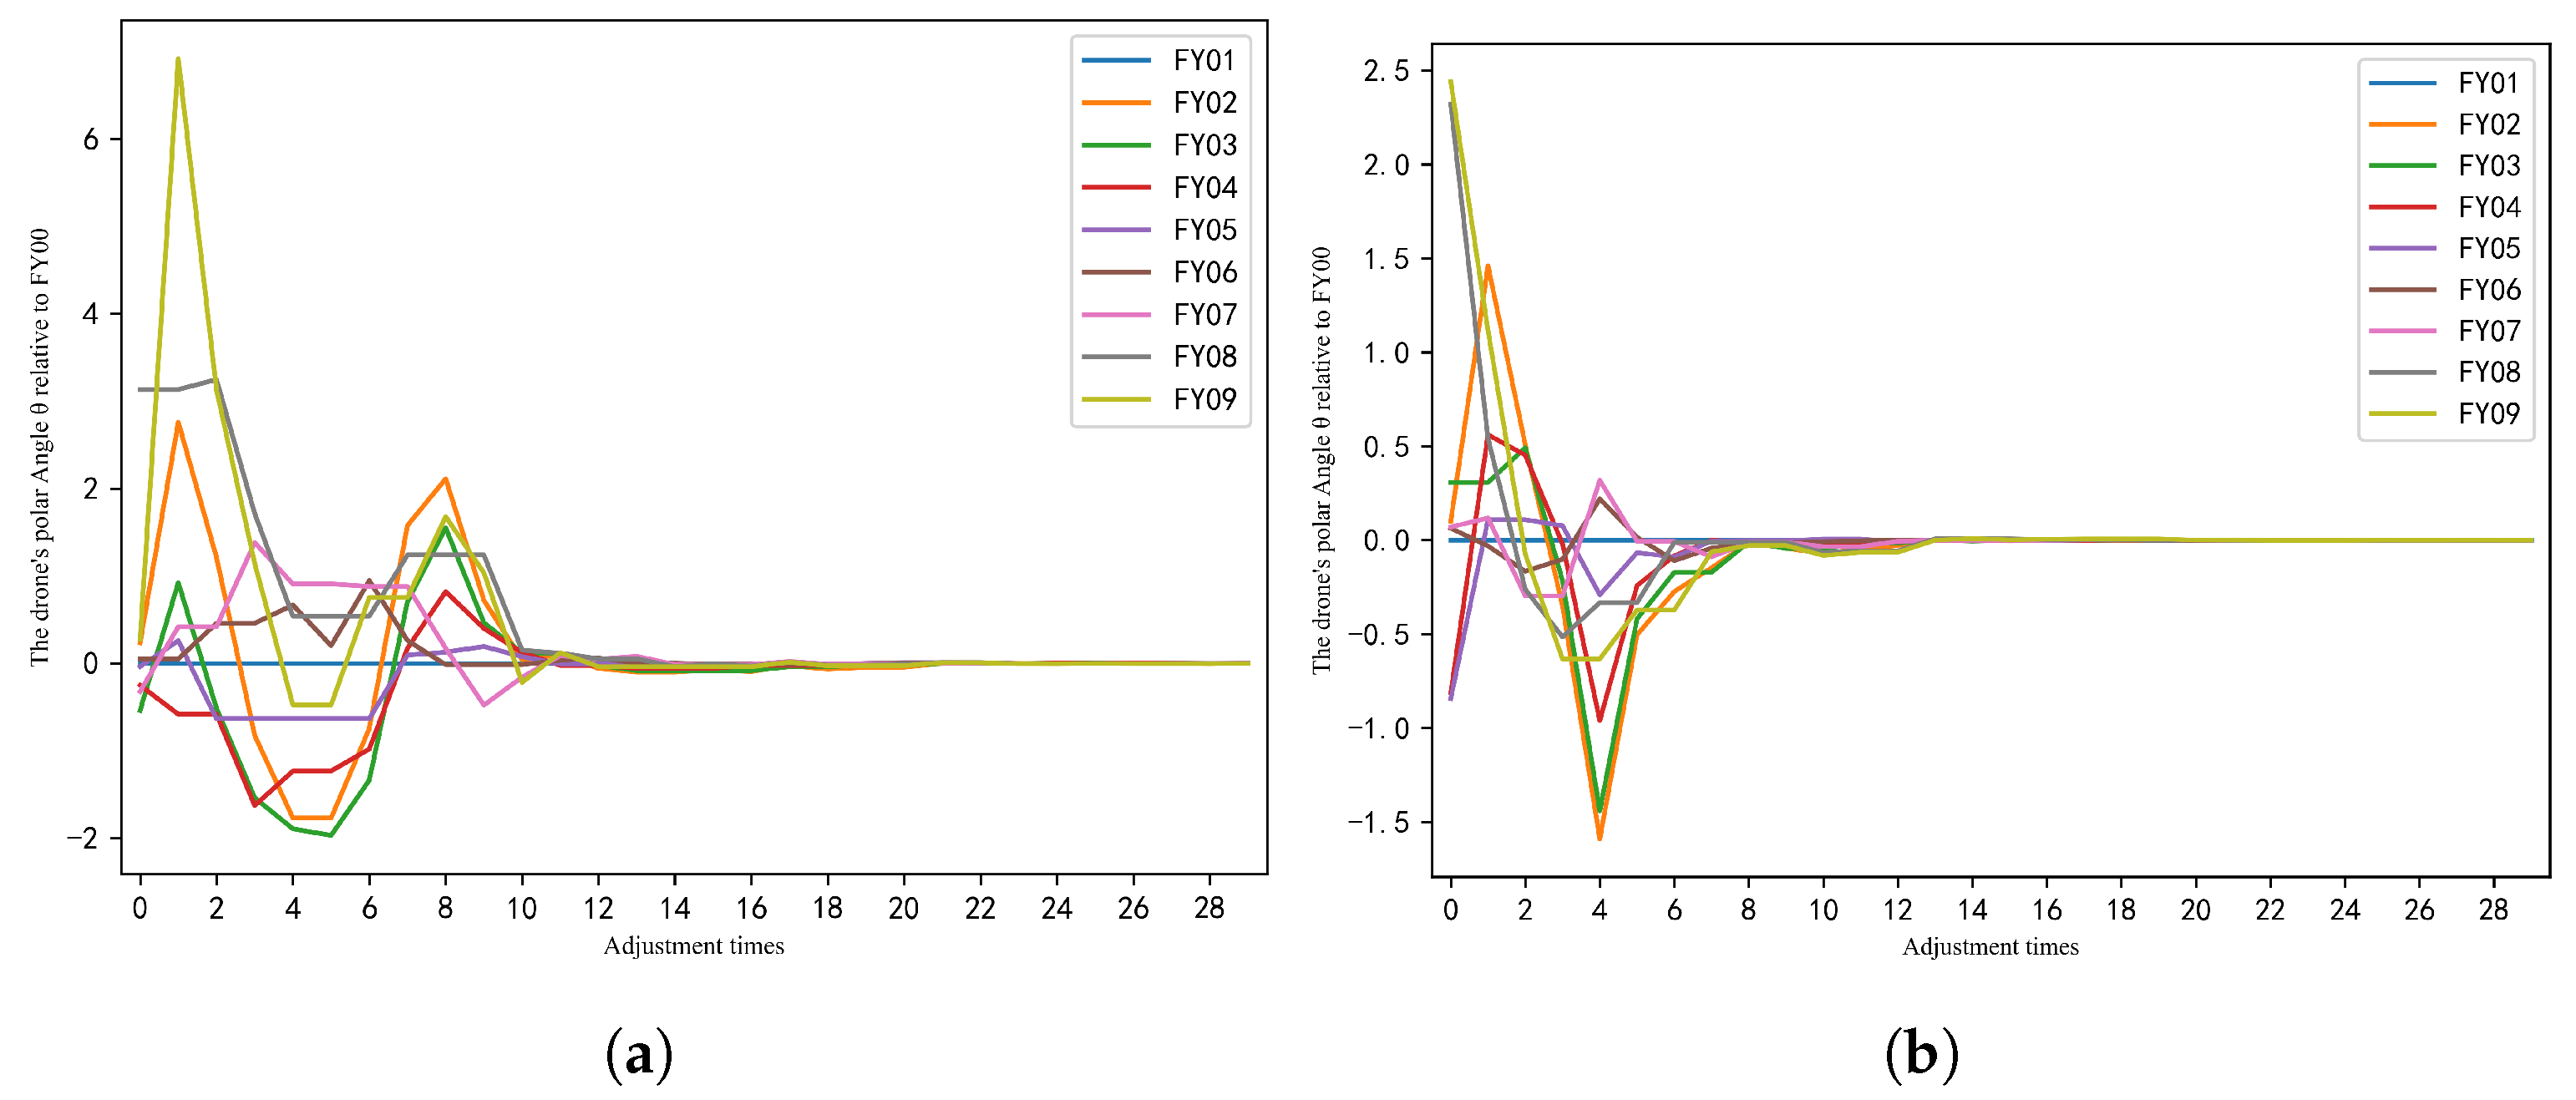
Illustrate the position adjustment process of each UAV under the optimal adjustment scheme. Under the optimal strategy, as the iteration count increases, the line charts showing the changes in polar radius ρ and polar angle θ relative to the central UAV F Y 00 are depicted in Figure 21a,b. This paper applies an offset processing technique to the polar angle data of each UAV, setting the target polar angle of all positional UAVs to 0. This aims to facilitate easier comparison and observation of polar angle changes during the adjustment processes of different UAVs in the diagrams.
It can be observed that as the number of adjustments increases, the polar radius and polar angle of each UAV fluctuate while gradually converging toward the desired values. Furthermore, as shown in Figure 21a,b, when the number of adjustments per scheme reaches approximately 20, the positions of all UAVs have stabilized at relatively consistent values. At this point, further adjustments are unnecessary.

6.4. Effectiveness Analysis of the UAV Adjustment Scheme

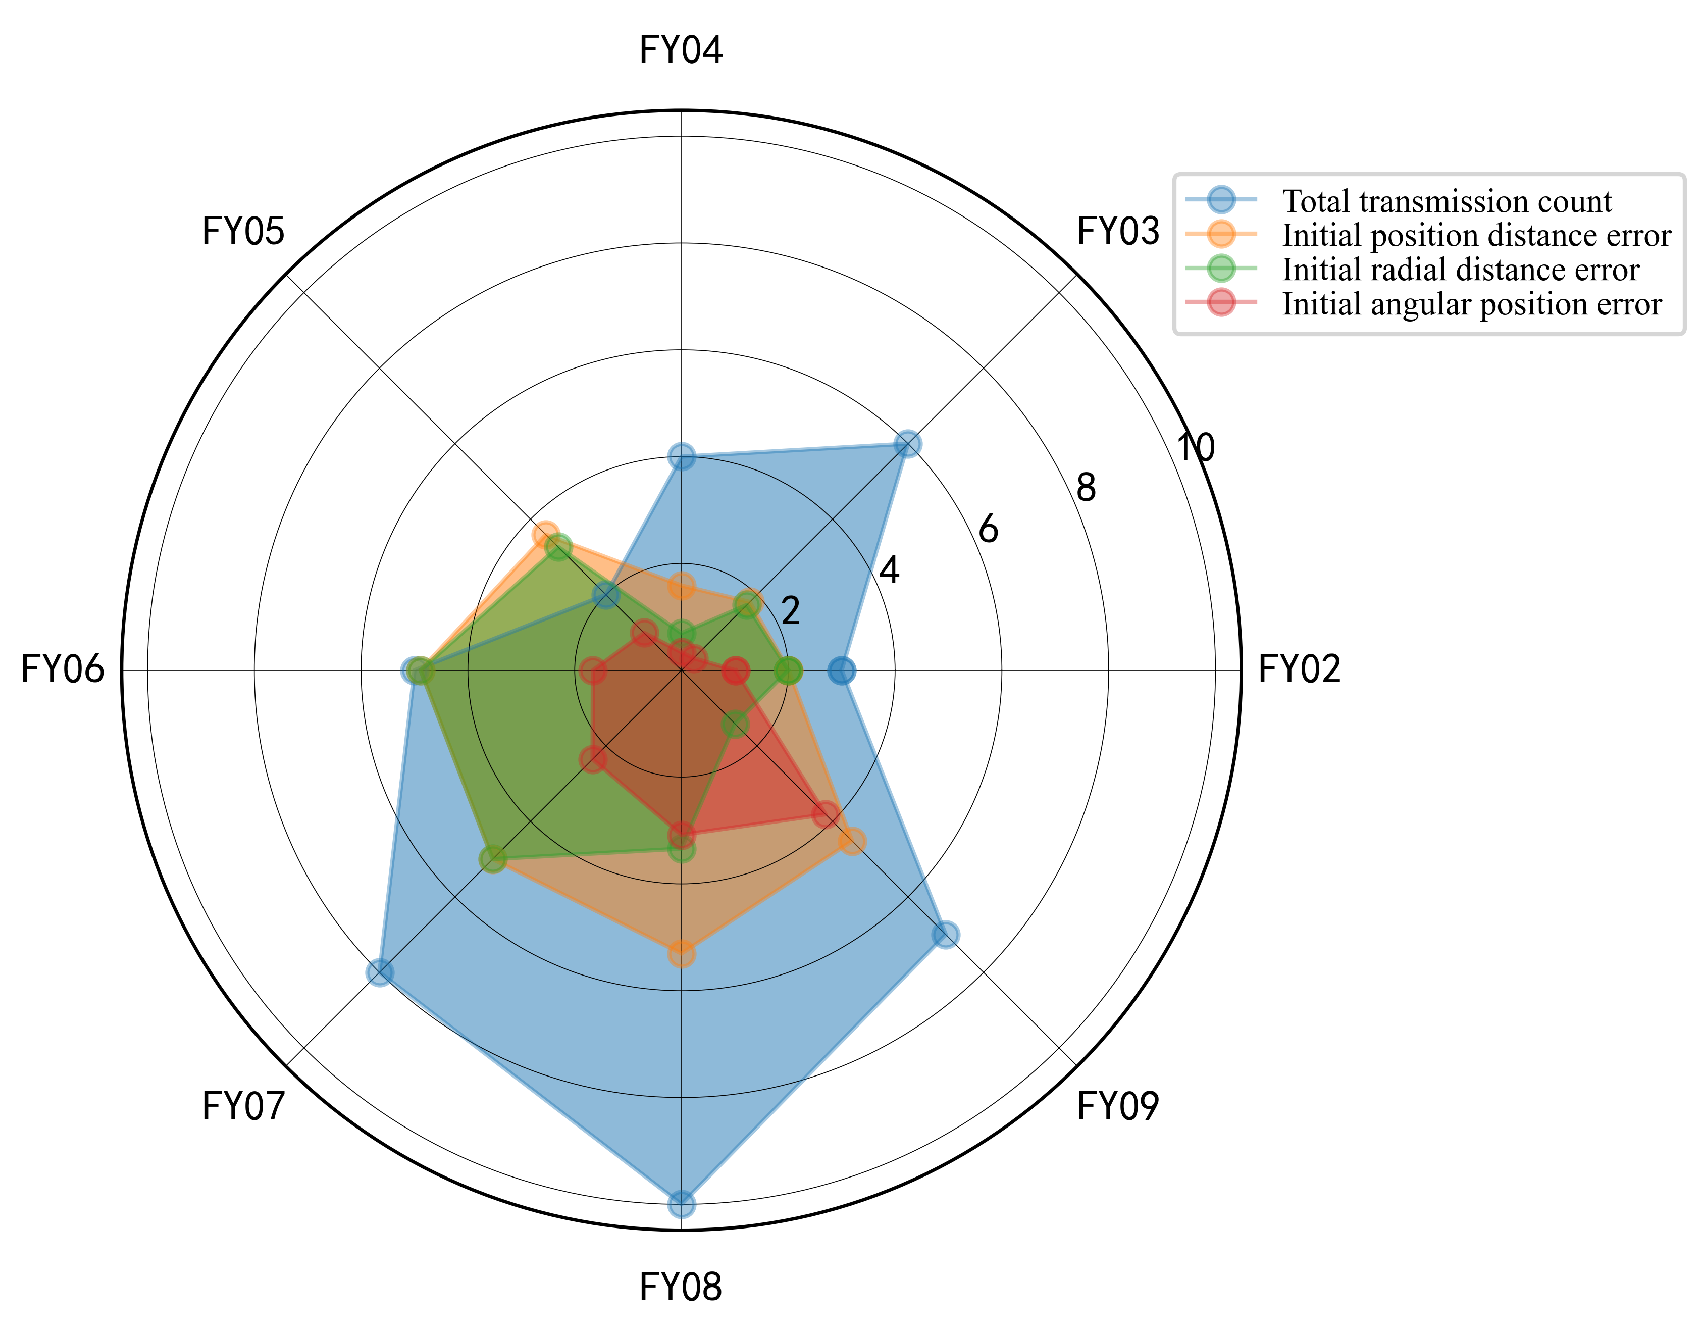
By examining the drone adjustment attribute radar chart (Figure 22) and the optimal adjustment plan (Figure 23), it can be observed that the initial position deviation of drones exhibits a flexible correlation with the number of signal transmission tasks they undertake. Some drones with larger initial position deviations ( F Y 08 , F Y 09 ) performed a certain number of signal transmission tasks, while drones with smaller initial deviations ( F Y 02 ) did not necessarily lead in the absolute number of signal transmissions. This adjustment mechanism enables drones with larger deviations to obtain more precise positional references through signal interactions during transmission, accelerating their own adjustments. Simultaneously, drones with smaller deviations participate moderately in transmission, ensuring the stability of the positioning reference while avoiding signal redundancy caused by continuous transmission from a single drone. This dynamically balanced task allocation fosters complementary adjustment and collaboration among drones, significantly enhancing the efficiency and stability of the entire formation’s position convergence. It also demonstrates the effectiveness of the proposed Perceive-Explore-Judge-Excute ( P E J E ) strategy.

6.5. Sensitivity Analysis of Algorithm Parameters

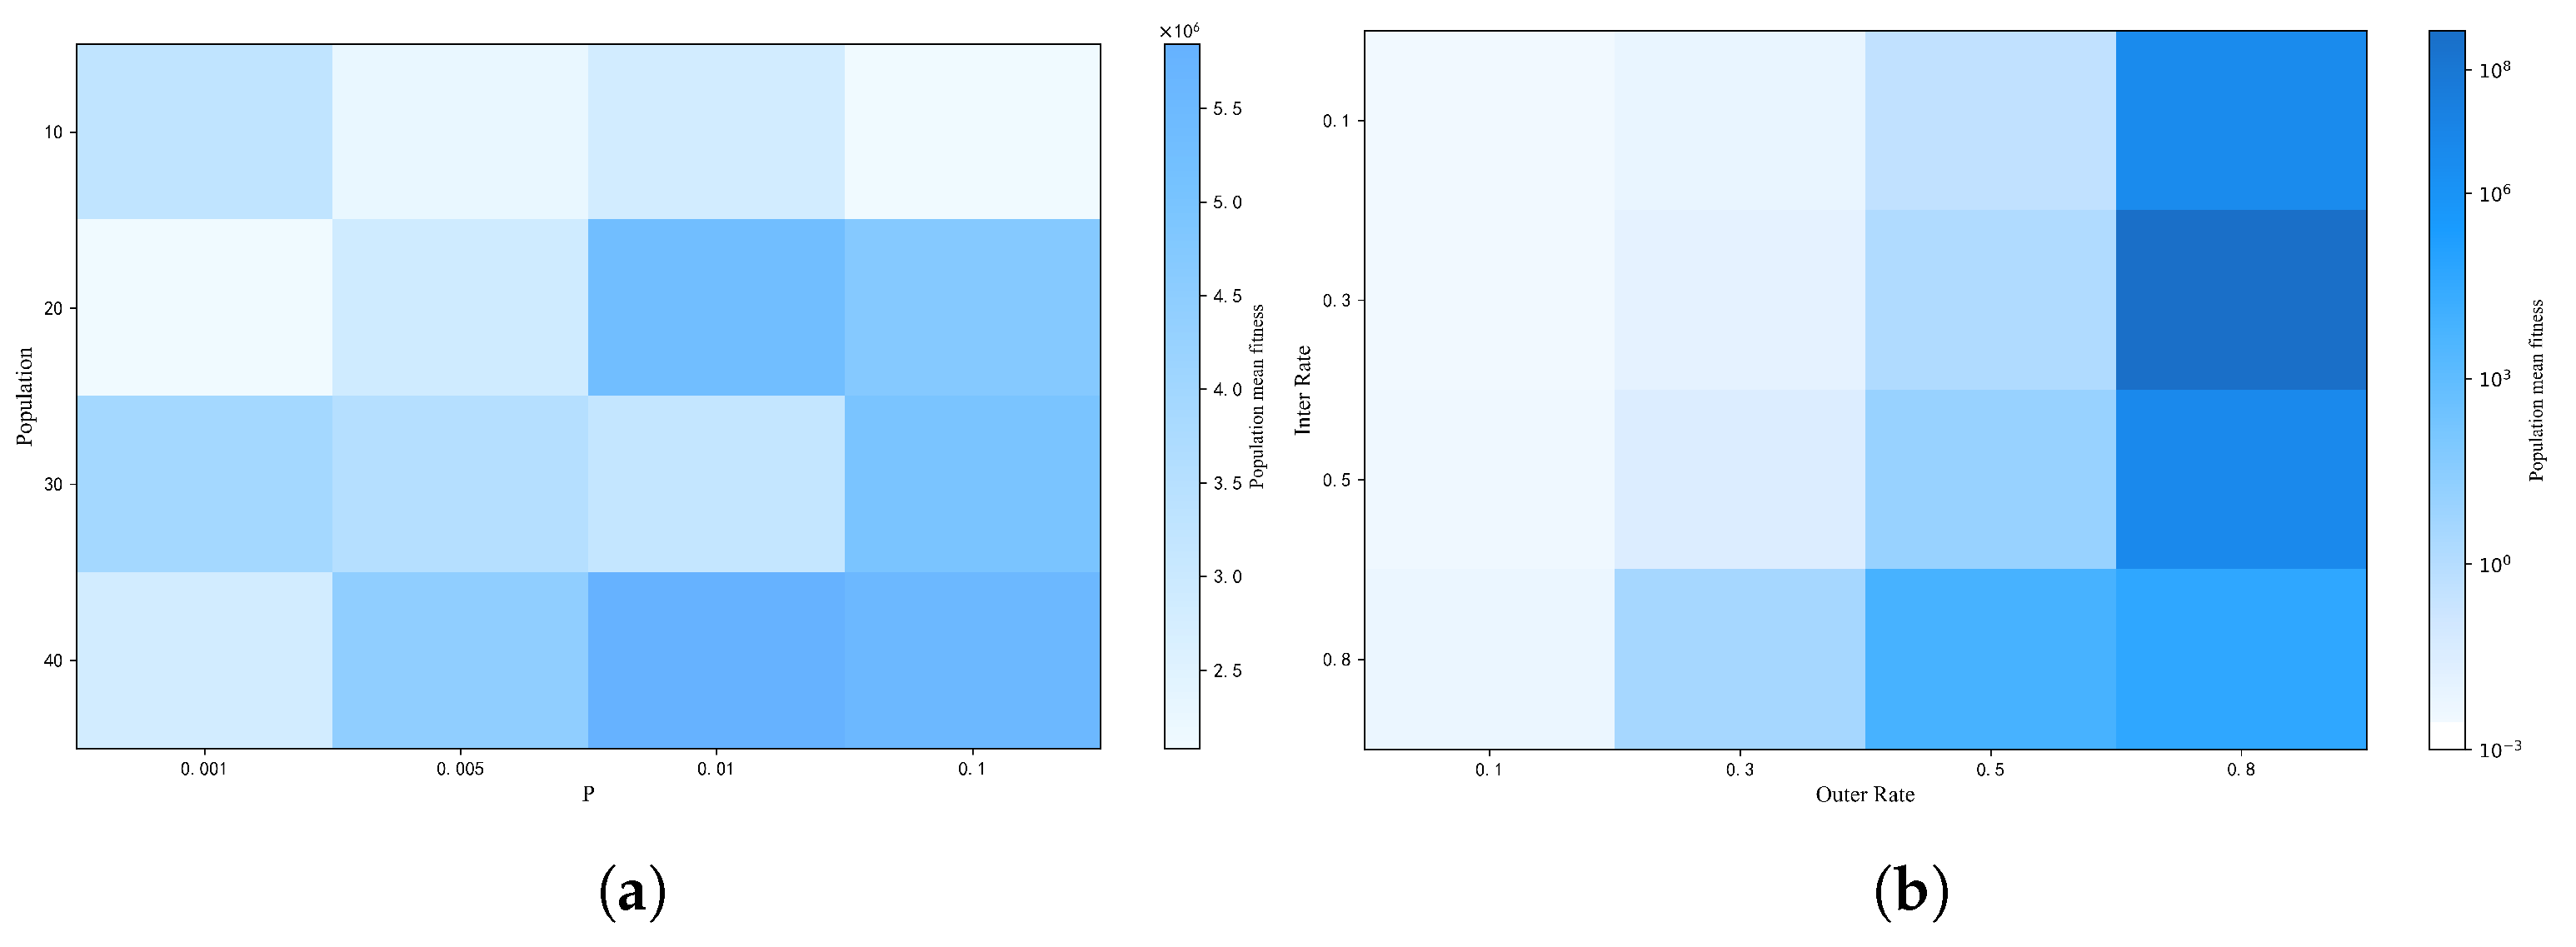
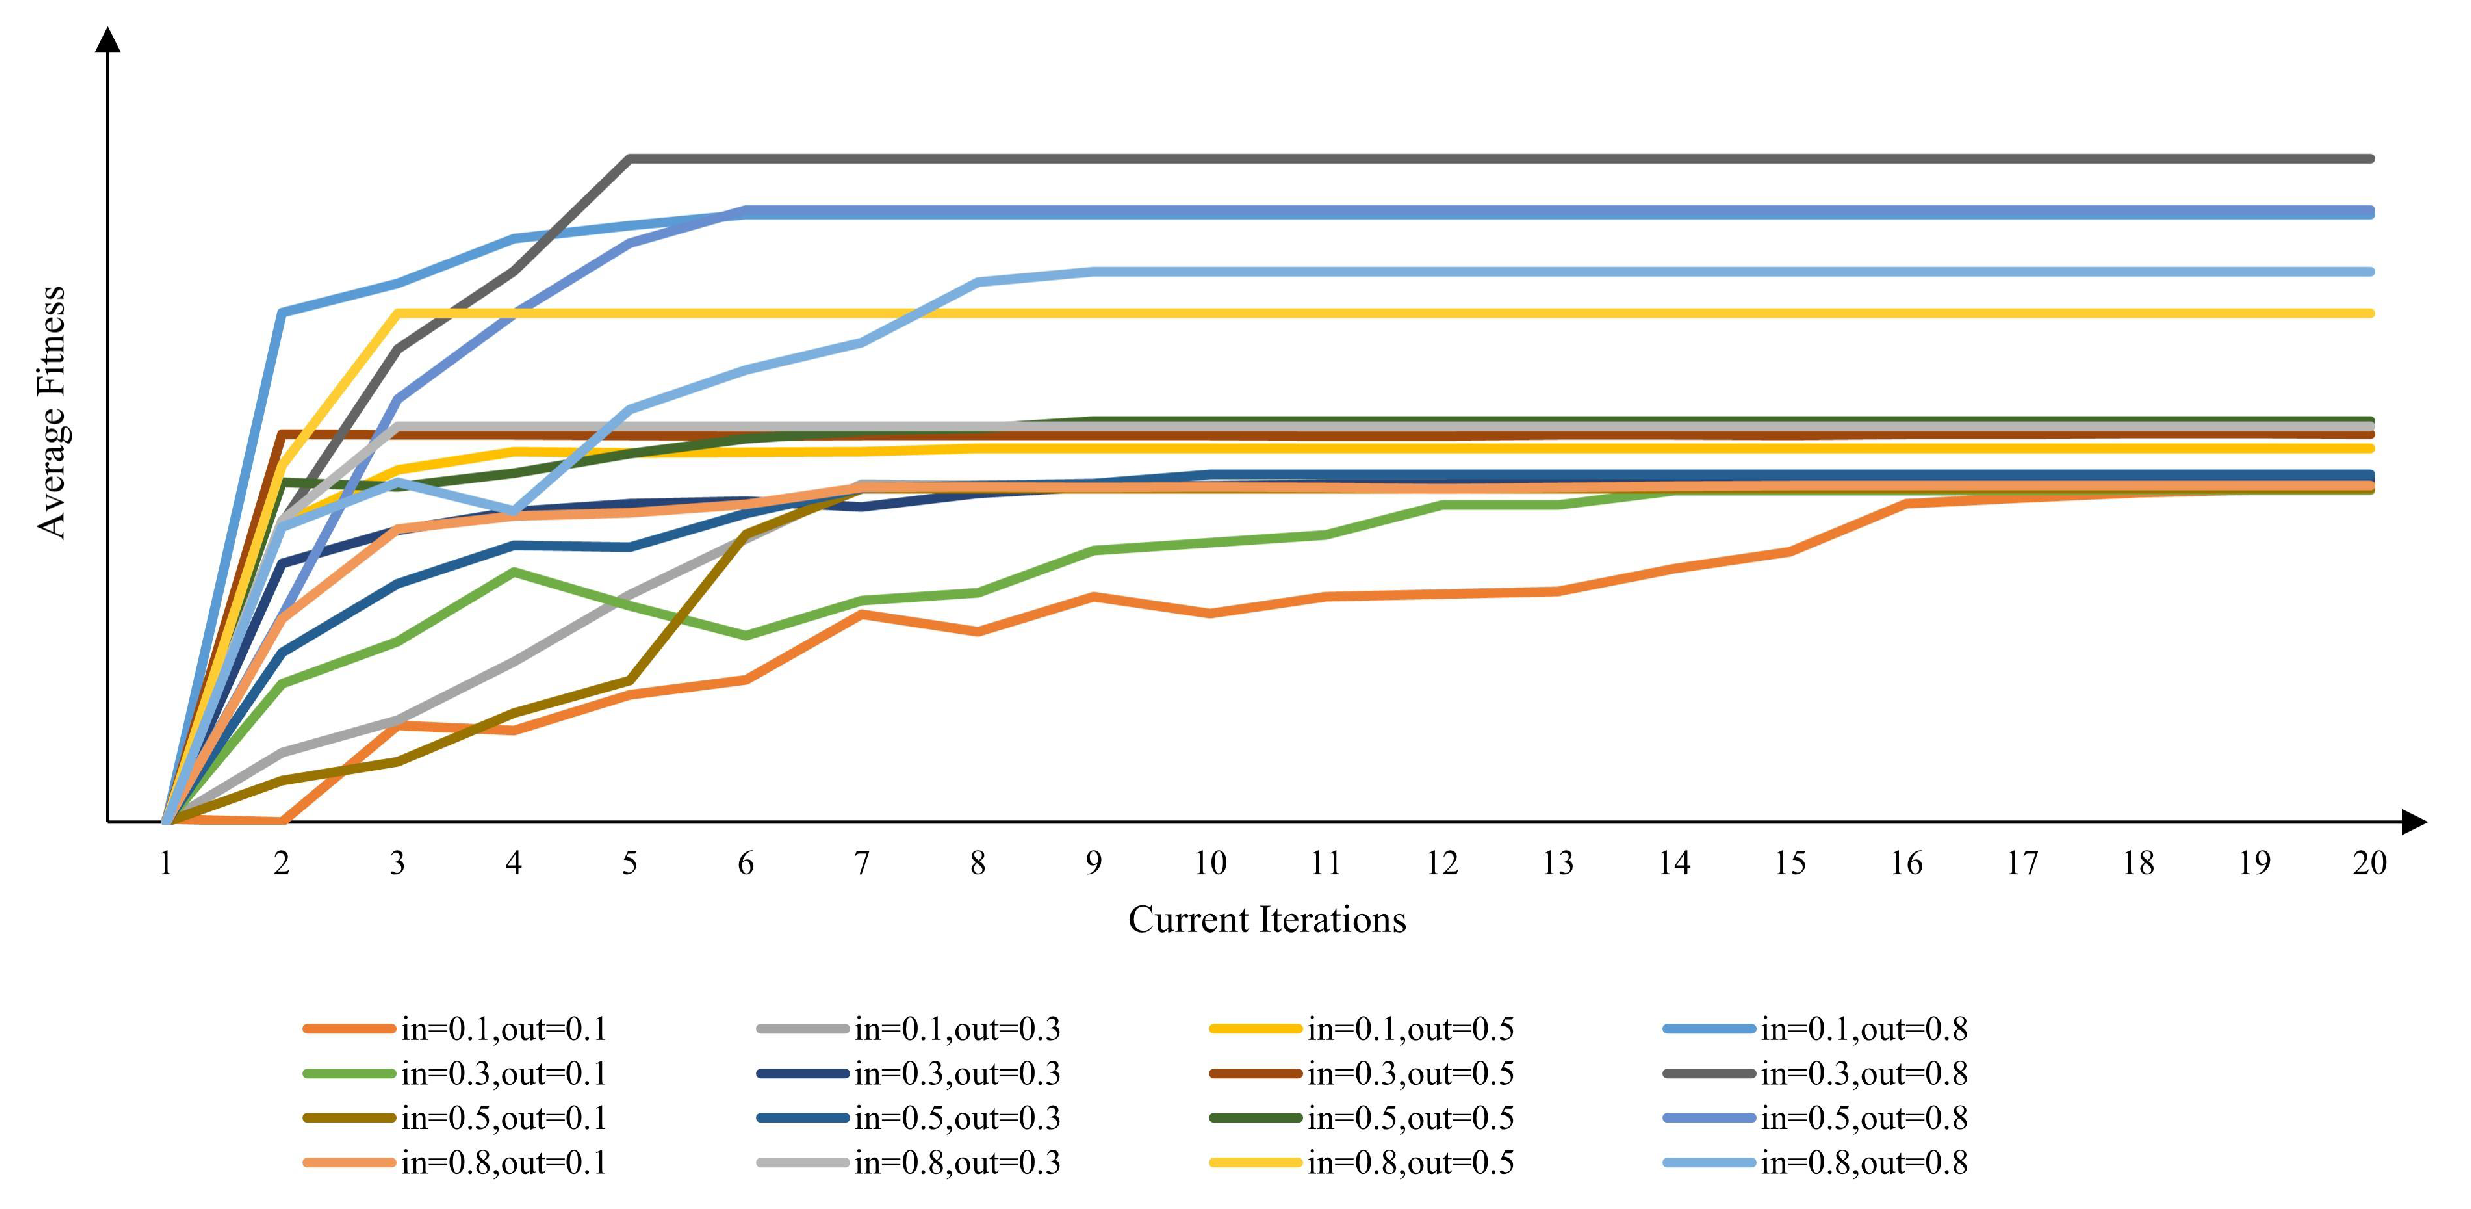
This paper first analyzes the population size S, mutation probability P 0 , step size reduction factor within a single adjustment step η i n t e r and step size reduction factor between consecutive adjustment steps η o u t e r within the algorithm. The results are shown in Figure 24a,b.
This study selected S = 10 , 20 , 30 , 40 and P v = 0.001 , 0.005 , 0.01 , 0.1 to first investigate the magnitude of the average fitness value during algorithm iterations under different combinations of population size and mutation probability parameters. The results are shown in Figure 24a. It can be observed that the parameter combinations yielding higher fitness are S = 40 , P v = 0.01 and S = 20 , P v = 0.01 . Simultaneously, it is observed that when P v = 0.001 , fitness values are generally low, with only the population size S = 30 showing relatively better performance. This can be attributed to the excessively low mutation probability leading to insufficient population diversity, causing the algorithm to easily get stuck in local optima. Conversely, when P v = 0.1 , fitness values increase with larger population sizes, yet remain overall lower than when P v = 0.01 . Thus, while high mutation rates enhance diversity, they may disrupt high-quality genes, leading to unstable convergence. At P v = 0.01 , fitness values peak significantly, especially at population sizes 20 and 40. This indicates that moderate mutation balances population diversity and convergence speed, enhancing global search capability. Similarly, for population size, small populations ( S = 10 ) exhibit the lowest overall fitness values and are sensitive to mutation probability, often resulting in limited search capabilities. Large populations ( S = 40 ) provide a richer gene pool, and when combined with moderate mutation rates, can steadily improve algorithm performance, but the algorithm’s runtime increases significantly. Medium populations ( S = 20 , 30 ) perform excellently at P v = 0.01 , but S = 30 shows a decline in performance at P v = 0.01 , while S = 20 ensures both algorithmic efficiency and result stability.
This study further investigates the average fitness variation of each generation during algorithm iteration under different combinations of population size and mutation probability parameters, as shown in Figure 25. It is similarly observed that when S = 20 , P v = 0.01 , the population exhibits higher fitness and faster convergence. However, it should be noted that while S = 40 , P v = 0.01 also yields high population fitness, its convergence rate is slower. The appropriate choice should be determined based on practical circumstances. The results further demonstrate that a moderate mutation rate combined with a medium population size strikes a crucial balance between algorithmic search capability and efficiency. This configuration enables the drone formation adjustment scheme to approach the optimal solution within fewer iterations. Consequently, this study selects S = 20 and P v = 0.01 as the algorithmic parameter.
This section investigates the average fitness values during algorithm iterations under different combinations of step size adjustment coefficients. Experiments were conducted with η i n t e r = 0.1 , 0.3 , 0.5 , 0.8 and η o u t e r = 0.1 , 0.3 , 0.5 , 0.8 , with results shown in Figure 24b. It can be observed that when both η i n t e r and η o u t e r are small (e.g., 0.1 , 0.3 ), fitness values are generally low, indicating that excessively slow step size adjustment leads to inefficient search and hinders convergence toward optimal solutions. When either η i n t e r or η o u t e r exceeds 0.5, the fitness values show significant divergence. Some combinations ( η i n t e r = 0.8 , η o u t e r = 0.5 ) exhibit high fitness values, while others ( η i n t e r = 0.8 , η o u t e r = 0.8 ) experience a decline. This indicates that excessively large step size parameters may cause search instability.
This paper further investigates the average fitness variation of each generation within the algorithm’s iterative process under different combinations of step size variation coefficients within single adjustments and between adjustments. As shown in Figure 26, moderate values of η i n t e r (e.g., 0.3 , 0.5 ) generally outperform extreme values (e.g., 0.1 , 0.8 ), as moderate values strike a balance between local search precision and global exploration capability. Larger η o u t e r values (e.g., 0.5 , 0.8 ) generally perform better, as higher inter-adjustment step size coefficients delay step size decay, ensuring sufficient exploration range across multiple iterations—a distinct advantage in complex solution spaces. This paper selects η i n t e r = 0.5 and η o u t e r = 0.8 as algorithm parameters. This combination ensures rapid expansion of the search range within a single iteration to avoid getting stuck in local minima, while maintaining moderate step decay across multiple iterations to balance exploration and convergence. Results demonstrate that the algorithm achieves higher fitness under this parameter configuration.

6.6. Robustness Verification of UAV Formation Adjustment to Initial Position Deviations

To compare the stability of the model and algorithm under different initial position offsets of the drones, this paper sets three groups of initial position deviation values at 10 % R , 20 % R , 30 % R , where R denotes the drone formation radius. For each deviation magnitude, 50 initial drone positions were randomly generated based on the assumption. The algorithm was then run for each set, and the following metrics were calculated:
  • Average fitness of the algorithm iteration process after all drones reached stable positions across different initial deviation magnitudes.
  • Box plots of the polar radial error, polar angular error, horizontal coordinate error, and vertical coordinate error between each drone and its target position.
The results are shown in Figure 27 and Figure 28.
According to Figure 27, the larger the initial deviation, the lower the overall average fitness value during the algorithm’s iteration process. The 10 % R deviation group exhibits the highest median fitness and the least fluctuation, while the 30 % R deviation group shows the most dispersed fitness distribution. This indicates that with smaller initial deviations, the algorithm converges faster and demonstrates greater stability. However, it is also noted that GA-IADES converges under all three initial deviation conditions. Yet, larger initial deviations require more iterations, as they cause cumulative measurement errors in signal angle measurements, increasing the difficulty of searching for the optimal adjustment sequence. The results demonstrate that GA-IADES effectively handles formation adjustment problems with varying initial deviations, exhibiting optimal performance at small deviations ( 10 % R ) with high adjustment accuracy and rapid convergence.
Figure 28(a), Figure 28(b), Figure 28(c), and Figure 28(d), respectively, show the statistical distributions of polar radius error, polar angle error, horizontal coordinate error, and vertical coordinate error between the final position and desired position of the UAV under different initial position deviations. As depicted in Figure 28, when the initial position deviation is 10 % R , 20 % R , 30 % R , the deviation between the final position and desired position in both polar and Cartesian coordinates becomes negligible. Additionally, the median lines in the final error box plots for polar and Cartesian coordinates are close under different initial position deviation magnitudes, indicating consistent deviation correction accuracy across coordinate systems. It can be concluded that increased initial deviation only slightly affects the initial adaptation and error dispersion but does not significantly impact the final convergence accuracy, demonstrating the algorithm’s capability to handle a wide range of initial position deviations.
In summary, the improved genetic algorithm demonstrates outstanding performance in adjusting the positions of UAV (UAV) formations. Regardless of the magnitude of initial deviations, it can stabilize the formation’s fitness through iterative optimization. Simultaneously, it effectively controls errors in both polar and rectangular coordinate systems, meeting the precision requirements for formation control.

6.7. Performance Comparison with the GA

This section compares the proposed GA-IADES with a GA. Firstly, the variation of the average fitness value per generation during the iterative process of both algorithms is compared, as shown in Figure 29a. Secondly, the variation of the fitness value for each single adjustment step within the complete adjustment scheme obtained by the optimal individual of each algorithm is compared, as shown in Figure 29b. Note that the left and right vertical axes in Figure 29a,b represent the population fitness values for the GA and GA-IADNS algorithms, respectively.
Based on the comparative results, it is found that GA-IADNS reaches the peak average population fitness around the 6th generation and remains stable thereafter throughout subsequent iterations. In contrast, the traditional GA shows only low-level growth until the 20th generation without a clear convergence inflection point. This difference indicates that GA-IADNS, by integrating the adaptive discrete neighborhood search mechanism, can rapidly guide the population towards high-fitness regions, effectively avoiding the issues of initial search blindness and low evolutionary efficiency inherent in the traditional GA. Furthermore, the average population fitness of the traditional GA exhibits significant fluctuations during the 20 generations of iteration, whereas GA-IADNS, after reaching its peak at the 6th generation, shows much smaller fluctuations in the average fitness during subsequent iterations. This suggests that GA-IADNS, through local refined search, filters for better individuals and avoids the fitness fluctuations caused by the disruption of high-quality genes due to random mutations in the traditional GA, ensuring the population continuously evolves towards the global optimum. Additionally, after the iterations conclude, the average population fitness of GA-IADNS is significantly higher than that of the traditional GA, demonstrating that GA-IADNS can not only cover a broader solution space but also perform detailed exploration within potential optimal regions, ultimately forming a high-quality population.
Finally, the coordinate changes of each UAV during the formation adjustment process under the two different algorithms are compared. Figure 30a,b show the variation of the polar radius ρ for each UAV under the optimal adjustment scheme obtained by the GA algorithm and the GA-IADNS algorithm, respectively. Figure 31a,b show the variation of the polar angle θ for each UAV under the optimal adjustment scheme obtained by the GA algorithm and the GA-IADNS algorithm, respectively.
The comparison reveals that under the optimal adjustment scheme of the GA algorithm, the polar radius and polar angle of the UAVs exhibit larger fluctuations and slower convergence. In contrast, under the adjustment of the optimal scheme found by the GA-IADNS algorithm, which utilizes adaptive neighborhood search, the changes in the polar radius and polar angle of the UAVs show no significant fluctuations and converge gradually, effectively avoiding repeated positional offsets of the UAVs.
In summary, compared to the traditional GA algorithm, GA-IADNS demonstrates core advantages of faster convergence, more stable control, and higher precision, making it more suitable for the requirements of precise formation reconstruction in electromagnetic silence environments. This further validates the effectiveness of the proposed GA-IADNS algorithm.

7. Conclusions

This study has systematically addressed the problem of UAV formation adjustment using bearing-only passive localization under electromagnetic silence conditions. Three core challenges identified in the introduction are resolved through dedicated modeling and algorithmic strategies:
1.
For localization with three known emitters, a geometric trilateration model was established. By leveraging the fixed positions of the emitters and the measured bearing angles, the model provides a closed-form solution for the receiver’s coordinates in polar form, effectively eliminating positional ambiguity and guaranteeing uniqueness.
2.
For emitter identification with partially unknown sources, a hierarchical identification mechanism, underpinned by a precomputed angle database, was developed. This strategy successfully resolves the inherent ambiguity in critical angle regions by intelligently incorporating measurements from additional emitters, ensuring reliable recognition of emitter labels and subsequent accurate localization.
3.
For cooperative formation adjustment with variable emitters, a novel cyclic cooperative strategy, the Perceive-Explore-Judge-Execute ( P E J E ) loop, was proposed. This framework enables dynamic role-switching among UAVs between signal transmission and reception. Its core is optimized by GA-IADES, which efficiently searches for the optimal sequence of role transitions, ensuring rapid convergence and high precision for the entire formation.
The core features of the proposed methods are threefold. First, the models exhibit strong scenario-specific applicability, with dedicated localization and coordination mechanisms tailored to different information conditions (e.g., known/unknown emitters, fixed/variable sources), ensuring uniqueness and reliability across contexts. Second, the proposed P E J E strategy demonstrates closed-loop collaboration, enabling dynamic role-switching between emission and reception through its Perceive–Explore–Judge–Execute cycle, significantly enhancing convergence efficiency and formation-wide stability. Finally, the GA-IADES algorithm hybridizes global exploration with local refinement, employing genetic algorithms for broad search in sequence space and adaptive discrete neighborhood search for precise adjustment, thereby efficiently approximating the global optimal scheduling strategy in complex solution spaces.
Extensive simulation results demonstrate that the proposed models and algorithms exhibit robust performance, rapid convergence, and high adjustment accuracy across various initial deviations, with the final positional errors being negligible.
Notwithstanding these contributions, this work has several limitations. First, the computational complexity of the algorithm may hinder its real-time application in very large-scale swarms. Second, the models operate under idealized assumptions, such as perfect angle measurements and an obstacle-free environment, not accounting for practical noise, occlusions, or multi-path effects. Lastly, the current research is confined to 2D space and static scenarios.
Future work will focus on: (1) enhancing algorithmic efficiency for real-time performance in larger swarms; (2) incorporating robustness mechanisms to handle measurement uncertainties and communication delays; (3) extending the framework to 3D formation control and dynamic environments with obstacles; (4) exploring integration with reinforcement learning for more intelligent signaling strategies; and (5) validating the approaches on physical hardware platforms to bridge the gap between simulation and practical deployment.In summary, this research provides a comprehensive and effective theoretical framework and technical pathway for passive, bearing-only UAV formation control in electromagnetically silent conditions, with significant potential for both theoretical and practical advancements in the field.

Author Contributions

Conceptualization, S.L. and H.L.; methodology, S.L., C.Z. and H.L.; software, S.L.; validation, S.L. and H.L.; formal analysis, S.L. and Y.R.; investigation, S.L., H.L. and Y.R.; resources, S.L., H.L. and Q.F.; writing—original draft preparation, S.L., H.L., Y.R. and C.Z.; writing—review and editing, S.L., H.L., Y.R. and Q.F.; supervision, Y.R. and H.L.; funding acquisition, H.L. and Y.R. All authors have read and agreed to the published version of the manuscript.

Funding

This research was funded by the Hunan Provincial Natural Science Foundation of China grant number 2022JJ10069.

Data Availability Statement

The original contributions presented in the study are included in the article, further inquiries can be directed to the corresponding author.

Conflicts of Interest

The authors declare no conflicts of interest.

References

  1. Zhang, Q.; Sun, K.; Zhang, Q. An Investigation of Purely Azimuthal Passive Localization and Position Adjustment in Attempted UAV Formation Flights. J. Appl. Math. Phys. 2023, 11, 3075–3098. [Google Scholar] [CrossRef]
  2. Gao, Y.; Feng, H.; Chen, J.; Li, J.; Wei, Z. A scalable distributed control algorithm for bearing-only passive UAV formation maintenance. Sensors 2023, 23, 3849. [Google Scholar] [CrossRef] [PubMed]
  3. Zhou, Y.; Song, D.; Ding, B.; Rao, B.; Su, M.; Wang, W. Ant colony pheromone mechanism-based passive localization using UAV swarm. Remote Sens. 2022, 14, 2944. [Google Scholar] [CrossRef]
  4. Kang, Z.; Deng, Y.; Yan, H.; Yang, L.; Zeng, S.; Li, B. A New Method of UAV Swarm Formation Flight Based on AOA Azimuth-Only Passive Positioning. Drones 2024, 8, 243. [Google Scholar] [CrossRef]
  5. Kang, X.; Shao, Y.; Bai, G.; Sun, H.; Zhang, T.; Wang, D. Dual-UAV Collaborative High-Precision Passive Localization Method Based on Optoelectronic Platform. Drones 2023, 7, 646. [Google Scholar] [CrossRef]
  6. Farina, A. Target tracking with bearings–only measurements. Signal Process. 1999, 78, 61–78. [Google Scholar] [CrossRef]
  7. Koteswara Rao, S.; Linga Murthy, K.S.; Raja Rajeswari, K. Data fusion for underwater target tracking. IET Radar Sonar Navig. 2010, 4, 576–585. [Google Scholar] [CrossRef]
  8. Brandao, A.S.; Barbosa, J.P.; Mendoza, V.; Sarcinelli-Filho, M.; Carelli, R. A multi-layer control scheme for a centralized uav formation. In Proceedings of the 2014 International Conference on Unmanned Aircraft Systems, Orlando, FL, USA, 27–30 May 2014. [Google Scholar]
  9. Tao, C.; Zhang, R.; Song, Z.; Wang, B.; Jin, Y. Multi-UAV formation control in complex conditions based on improved consistency algorithm. Drones 2023, 7, 185. [Google Scholar] [CrossRef]
  10. Han, Q.; Zhang, A.; Wang, X.; Cao, R.; Chen, G. Leader-following consensus of multi-agent system with multiple leaders under formation control. In Proceedings of the 2020 IEEE 3rd International Conference of Safe Production and Informatization, Chongqing, China, 28–30 November 2020. [Google Scholar]
  11. Challa, V.R.; Ratnoo, A. Analysis of uav kinematic constraints for rigid formation flying. In Proceedings of the AIAA Guidance, Navigation, and Control Conference, San Diego, CA, USA, 4–8 January 2016. [Google Scholar]
  12. Trejo, J.A.V.; Medina, M.A.; Trejo, J.A.V.; Beltrán, C.D.G.; Morales, J.G. Robust observer-based leader-following consensus for multi-agent systems. IEEE Lat. Am. Trans. 2021, 19, 1949–1958. [Google Scholar] [CrossRef]
  13. Lawton, J.R.; Beard, R.W.; Young, B.J. A decentralized approach to formation maneuvers. IEEE Trans. Robot. Autom. 2004, 19, 933–941. [Google Scholar] [CrossRef]
  14. Yoshioka, C.; Namerikawa, T. Formation control of nonholonomic multi-vehicle systems based on virtual structure. IFAC Proc. Vol. 2008, 41, 5149–5154. [Google Scholar] [CrossRef]
  15. Olfati-Saber, R.; Murray, R.M. Distributed cooperative control of multiple vehicle formations using structural potential functions. IFAC Proc. Vol. 2002, 35, 495–500. [Google Scholar] [CrossRef]
  16. Ma, K.; Zhao, H.; Wang, J. A Multi-UAV Network Formation Scheme via Integrated Localization and Motion Planning. IEEE Trans. Netw. Sci. Eng. 2025, 12, 1552–1566. [Google Scholar] [CrossRef]
  17. Qian, C. Research on pure azimuth passive positioning of UAV formation in electromagnetic silence environment. Meas. Control 2025, 58, 656–665. [Google Scholar] [CrossRef]
  18. Huang, J.; Zhang, L.; Wang, W. Passive Positioning and Adjustment Strategy for UAV Swarm Considering Formation Electromagnetic Compatibility. Drones 2025, 9, 426. [Google Scholar] [CrossRef]
  19. Liu, L.; Ru, L.; Zhang, Z. Research on purely azimuthal passive localization method in UAV formation flight. J. Phys. Conf. Ser. 2025, 3073, 012027. [Google Scholar] [CrossRef]
  20. Fu, Y.; Jiang, T.; Feng, D. Research on pure azimuth passive localization in UAV formation flight. Acad. J. Eng. Technol. Sci. 2024, 7, 151–157. [Google Scholar] [CrossRef]
  21. Yu, H.; Wang, X.; Zheng, Z. Formation maintenance strategy for USV fleets based on passive localization under communication constraints. Ocean. Eng. 2025, 3, 122306. [Google Scholar] [CrossRef]
  22. Liu, W.; Lyu, S.K.; Liu, T.; Wu, Y.T.; Qin, Z. Multi-target optimization strategy for UAV formation in forest fire monitoring based on deep Q-network algorithm. Drones 2024, 8, 201. [Google Scholar] [CrossRef]
  23. Zhu, Z.; Wang, H. Pure Azimuth Passive Positioning Model of UAV Based On Dynamic Programming. Procedia Comput. Sci. 2024, 243, 873–881. [Google Scholar] [CrossRef]
  24. Li, Y.; Qi, G.; Sheng, A. Optimal deployment of vehicles with circular formation for bearings-only multi-target localization. Automatica 2019, 105, 347–355. [Google Scholar] [CrossRef]
  25. Wang, W.; Chen, X.; Ia, J.; Fu, Z. Target localization and encirclement control for multi-UAVs with limited information. IET Control Theory Appl. 2022, 16, 1396–1404. [Google Scholar] [CrossRef]
  26. Lin, Q.; Miao, Z.; Chen, Y.; Wang, X.; He, W.; Wang, Y. Bearing-only formation maneuvering for UAV swarm over directed interaction topologies. IEEE Trans. Intell. Veh. 2024, 10, 2653–2664. [Google Scholar] [CrossRef]
  27. Yu, T. A Two-Station Passive Locating Solution Independent of the Baseline Length. Open J. Appl. Sci. 2020, 10, 476–485. [Google Scholar] [CrossRef]
  28. Qu, Y.; Wu, J.; Xiao, B.; Yuan, D. A fault-tolerant cooperative positioning approach for multiple UAVs. IEEE Access 2017, 5, 15630–15640. [Google Scholar] [CrossRef]
  29. Ma, W.; Fang, Y.; Fu, W.; Liu, S.; Guo, E. Cooperative localisation of UAV swarm based on adaptive SA-PSO algorithm. Aeronaut. J. 2023, 127, 57–75. [Google Scholar] [CrossRef]
  30. Bishop, A.N. Distributed bearing-only quadrilateral formation control. IFAC Proc. Vol. 2002, 44, 4507–4512. [Google Scholar] [CrossRef]
  31. Moshtagh, N.; Michael, N.; Jadbabaie, A.; Daniilidis, K. Bearing-only control laws for balanced circular formations of ground robots. In Proceedings of the Robotics: Science and Systems IV, Zurich, Switzerland, 25–28 June 2008. [Google Scholar]
  32. Bishop, A.N. A very relaxed control law for bearing-only triangular formation control. IFAC Proc. Vol. 2011, 44, 5991–5998. [Google Scholar] [CrossRef]
  33. Jing, G.; Caixia, Z.; Meijin, L. Angle-based cooperation control of triangle formation. In Proceedings of the 2015 34th Chinese Control Conference, Hangzhou, China, 28–30 July 2015. [Google Scholar]
  34. Eren, T. Formation shape control based on bearing rigidity. Int. J. Control 2012, 85, 1361–1379. [Google Scholar] [CrossRef]
  35. Trinh, M.H.; Oh, K.K.; Jeong, K.; Ahn, H.S. Bearing-only control of leader first follower formations. IFAC-Pap. 2016, 49, 7–12. [Google Scholar]
  36. Van Tran, Q.; Trinh, M.H.; Zelazo, D.; Mukherjee, D.; Ahn, H.S. Finite-time bearing-only formation control via distributed global orientation estimation. IEEE Trans. Control Netw. Syst. 2018, 6, 702–712. [Google Scholar] [CrossRef]
  37. Van Tran, Q.; Park, S.H.; Ahn, H.S. Bearing-based formation control via distributed position estimation. In Proceedings of the 2018 IEEE Conference on Control Technology and Applications, Copenhagen, Denmark, 21–24 August 2018. [Google Scholar]
  38. Tron, R. Bearing-based formation control with second-order agent dynamics. In Proceedings of the 2018 IEEE Conference on Decision and Control, Miami, FL, USA, 17–19 December 2018. [Google Scholar]
  39. Bishop, A.N.; Summers, T.H.; Anderson, B.D. Stabilization of stiff formations with a mix of direction and distance constraints. In Proceedings of the 2018 IEEE Conference on Decision and Control, Hyderabad, India, 28–30 August 2013. [Google Scholar]
  40. Fathian, K.; Rachinskii, D.I.; Spong, M.W.; Gans, N.R. Globally asymptotically stable distributed control for distance and bearing based multi-agent formations. In Proceedings of the 2016 American Control Conference, Boston, MA, USA, 6–8 July 2016. [Google Scholar]
  41. Zhao, S.; Zelazo, D. Translational and scaling formation maneuver control via a bearing-based approach. IEEE Trans. Control Netw. Syst. 2015, 4, 429–438. [Google Scholar] [CrossRef]
  42. Schiano, F.; Franchi, A.; Zelazo, D.; Giordano, P.R. A rigidity-based decentralized bearing formation controller for groups of quadrotor UAVs. In Proceedings of the IEEE/RSJ International Conference on Intelligent Robots and Systems, Daejeon, Republic of Korea, 9–14 October 2016. [Google Scholar]
  43. Van Tran, Q.; Ahn, H.S. Flocking control and bearing-based formation control. In Proceedings of the 2018 18th International Conference on Control, Automation and Systems, PyeongChang, Republic of Korea, 17–20 October 2018. [Google Scholar]
  44. Liu, G.; Zhang, J.; Li, C. A leader-following formation control bearing-based approach. In Proceedings of the 2018 Chinese Automation Congress, Automation and Systems, Xi’an, China, 30 November 2018–2 December 2018. [Google Scholar]
Figure 1. Schematic diagram of UAV formation.
Drones 09 00767 g001
Figure 2. Schematic diagram of trilateration localization model with three known emitters.
Drones 09 00767 g002
Figure 3. Diagram of the direction angles for UAVs numbered in counterclockwise order 1 0 X within the localization model of trilateration localization model ( K = 7 ).
Drones 09 00767 g003
Figure 4. Trilateration localization model with three known emitters: UAV coordinate computation diagram.
Drones 09 00767 g004
Figure 5. Hierarchical emitter identification and localization model with partially unknown emitters.
Drones 09 00767 g005
Figure 6. Dual solutions for the emitter corresponding to α 2 = 60 . 06 ° ( F Y 0 Y = F Y 07 ).
Drones 09 00767 g006
Figure 7. (a) Dual-solution scenario for receiver localization with α 1 . (b) Unique-solution scenario for receiver localization with α 1 ( F Y 0 Y = F Y 07 ).
Drones 09 00767 g007
Figure 8. Receiver location region under the condition of X 1 = Y 1 ( F Y 0 Y = F Y 07 ).
Drones 09 00767 g008
Figure 9. Receiver location region under the condition of X 1 = Y 2 ( F Y 0 Y = F Y 07 ).
Drones 09 00767 g009
Figure 10. (a) Receiver Location Region under the Condition of X 1 = Y 1 and X 2 = Y + 1 . (b) Receiver Location Region under the Condition of X 1 = Y 2 and X 2 = Y + 2 ( F Y 0 Y = F Y 07 ).
Drones 09 00767 g010
Figure 11. Receiver location region under the condition of X 1 + X 2 = 2 Y ( F Y 0 Y = F Y 07 ).
Drones 09 00767 g011
Figure 12. Solution workflow for the hierarchical emitter identification and localization model.
Drones 09 00767 g012
Figure 13. Multi-UAV signal interaction-based iterative strategy for cooperative position adjustment ( P E J E ).
Drones 09 00767 g013
Figure 14. Schematic of the initial discretization interval and discrete points.
Drones 09 00767 g014
Figure 15. Schematic of the discretization interval during the position adjustment process.
Drones 09 00767 g015
Figure 16. The adaptive discrete neighborhood search algorithm flowchart.
Drones 09 00767 g016
Figure 17. Schematic of gene encoding.
Drones 09 00767 g017
Figure 18. Schematic of chromosomal encoding.
Drones 09 00767 g018
Figure 19. Mutation in GA-IADNS.
Drones 09 00767 g019
Figure 20. Crossover in GA-IADNS.
Drones 09 00767 g020
Figure 21. (a) Variation curves of polar radius ρ for each UAV. (b) Variation curves of polar angle θ for each UAV.
Drones 09 00767 g021
Figure 22. Radar chart of attributes for the optimal UAV adjustment scheme.
Drones 09 00767 g022
Figure 23. Encoding of the optimal UAV adjustment solution.
Drones 09 00767 g023
Figure 24. (a) Comparison of algorithm’s average fitness under different combinations of population size and mutation probability. (b) Comparison of algorithm’s average fitness under different combinations of step size adjustment coefficients.
Drones 09 00767 g024
Figure 25. Average fitness during iteration for different combinations of population size and mutation probability.
Drones 09 00767 g025
Figure 26. Average fitness during iteration under different combinations of step size adjustment coefficients.
Drones 09 00767 g026
Figure 27. Comparison of average fitness during iteration under different initial UAV position deviations.
Drones 09 00767 g027
Figure 28. Deviation of final positions from desired positions under different initial UAV location errors. (a) Radial coordinate ( ρ ) deviation. (b) angular coordinate ( θ ) deviation. (c) Abscissa (x) deviation. (d) Ordinate (y) deviation.
Drones 09 00767 g028
Figure 29. Comparison between the GA and GA-IADES. (a) Comparison of the variation of the average fitness value per generation. (b) Comparison of the variation of the fitness value after each single adjustment for the optimal individual.
Drones 09 00767 g029
Figure 30. Variation of UAV polar radius under the optimal adjustment scheme. (a) GA algorithm. (b) GA-IADNS algorithm.
Drones 09 00767 g030
Figure 31. Variation of UAV polar angle under the optimal adjustment scheme. (a) GA algorithm. (b) GA-IADNS algorithm.
Drones 09 00767 g031
Table 1. Feature comparison between existing research and this paper.
Feature DimensionRepresentative Existing ResearchThis Paper
Localization MethodActive localization [3], hybrid passive (TDOA, RSS, etc.) [5], or bearing-only assuming fully known emitters [1,4,22,26]Bearing-only passive localization, strictly adhering to electromagnetic silence requirements
Emitter AssumptionTypically assume positions are fully known and fixed [1,4,24,30,31,32,33,34,35,36,37,38,39,40,41,42,43,44]Systematically addresses partially unknown and dynamically variable emitters
Ambiguity IssueMost studies do not deeply address or resolve localization ambiguities inherent in geometric constraints [1]Proposes a hierarchical identification mechanism and a cooperative adjustment strategy to effectively resolve ambiguities
Adjustment StrategyLacks systematic mechanisms for planning signal transceiver roles [1,4], or relies on fixed, predefined adjustment steps, or relies on fixed, predefined adjustment stepsProposes the cyclic PEJE cooperative strategy, dynamically planning signal sequences and enabling UAV role switching
Optimization MethodOften employs traditional control theory [12,15], rigidity theory [34], or simple optimization algorithmsIntroduces an Improved Genetic Algorithm (GA-IADES) to optimize discrete neighborhood search and signal scheduling sequences, balancing convergence speed and precision
Primary ObjectiveFormation stability [8,15], trajectory tracking [8], target encircling [25], or convergence to specific shapes [30,31,32,33,34,35,36,37,38,39,40,41,42,43,44]High-precision formation convergence under EM silence, focusing on correcting large initial deviations and inhibiting error accumulation
Table 2. Parameters description.
SymbolDescription
α Measured bearing angle at the receiver UAV
γ Central angle subtended by two UAVs on the circumference
rThe distance between drone on the circular formation and drone at the center
ρ Polar radius (radial coordinate) of the target UAV
θ Polar angle (angular coordinate) of the target UAV
F Y O X i The i-th unidentified emitter UAV
R E S Set of indices for receiver UAVs
L A U Set of indices for emitter UAVs
r e s m Index of the m-th receiver UAV in a single adjustment
l a u n Index of the n-th emitter UAV in a single adjustment
α r e s 0 i , l a u 0 j Actual bearing angle formed by receiver F Y 0 i and emitters F Y 00 & F Y 0 j
α r e s 0 i , l a u 0 j Desired bearing angle formed by receiver F Y 0 i and emitters F Y 00 & F Y 0 j
α r e s 0 i , 01 Actual bearing angle formed by receiver F Y 0 i and emitters F Y 00 & F Y 01
α r e s 0 i , 01 Desired bearing angle formed by receiver F Y 0 i and emitters F Y 00 & F Y 01
Δ S 0 Discretization step size (interval)
wNumber of grid points along the horizontal axis
hNumber of grid points along the vertical axis
( x i j , y i j ) Coordinates of a point in the discretized grid, i { 1 , 2 , , w + 1 } , j { 1 , 2 , , h + 1 }
( x k , y k ) Initial coordinates of the UAV
g e n e Encoding for a one-time adjustment scheme (OTS)
c h r o m o s o m e Encoding for a complete adjustment scheme (CAS)
a d j _ t i m e Number of adjustment steps in a complete scheme
x i A binary decision variable in the OTS encoding, x i { 0 , 1 }
Table 3. The positional information of the signal transmitter in trilateration localization model with three known emitters.
UAV NumberPosition Deviation
F Y 00 No
F Y 0 X 1 No
F Y 0 X 2 No
Table 4. Calculated direction angles θ 1 , θ 2 under different UAV sequencing schemes.
Counterclockwise Sequencing of UAVs θ 1 θ 2
0 X 1 α 1 α 2
0 1 X α 1 α 2
1 0 X 2 π α 1 α 2
1 X 0 2 π α 1 2 π α 2
X 1 0 2 π α 1 2 π α 2
X 0 1 α 1 2 π α 2
Table 5. Calculated polar angles of the target UAV.
α 2 θ
<π π + γ β 2 θ 2
>π π + γ + β 2 + θ 2
Table 6. The positional information of the signal transmitter in hierarchical emitter identification and localization model.
UAV NumberPosition Deviation
F Y 00 No
F Y 01 No
Unknown Position UAVs ×   n No
Table 7. Range of receiver angles α 2 under deviation-free UAV formation.
Y23456789
X
2\70503010350330310
3290\70503010350330
4310290\70503010350
5330310290\70503010
6350330310290\705030
710350330310290\7050
83010350330310290\70
9503010350330310290\
Table 8. Range of receiver angles α 2 under positional deviation.
Nominal Value of α 2 (Ideal Formation)/°Actual Interval of α 2 with Positional Deviation/°
10[5.05, 17.00]
30[24.48, 38.11]
50[42.59, 61.05]
70[55.92, 90.98]
290[269.02, 304.08]
310[298.95, 317.41]
330[321.89, 335.52]
350[343.00, 354.95]
Table 9. Coordinates of UAVs in the initial formation and desired UAV positions.
UAV NumberActual Polar Coordinates (m, °)Desired Polar Coordinates (m, °)
FY00(0, 0)(0, 0)
FY01(100, 0)(100, 0)
FY02(98, 40.10)(100, 40)
FY03(112, 80.21)(100, 80)
FY04(105,119.75)(100, 120)
FY05(98, 159.86)(100, 160)
FY06(112, 199.96)(100, 200)
FY07(105, 240.07)(100, 240)
FY08(98, 280.17)(100, 280)
FY09(112, 320.28)(100, 320)
Table 10. Parameters in the adaptive discrete neighborhood search algorithm.
ParameterDescription
η i n t e r Step size reduction factor within a single adjustment step
N i n t e r Maximum number of iterative searches within a single adjustment step
η o u t e r Step size reduction factor between consecutive adjustment steps
k i n t e r Counter for iterations within the current adjustment step
k o u t e r Global counter for the number of adjustment steps completed
Table 11. Comparison between actual final and desired UAV positions in polar coordinates.
UAV No.Radial Coordinate ( ρ )Angular Coordinate ( θ )
Actual Final
Position Under
GA-IADES
Desired
Position
Deviation Actual Final
Position Under
GA-IADES
Desired
Position
Deviation
FY000.0000000.0000000.0000000.0000000.0000000.000000
FY01100.000100.0000.0000000.0000000.0000000.000000
FY0299.99993100.0000.000070139.9998740.000000.0001301
FY03100.000100.0000.00000079.9999780.000000.0000301
FY04100.000100.0000.0001001120.0001120.00000.0001001
FY05100.000100.0000.000000159.9999160.00000.0001001
FY06100.000100.0000.0001001200.0000200.00000.000000
FY0799.99997100.0000.0000301240.0000240.00000.000000
FY0899.99993100.0000.0000701280.0000280.00000.000000
FY0999.99998100.0000.0000201319.9999320.00000.0001001
Bold text indicates deviations between the actual UAV coordinates solved by the GA-IADES algorithm and the desired coordinates. Downward arrows represent cases where the actual coordinates are smaller than the desired values, while upward arrows denote cases where the actual coordinates exceed the desired values.
Table 12. Comparison between actual final and desired UAV positions in cartesian coordinates.
UAV No.Abscissa (x)Ordinate (y)
Actual Final
Position Under
GA-IADES
Desired
Position
Deviation Actual Final
Position Under
GA-IADES
Desired
Position
Deviation
FY000.0000000.0000000.0000000.0000000.0000000.000000
FY01100.000100.0000.0000000.0000000.0000000.000000
FY0276.6045476.604440.000100 ↑64.2785564.278760.000210 ↓
FY0317.3648817.364820.000060 ↑98.4808098.480780.000020 ↑
FY04−50.00010−50.000000.000100 ↓86.6025886.602540.000040 ↑
FY05−93.96920−93.969200.00000034.2021834.202010.000170↑
FY06−93.96940−93.969100.000300 ↓−34.20200−34.202000.000000
FY07−50.00010−50.000000.000100 ↓−86.60250−86.602500.000000
FY0817.3638817.364870.000100 ↓−98.48070−98.480800.000100 ↑
FY0976.6043076.604490.000190 ↓−64.27890−64.278800.000100 ↑
Bold text indicates deviations between the actual UAV coordinates solved by the GA-IADES algorithm and the desired coordinates. Downward arrows represent cases where the actual coordinates are smaller than the desired values, while upward arrows denote cases where the actual coordinates exceed the desired values.
Disclaimer/Publisher’s Note: The statements, opinions and data contained in all publications are solely those of the individual author(s) and contributor(s) and not of MDPI and/or the editor(s). MDPI and/or the editor(s) disclaim responsibility for any injury to people or property resulting from any ideas, methods, instructions or products referred to in the content.