Article

Hierarchical Deep Learning Model for Identifying Similar Targets in UAV Imagery

1
Department of Computer Science, Khmelnytskyi National University, 11 Instytuts’ka Street, 29016 Khmelnytskyi, Ukraine
2
Department of Theoretical Cybernetics, Taras Shevchenko National University of Kyiv, 4d Akademika Glushkova Ave., 03680 Kyiv, Ukraine
3
Laboratory of Communicative Information Technologies, V.M. Glushkov Institute of Cybernetics, 40 Akademika Glushkova Ave., 03187 Kyiv, Ukraine
*
Author to whom correspondence should be addressed.
Drones 2025, 9(11), 743; https://doi.org/10.3390/drones9110743 (registering DOI)
Submission received: 9 September 2025 / Revised: 22 October 2025 / Accepted: 23 October 2025 / Published: 25 October 2025

Highlights

What are the main findings?
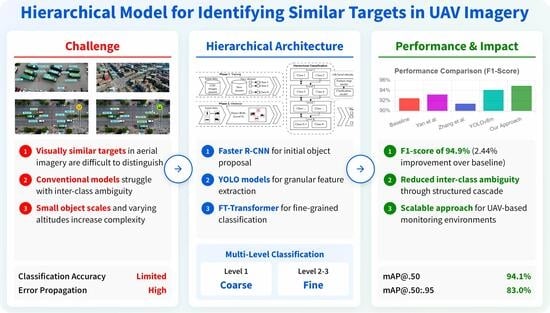
  • A hierarchical deep learning model achieves a 94.9% F1-score in UAV object detection, outperforming the non-hierarchical baseline by 2.44%.
  • The proposed coarse-to-fine cascade architecture effectively resolves inter-class ambiguity by systematically refining classification through specialized deep learning stages.
What are the implications of the main findings?
  • The proposed architecture enables the development of more accurate and reliable situational awareness systems for UAVs, reducing critical errors in target identification.
  • This work provides a scalable and robust solution for complex computer vision tasks, demonstrating the superiority of modular, specialized models over monolithic approaches in UAV applications.

Abstract

Accurate object detection in UAV imagery is critical for situational awareness, yet conventional deep learning models often struggle to distinguish between visually similar targets. To address this challenge, this study introduces a hierarchical deep learning architecture that decomposes the multi-class detection task into a structured, multi-level classification cascade. Our approach combines a high-recall Faster R-CNN for initial object proposal, specialized YOLO models for granular feature extraction, and a dedicated FT-Transformer for fine-grained classification. Experimental evaluation on a complex dataset demonstrated the effectiveness of this strategy. The hierarchical model achieved an aggregate F 1 -score of 93.9%, representing a 1.41% improvement over the 92.46% F 1 -score from a traditional, non-hierarchical baseline model. These results indicate that a modular, coarse-to-fine cascade can effectively reduce inter-class ambiguity, offering a scalable approach to improving object recognition in complex UAV-based monitoring environments. This work contributes a promising approach to developing more accurate and reliable situational awareness systems.

1. Introduction

1.1. Motivation and Contributions

Effective situational awareness is a critical component for decision-making in a wide range of applications, from civil security to environmental monitoring, where unmanned aerial vehicles (UAVs) have become indispensable tools [1,2]. UAVs, or drones, offer unparalleled mobility and cost-effectiveness as platforms for remote sensing [3], enabling complex tasks such as the dynamic inspection of critical infrastructure like wind turbines [4,5]. However, the practical utility of the vast volumes of high-resolution imagery they collect hinges on the ability of automated systems to perform real-time analysis, often under challenging conditions such as low illumination [6,7]. A key challenge in this domain is the accurate and rapid detection of specific objects, particularly small or visually similar targets, a problem that has driven the development of advanced hierarchical frameworks [8]. This task is a cornerstone of modern computer vision and robotic perception, where deep learning models have set the state-of-the-art.
This study is directly motivated by the need to advance the perceptual capabilities of these aerial platforms. While deep learning has significantly reduced the cognitive load on human operators and accelerated decision-making, a persistent challenge remains: the reliable identification of visually similar targets. This problem is not merely theoretical; in applications such as search and rescue, infrastructure inspection, or security surveillance, misclassifying objects can have critical consequences. Our work addresses this gap by proposing a novel hierarchical, multi-level classification model specifically designed to resolve the inter-class ambiguity that plagues conventional, monolithic detection systems.
The primary goal of this research is to enhance the classification accuracy of similar targets in real-time UAV imagery, particularly under the computational constraints typical of drone platforms. We achieve this by developing a hierarchical deep learning architecture that decomposes a complex, multi-class detection problem into a structured, multi-level cascade.
To achieve this goal, this study makes the following major contributions:
  • We propose a multi-level classification model for UAV imagery that systematically refines object classes from coarse to fine, significantly enhancing accuracy for visually similar targets.
  • We introduce a novel method for integrating specialized deep learning models at each stage of the hierarchy, using Faster Region-based Convolutional Neural Network (CNN), i.e., Faster R-CNN, for initial detection, You Only Look Once (YOLO) for granular feature extraction, and a Feature-Tabular Transformer (FT-Transformer) for robust classification.
  • We conduct a comprehensive validation and comparative evaluation of the proposed approach against existing solutions, demonstrating a marked improvement in performance and confirming its scalability and effectiveness.

1.2. State of the Art

Modern deep learning offers a powerful toolkit for object classification, with notable architectures such as Faster R-CNN [9] and YOLO [10] setting the standard. These models, built on CNNs, excel at extracting features for robust object recognition. However, their high accuracy can be offset by computational demands, creating challenges for real-time deployment on drones. Researchers have focused on improving these foundational models, for instance, by enhancing Faster R-CNN for the detection of small objects in real-time surveillance imagery [11]. The development of large-scale public benchmarks, such as the VisDrone dataset [12], which contains over 8000 high-resolution images captured in diverse real-world scenarios, has been instrumental in driving these advancements.
Recognizing the unique challenges of aerial imagery, such as small object scales, variable altitudes, and cluttered backgrounds, significant effort has been directed at tailoring deep learning architectures for UAVs. Innovations include HSP-YOLOv8, which integrates an additional prediction head to improve small-object accuracy [13]; modifications to YOLOv7 to handle varying object scales and dense clusters [14]; and UN-YOLOv5s, which introduces specialized mechanisms to boost mean Average Precision (mAP) [15]. Other approaches, such as the DV-DETR [16] and various improved YOLOv5 methods [17], further highlight the trend toward specialized models. A recent comprehensive survey underscores the rapid progress and remaining challenges in UAV detection and classification using machine learning [18].
Beyond standard visual object detection, research has explored alternative sensing modalities and applications. These include UAV detection via compressively sensed RF signals [19] and the use of hybrid Transformer–CNN architectures for complex tasks like land cover classification [20,21]. Deep learning has also been successfully applied to critical environmental and agricultural monitoring tasks from UAVs, such as flood detection [22], crop classification [23], and tree species identification [24]. Concurrently, studies have investigated key operational challenges, including the impact of adverse weather on model performance [25] and the development of robust vision-based systems for complex environments [26].
In parallel, transformer-based architectures have emerged as a powerful paradigm in computer vision. The Vision Transformer (ViT) [27] first demonstrated the potential of applying self-attention mechanisms to image patches. Subsequent work, such as the Data-efficient Image Transformer [28], optimized these models for training on smaller datasets. The Perceiver model introduced a general-purpose architecture for handling multimodal data [29], while the TabTransformer was specifically designed for processing tabular data by modeling contextual embeddings for categorical features [30]—a concept highly relevant to our work. Hierarchical models like the Swin Transformer [31] and Pyramid Vision Transformer [32] have further refined this approach, balancing accuracy and computational efficiency. These advancements have inspired a new generation of lightweight, high-performance models for UAVs, including G-YOLO [33], specialized YOLOv5 variants for non-civilian target detection [34], and HR-YOLOv8 for crop status monitoring [10].
Based on this analysis, we propose a hybrid approach that leverages a modified Faster R-CNN for initial object proposal [35], the YOLO framework for feature extraction [36], and a Feature-Tabular Transformer (FT-Transformer) [37] for classification. This approach is founded on two scientific hypotheses: (i) a multi-level architecture using separately trained deep learning models is more effective than a monolithic model; and (ii) transformer-based models adapted for structured tabular data are highly effective for classifying feature vectors extracted from CNNs.

1.3. Objectives and Tasks

The overarching aim of this study is to improve the accuracy of similar-target classification based on real-time UAV imagery under constrained computational resources. To achieve this, research objectives are defined as follows:
  • Propose a multi-level classification approach for objects in UAV imagery.
  • Design a hierarchical model tailored for multi-level object classification.
  • Develop a method for selecting optimal deep learning models for feature vector extraction and subsequent classification.
  • Perform a rigorous validation and comparative evaluation of the proposed approach against existing solutions.
The remainder of this paper is structured as follows. Section 2 details the proposed hierarchical model, methodology, and experimental design. Section 3 presents the quantitative and qualitative results, comparing our approach against baseline and state-of-the-art models. Finally, Section 4 discusses the implications of our findings, addresses the study’s limitations, and outlines future research directions aimed at enhancing the model for real-world deployment on drone platforms.

2. Materials and Methods

2.1. Description of the Proposed Approach

The essence of the proposed approach is a multi-level structure that classifies objects sequentially, refining their classification at each step. This method allows for more accurate feature extraction compared to a single multi-class model because, at each level, classification is performed within a limited number of classes, enabling the model to isolate the unique features that distinguish different target types. A key feature is the use of two separate deep learning models at each level [38]: one for feature extraction and vector representation, and another for classification based on those features. A schematic representation of the proposed approach is shown in Figure 1. This figure illustrates the design process of the cascade architecture for a given task, the process of direct detection and classification, an example of a constructed cascade, and the operating principle of each classification layer. This approach is scalable and flexible, as it allows new classification levels to be easily added without the need to retrain the entire system.
Further in this article, the following are proposed as part of the above-mentioned multi-level object classification approach for UAV imagery: (i) a model for multi-level classification of objects in UAV imagery and (ii) a method for selecting deep learning models for target feature vector extraction and classification based on these features. Additionally, we present (iii) an example of applying the proposed approach and (iv) evaluation metrics used to assess its performance.

2.2. Multi-Level Object Classification Model for UAV Imagery

In automated UAV image analysis, a structured multi-level processing approach enables the sequential refinement of object classes while maintaining high accuracy. This avoids excessive feature dispersion and allows for efficient system scalability. The processing can be formalized as a set-theoretic model that describes the stepwise transformation of input data into structured output labels.
The mathematical formalization presented here is definitional to our proposed model and describes the stepwise transformation of input data into structured output labels. Let an input image be x X , where X is the set of all possible UAV images. The goal is to produce an ordered set of detected targets with their corresponding classes. Object detection is a function D : X P ( R ) , mapping an image x to a subset of ROIs { r 1 , , r k } R . Feature vector construction for each region is a function F : R R n , mapping each region to a feature vector. These vectors are then input to a classifier C, a deep learning model that maps each vector to a class from the set { A 1 , , A s } at the current level. This transformation can be expressed as
x D { r 1 , , r k } F { f r 1 , , f r k } C { c 1 , , c k } ,
where each c i { A 1 , , A s } .
If an object of class A y requires further classification at a subsequent level k, this refinement is expressed for each corresponding object r i as
r i F k C k c i ,
where c i belongs to the set of classes at the next classification level.
This process can be generalized to a global function Φ : X P ( R × C ) that maps an input image to a set of pairs containing object coordinates and their final classes:
Φ ( x ) = { ( r 1 , c ^ 1 ) , ( r 2 , c ^ 2 ) , , ( r k , c ^ k ) } ,
where each c ^ i is the final classification label for region r i .
For an arbitrary number of levels n, let F i be the feature extraction function and C i be the classifier at level i. The generalized mapping function Φ can be expressed as
Φ ( x ) = { ( r i , c ^ i ) | r i D ( x ) , c ^ i = Γ ( r i ) } ,
where Γ : R C is a multi-level classification function defined recursively as
Γ ( r ) = C 1 ( F 1 ( r ) ) , if C 1 ( F 1 ( r ) ) C last ; C 2 ( F 2 ( r ) ) , if C 1 ( F 1 ( r ) ) C last and C 2 ( F 2 ( r ) ) C last ; C n ( F n ( r ) ) , if C n 1 ( F n 1 ( r ) ) C last and C n ( F n ( r ) ) C last .
In Equation (5), C last represents the set of terminal classes that do not require further refinement.
Finally, the proposed model formalized by Equation (5) enables consistent refinement of object classes, ensuring high accuracy. It is also easily scalable by adding new layers with corresponding functions F n + 1 and C n + 1 without modifying previous levels.

2.3. Method for Selecting Deep Learning Models for Feature Vector Extraction and Classification

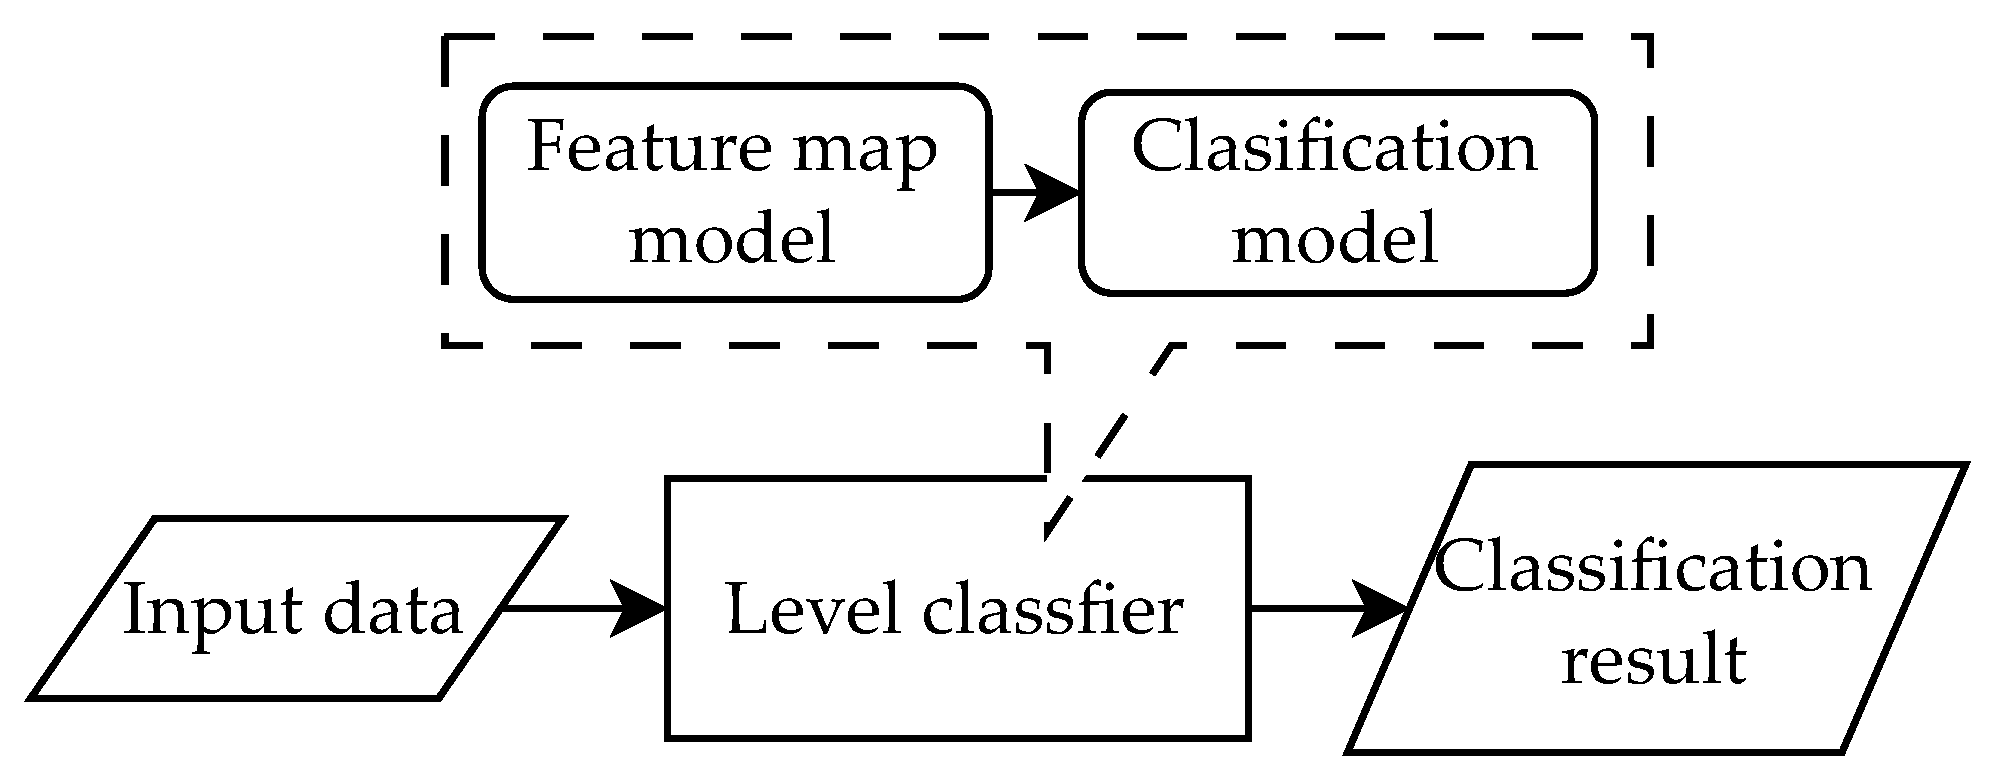
At each classification level, two separate models are used as follows: a feature map model for generating feature vectors and a classification model for object classification. This dual-model structure, illustrated in Figure 2, is motivated by the fact that the quality of the feature vectors is decisive for successful classification. This approach helps avoid overloading a single model with too many target classes, which can lead to feature space blurring and reduced classification quality. In contrast, narrowly specialized models focused on a small number of classes can form more distinct feature vectors with higher inter-class separation. The classification model replaces the standard classification head of a convolutional network, providing a more flexible and powerful structure.
The feature vector formed for each object represents spatial, contextual, textural, and morphological information captured in the image. While it is common practice to use the feature vector from the final layer of a CNN [39], this approach is not always optimal. Deep convolutional networks are organized such that initial layers extract simple local patterns (e.g., edges and textures), while final layers aggregate this information into abstract, semantically rich features, often neglecting fine local details. In tasks requiring high sensitivity to local differences, limiting the feature representation to only the last layer can lead to a loss of critical information as was analyzed in [40].
Therefore, our proposed approach constructs feature vectors using a combination of features from the final layer and intermediate layers to maintain a balance between abstraction and detail. Feature vectors are obtained from each convolutional layer, forming a set of vectors F in the space R n . The final feature vector for an object r i , denoted f i F , is obtained by concatenation:
f i = con ( C ( n , k ) ) ,
where C is a function for selecting k vectors from the total of n available layer vectors.
The goal is to find a combined feature vector f i that maximizes the inter-class distance. This optimization problem is formalized as finding a vector ϕ * that satisfies the following:
ϕ * = arg max concat lim | S | min i , j ; c i c j f i f j ,
where S is the set of objects, c i is the class of object i, and f i is its constructed feature vector.
The inter-class distance is calculated as the Euclidean distance between the centroids of the respective classification classes:
d ( p , q ) = i = 1 n ( q i p i ) 2 ,
where p and q represent the centroids of the two classes.
For the classification task based on these combined feature vectors, we propose using the FT-Transformer, an innovative architecture for processing tabular data. Let M c i be the deep learning model for classifying objects. Its generalized architecture can be expressed as
M c i = { Enc , Ftr , Out } ,
where Enc is a sequence of encoder layers with multi-head self-attention to capture dependencies between features, Ftr is a feature transformer layer that learns interactions between features in an interpretable way, and Out is the final output layer for classification.
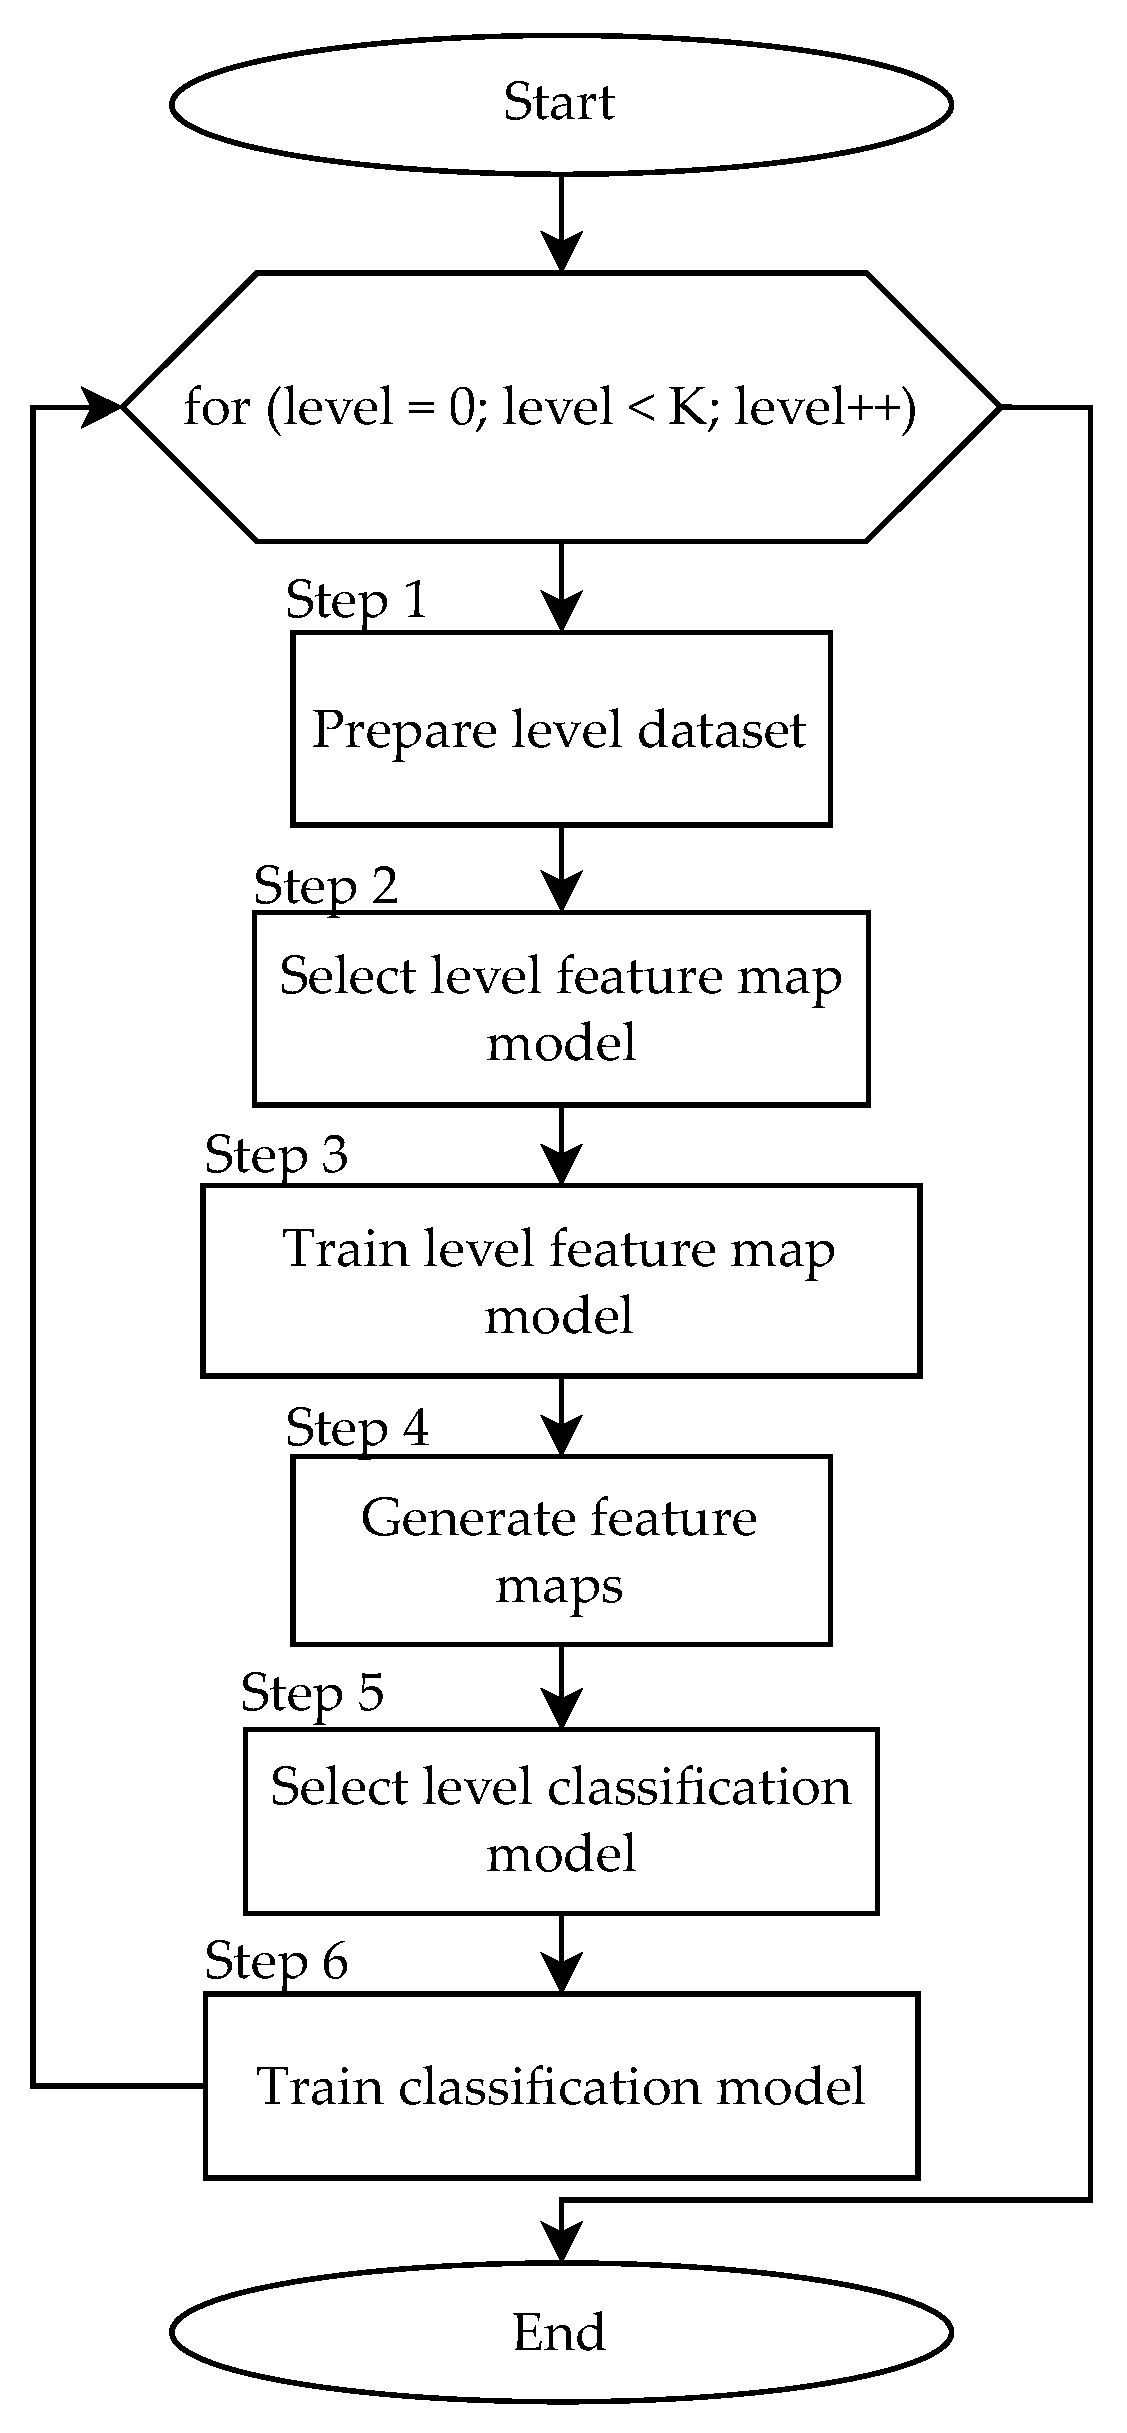
The overall method involves two stages: training/validation and application. The training stage, depicted in Figure 3, follows a structured workflow for each classification level.
The input is a dataset for model training.
Step 1: Define classes for the current level and create an intermediate training dataset.
Step 2: Select the optimal feature map model and feature vector construction strategy by solving the optimization problem in Equation (7), using visual analytics for evaluation.
Step 3: Train the selected feature map model from Step 2.
Step 4: Generate a dataset of constructed feature vectors using the trained model.
Steps 5 and 6: Select and train the FT-Transformer classification model using the feature vectors from Step 4.
This algorithm is repeated for all K classification levels, yielding two trained models per level. The application stage, shown in Figure 4, uses these trained models for end-to-end inference.
The input is an image containing objects.
Step 1: Detection of all possible ROIs is performed using the model trained on the general dataset.
Step 2: All ROIs are passed to the classification block, which sequentially applies the previously trained classifiers to refine the object classes.
The output is the image with detected and classified objects. This modularity allows for the effective combination of modern deep learning models and facilitates easy updates of individual components without disrupting the overall structure.

2.4. Example of the Proposed Approach

To validate the model and method, we constructed a multi-level target detection model based on a principled, coarse-to-fine classification strategy. This hierarchical design is structured by beginning with the most visually distinct superclasses and then recursively splitting the most ambiguous or populous remaining class at each subsequent level. This strategy is critical because it ensures that the model addresses the easiest, most discriminative classification problems first, thereby maximizing accuracy and minimizing error propagation in the early stages of the cascade. The three-level classification sequence (Figure 5) was specifically chosen as a proof-of-concept to demonstrate the effectiveness of this logical partitioning approach. A generalizable methodology for automatically determining the optimal hierarchical structure will be addressed in future work.
At the first level, objects are classified into two broad classes: Humans (H) and Vehicles (V). This initial separation is designed to distinguish between the most dissimilar classes first to maximize accuracy and minimize early-stage errors. At the second classification level, the goal is to divide objects of the “Vehicle” class into two subclasses: “Trucks” (T) and “Other Vehicles” (O). This categorization is motivated by the distinct visual features of trucks and the need to balance class distributions in the training data, which improves model accuracy. The third level further details the class “Other Vehicles,” classifying them into three classes: “Van” (G), “Bus” (M), and “Other Vehicles” (Z).
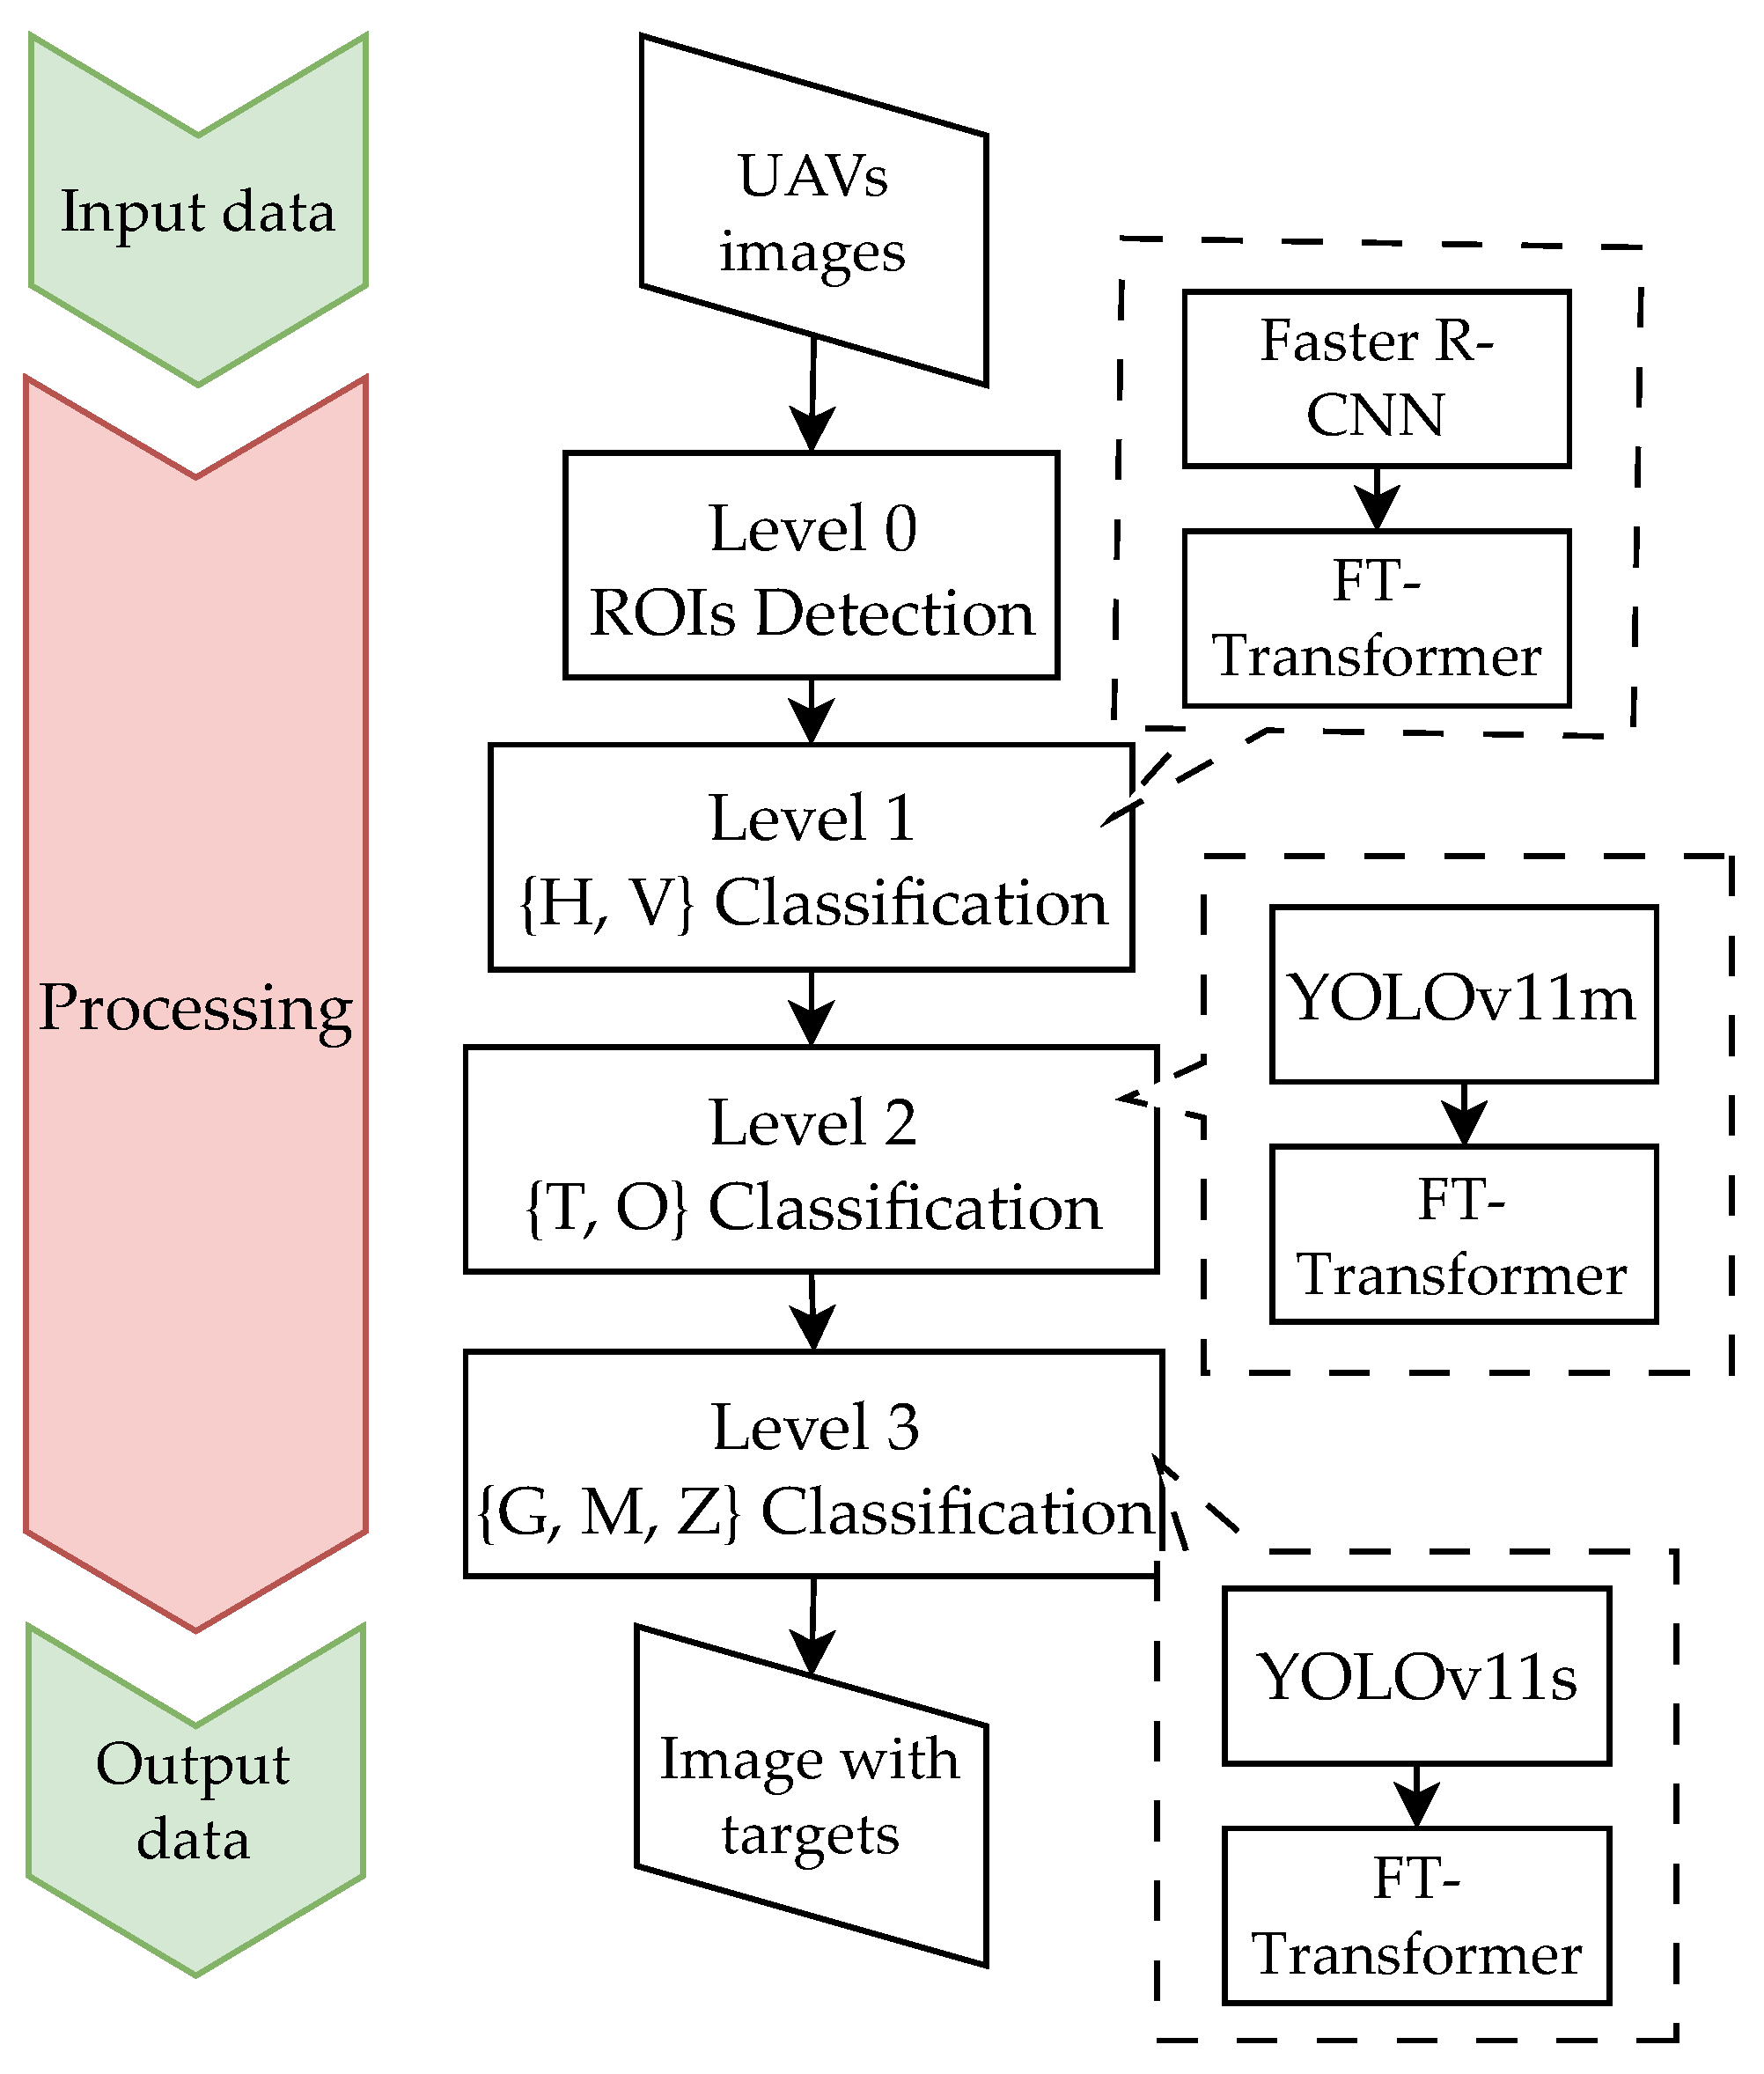
The initial object detection was performed by a Faster R-CNN model trained on a custom dataset with only the “Human” and “Vehicle” classes, derived from the VisDrone2019 dataset [12]. The architecture of this Faster R-CNN model includes several key components: a backbone network (CNN) for initial feature extraction, a Region Proposal Network (RPN) that generates candidate object bounding boxes, an ROI pooling layer to standardize the size of feature maps for these regions, and final classification and regression heads. As illustrated in Figure 6, to balance detection accuracy and processing speed, a YOLOv11m model was used for feature extraction at the second classification level, and the smaller YOLOv11s model was used for the third. At each stage of the cascade, a dedicated FT-Transformer model performed the final classification task based on the extracted feature vectors.
After identifying potential targets, their feature vectors are passed for classification. The optimal feature vector construction strategy was determined experimentally for each classification level. We tested several configurations: the feature vector from the last convolutional layer ( f n ), a combination of vectors from the last and penultimate layers ( c o n ( f n , f n 1 ) ), a combination of the final layer and a vector from an earlier layer responsible for contour features ( c o n ( f n , f j ) ), and a concatenation of all three ( c o n ( f n , f n 1 , f j ) ). The most effective strategy for the first-level classification was the concatenation of vectors from the last and penultimate convolutional layers. For both the second and third classification levels, the optimal strategy was the concatenation of the final convolutional feature vector with the vector responsible for object contours. This contour-rich vector, f j , was sourced from the output of the third convolutional block in the YOLOv11 backbone, a layer that was empirically determined to retain strong edge and texture information crucial for distinguishing between visually similar vehicle sub-types.
Using Principal Component Analysis (PCA) [41], we visualized the vector representations and calculated the inter-class distances between the centroids of the resulting point clouds for each configuration, as shown in Table 1.
These findings, quantitatively supported by the inter-class distance measurements in Table 1, are visualized in Figure 7. The PCA plots confirm that the selected strategies achieve the best class separation at each respective level. The results suggest that as classification becomes more granular (Levels 2 and 3), features related to object contours ( f j ) become more discriminative than the more abstract features from the penultimate layer ( f n 1 ), which were optimal for the broader classification at Level 1.

2.5. Evaluation Metrics of the Proposed Approach

To provide a comprehensive and multi-faceted evaluation of the proposed hierarchical model, we employed a suite of standard metrics for classification and object detection. At each individual classification level, performance was assessed using Precision, Recall, and the F 1 -score. These metrics are defined as follows:
Precision measures the accuracy of positive predictions, quantifying the proportion of correctly identified positive instances among all instances predicted as positive. It is calculated as
Precision = TP TP + FP ,
where TP (True Positives) is the number of correctly classified positive instances and FP (False Positives) is the number of incorrectly classified negative instances.
Recall (or Sensitivity) measures the model’s ability to identify all relevant instances, quantifying the proportion of actual positives that were correctly classified. It is calculated as
Recall = TP TP + FN ,
where FN (False Negatives) is the number of positive instances that were incorrectly classified as negative.
F 1 -score provides a single, balanced measure of a model’s performance by calculating the harmonic mean of Precision and Recall. It is particularly useful when dealing with imbalanced class distributions and is defined as
F 1 -score = 2 × Precision × Recall Precision + Recall .
Given the multi-level nature of the proposed method, we introduce an aggregate metric, M avg , to summarize the overall performance across the entire cascade for any given metric M (e.g., Precision, Recall, or F 1 -score):
M avg = i = 1 n M i n ,
where M i is the value of the metric at classification level i, and n is the total number of classification levels.
To evaluate the effectiveness of the entire cascaded system as an integrated object detector, and to account for the cumulative effect of error propagation on both classification and localization accuracy, we utilized the mAP metric. AP (Average Precision) computes the area under the precision–recall curve for a specific class. The mAP is the mean of the AP values calculated over all object classes. We report mAP under two standard Intersection over Union (IoU) criteria:
  • mAP@.50: This metric calculates the mAP using a single, fixed IoU threshold of 0.50. A detection is considered a True Positive only if the IoU between the predicted and ground-truth bounding boxes is 0.50 or greater.
  • mAP@.50:.95: This is the primary metric from the COCO challenge and provides a more comprehensive evaluation of localization accuracy. It is calculated by averaging the mAP values over 10 different IoU thresholds, from 0.50 to 0.95 in increments of 0.05.

2.6. Experimental Setup

To ensure the reproducibility and validity of our results, all experiments were conducted under a unified and meticulously documented setup. The study utilized several publicly available datasets, each serving a distinct purpose in the training and evaluation pipeline. The primary dataset for training and initial testing was VisDrone2019 [12], a large-scale benchmark for UAV-based object detection featuring over 8000 high-resolution images captured in diverse real-world scenarios. For final metric evaluation, a validation set was created by randomly sampling 10% of the base images. To evaluate the model’s generalization capabilities on out-of-distribution data, we used the Common Objects in Context (COCO) dataset [42], a large-scale, general-purpose object detection benchmark. The model’s robustness and adaptability in aerial tracking scenarios were further assessed using the UAV Tracking Benchmark Dataset (UAV123) [43], which contains diverse scenes with varying viewpoints and illumination conditions. Finally, an external validation was performed on the FECL dataset [44], a public benchmark for non-civilian object detection, to confirm the model’s applicability in a different and more challenging domain.
All models were trained using the Adam optimizer (initial learning rate 0.001) with a cosine annealing learning rate scheduler. A batch size of 16 was used for the detection models (Faster R-CNN and YOLO), while the transformer-based classifiers employed a batch size of 32. Each model was trained for 20 epochs. Standard data augmentation techniques were applied to improve generalization, including random horizontal flips, scaling (resize jitter), and brightness/contrast adjustments (handled via OpenCV v4.9.0 [45]). The YOLOv11 (v8.3.196) [36] models additionally utilized mosaic and mixup augmentation strategies, as provided by the Ultralytics framework.
All experiments were executed on a workstation running a 64-bit Linux OS, equipped with an NVIDIA GeForce RTX 3090 GPU (24 GB GDDR6X; NVIDIA Corp., Santa Clara, CA, USA), an AMD Ryzen 9 series CPU (Advanced Micro Devices, Santa Clara, CA, USA), and 64 GB of RAM. The software environment consisted of Python v3.10 [46], PyTorch v2.2.1 [47] (built with CUDA Toolkit v12.3.2 [48]), TorchVision v0.20.1 [49], the Ultralytics YOLOv11 framework, Scikit-learn v1.4 [50], and HuggingFace Transformers v4.53.1 [51]. Although model development was performed in a high-performance computing environment, the final cascade is designed to be deployable on resource-constrained edge devices (e.g., NVIDIA Jetson Orin Nano and Jetson Xavier NX, NVIDIA Corp., Santa Clara, CA, USA) commonly used onboard UAVs. The resulting model sizes and training times (on the RTX 3090) for the major components were Faster R-CNN—245 MB, 32.4 h; YOLOv11-m—131 MB, 23.5 h; YOLOv11-s—54 MB, 14.2 h; and each FT-Transformer classifier—approximately 53 MB, 15.6 h. These figures highlight the trade-off between the hierarchical model’s high accuracy and its computational requirements.

3. Results

To rigorously evaluate the performance of the proposed hierarchical deep learning architecture, a comprehensive suite of experiments was conducted. This section details the findings, beginning with a qualitative illustration of the hierarchical classification process, followed by detailed quantitative metrics on the primary VisDrone2019 dataset. Subsequently, we assess the model’s generalization capabilities on unseen datasets (COCO and UAV123), provide a comparative analysis against baseline and state-of-the-art methods, and conclude with a deeper diagnostic evaluation of the model’s performance at each classification stage.

3.1. Qualitative Hierarchical Classification Performance

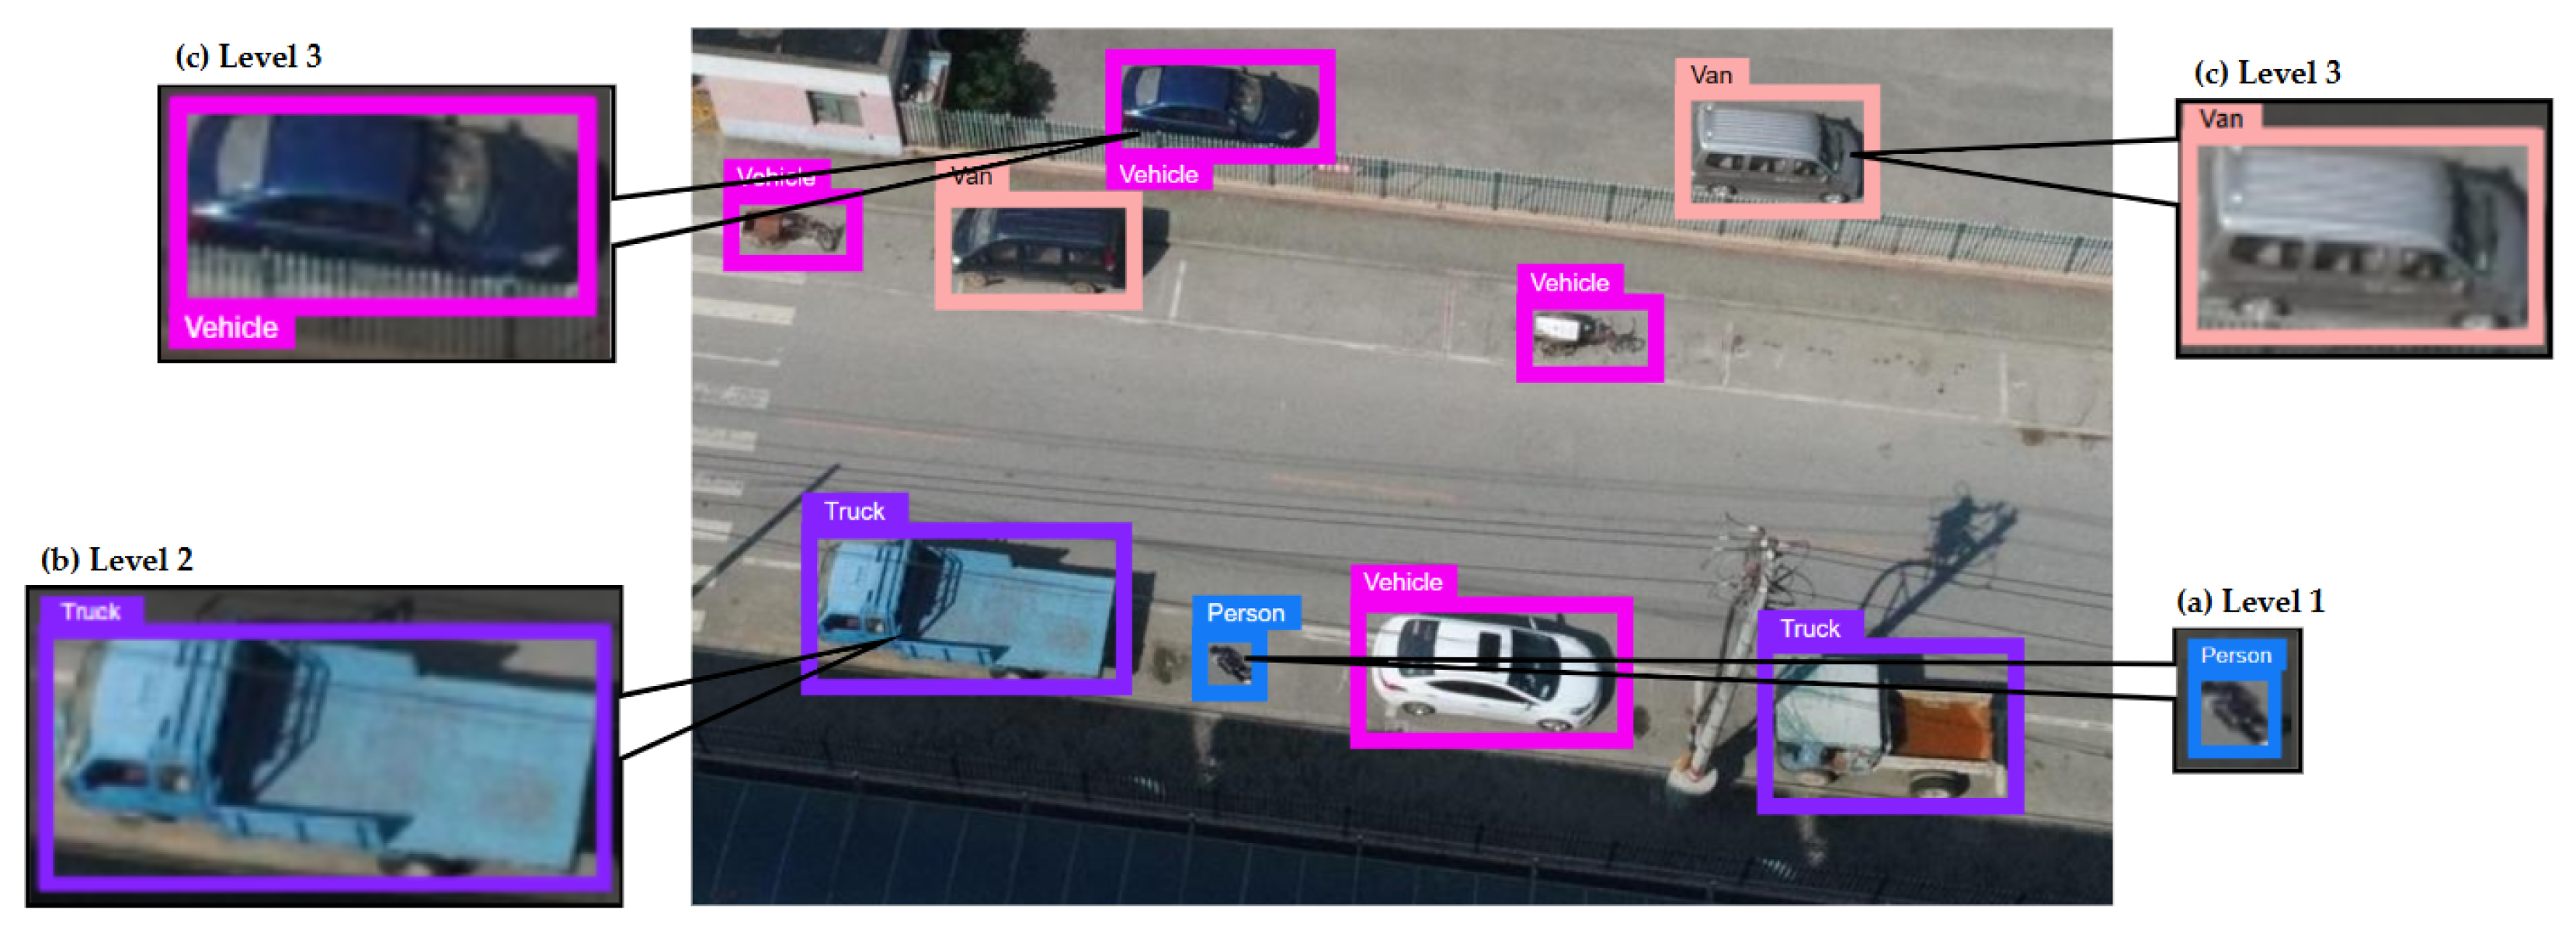
A qualitative demonstration of the model’s hierarchical classification process is presented in Figure 8. This figure illustrates the core principle of the coarse-to-fine refinement strategy. At the initial stage, as shown in Figure 8a, the model performs a broad classification, successfully distinguishing between general categories such as “Persons” (blue bounding box) and “Vehicles” (pink bounding box). As the data proceeds to the next level of the cascade, shown in Figure 8b, the “Vehicles” class is further resolved, enabling the model to identify more specific sub-categories like “Trucks” (violet bounding box). The process culminates at the third level, depicted in Figure 8c, where the model executes its most fine-grained classification, accurately identifying specific object types such as a “Van” (orange bounding box). This visual evidence effectively showcases the system’s ability to systematically reduce ambiguity and increase classification specificity at each successive stage.

3.2. Quantitative Performance on the VisDrone2019 Dataset

The primary dataset used for training and initial testing was the VisDrone2019 dataset [12], a widely recognized benchmark for aerial object detection. To ensure statistical reliability, the datasets for each level were randomly split three times, adhering to an 80% training and 20% testing ratio. The model’s performance was quantitatively assessed using a range of standard evaluation metrics.
The detailed quantitative performance of the individual models within the cascade is summarized in Table 2. The data reveals exceptionally strong and stable performance across all three classification levels. For instance, on the test set, the model achieved consistently high F 1 -scores of 93.5%, 94.2%, and 93.9% for levels 1, 2, and 3, respectively. The notably low standard deviation across all metrics for the three separate experimental runs highlights the robustness of the training methodology and the stability of the final models, indicating that the performance is consistent and not due to a fortuitous data split.
To assess the efficacy of the entire cascaded system as an integrated whole, and to account for the potential propagation of errors through the hierarchy, we calculated the mAP score. The results, presented in Table 3, demonstrate the system’s outstanding overall performance. On the test data, the model achieved a mAP@.50 of 94.1% and a mAP@.50:.95 of 83.0%. These high scores, particularly the mAP@.50:.95 which evaluates performance across a stringent range of IoU thresholds, confirm the system’s proficiency in not only accurate classification but also precise object localization.

3.3. Model Generalization and Robustness

To validate the model’s capacity for generalization and to ensure it had not overfitted to the training data, we conducted evaluations on two additional datasets that were entirely unseen by the model during the training phase: COCO [42] and UAV123 [43].
The performance metrics on the COCO dataset, detailed in Table 4, are strong across all classification levels. This successful performance on a novel and diverse dataset confirms that the hierarchical architecture has learned robust and generalizable features, making it adaptable to different operational environments beyond the specific context of the VisDrone2019 dataset.
Furthermore, to assess the model’s robustness in aerial tracking scenarios, we performed an additional evaluation on the UAV123 dataset. This dataset provides a challenging test environment with diverse aerial scenes, varying viewpoints, illumination, and object scales. The performance metrics, presented in Table 5, demonstrate consistently high results, confirming that the model effectively captures discriminative and transferable features suited for aerial object detection and tracking tasks. The small decrease in performance compared to the primary dataset is likely attributable to the dataset’s specific structure, which includes only a subset of the classes present in our cascade.

3.4. Comparative Analysis and Benchmarking

A critical aspect of this study was a comparative analysis to benchmark our proposed methodology against both a standard baseline and existing state-of-the-art models.
First, we compared our novel feature vector construction and transformer-based classification approach against a baseline model that utilizes a traditional fully connected layer for classification. As shown in Table 6, our proposed method yields a substantial improvement across all metrics, achieving an aggregate F 1 -score of 93.9%—a 1.41% increase over the baseline’s 92.46%. This result underscores the superiority of the specialized feature integration and classification strategy.
Next, we benchmarked our model against several existing state-of-the-art methods on the VisDrone2019 dataset. As shown in Table 7, the proposed multi-level classification approach outperforms the methods of Yan et al. [9] (93.2% F 1 -score) and Zhang et al. [10] (91.4% F 1 -score), and demonstrates performance comparable to a fine-tuned YOLOv8m model (94.1% F 1 -score), establishing its competitive position within the field.
To directly address the reviewer’s request for a comparison against other methods on the UAV123 dataset, we fine-tuned several representative detectors using our standardized evaluation protocol for a fair comparison. Table 8 shows that the proposed hierarchical cascade surpasses competitive baselines on all key metrics. Notably, it outperforms a fine-tuned YOLOv8m [36], MCA-YOLOv7 [14], and DV-DETR [16], demonstrating superior performance in terms of F 1 -score, mAP@.50, and the more stringent mAP@.50:.95. This highlights the effectiveness and robust generalization of our hierarchical approach in challenging aerial scenarios not encountered during training.

3.5. Diagnostic Evaluation

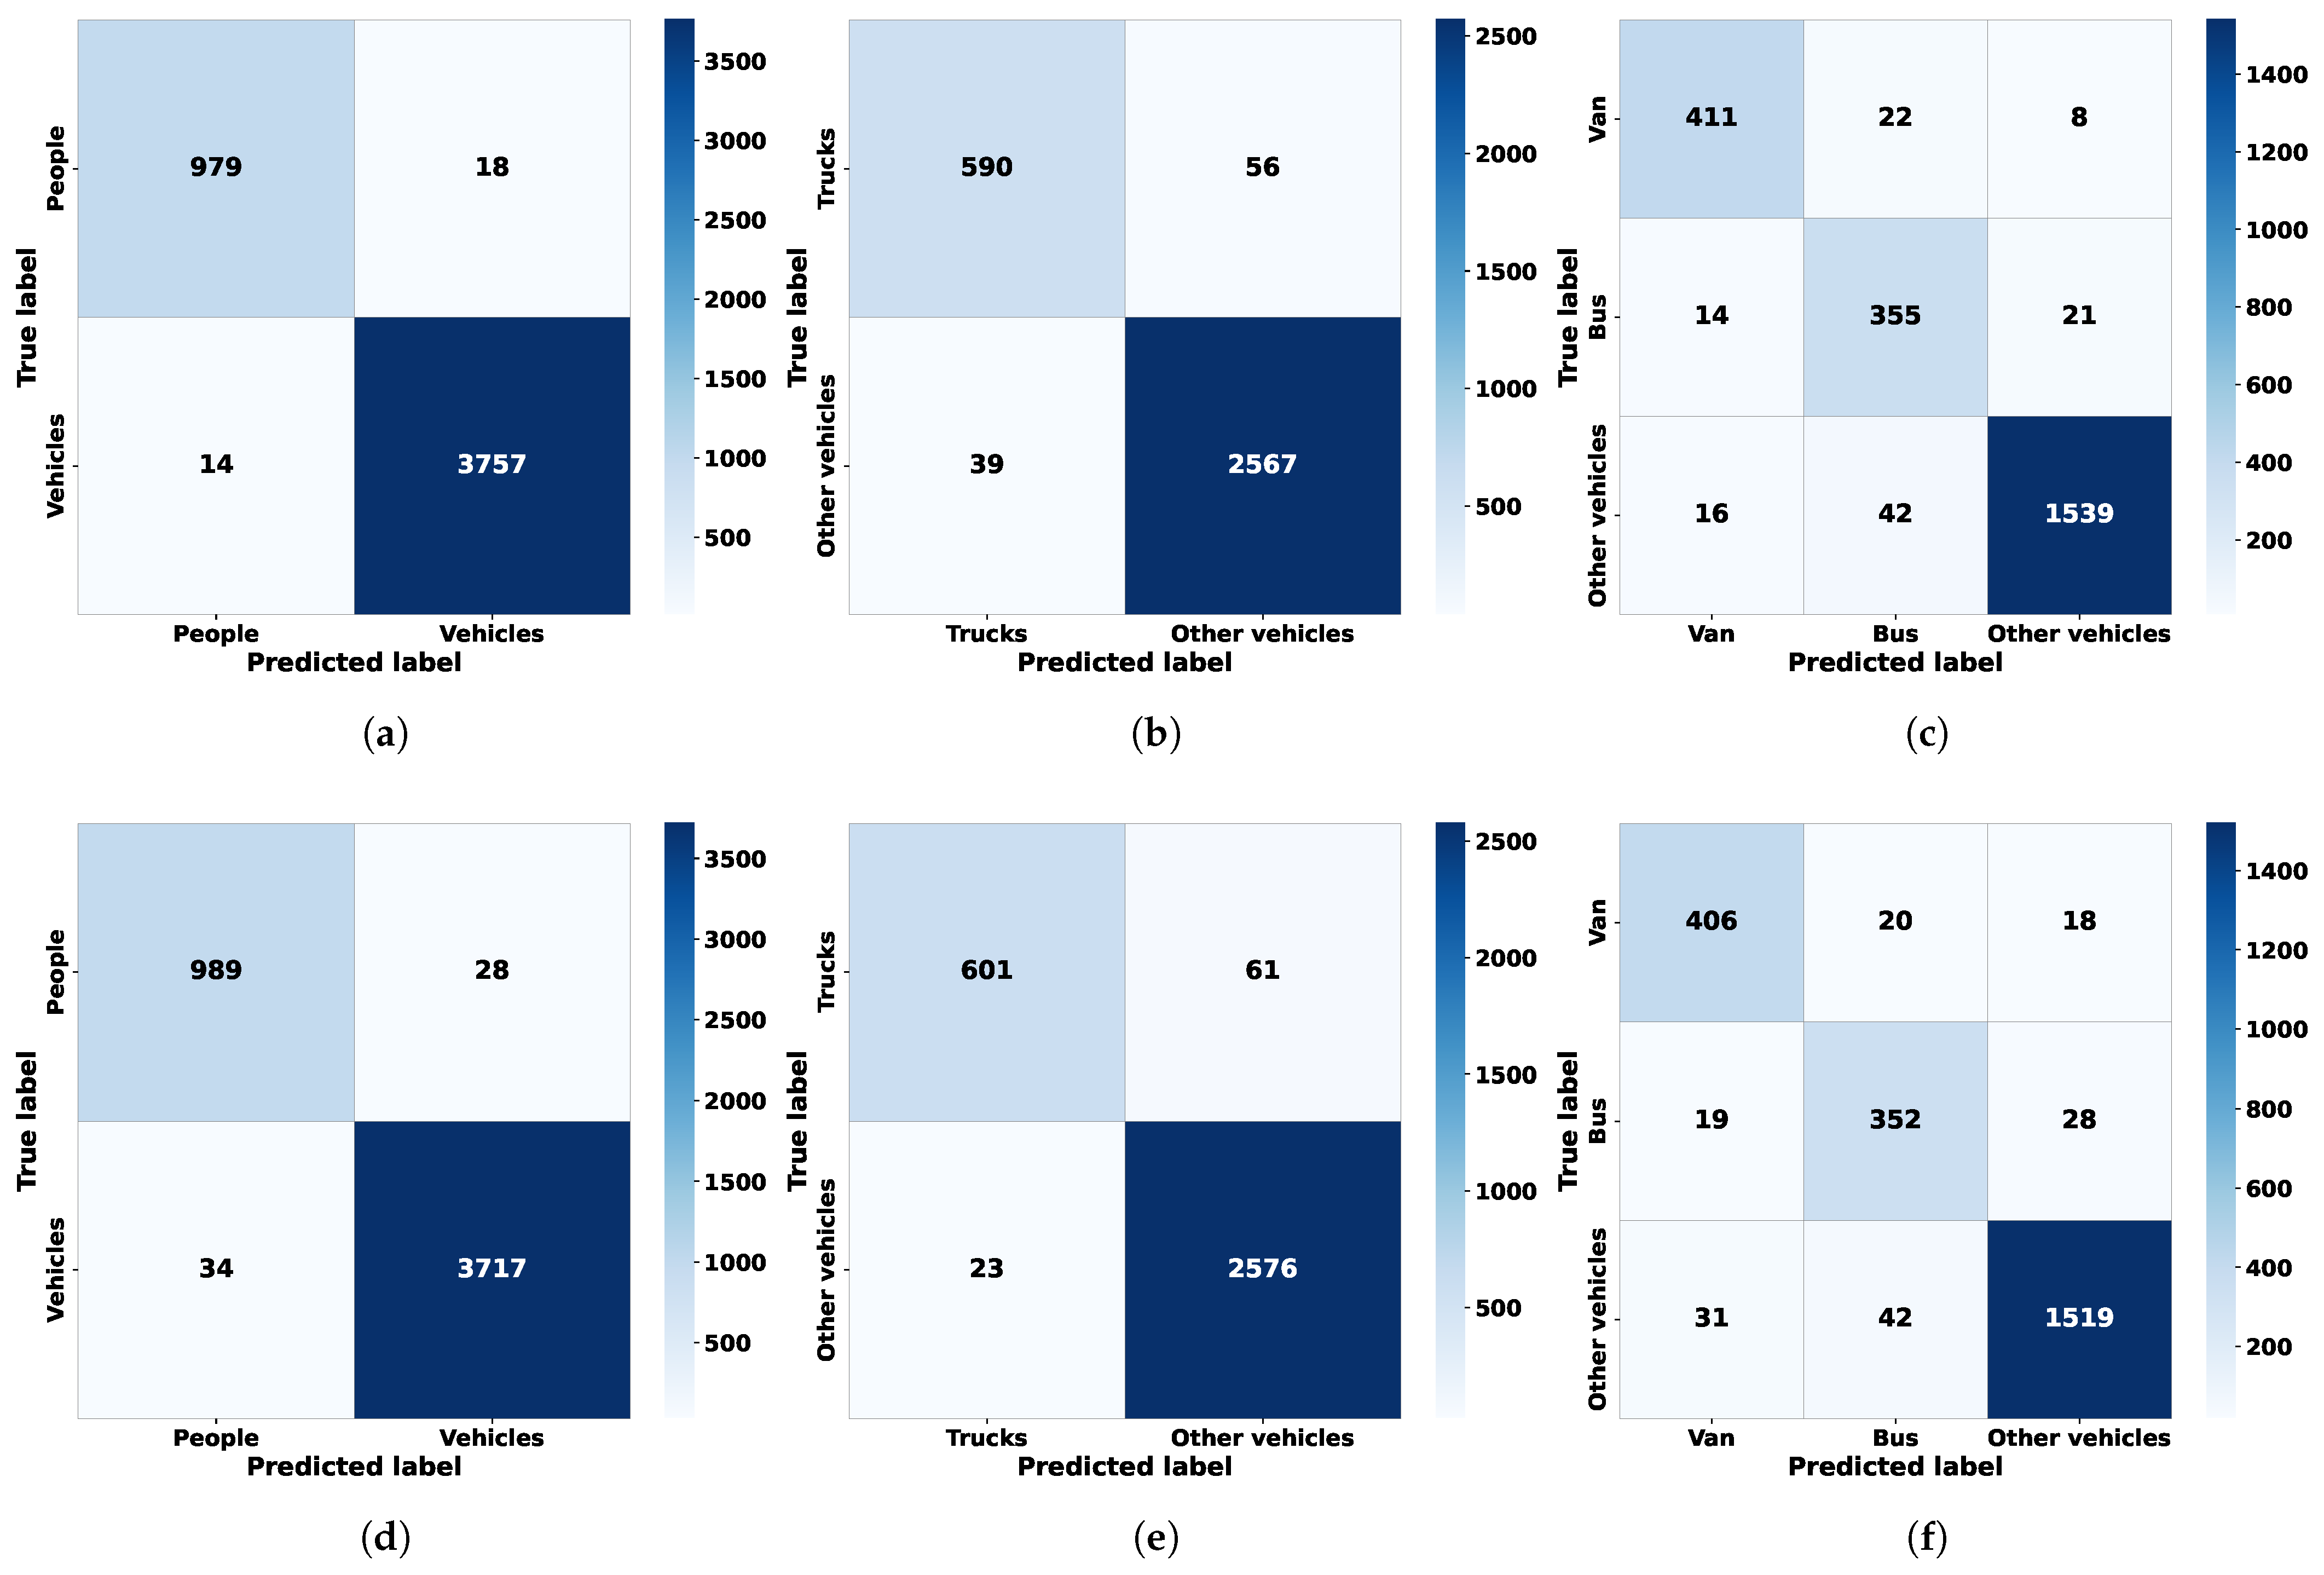
For a deeper diagnostic insight into the model’s behavior, we generated confusion matrices for each classification level, as depicted in Figure 9. These matrices, which distinguish between the performance of the baseline feature extraction models (top row) and our final classification models with the proposed FT-Transformer (bottom row), show a high concentration of True Positives along the diagonal and minimal off-diagonal values. This confirms the high discriminative power of the classifiers at each stage, with a visible improvement from using the specialized transformer-based heads.
A ROC analysis was also performed to rigorously evaluate the diagnostic ability of the models at each classification level. The resulting ROC curves, presented in Figure 10, exhibit high Area Under the Curve (AUC) values of 0.95, 0.93, and 0.96 for the three respective levels. These high AUC scores provide conclusive evidence of the models’ excellent capability to distinguish between classes at every stage of the hierarchical pipeline.
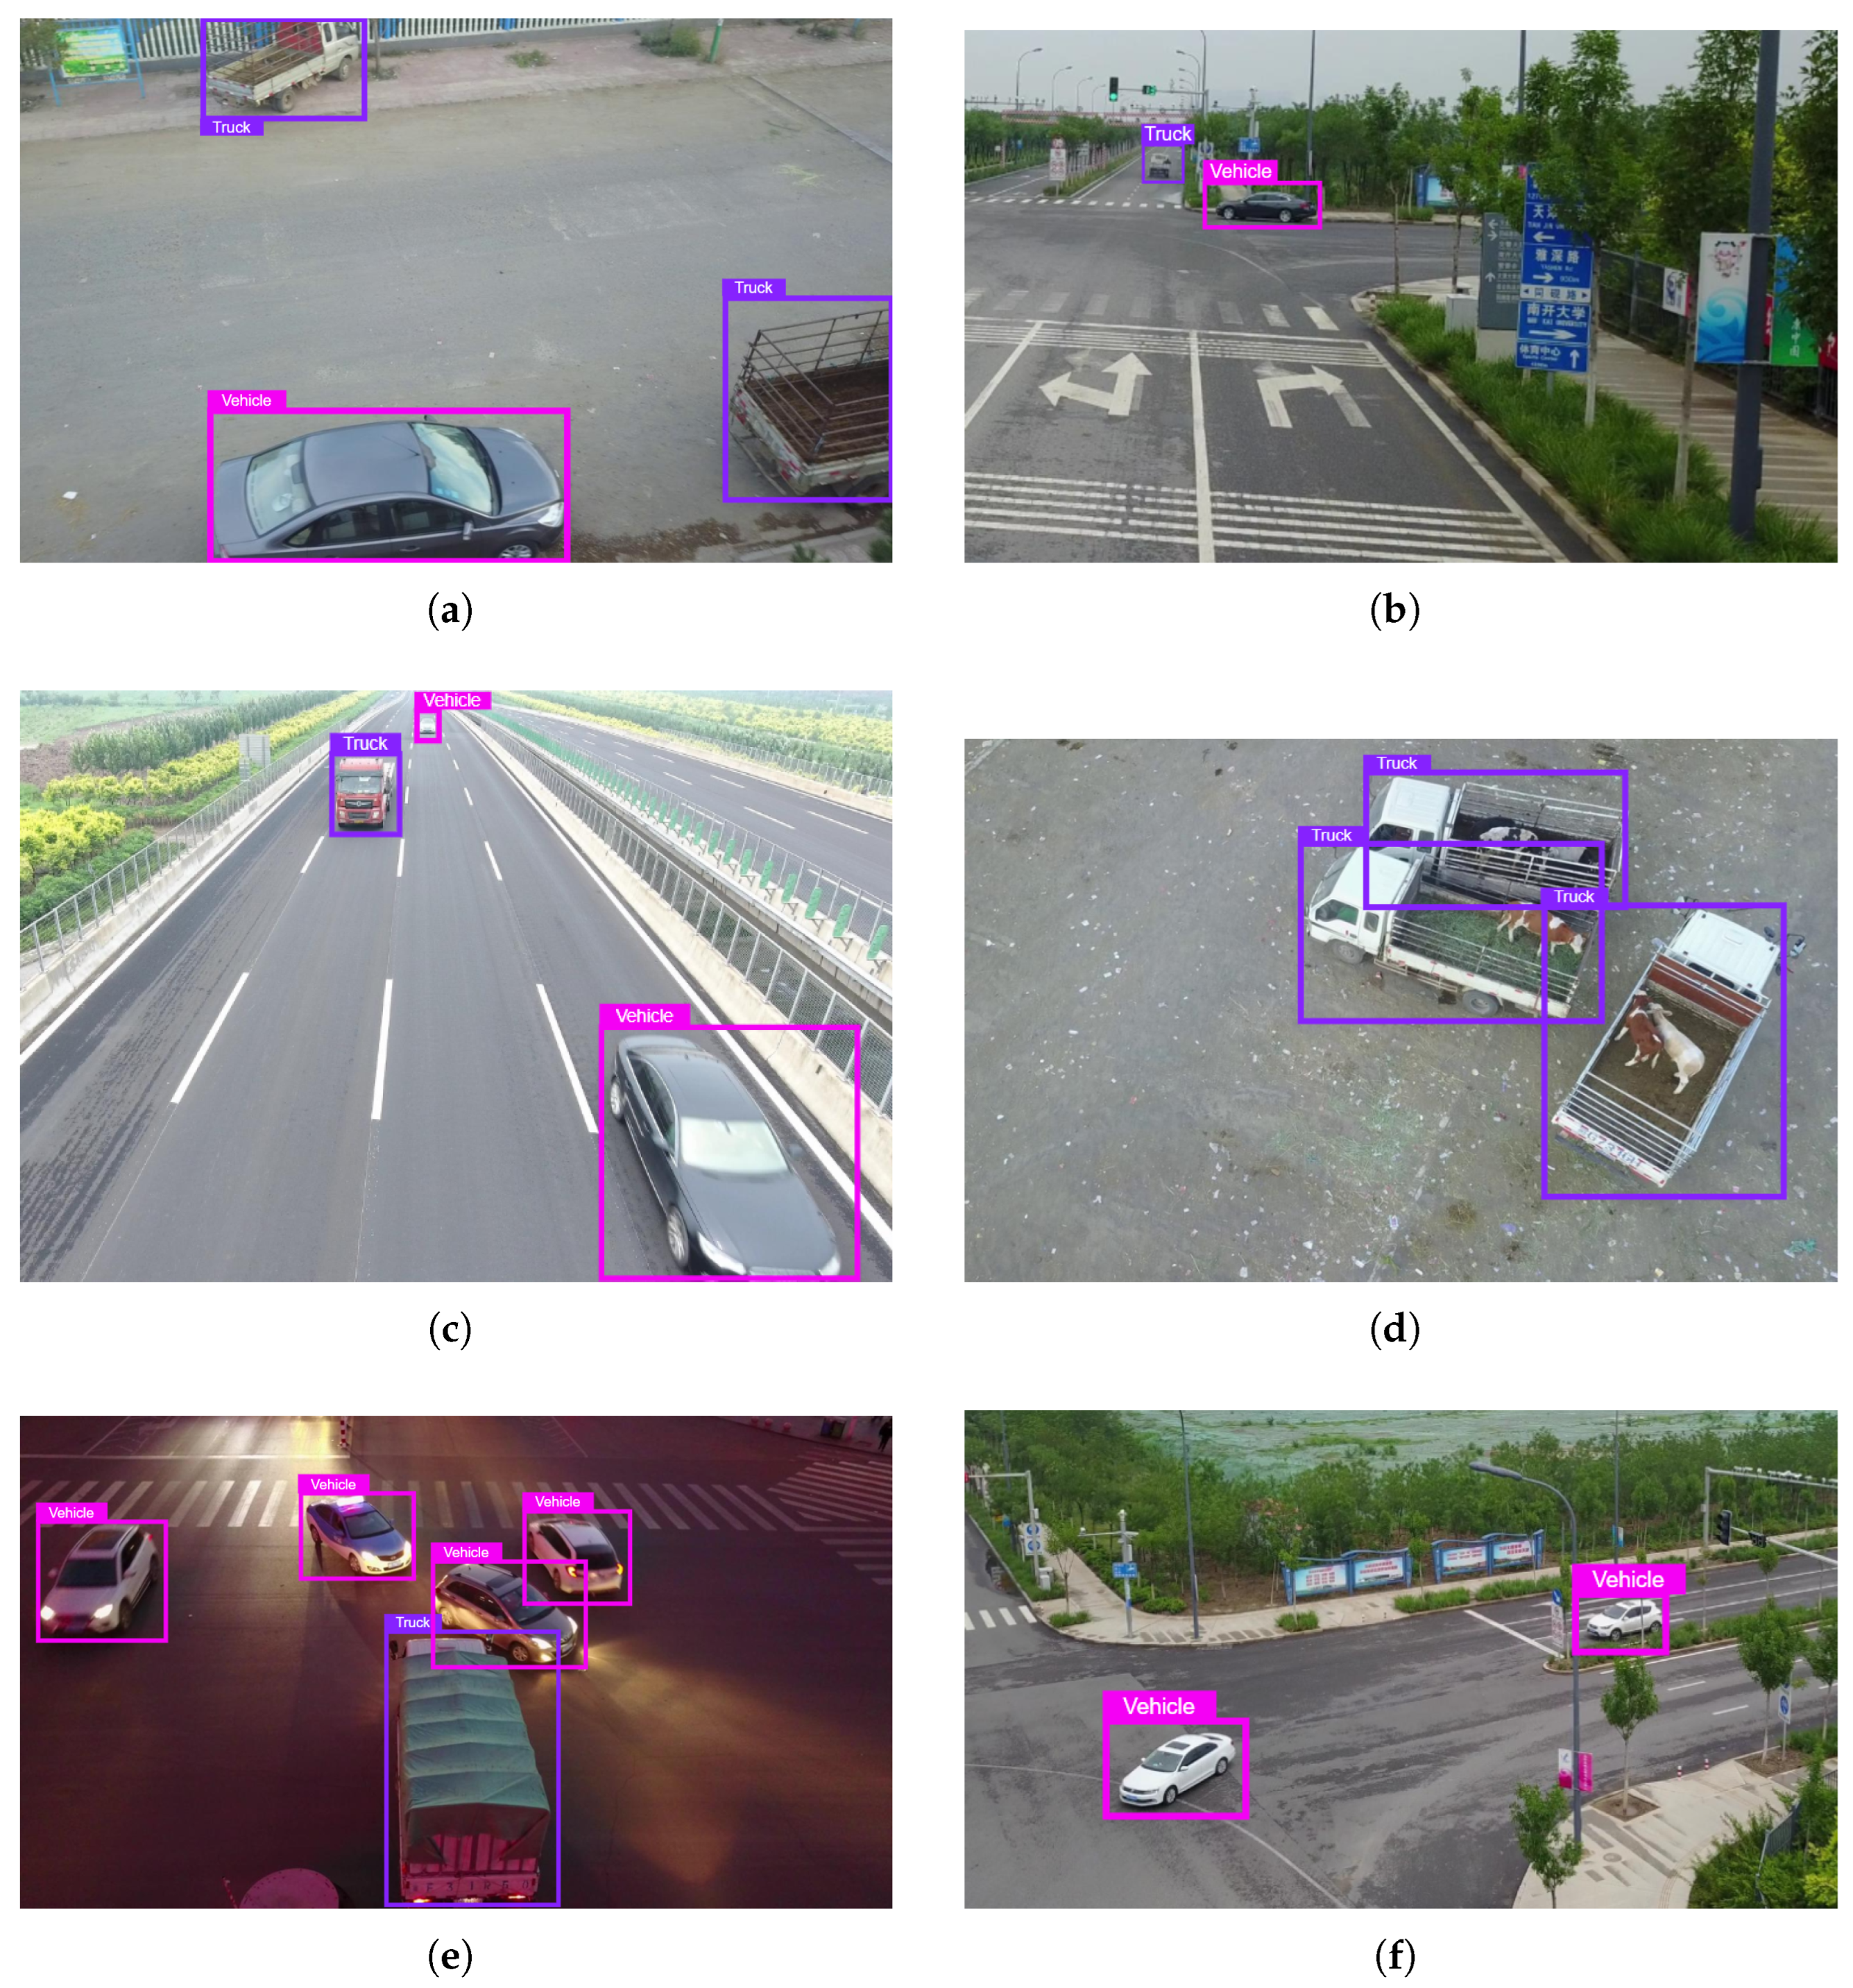
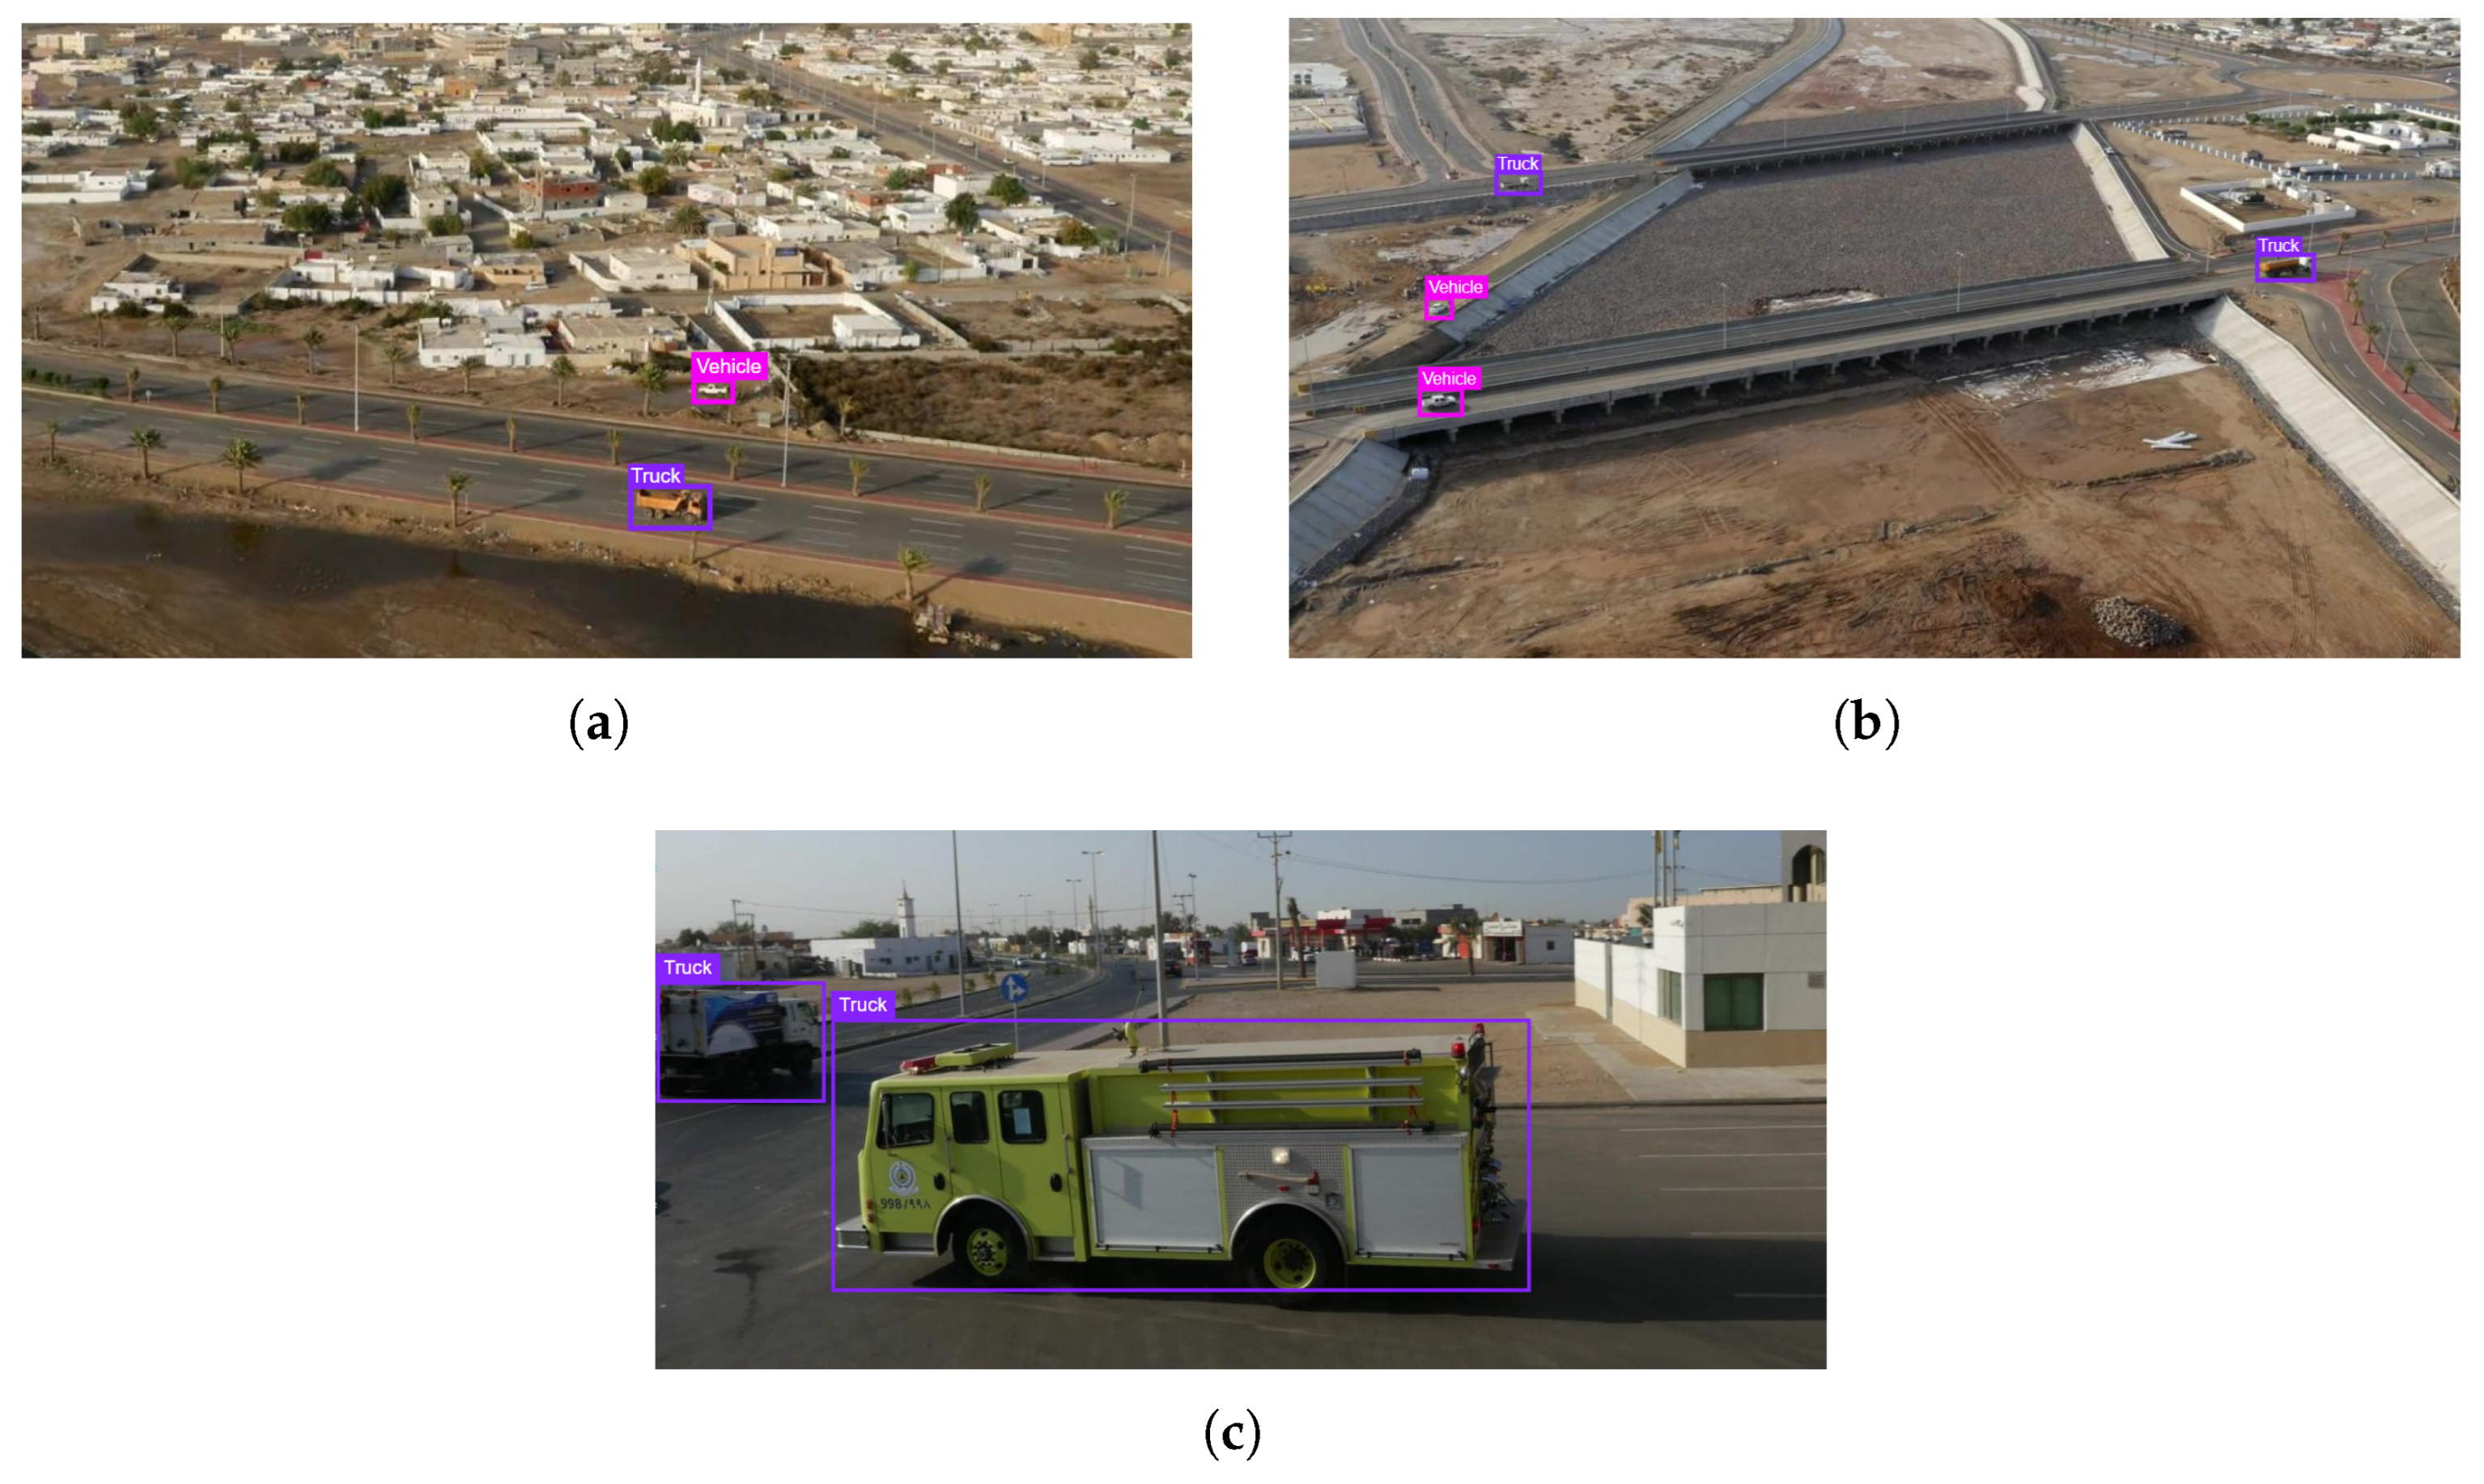
The comprehensive experimental results, validated across multiple datasets and compared against established benchmarks, consistently demonstrate the superiority, robustness, and generalizability of the proposed hierarchical deep learning model. To further enhance the intuitive understanding of these results, as suggested by the reviewer, an extensive set of qualitative examples is provided in Appendix A. Figure A3, Figure A4 and Figure A5 showcase the model’s detection capabilities on challenging, unseen images from the COCO, UAV123, and VisDrone2019 datasets, respectively. These visual results reinforce the quantitative findings, demonstrating the model’s reliability in handling varied illuminations, complex backgrounds, and diverse aerial perspectives.
Finally, an additional external validation was conducted on the publicly available FECL dataset [44] to confirm the model’s applicability to different domains, specifically non-civilian object detection. A detailed account of this testing is provided in the accompanying Supplementary Materials. The results of this validation (Supplementary Figure S1 and Table S1) confirm that the hierarchical model maintains high performance even in this distinct and complex domain, further cementing the overall conclusion of its effectiveness.

4. Discussion

This study demonstrated that a hierarchical deep learning architecture significantly improves object detection accuracy in UAV imagery. Our key finding is that the proposed model achieved an aggregate F 1 -score of 93.9%, a 1.41% improvement over a standard, non-hierarchical baseline. This result supports our primary hypothesis: a coarse-to-fine cascade is more effective at handling subtle inter-class complexities than monolithic systems. This improvement translates to a reduction of classification errors in critical applications. The model’s modular design is a core advantage, allowing each component to be optimized. As shown in Table 7, its 93.9% F 1 -score is highly competitive, outperforming several methods [9,10] and performing on par with a fine-tuned YOLOv8m (94.1%), highlighting the effectiveness of its specialized, multi-stage pipeline.
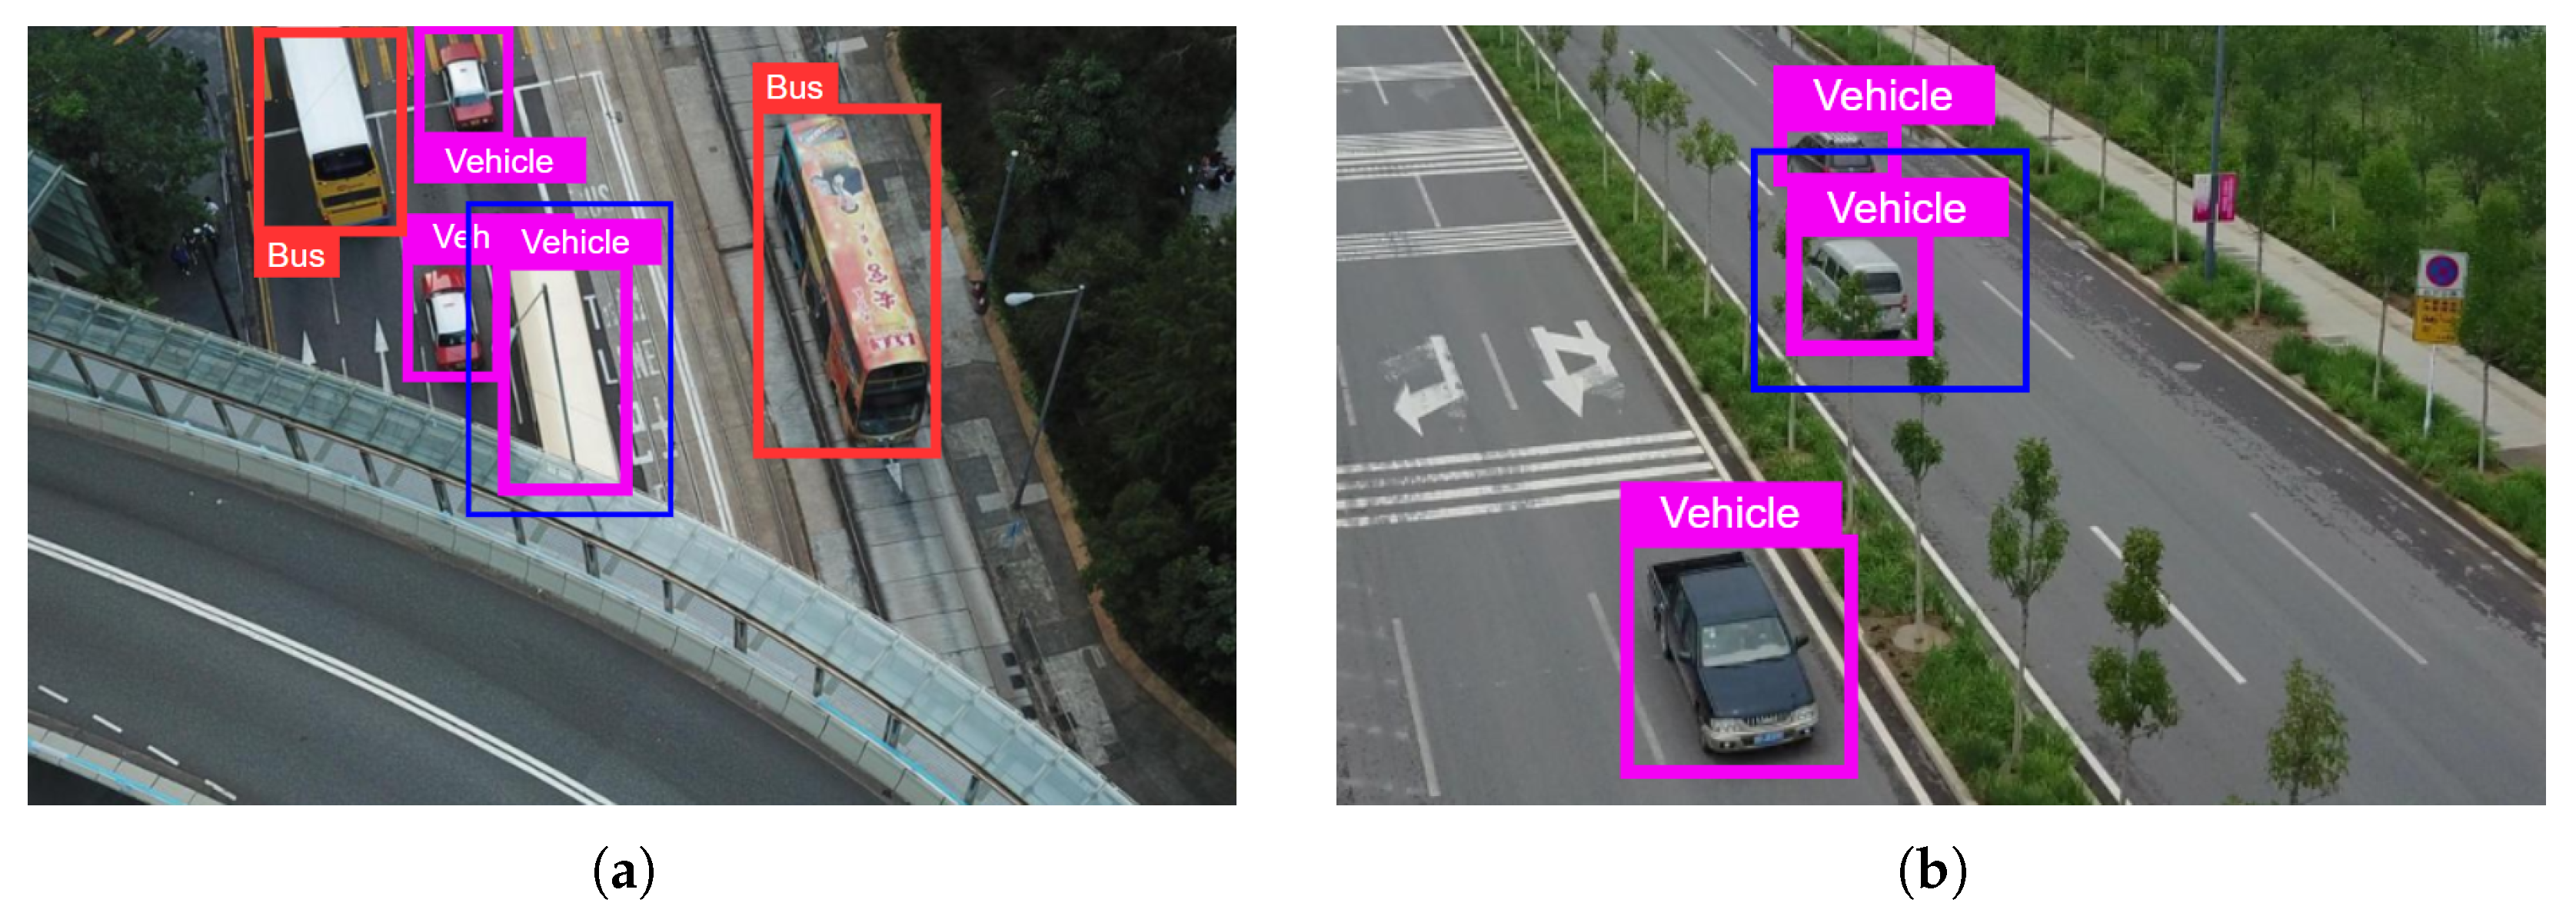
Despite these promising results, the study has limitations. The primary disadvantage is the increased computational latency inherent in a multi-stage pipeline. Benchmarking on an NVIDIA Jetson Xavier NX revealed that while a standard YOLOv8m model achieves approximately 38 FPS, our full cascade operates at around 14 FPS. This trade-off between higher accuracy and lower speed may hinder real-time deployment on resource-constrained UAVs where high frame rates are critical. Another significant challenge is the risk of error propagation; a misclassification at an early level becomes irreversible. While our high overall mAP scores suggest this issue is well managed, it remains a key consideration. The misclassifications in Figure A1 in Appendix A, added in response to reviewer feedback, suggest the model can be confused by challenging angles or partial occlusions. In contrast, the numerous correct classifications presented in Figure A2, along with the extended visual evidence in Figure A3, Figure A4 and Figure A5, reaffirm the model’s practical effectiveness and generalizability across diverse operational contexts. Furthermore, robustness to low-resolution imagery and heavy occlusion requires further investigation. Given the model’s successful application to the FECL dataset [44], it is imperative to address the ethical implications. We strongly advocate for stringent human-in-the-loop oversight in any practical deployment to ensure ethical application and accountability.
These limitations define a clear path for future research. A more rigorous analysis should involve evaluating performance on artificially degraded datasets. Future work must benchmark the model’s inference time and memory footprint against single-stage detectors to characterize the accuracy–speed trade-off. Overcoming challenges such as latency and error propagation will be critical for transitioning this technology to a reliable, field-deployable system.
Ultimately, this work highlights the potential of the hierarchical cascade paradigm as an effective strategy for advancing UAV-based object detection and offers a foundation for future research into more accurate and deployable computer vision systems.

5. Conclusions

In summary, this study presented a promising approach for addressing the challenge of accurately detecting and classifying visually similar targets in UAV imagery. We proposed and validated a hierarchical deep learning architecture that decomposes a complex multi-class problem into a sequence of manageable, fine-grained classification stages. This architecture integrates a high-recall Faster R-CNN, specialized YOLO-based models, and a sophisticated FT-Transformer, creating a coarse-to-fine pipeline designed to resolve inter-class ambiguity. Our experimental evaluation produced compelling evidence of the model’s efficacy. The architecture achieved an aggregate F 1 -score of 93.9%, a 1.41% improvement over a traditional, non-hierarchical baseline, and demonstrated competitive performance against several other existing methods. This result suggests that our hierarchical method is a competitive alternative to monolithic models for this task.
However, the study also identified key limitations. The primary challenges include the computational latency introduced by the multi-stage pipeline and the inherent risk of cascading errors. These factors currently represent a trade-off between accuracy and real-time performance, a crucial consideration for deployment on resource-constrained UAV platforms.
Future work will focus on mitigating these issues through optimization techniques like quantization and knowledge distillation, as well as exploring uncertainty-handling mechanisms. Further investigation is also required to validate performance against real-world environmental challenges.

Supplementary Materials

The following supporting information can be downloaded at https://www.mdpi.com/article/10.3390/drones9110743/s1, File Supplementary Material: Validation of the hierarchical model on the non-civilian FECL dataset, including experimental setup, methodology, qualitative results (Figure S1), and detailed performance metrics (Table S1) demonstrating the model’s generalizability.

Author Contributions

Conceptualization, D.B. and O.B.; methodology, D.B., O.B. and I.K.; software, D.B. and P.R.; validation, D.B., O.B. and P.R.; formal analysis, O.B., P.R. and I.K.; investigation, D.B.; resources, O.B. and I.K.; data curation, D.B. and P.R.; writing—original draft preparation, D.B. and O.B.; writing—review and editing, P.R. and I.K.; visualization, D.B. and P.R.; supervision, I.K.; project administration, O.B. All authors have read and agreed to the published version of the manuscript.

Funding

This research received no external funding.

Data Availability Statement

Publicly available datasets were analyzed in this study. This data can be found in the GitHub repository: https://github.com/DmytroBorovykKhnu/Target-detection (accessed on 12 October 2025).

Conflicts of Interest

The authors declare no conflicts of interest.

Abbreviations

The following abbreviations are used in this manuscript:
AUCArea Under the Curve
CNNConvolutional Neural Network
F 1 -scoreHarmonic Mean of Precision and Recall
Faster R-CNNFaster Region-based CNN
FT-TransformerFeature-Tabular Transformer
IoUIntersection over Union
mAPmean Average Precision
PCAPrincipal Component Analysis
ROCReceiver Operating Characteristic
ROIRegion of Interest
RPNRegion Proposal Network
SDStandard Deviation
UAVUnmanned Aerial Vehicle(s)
UAV123UAV Tracking Benchmark Dataset
ViTVision Transformer
YOLOYou Only Look Once

Appendix A. Visual Analysis of Model Performance

This appendix provides a detailed visual analysis of the model’s performance. It includes examples of misclassifications to highlight current limitations (Figure A1), as well as a comprehensive set of successful detections across various challenging datasets and scenarios to demonstrate the model’s overall robustness and generalizability (Figure A2, Figure A3, Figure A4 and Figure A5). The additional qualitative results in Figure A3, Figure A4 and Figure A5 were included in response to reviewer feedback to offer a more intuitive understanding of the model’s capabilities in real-world conditions.
Figure A1. Examples of misclassification under challenging conditions. Bounding boxes are color-coded by class: “Bus” (red) and “Vehicle” (purple). A blue frame is used to highlight the final misclassified object. (a) A bus is misclassified as “Other Vehicle” from an ambiguous viewing angle. (b) A van is mislabeled as “Other Vehicle,” demonstrating challenges with high intra-class similarity.
Drones 09 00743 g0a1
Figure A2. Examples of correct object classification in diverse scenarios. Bounding boxes are color-coded by class: “Truck” (violet) and “Vehicle” (purple). The model demonstrates reliability in (a) mixed urban scenes, (b) standard road environments with complex signage, (c) high-altitude highway views, (d) scenes with partial occlusion, (e) low-light night conditions, and (f) oblique aerial angles.
Drones 09 00743 g0a2
Figure A3. Examples of model performance on the unseen COCO dataset. Bounding boxes are color-coded by predicted class: “Person” (blue), “Bus” (red), “Truck” (violet), and “Vehicle” (purple). The model performs reliably in (a) a clear rural setting, (b) a cluttered urban street with pedestrians and vehicles, and (c) a challenging low-light night scene, confirming strong generalization.
Drones 09 00743 g0a3
Figure A4. Qualitative results on the UAV123 aerial tracking benchmark. Bounding boxes are color-coded by class: “Truck” (violet) and “Vehicle” (purple). The model showcases proficiency in handling diverse aerial viewpoints and scales, including (a) a high-altitude view of highway traffic, (b) an oblique perspective of a complex intersection, and (c) accurate low-altitude classification of specialized vehicles like fire trucks, which differ from typical training examples.
Drones 09 00743 g0a4
Figure A5. Additional qualitative results from the VisDrone2019 dataset in dense scenarios. Bounding boxes are color-coded by class: “Person” (blue), “Bus” (red), “Truck” (violet), and “Vehicle” (purple). These examples highlight the model’s effectiveness in (a) a top-down view with multiple pedestrians, (b) a high-altitude view of dense traffic, (c) scenes with significant vertical occlusion, and (d) a parking lot with varied vehicle orientations.
Drones 09 00743 g0a5aDrones 09 00743 g0a5b

References

  1. Endsley, M.R.; Jones, D.G. Designing for Situation Awareness: An Approach to User-Centered Design, 3rd ed.; CRC Press: Boca Raton, FL, USA, 2016. [Google Scholar] [CrossRef]
  2. Melnychenko, O.; Scislo, L.; Savenko, O.; Sachenko, A.; Radiuk, P. Intelligent integrated system for fruit detection using multi-UAV imaging and deep learning. Sensors 2024, 24, 1913. [Google Scholar] [CrossRef] [PubMed]
  3. Tang, G.; Ni, J.; Zhao, Y.; Gu, Y.; Cao, W. A survey of object detection for UAVs based on deep learning. Remote Sens. 2024, 16, 149. [Google Scholar] [CrossRef]
  4. Svystun, S.; Scislo, L.; Pawlik, M.; Melnychenko, O.; Radiuk, P.; Savenko, O.; Sachenko, A. DyTAM: Accelerating wind turbine inspections with dynamic UAV trajectory adaptation. Energies 2025, 18, 1823. [Google Scholar] [CrossRef]
  5. Svystun, S.; Melnychenko, O.; Radiuk, P.; Savenko, O.; Sachenko, A.; Lysyi, A. Dynamic trajectory adaptation for efficient UAV inspections of wind energy units. In Proceedings of the 2024 14th International Conference on Dependable Systems, Services and Technologies (DESSERT), Greece, Athens, 11–13 October 2024; pp. 1–7. [Google Scholar] [CrossRef]
  6. Radiuk, P.; Barmak, O.; Manziuk, E.; Krak, I. Explainable deep learning: A visual analytics approach with transition matrices. Mathematics 2024, 12, 1024. [Google Scholar] [CrossRef]
  7. Jiang, Z.; Shi, D.; Zhang, S. FRSE-Net: Low-illumination object detection network based on feature representation refinement and semantic-aware enhancement. Vis. Comput. 2023, 40, 3233–3247. [Google Scholar] [CrossRef]
  8. Yan, X.; Du, J.; Li, X.; Wang, X.; Sun, X.; Li, P.; Zheng, H. A hierarchical feature fusion and dynamic collaboration framework for robust small target detection. IEEE Access 2025, 13, 92953–92964. [Google Scholar] [CrossRef]
  9. Yan, D.; Li, G.; Li, X.; Wang, S. An improved faster R-CNN method to detect tailings ponds from high-resolution remote sensing images. Remote Sens. 2021, 13, 2052. [Google Scholar] [CrossRef]
  10. Zhang, J.; Tang, Y.; Qian, J.; He, Y. HR-YOLOv8: A crop growth status object detection method based on YOLOv8. Electronics 2024, 13, 1620. [Google Scholar] [CrossRef]
  11. Cui, G.; Zhang, L. Improved faster region convolutional neural network algorithm for UAV target detection in complex environment. Results Eng. 2024, 23, 102487. [Google Scholar] [CrossRef]
  12. Zhu, P.; Wen, L.; Du, D.; Bian, X.; Fan, H.; Hu, Q.; Ling, H. Detection and tracking meet drones challenge. IEEE Trans. Pattern Anal. Mach. Intell. 2021, 44, 7380–7399. [Google Scholar] [CrossRef]
  13. Zhang, H.; Sun, W.; Sun, C.; He, R.; Zhang, Y. HSP-YOLOv8: UAV aerial photography small target detection algorithm. Drones 2024, 8, 453. [Google Scholar] [CrossRef]
  14. Qin, Z.; Chen, D.; Wang, H. MCA-YOLOv7: An improved UAV target detection algorithm based on YOLOv7. IEEE Access 2024, 12, 42642–42650. [Google Scholar] [CrossRef]
  15. Guo, J.; Liu, X.; Bi, L.; Liu, H.; Lou, H. UN-YOLOv5s: A UAV-based aerial photography detection algorithm. Sensors 2023, 23, 5907. [Google Scholar] [CrossRef]
  16. Wei, X.; Yin, L.; Zhang, L.; Wu, F. DV-DETR: Improved UAV aerial small target detection algorithm based on RT-DETR. Sensors 2024, 24, 7376. [Google Scholar] [CrossRef]
  17. Luo, X.; Wu, Y.; Wang, F. Target detection method of UAV aerial imagery based on improved YOLOv5. Remote Sens. 2022, 14, 5063. [Google Scholar] [CrossRef]
  18. Rahman, M.H.; Sejan, M.A.S.; Aziz, M.A.; Shamshirband, S.; Almogren, A.; Dellacasa, C.; Al-zahrani, A.A.; Daponte, P. A comprehensive survey of unmanned aerial vehicles detection and classification using machine learning approach: Challenges, solutions, and future directions. Remote Sens. 2024, 16, 879. [Google Scholar] [CrossRef]
  19. Mo, Y.; Huang, J.; Qian, G. Deep learning approach to UAV detection and classification by using compressively sensed RF signal. Sensors 2022, 22, 3072. [Google Scholar] [CrossRef] [PubMed]
  20. Zhang, C.; Zhang, L.; Zhang, B.Y.J.; Sun, J.; Dong, S.; Wang, X.; Li, Y.; Xu, J.; Chu, W.; Dong, Y.; et al. Land cover classification in a mixed forest-grassland ecosystem using LResU-net and UAV imagery. J. For. Res. 2022, 33, 923–936. [Google Scholar] [CrossRef]
  21. Lu, T.; Wan, L.; Qi, S.; Gao, M. Land cover classification of UAV remote sensing based on transformer-CNN hybrid architecture. Sensors 2023, 23, 5288. [Google Scholar] [CrossRef] [PubMed]
  22. Munawar, H.S.; Ullah, F.; Qayyum, S.; Heravi, A. Application of deep learning on UAV-based aerial images for flood detection. Smart Cities 2021, 4, 1220–1243. [Google Scholar] [CrossRef]
  23. Teixeira, I.; Morais, R.; Sousa, J.J.; Cunha, A. Deep learning models for the classification of crops in aerial imagery: A review. Agriculture 2023, 13, 965. [Google Scholar] [CrossRef]
  24. Pierdicca, R.; Nepi, L.; Mancini, A.; Malinverni, E.S.; Balestra, M. UAV4TREE: Deep learning-based system for automatic classification of tree species using RGB optical images obtained by an unmanned aerial vehicle. Int. Ann. Photogramm. Remote Sens. Spat. Inf. Sci. 2023, X-1/W1-2023, 1089–1096. [Google Scholar] [CrossRef]
  25. Tahir, N.U.A.; Zhang, Z.; Asim, M.; Iftikhar, S.; Abd El-Latif, A.A. PVDM-YOLOv8l: A solution for reliable pedestrian and vehicle detection in autonomous vehicles under adverse weather conditions. Multimed. Tools Appl. 2025, 84, 27045–27070. [Google Scholar] [CrossRef]
  26. Al-Qubaydhi, N.; Alenezi, A.; Alanazi, T.; Senyor, A.; Alanezi, N.; Alotaibi, B.; Alotaibi, M.; Razaque, A.; Hariri, S. Deep learning for unmanned aerial vehicles detection: A review. Comput. Sci. Rev. 2024, 51, 100614. [Google Scholar] [CrossRef]
  27. Dosovitskiy, A.; Beyer, L.; Kolesnikov, A.; Weissenborn, D.; Zhai, X.; Unterthiner, T.; Dehghani, M.; Minderer, M.; Heigold, G.; Gelly, S.; et al. An image is worth 16×16 words: Transformers for image recognition at scale. In Proceedings of the International Conference on Learning Representations (ICLR), Virtual Event, Austria, 3–7 May 2021; Available online: https://openreview.net/forum?id=YicbFdNTTy (accessed on 12 October 2025).
  28. Touvron, H.; Cord, M.; Douze, M.; Massa, F.; Sablayrolles, A.; Jégou, H. Training data-efficient image transformers & distillation through attention. In Proceedings of the 38th International Conference on Machine Learning (ICML), Virtual Event, 18–24 July 2021; Volume 139, pp. 10347–10357. Available online: http://proceedings.mlr.press/v139/touvron21a.html (accessed on 12 October 2025).
  29. Jaegle, A.; Gimeno, F.; Brock, A.; Zisserman, A.; Vinyals, O.; Carreira, J. Perceiver: General perception with iterative attention. In Proceedings of the 38th International Conference on Machine Learning (ICML), Virtual Event, 18–24 July 2021; Volume 139, pp. 4651–4664. Available online: http://proceedings.mlr.press/v139/jaegle21a.html (accessed on 12 October 2025).
  30. Huang, X.; Khetan, A.; Cvitkovic, M.; Karnin, Z. TabTransformer: Tabular data modeling using contextual embeddings. arXiv 2020, arXiv:2012.06678. [Google Scholar] [CrossRef]
  31. Liu, Z.; Lin, Y.; Cao, Y.; Hu, H.; Wei, Y.; Zhang, Z.; Lin, S.; Guo, B. Swin transformer: Hierarchical vision transformer using shifted windows. In Proceedings of the IEEE/CVF International Conference on Computer Vision (ICCV), Montreal, QC, Canada, 10–17 October 2021; pp. 10012–10022. [Google Scholar] [CrossRef]
  32. Wang, W.; Xie, E.; Li, X.; Chang, D.P.; Wang, X.; Lu, T.; Luo, P. Pyramid vision transformer: A versatile backbone for dense prediction without convolutions. In Proceedings of the IEEE/CVF International Conference on Computer Vision (ICCV), Montreal, QC, Canada, 10–17 October 2021; pp. 548–558. [Google Scholar] [CrossRef]
  33. Zhao, X.; Zhang, W.; Xia, Y.; Wang, Z.; Su, Y.; Zhang, H. G-YOLO: A lightweight infrared aerial remote sensing target detection model for UAVs based on YOLOv8. Drones 2024, 8, 495. [Google Scholar] [CrossRef]
  34. Du, X.; Song, L.; Lv, Y.; Qiu, S. A lightweight military target detection algorithm based on improved YOLOv5. Electronics 2022, 11, 3263. [Google Scholar] [CrossRef]
  35. Yan, H.; Yang, M.; Zhao, Q.; Wang, X.; Shi, H. Implementation of a modified Faster R-CNN for target detection technology of coastal defense radar. Remote Sens. 2021, 13, 1703. [Google Scholar] [CrossRef]
  36. Jocher, G.; Chaurasia, A.; Qiu, J. YOLO by Ultralytics (Version 8.3.196). GitHub Repository. 2025. Available online: https://github.com/ultralytics/ultralytics/releases/tag/v8.3.196 (accessed on 12 October 2025).
  37. Dai, H.; Wu, S.; Zhao, H.; Huang, J.; Jian, Z.; Zhu, Y.; Hu, H.; Chen, Z. FT-Transformer: Resilient and reliable transformer with end-to-end fault tolerant attention. arXiv 2025, arXiv:2504.02211. [Google Scholar] [CrossRef]
  38. Yan, Z.; Zhang, H.; Piramuthu, R.; Jagadeesh, V.; DeCoste, D.; Di, W.; Yu, Y. HD-CNN: Hierarchical deep convolutional neural networks for large scale visual recognition. In Proceedings of the IEEE International Conference on Computer Vision (ICCV), Santiago, Chile, 7–13 December 2015; pp. 2740–2748. [Google Scholar] [CrossRef]
  39. Huang, H.; Xu, K. Combing triple-part features of convolutional neural networks for scene classification in remote sensing. Remote Sens. 2019, 11, 1687. [Google Scholar] [CrossRef]
  40. Tariku, G.; Ghiglieno, I.; Simonetto, A.; Gentilin, F.; Armiraglio, S.; Gilioli, G.; Serina, I. Advanced image preprocessing and integrated modeling for UAV plant image classification. Drones 2024, 8, 645. [Google Scholar] [CrossRef]
  41. Pearson, K. On lines and planes of closest fit to systems of points in space. Lond. Edinb. Dublin Philos. Mag. J. Sci. 1901, 2, 559–572. [Google Scholar] [CrossRef]
  42. Lin, T.Y.; Maire, M.; Belongie, S.; Hays, J.; Perona, P.; Ramanan, D.; Dollàr, P.; Zitnick, C.L. Microsoft COCO: Common objects in context. In Proceedings of the Computer Vision—ECCV 2014; Fleet, D., Pajdla, T., Schiele, B., Tuytelaars, T., Eds.; Springer International Publishing: Cham, Switzweland, 2014; pp. 740–755. [Google Scholar] [CrossRef]
  43. Mueller, M.; Smith, N.; Ghanem, B. A benchmark and simulator for UAV tracking. In Computer Vision—ECCV 2016: 14th European Conference, Amsterdam, The Netherlands, 11–14 October 2016, Proceedings, Part VIII; Leibe, B., Matas, J., Sebe, N., Welling, M., Eds.; Springer Nature: Cham, Switzerland, 2016; pp. 445–461. [Google Scholar] [CrossRef]
  44. FECL Dataset. Roboflow Universe Dataset. 2025. Available online: https://universe.roboflow.com/mvddetection/mv_detection-fecl (accessed on 12 October 2025).
  45. Bradski, G. The OpenCV library. Dr. Dobb’s J. Softw. Tools Prof. Program. 2000, 25, 120–125. [Google Scholar]
  46. Python 3.10.0 Documentation. Official Software Documentation. 2021. Available online: https://docs.python.org/release/3.10.0/ (accessed on 12 October 2025).
  47. Paszke, A.; Gross, S.; Massa, F.; Lerer, A.; Bradbury, J.; Chanan, G.; Killeen, T.; Lin, Z.; Gimelshein, N.; Antiga, L.; et al. PyTorch: An imperative style, high-performance deep learning library. In Advances in Neural Information Processing Systems 32; Wallach, H., Larochelle, H., Beygelzimer, A., d’Alché-Buc, F., Fox, E., Garnett, R., Eds.; Curran Associates, Inc.: Red Hook, NY, USA, 2019; pp. 8026–8037. Available online: https://dl.acm.org/doi/10.5555/3454287.3455008 (accessed on 12 October 2025).
  48. CUDA Toolkit Documentation, Version 12.3.2. Official Software Documentation. 2024. Available online: https://docs.nvidia.com/cuda/archive/12.3.2/ (accessed on 12 October 2025).
  49. TorchVision v0.20.1: Datasets, Transforms and Pretrained Models. Official Software Documentation. 2024. Available online: https://pytorch.org/vision/stable/ (accessed on 12 October 2025).
  50. Pedregosa, F.; Varoquaux, G.; Gramfort, A.; Michel, V.; Thirion, B.; Grisel, O.; Blondel, M.; Prettenhofer, P.; Weiss, R.; Dubourg, V.; et al. Scikit-learn: Machine learning in Python. J. Mach. Learn. Res. 2011, 12, 2825–2830. Available online: http://www.jmlr.org/papers/volume12/pedregosa11a/pedregosa11a.pdf (accessed on 12 October 2025).
  51. Wolf, T.; Debut, L.; Sanh, V.; Chaumond, J.; Delangue, C.; Moi, A.; Cistac, P.; Rault, T.; Louf, R.; Funtowicz, M.; et al. Transformers: State-of-the-art natural language processing. In Proceedings of the 2020 Conference on Empirical Methods in Natural Language Processing: System Demonstrations, Online, 16–20 November 2020; pp. 38–45. [Google Scholar] [CrossRef]
Figure 1. Conceptual diagram of the proposed two-phase hierarchical classification approach. In Phase 1 (Training), specialized datasets are prepared from UAV imagery to train the cascade. In Phase 2 (Inference), an initial detection model identifies Regions of Interest (ROIs), which are then fed into the multi-level classifier. This classifier operates as a coarse-to-fine cascade, where each level uses a dedicated feature map model and a classification model to progressively refine the object’s identity.
Drones 09 00743 g001
Figure 2. Modular data processing at a single classification level. A detected ROI is processed by a feature map model (e.g., YOLO) to create a feature vector. This vector is then classified by a separate Classification Model (e.g., FT-Transformer). This dual-model design decouples feature extraction from classification for optimized performance.
Drones 09 00743 g002
Figure 3. The structured training workflow for each classification level. First, a feature map model is trained on a labeled image dataset. This model then generates a new dataset of feature vectors, which is subsequently used to train a separate, specialized classification model, ensuring both components are optimally tuned.
Drones 09 00743 g003
Figure 4. The end-to-end inference pipeline. An initial detection model (Faster R-CNN) identifies all potential ROIs. Each ROI is then sequentially processed through the multi-level cascade, where its classification is progressively refined from general to specific, resulting in a final, accurately labeled object.
Drones 09 00743 g004
Figure 5. An example of the three-level classification hierarchy, which follows a coarse-to-fine decision-tree structure. Level 1 separates objects into “Human” or “Vehicle,” focusing on the maximum inter-class distance. Level 2 refines the most populous class, “Vehicle,” into “Truck” or “Other Vehicle.” Level 3 further classifies “Other Vehicle” into “Van,” “Bus,” or “Other,” achieving granular identification.
Drones 09 00743 g005
Figure 6. The specific deep learning models used in the three-level architecture. A Faster R-CNN model performs initial detection. Specialized YOLO models (YOLOv11m and YOLOv11s) then serve as feature extractors for subsequent levels. Finally, dedicated FT-Transformer models perform the classification at each stage, ensuring high accuracy.
Drones 09 00743 g006
Figure 7. Visualization of feature vector separation using PCA for the optimal merging strategy at each classification level. (a) At the first level (Person vs. Vehicle), the concatenation of the last and penultimate layer vectors provides clear separation. (b) At the second level (Truck vs. Other Vehicle), combining the final layer with contour features is most effective. (c) At the third level (Van vs. Bus vs. Other Vehicle), the same strategy as the second level yields the best class distinction.
Drones 09 00743 g007
Figure 8. Qualitative classification results illustrating the multi-level refinement process. (a) At Level 1, the model performs a general classification, identifying a “Person” (blue) and “Vehicles” (pink). (b) At Level 2, the classification is refined to identify a “Truck” (violet). (c) At Level 3, the model achieves fine-grained identification of a “Van” (orange).
Drones 09 00743 g008
Figure 9. Confusion matrices for each classification level. Top row (ac) shows the performance of the baseline feature extraction models using their standard classification heads. Bottom row (df) shows the improved performance of our proposed FT-Transformer classifiers, which use the feature vectors from the corresponding models.
Drones 09 00743 g009
Figure 10. ROC curves for each classification level. The high AUC values for each level (1-layer: 0.95, 2-layer: 0.93, 3-layer: 0.96) demonstrate the excellent diagnostic ability and discriminative power of the models at each stage.
Drones 09 00743 g010
Table 1. Quantitative comparison of inter-class distances (unitless values in the PCA-reduced feature space) for various feature vector configurations across the three classification levels. The optimal distance for each level, indicating the best feature separation, is highlighted in bold.
VectorInter-Class Distances
Level 1Level 2Level 3
f n 3.901.801.58
c o n ( f n , f n 1 ) 4.201.741.64
c o n ( f n , f j ) 3.02.381.84
c o n ( f n , f n 1 , f j ) 3.672.011.78
Table 2. Detailed performance metrics (in %) for each classification level for train and test subsets (SS). The results for both training and test sets demonstrate consistently high and stable performance, with low standard deviation (SD) calculated across three independent experimental runs.
LevelSSPrecisionRecall F 1 -Score
123AvgSD123AvgSD123AvgSD
1Train95.295.595.895.50.394.694.894.194.50.494.494.794.294.40.3
Test93.594.194.594.00.594.893.393.593.81.093.293.593.993.50.4
2Train93.793.294.093.60.495.895.796.996.10.895.995.196.395.70.6
Test93.192.892.192.70.695.295.493.994.80.994.594.493.794.20.5
3Train95.994.895.395.30.697.197.396.496.90.595.996.195.095.70.7
Test94.894.194.794.50.496.596.295.095.90.993.193.994.993.91.0
Table 3. mAP scores (in %) for the complete cascaded system, evaluating performance on both training and test sets across different IoU thresholds. The results highlight the model’s high accuracy in both classification (mAP@.50) and precise object localization (mAP@.50:.95).
SubsetmAP@.50mAP@.50:.95
123AvgSD123AvgSD
Train95.195.294.594.90.484.186.885.485.41.4
Test94.594.193.794.10.483.882.383.183.00.8
Table 4. Generalization performance on the unseen COCO dataset (in %). Precision, Recall, and F 1 -score are reported per level, while mAP scores reflect the aggregate performance of the complete three-level cascade.
LevelPrecisionRecall F 1 -ScoremAP@.50mAP@.50:.95
193.293.194.0
292.894.794.2
394.294.993.793.580.1
Table 5. Generalization performance on the unseen UAV123 dataset (in %). Precision, Recall, and F 1 -score are reported per level, while mAP scores reflect the aggregate performance of the complete three-level cascade.
LevelPrecisionRecall F 1 -ScoremAP@.50mAP@.50:.95
192.892.492.9
292.192.993.1
393.193.593.092.178.4
Table 6. Comparison (in %) of the proposed feature vector construction method with the standard model. The proposed method, using a transformer-based classifier, yields significantly better results across all metrics.
MethodPrecisionRecall F 1 -Score
Proposed feature vector construction method93.7394.8393.87
Standard fully connected layer model for classification90.7392.4092.46
Table 7. Comparison (in %) of the proposed method with existing approaches on the VisDrone2019 dataset. The proposed multi-level classification approach demonstrates competitive performance against other state-of-the-art methods. Higher values are shown in bold.
MethodPrecisionRecall F 1 -Score
Yan et al. [9]94.594.093.2
Zhang et al. [10]91.491.091.4
Fine-tuned YOLOv8m [36]92.493.894.1
Our approach93.794.893.9
Table 8. Comparative performance analysis (in %) on the UAV123 dataset (test split, averaged over three runs). Baselines were re-trained with our protocol for a fair comparison. Methods are linked to Section 1.2 via citations. Higher values are shown in bold.
Method F 1 -ScoremAP@.50mAP@.50:.95
Faster R-CNN (baseline)88.786.969.2
Fine-tuned YOLOv8m [36]91.790.275.1
MCA-YOLOv7 [14]91.089.873.5
DV-DETR (RT-DETR variant) [16]90.989.474.0
Our approach93.092.178.4
Disclaimer/Publisher’s Note: The statements, opinions and data contained in all publications are solely those of the individual author(s) and contributor(s) and not of MDPI and/or the editor(s). MDPI and/or the editor(s) disclaim responsibility for any injury to people or property resulting from any ideas, methods, instructions or products referred to in the content.