Article

A Workflow for Urban Heritage Digitization: From UAV Photogrammetry to Immersive VR Interaction with Multi-Layer Evaluation

1
Faculty of Architecture, Xi’an University of Architecture and Technology Huaqing College, Xi’an 710043, China
2
Department of Civil, Environmental and Architectural Engineering, University of Padua, 35131 Padua, Italy
3
Faculty of Architecture and the Built Environment, Delft University of Technology, 2628 BL Delft, The Netherlands
*
Author to whom correspondence should be addressed.
Drones 2025, 9(10), 716; https://doi.org/10.3390/drones9100716
Submission received: 27 August 2025 / Revised: 13 October 2025 / Accepted: 14 October 2025 / Published: 16 October 2025
(This article belongs to the Special Issue Implementation of UAV Systems for Cultural Heritage)

Abstract

Highlights

What are the main findings?
  • An end-to-end workflow integrates UAV photogrammetry, LiDAR, and VR for heritage.
  • Three-layer evaluation shows focused attention, edge-anchored movement, and clearer cultural understanding.
What is the implication of the main finding?
  • UAV-enabled completeness improves both geometric fidelity and user experience in VR.
  • The workflow is affordable and transferable, supporting under-resourced heritage sites.

Abstract

Urban heritage documentation often separates 3D data acquisition from immersive interaction, limiting both accuracy and user impact. This study develops and validates an end-to-end workflow that integrates UAV photogrammetry with terrestrial LiDAR and deploys the fused model in a VR environment. Applied to Piazza Vittorio Emanuele II in Rovigo, Italy, the approach achieves centimetre-level registration, completes roofs and upper façades that ground scanning alone cannot capture, and produces stable, high-fidelity assets suitable for real-time interaction. Effectiveness is assessed through a three-layer evaluation framework encompassing vision, behavior, and cognition. Eye-tracking heatmaps and scanpaths show that attention shifts from dispersed viewing to concentrated focus on landmarks and panels. Locomotion traces reveal a transition from diffuse roaming to edge-anchored strategies, with stronger reliance on low-visibility zones for spatial judgment. Post-VR interviews confirm improved spatial comprehension, stronger recognition of cultural values, and enhanced conservation intentions. The results demonstrate that UAV-enabled completeness directly influences how users perceive, navigate, and interpret heritage spaces in VR. The workflow is cost-effective, replicable, and transferable, offering a practical model for under-resourced heritage sites. More broadly, it provides a methodological template for linking drone-based data acquisition to measurable cognitive and cultural outcomes in immersive heritage applications.

1. Introduction

Urban architectural heritage comprises historically significant structures and landscapes embedded in cities [1]. Beyond their material fabric, such places carry collective memory, shape local identity, and sustain cultural continuity [2]. As digital technologies mature, from low-cost sensing to consumer-grade immersive media, the dissemination of heritage experiences has expanded far beyond on-site visits and static documentation [3]. Yet, for dense urban sites with complex skylines and frequent occlusions, the central question is shifting from whether we can reconstruct the assets to whether our upstream measuring choices measurably improve downstream immersive experience. In this paper, unmanned aerial vehicles (UAVs) are framed as an application factor that enables access to vantage points and flexible capture strategies while shaping the quality of the datasets that later drive visibility, presence and user performance in immersive environments. We therefore treat UAVs not simply as another data source but as a mechanism that links acquisition decisions to interaction outcomes along a coherent chain from measurement to visibility and, ultimately, to behavior [4].

1.1. UAVs as an Enabler for Urban-Heritage Digitization

Over the past decade, UAVs have been extensively applied in cultural heritage documentation with UAV photogrammetry delivering high-resolution 3D models of historic buildings, squares, and streetscapes, often at centimeter-level accuracy [5,6]. Researchers have used UAVs to record architectural geometry and material details, to support condition surveys and structural monitoring, and to perform change detection through repeated flights [7]. Beyond this general capability, what gives UAVs distinctive value for immersion is their maneuverability in data collection and the quality of the resulting data. By approaching upper façades, rooflines, and enclosed courtyards with flexible flight geometries, adapting paths around scaffolds or crowds, and repeating sorties with minimal site intrusion, UAVs improve view-dependent completeness precisely in the edge and roof regions. At the same time, data quality should be read taxonomically rather than as a single accuracy figure: geometric completeness at salient boundaries, radiometric continuity across textures and exposure, and semantic structuring of elements that will support interaction jointly determine which visual anchors exist in VR and how reliably users can exploit them for navigation and interpretation. UAV imagery is frequently combined with other techniques, such as terrestrial laser scanning (TLS), to obtain complete point clouds that cover both roofs and near-ground elements [8], HBIM platforms for conservation planning and archiving [9], and VR/AR applications for immersive access to urban heritage environments for education and tourism [10]. Collectively, these studies demonstrate UAVs’ value as a non-intrusive, flexible, and cost-effective means of documenting and communicating urban heritage at multiple scales [11], yet they often stop at model generation or visualization without connecting the data to the full heritage workflow—from acquisition and multi-sensor integration to immersive interaction, spatial analysis, and user evaluation. The gap this paper addresses is to position UAVs not as stand-alone suppliers but as enablers whose capture decisions are optimized for downstream immersive outcomes.

1.2. Digital Interaction for Heritage: From Maps to Immersive Technology

A broad spectrum of digital approaches has been developed to communicate urban heritage [12], from web-based 3D viewers and panoramic street-view platforms that democratize access with lightweight narrative overlays such as text, audio, or archival images [13]. VR/AR/XR systems provide embodied presence and in situ augmentation [14]. VR enables off-site exploration of reconstructed squares and skylines, while AR enriches on-site visits with semantic layers such as labels, guided paths, or time-slice reconstructions [3]. Empirical studies report that such systems can increase visitor satisfaction, strengthen perceived authenticity, and improve knowledge retention compared with conventional media [15]. While these systems can enhance satisfaction, perceived authenticity, and knowledge retention compared with conventional media, recent multi-user spaces and game-engine platforms further strengthen social presence and engagement. [16,17,18]. Collectively, these studies show both the diversity of interaction modes and their potential to enhance learning, interpretation, and outreach in urban heritage contexts. Despite these advances, current research often treats acquisition and interaction in isolation: VR/AR studies seldom articulate how UAV data contribute to completeness or quality of experience [19] and UAV studies emphasize documentation accuracy without testing whether their outputs translate into measurable gains in visibility, presence, or user performance [20]. By explicitly linking measuring choices to immersive metrics, this study integrates UAV capture with interactive technologies and provides empirical evidence for the specific advantages UAV data bring to VR/AR-based urban-heritage applications.

1.3. Research Gaps and Research Questions

Despite growing progress in both UAV-based documentation and immersive heritage applications, two critical gaps remain. First, UAV capture is rarely optimized or evaluated for its effect on immersive visibility, presence and performance, even though these are the outcomes that ultimately matter for interpretation. Second, although UAVs are known to improve roof and façade completeness, there is little empirical evidence of how upstream data taxonomy: geometric, radiometric and semantic quality, these advantages translate into measurable benefits for user perception, spatial behavior, or overall interaction quality in immersive environments [21].
This paper addresses these gaps by developing and testing an integrated workflow for urban heritage digitization, from UAV capture through multi-sensor fusion to VR-based user evaluation. We explicitly focus on arcaded squares where roofs and upper edges are critical to skyline cues [22], exemplified by our case study of Piazza Vittorio Emanuele II in Rovigo, Italy, a historic urban square that exemplifies the challenges of documenting and interpreting complex heritage landscapes. The work pursues two objectives: designing a reusable pipeline and evaluating its effectiveness through seeing–acting–understanding outcomes, and is guided by three research questions: RQ1: When UAV is the primary reference, how can a comprehensive workflow be established that integrates UAV photogrammetry with terrestrial scanning and immersive VR for urban heritage documentation? RQ2: How can the effectiveness of the proposed workflow be evaluated through users’ spatial behavior and perceptual responses in the immersive model of an urban heritage site? RQ3: What are the advantages and prospects of this workflow in supporting not only technical applications but also the transmission of cultural and intangible values within urban heritage?

2. Case Study

Italy hosts an extraordinary density of cultural heritage, yet most municipal-level places remain outside the scope of high-budget digitization [23]. Piazza Vittorio Emanuele II in Rovigo (Veneto) is a typical case: culturally important to the town’s identity and everyday life, but ordinary rather than iconic at the national scale (Figure 1). It is an arcaded square (≈45 m × 96 m; average arcade depth 2.8 m; clock-tower height 18 m). Pedestrian flows concentrate along the shaded “grey spaces” beneath arcades. The skyline is defined by roof ridges and upper cornices, which are poorly visible to ground scanners but well captured by UAV obliques. Functionally, the square anchors civic and commercial activity; culturally, it stages communal events and memory. Precisely because it is important yet unassuming, it is unlikely to receive costly, bespoke productions, making it a representative testbed for affordable, transferable digitization. The site’s mid-scale, open plan with continuous façades also makes it well suited to a drone-first acquisition: nadir coverage efficiently captures the paving and street furniture, while oblique and orbital passes resolve roofs, upper façades, and skyline continuity. Targeted terrestrial LiDAR complements recessed arcades and occlusions.
Building on this case, the paper proceeds along two methodological strands. The first is an end-to-end workflow, covering the full pipeline from data collection (UAV photogrammetry, targeted LiDAR, and historical/cultural sources), through pre-processing and multi-sensor integration, 3D modeling and VR deployment, to spatial/visibility analysis and interaction design. The second is a reliability and utility evaluation, based on a multi-level framework that examines dimensions (seeing, acting, and understanding).

3. Materials and Methods

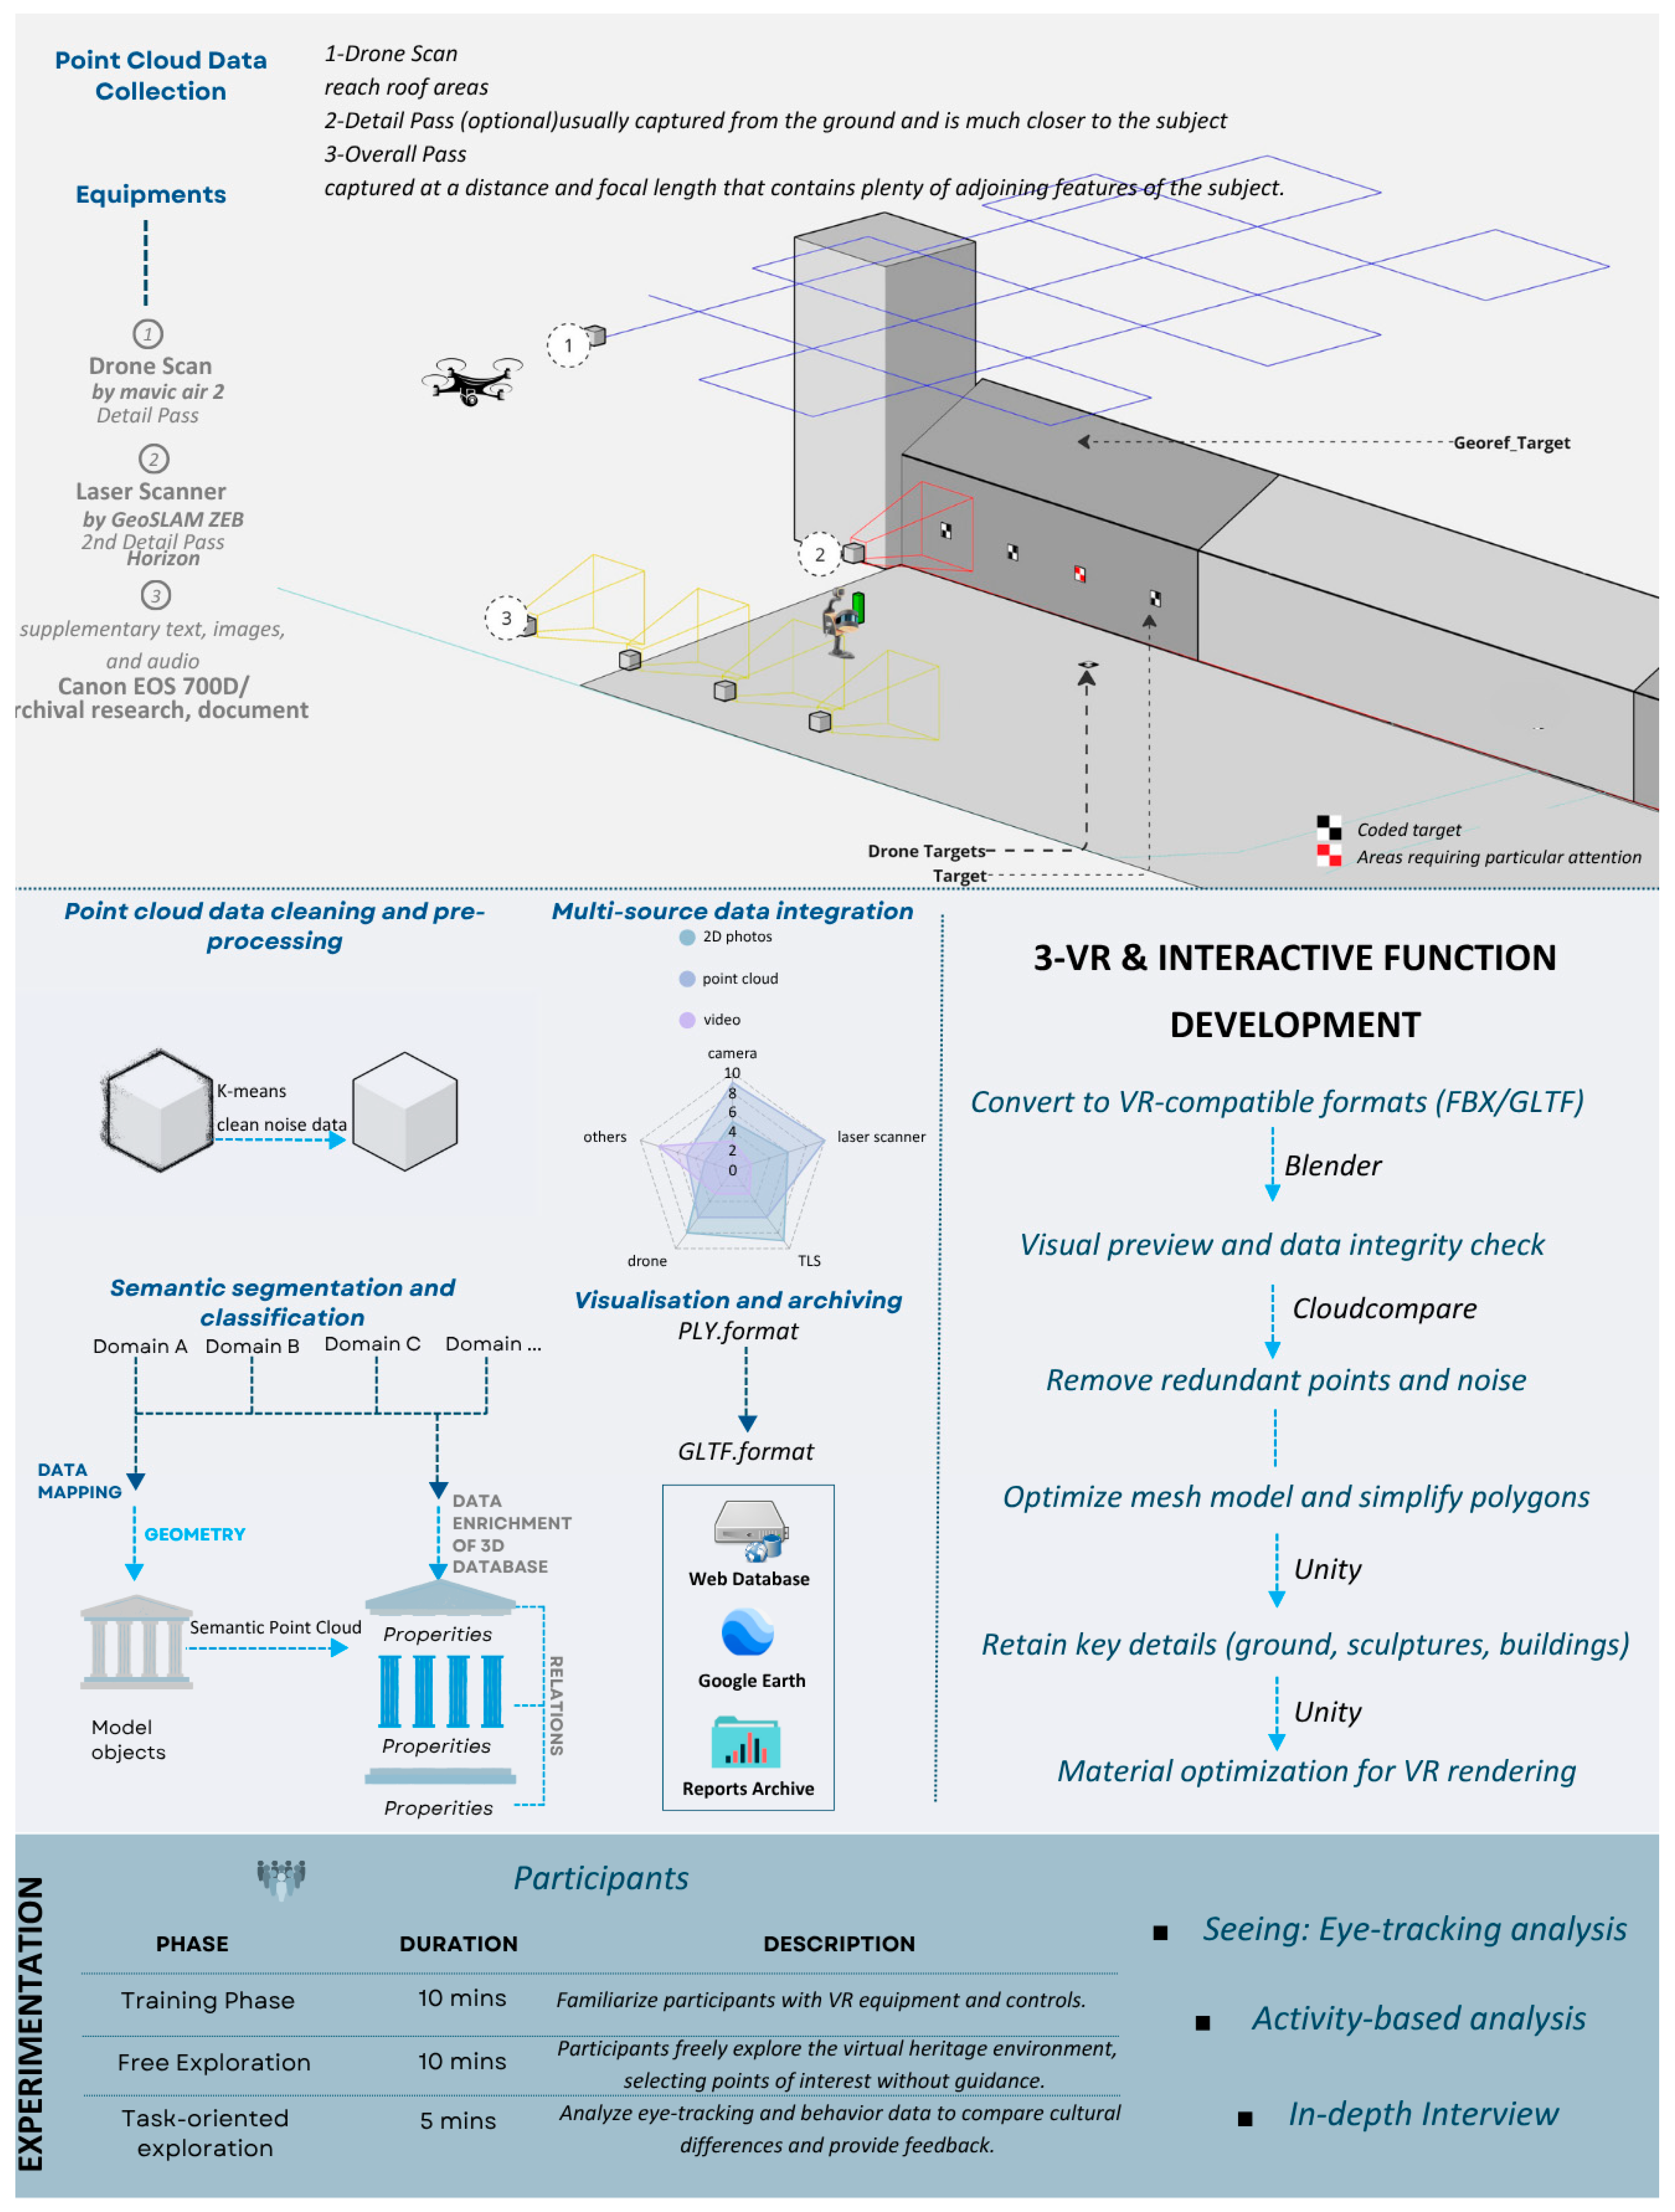
To transform the case site into a usable digital environment, the workflow proceeds through three main components. The first is the construction of the virtual environment, which begins with UAV-dominant data acquisition and multi-sensor integration, followed by preprocessing, modeling, and rendering to establish a metrically accurate and visually coherent VR space. The second is the incorporation of interactive design elements, ensuring that the environment is not only a static reconstruction but also supports meaningful user interaction through navigation, hotspots, and dynamic content [24,25]. The third is the implementation of spatial analysis methods, which extend the use of the environment by providing quantitative indicators, such as visibility and isovist measures, that can be aligned with user behavior and later applied in the evaluation of the workflow’s reliability (Figure 2).

3.1. Data Collection

Data collection encompasses hybrid scanning for acquiring point cloud data of Rovigo’s Piazza Vittorio Emanuele II, as well as historical and cultural data related to the square (Table 1). To ensure cross-modality alignment, nine high-contrast coded targets were placed around the square, at the four corners, mid-edges, and on elevated positions such as lamp posts, so that they are visible both in oblique UAV photographs and in the terrestrial LiDAR scans. These targets serve as tie points across datasets; only approximate sketches and IDs were recorded on site, while the absolute coordinate frame was established later during the registration process.
(a) UAV image acquisition: Because the object is an open plaza, the drone provides the dominant coverage and texture. Plan two complementary image sets. To provide cross-modal tie points, a small set of high-contrast markers was placed at the corners and mid-edges of the square, ensuring visibility in both aerial and ground perspectives. The DJ Mini 3 was deployed as the principal platform and conducted at an average flight altitude of 35 m above ground level: nadir grid flights (≈80% forward and 70% side overlap) captured the entire plaza surface including paving patterns and urban furniture, while oblique perimeter orbits at 25–35° tilt documented the façades and upper edges of the surrounding buildings. The staircase-altitude flight plan was used to adapt to different building heights while maintaining consistent overlap. Still photographs were captured in RAW format with locked exposure and focus under stable lighting.
(b) Terrestrial scanning data acquisition: Complementary LiDAR surveys were carried out with the GeoSLAM RT Horizon, limited to areas where UAV coverage is weak: The details of the arcades, recessed facades, and the clock tower and sculptures in the plaza, thus contributing accurate vertical geometry without attempting to scan the full plaza.
(c) Historical and cultural data: Historical and cultural data provide supplementary text, images, and audio to enhance the VR model, offering participants a more immersive and comprehensive cultural experience. The historical and cultural data of the square were obtained through the following sources: archival research, documents, interviews.

3.2. Development of the Immersive Virtual Environment

The development of the VR environment followed a three-stage workflow: data preprocessing and integration, 3D modeling and VR deployment, and interactive function design. This pipeline ensured that heterogeneous data from UAV photogrammetry and terrestrial LiDAR were transformed into a metrically consistent, visually optimized, and interactively accessible virtual heritage environment.
(a) Data preprocessing and integration: Raw UAV imagery (DJI Mini 3) was processed through a standard Structure-from-Motion/Multi-View Stereo (SfM–MVS) workflow to generate a dense, colored point cloud with associated camera poses [6]; blurred frames and radiometric outliers were culled before bundle adjustment. LiDAR data were exported from vendor software (Faro Connect v2024.1.3) as .laz files with loop closure optimization applied, then denoised via statistical outlier removal and mild radius filtering. Both modalities were cropped to the plaza boundary and voxel-downsampled to harmonize sampling density.
For multi-source alignment, initial coarse registration was performed in CloudCompare using manually selected correspondences between coded markers and architectural features visible in both datasets, solving a 7-DoF similarity transform to impose LiDAR scale on the UAV model. Fine registration applied iterative closest point (ICP) (overlap ≥ ~70%, max correspondence distance on the order of centimeters) to achieve sub-centimeter residuals. To fuse modalities, we classify surfaces by local normal (near-horizontal vs. near-vertical) and apply asymmetric confidence weights so that UAV contributes on horizontals (denser, more uniform sampling/texture) while TLS dominates vertical and occluded parts; seam zones are blended with bilateral weighting and point-to-plane ICP. To mitigate TLS multi-station non-uniformity, we use adaptive voxel downsampling (target neighborhood k\approx30\pm5) and density-normalized ICP, pruning overly dense TLS patches when cross-modal overlap is low.
(b) 3D modeling and VR deployment: The merged cloud was surfaced using screened Poisson reconstruction, decimated with curvature preservation, UV-unwrapped, and textured primarily from UAV imagery to ensure a realistic appearance. Semantic segmentation and classification (via a deep learning routine) identified façades, sculptures, and paving patterns, which were archived as semantic layers for both conservation analysis and virtual presentation. The final mesh was exported in glTF/FBX formats with metric units, multiple levels of detail, and collision proxies. In Blender, redundant points and noise were removed, and polygon counts were reduced while preserving architectural details. Materials were optimized for VR rendering. The resulting assets were deployed in Unity 2022.3.42, where the Rovigo square was reconstructed as a VR scene. Real-time lighting, baked occlusion culling, and dynamic weather simulations were incorporated to enhance immersion and ensure stable rendering performance. Minor mesh artifacts observed in narrow gullies were spatially masked prior to metric computation and user-study mapping; therefore, they do not enter the quantitative analyses reported in the result. Tests on a desktop with an RTX 4070 Ti (12 GB) and 32 GB RAM sustained ~80 FPS at per-eye 1440 × 1600 under the streamed, block-based LOD pipeline.
(c) Interactive function design: Interactive functions were implemented by integrating eye-tracking (Tobii Pro Glasses 3) into the VR system [26]. Users could freely explore the square, approach sculptures or façades, and trigger information pop-ups providing historical stories or restoration records. The system dynamically used gaze direction to activate context-relevant content, offering personalized cultural narratives. Domain experts place sparse key points on salient architectural elements. Each key point triggers a content bundle (text/audio/historic imagery/overlays) via the rule from our library: (i) trigger when users click on key points, (ii) gaze dwell ≥ 800 ms. Context relevance and personalization are achieved through user-selected narrative tracks at onboarding and lightweight runtime adaptation to interaction signals (e.g., dwell time, revisits).
In this VR-based experiment on urban heritage landscapes, the goal is to explore the activities and behaviors of young people in a VR-based urban heritage landscape. The VR primitives include point-and-teleport locomotion with snap turns, ray-cast selection, and grab/scale for close inspection (bounded to comfortable ranges). To support later analysis without mixing methods and results, we log three synchronized streams: (S1) gaze [time, worldRay] (eye-tracker integrated with the HMD), (S2) locomotion [time, position, heading] and (S3) hotspot events [time, hotspotID, enter/exit, dwell, activationType, contentID]. After removing unsuitable and invalid participants, the experiment involves 53 young participants from diverse backgrounds.

3.3. Spatial Analysis for the Virtual Environment

An isovist refers to the area in a spatial environment that is directly visible from a specific observation point, considering the surrounding physical structures that block or limit visibility. Widely used in spatial analysis and architectural studies, isovists provide a means to quantify and interpret visual access within a space [27,28] (Figure 3). Given that the case site is an urban plaza framed by continuous architectural façades, isovists were applied to analyze its spatial characteristics. Based on the reconstructed mesh model, viewpoints were systematically distributed at 1 m intervals across the plaza (referencing an average human stride length), with an eye height of 1.6 m above ground and a 360° field of view. From each viewpoint, rays were cast every 4°, with a maximum length of 300 m. For each ray, intersections with mesh surfaces were detected, and the resulting end points were connected to form the isovist boundary. The visible area at each viewpoint was then calculated by analyzing the geometry of these boundaries. A gradient heat map was generated to visualize spatial openness, highlighting areas of greater or lesser visibility. In addition, distances from each sampling point to surrounding buildings and landmarks were computed, allowing a distinction between shaded zones beneath the arcades and the more open areas of the plaza, thereby offering deeper insights into the spatial composition of the heritage landscape.

3.4. Evaluation Methods

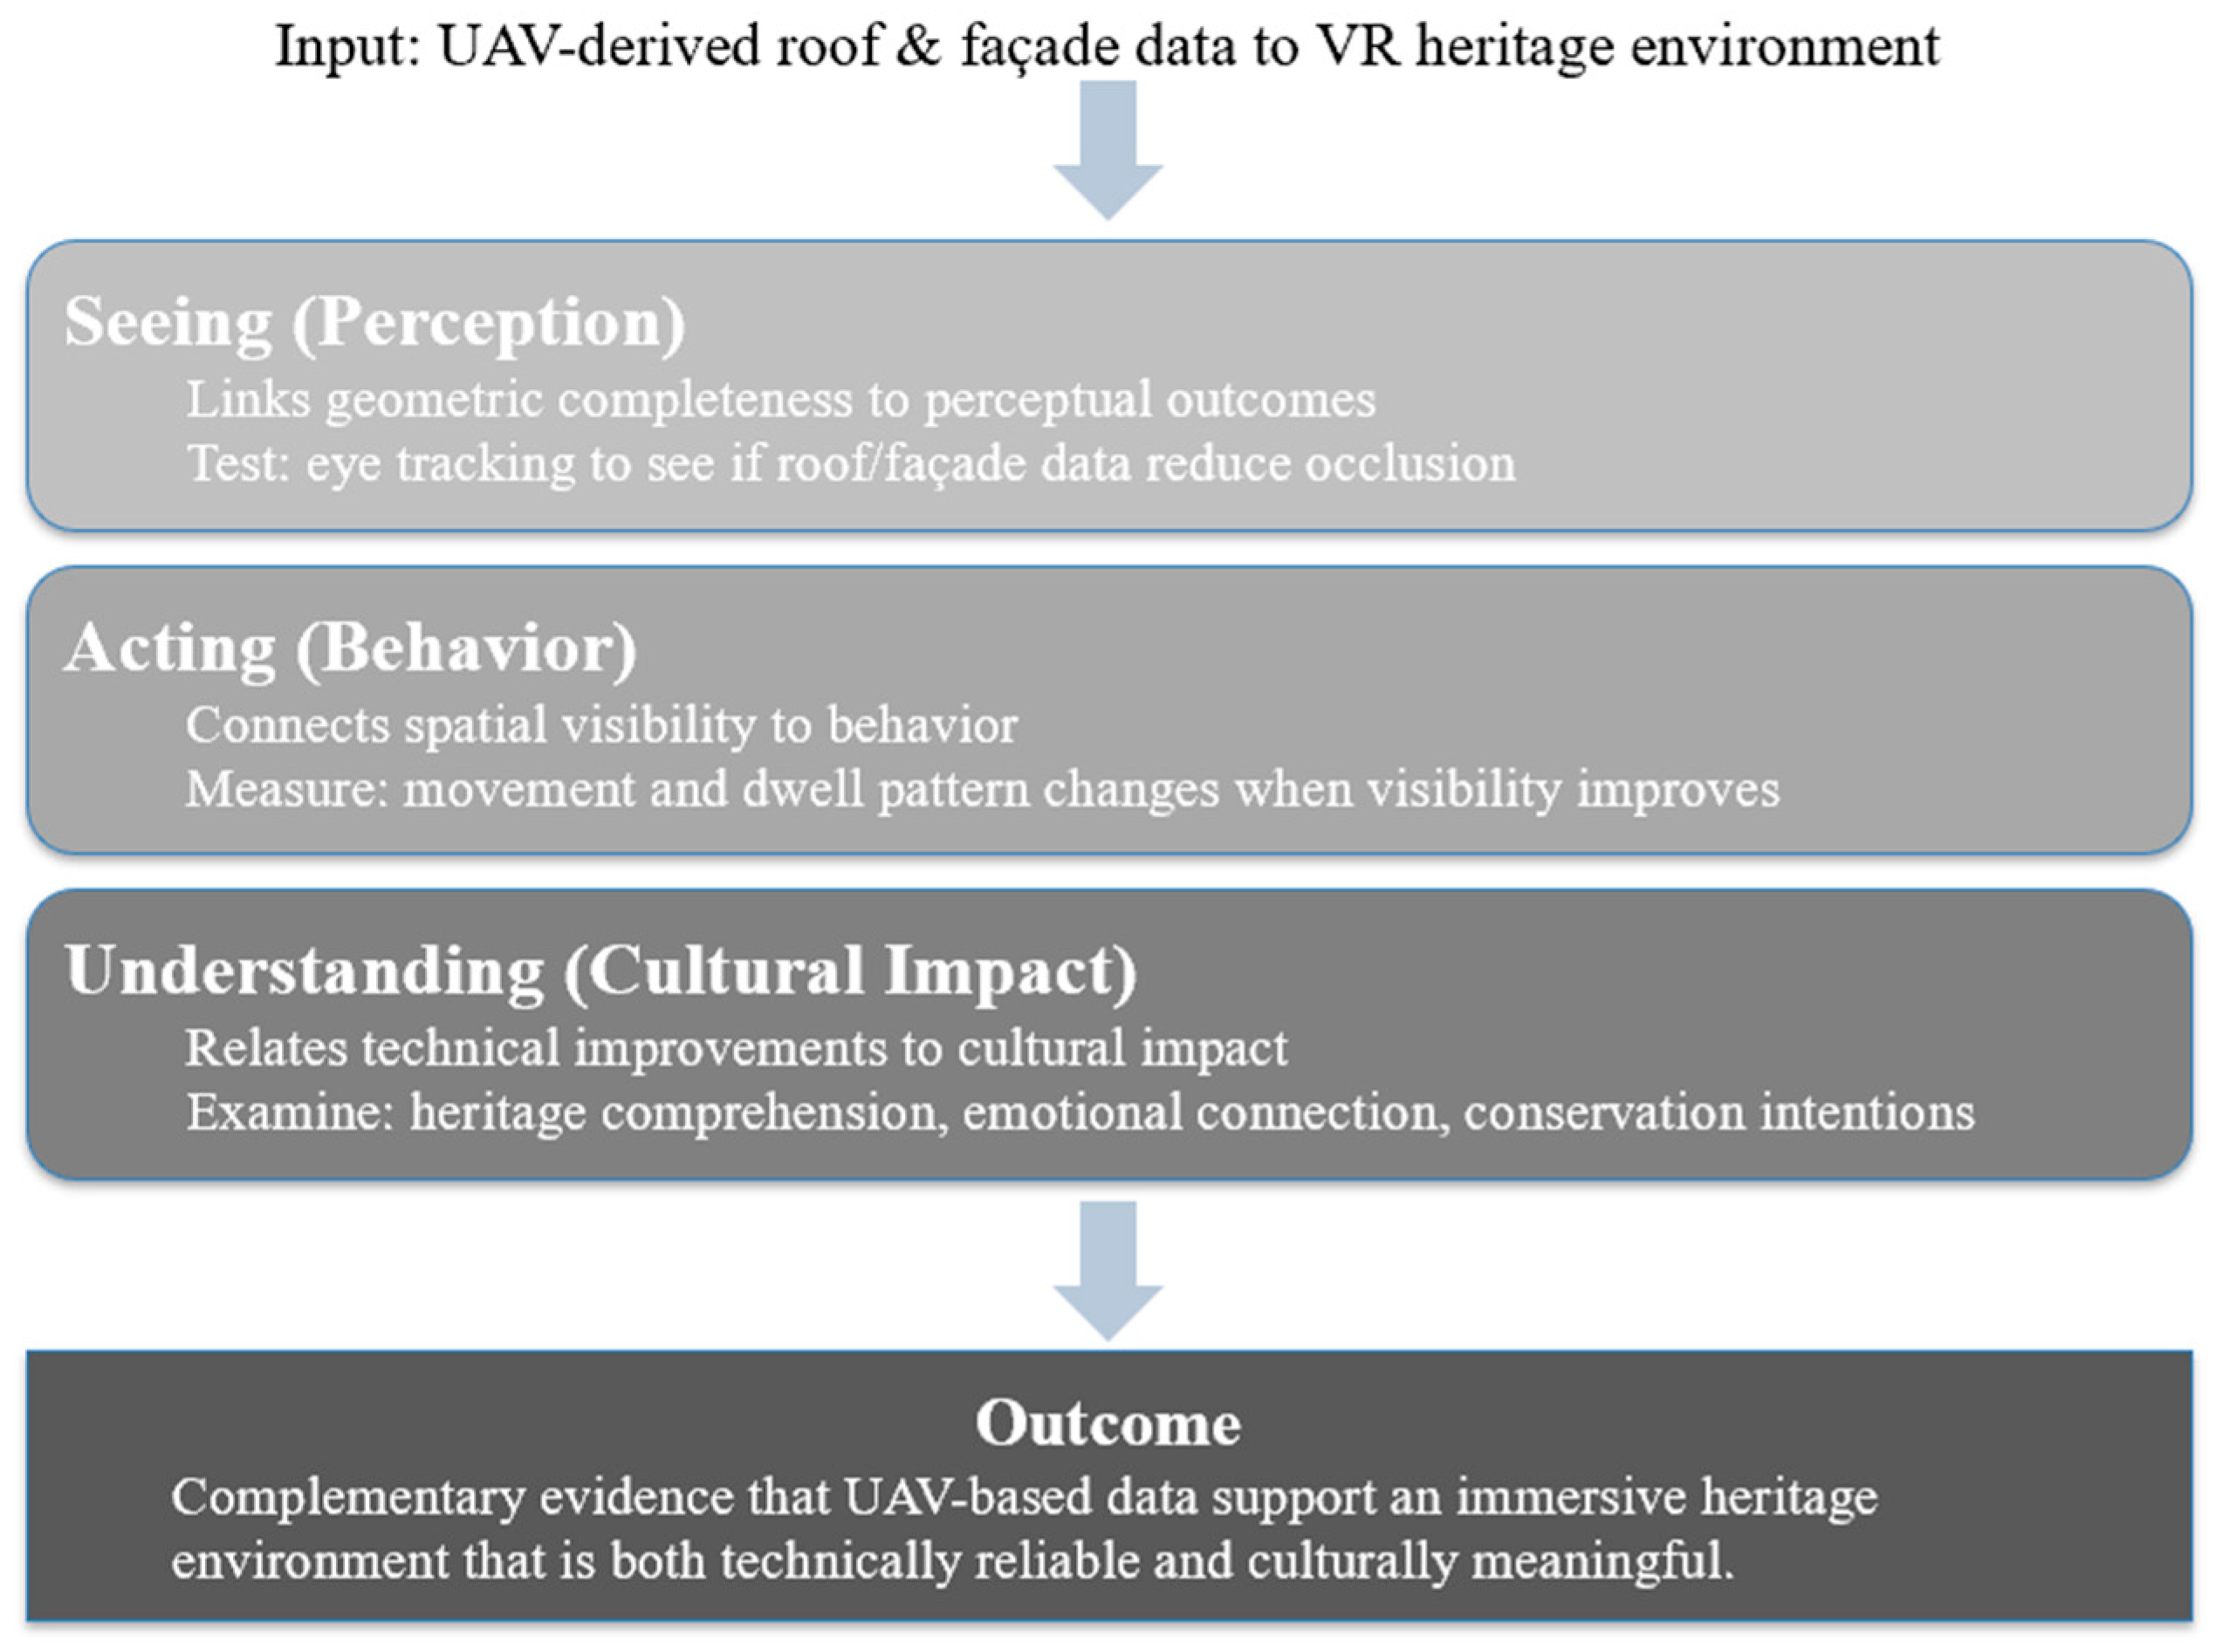
To evaluate the effectiveness of the proposed workflow, we designed a three-layer framework consisting of seeing, acting, and understanding (Figure 4). This layered approach has several advantages. First, it links geometric completeness to perceptual outcomes. For example, whether UAV-derived roof and façade data actually reduce occlusion can be tested through eye tracking at the seeing layer. Second, it connects spatial visibility to behavior. If visibility improves, users’ movement and dwell patterns are expected to change, which can be measured at the acting layer. Third, it relates technical improvements to cultural impact. At the understanding layer, we can examine whether the VR experience enhances users’ comprehension of heritage, builds emotional connections, and fosters conservation intentions. Together, these three layers provide complementary evidence that UAV-based data support an immersive heritage environment that is both technically reliable and culturally meaningful.

3.4.1. VR-Based Experiment Process

A total of 53 participants were initially recruited for the VR experiment, of which 41 met the inclusion criteria and were retained for analysis (Table 2).
To collect valid behavioral data for subsequent research, the entire experiment consists of three main phases:
(a) Training session: In the initial phase of the experiment, participants first undergo a training session to familiarize themselves with the VR equipment and interface. This session ensures that all participants understand and feel comfortable operating the VR headset and controllers for the subsequent experiment.
(b) Free exploration: During the free exploration phase, participants are guided into the virtual urban heritage environment, where they can independently choose locations of interest to explore. This phase does not impose specific tasks, allowing participants to move and observe freely at their own pace. This approach aims to uncover which cultural elements attract their attention in the absence of external guidance. The process lasts 3 min, during which participants’ movement trajectories and dwell locations within the square are recorded.
(c) Task-oriented exploration: In the task-oriented exploration phase, participants are required to complete specific exploration tasks. This phase consists of two key activities: Interacting with designated interactive interfaces—Participants are required to engage with interactive elements in the virtual environment. During this process, eye-tracking data is recorded, including fixation points at predefined locations, gaze movement trajectories, fixation points, and fixation durations. Re-exploring the site to describe spatial dimensions—Participants are asked to navigate the space again and provide descriptions of its scale after completing the experiment. During this process, movement trajectories are recorded to analyze their spatial exploration behavior.

3.4.2. Seeing: Eye-Tracking Analysis

Eye tracking data within the VR environment were used to evaluate the seeing layer. The experiment employed an HTC VIVE Pro Eye headset with integrated Tobii eye tracking. The system continuously recorded gaze positions in panoramic VR scenes that were spatially aligned with the reconstructed 3D model of the square. Data were collected and processed in Tobii Pro Lab using standardized presets, then analyzed through a dedicated pipeline incorporating machine-learning–based filtering for noise reduction. The tracker operated at 120 Hz with an accuracy of approximately 0.5–1.1°, which is sufficient for capturing fine-grained gaze patterns in architectural environments.
Three experimental conditions were designed to capture different aspects of visual attention: (a) interactive scenes in which participants could trigger information panels, (b) panoramic scenes augmented with heritage hotspot indicators that guided users toward specific points of interest, and (c) unmarked panoramic scenes that presented the environment without any additional prompts. In total, five hotspot locations were included in the design. These comprised the central open square, the shaded “grey space” beneath the arcades, two façades containing distinctive architectural features, and the central monumental sculpture. The distribution of hotspots was intended to cover both highly visible open areas and more occluded or spatially ambiguous zones of the plaza.
The primary measures derived from the eye tracking data were fixation-duration heatmaps and scanpaths. Heatmaps aggregated gaze points to reveal spatial clusters of attention and allowed intuitive visualization of how participants’ focus shifted across different conditions. Scanpaths complemented this information by showing the temporal sequence and trajectory of gaze movements, making it possible to identify whether participants followed systematic search patterns or engaged in more exploratory scanning. In this study, heatmaps served as the principal tool for interpreting gaze behavior, since they clearly highlighted attention concentration and comparative differences between conditions. Scanpaths and AOI metrics were used to corroborate these findings, ensuring that observed patterns in visual attention were both intuitively recognizable and quantitatively reliable. This combination of qualitative visualization and quantitative support ensured that the seeing layer could be evaluated with both clarity and rigor.

3.4.3. Acting: Activity-Based Analysis

The analysis of the acting layer focused on the spatial distribution of participants’ activities in the VR environment. Individual trajectories and dwell points were aggregated into group-level heatmaps for both free exploration and task-oriented conditions. These maps revealed where participants tended to concentrate their movement and rest within the square. From the synchronized logs, we rasterised (i) trajectory occupancy (time-normalised path density) and (ii) dwell time into 1 m cells over the walkable mask; free exploration and task-oriented runs were aggregated separately. To examine how activity patterns were shaped by spatial visibility, the activity heatmaps were compared directly with the cumulative isovist field generated in Section 3.3. This allowed us to test whether participants were more likely to occupy highly visible open areas or to explore less visible pockets along boundaries and under arcades.
To make this comparison, activity intensities were extracted from the color-coded heatmaps of the two conditions by calculating the red–blue channel difference, which highlighted dwell density, and then normalizing the values to a [0, 1] range. The cumulative isovist field was resampled to the same resolution as the heatmaps and masked to include only free-space pixels, ensuring proper alignment. Correlation tests were then conducted to evaluate the relationship between visibility and activity. At the pixel level, Pearson’s r and Spearman’s ρ were calculated across all free-space pixels. To reduce potential noise from pixel misalignment, the fields were also aggregated into a coarser grid of approximately 150 by 87 cells, and the correlations were recalculated at this scale.
In addition to these full-field correlations, we further analyzed the data after excluding the lowest 10% and 25% of activity values. This step removed minimally used zones and highlighted the relationship between visibility and activity in areas where participants were more concentrated. Finally, we conducted a bivariate quadrant classification that cross-tabulated activity intensity and isovist values, allowing us to identify the relative prevalence of high-activity × low-visibility cells compared with other categories. Through this multi-level approach, the acting layer analysis relied on statistical correlations and categorical comparisons to link behavioral patterns with geometric openness, providing a reproducible basis for comparing free exploration and task-driven conditions.

3.4.4. Understanding: Feedback Interview

This part of the evaluation focused on how the VR experience influenced participants’ cultural cognition, spatial understanding, and conservation intentions. To capture these dimensions, we adopted semi-structured interviews designed in a light-touch format. The approach allowed us to complement the behavioral and perceptual data with deeper qualitative insights.
The procedure followed a within-participant design. Before entering VR, participants briefly reviewed traditional media that included textual descriptions, still images, and a 2D map of the square. They were asked short prompts to establish a baseline of interpretation. After completing the VR exploration and tasks, each participant then took part in an individual interview.
The interviews were organized around three main themes. The first theme addressed spatial characteristics and historical context, asking participants how they understood the square’s layout, architectural features, and historical background, as well as its role in local culture. The second theme examined heritage value identification, including emotional connections, community identity, and intangible meanings ascribed to the site. The third theme considered behavioral intentions, probing participants’ views on future conservation, their willingness to visit or recommend the square, and their readiness to engage in preservation activities. A closing question asked participants to compare their impressions of VR with traditional media, focusing on perceived knowledge gain, sense of presence, and motivation for heritage conservation.
All interviews were audio-recorded, transcribed, and analyzed using content analysis. Coding was aligned with the three themes, and frequency counts of words and phrases were compiled to identify consistent patterns. Comparisons between pre-VR and post-VR responses revealed shifts in how participants described spatial relations, recognized intangible values such as communal memory, and expressed intentions to support conservation. Representative quotations were selected to illustrate these trends. This procedure provided a reproducible way to link the VR experience with changes in understanding, attachment, and conservation attitudes relevant to urban heritage dissemination and stewardship.

3.4.5. Comprehensive Evaluation

The integrated assessment is based on triangulation rather than on adding new measurements. Instead of introducing separate metrics, we treat the vision, behavior, and cognition layers reported in Section 4.2, Section 4.3 and Section 4.4 as complementary perspectives and interpret them together. We define convergence with respect to UAV-specific gains. When upper-edge AOIs (rooflines/cornices), features enhanced by UAV and under-represented in LiDAR-only scenes, show higher edge clarity/continuity, and this aligns with lower gaze entropy, more edge-anchored routes (lower tortuosity), and interview references to “roofline/skyline/continuous arcade,” we treat the alignment as evidence for the drone-first effect. In practice, this means looking for consistent shifts, for example, from dispersed to guided attention, from diffuse roaming to edge-anchored exploration, and from unstructured actions to purposeful evidence-gathering routines.

4. Results

4.1. Results of Virtual Environment Construction

This environment accurately reconstructs the spatial layout, historical information, and material characteristics of the site, providing an innovative digital platform for both academic research and public engagement. The core functionalities of the virtual environment include high-fidelity 3D models, interactive historical information display, and dynamic weather simulation [29].

4.1.1. Model Representation and Environmental Effects

The UAV mission yielded 318 still photographs at 4032 × 3024 px (≈12 MP): 210 nadir grid images and 108 oblique perimeter images captured over 3 sorties (total airtime ≈ 29 min). About 4% of frames were culled during QC. The GeoSLAM pass comprised two short loops around occluded edges (walking trajectory ≈ 720 m). SfM–MVS produced a UAV dense cloud of 34.7 million points (PLY ≈ 1.28 GB); after artifact removal and downsampling to 3–4 cm nominal spacing in overlap zones, 12.6 million points remained. The LiDAR dataset contained 16.2 million points (LAZ ≈ 0.58 GB); 3.1% outliers were removed and normals computed for QA. In CloudCompare, 9 manually picked correspondences solved the 7 DoF transform; ICP (max pair distance 6 cm, target overlap ≥ 72%) converged to RMS = 1.9 cm (MAD = 1.1 cm) over façade and floor validation patches. Confidence weighted fusion yielded 21.9 million points (PLY ≈ 0.96 GB). Screened Poisson meshing followed by curvature-preserving decimation produced a triangle mesh of 3.4 million faces (LODs: 3.4 M/1.7 M/0.62 M). Textures were baked from the Mini 3 imagery into two 8192 px and two 4096 px atlases (total ≈ 380 MB).
Within the Unity application, we implemented a multimodal interaction layer that combines point-and-teleport locomotion (arc targeting, snap-turn) with ray-based UI selection and direct grab/scale for inspecting façade fragments and street furniture at 1:1 or miniature scale. A dynamic navigation system is generated from a NavMesh baked on the fused plaza mesh and a graph of named waypoints (e.g., “Clock Tower,” “Portico North,” “Sculpture”). At runtime, the system computes shortest paths between waypoints, draws a breadcrumb line that reorients with the user’s heading, and unlocks nearby anchors based on proximity, thus supporting ad hoc tours without pre-baked camera paths. “Smart” interactions attach geo-tagged hotspots to architectural elements; opening a hotspot spawns a context panel with text, images, or video, and can trigger temporal states (e.g., daylight toggle) to aid reading. Eye-tracking supports dwell-to-select on panels (≈500 ms dwell), gaze-guided focus for the virtual guide (answers are scoped to the object being looked at), and foveated rendering plus anonymized gaze logging to generate attention heatmaps for evaluation. The complete interaction stack ran stably in VR, maintaining ~80 FPS while enabling guided exploration of Vittorio Emanuele II Square.

4.1.2. Interactive Design

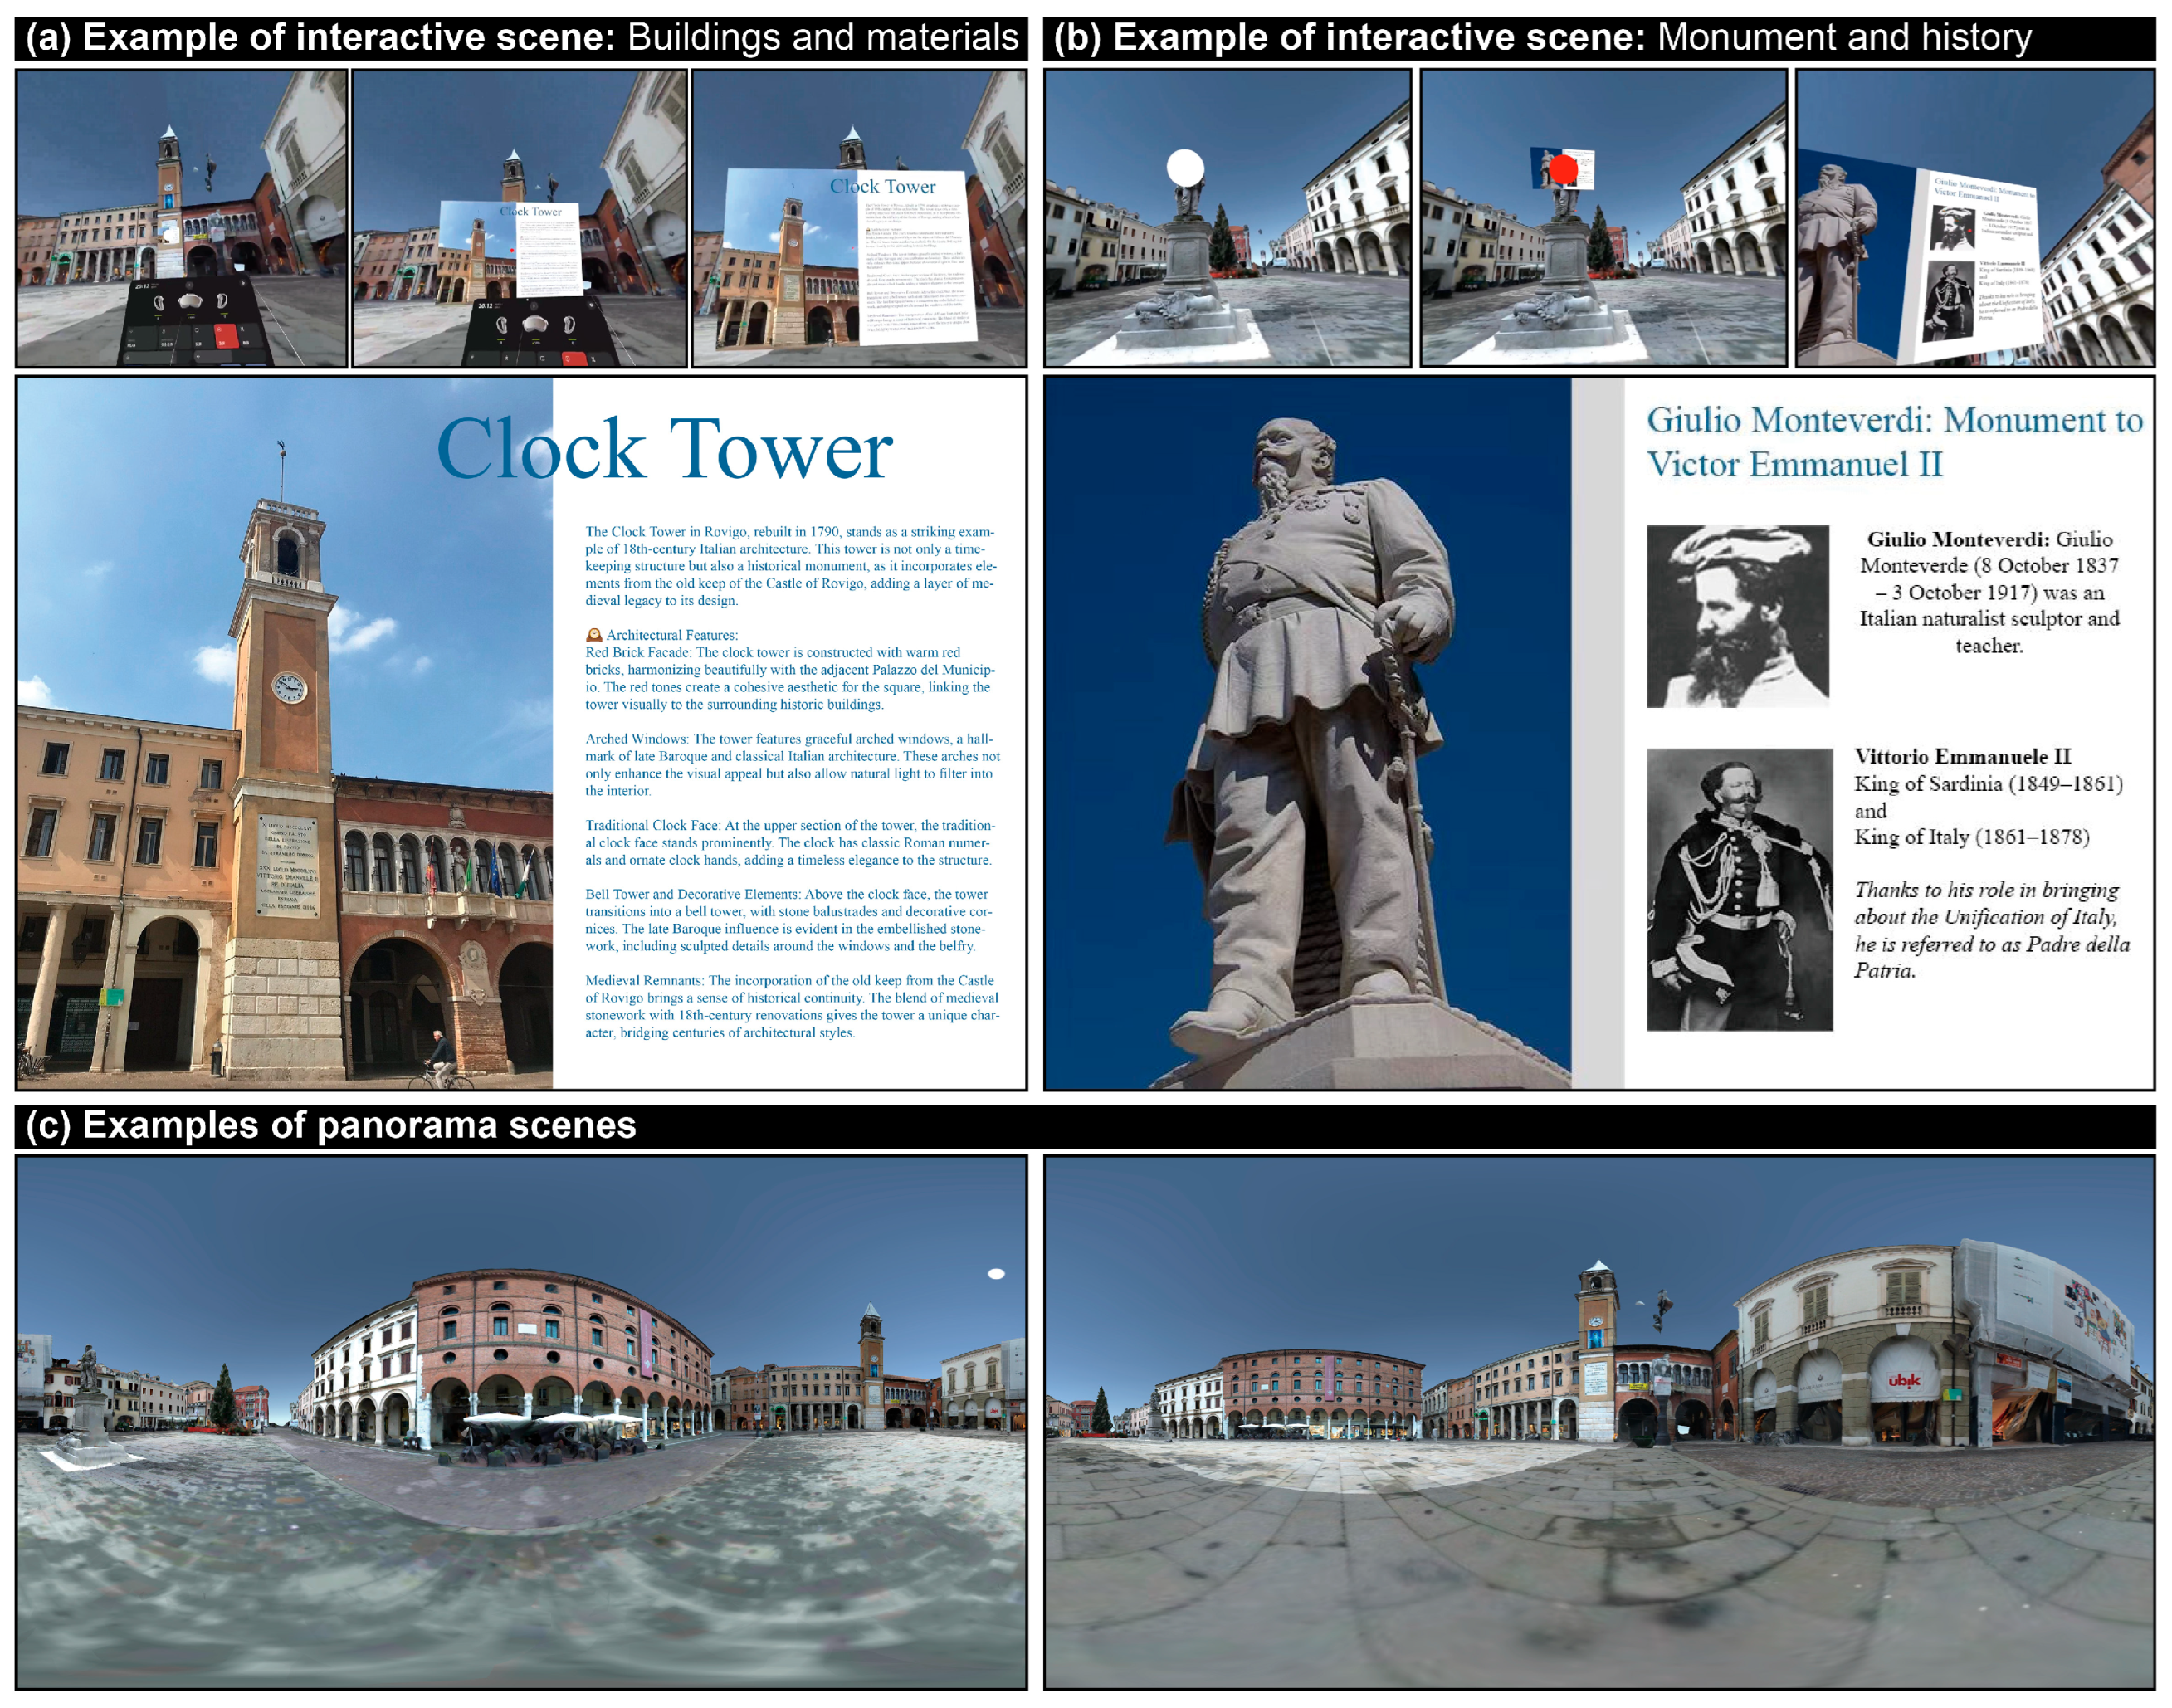
The interactive design of the virtual environment emphasizes intuitive historical information presentation and multi-layered interactive experiences. Interactive hotspots embedded within the model enable users to click and explore the historical background, functional significance, and temporal transformations of specific buildings or sculptures (Figure 5). Additionally, the model supports in-depth material information visualization. By integrating point cloud segmentation results, users can zoom in on specific architectural features to examine material textures in detail, such as the natural grain of stone surfaces, the directionality of wooden textures, and the intricate sculptural details of decorative elements. Moreover, interactive tools provide insights into the material origins, historical significance, and processing techniques. For instance, clicking on the Monumento a Garibaldi allows users to analyze the stone distribution, weathering traces, and carving techniques employed by artisans.

4.2. Seeing: Visual Attention in the Virtual Environment

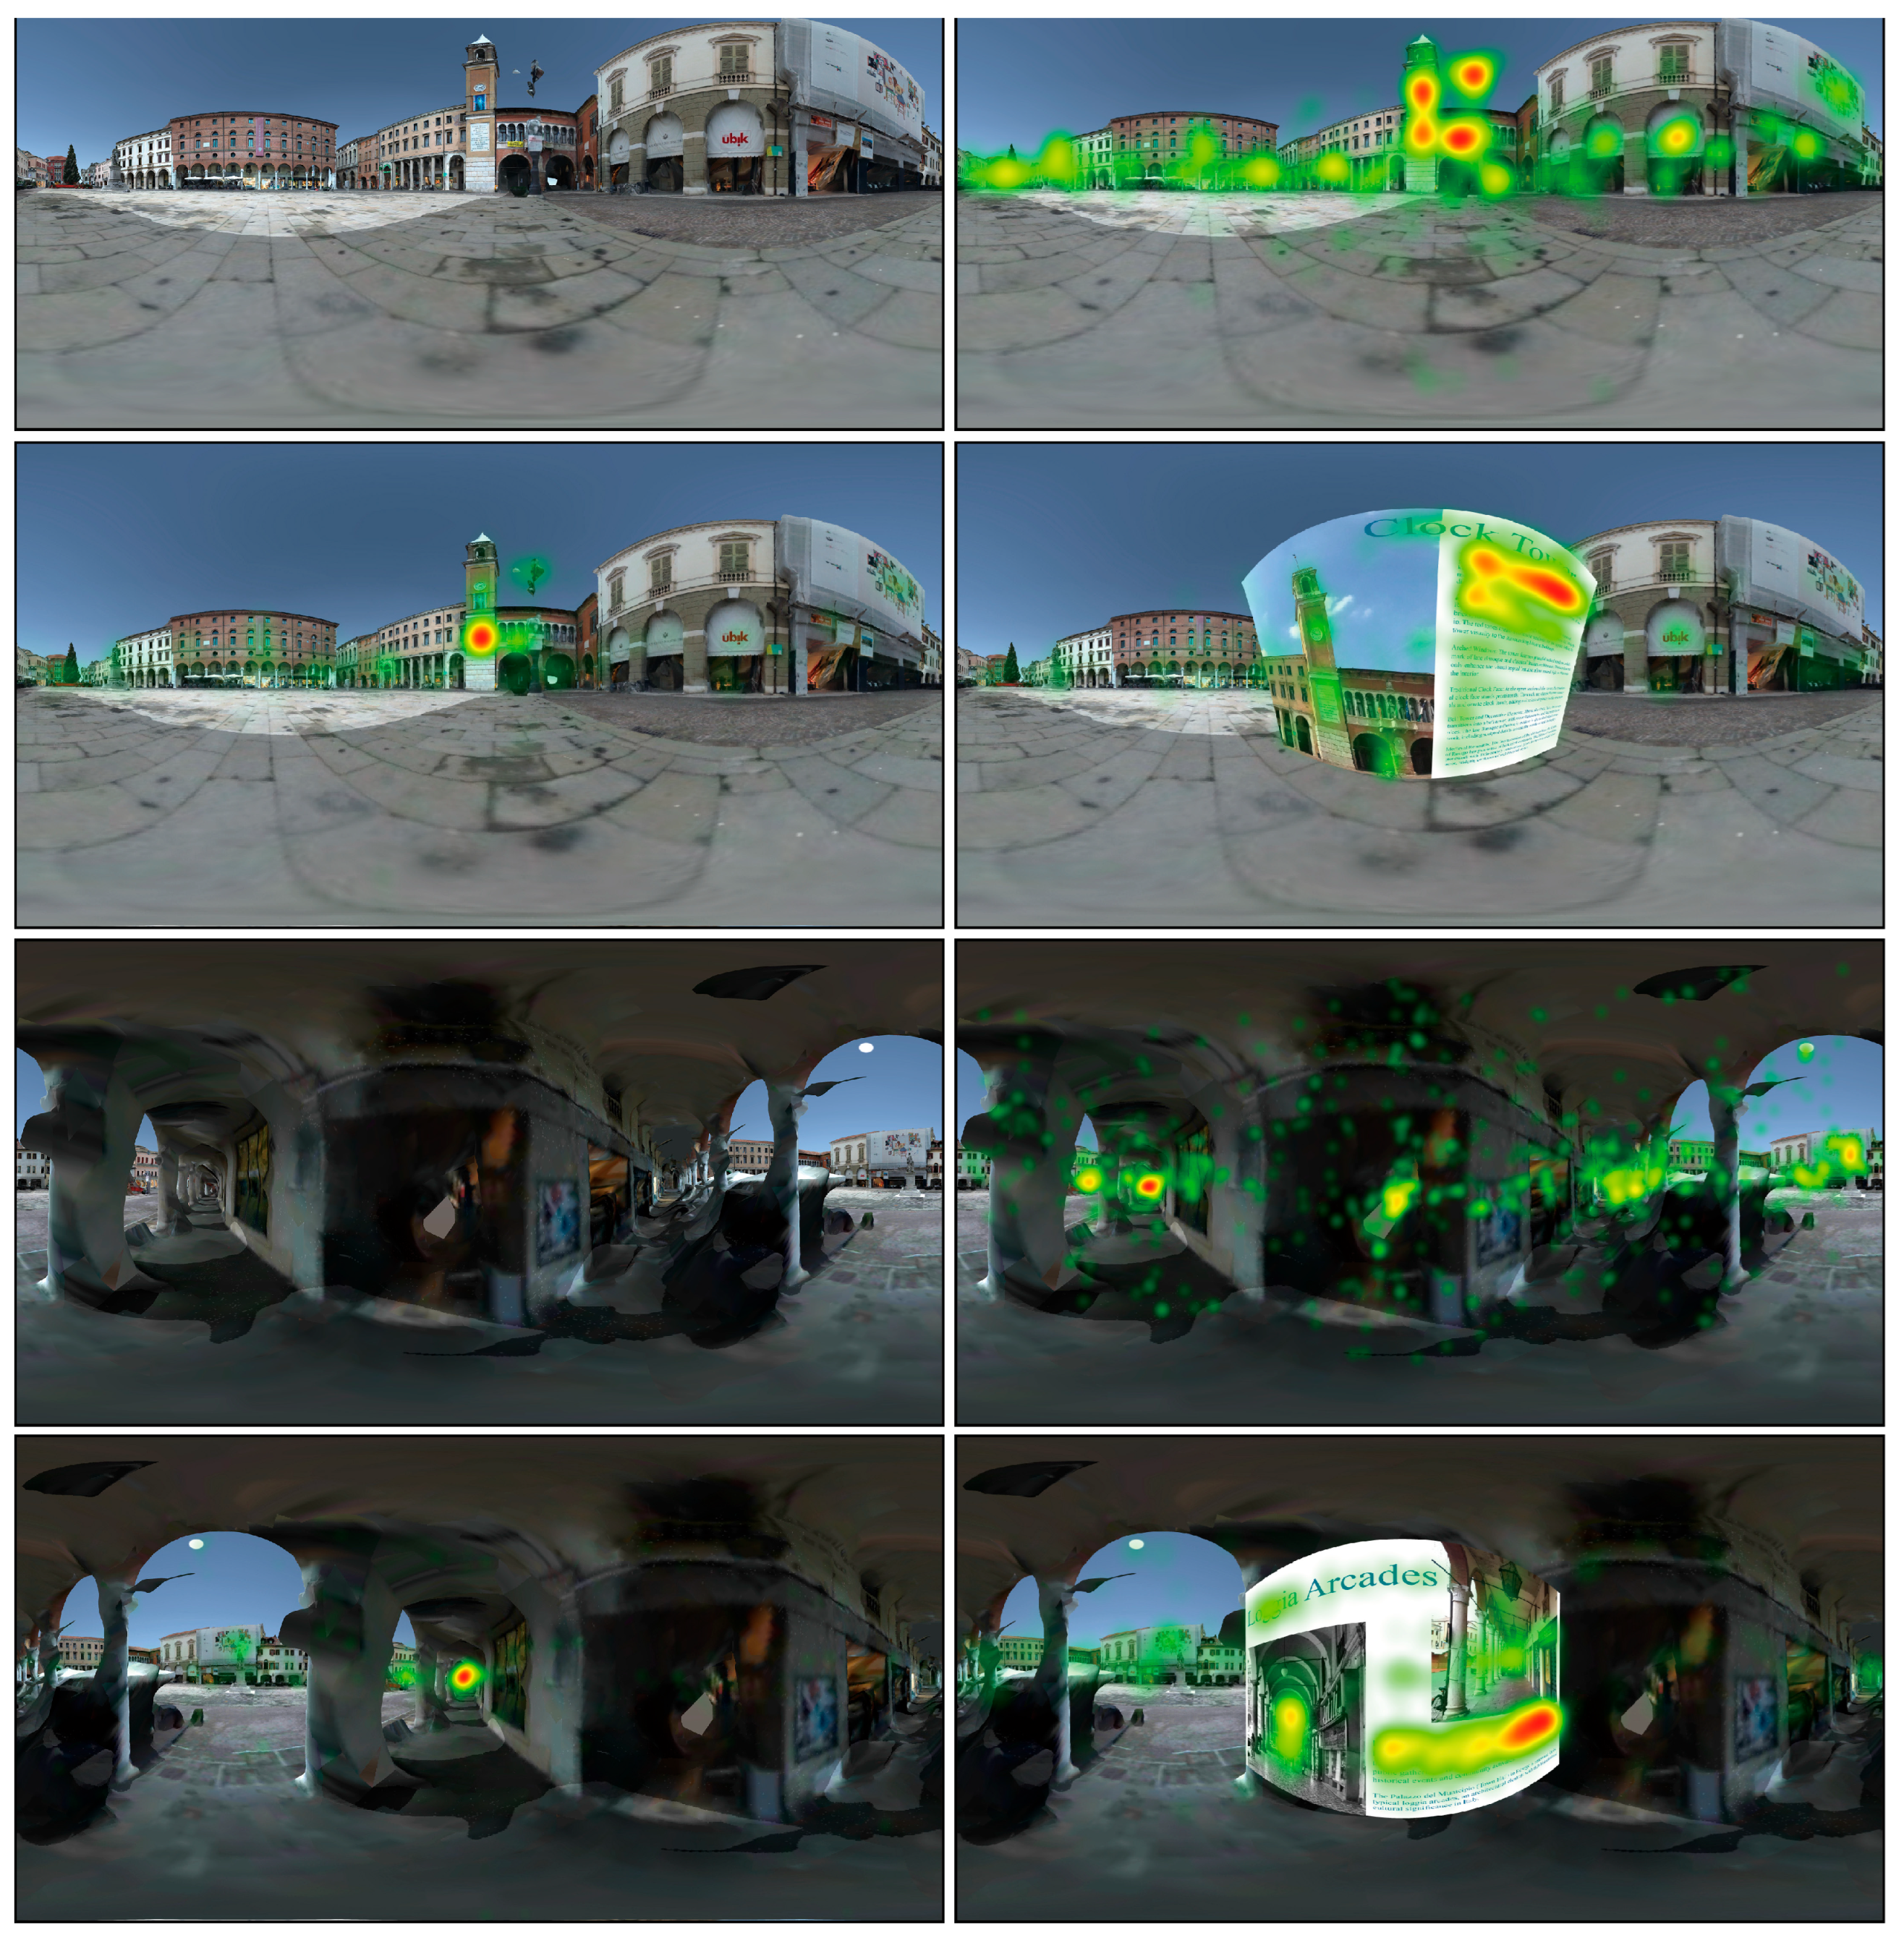
The eye-tracking analysis reveals clear differences in visual attention across the tested interaction conditions (Figure 6). In the baseline exploration, participants’ fixations were not uniformly distributed but concentrated on a limited set of salient elements within the square. These included landmark buildings, commercial advertisements, and the chandelier-like installation in the sky, which share common features such as fine detail, textual information, or high visual contrast [25]. In addition, areas where the 3D model geometry was less defined or visually ambiguous also attracted momentary attention, indicating that uncertainty in representation can trigger exploratory gazes. When landmark indicators were introduced into the scene, participants’ visual focus became more concentrated around these marked points. The heatmaps show that the dispersion of gaze reduced significantly, suggesting that explicit guidance elements effectively channel attention toward system-defined foci, diminishing random or peripheral exploration. Finally, when an informational pop-up interface was activated, the surrounding environment received markedly less visual attention. Instead, participants’ fixations shifted almost exclusively to the panel itself, with the textual components, particularly titles and highlighted keywords, receiving the longest dwell times. This indicates a clear transition from spatial exploration to information processing once the interface is triggered, with visual attention strongly anchored to the presented cultural narrative.
Overall, these results suggest a three-stage pattern of visual behavior: (a) reliance on environmental salience in free exploration, (b) directed attention under landmark guidance, and (c) dominance of textual information when interactive content is displayed.

4.3. Acting: Exploration and Task-Oriented Behaviors

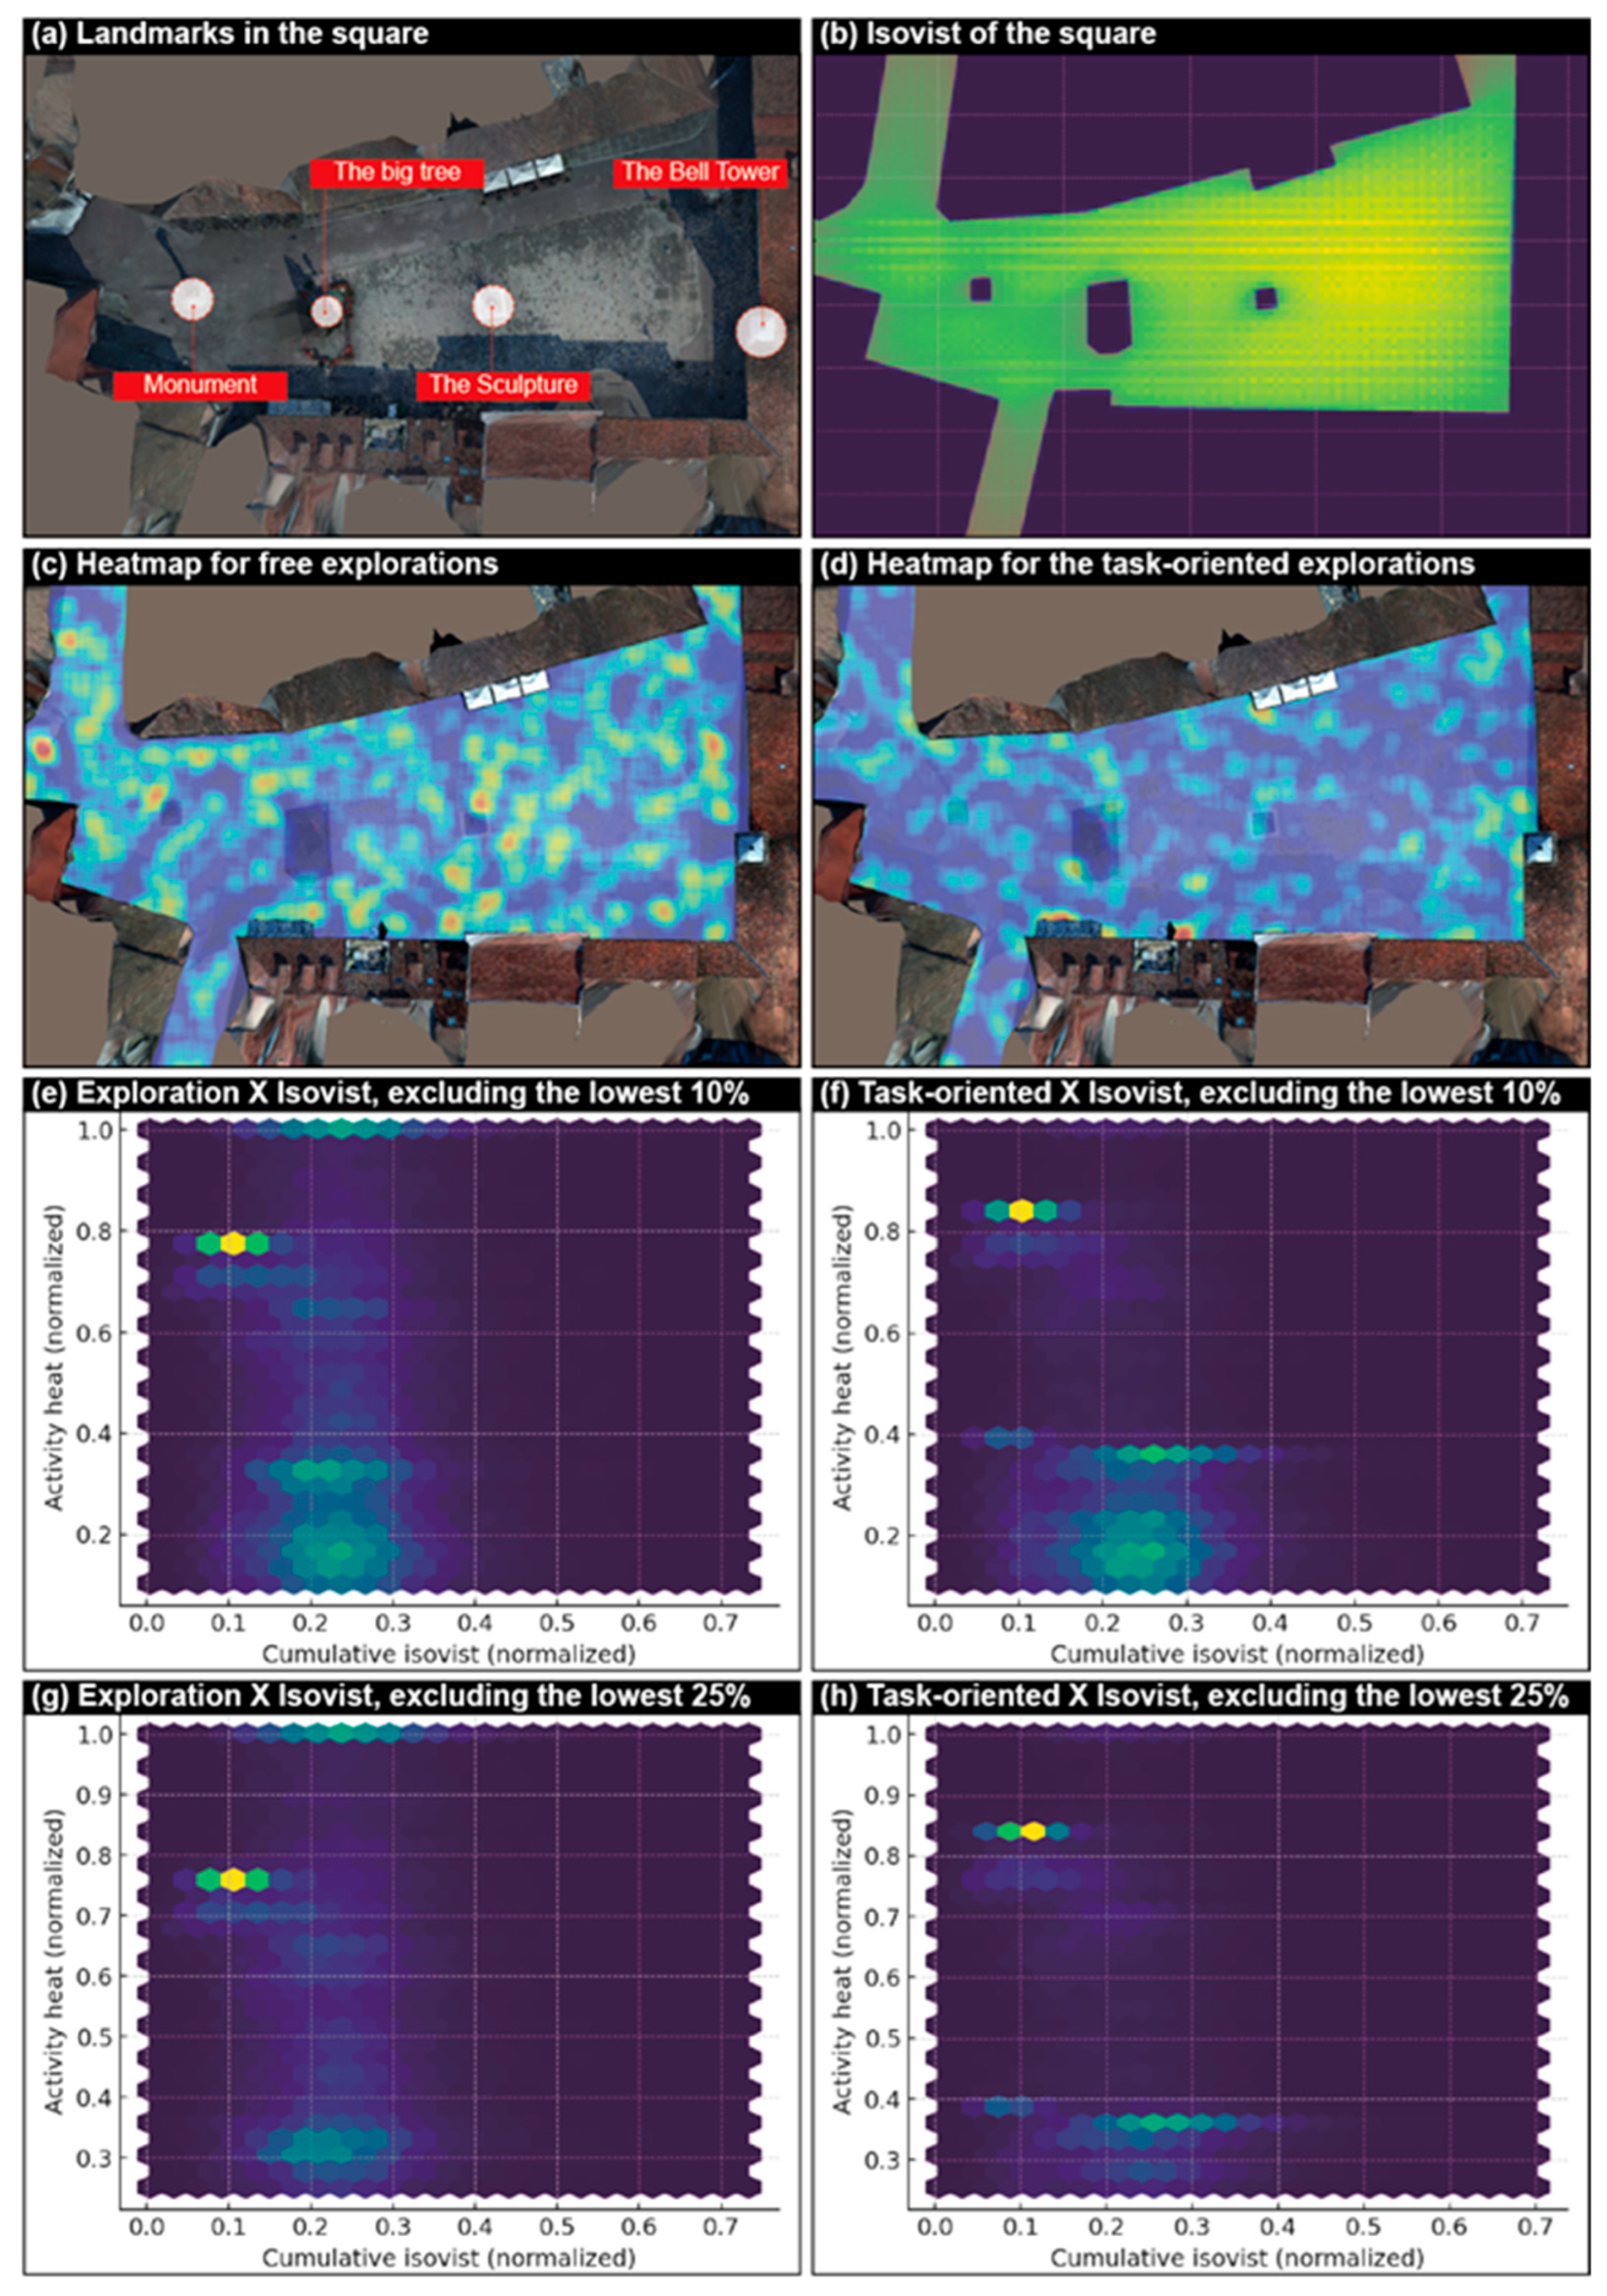
In the exploration condition, where participants were free to move and play within the virtual square, activity heatmaps revealed a relatively scattered distribution. Movement trajectories were more evenly dispersed across the open space, with occasional clusters along vegetation edges and near waterscapes, but without strong directional bias. By contrast, in the task-oriented condition, where participants were instructed to estimate the scale of the square, activity became more concentrated. Heatmaps showed marked accumulations along the boundaries and corners of the plaza, indicating that participants deliberately approached enclosing edges or occluded pockets in order to extract spatial cues for size judgment.
Building on these spatial patterns, we examined the quantitative relationship between activity intensity and cumulative isovist values. Across all pixels, both conditions showed significant negative correlations, indicating that activity tended to concentrate in areas of lower visibility. In the exploration condition, this relationship was weak (Pearson r = −0.123, Spearman ρ = −0.156, n = 335,845, p < 0.001), consistent with a playful and diffuse engagement that only modestly favored less visible zones. In the task-oriented condition, however, the negative association was stronger (r = −0.244, ρ = −0.170, n = 335,845, p < 0.001), reflecting systematic reliance on low-visibility areas to anchor spatial judgments. Aggregating the data into a coarser grid (≈150 cells across the square) produced similar trends, with correlations of r = −0.180 for exploration and r = −0.352 for task-oriented activity (both p < 0.001).
To avoid floor effects from the large proportion of minimally used pixels, we repeated the analysis after excluding the lowest 10% and 25% of activity values. When only higher-activity cells were retained, correlations in the exploration condition weakened further (r ≈ −0.07 to −0.10), whereas in the task-oriented condition they strengthened substantially (r ≈ −0.36 to −0.41, all p < 0.001). This contrast highlights that while free exploration led to more diffuse and loosely structured use of space, task-driven activity systematically prioritized low-visibility edge zones as anchors for estimating spatial extent.
Finally, a bivariate quadrant classification of activity versus visibility confirmed these tendencies (Figure 7). High-activity × low-visibility cells accounted for the largest share in both conditions, but they were notably more frequent under the task-oriented instruction. By comparison, exploration showed a greater presence of mixed or high-visibility cells, underscoring its more wandering and less constrained behavioral mode.
Together, these results demonstrate that participants’ movement patterns in VR were strongly modulated by task context. Free exploration encouraged dispersed and exploratory use of space, whereas task-oriented estimation drove participants toward low-visibility pockets and boundaries. This situational contrast underscores how environmental visibility interacts with behavioral goals to structure activity within heritage-inspired urban squares.

4.4. Understanding: Enhancement of Heritage Cognition and Protecting Intentions

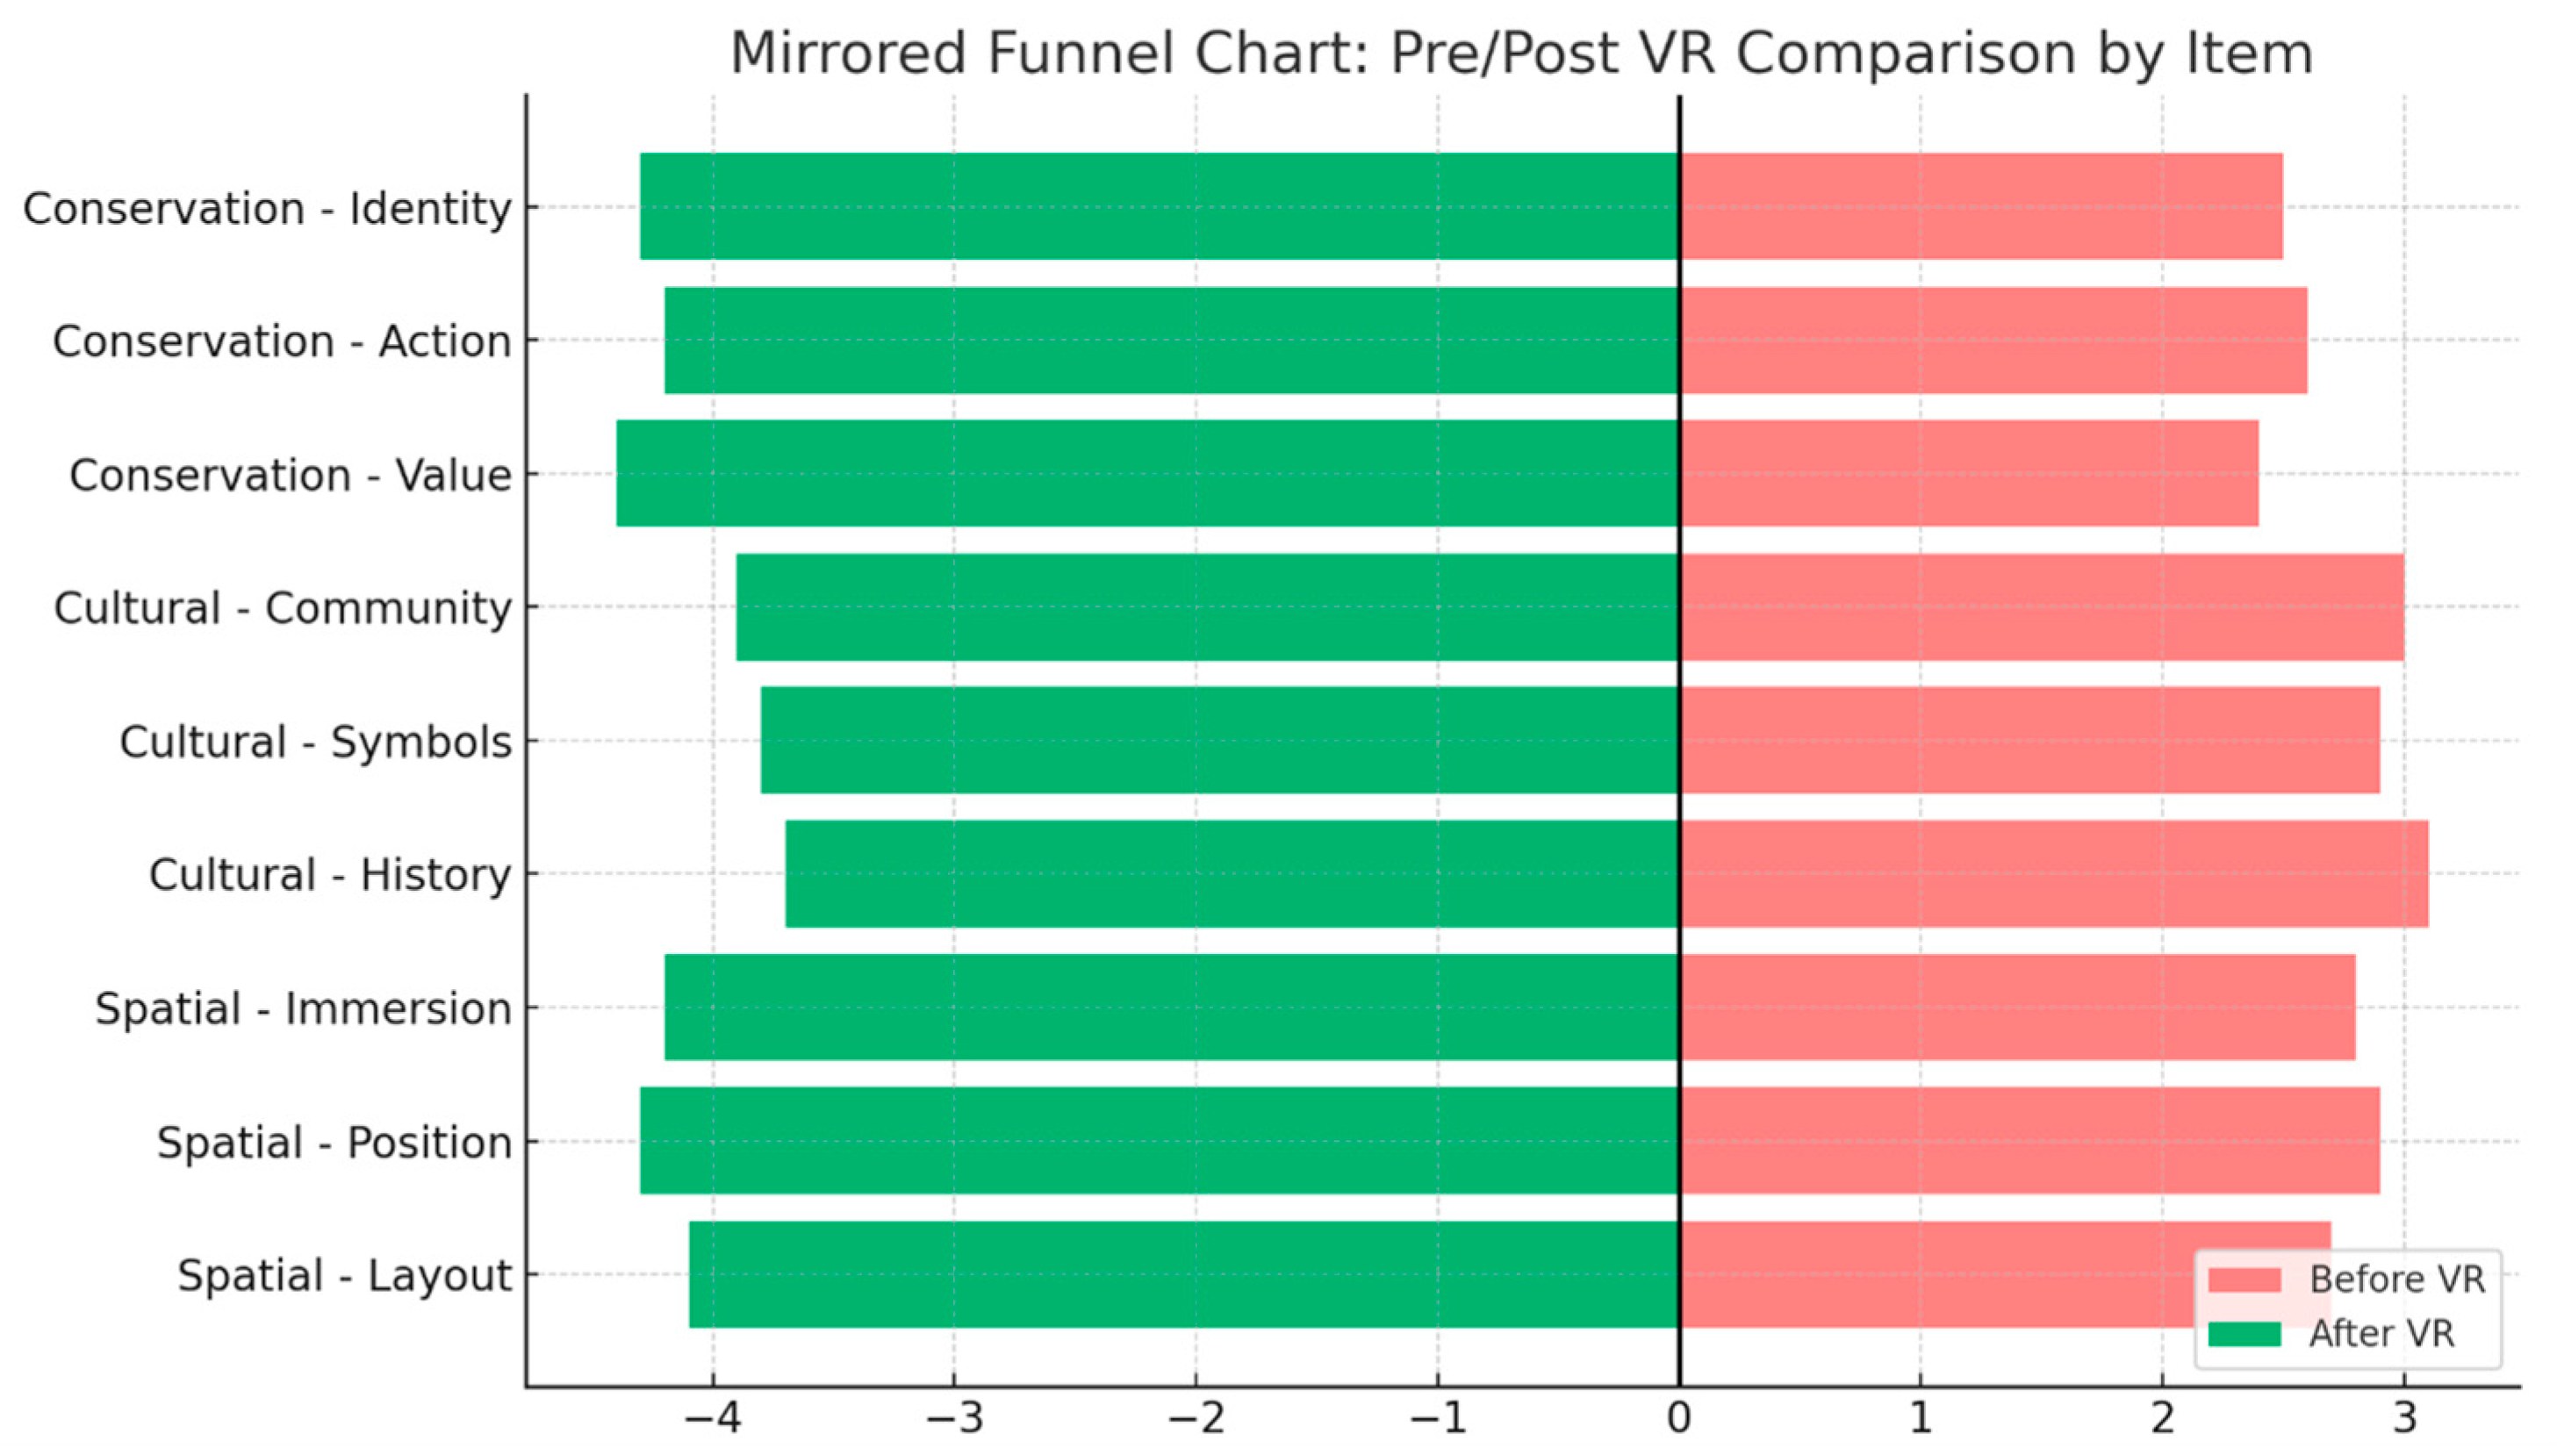
The interview data showed clear improvements in participants’ cultural cognition after the VR experience (Figure 8). In terms of spatial understanding, participants reported that the immersive perspective helped them better grasp the square’s overall layout and the spatial relationships between façades, arcades, and open areas. Many indicated that the experience transformed abstract information into a coherent mental map. These narratives were consistent with more frequent references to relative positions, spatial scale, and visual immersion in the post-VR interviews compared with the pre-VR baseline. With regard to heritage value identification, most participants acknowledged that the VR environment heightened their awareness of the square’s cultural and symbolic significance. Several commented that the experience made the site feel “alive” and underscored its role as a community gathering place. Mentions of intangible values such as collective identity and local traditions increased substantially after the VR session. A minority of participants felt that the cultural information presented was somewhat limited, but they still described the VR environment as a useful entry point to heritage appreciation. The most pronounced changes appeared in behavioral intentions. Before the VR experience, participants tended to speak in more detached terms, but after the session, many expressed a personal connection with the square and a stronger sense of responsibility for its preservation. They reported being more motivated to visit the site in person, to share their impressions with others, and to support heritage conservation. Typical remarks included statements such as wanting to “go there in real life” or feeling “responsible to protect such places.”
When asked to compare VR with traditional media, participants consistently described VR as more engaging and memorable (Table 3). They noted that the ability to move inside the square and experience its spatial qualities first-hand provided a stronger sense of presence than static images or maps. At the same time, some emphasized that VR should complement rather than replace textual or archival sources, suggesting that immersive technologies are most effective when paired with deeper historical content. Taken together, these results indicate that the VR workflow not only improved participants’ spatial comprehension of an urban heritage site but also strengthened their recognition of its cultural values and enhanced their willingness to support its conservation. The findings support the role of UAV-based immersive environments as effective tools for both heritage interpretation and the transmission of intangible values.

4.5. Results of Comprehensive Evaluation

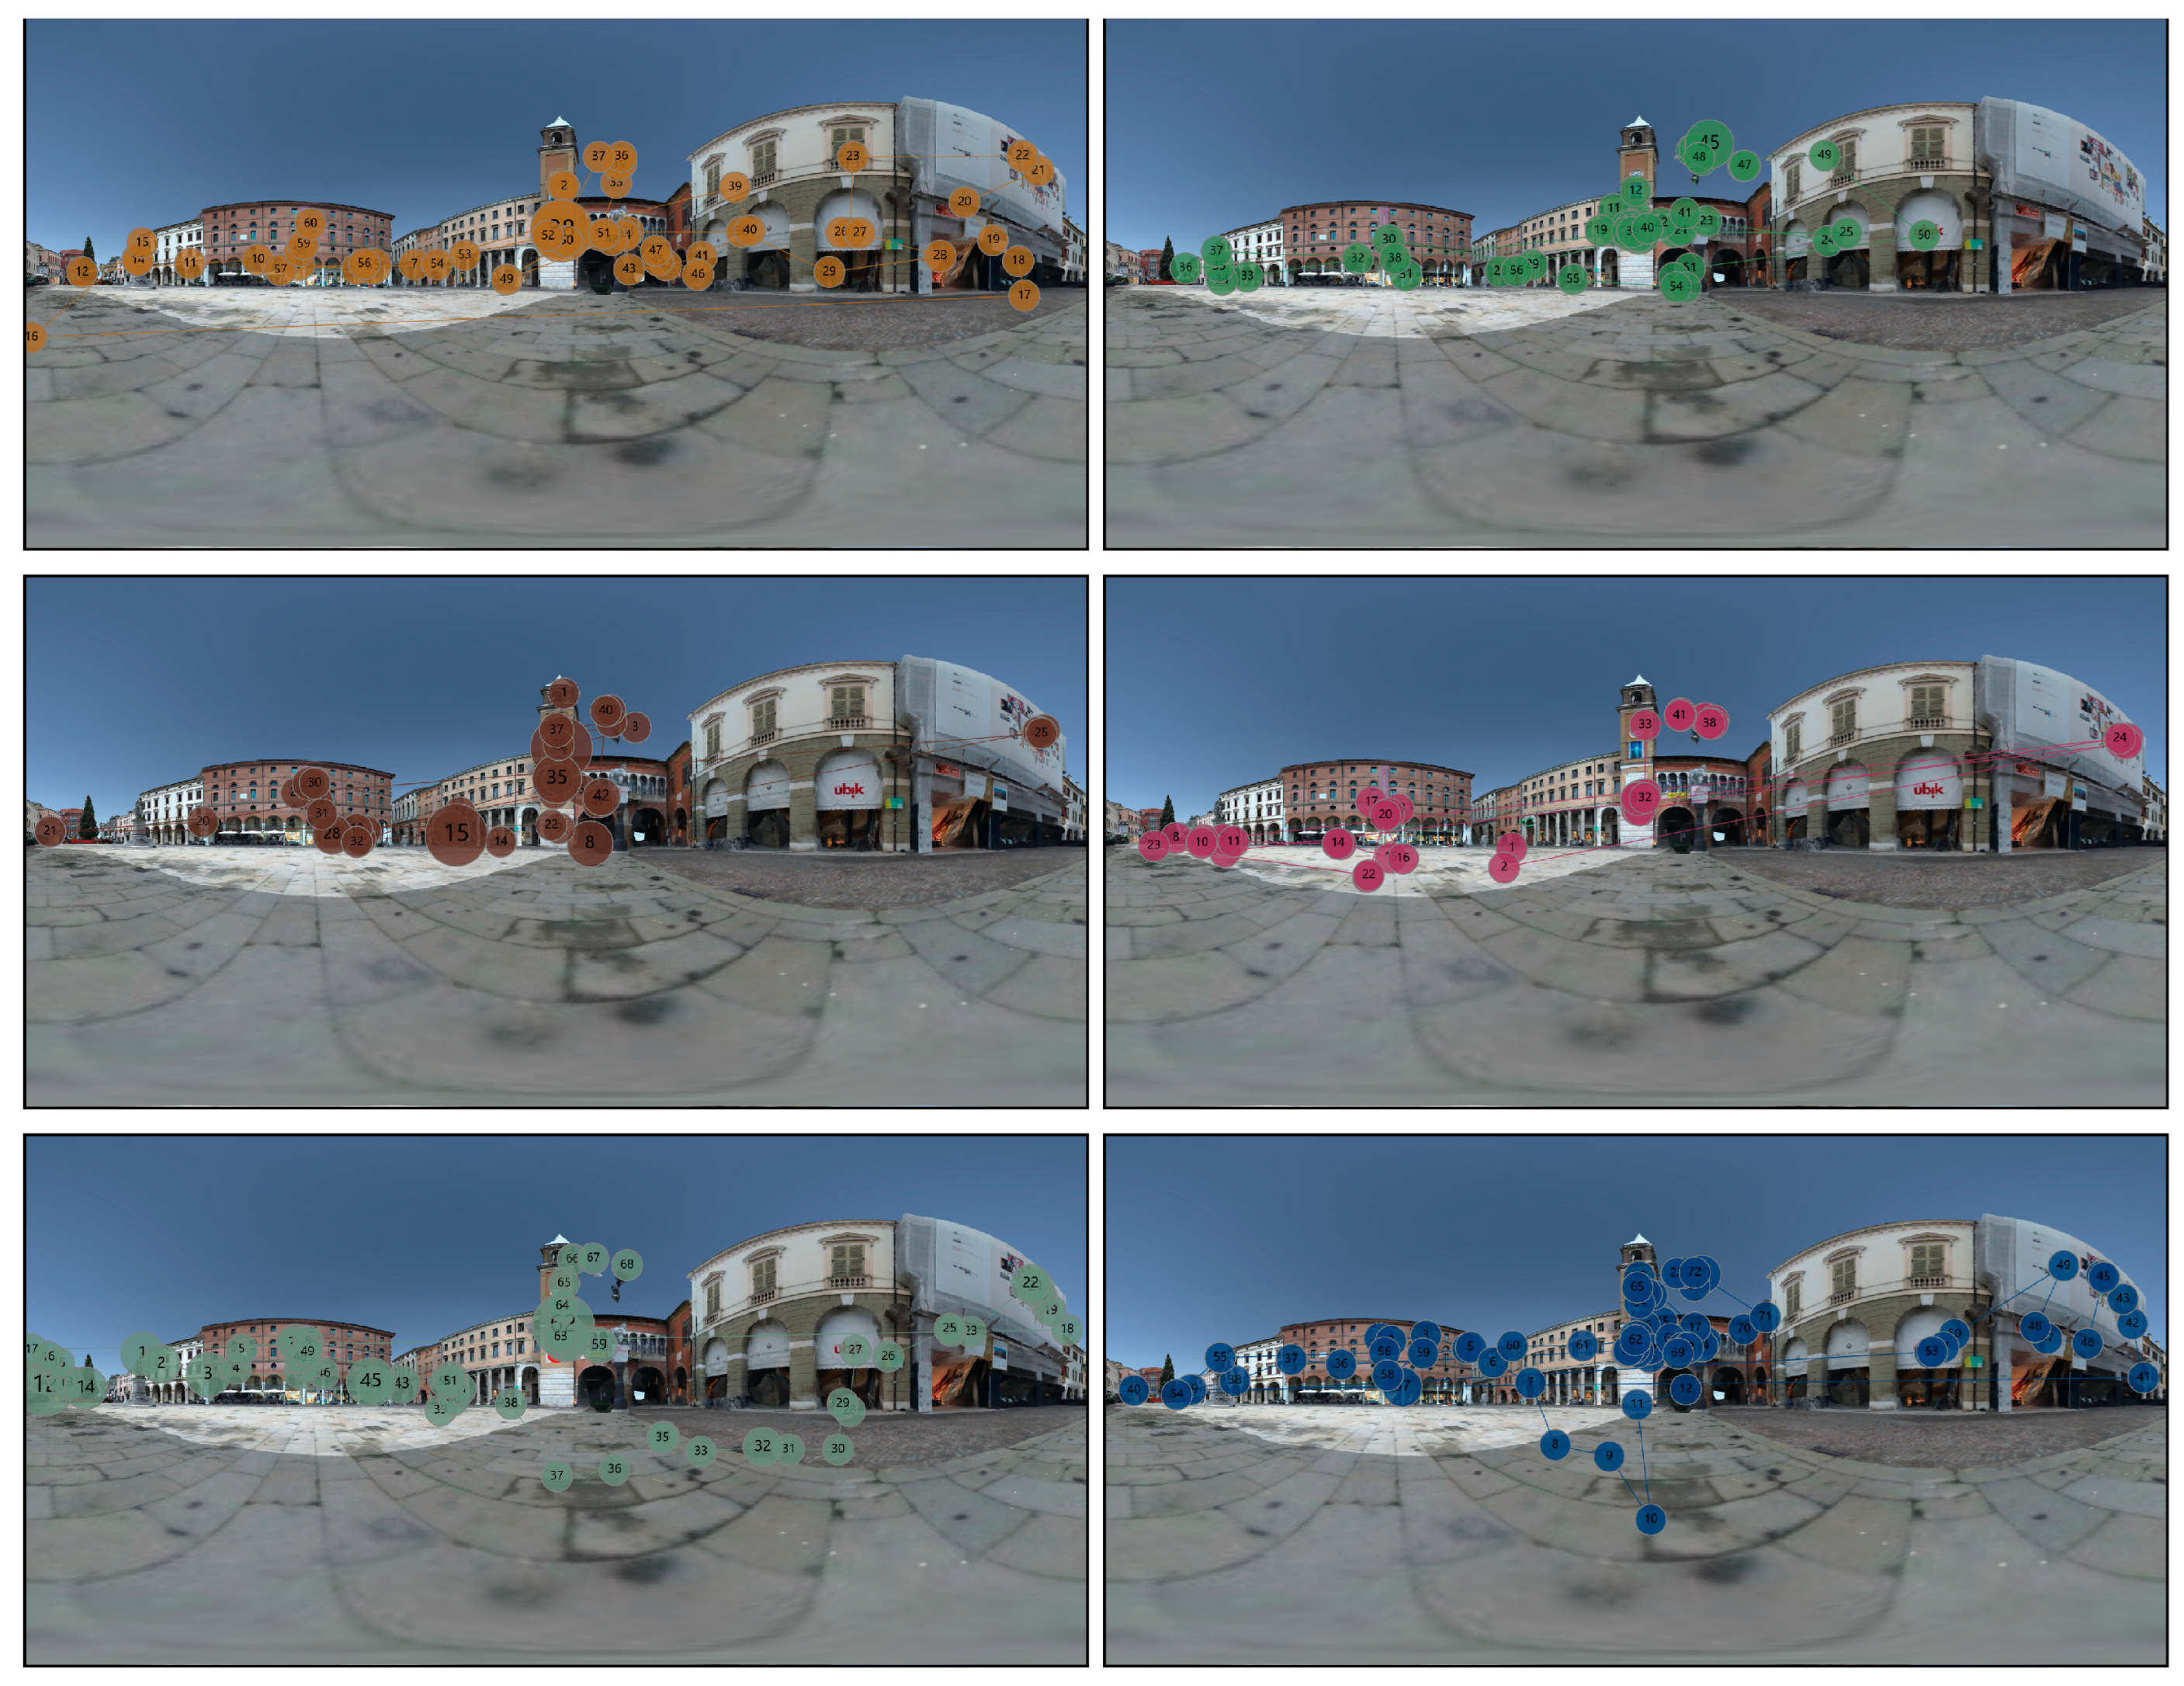
The three layers of evidence consistently point to the same trend. In terms of vision, gaze shifted from dispersed viewing in free exploration to more focused attention on landmarks and panels when tasks were introduced. In terms of behavior, movement became less diffuse and concentrated along edges and corners, showing stronger reliance on low-visibility areas for spatial judgment. In terms of cognition, these combined patterns indicate a purposeful exploration routine that connects seeing, moving, and understanding rather than random wandering (Figure 9).
The integration of UAV and LiDAR data completed roofs and upper façades, reduced blind spots, and ensured stable rendering in VR. This completeness allowed participants to anchor their attention and movement to authentic spatial cues instead of artefacts. Overall, the converging evidence shows that the drone-first workflow not only produces accurate reconstructions but also directly enhances how young users perceive, navigate, and interpret a heritage square in VR.

5. Discussion

This paper demonstrates an end-to-end pipeline that integrates UAV photogrammetry and terrestrial LiDAR with an interactive VR environment for urban-heritage interpretation. The drone-first capture substantially improves façade and roof completeness and stabilizes skyline visibility; when these data are fused and deployed in VR, users exhibit (a) salient attention to landmarks and guidance cues, (b) task-dependent movement strategies that gravitate toward low-visibility edge zones, and (c) measurable gains in spatial understanding, cultural salience, and conservation intentions.

5.1. The Advantages of Using UAV

In this project, UAVs provided a level of completeness and accuracy that would have been difficult to achieve with ground-based methods alone [30,31,32]. The aerial coverage filled typical blind spots, especially the roofs and the upper edges of façades, and when fused with terrestrial data, the model reached centimetre-level registration while still running stably in VR [33,34]. This meant that users experienced a virtual square that was both metrically reliable and visually consistent, without distracting gaps or distortions that could undermine evaluation.
Equally important, Ground LiDAR excels on vertical planes but under-represents roofs and upper edges, weakening skyline continuity and edge readability, cues that people use for landmarking and edge-following. In our drone-first scenes, these UAV-dominant features are restored, which we quantify as higher edge clarity and greater roofline continuity. For immersive environments this is more than a cosmetic advantage: edges and corners serve as key anchors for spatial judgment. In our experiment, participants’ gaze and trajectories converged on these features once guidance was introduced, and this convergence was possible because the drone-completed model rendered the boundaries clearly [35]. Where edges were vague, such as under colonnades, gaze maps appeared scattered and exploratory, confirming that legible geometry is essential for coherent visual behavior [34].
Another strength is affordability. The workflow relied on a consumer-grade UAV combined with handheld terrestrial scanning, which kept costs far lower than survey-grade aerial LiDAR or total station campaigns [36,37]. This makes the approach realistic for under-recognized heritage, including sites in developing or resource-constrained contexts where high-end equipment is impractical. The ability to generate accurate, immersive models with modest investment greatly expands the range of sites that can be digitally preserved and interpreted.
Beyond these core benefits, UAVs also contribute speed, safety, and texture quality. Short sorties with lightweight drones allow rapid resurvey and easy repetition over time, supporting incremental updates of the VR asset. Aerial capture also minimizes risk to people and fragile fabric by documenting inaccessible zones without contact. At the same time, UAV imagery produces uniform, high-quality textures that improve the readability of architectural details and enhance image-led information processing once cultural panels are opened [38].
Finally, the complementarity between UAV and terrestrial scanning strengthens both reconstruction and evaluation. By assigning UAV data to horizontal planes and LiDAR data to occluded verticals, the fused model balances coverage and fidelity [39,40], while clean geometry and multi-level assets sustain high frame rates in VR. This stability ensures that the behavioral patterns observed—such as deliberate activity in low-visibility edge zones—reflect genuine user strategies rather than artefacts of incomplete modeling. In short, UAVs in this workflow do not simply “add coverage,” but provide the geometric clarity, texture fidelity, and logistical efficiency that make immersive evaluation meaningful.

5.2. Significance and Extensibility of the Pipeline

The pipeline developed in this study demonstrates the value of treating data capture, modeling, immersive deployment, and user evaluation as one continuous workflow [41,42]. Rather than isolating UAV photogrammetry as a documentation tool or VR as a communication interface, the pipeline integrates both into a stable and reproducible sequence. Each stage is parameterized, from mission planning and GSD-based capture to cross-sensor alignment and VR optimization, which ensures methodological consistency [42,43]. This stability makes the workflow transferable across sites of similar scale and morphology, providing a practical option for small and medium-sized towns where high-budget digitization projects are unlikely.
An important contribution of the pipeline is that it establishes a research-ready path for virtual behavior studies. The environment links gaze data from the Tobii subsystem with locomotion, head pose, and interaction events recorded in Unity. This synchronization enables fine-grained analysis that connects spatial geometry, such as isovist openness, with perceptual indicators like dwell time and with behavioral outcomes such as trajectory clustering. By embedding these functions directly into the VR environment, the pipeline creates a platform that is useful not only for heritage presentation but also for academic studies of spatial cognition and interaction in complex urban settings.
Another distinctive feature is the incorporation of cultural and semantic information. Historical narratives, interpretive texts, and symbolic elements are delivered as pop-ups and interactive markers within the environment [44]. This enriches the user experience beyond geometric accuracy, allowing the virtual square to function as a medium for heritage education and value transmission. Because the semantic content is layered onto the geometric model, curators and educators can update or expand cultural information without the need to rebuild the scene.
The workflow also shows promise for wider application. Its modular design means that the same assets can support single-user VR sessions, museum installations, school programs, or even future multi-user metaverse scenarios. UAV acquisition can be repeated periodically to refresh the model and support monitoring, turning the environment into a living archive that documents changes over time. Standardized formats and open logging further enable interoperability with other platforms, ensuring that the data and the analyses remain accessible for conservation professionals, educators, and researchers [45].

5.3. Three-Layer Evaluation and Differences from Real-World Behavior

Our three-layer evaluation, combining vision, behavior, and cognition, provides a comprehensive way to assess the workflow. By looking across heatmaps and scanpaths, locomotion traces and activity maps, and interview narratives, the method reduces the risk of relying on a single perspective. The strength lies in convergence: when all three layers show the same trend: attention becoming more focused, movement tightening along edges, and participants articulating clearer spatial and cultural narratives, we can be confident that the observed effects are not accidental but stem from the qualities of the model itself. This framework is also transparent and replicable. The underlying materials are direct and inspectable, such as gaze maps, trajectory overlays, and coded excerpts, which other teams can reproduce or extend at different sites. In this way, the method not only captures user reactions but also makes visible how UAV-enabled completeness in roofs and façades translates into consistent experiential outcomes.
At the same time, the VR setting inevitably shapes behavior in ways that differ from normal on-site experience [46,47]. In the square itself, exploration is influenced by physical effort, social conventions, and safety, whereas in VR, participants can “jump” freely between positions and approach fragile zones without risk. Visual attention is also more narrowly driven by high-contrast elements and interactive panels, because cues such as sound, smell, or airflow are absent. Social context is minimized, which can make exploration more individual and expressive than it would be in reality. These differences underline the value of our three-layer framework: by requiring alignment across vision, behavior, and cognition before drawing conclusions, we can separate genuine spatial reasoning from the peculiarities of the medium. In this sense, the approach not only evaluates one project but also offers a model for studying how drone-based reconstructions support meaningful engagement in immersive heritage environments.

5.4. Limitations

To ensure linguistic fluency and consistency in data interpretation, all participants in this study were drawn from undergraduate and postgraduate education backgrounds. As a result, the sample population does not fully represent the wider public, leading to potential selection bias. Individuals with lower levels of formal education or with limited exposure to cultural heritage and digital technologies were not included, which may restrict the generalizability of the findings to more diverse audiences. Future research should involve participants from a broader range of educational and demographic backgrounds to gain a more comprehensive understanding of public engagement with cultural heritage through VR.
In addition, despite efforts to ensure high accuracy in scanning and modeling, discrepancies inevitably exist between the digital reconstructions and the actual heritage site. Hardware limitations, software algorithms, data resolution constraints, and interpretation errors can result in deviations in scale, texture, and structural details. The necessary simplification of complex architectural elements for computational performance may also lead to the loss of fine features. Such variations can influence the perceived authenticity of the VR environment and, in turn, affect user engagement and learning outcomes.

6. Conclusions

This paper addressed three research questions through the case of Piazza Vittorio Emanuele II in Rovigo. For RQ1, we established a comprehensive end-to-end workflow that integrates UAV photogrammetry with terrestrial scanning and immersive VR. The pipeline moves from hybrid data capture to multi-sensor fusion, optimized modeling, and deployment in Unity, ensuring both geometric completeness and stable rendering suitable for user interaction. For RQ2, we proposed and applied a three-layer evaluation framework linking vision, behavior, and cognition. Eye-tracking, activity maps, and interview narratives revealed converging patterns—from dispersed to guided attention, from diffuse roaming to edge-anchored exploration, and from unstructured actions to purposeful evidence gathering—demonstrating how the workflow’s technical quality translates into measurable experiential outcomes. For RQ3, we identified the main advantages of the approach: UAVs enhance roof and edge completeness that ground scanning alone cannot achieve, they sharpen boundaries that stabilize attention in VR, and they do so at relatively low cost, making the method applicable to heritage sites that lack resources for high-end digitization.
The contributions of this study are twofold. First, it delivers a replicable, affordable, and transferable end-to-end workflow that can be adapted to similar urban squares and arcaded streetscapes. Second, it provides empirical evidence that UAV-enabled completeness not only improves technical accuracy but also shapes perception, navigation, and cultural interpretation in immersive environments. Together, these findings show that these pipelines can support both the technical and cultural missions of heritage digitization, while offering a methodological template for future cross-site applications and evaluations.

Author Contributions

Conceptualization, C.Z. and Y.Y.; methodology, C.Z. and G.L.; software, Y.P. and G.L.; validation, C.Z., G.L. and Y.P.; formal analysis, C.Z.; investigation, C.Z. and G.L.; resources, Y.Y.; data curation, G.L.; writing—original draft preparation, C.Z.; writing—review and editing, Y.Y., Y.P. and G.L.; visualization, Y.P. and C.Z.; supervision, Y.Y.; project administration, Y.Y. All authors have read and agreed to the published version of the manuscript.

Funding

This research received no external funding.

Data Availability Statement

The UAV imagery, terrestrial LiDAR scans, and derived 3D/VR assets supporting the findings of this study contain location-sensitive cultural heritage information and participant data. De-identified evaluation outputs (e.g., aggregated eye-tracking and locomotion metrics) are available from the corresponding author (Y.Y.) upon reasonable request. Access to raw site data may be restricted by heritage protection and site-access agreements.

Acknowledgments

We thank the local heritage authorities and site managers in Rovigo for access and logistical support, and our laboratory colleagues for assistance with UAV operations, LiDAR capture, eye-tracking setup, and VR deployment. We are grateful to all study participants.

Conflicts of Interest

The authors declare no conflicts of interest.

References

  1. Bandarin, F.; Van Oers, R. The Historic Urban Landscape: Managing Heritage in an Urban Century; John Wiley & Sons: Hoboken, NJ, USA, 2012. [Google Scholar] [CrossRef]
  2. Wang, K.; Fouseki, K. Sustaining the Fabric of Time: Urban Heritage, Time Rupture, and Sustainable Development. Land 2025, 14, 193. [Google Scholar] [CrossRef]
  3. Zhang, J.; Wang, G.; Chen, H.; Huang, H.; Shi, Y.; Wang, Q. Internet of Things and Extended Reality in Cultural Heritage: A Review on Reconstruction and Restoration, Intelligent Guided Tour, and Immersive Experiences. IEEE Internet Things J. 2025, 12, 19018–19042. [Google Scholar] [CrossRef]
  4. Gibson, J.J. The Ecological Approach to Visual Perception; Classic Edition; Psychology Press: Hove, UK, 2014. [Google Scholar] [CrossRef]
  5. Ulvi, A. Documentation, Three-Dimensional (3D) Modelling and visualization of cultural heritage by using Unmanned Aerial Vehicle (UAV) photogrammetry and terrestrial laser scanners. Int. J. Remote Sens. 2021, 42, 1994–2021. [Google Scholar] [CrossRef]
  6. Pepe, M.; Alfio, V.S.; Costantino, D. UAV Platforms and the SfM-MVS Approach in the 3D Surveys and Modelling: A Review in the Cultural Heritage Field. Appl. Sci. 2022, 12, 12886. [Google Scholar] [CrossRef]
  7. Kerle, N.; Nex, F.; Gerke, M.; Duarte, D.; Vetrivel, A. UAV-Based Structural Damage Mapping: A Review. ISPRS Int. J. Geo-Inf. 2020, 9, 14. [Google Scholar] [CrossRef]
  8. Yang, S.; Hou, M.; Li, S. Three-Dimensional Point Cloud Semantic Segmentation for Cultural Heritage: A Comprehensive Review. Remote Sens. 2023, 15, 548. [Google Scholar] [CrossRef]
  9. Hu, D.; Minner, J. UAVs and 3D City Modeling to Aid Urban Planning and Historic Preservation: A Systematic Review. Remote Sens. 2023, 15, 5507. [Google Scholar] [CrossRef]
  10. Templin, T.; Popielarczyk, D. The Use of Low-Cost Unmanned Aerial Vehicles in the Process of Building Models for Cultural Tourism, 3D Web and Augmented/Mixed Reality Applications. Sensors 2020, 20, 5457. [Google Scholar] [CrossRef]
  11. Georgopoulos, A.; Stathopoulou, E.K. Data Acquisition for 3D Geometric Recording: State of the Art and Recent Innovations. In Heritage and Archaeology in the Digital Age: Acquisition, Curation, and Dissemination of Spatial Cultural Heritage Data; Vincent, M.L., López-Menchero Bendicho, V.M., Ioannides, M., Levy, T.E., Eds.; Springer International Publishing: Cham, Switzerland, 2017; pp. 1–26. [Google Scholar] [CrossRef]
  12. Economou, M. Heritage in the Digital Age. In A Companion to Heritage Studies; Wiley Online Library: Hoboken, NJ, USA, 2015; pp. 215–228. [Google Scholar] [CrossRef]
  13. Santos, I.; Henriques, R.; Mariano, G.; Pereira, D.I. Methodologies to Represent and Promote the Geoheritage Using Unmanned Aerial Vehicles, Multimedia Technologies, and Augmented Reality. Geoheritage 2018, 10, 143–155. [Google Scholar] [CrossRef]
  14. Yu, Y.; Verbree, E.; van Oosterom, P.; Pottgiesser, U. 3D Gaussian Splatting for Modern Architectural Heritage: Integrating UAV-Based Data Acquisition and Advanced Photorealistic 3D Techniques. Agil. GISci. Ser. 2025, 6, 51. [Google Scholar] [CrossRef]
  15. Choi, K.; Nam, Y. Do Presence and Authenticity in VR Experience Enhance Visitor Satisfaction and Museum Re-Visitation Intentions? Int. J. Tour. Res. 2024, 26, e2737. [Google Scholar] [CrossRef]
  16. Barrado-Timón, D.A.; Hidalgo-Giralt, C. The Historic City, Its Transmission and Perception via Augmented Reality and Virtual Reality and the Use of the Past as a Resource for the Present: A New Era for Urban Cultural Heritage and Tourism? Sustainability 2019, 11, 2835. [Google Scholar] [CrossRef]
  17. Yan, Y.; Du, Q. From digital imagination to real-world exploration: A study on the influence factors of VR-based reconstruction of historical districts on tourists’ travel intention in the field. Virtual Real. 2025, 29, 85. [Google Scholar] [CrossRef]
  18. Schott, E.; Makled, E.B.; Zoeppig, T.J.; Muehlhaus, S.; Weidner, F.; Broll, W.; Froehlich, B. UniteXR: Joint Exploration of a Real-World Museum and its Digital Twin. In Proceedings of the 29th ACM Symposium on Virtual Reality Software and Technology, Christchurch, New Zealand, 9–11 October 2023; Association for Computing Machinery: New York, NY, USA, 2023; pp. 1–10. [Google Scholar] [CrossRef]
  19. Bolognesi, C.M.; Fiorillo, F. Virtual Representations of Cultural Heritage: Sharable and Implementable Case Study to Be Enjoyed and Maintained by the Community. Buildings 2023, 13, 410. [Google Scholar] [CrossRef]
  20. Szóstak, M.; Mahamadu, A.-M.; Prabhakaran, A.; Caparros Pérez, D.; Agyekum, K. Development and testing of immersive virtual reality environment for safe unmanned aerial vehicle usage in construction scenarios. Saf. Sci. 2024, 176, 106547. [Google Scholar] [CrossRef]
  21. Elghaish, F.; Matarneh, S.; Talebi, S.; Kagioglou, M.; Hosseini, M.R.; Abrishami, S. Toward digitalization in the construction industry with immersive and drones technologies: A critical literature review. Smart Sustain. Built Environ. 2020, 10, 345–363. [Google Scholar] [CrossRef]
  22. Lynch, K. “The Image of the Environment” and “The City Image and Its Elements”: From The Image of the City (1960). In The Urban Design Reader; Routledge: Abingdon, UK, 2013; pp. 125–138. ISBN 978-0-262-62001-7. [Google Scholar]
  23. Guccio, C.; Martorana, M.F.; Mazza, I.; Rizzo, I. Technology and Public Access to Cultural Heritage: The Italian Experience on ICT for Public Historical Archives. In Cultural Heritage in a Changing World; Borowiecki, K.J., Forbes, N., Fresa, A., Eds.; Springer International Publishing: Cham, Switzerland, 2016; pp. 55–75. [Google Scholar] [CrossRef]
  24. Montello, D.R. Navigation. In The Cambridge Handbook of Visuospatial Thinking; Shah, P., Miyake, A., Eds.; Cambridge University Press: Cambridge, UK, 2005; pp. 257–294. [Google Scholar] [CrossRef]
  25. Wiener, J.M.; Büchner, S.J.; Hölscher, C. Taxonomy of Human Wayfinding Tasks: A Knowledge-Based Approach Taxonomy of Human Wayfinding Tasks: A Knowledge-Based Approach. Spat. Cogn. Comput. 2009, 9, 152–165. [Google Scholar] [CrossRef]
  26. Zhang, L.-M.; Zhang, R.-X.; Jeng, T.-S.; Zeng, Z.-Y. Cityscape protection using VR and eye tracking technology. J. Vis. Commun. Image Represent. 2019, 64, 102639. [Google Scholar] [CrossRef]
  27. Wu, Z.; Wang, Y.; Gan, W.; Zou, Y.; Dong, W.; Zhou, S.; Wang, M. A Survey of the Landscape Visibility Analysis Tools and Technical Improvements. Int. J. Environ. Res. Public Health 2023, 20, 1788. [Google Scholar] [CrossRef] [PubMed]
  28. Omrani Azizabad, S.; Mahdavinejad, M.; Hadighi, M. Three-dimensional embodied visibility graph analysis: Investigating and analyzing values along an outdoor path. Environ. Plan. B Urban Anal. City Sci. 2025, 52, 1669–1684. [Google Scholar] [CrossRef]
  29. Mazzetto, S. Integrating Emerging Technologies with Digital Twins for Heritage Building Conservation: An Interdisciplinary Approach with Expert Insights and Bibliometric Analysis. Heritage 2024, 7, 6432–6479. [Google Scholar] [CrossRef]
  30. Jo, Y.H.; Hong, S. Three-Dimensional Digital Documentation of Cultural Heritage Site Based on the Convergence of Terrestrial Laser Scanning and Unmanned Aerial Vehicle Photogrammetry. ISPRS Int. J. Geo-Inf. 2019, 8, 53. [Google Scholar] [CrossRef]
  31. Nex, F.; Remondino, F. UAV for 3D mapping applications: A review. Appl. Geomat. 2014, 6, 1–15. [Google Scholar] [CrossRef]
  32. Chiabrando, F.; Di Pietra, V.; Lingua, A.; Maschio, P.; Noardo, F.; Sammartano, G.; Spano, A. TLS MODELS GENERATION ASSISTED BY UAV SURVEY. ISPRS-Int. Arch. Photogramm. Remote Sens. Spat. Inf. Sci. 2016, XLI-B5, 413–420. [Google Scholar] [CrossRef]
  33. Murtiyoso, A.; Koehl, M.; Grussenmeyer, P.; Freville, T. ACQUISITION AND PROCESSING PROTOCOLS FOR UAV IMAGES: 3D MODELING OF HISTORICAL BUILDINGS USING PHOTOGRAMMETRY. ISPRS Ann. Photogramm. Remote Sens. Spat. Inf. Sci. 2017, IV-2/W2, 163–170. [Google Scholar] [CrossRef]
  34. de la Fuente Suárez, L.A. Subjective experience and visual attention to a historic building: A real-world eye-tracking study. Front. Archit. Res. 2020, 9, 774–804. [Google Scholar] [CrossRef]
  35. Walter, J.L.; Essmann, L.; König, S.U.; König, P. Finding landmarks—An investigation of viewing behavior during spatial navigation in VR using a graph-theoretical analysis approach. PLoS Comput. Biol. 2022, 18, e1009485. [Google Scholar] [CrossRef]
  36. Bakirman, T.; Bayram, B.; Akpinar, B.; Karabulut, M.F.; Bayrak, O.C.; Yigitoglu, A.; Seker, D.Z. Implementation of ultra-light UAV systems for cultural heritage documentation. J. Cult. Herit. 2020, 44, 174–184. [Google Scholar] [CrossRef]
  37. Nex, F.; Armenakis, C.; Cramer, M.; Cucci, D.A.; Gerke, M.; Honkavaara, E.; Kukko, A.; Persello, C.; Skaloud, J. UAV in the advent of the twenties: Where we stand and what is next. ISPRS J. Photogramm. Remote Sens. 2022, 184, 215–242. [Google Scholar] [CrossRef]
  38. Dostal, C.; Yamafune, K. Photogrammetric texture mapping: A method for increasing the Fidelity of 3D models of cultural heritage materials. J. Archaeol. Sci. Rep. 2018, 18, 430–436. [Google Scholar] [CrossRef]
  39. Mat Adnan, A.; Darwin, N.; Ariff, M.F.M.; Majid, Z.; Idris, K.M. INTEGRATION BETWEEN UNMANNED AERIAL VEHICLE AND TERRESTRIAL LASER SCANNER IN PRODUCING 3D MODEL. ISPRS-Int. Arch. Photogramm. Remote Sens. Spat. Inf. Sci. 2019, XLII-4/W16, 391–398. [Google Scholar] [CrossRef]
  40. Tysiac, P.; Sieńska, A.; Tarnowska, M.; Kedziorski, P.; Jagoda, M. Combination of terrestrial laser scanning and UAV photogrammetry for 3D modelling and degradation assessment of heritage building based on a lighting analysis: Case study—St. Adalbert Church in Gdansk, Poland. Herit. Sci. 2023, 11, 53. [Google Scholar] [CrossRef]
  41. Storeide, M.S.B.; George, S.; Sole, A.; Hardeberg, J.Y. Standardization of digitized heritage: A review of implementations of 3D in cultural heritage. Herit. Sci. 2023, 11, 249. [Google Scholar] [CrossRef]
  42. Waagen, J. Documenting drone remote sensing: A reality-based modelling approach for applications in cultural heritage and archaeology. Drone Syst. Appl. 2025, 13, 1–14. [Google Scholar] [CrossRef]
  43. Stanga, C.; Banfi, F.; Roascio, S. Enhancing Building Archaeology: Drawing, UAV Photogrammetry and Scan-to-BIM-to-VR Process of Ancient Roman Ruins. Drones 2023, 7, 521. [Google Scholar] [CrossRef]
  44. Zidianakis, E.; Partarakis, N.; Ntoa, S.; Dimopoulos, A.; Kopidaki, S.; Ntagianta, A.; Ntafotis, E.; Xhako, A.; Pervolarakis, Z.; Kontaki, E.; et al. The Invisible Museum: A User-Centric Platform for Creating Virtual 3D Exhibitions with VR Support. Electronics 2021, 10, 363. [Google Scholar] [CrossRef]
  45. Azzola, P.; Cardaci, A.; Mirabella Roberti, G.; Nannei, V. UAV PHOTOGRAMMETRY FOR CULTURAL HERITAGE PRESERVATION MODELING AND MAPPING VENETIAN WALLS OF BERGAMO. ISPRS-Int. Arch. Photogramm. Remote Sens. Spat. Inf. Sci. 2019, XLII-2/W9, 45–50. [Google Scholar] [CrossRef]
  46. Dumonteil, M.; Gouranton, V.; Macé, M.J.-M.; Nicolas, T.; Gaugne, R. Cognitive Archaeology in Virtual Environment. In Proceedings of the 2025 IEEE Conference on Virtual Reality and 3D User Interfaces Abstracts and Workshops (VRW), Saint Malo, France, 8–12 March 2025; pp. 43–46. [Google Scholar] [CrossRef]
  47. Bozzelli, G.; Raia, A.; Ricciardi, S.; Nino, M.D.; Barile, N.; Perrella, M.; Tramontano, M.; Pagano, A.; Palombini, A. An integrated VR/AR framework for user-centric interactive experience of cultural heritage: The ArkaeVision project. Digit. Appl. Archaeol. Cult. Herit. 2019, 15, 00124. [Google Scholar] [CrossRef]
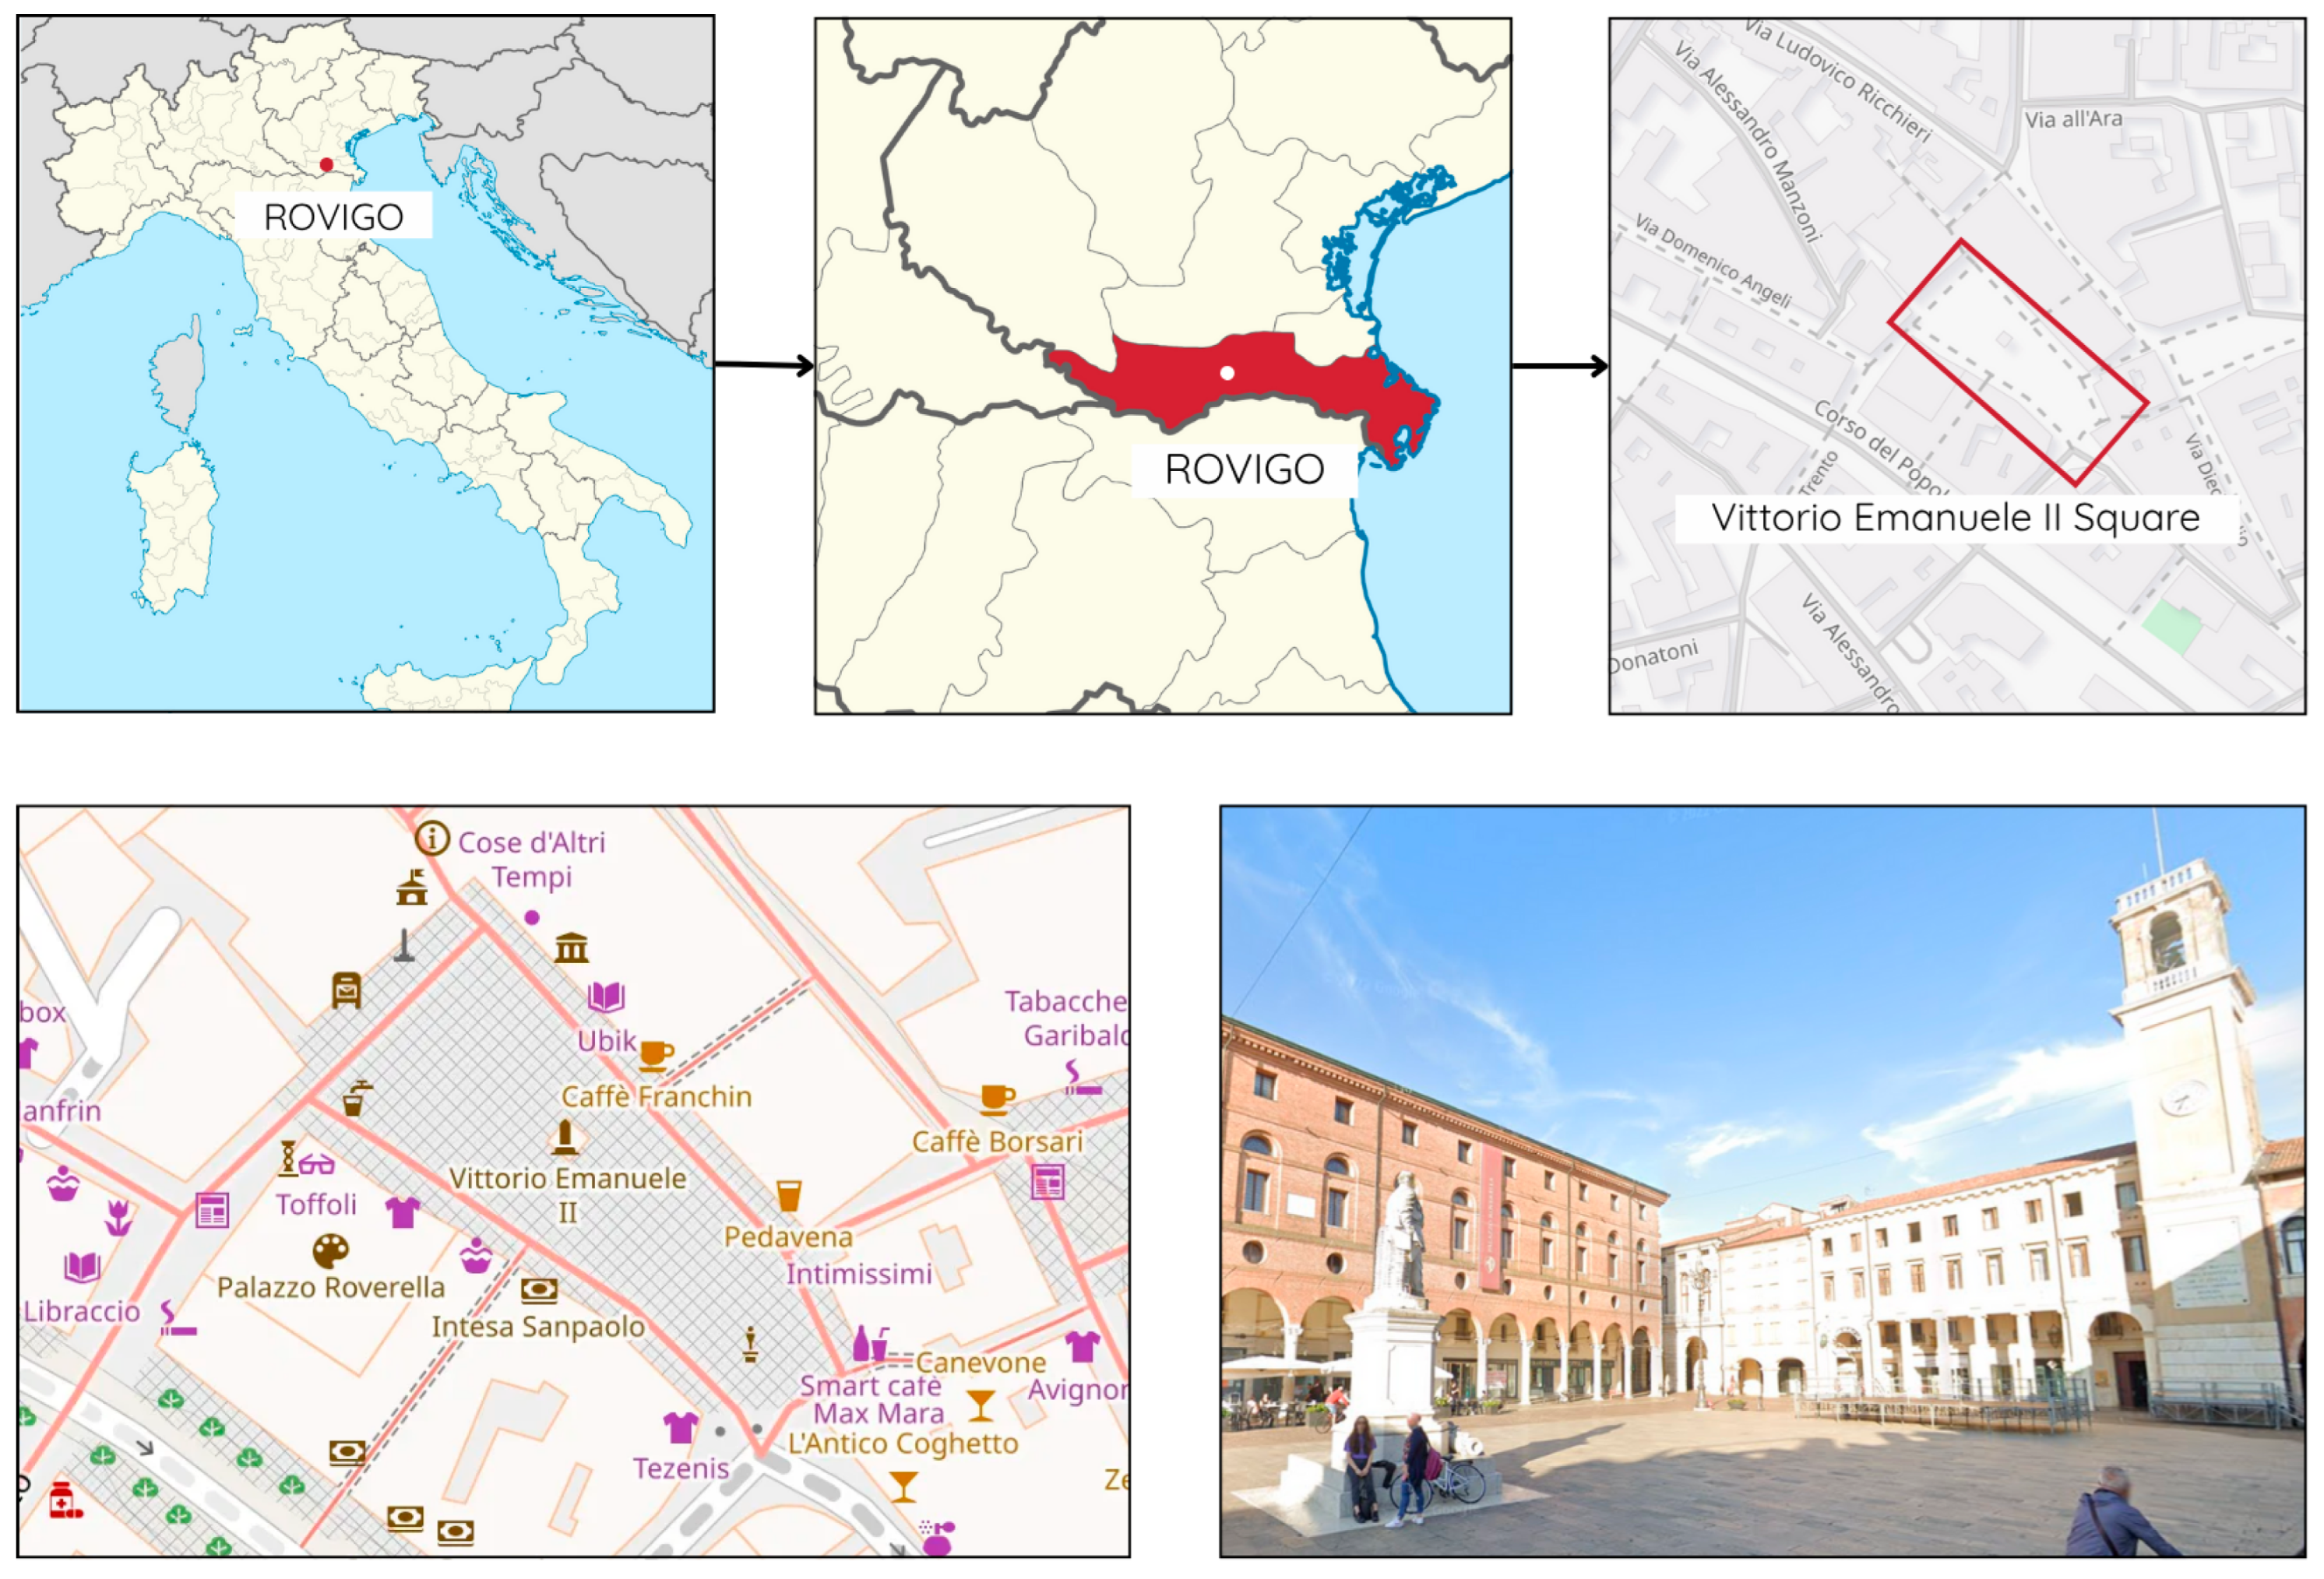
Figure 1. Location of the case study site. From left to right: the position of Rovigo within Italy, its location in the Veneto region, and the outline of Piazza Vittorio Emanuele II within the urban fabric. Bottom row: schematic map of surrounding functions and street network, and street-level view of the square with arcaded façades and the clock tower.
Drones 09 00716 g001
Figure 2. Workflow Overview.
Drones 09 00716 g002
Figure 3. Sample viewpoints A and B: White = walkable area, black = obstacles (buildings, sculptures, arcades). A regular grid provides the sampling scaffold. For each viewpoint, 360° rays are cast at constant angular steps (Δθ = 2–4°) until the first obstacle; the resulting boundary encloses the isovist and is rendered as a gray polygon. These panels illustrate how visibility support is derived for later linkage to gaze and movement metrics.
Drones 09 00716 g003
Figure 4. Three-layer evaluation framework.
Drones 09 00716 g004
Figure 5. Examples of VR scene construction results: (a) Interactive scene showing buildings and material information, (b) interactive scene presenting a monument and historical context, and (c) panorama scenes of Piazza Vittorio Emanuele II.
Drones 09 00716 g005
Figure 6. Visual attention results in the VR environment: The top four panels show gaze heatmaps in the open square: (top left) original scene, (top right) heatmap during free exploration, (bottom left) heatmap with landmark indicators, and (bottom right) heatmap when an information panel is open. The bottom four panels show the same sequence in the shaded arcade space. Compared with the square, where guidance produces clearer and more consistent hotspots, the arcade generates more dispersed and random fixation patterns, reflecting the weaker edge definition and higher ambiguity of this space.
Drones 09 00716 g006
Figure 7. Spatial behavior in relation to visibility in Piazza Vittorio Emanuele II: (a) Main landmarks in the square, (b) cumulative isovist field, (c) heatmap of free exploration, and (d) heatmap of task-oriented exploration. Panels (eh) show the relationship between activity intensity and isovist values after excluding the lowest 10% and 25% of activity cells, highlighting that task-driven exploration exhibits a stronger tendency toward low-visibility edge zones compared with free exploration.
Drones 09 00716 g007
Figure 8. Pre- and post-VR comparison of participants’ responses across spatial, cultural, and conservation dimensions. The mirrored funnel chart shows the average frequency of mentions before and after the VR experience, with consistent increases across all items. The strongest gains appear in spatial immersion and layout understanding, cultural community and symbols, and conservation identity and action.
Drones 09 00716 g008
Figure 9. Example of scanpath maps under guided viewing: When landmark cues were introduced in this visually complex square, participants’ attention and trajectories converged strongly, especially around architectural edges and the boundary of the chandelier-like installation. This consistency indicates that edge information served as a common anchor across individuals. Importantly, such clarity was made possible by UAV capture, which completed roofs and upper façades and thus rendered edges legible and reliable in VR. Without this aerial contribution, participants’ gaze in earlier conditions appeared more dispersed and exploratory, reflecting uncertainty about where structural boundaries lay.
Drones 09 00716 g009
Table 1. Summaries for the hybrid scanning process, including the tools, resolutions, areas and durations for scanning.
Area/ScopeTool UsedResolution (Approx.)Scanning DurationComments
Roof and surrounding environmentDJI UAV (MINI 3)Medium (≈3–6 cm)30–45 minEffective for aerial views and roof details
Entire area and streets/facade areaGeoSLAM ZEB Horizon RT scanner (3D laser scanner)Medium-High (≈1–3 cm)45–60 minIdeal for large-scale mapping and street views
Sculptural details and featuresCanon EOS 700D/archival researchHigh (≈0.5–1.5 mm)1–2 hUsed for intricate details and texture accuracy
Table 2. Participants’ information.
VariableCategoryTotal (n)Total (%)
Age18–2524.9
26–352458.5
36–451229.3
46–5537.3
56+00.0
GenderMale2048.8
Female2151.2
Table 3. Representative answers of interview.
ThemeKey FindingsExample Quotes
Knowledge EnhancementParticipants gained deeper knowledge of materials, craftsmanship, and local traditions.“I never knew about these traditional materials before, but now I understand why they are important.”
Emotional ConnectionVR created a stronger emotional link to cultural heritage, making history feel ‘alive’ rather than distant.“I felt like I was actually in the past, experiencing the site rather than just reading about it.”
Comparison with Traditional MediaVR was described as more immersive and engaging compared to text, images, or videos.“Books tell you about history, but VR lets you feel it.”
Increased Motivation for Heritage PreservationParticipants felt more inclined to protect and promote cultural heritage after experiencing it in VR.“I want to visit the real place now and learn more.”
Disclaimer/Publisher’s Note: The statements, opinions and data contained in all publications are solely those of the individual author(s) and contributor(s) and not of MDPI and/or the editor(s). MDPI and/or the editor(s) disclaim responsibility for any injury to people or property resulting from any ideas, methods, instructions or products referred to in the content.