Article

Optimization Design and Flight Validation of Pull-Up Control for Air-Deployed UAVs Based on Improved NSGA-II

1
Institute of Engineering Thermophysics, Chinese Academy of Sciences, Beijing 100190, China
2
School of Aeronautics and Astronautics, University of Chinese Academy of Sciences, Beijing 100049, China
3
National Key Laboratory of Science and Technology on Advanced Light-Duty Gas-Turbine, Beijing 100049, China
*
Author to whom correspondence should be addressed.
Drones 2025, 9(10), 679; https://doi.org/10.3390/drones9100679
Submission received: 20 August 2025 / Revised: 22 September 2025 / Accepted: 28 September 2025 / Published: 29 September 2025

Abstract

During the automatic leveling process of small low-cost unmanned aerial vehicles (UAVs) after airdrop, their state parameters and control surface efficiency undergo drastic changes. It is difficult to achieve good control effects using controllers with fixed parameters. To solve these problems, this study proposes a parameter adaptive PID controller based on indicated airspeed. When tuning the controller parameters, in order to ensure the successful pulling of the UAV and the safety of structure and flight, it is necessary to optimize the success rate of pulling up, normal overload, angle of attack (AOA), airspeed, and descent altitude simultaneously. These five indicators are of different importance to the UAV. To facilitate parameter tuning based on these differences, an improved second-generation non-dominated sorting genetic algorithm (NSGA-II) is proposed, which combines a comprehensive fitness mechanism based on target priority and segmented scoring and an adaptive genetic strategy. In this study, different priorities were set for all indicators, and segmented scores were given based on individual indicators to calculate the comprehensive fitness, which guided the evolutionary direction of the population. Then, while the genetic parameters were modified, elite individuals were retained to balance search ability and convergence. Finally, the effectiveness of this mechanism was confirmed through comparative simulation. The flight test results show significant differences from the simulation results of the controller designed in this study, but the basic trend remains consistent. The controller can effectively suppress the oscillations caused by the initial state.

1. Introduction

The rapid development of UAV technology has enabled autonomous flight for small, low-cost UAVs. Compared to large aircraft or manned vehicles, these UAVs offer lower maintenance and mission costs while achieving precise task execution at designated locations. As a result, they are widely used in applications such as search and rescue, material delivery and military reconnaissance. However, due to inherent limitations, they often rely on larger carrier platforms for transportation to mission areas such as remote regions like mountains, islands, or forests far from support bases, where they are deployed via airdrop after being transported by the carrier aircraft.
Automatic pull up after airdrop is different from taxiing [1], boosting [2], and vertical takeoff [3]. The initial attitude of the UAV is almost vertically downward under the action of gravity. The three degrees of freedom of linear velocity are restricted while those of rigid body rotation are not. After release, the UAV accelerates under the action of gravity and propeller thrust, and the control surface is then manipulated to automatically adjust the attitude to near horizontal.
Several researchers have conducted experimental studies on UAV aerial deployment: Finigian et al. [4] proposed a general tube-launch UAV scheme and validated its automatic pull-up capability using a rotorcraft carrier for deployment. Lu et al. [5] adopted a fixed-wing carrier aircraft with a catapult-launch mechanism, successfully completing flight tests for the deployment, launch, and cruise of a small folding-wing UAV. Watson et al. [6] proposed a folding-wing UAV system deployed at high altitudes using rockets and conducted preliminary validation through a scaled-down model. Wang et al. [7] tested the effects of different initial pitch angles, release modes, wind disturbances, and control surface deviations on the pulling process of a scaled model of a solar powered UAV. However, research on control law design for the automatic pull-up process after airdrop remains limited: Liu [8] modeled the automatic pull-up process of a parachute-launched small UAV and used a PID controller to control the process, but did not analyze the overload, AOA, and airspeed data from flight tests, which are factors that affect structural and flight safety. Qu et al. [9] also used a PID controller to verify the ability of UAV to automatically pull up after being launched through high-altitude balloons. The aircraft in their study adopts a delta wing layout, and the total weight of the aircraft is only 180 g . Overload has little effect on this type of aircraft. However, the aircraft in this study is a tandem wing layout with a long wingspan. If the normal overload is large, it may cause the wing to bend significantly during the pull-up process, and the connection between the wing and the fuselage will bear a large force. In addition, due to limitations in application scenarios, the AOA, airspeed, and descent altitude during the process of UAV deployment also need to be considered, and the interrelationships between these parameters have not been well elucidated in previous studies.
During the automatic pull-up process of UAV after airdrop, the longitudinal channel parameters such as altitude, airspeed, pitch angle, and AOA vary greatly. Simulation and experimental studies by Cheng et al. [10] have confirmed this, which makes it difficult for a PID controller with fixed parameters to adapt to this process. Several researchers have proposed improvements to address this problem: Zhang et al. [11] developed a variable-universe fractal dual fuzzy PID controller to resolve longitudinal instability during the vertical takeoff-to-level flight transition of tail-sitter UAVs. The initial state of this process is horizontal flight. But in this study the initial state is almost vertically downward. Megyesi et al. [12] proposed an adaptive PID controller based on airspeed to improve robustness, but its controller design is based on a small disturbance linearization model. However, during the process of pulling up the UAV after airdrop, the system state is in an unbalanced state. Therefore, this method is not suitable. Hu et al. [13] designed an adaptive PID controller for a large-wingspan UAV launched from a balloon, with the proportional coefficient being set to be inversely proportional to the dynamic pressure, but not to the integral and differential channels. This design may result in the controller weakening the weight of control surface effectiveness changes when the integral and differential channels have a significant impact, and this study did not pay attention to state parameters such as overload and AOA that affect flight safety during the pulling process.
The automatic pull-up process after airdrop must satisfy multiple objectives simultaneously, including ensuring successful pulling up, ensuring structural safety, reducing stall risk, maintaining the speed within the right envelope, and reducing descent height. These optimization objectives are inherently conflicting and have varying degrees of importance, necessitating a multi-objective optimization algorithm for controller parameter tuning. The NSGA-II provides a viable approach to address such problems. Similar to most heuristic optimization algorithms, NSGA-II can easily become trapped in local optima. Several studies have proposed improvements to solve this problem: Zhao et al. [14] introduced a segmented crossover strategy to help the population escape local optima. Zhao et al. [15] divided the population into four subpopulations employing different crossover strategies and dynamically adjusted their sizes based on their contributions to the elite solution set. Du et al. [16] improved local search performance by combining Tent mapping initialization, hybrid local search, and an adaptive elite selection strategy to balance convergence and diversity. Most of these studies involved two-to-three objective functions, though some extended to five [17] or more [18]. However, few considered the varying importance levels among objectives. Zhang et al. [19] prioritized higher-importance objectives in the non-dominated sorting critical layer using an objective importance vector, addressing the uneven solution distribution caused by crowding distance in high-dimensional objectives. Nevertheless, this study did not fully resolve the issue of local optima entrapment.
In summary, there is currently limited research on improving NSGA-II by addressing the varying importance of objective functions. At the same time, in this study, the automatic pulling up of the UAV requires optimization of the simulation success rate, normal overload, AOA, airspeed and descent altitude. With numerous objective functions, it is easy to fall into local optima [18]. Therefore, a mechanism is needed for the population to evolve in a directional manner based on the importance of the target while avoiding premature maturation during the evolution process.
To address the UAV’s control problem of the process of pulling up after being airdropped, a six-degree-of-freedom (6-DOF) model was established. Then, an adaptive PID controller based on airspeed was designed to track pitch angle commands, and a sine command generator was designed to generate pitch angle commands for guiding the drone to pull up. In order to perform multi-objective optimization design on the controller, a target priority and segmented scoring mechanism was introduced in NSGA-II to calculate the comprehensive fitness, and genetic operations were then performed through a tournament method to guide the evolutionary direction of the population. Meanwhile, the genetic strategy of the population was adjusted based on its convergence to avoid premature maturation. Finally, the effectiveness of the algorithm for controller tuning and the robustness of the controller was verified through comparative simulations and flight tests.

2. System Model and Problem Description

2.1. UAV’s Model

The UAV features a tandem-wing configuration with a pair of control surfaces mounted on the rear wing. A motor-driven propeller at the tail provides thrust. The key structural parameters include the following: a 1357 mm front wing span, 990 mm rear wing span, 828 mm fuselage length, and 188 mm vertical tail height. The total weight is 5.65 kg , as shown in Figure 1.
For the convenience of research, this study makes the following assumptions about the UAV:
  • The structure and mass distribution are symmetrical, and the UAV is considered a rigid body. In fact, when the overload is large, the wings of the UAV will bend, so it is necessary to limit the maximum overload during the pulling process.
  • The aerodynamic model was obtained through CFD calculations and has not been calibrated through wind tunnel tests. The calculation results of UAV aerodynamic data under high AOA are inaccurate. In order to ensure the rigor of simulation and the safety of flight test, the aerodynamic data only under low AOA are assumed as accurate. When tune the controller parameters, the occurrence of high AOA situations will be avoided.
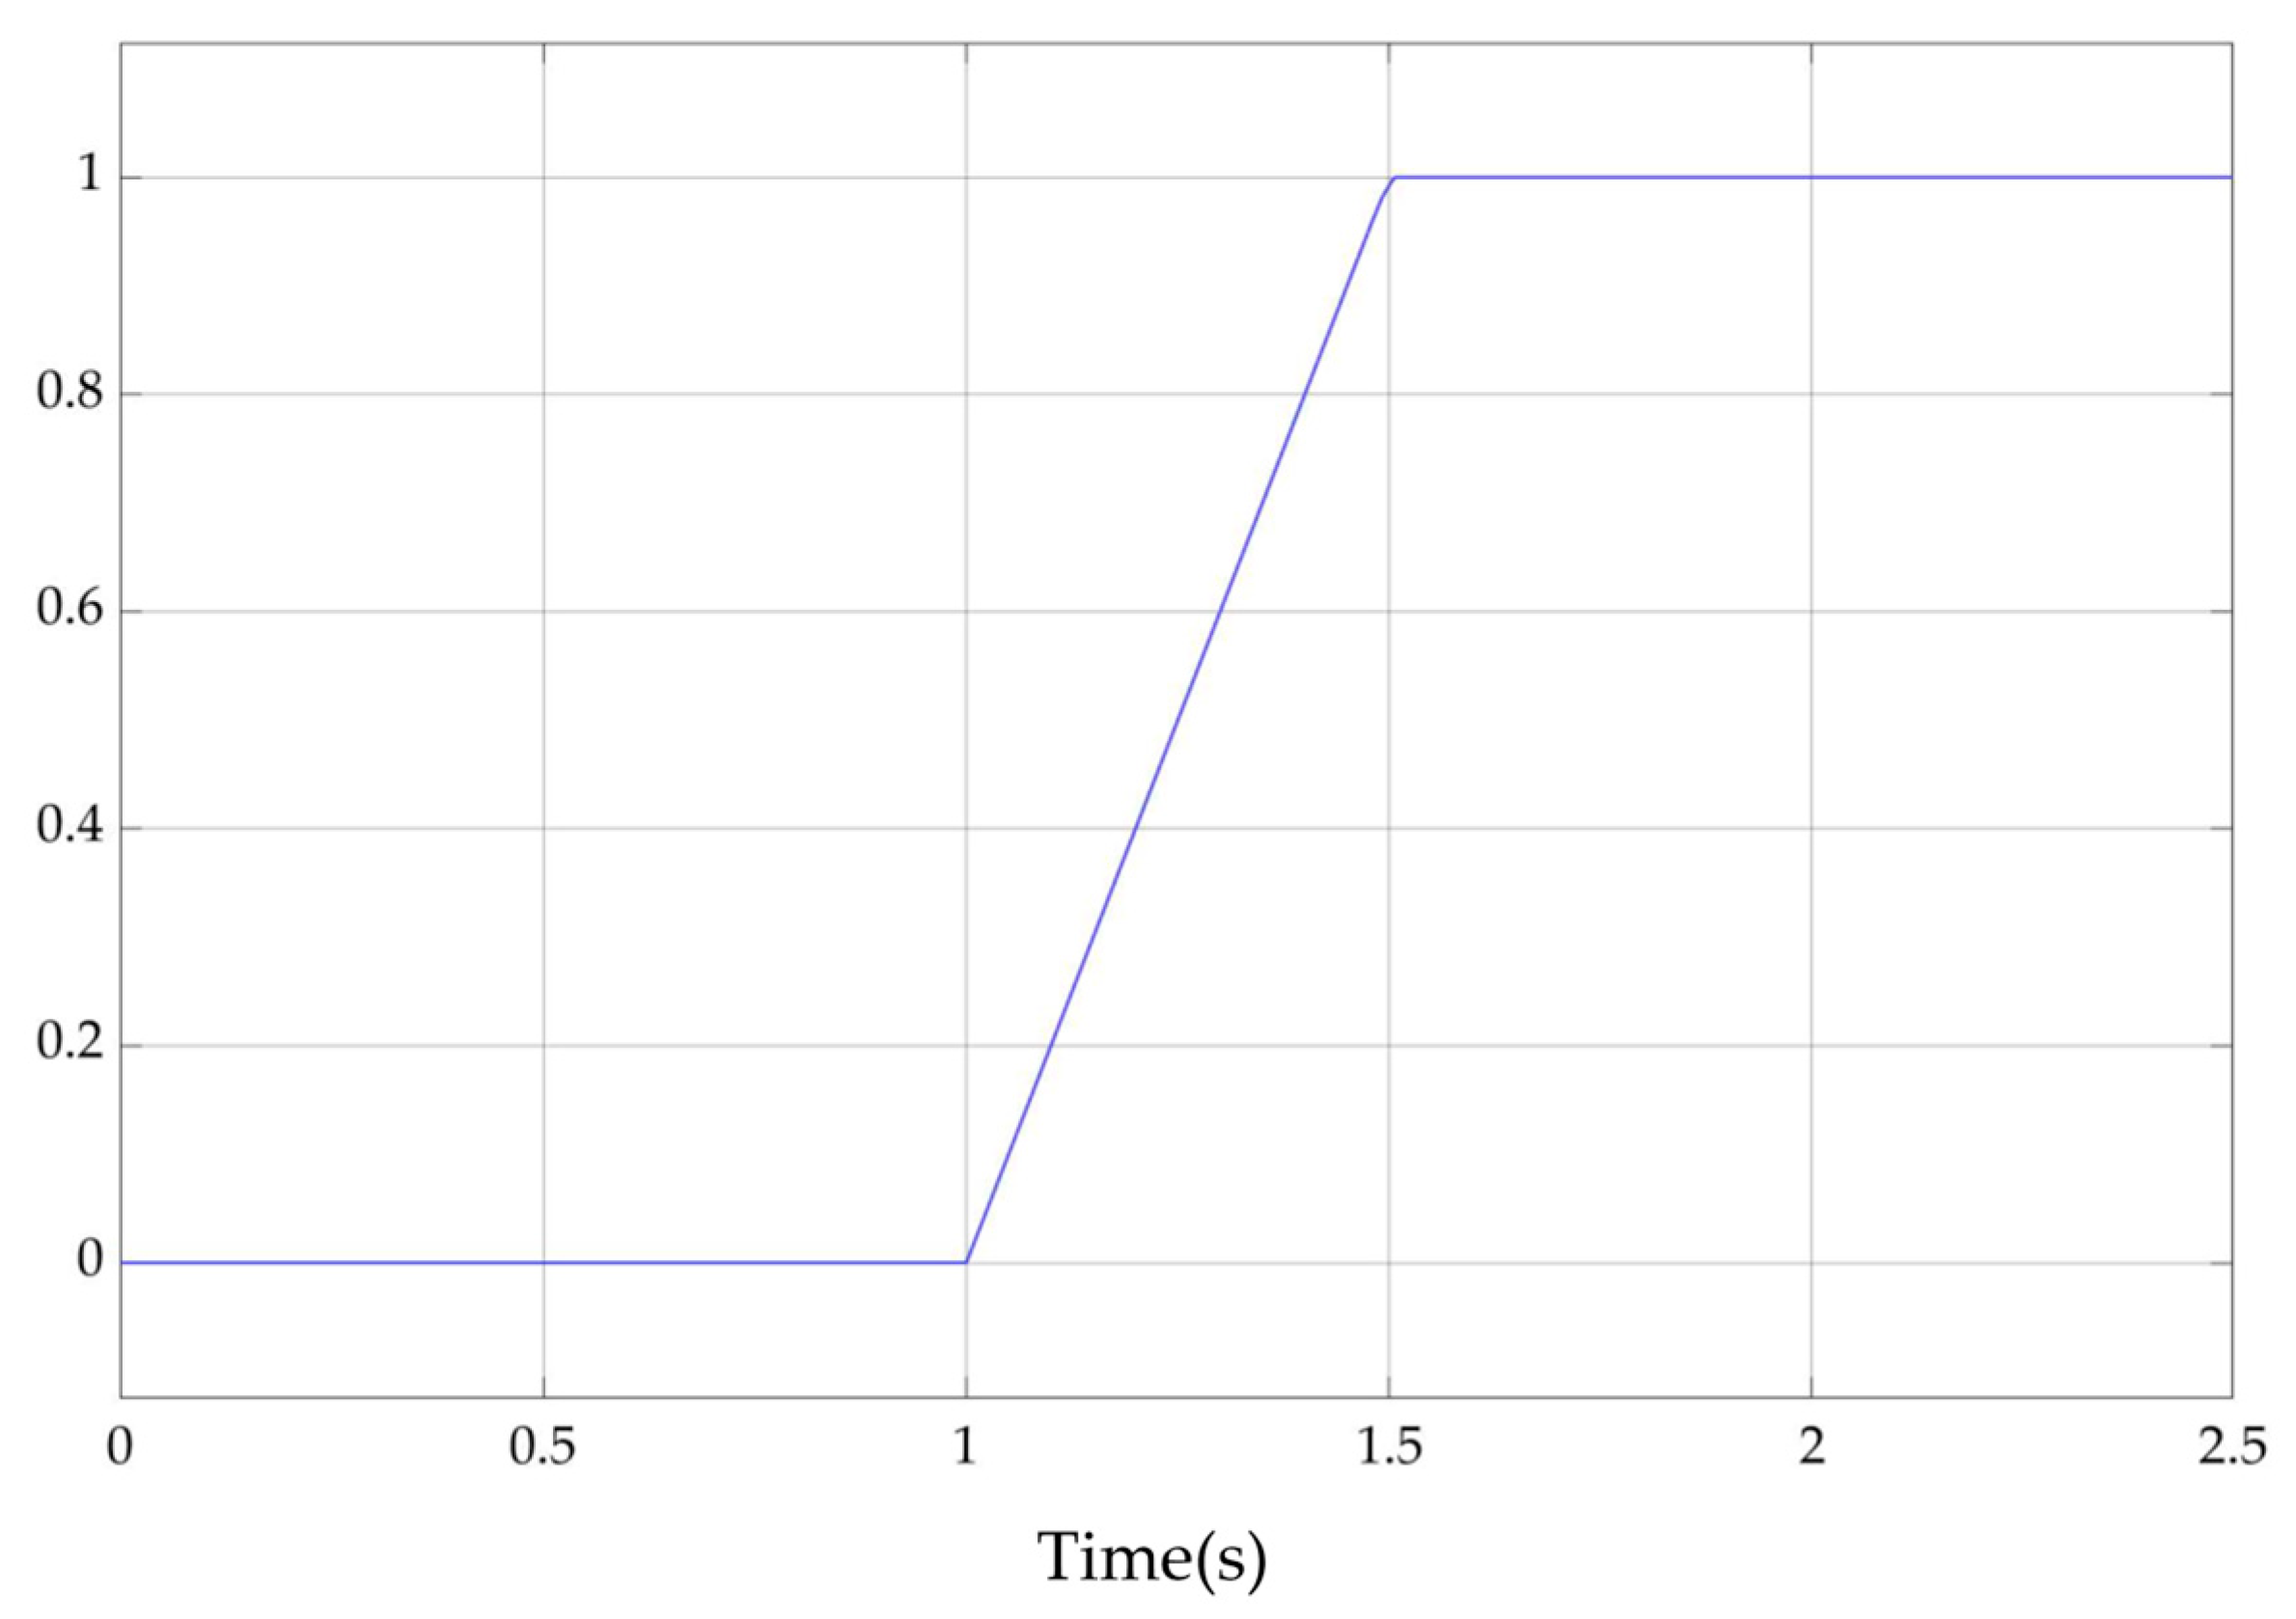
  • The dynamic response of the servo motor is shown in Figure 2. The limit for deflection angle in the model is ± 30 ° . The power system adopts a brushless DC motor, assuming it is ideal. After testing, the actual maximum speed of the motor is about 7500 r / min
The coordinate transformation matrix from the ground frame to the body frame is as follows:
C g b = cos θ cos ψ cos θ sin ψ sin θ sin ϕ sin θ cos ψ cos ϕ sin ψ sin ϕ sin θ sin ψ + cos ϕ cos ψ sin ϕ cos θ cos ϕ sin θ cos ψ + sin ϕ sin ψ cos ϕ sin θ sin ψ sin ϕ cos ψ cos ϕ cos θ
where ϕ , θ , and ψ are Euler angles. The transformation matrix from the wind frame to the body frame is
C a b = cos α cos β cos α sin β sin α sin β cos β 0 sin α cos β sin α sin β cos α
where α and β are the AOA and angle of sideslip (AOS), respectively. In the absence of wind or side slip, the UAV’s AOA can be calculated using the following equation:
α = arctan w u
where u and w are the velocity components along the x-axis and z-axis in the body frame, respectively.
Let V b = [ u v w ] T denote the velocity in the body frame, ω b = [ p q r ] T the angular velocity, G = [ 0 0 m g ] T the gravity force, A = [ D Y L ] T the aerodynamic force, and T = [ T 0 0 ] T the propeller thrust (with a zero installation angle); then, the center-of-mass dynamic equations are as follows:
m V ˙ b + ω b × V b = C g b G + C a b A + T
after expanding the formula, it is expressed as
u ˙ + q w r v = T m 1 m D cos α cos β + Y cos α sin β L sin α g sin θ v ˙ + r u p w = 1 m Y cos β D sin β + g cos θ sin ϕ w ˙ + p v q u = 1 m D sin α cos β + Y sin α sin β + L cos α + g cos θ cos ϕ
The UAV’s attitude is influenced by aerodynamic moments L ¯ M N T . If the UAV’s inertia tensor is denoted as I = d i a g I x I y I z , then its attitude dynamics equations can be expressed as follows:
I x p ˙ + I z I y q r = L ¯ I y q ˙ + I x I z p r = M I z r ˙ + I y I x p q = N
The aerodynamic force and moment in Equations (5) and (6) can be calculated using the following general expressions:
D = C D Q S Y = C Y Q S L = C L Q S L ¯ = C L ¯ Q S b M = C M Q S c N = C N Q S b
where Q is the dynamic pressure, S is the wing area, b is the wingspan, c is the chord length, and C X ( X is arbitrary subscript) is the aerodynamic coefficient. Since the UAV’s control surfaces consist solely of two control surfaces mounted on the rear wing, its aerodynamic model can be expressed as
C D = C D 0 + C D , q q ¯ + C D , δ l δ l + C D , δ r δ r C Y = C Y 0 + C Y , p p ¯ + C Y , δ l δ l + C Y , δ r δ r C L = C L 0 + C L , q q ¯ + C L , δ l δ l + C L , δ r δ r C L ¯ = C L ¯ 0 + C L ¯ , p p ¯ + C L ¯ , r r ¯ + C L ¯ , δ l δ l + C L ¯ , δ r δ r C M = C M 0 + C M , q q ¯ + C M , δ l δ l + C M , δ r δ r C N = C N 0 + C n , p p ¯ + C n , r r ¯ + C N , δ l δ l + C N , δ r δ r
where δ l and δ r are the deflection angles of the left and right control surfaces, respectively, C X , Y ( X and Y are arbitrary subscripts), and p ¯ , q ¯ , and r ¯ are calculated as follows:
p ¯ = p b 2 V a , q ¯ = q c 2 V a , r ¯ = r b 2 V a
where V a is the true airspeed.
The left and right control surfaces must perform both aileron and elevator functions. The control surface deflection command allocation follows Equation (10):
δ l c = δ e c δ a c δ r c = δ e c + δ a c
where δ e c and δ a c are the elevator command and aileron command output by the flight control computer, respectively.

2.2. Description of UAV Automatic Pull-Up Process After Airdrop

In this study, the UAV is lifted to a certain altitude by a multi-rotor carrier aircraft and then released for automatic pull-up. This process consists of four stages: release standby, pull-up preparation, pull-up control, and mission cruise, as shown in Figure 3. At Stage 3, the UAV’s initial state features a pitch angle θ near 90 ° while the angular velocity may be non-zero due to wind effects. This initial condition presents three main challenges: firstly, the MEMS inertial navigation system may output attitude data with significant noise; secondly, when the flight control system initially takes over, the airspeed is low while the UAV is adjusting its θ , resulting in a large α and potential stall risk; thirdly, the low initial velocity reduces control surface effectiveness. Relying solely on free-fall to gain speed would both sacrifice altitude and prolong the time required to reach stable cruise.
To address these problems, the controller is programmed to initiate pitch angle adjustment only when θ has sufficiently deviated from 90 ° . Additionally, to mitigate stall risk and enhance control surface effectiveness, a constant throttle command is applied to increase airspeed. The detailed control logic for the four stages is designed as follows:
Stage 1. The UAV is suspended from the carrier aircraft, awaiting release.
Stage 2. The UAV enters the pre-pull-up state when detecting the acceleration along the x-axis of the body frame a x > -5 m / s 2 . During this phase, the UAV employs angular rate control, with the pitch rate command set at q c = 15 ° / s and roll rate command at p c = 0 ° / s .
Stage 3. When the pitch angle θ > 70 ° , the flight control system takes over. The UAV begins to pull up under the combined action of control surfaces and constant throttle, with θ following the command until it approaches 5 ° .
Stage 4. The UAV transitions to mission cruise mode when θ > 5 ° and indicated airspeed V I > 25 m / s , marking the completion of the automatic pull-up process.
The above processes are shown in Figure 3.
During the pull-up process, as the UAV descends, both the V I and θ gradually increase. This study aims to ensure a successful pull-up through control law optimization. The selection of objective functions and their rationales are as follows:
1. Minimize the maximum absolute value of normal overload a z max to ensure structural safety of the UAV;
2. Minimize the maximum indicated airspeed V I , max to keep the UAV’s speed within the right edge of the flight envelope;
3. Minimize the maximum descent height H d , max to reduce the demand for height;
4. Minimize the maximum AOA α max to mitigate stall risk.

2.3. Design of Pull-Up Maneuver Controller

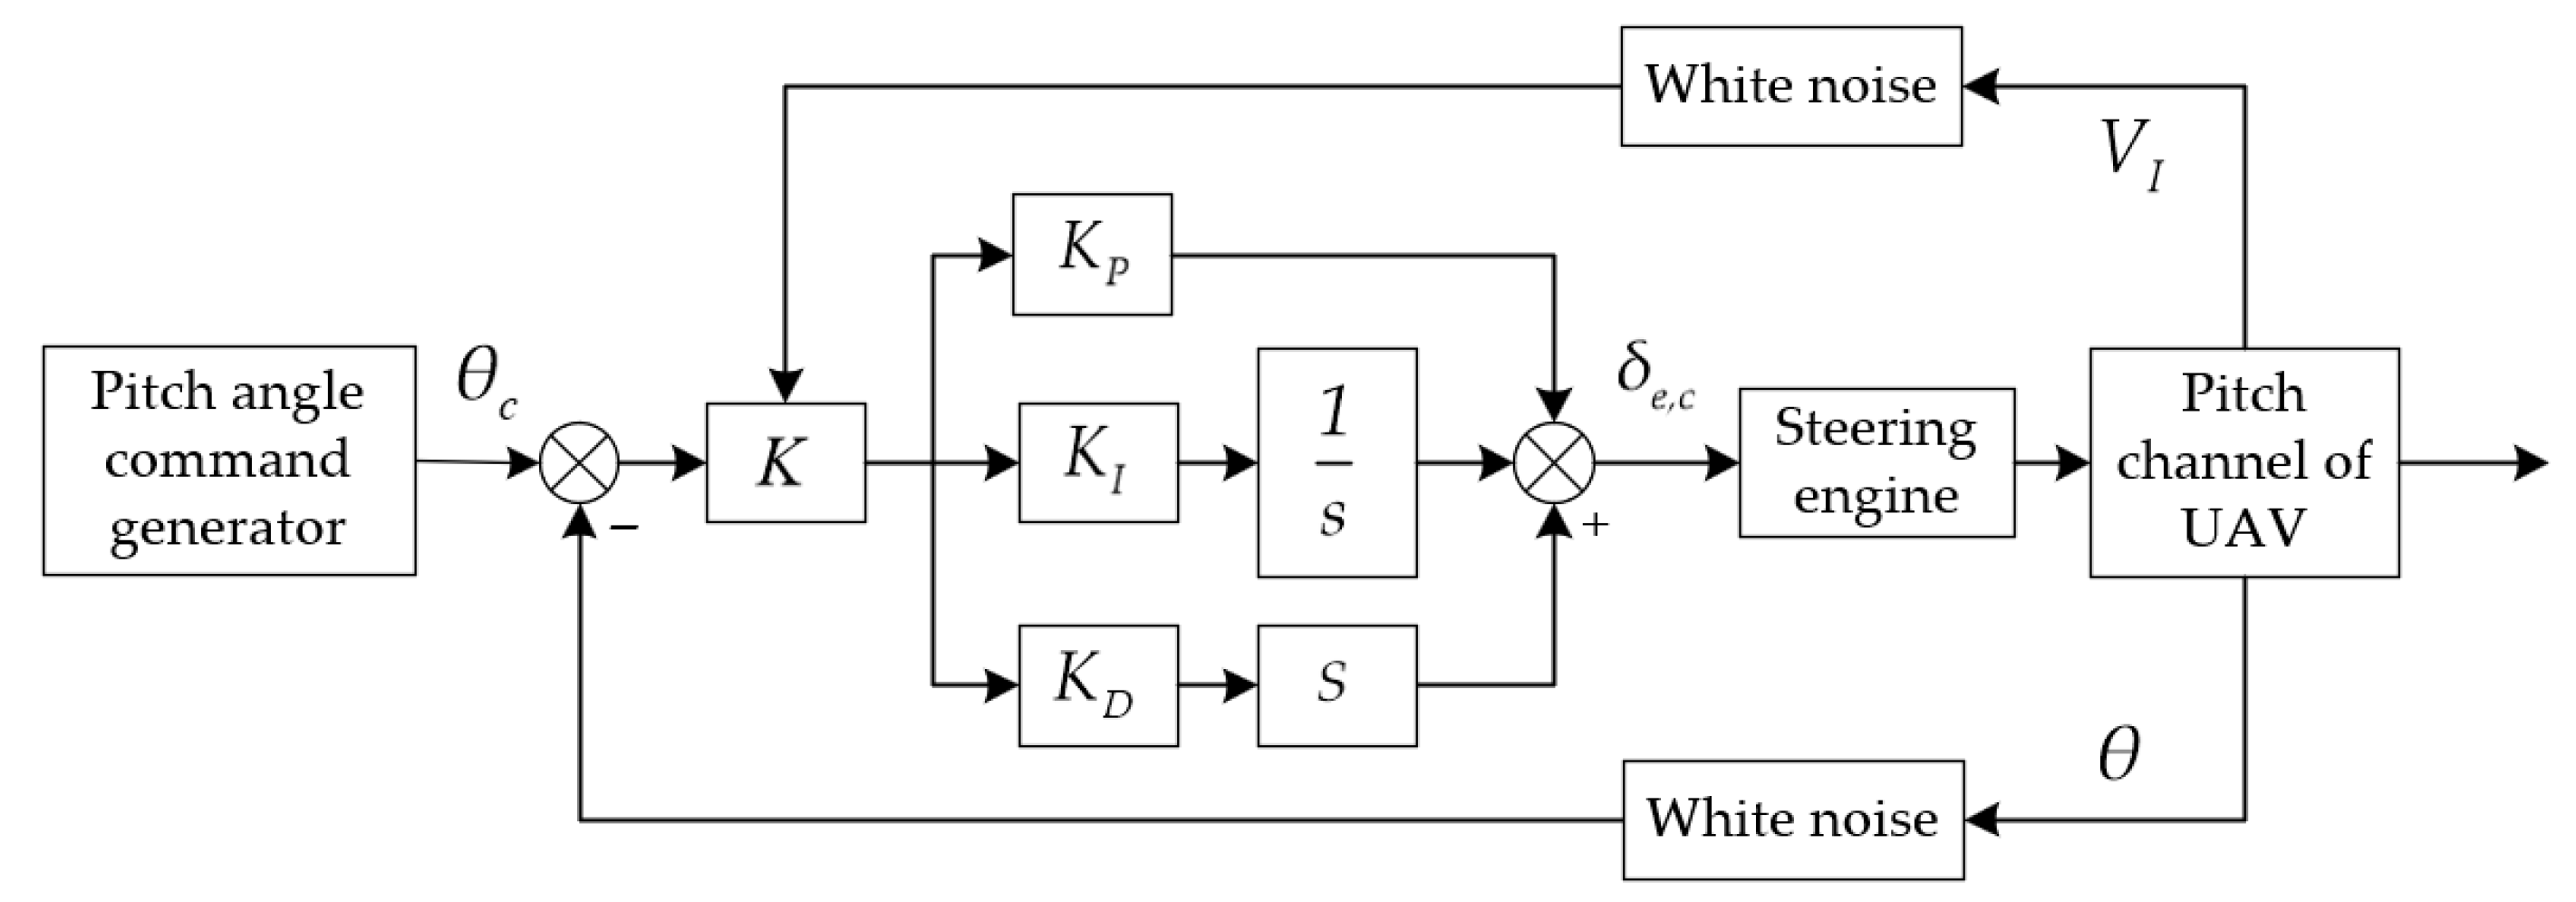
As shown in Figure 4, the longitudinal control during the flight test pull-up process employs a variable-parameter PID control scheme, where K P , K I , and K D are the proportional, integral, and derivative coefficients respectively, and K is the variable coefficient. The purpose of optimization is to obtain these four parameters.
Assuming that the relationship between control surface efficiency and V I is unknown and the optimal variation pattern of K is also unknown (potentially nonlinear), due to the drastic changes in airspeed during the pulling process, the dynamic pressure p = 1 2 ρ v 2 changes significantly, directly affecting the rudder effect. The controller parameters need to be adaptive. Based on the calculation formula of dynamic pressure, a quadratic function is chosen to change the K value:
K = K a V I K b 2 + K c
where K a , K b , and K c are parameters to be optimized. During the pull-up process, the UAV transitions from a nearly vertical downward orientation to a horizontal state. If the pitch angle command θ c is directly set to 0 ° , the PID controller will generate excessively large control surface commands at the initial pull-up stage. This will result in an overly aggressive pull-up maneuver that could induce significant overload and increase stall risk. To achieve a smooth transition of the pitch angle from its initial pull-up state to 0 ° , a pitch angle command generator is constructed:
θ c = θ 0 2 sin 2 π T t + θ 0 θ 0 + θ 0 2
where θ 0 is the UAV’s pitch angle at the initiation of the pull-up maneuver, T is the period of the sinusoidal function, and t is the elapsed time from pull-up commencement to the current moment.
For lateral-directional control during the UAV pull-up process, a fixed-parameter PID controller is employed for roll angle regulation. This study primarily focuses on the longitudinal control during pull-up, with lateral-directional control excluded from the research scope.

3. Target Priority and Segmented Scoring Based Adaptive NSGA-II

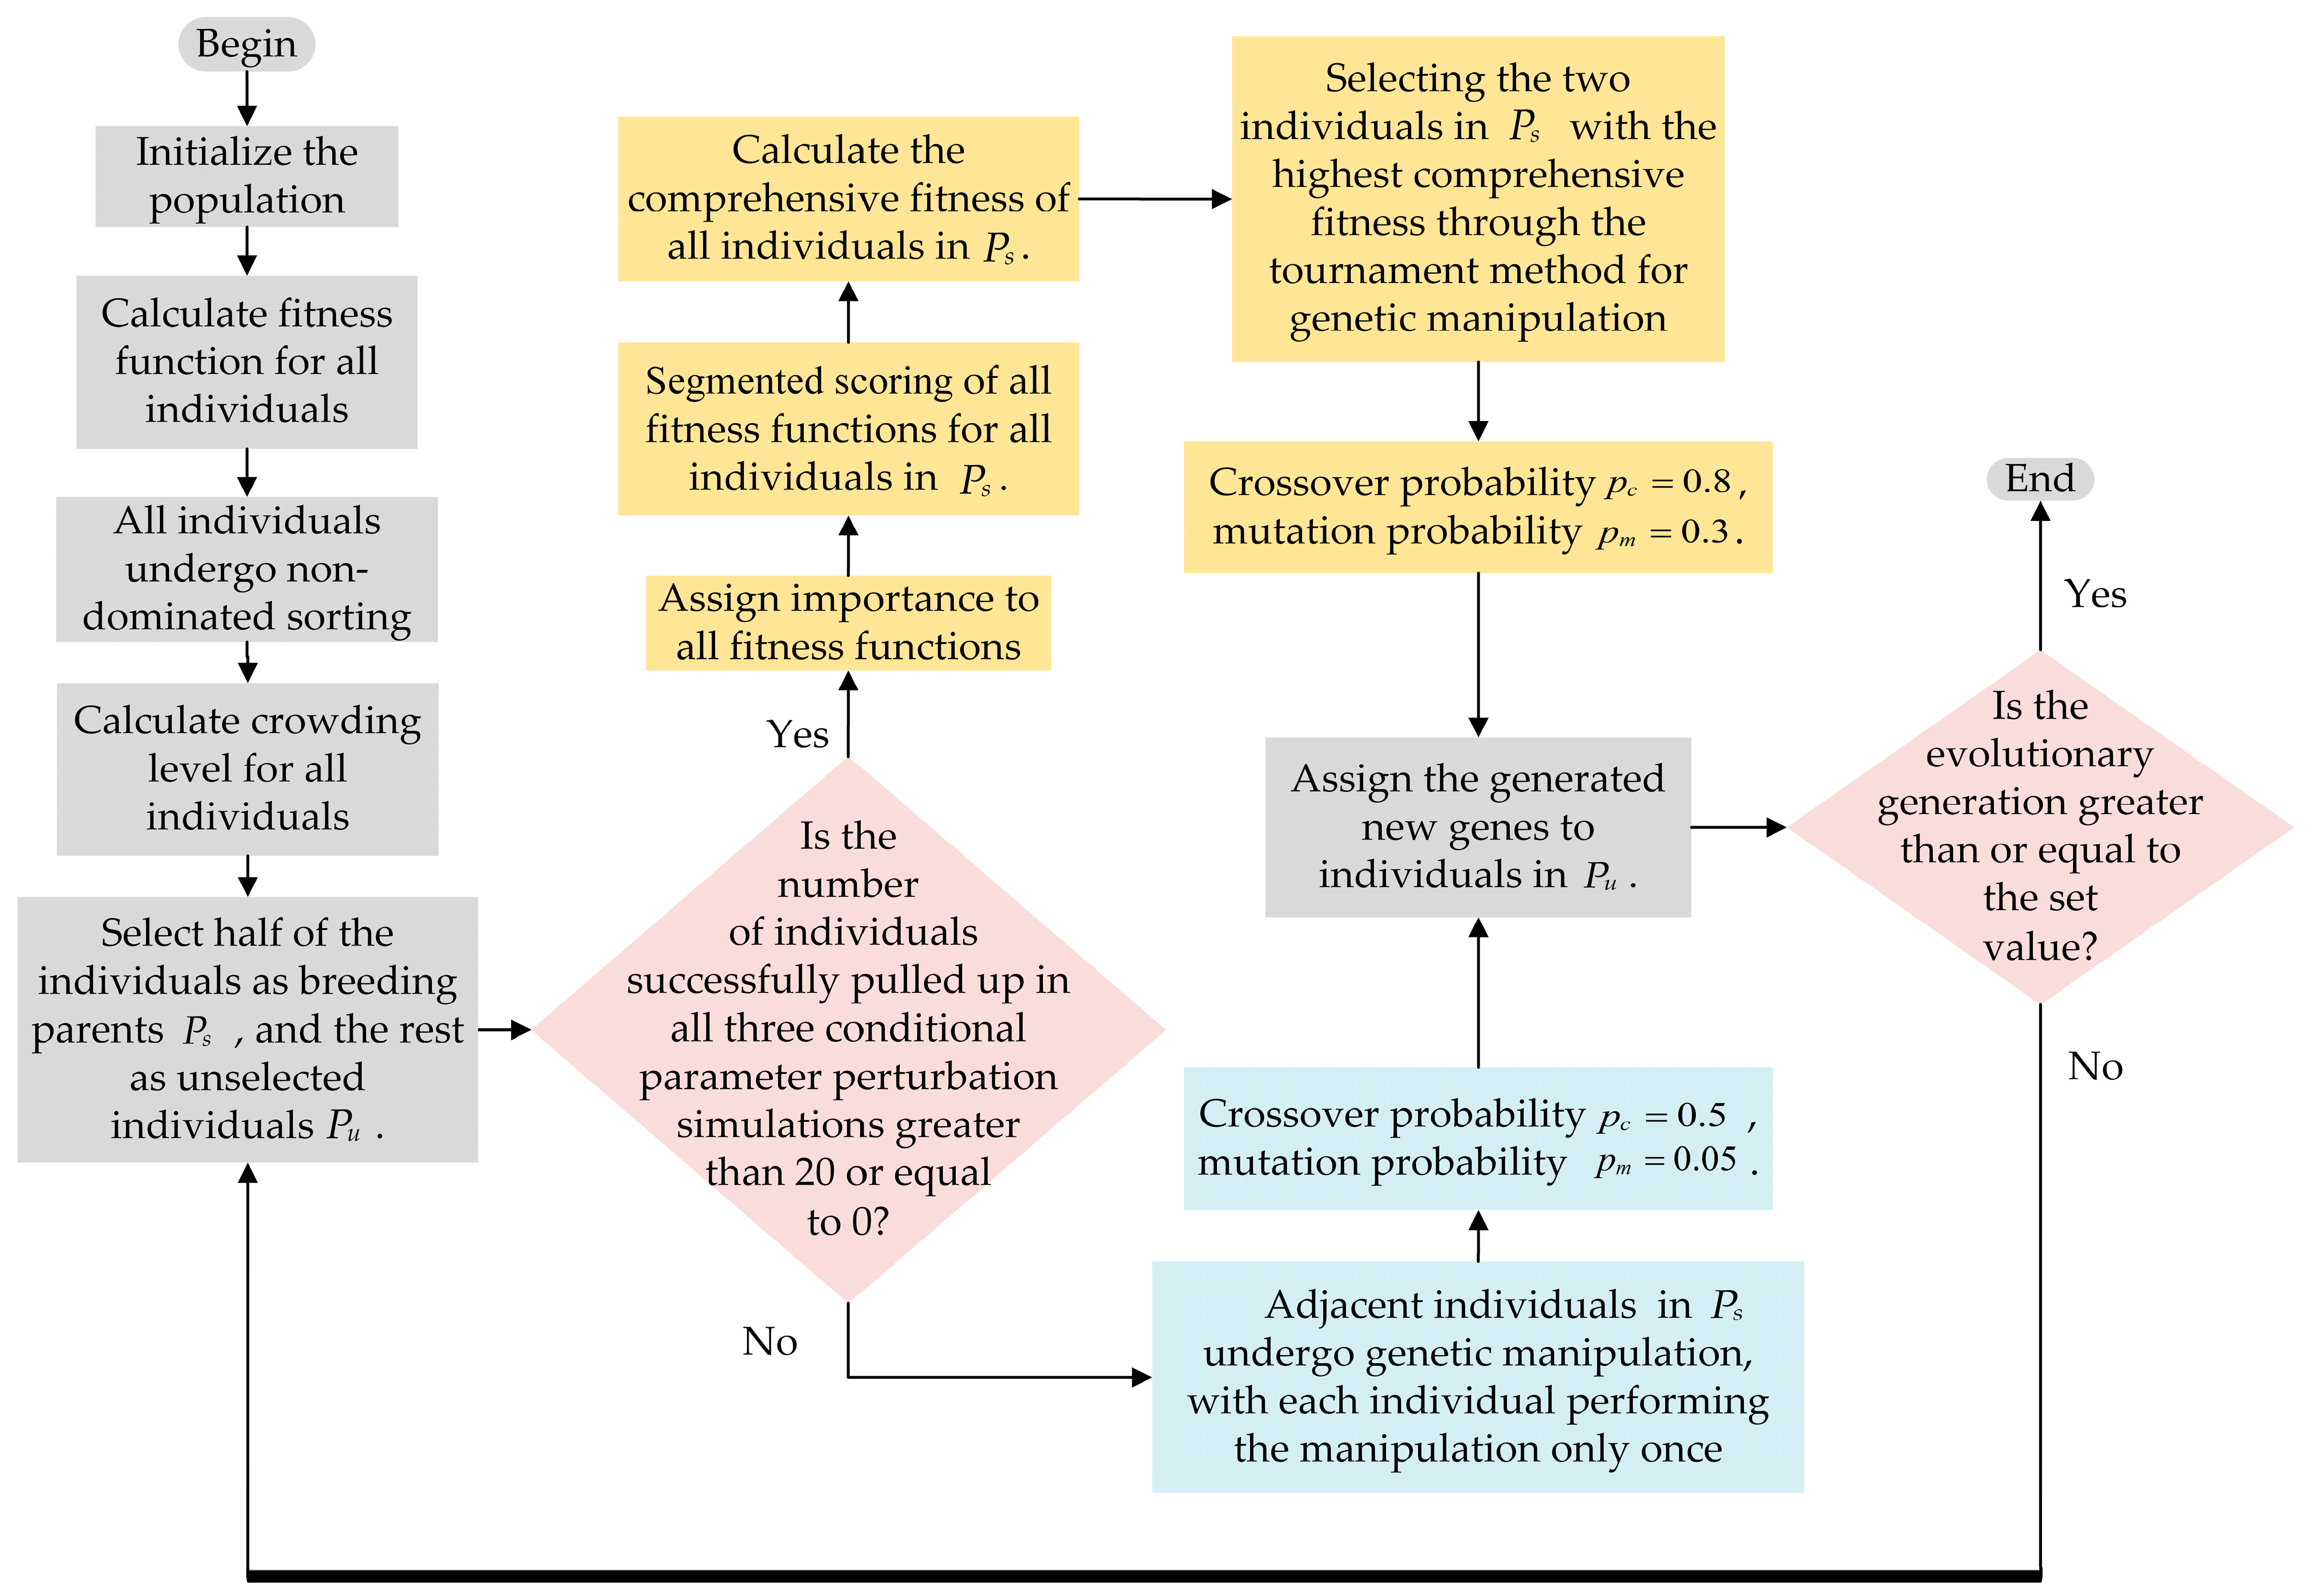
The optimization algorithm proposed in this study is illustrated in Figure 5, with a population size of 40 and a maximum generation number set to 90. The standard NSGA-II process consists of five steps: population initialization, calculation of fitness function, non-dominated sorting, crowding calculation, and crossover and mutation. Assuming there are 40 individuals in the population and calculating their fitness function, if it is found that there are n 0 < n 20 individuals whose parameter perturbation simulation has passed (i.e., the number of times the UAV successfully pulls up during simulation under parameter bias conditions is 3), the genetic operation follows the standard NSGA-II steps, with a crossover probability of 0.5 and a mutation probability of 0.03, respectively. Under these conditions, the population will converge rapidly. When n = 0 or n > 20 , the standard NSGA-II steps are still performed, but after the crowding distance calculation step, individuals near the Pareto front in the non-dominated sorting table will calculate their comprehensive fitness based on target priority and segmented scoring mechanism. In the crossover and mutation steps, parents are selected from the excellent individuals using the tournament method based solely on their comprehensive fitness, with crossover and mutation probabilities set at 0.8 and 0.3. Then, new genes obtained through crossover and mutation are assigned to ordinary individuals in the population. The detailed process will be discussed in this chapter.

3.1. Chromosome Encoding and Decoding

The parameters to be optimized in the controller designed in this study are shown in Table 1.
All these parameters are encoded in binary according to Equation (13):
X = int x U min U max U min 2 l 1
where x and X represent the parameter values before and after encoding, respectively, and l is the encoding length with a value of 9. Chromosome decoding can be accomplished by performing the inverse operation of Equation (13).

3.2. Calculation of Fitness Function

The four objective functions listed in Section 2.2 can be directly used as the fitness functions for the optimization algorithm.
Additionally, controller design must consider robustness. Conventional methods involve small-disturbance linearization of the aircraft to obtain a state-space model, followed by evaluation of time-domain and frequency-domain response characteristics. However, during the UAV pull-up process, state variables undergo large variations, making it impossible to identify suitable reference motion for small-disturbance linearization. Therefore, this study defines the reciprocal of the conditional parameter perturbation simulation pass ratio r p as a robustness metric for the controller:
r p = N s , max N s , pass
where N s , pass is the number of successful pull-ups in the conditional parameter perturbation simulations, and N s , max is the maximum number of simulation tests.
When the simulated indicators of the UAV pull up meet Table 2, it is considered a successful pull up. If any of these conditions are not met, it is considered a failure.
< 40 m / s 2 < 60 m / s < 200 m < 10 ° To compute r p , each pull-up simulation is conducted under different perturbation conditions, including the nominal condition, + 20 % positive perturbation, and 20 % negative perturbation. If the pull-up fails under the nominal condition, all fitness functions, including r p , are set to 100. Thus, r p ranges from 1 1.5 3 100 . The perturbed parameters include aerodynamic coefficients, mass and moment of inertia, initial UAV attitude, control surface dead zone, and thrust.

3.3. Fast Non-Dominated Sorting

To explain the fast non-dominated sorting process, two definitions are first required:
Definition 1.
The multi-objective optimization problem is formulated as
min F x = f 1 x , f 2 x , , f n x
where x R m is the decision variable vector, f i x is the objective function, and n is the number of objective functions. A solution x * is called a Pareto optimal solution or Pareto front if there exists no other x R m that is better than it in all objective functions.
Definition 2.
For a population P containing N individuals, if individuals x i and x j satisfy Equations (16) and (17) at the same time,
f k x i f k x j , k 1 , 2 , , n
f l x i < f l x j , l 1 , 2 , , n
then x i is said to dominate x j .
The purpose of fast non-dominated sorting is to obtain a non-dominated ranking table by calculating the dominance relationships between individuals, thereby identifying the Pareto front and subsequent non-dominated layers. Based on Definition 2, let N i be the number of individuals that dominate x i , and S i be the set of all individuals dominated by x i . The sorting process proceeds as follows:
Step 1. Initialize N i = 0 and S i = for all individuals.
Step 2. For each individual x i in the population, compare with all other individuals x j . If x i dominates x j , then S i = S i { x i } , otherwise, N i = N i + 1 .
Step 3. Identify all individuals with N i = 0 as the first non-dominated layer F 1 .
Step 4. For each individual x k in F 1 , examine all individuals in its S i set. For each examined x l , decrement N l by 1 until N l = 0 .
Step 5. Add all x l with N l = 0 to the next non-dominated layer.
Step 6. Repeat Steps 4 and 5 until all individuals are assigned to their respective non-dominated layers.
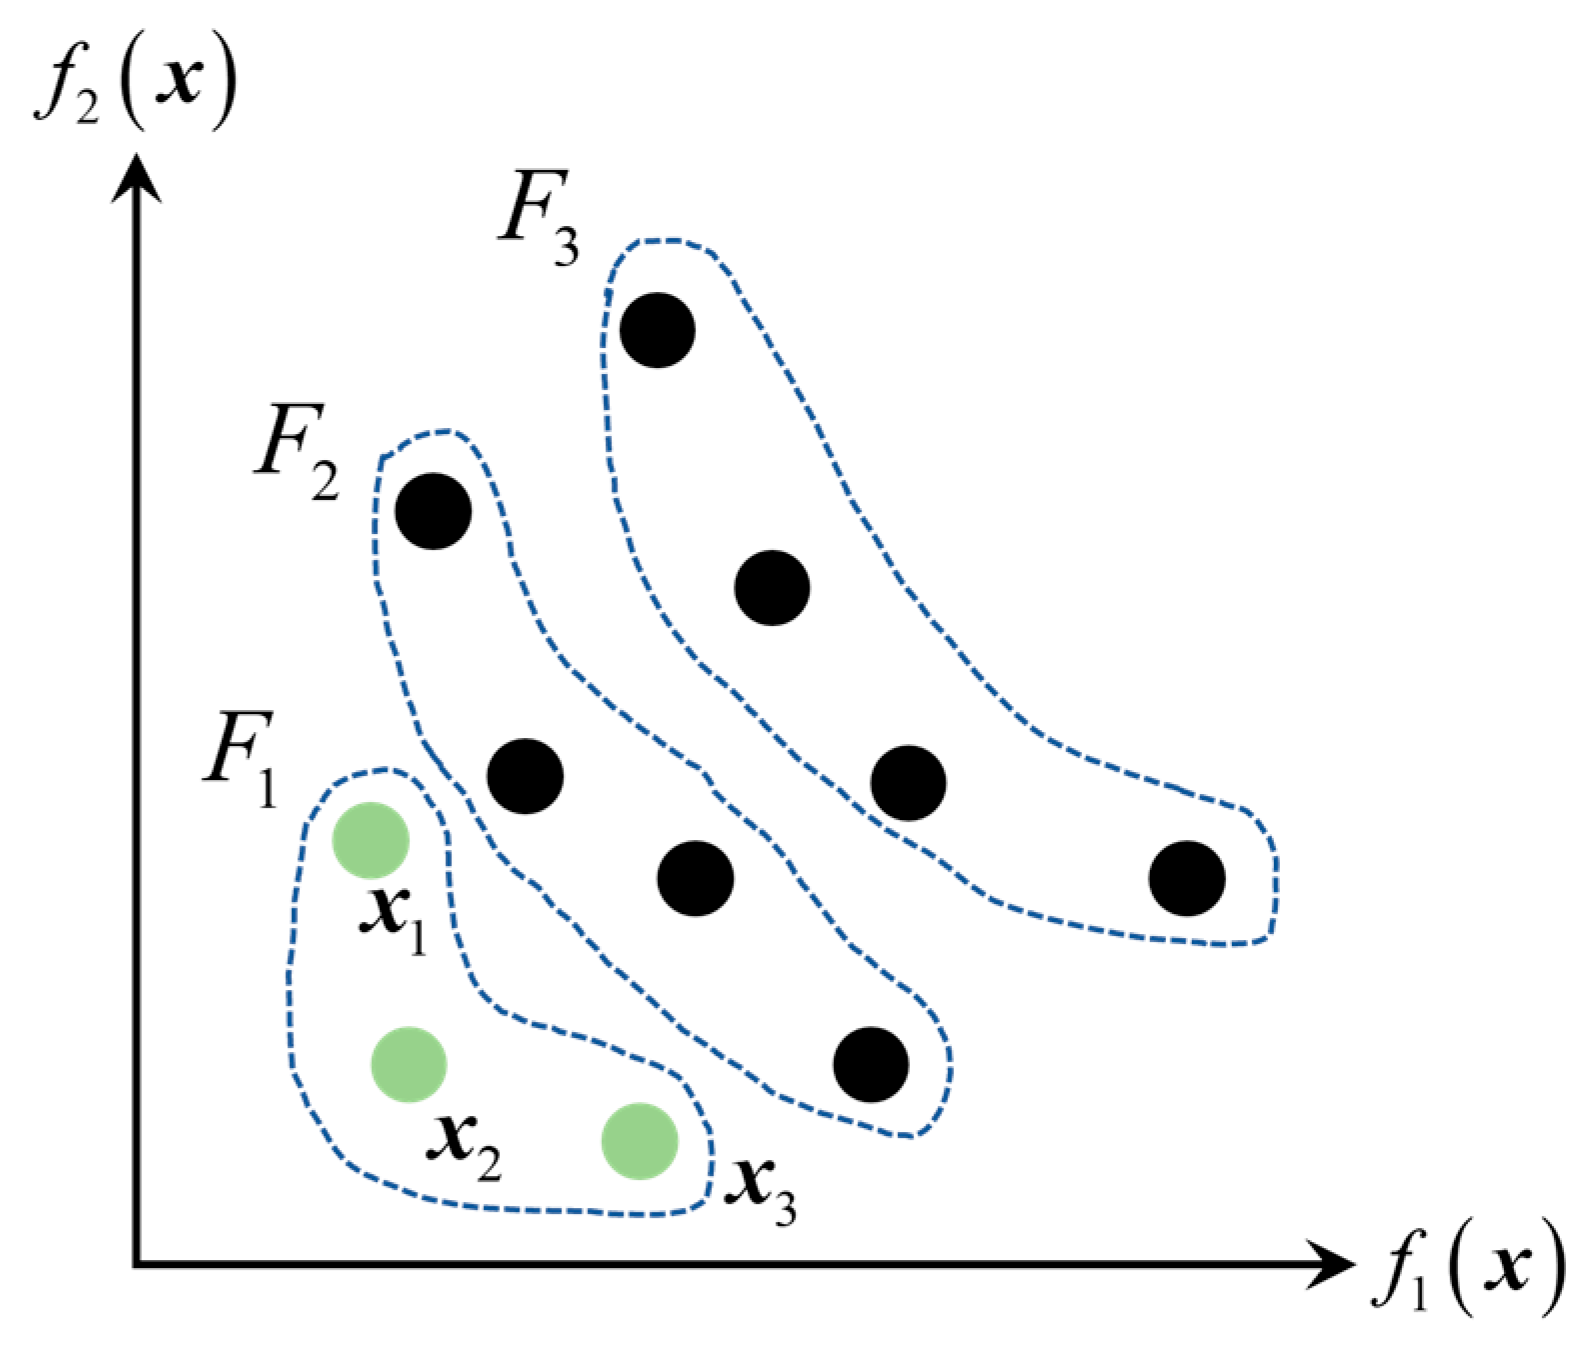
For illustration, consider an optimization problem with two objective functions. As shown in Figure 6, the fast non-dominated sorting process divides 11 solutions into three non-dominated layers ( F 1 , F 2 , and F 3 ). The individuals in F 1 constitute the Pareto optimal solutions, with F 1 being the Pareto front, while F 2 and F 3 represent the subsequent non-dominated layers.

3.4. Crowding Distance Calculation

Crowding distance measures the density of individuals within their respective non-dominated layers. A larger crowding distance indicates sparser neighboring individuals, making the individual more likely to be selected for the next generation. For boundary individuals (e.g., x 1 and x 3 in layer F 1 in Figure 6), their crowding distances are set to infinity. For other individuals x i , the crowding distance is calculated using Equation (18):
d i = r = 1 n f r x i + 1 f r x i 1 f r , max f r , min
where f r , max and f r , min are the maximum and minimum values of the k - th objective function in the current non-dominated layer, respectively, x i + 1 and x i 1 are the adjacent individuals to x i in the solution space, and f r x is the objective function of adjacent individuals within the same non-dominated layer. In this study, individuals from non-dominated layers closer to the frontier are preferentially selected. Among individuals within the same non-dominated layer, those with larger crowding distances are given priority. Using this approach, half of the population is selected as breeding parents P s .

3.5. Adaptive Genetic Strategy Based on Target Priority and Segmented Scoring

When the population converges, the crowding distances tend to become uniform, making it difficult to effectively distinguish between individuals. Moreover, all objective functions have varying levels of importance. Therefore, a target priority and segmented scoring mechanism is introduced to guide the population’s directional evolution. It serves as a supplementary approach to the crowding distance mechanism when the population reaches a certain degree of convergence. The comprehensive fitness of individuals is defined as follows:
f i c = r = 1 n I r R r , i
where I r is the objective function importance index, and R r , i is the segmented scoring index of the fitness value f r , i corresponding to the objective function of individual x i in P s . Table 3 and Table 4 present the assignment methods for I r and R r , i . For the assignment of I r across objective functions, the optimization process should first decrease r p to ensure successful UAV pull-up, then reduce a z max and α max to guarantee structural safety and minimize stall risk, followed by lowering V I , max to maintain V I within the flight envelope, and finally consider reducing H d , max . Regarding the assignment of R r , i , to maintain population diversity, individuals with poor fitness are allowed to compete equally with individuals with better fitness within a certain range. Therefore R r , i is assigned in segments based on comparison of fitness values, where individuals within the same segment receive identical values rather than distinct assignments for each individual.
After calculating the comprehensive fitness f i c for each individual in P s using Equation (19), a tournament selection method is employed to select parents from P s for crossover and mutation operations. The procedure is as follows:
Step 1. Select a third of individuals from P s to participate in the tournament, then choose the two individuals with the highest comprehensive fitness and extract their genes G 1 and G 2 ;
Step 2. Perform crossover operations on G 1 and G 2 with probability p c to generate G 1 and G 2 ;
Step 3. Perform mutation operations on G 1 and G 2 with probability p m to generate G 1 and G 2 ;
Step 4. Retain the original individuals in P s as elites in the population, while assigning G 1 and G 2 to replace ordinary individuals in the population;
Step 5. Repeat Steps 1 through 4 until all ordinary individuals have been assigned new genes.
In this process, p c and p m are adaptively adjusted based on population convergence. When the number of individuals with r p = 1 is less than half of the total population size, p c and p m are set to 0.5 and 0.05, respectively. Otherwise, they are set to 0.8 and 0.3. This mechanism helps the population escape local optima and prevents the NSGA-II algorithm from losing population diversity maintenance capability due to convergence in later evolutionary stages. Meanwhile, an elite retention strategy is implemented to preserve individuals selected through non-dominated sorting and comprehensive fitness evaluation, ensuring algorithm convergence.

4. Simulation Results and Flight Tests

4.1. Analysis of the Effectiveness of Optimization Algorithms

4.1.1. The Effect on Population Diversity

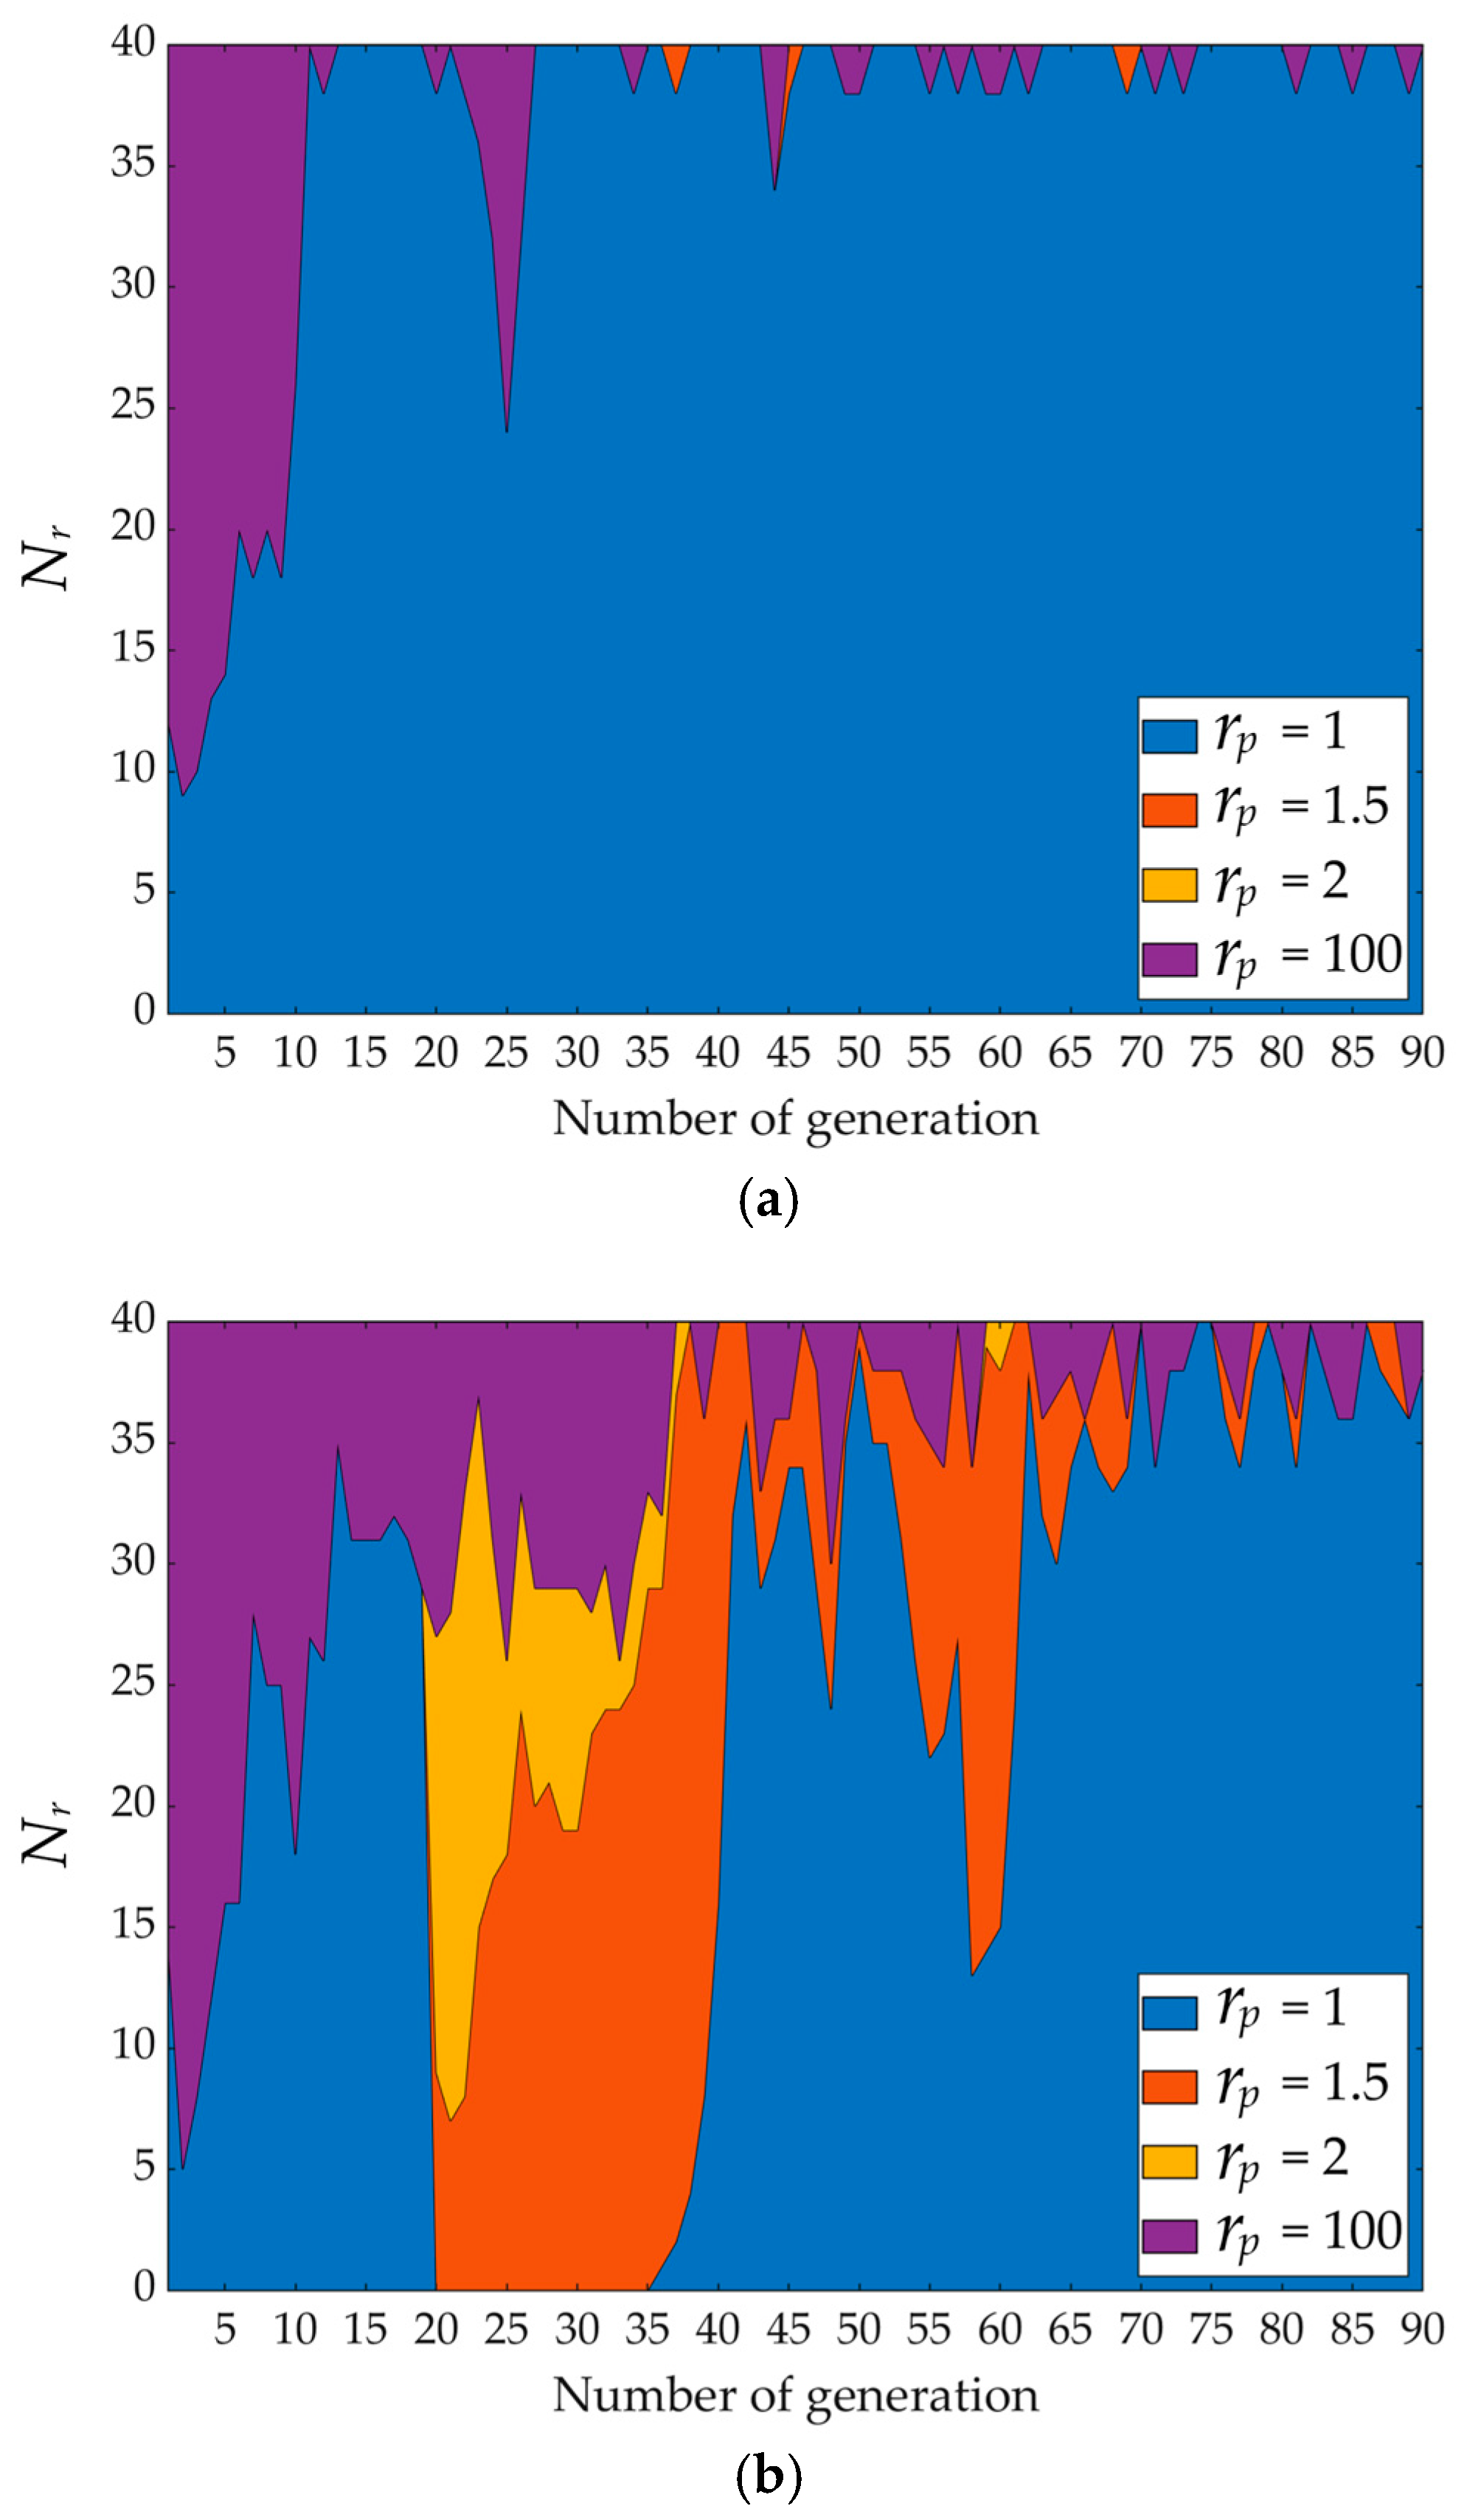
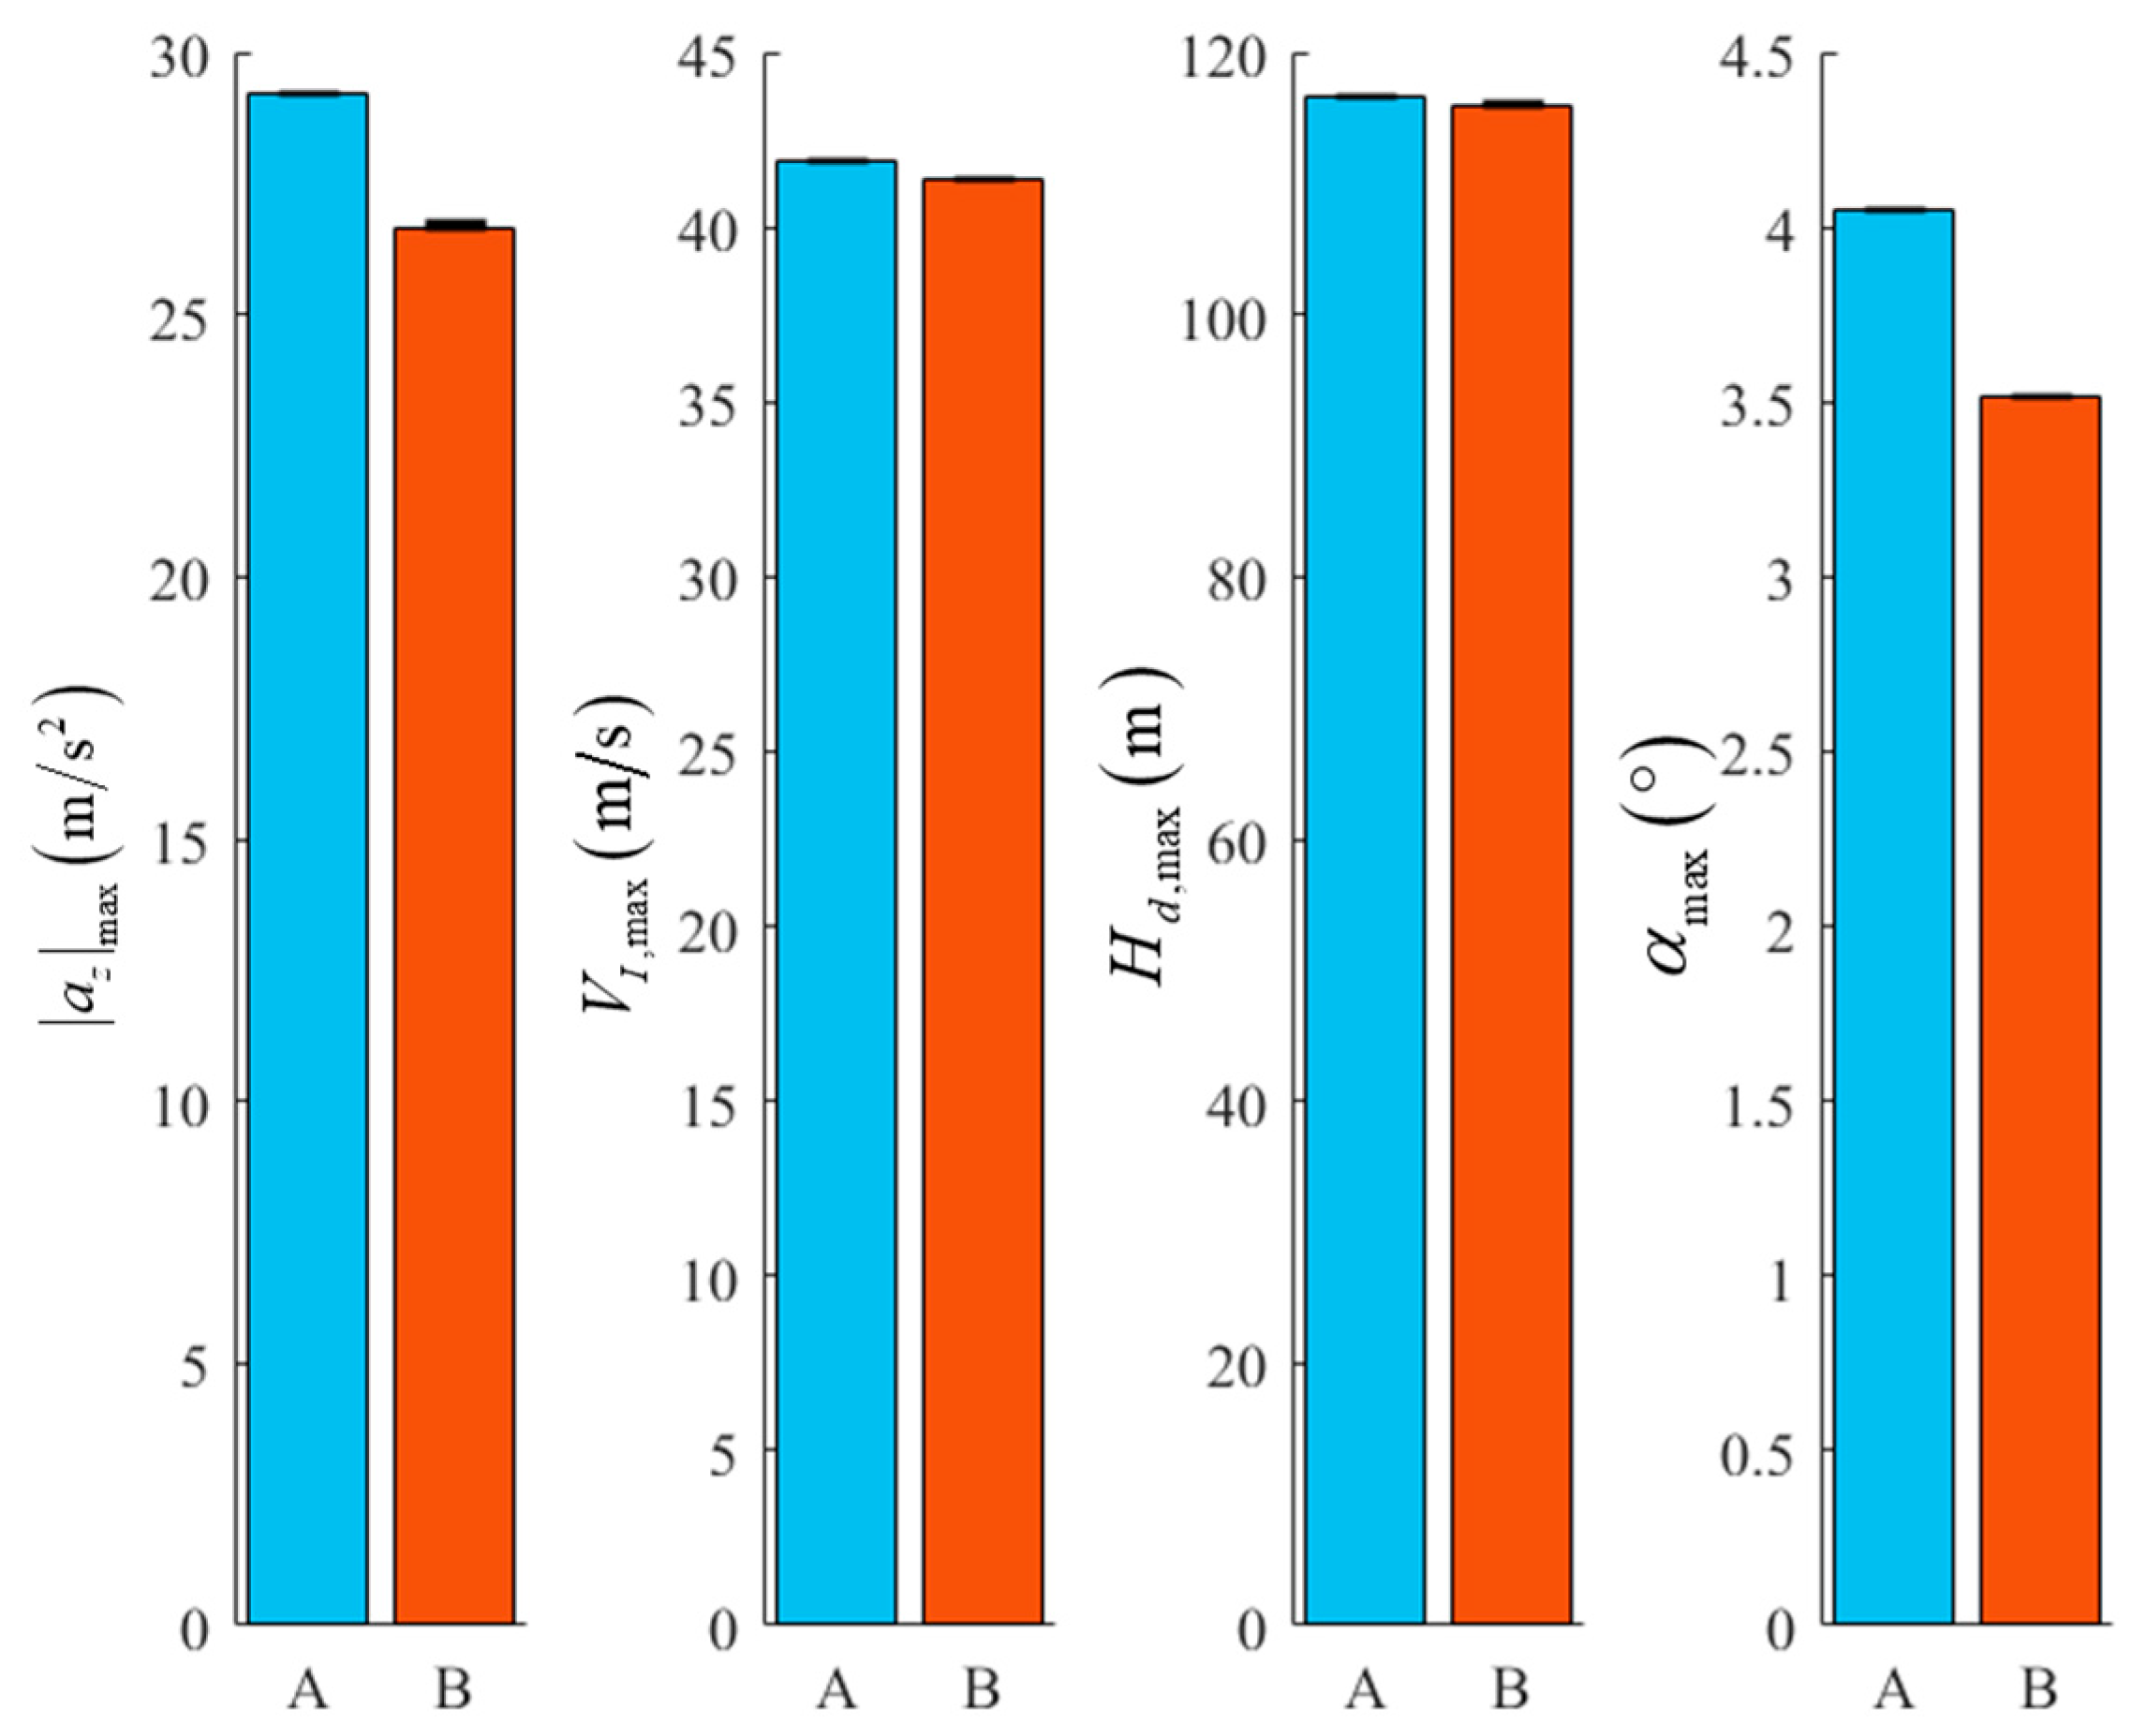
Let Strategy A denote the standard NSGA-II, and Strategy B represent the adaptive hybrid genetic strategy that combines Strategy A with target priority and segmented scoring mechanisms. Let N r represent the number of individuals with different values of r p . Figure 7 and Figure 8 compare the pass counts of conditional parameter perturbation simulations across generations and the fitness statistics of P s in the final generation population under Strategies A and B, respectively. Figure 7a shows that the population essentially converges after the 27th generation under Strategy A, with superior individuals ( r p = 1 ) accounting for no less than 85 % of the population. Figure 7b demonstrates that Strategy B results in slower convergence; the proportion of superior individuals only stabilizes ( 75 % to 100 % ) after the 62nd generation, with an overall lower percentage compared to Figure 7a. This indicates that Strategy B enhances population diversity during evolution while still achieving eventual convergence. In Figure 8, for both Strategies A and B, the fitness function range of P s in the final generation remains relatively small compared to the mean value ( 0.44 % ), which indicates that P s possess convergence.

4.1.2. The Effect on Optimization Performance

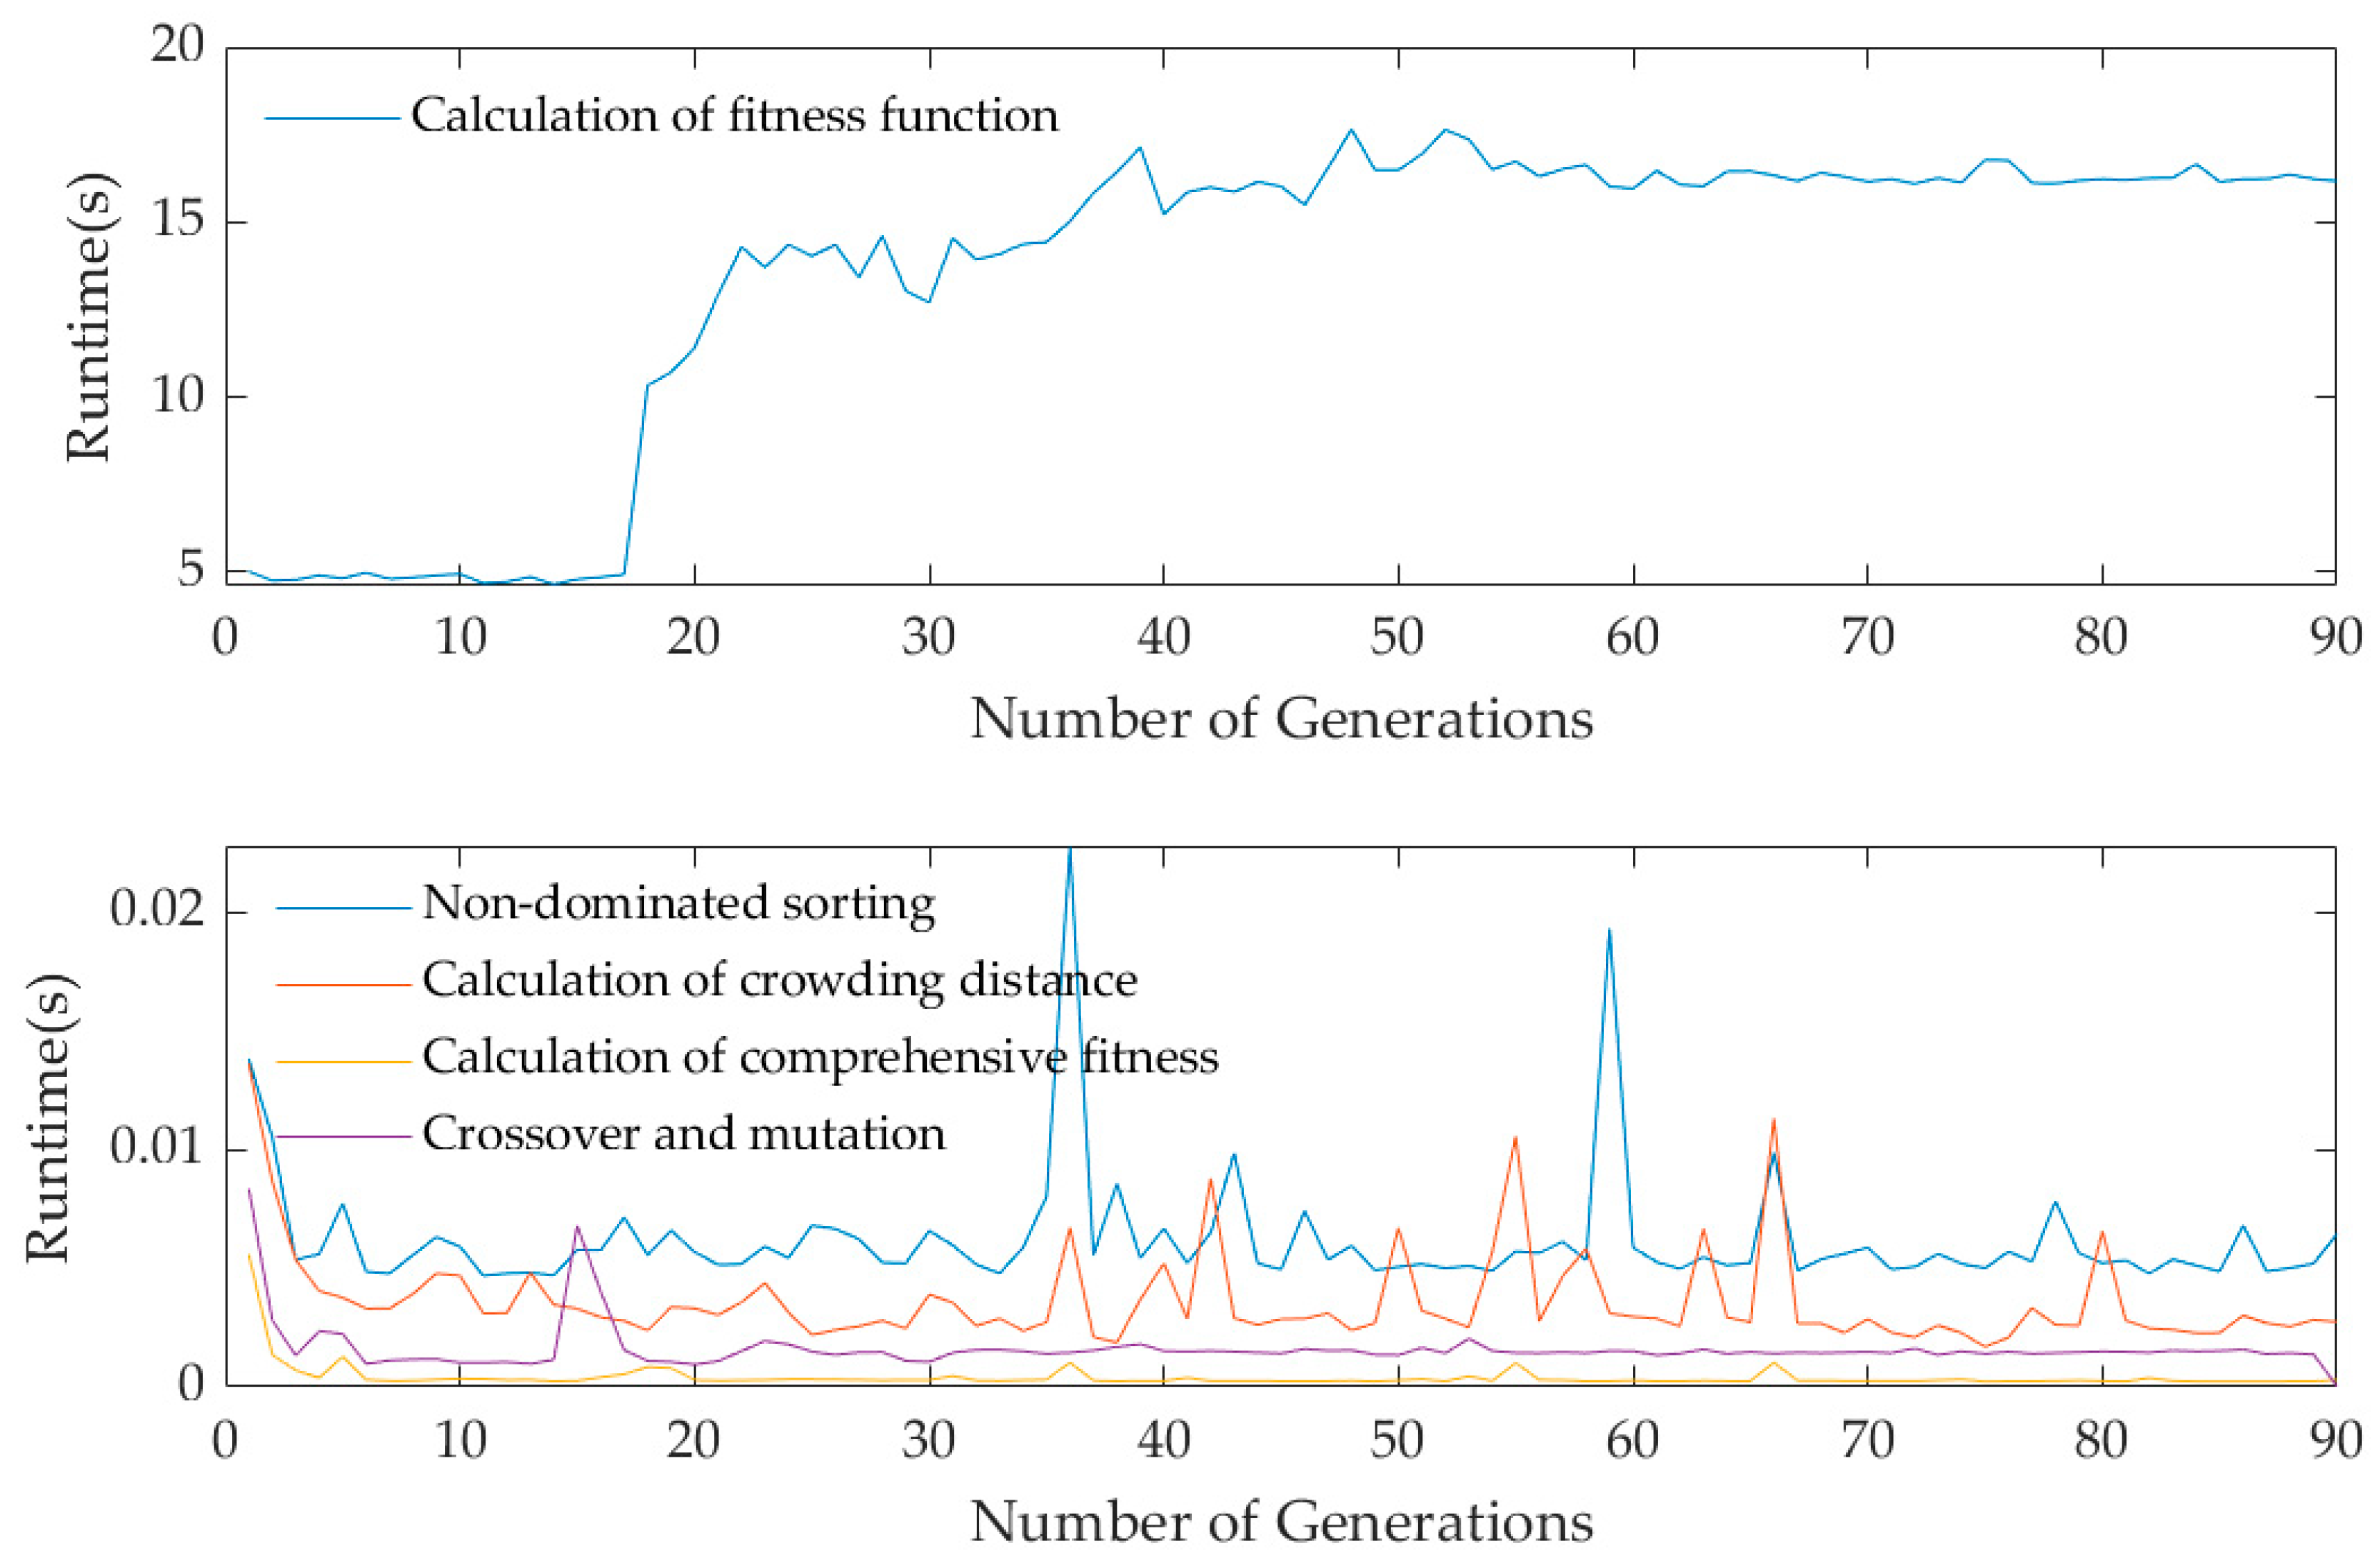
The optimization algorithm runs in MATLAB R2022b, and the Monte Carlo simulation model of UAV pull-up is an executable file generated by Simulink. The improved NSGA-II process includes fitness function calculation, non-dominated sorting, crowding distance calculation, comprehensive fitness calculation, and crossover and mutation. The trend in the runtime of these steps across generations is shown in Figure 9.
Among the various steps of the improved NSGA-II, the calculation of the fitness function takes the longest time. Within the 18th generation (one-fifth of the total generations), only Monte Carlo simulations under nominal conditions are performed to calculate fitness, while simulations under nominal conditions and positive and negative pull bias conditions are required in the 18th and subsequent generations. Therefore, the runtime increases from about 5 s to about 15 s . Compared to the standard NSGA-II process, the improved NSGA-II requires additional comprehensive fitness calculations, with an average time consumption of 0.00038617 s . It is significantly lower than the average runtime of other steps, as shown in Table 5. Therefore, the runtime cost brought by this step is very small.
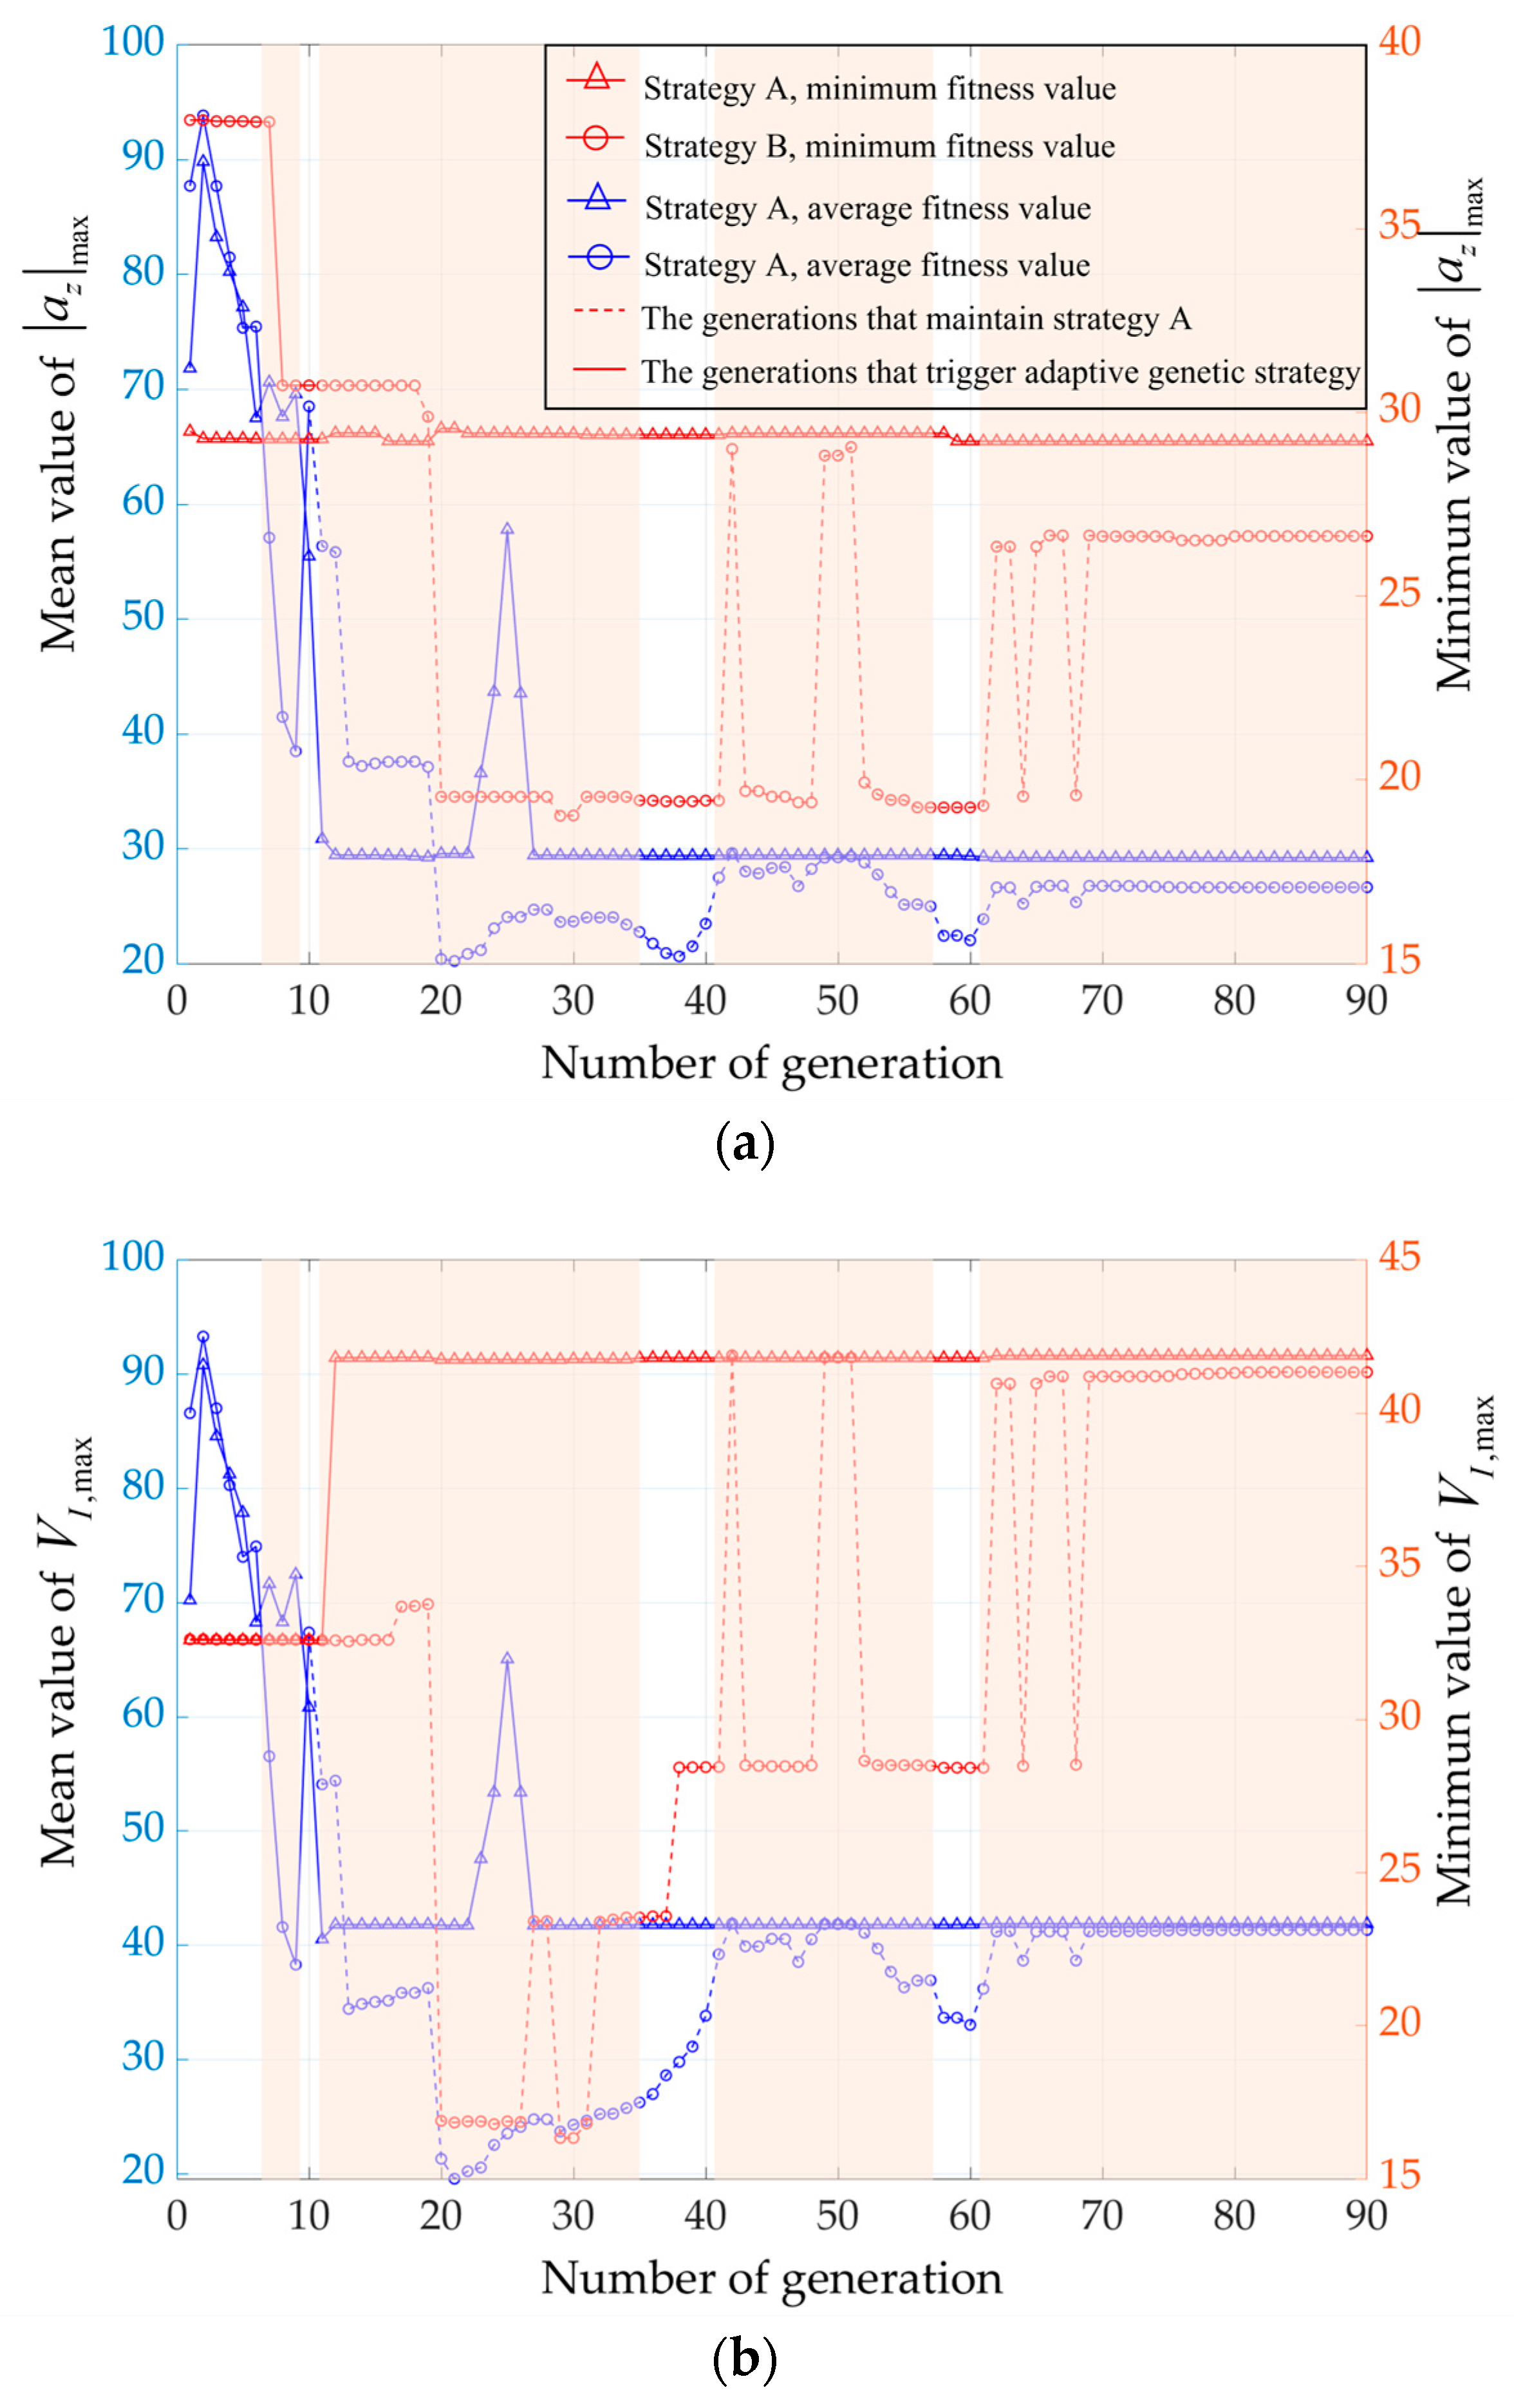
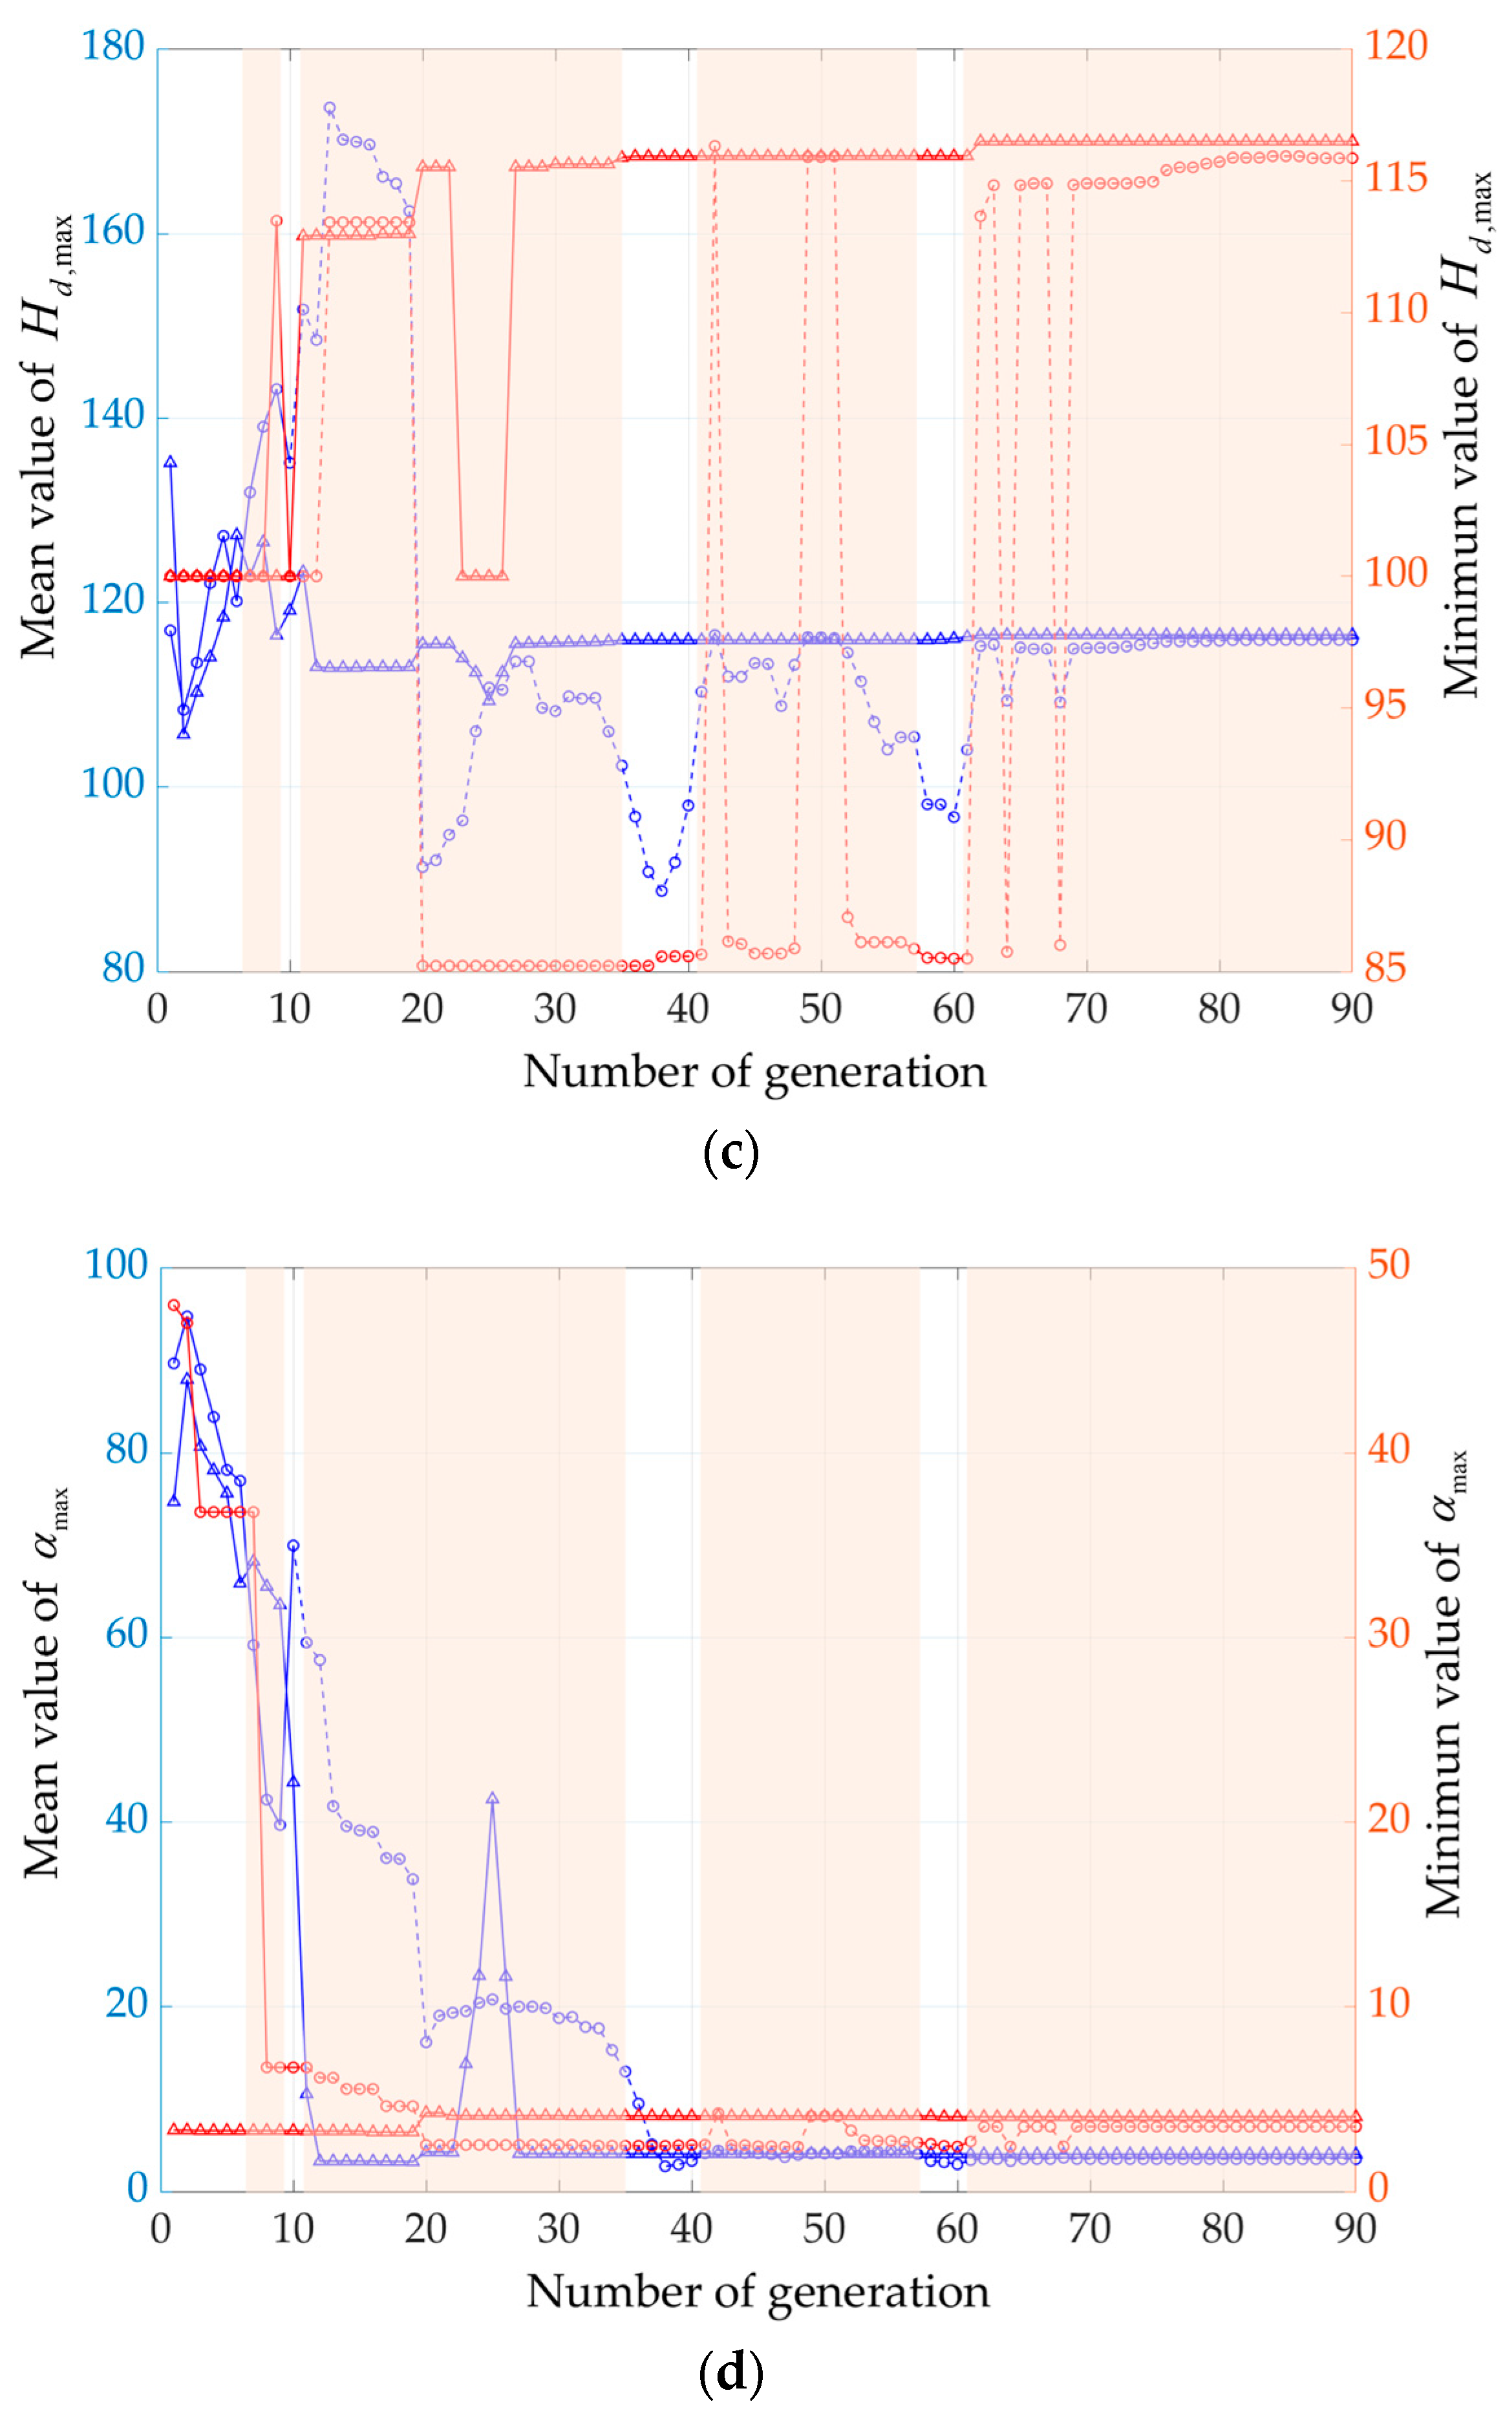
Figure 10 compares the average values (left y-axis with blue color) and minimum values (right y-axis with red color) of fitness functions for individuals in P s during evolution under Strategies A and B. The results demonstrate that both strategies achieve population convergence.
With Strategy B, the adaptive genetic strategy is triggered four times during evolution (indicated by skin color regions in Figure 10). The second triggering occurs when no superior individuals ( r p = 1 ) exist in the population, necessitating increased p c and p m to generate superior individuals, while the other three triggerings result from having more than 20 individuals whose r p = 1 .
Under Strategy A, evolutionary progress stagnates after the 27th generation, failing to produce significantly better individuals. In contrast, Strategy B maintains population diversity through higher crossover/mutation probabilities, while the elite retention strategy preserves superior individuals to drive further evolution. Consequently, Strategy B yields better-performing individuals, particularly showing significant improvements in fitness functions a z max and α max , as evidenced in Table 6.
In Table 6, after 90 generations of evolution under Strategy A, the minimum and average fitness functions of the population’s Ps are equal, indicating that the population no longer has diversity and has fallen into local optima. However, when the population evolves under Strategy B, although the average and minimum values are very similar, these two values are still different.

4.1.3. The Effect on the Direction of Population Evolution

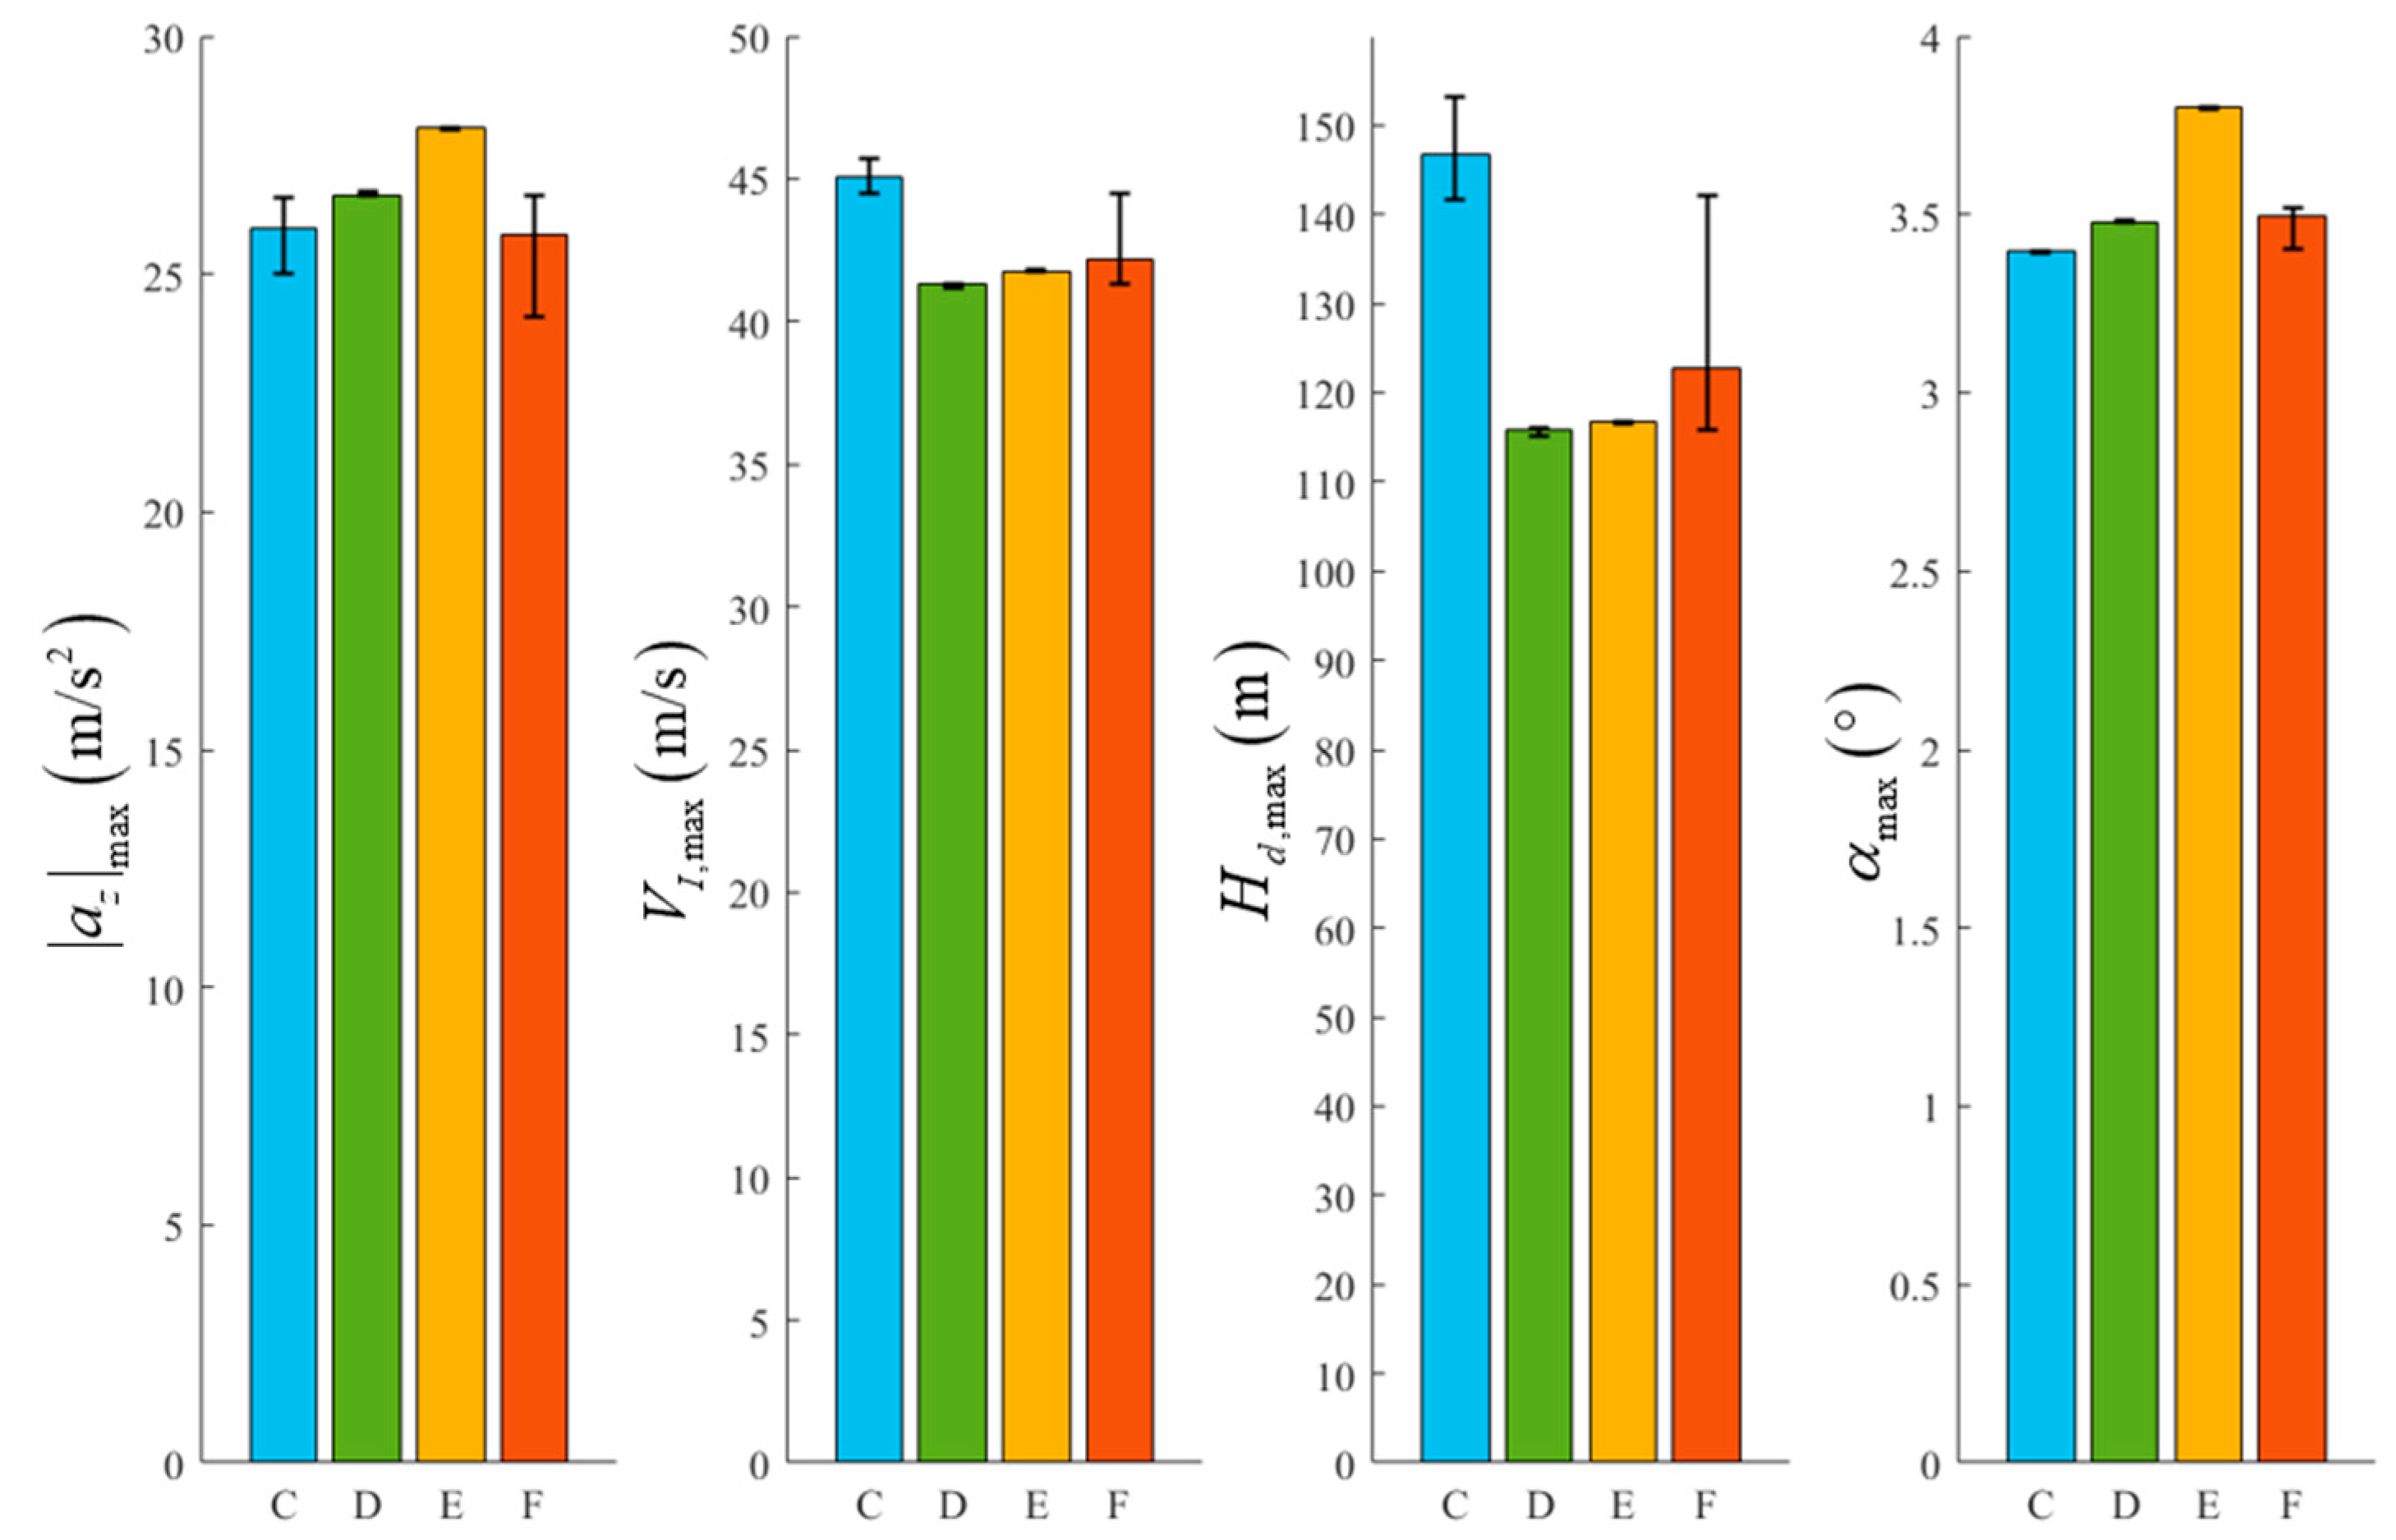
To validate the effectiveness of the comprehensive fitness mechanism based on target priority and segmented scoring proposed in this study, optimization was performed by assigning I r values to each fitness function according to Table 7. Subsequently, the maximum, minimum, and average values of the fitness functions were statistically analyzed for the P s in the final generation population.
The optimization results are shown in Figure 11 and Table 8. The interactions among the four indicators a z max , V I , max , H d , max , and α max during the pull-up process primarily manifest through their influence on pull-up speed:
1. For maximum I r assigned to a z max (Group C), the optimized pull-up process exhibits smaller a z max and slower pull-up speed, resulting in relatively smaller α max . This also leads to significantly larger H d , max , and the subsequent conversion of potential energy to kinetic energy causes higher V I , max
2. For maximum I r assigned to V I , max (Group D), the conversion from potential to kinetic energy is essentially constrained, making Group D show the lowest values for both H d , max and V I , max
3. For maximum I r assigned to H d , max (Group E), the situation resembles point 2. Additionally, since reducing H d , max essentially accelerates the pull-up process, Group E demonstrates the largest a z max and α max values.
4. For maximum I r assigned to α max (Group F), the P s in the population exhibit overall smaller α max values, corresponding to slower UAV pitch rates. Consequently, both H d , max and V I , max remain slightly larger while a z max stays smaller.

4.2. Simulation and Flight Result Analysis

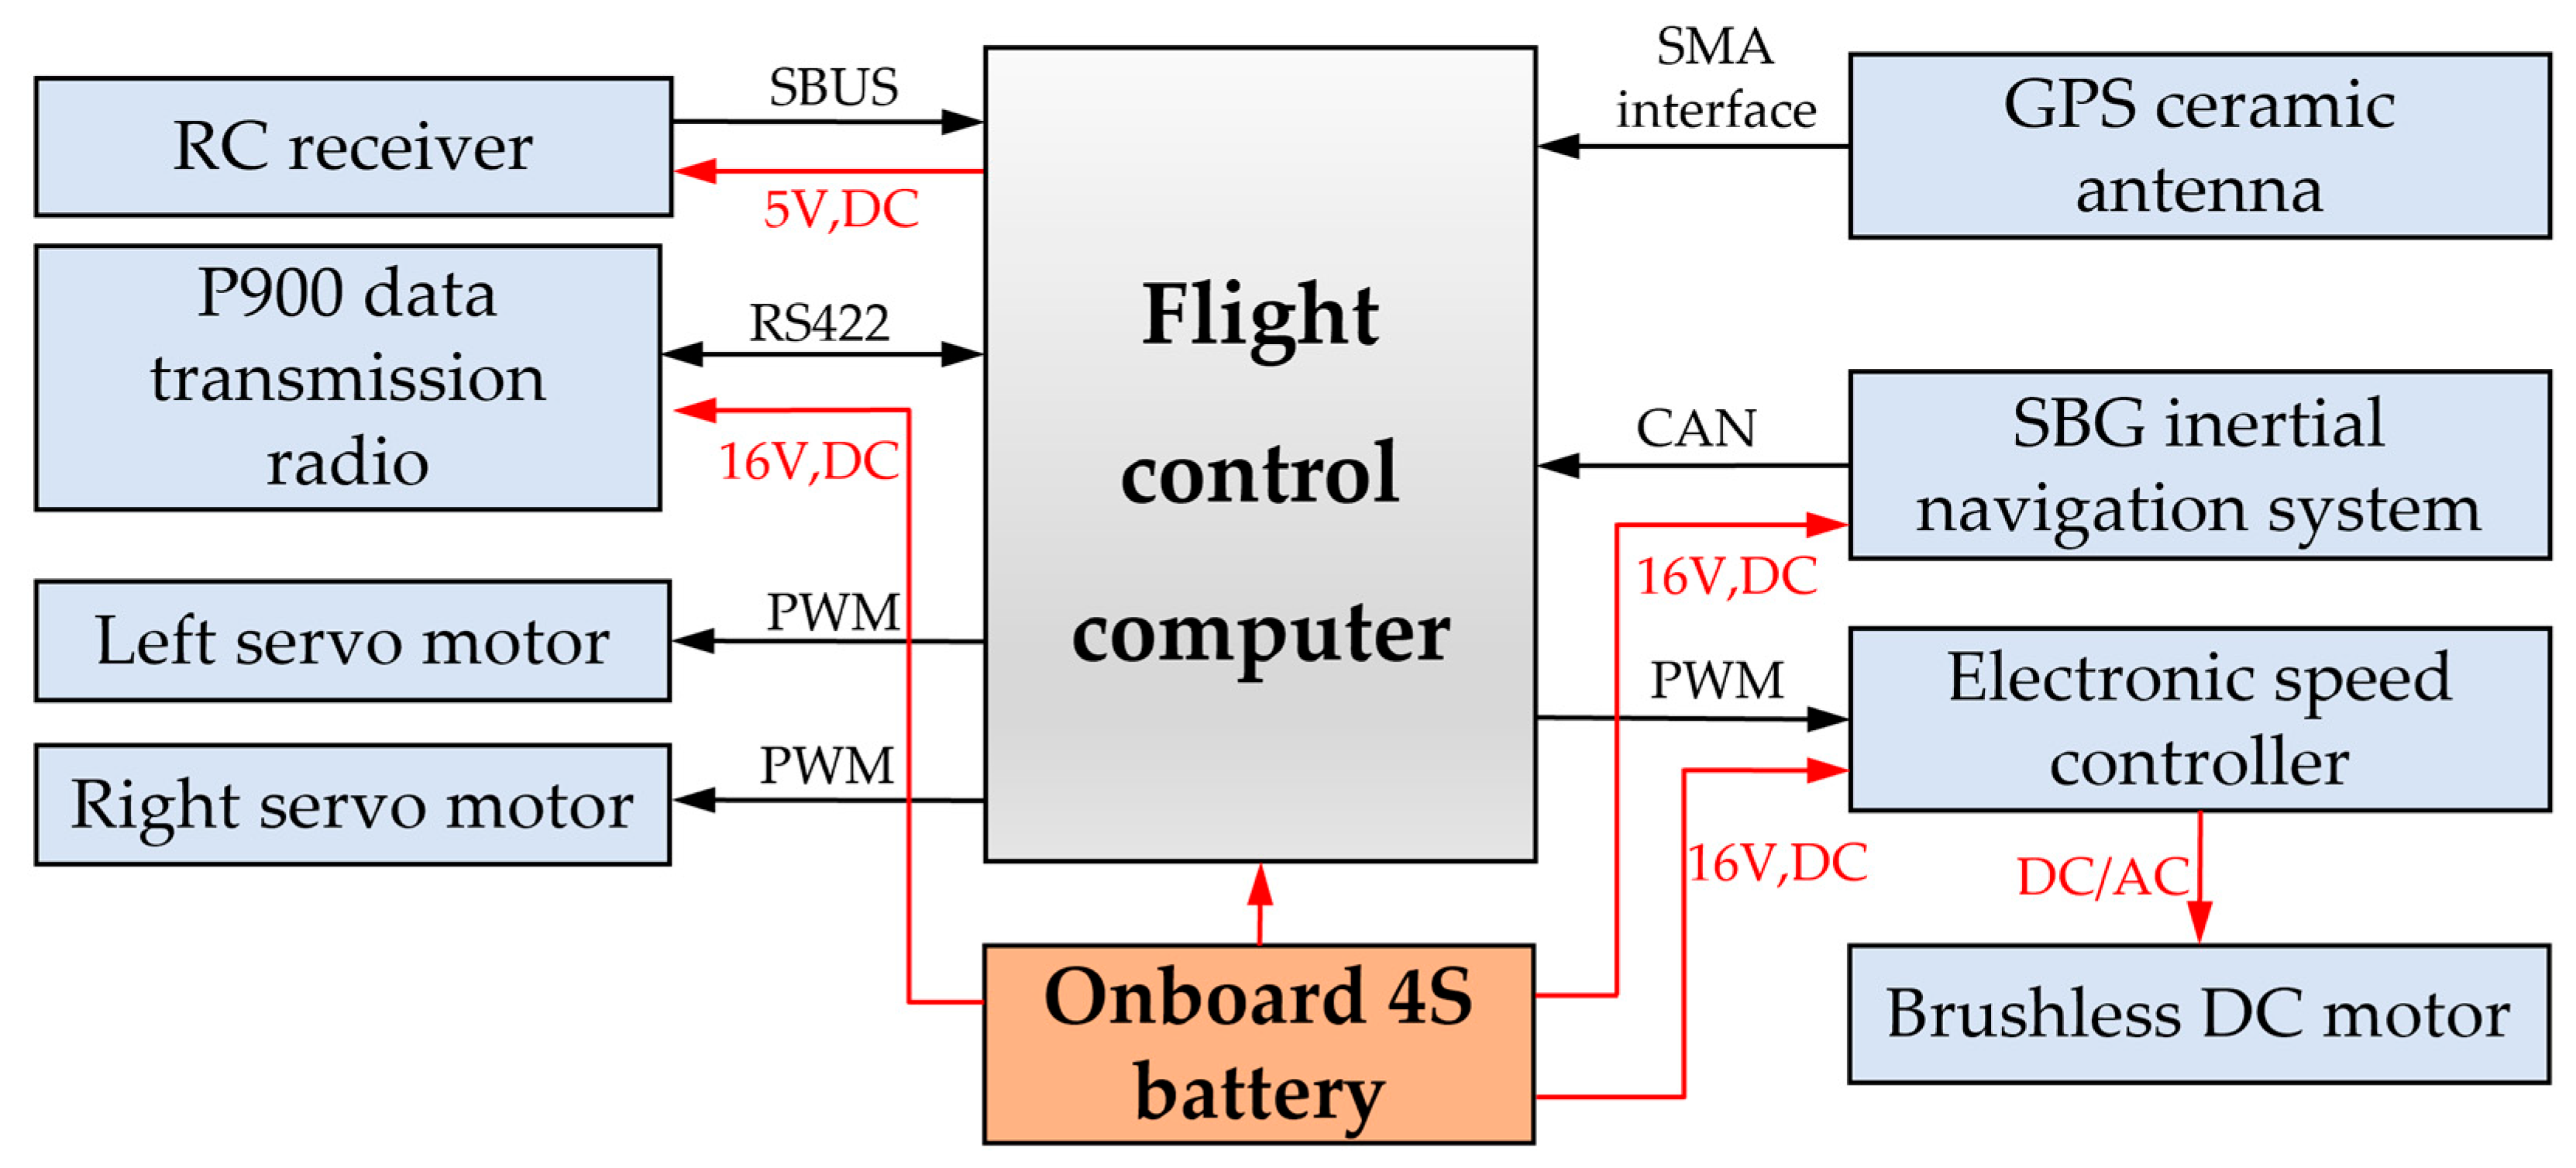
The UAV’s avionics connections are shown in Figure 12. The entire system is powered by a single onboard battery. The propulsion system employs a brushless DC motor. Attitude and overload data are collected by an external inertial navigation unit and transmitted to the flight control computer via the CAN protocol. The GPS antenna adopts a ceramic patch antenna, which allows installation on the compact airframe without compromising aerodynamic performance. The UAV communicates with the ground control station through a data radio. Additionally, for flight test safety, the flight control computer includes a reserved interface for an RC receiver, enabling manual intervention via remote control during emergencies.
The automatic pull-up flight test setup is shown in Figure 13a. The carrier aircraft lifts the entire UAV to an altitude of 350 m from the ground by suspending it via a tether attached to the propeller nut. After reaching altitude, it hovers while awaiting release. As shown in Figure 13b, when release is required, the operator sends a signal through the remote controller to the RC receiver, commanding the servo to move the rocker arm and release the tether, causing the UAV to separate from the carrier aircraft under gravity.
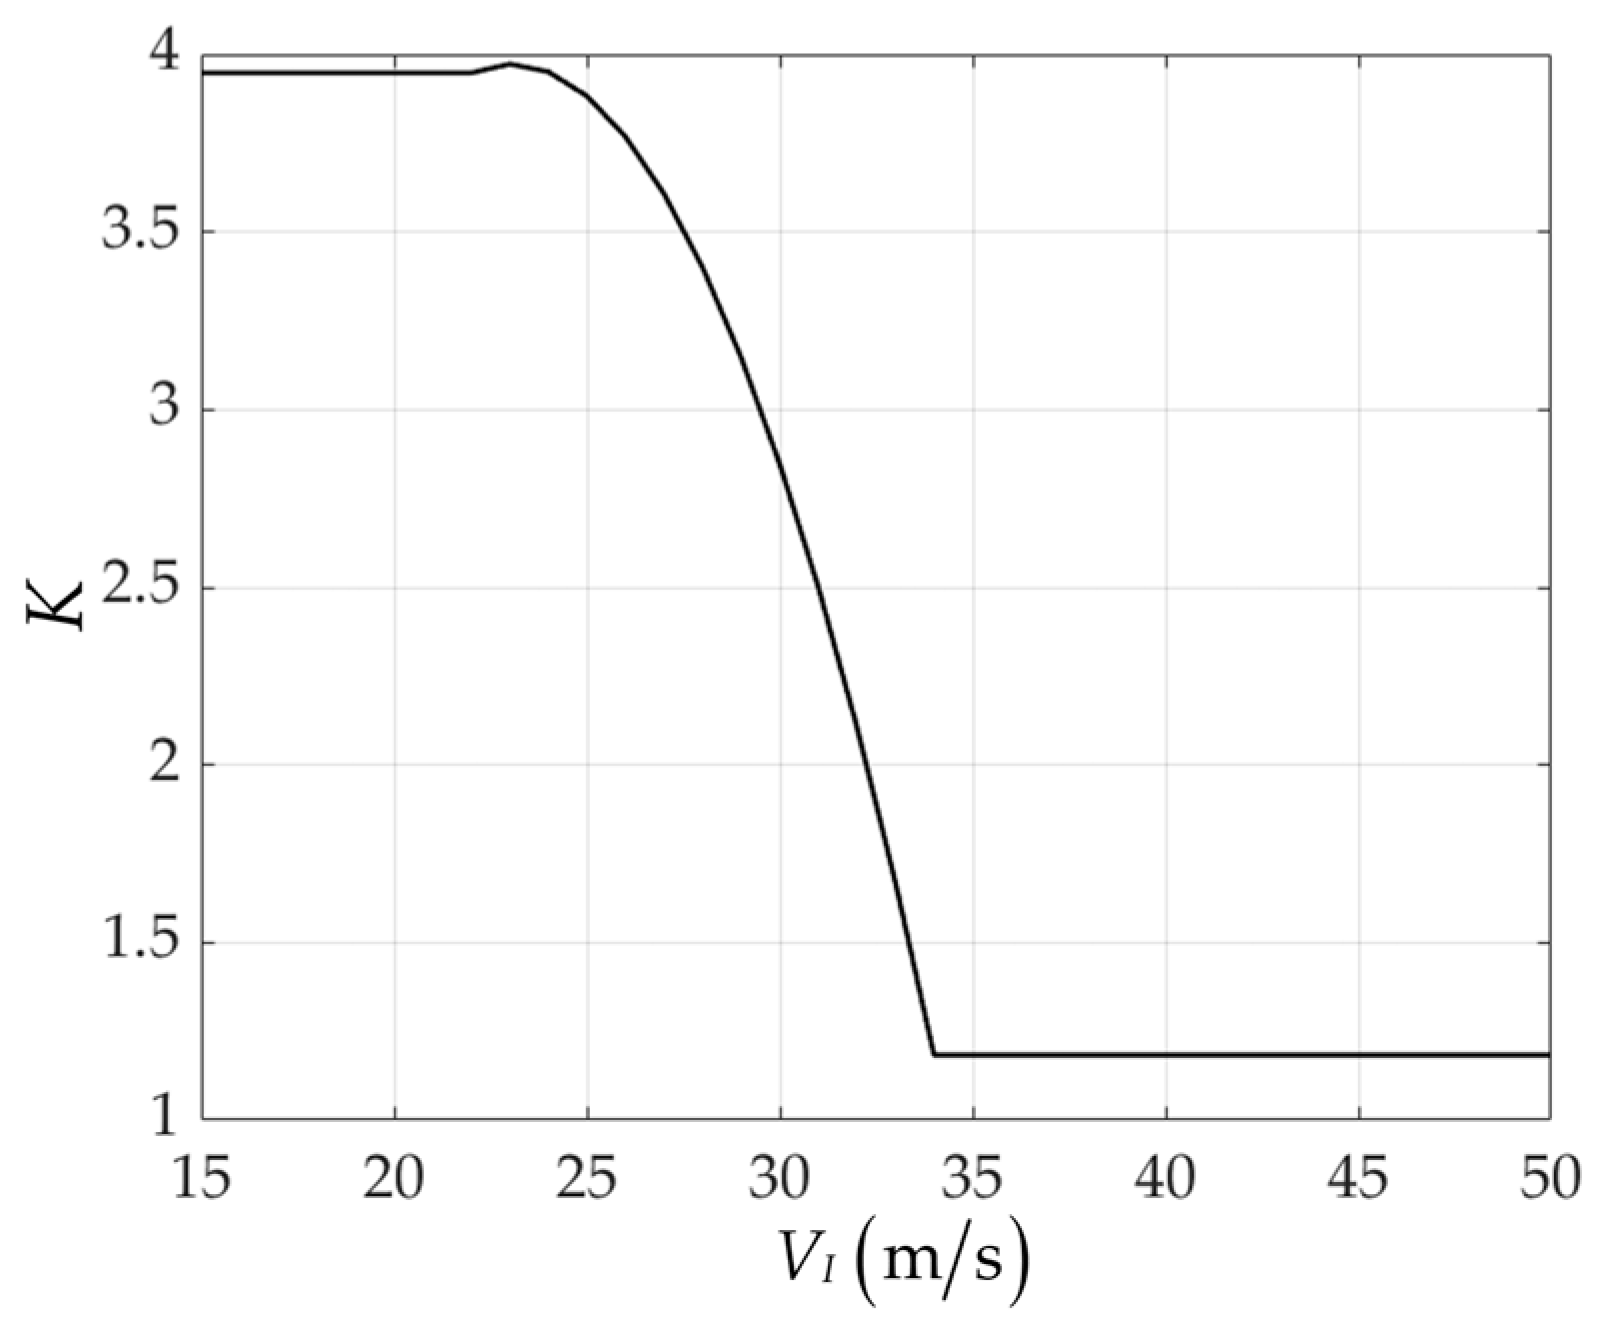
After optimizing the controller parameters, the resulting values for K P , K I , and K D are 0.254, 0.00058, and 0.0137, respectively. The variation in parameter K with V I is shown as 0. As shown in Figure 14, K ’s lower limit is set at the UAV’s stall speed of 22 m / s , while the upper limit prevents the controller gain K from becoming negative due to increased control surface effectiveness at higher airspeeds. Overall, K decreases as V I increases because higher V I enhances control surface effectiveness, requiring reduced parameter values to maintain stable control.
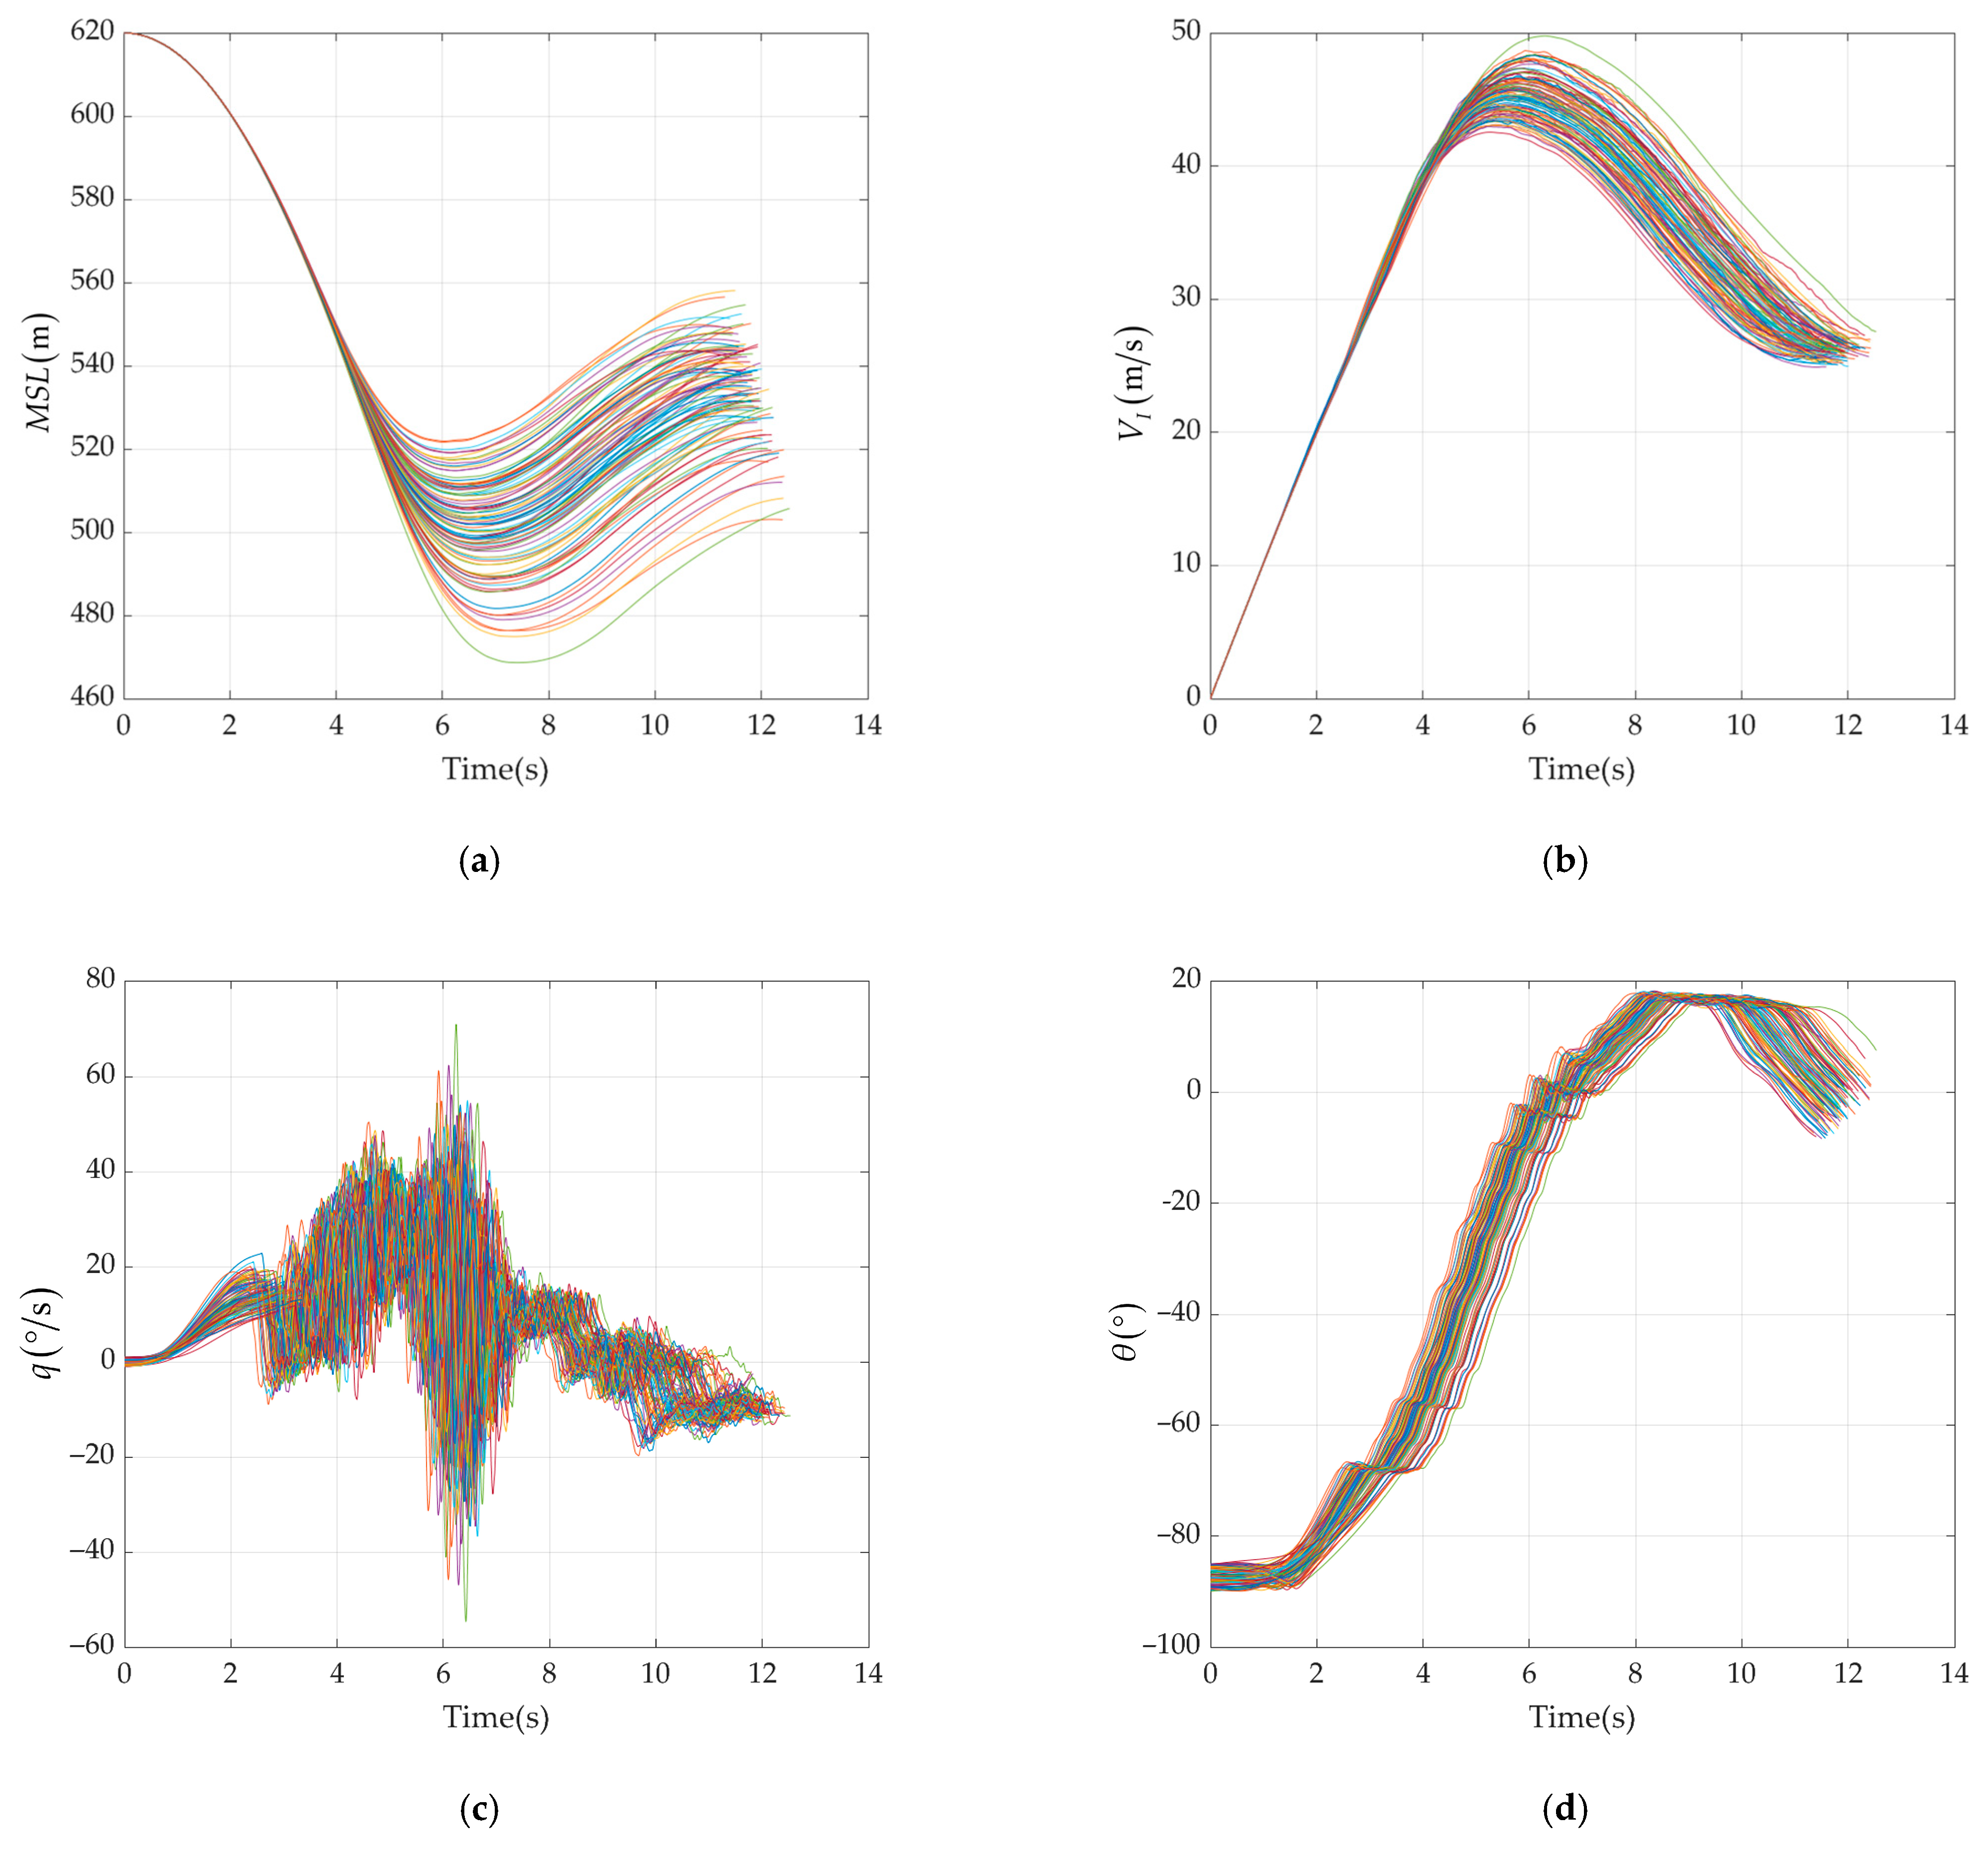
In order to further ensure the robustness of the controller, 100 simulations under random perturbation of conditional parameters were conducted. In addition to the aerodynamic parameters, mass and moment of inertia, initial attitude of the UAV, control surface deflection dead zone, and thrust mentioned in Section 3.2, constant wind and turbulent wind were also included in the perturbation parameters. Due to the low probability of encountering wind shear, it is not considered here. The perturbation range of constant wind speed is 0~10 m / s , and the wind direction is downwind or headwind relative to the initial yaw angle. The Dryden model is used to measure turbulent wind speed at a height of 6 m above the ground, with a perturbation range of 0~10 m / s . The perturbation range of turbulent wind occurrence time is 0~15 s after release. In addition, white noise with a signal-to-noise ratio of 1 dB has been added to the input parameters θ , q , and V I of the controller. The simulation results are shown in Figure 15.
The most extreme values of various indicators in the simulation results are summarized as follows:
From Figure 15 and Table 9, it can be seen that the controller has good robustness under the given simulation conditions and can enable the UAV to pull up stably and safely.
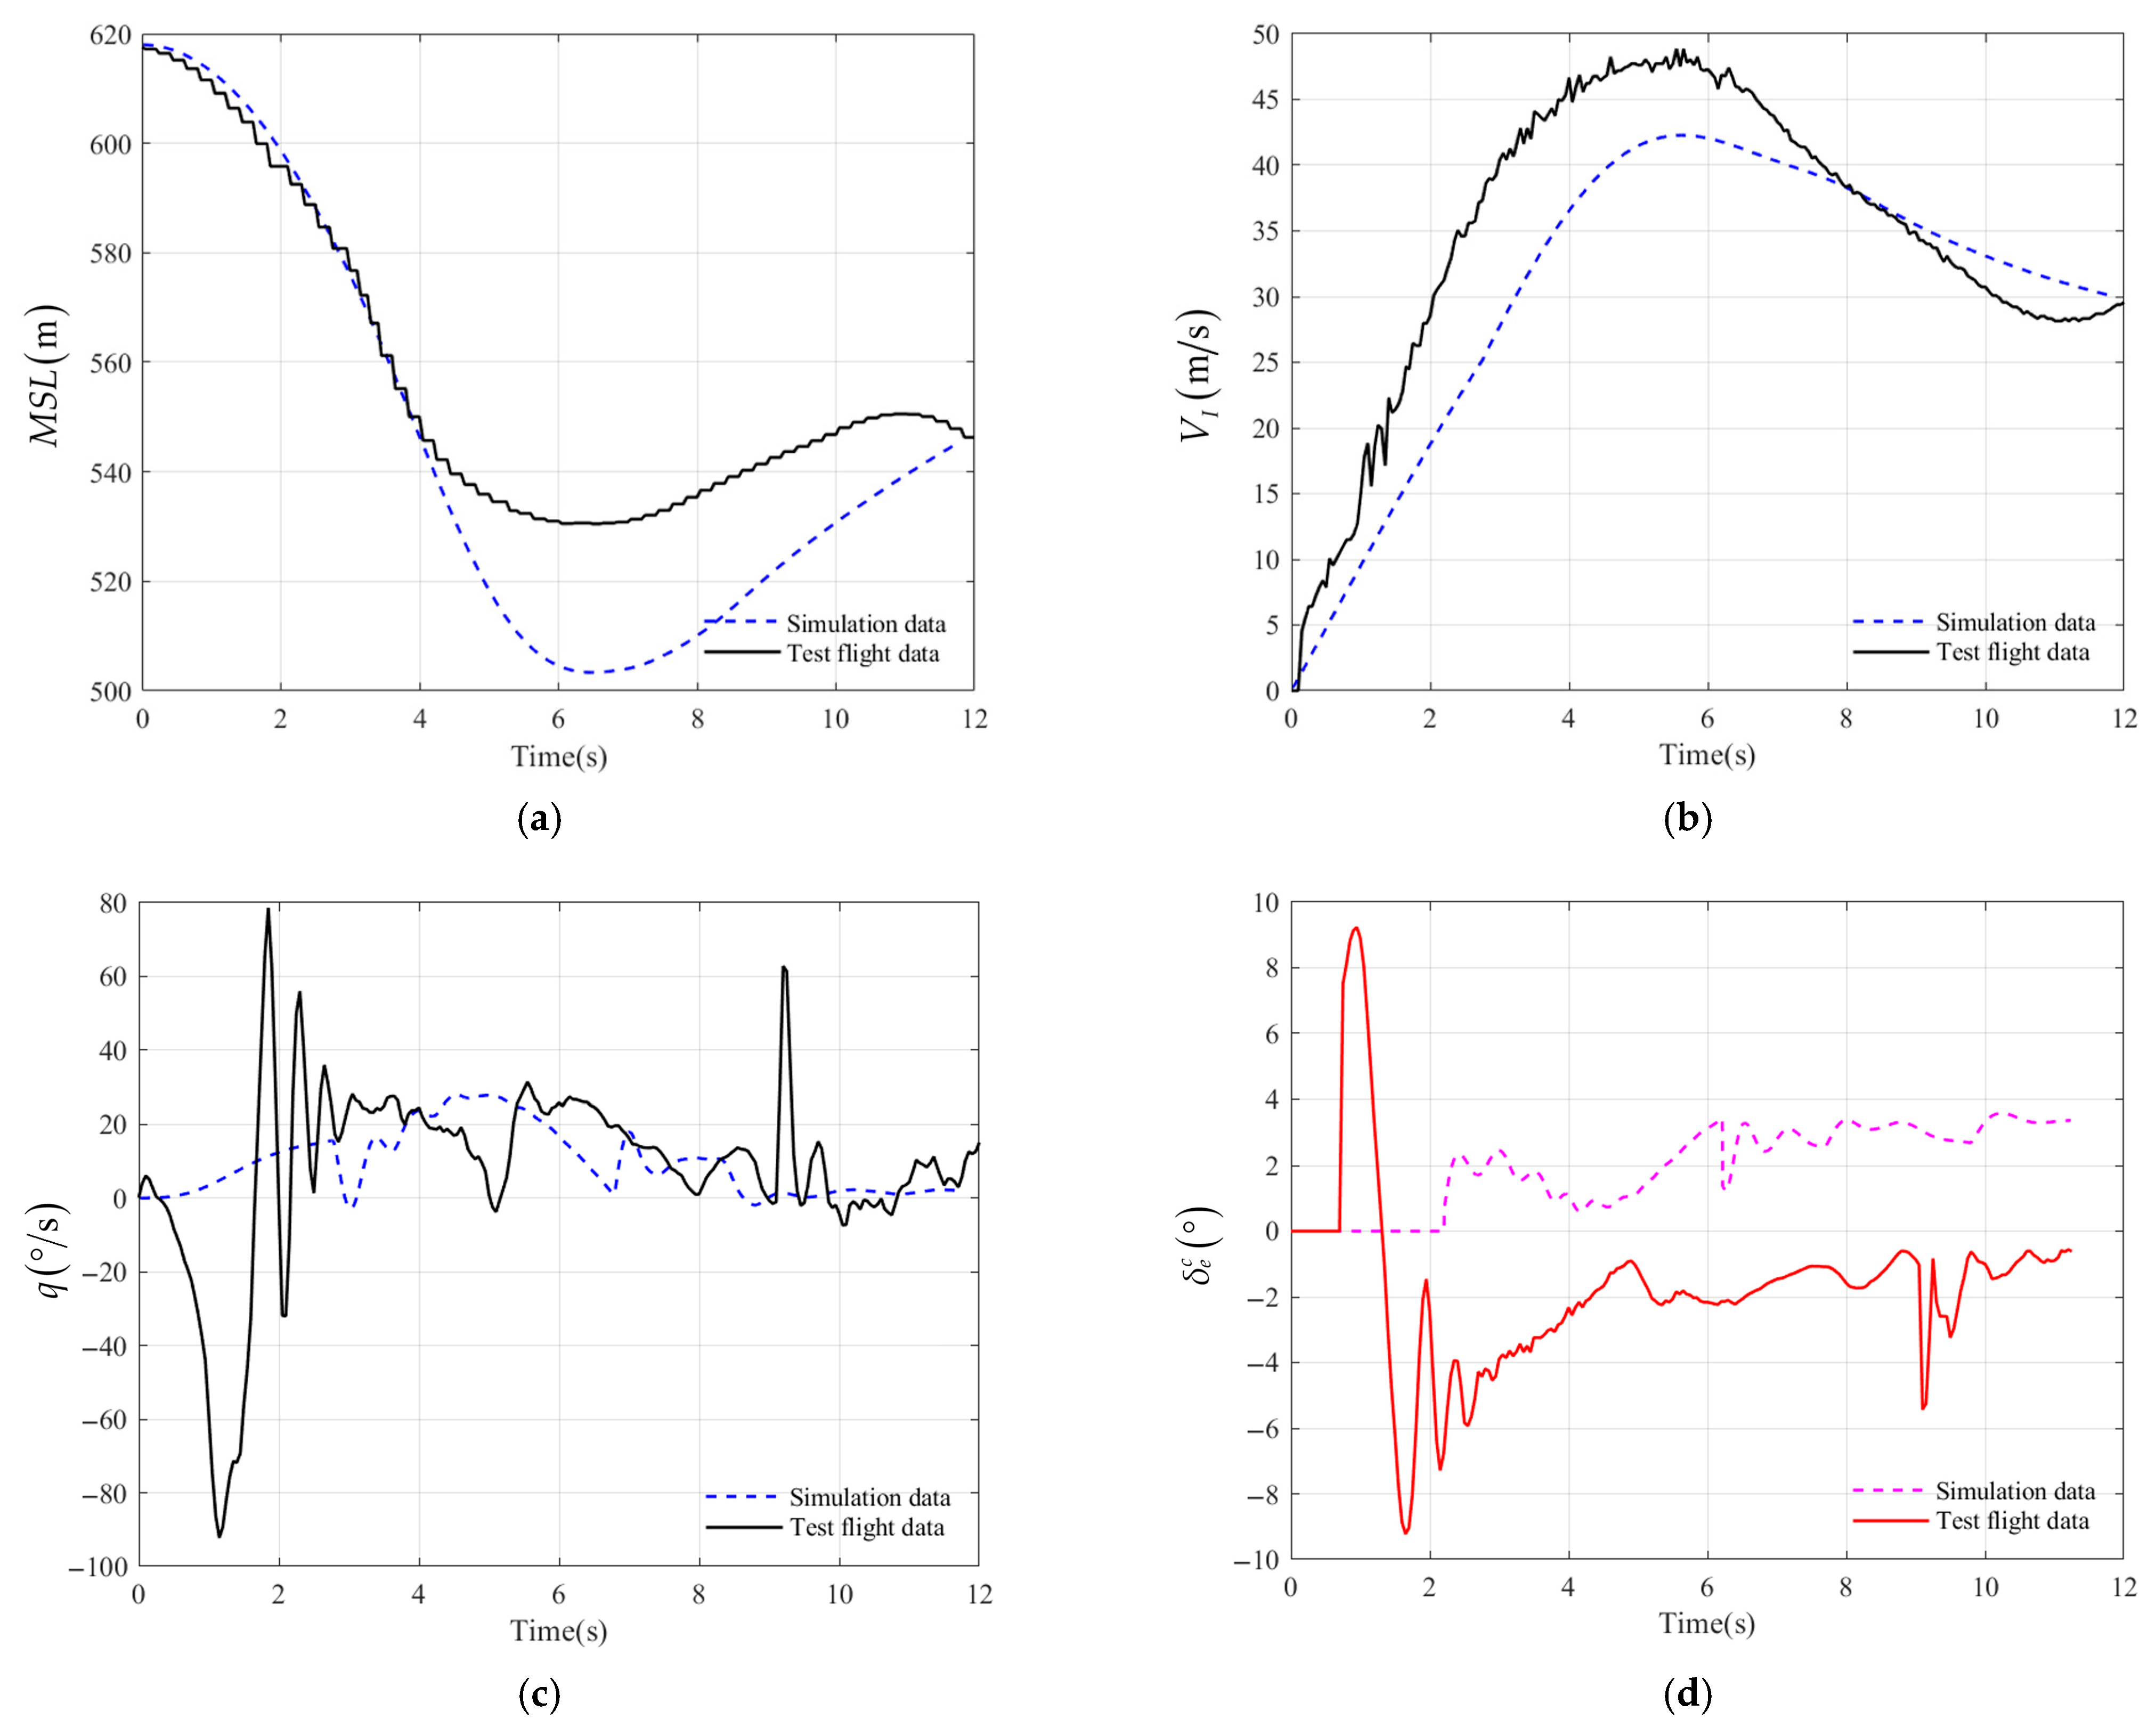
Figure 16 compares the simulation results under nominal conditions with the flight test results. In the simulation, the UAV is released at an altitude of 620 m , with an initial velocity of 0 m / s . All angular velocities are 0, and the initial attitude angles are 0 ° 90 ° 90 ° . The trends in altitude, indicated airspeed, and pitch angle during the pull-up process are generally consistent.
As shown in Figure 16, in the flight test, the UAV initially exhibits a pitch angle of approximately 75 ° at release due to wind conditions and rotor wash from the carrier aircraft. This initial condition also results in significant oscillations in the pitch rate q and pitch angle θ during the early stage after UAV being airdrop.
In order to clarify the degree of matching between the nominal condition simulation results and the flight test results, the values of indicators such as maximum descent altitude H d , max , maximum airspeed V I , max , pitch angular rate range R q , maximum normal overload absolute value a z max , elevator command range R δ e , time to enter the pull up t p u l l u p , duration of the pull-up process d p u l l u p , and the time when certain indicators reach their maximum values were selected. These data are listed in Table 10.
Based on Table 10 and combined with flight test conditions, the following analysis was conducted:
1. As shown in Figure 16a,b, during the flight test, the H d , max of the UAV was 23.3% lower than the simulation, resulting in a 15.8% increase in V I , max compared to the simulation. However, the time at which these two variables reached their maximum values was almost the same.
2. As shown in Figure 16c, the influence of wind led to a significant increase in the R q of UAV during flight testing compared to simulation results. It is also reflected in the range of elevator command R δ e , which is shown in Figure 16d.
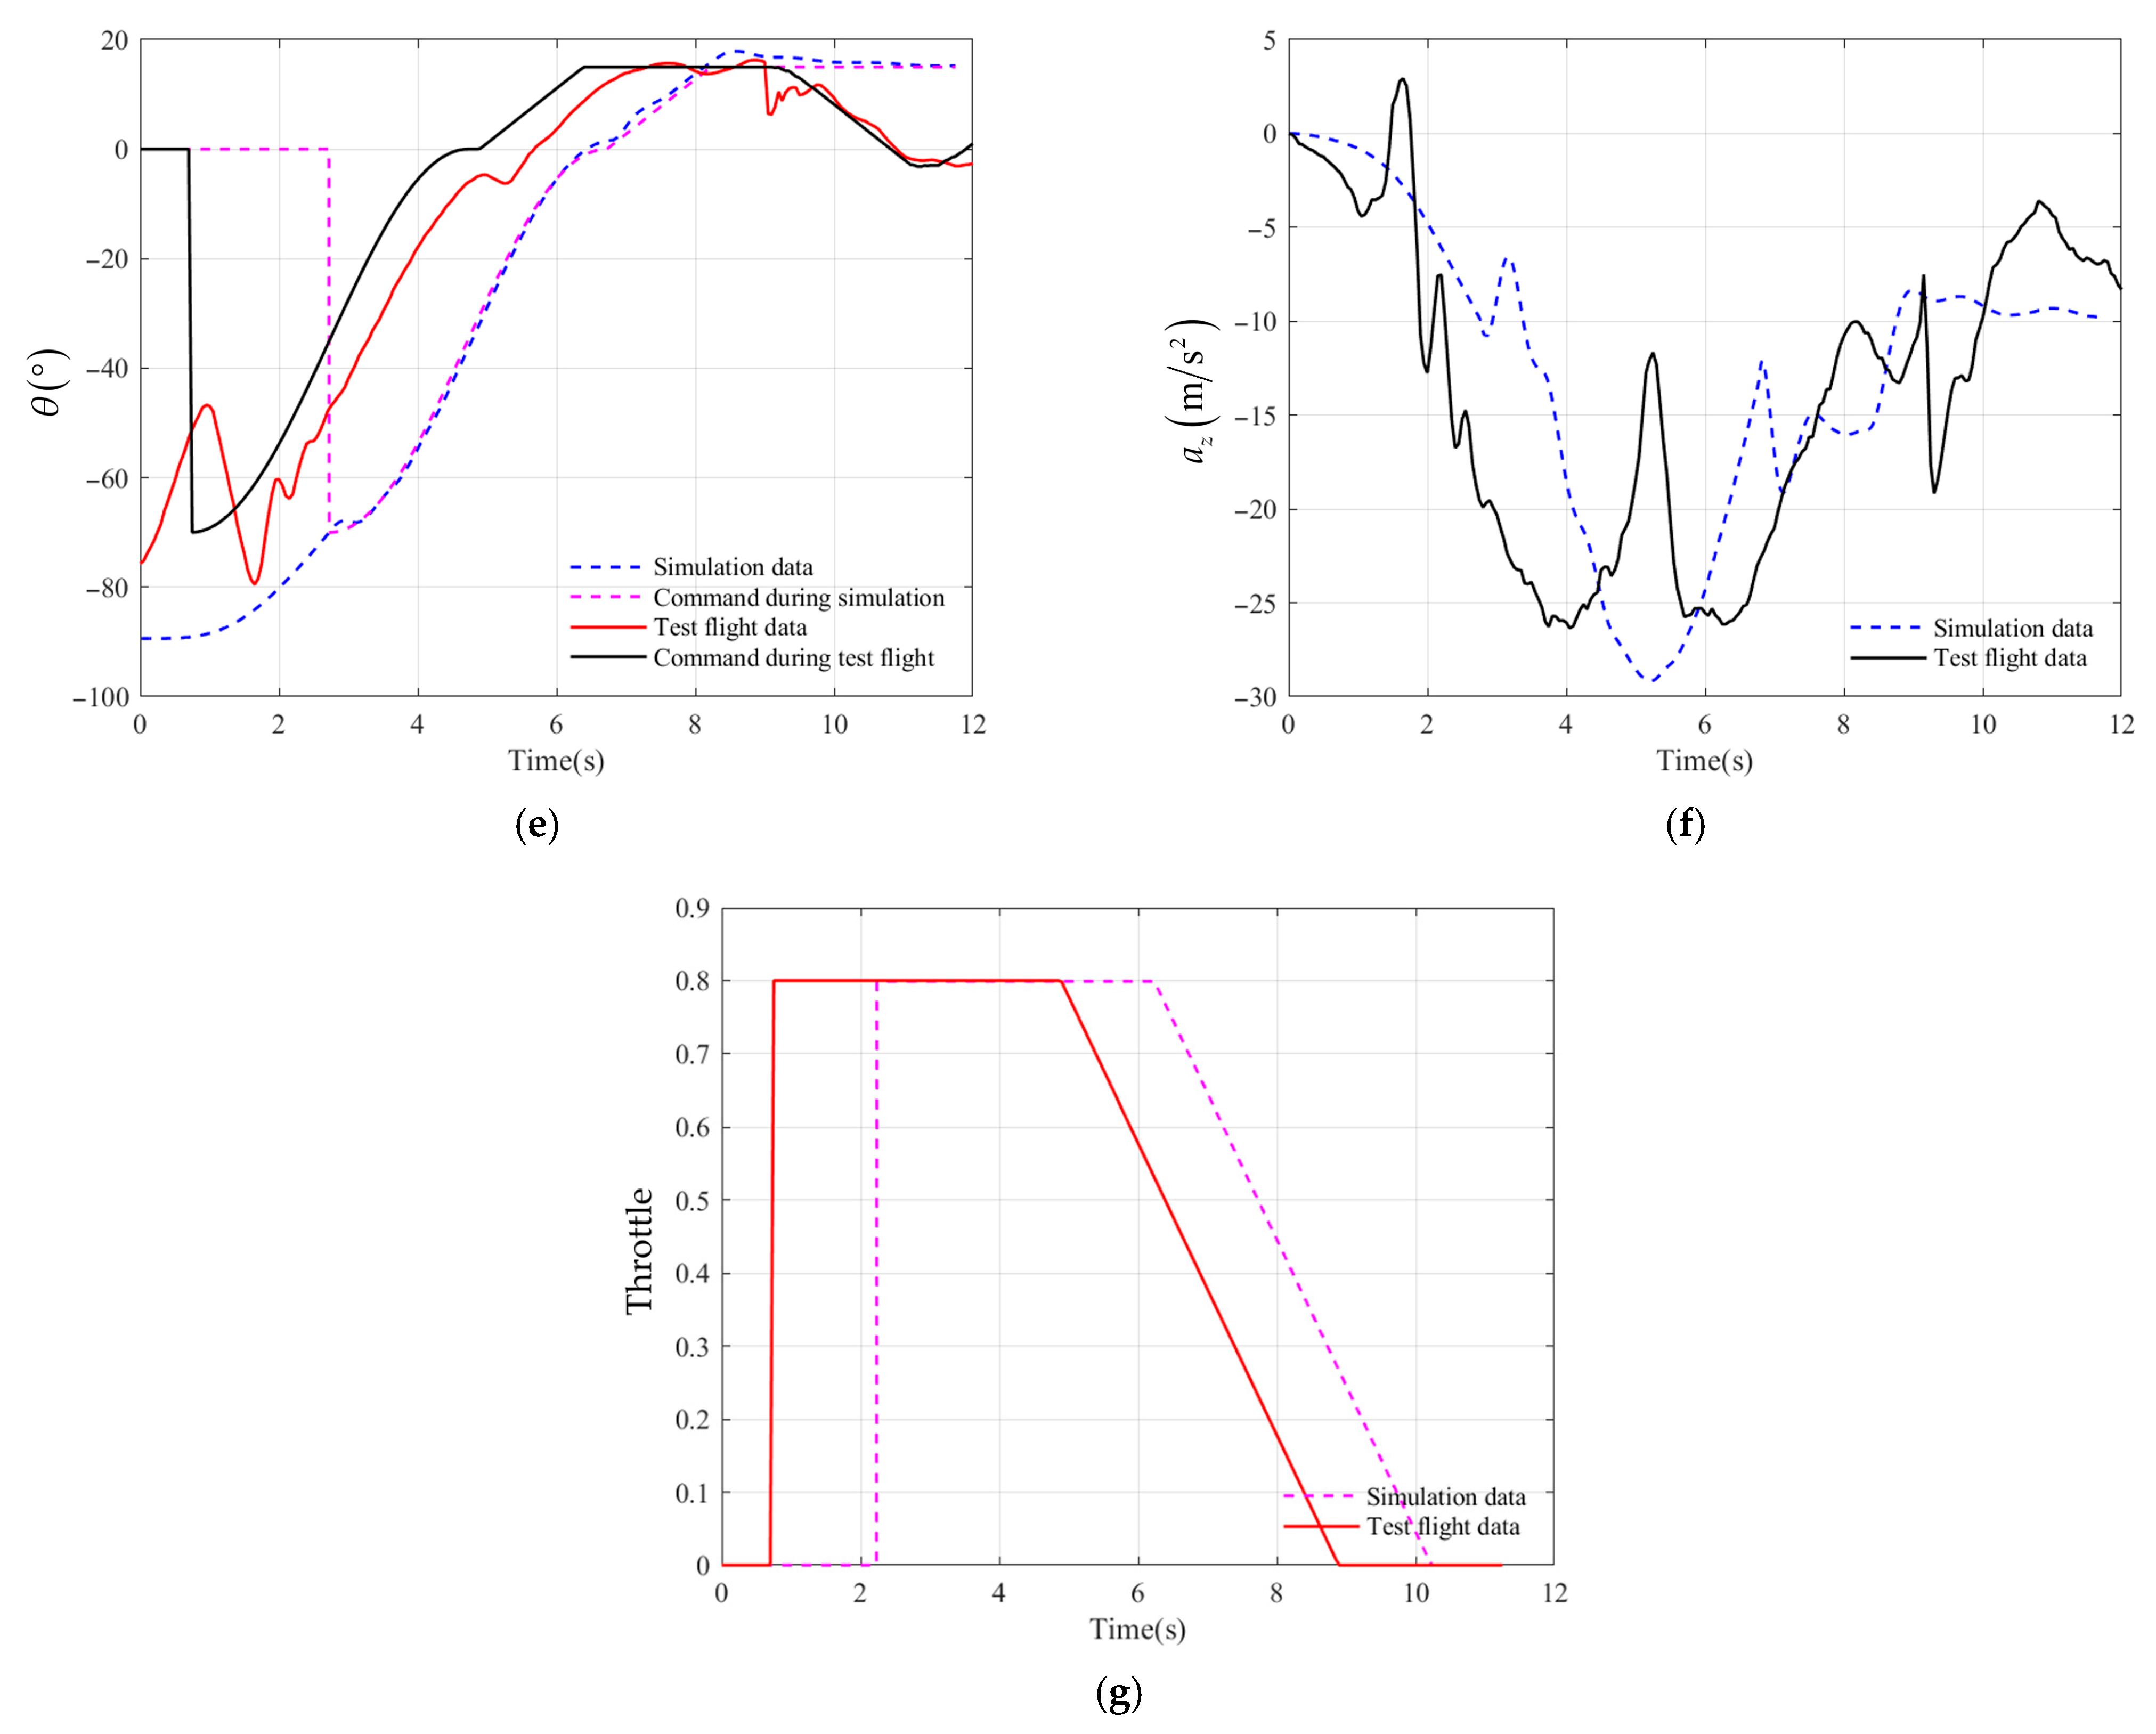
3. As shown in Figure 16e, the influence of wind causes the pitch angle θ to reach the pull up condition earlier during the flight test ( θ > 70 ° ), and the pitch rate q is also oscillating, resulting in a z max reaching its maximum value, 1.2 s , earlier than the simulation, which is shown in Figure 16f. Due to the smaller velocity V I at this time, it is 9.6% lower than the simulation.
4. As shown in Figure 16g, at 0.75 s after airdrop, the throttle command remains constant at 0.8, indicating that the inner-loop PID controller begins intervention. Between 1.15 s and 3.05 s , oscillations occur in q , θ , and a z , and they then gradually converge, demonstrating the controller’s capability to mitigate initial condition effects and its inherent robustness under current conditions. As shown in Figure 16e, the duration from controller intervention to entering mission cruise mode is approximately 3.3 s in nominal simulations versus 3.1 s in flight tests.
5. At around 5 s , the throttle command stabilizes, marking the end of the pull-up phase and the transition to cruise mode. Before this point, θ remained near 0° while q gradually decreased. After switching modes, the UAV increased θ to climb and recover altitude lost during pull-up, causing a sharp rise in θ and significant change in normal overload a z due to high airspeed.
6. During simulation and flight testing, the time taken for the UAV to automatically lift up is basically the same. However, due to the influence of wind, the UAV enters the lifting phase 1.7 s earlier than simulation during flight testing.
7. Figure 16d,e reveal that under nominal simulation conditions, θ closely tracks commands with continuous positive control surface deflection to suppress excessive nose-up tendencies. In contrast, flight tests show θ lagging behind commands by approximately 15 ° during stable pull-up, requiring negative control surface deflection for command tracking.
In summary, while noticeable discrepancies exist between flight test data and simulation results due to modeling errors and external disturbances, the overall trends remain consistent. The experimental data demonstrate that the proposed variable-parameter PID controller enables the UAV to achieve automatic pull-up under certain initial disturbances.

5. Conclusions and Prospect

This paper presents an automatic control logic for UAV pull-up after being airdropped, employing a variable-parameter PID controller for longitudinal channel control, optimized through an improved NSGA-II algorithm.
  • In order to accommodate the pronounced variations in state parameters during pull-up maneuvers, a variable-parameter PID control strategy was formulated. The controller parameters, changed as quadratic functions of the indicated airspeed, were systematically adjusted to achieve precise regulation of the UAV’s pitch angle.
  • An enhanced NSGA-II was developed by integrating objective prioritization with segmented fitness scoring to guide evolution, while an adaptive genetic strategy was employed to maintain diversity and avoid local optima.
  • The flight test results show that the controller designed in this study can successfully control the UAV to pull up. It also can eliminate the longitudinal channel oscillation caused by environmental wind, proving that the controller has certain robustness.
The control strategy proposed in this study is applicable to the scenario where small fixed-wing UAVs automatically pull up after airdrop. This allows the UAVs to be transported by carrier to mission areas such as mountainous regions, islands, forests, deserts, and large disaster areas before deployment, compensating for the shortcomings of small UAVs in terms of range and flight time. If the front and rear wings, vertical tail, and propeller are designed to be foldable, it can be convenient for the carrier to carry multiple UAVs, thereby deploying a swarm of UAVs with collaborative capabilities in the mission area. Therefore, the application prospects of this study are broad.
To further improve the applicability of this technology in complex environments, it is necessary to conduct in-depth research on the impact of various initial conditions (such as attitude and speed) and environmental factors on aerial deployment to ensure the reliability of this approach.

Author Contributions

Conceptualization, W.M. and Z.G.; methodology, H.Z.; formal analysis, G.L.; writing—original draft preparation, H.Z.; writing—review and editing, W.M.; project administration, J.Z. All authors have read and agreed to the published version of the manuscript.

Funding

This research received no external funding.

Data Availability Statement

The data presented in this study are available on request from the corresponding author. The data are not publicly available due to regulation of laboratory data management.

Conflicts of Interest

The authors declare no conflict of interest for this paper.

References

  1. Wasim, M.; Ullah, M.; Iqbal, J. Taxi Model of Unmanned Aerial Vehicle: Formulation and Simulation. In Proceedings of the 2018 1st International Conference on Power, Energy and Smart Grid (ICPESG), Mirpur Azad Kashmir, Pakistan, 9–10 April 2018; pp. 1–6. [Google Scholar]
  2. Gnemmi, P.; Changey, S.; Meder, K.; Roussel, E.; Rey, C.; Steinbach, C.; Berner, C. Conception and Manufacturing of a Projectile-Drone Hybrid System. IEEE/ASME Trans. Mechatron. 2017, 22, 940–951. [Google Scholar] [CrossRef]
  3. Safaee, A.; Moreira, A.P.; Aguiar, A.P. Designing and Developing a Fixed-Wing Tail-Sitter Tethered VTOL UAV with Custom Autopilot: A MIMO H∞ Robust Control Approach. In Proceedings of the 2025 IEEE International Conference on Autonomous Robot Systems and Competitions (ICARSC), Funchal, Portugal, 2–3 April 2025; pp. 138–143. [Google Scholar]
  4. Finigian, M.; Kavounas, P.A.; Ho, I.; Smith, C.C.; Witusik, A.; Hopwood, A.; Avent, C.; Ragasa, B.; Roth, B. Design and Flight Test of a Tube-Launched Unmanned Aerial Vehicle. Aerospace 2024, 11, 133. [Google Scholar] [CrossRef]
  5. Lu, Y.; Chen, Q.; Wang, P.; Wang, B.; Guo, Z. Design and Experiment of a Small Air-Launched UAV. Acta Aeronaut. Et Astronaut. Sin. 2023, 44, 528642. [Google Scholar] [CrossRef]
  6. Watson, M.; Gonzalez, F. Design and Implementation of a Low-Cost Folding-Wing UAV for Model Rocket Deployment. In Proceedings of the 2023 IEEE Aerospace Conference, Big Sky, MT, USA, 4–11 March 2023; pp. 1–10. [Google Scholar]
  7. Wang, X.; Zeng, G.; Yan, X.; Chen, W.; Li, K.; Yang, Y. A Feasibility Verification Scheme with Flight Analysis for Balloon-Borne Launched Unmanned Aerial Vehicles. In Proceedings of the 2020 3rd International Conference on Unmanned Systems (ICUS), Harbin, China, 27–28 November 2020; pp. 966–971. [Google Scholar]
  8. Liu, C. Technical Research of Initial State to Level Flight Control for Parachute-Type Small Aircraft. Ph.D. Dissertation, Beijing Institute of Technology, Beijing, China, 2014. [Google Scholar]
  9. Qu, Z.; Yang, Y.; Li, C.; Hao, Y.; Liu, Y.; Yan, F. Study of Balloon Launched Micro Air Vehicle Design and Flight Test. In Proceedings of the 7th China High Resolution Earth Observation Conference, Changsha, China, 17–19 November 2020. [Google Scholar]
  10. Cheng, Y.; Zhou, Z.; Wang, Z. Research on Deployment Process of Gravitational Airdrop UAV. J. Northwestern Polytech. Univ. 2022, 40, 485–492. [Google Scholar] [CrossRef]
  11. Zhang, D.; Chen, Z.; Xi, L. Adaptive Dual Fuzzy PID Control Method for Longitudinal Attitude Control of Tail-Sitter UAV. In Proceedings of the 2016 22nd International Conference on Automation and Computing (ICAC), Colchester, UK, 7–8 September 2016; pp. 378–382. [Google Scholar]
  12. Megyesi, D.; Bréda, R.; Schrötter, M. Adaptive Control and Estimation of the Condition of a Small Unmanned Aircraft Using a Kalman Filter. Energies 2021, 14, 2292. [Google Scholar] [CrossRef]
  13. Hu, Y.; Hu, Y.; Ding, X.; Zeng, G.; Guo, J. An Adaptive Launch Control for Balloon-Borne UAVs with Large Wingspans. Appl. Sci. 2022, 12, 10992. [Google Scholar] [CrossRef]
  14. Zhao, Y.; Lu, J.; Yan, Q.; Lai, L.; Xu, L. Research on Cell Manufacturing Facility Layout Problem Based on Improved NSGA-II. Comput. Mater. Contin. 2020, 62, 355–364. [Google Scholar] [CrossRef]
  15. Zhao, Z.; Liu, B.; Zhang, C.; Liu, H. An Improved Adaptive NSGA-II with Multi-Population Algorithm. Appl. Intell. 2019, 49, 569–580. [Google Scholar] [CrossRef]
  16. Du, J.; Liu, R.; Cheng, D.; Wang, X.; Zhang, T.; Yu, F. Enhancing NSGA-II Algorithm through Hybrid Strategy for Optimizing Maize Water and Fertilizer Irrigation Simulation. Symmetry 2024, 16, 1062. [Google Scholar] [CrossRef]
  17. Jain, K.; Gupta, S.; Kumar, D. Multi-Objective Power Distribution Optimization Using NSGA-II. Int. J. Comput. Methods Eng. Sci. Mech. 2021, 22, 235–243. [Google Scholar] [CrossRef]
  18. Pang, L.M.; Ishibuchi, H.; Shang, K. NSGA-II With Simple Modification Works Well on a Wide Variety of Many-Objective Problems. IEEE Access 2020, 8, 190240–190250. [Google Scholar] [CrossRef]
  19. Zhang, L.; Ge, H.; Ma, Y.; Xue, J.; Li, H.; Pecht, M. Multi-Objective Optimization Design of a Notch Filter Based on Improved NSGA-II for Conducted Emissions. IEEE Access 2020, 8, 83213–83223. [Google Scholar] [CrossRef]
Figure 1. Aerodynamic layout of UAV.
Drones 09 00679 g001
Figure 2. Dynamic response curve of servo motor (unit step signal input at 1st second).
Drones 09 00679 g002
Figure 3. The process of airdrop and pull-up of UAV.
Drones 09 00679 g003
Figure 4. Structure of pitch angle controller.
Drones 09 00679 g004
Figure 5. The overall process of target priority and segmented scoring based adaptive NSGA-II.
Drones 09 00679 g005
Figure 6. Schematic diagram of non-dominated sorting (green represents the Pareto front).
Drones 09 00679 g006
Figure 7. The variation in successful simulation pull ups with evolutionary generations under perturbation of conditional parameters: (a) adopting Strategy A; (b) adopting Strategy B.
Drones 09 00679 g007
Figure 8. Statistical information on the fitness of the last generation population when adopting Strategies A and B.
Drones 09 00679 g008
Figure 9. Trend in runtime changes in each step of the improved NSGA-II.
Drones 09 00679 g009
Figure 10. The mean and minimum values of various fitness functions of individuals in P s during the evolution process when adopting Strategies A and B: (a) a z max ; (b) V I , max ; (c) H d , max ; (d) α max .
Drones 09 00679 g010aDrones 09 00679 g010b
Figure 11. Statistical analysis of the fitness function of the last generation population under different values of I r (C, D, E and F correspond one-to-one with those in Table 7).
Drones 09 00679 g011
Figure 12. Schematic diagram of UAV flight control avionics system connection.
Drones 09 00679 g012
Figure 13. Flight test device that automatically pulls up after being airdropped: (a) overall structure of the experimental device; (b) partial enlarged view of the connection device.
Drones 09 00679 g013
Figure 14. Trend in K variation with airspeed after optimization.
Drones 09 00679 g014
Figure 15. Results of 100 simulations under random perturbation of conditional parameters: (a) mean sea level (m); (b) indicated airspeed ( m / s ); (c) pitch angular rate ( ° / s ); (d) pitch angle ( ° ); (e) normal acceleration ( m / s 2 ); (f) elevator command ( ° ); (g) throttle command.
Drones 09 00679 g015aDrones 09 00679 g015b
Figure 16. Comparison between simulation results after optimizing parameters and flight test data: (a) mean sea level (m); (b) indicated airspeed ( m / s ); (c) pitch angular rate ( ° / s ); (d) pitch angle ( ° ); (e) normal acceleration ( m / s 2 ); (f) elevator command ( ° ); (g) throttle command.
Drones 09 00679 g016aDrones 09 00679 g016b
Table 1. Parameters to be optimized in the controller.
Parameters K P K I K D K a K b K c
Minimum   U min 0.010.00010.0001−0.03200
Maximum   U max 50.050.020.1455
Table 2. Criteria for determining whether the pull up was successful.
Indicators a z max V I , max H d , max α max
Judgment conditions < 40 m / s 2 < 60 m / s < 200 m < 10 °
Table 3. Value of the importance index of the objective functions.
Objective Function r p a z max V I , max H d , max α max
Symbol f 1 f 2 f 3 f 4 f 5
The   value   of   a   I r 1000100101100
Table 4. Segmented scoring rules for objective functions.
Interval of Objective
Function Values
The   First   1 / 3 Between   1 / 3   and   2 / 3 The   Last   1 / 3
The   value   of   a   R r , i 321
Table 5. The runtime statistics of each step in the improved NSGA-II algorithm.
StepsAverage Runtime (s)Total Runtime (s)
Calculation of fitness function13.568835541221.195198
Non-dominated sorting0.0061983540.5578519
Calculation of crowding distance0.0036288410.3265957
Calculation of comprehensive fitness0.0003886170.0349755
Crossover and mutation0.0015872870.1428558
Table 6. The mean and minimum fitness functions of individuals in P s when adopting Strategies A and B. P s
ParametersStrategy AStrategy B
MeanMinimumMeanMinimum
a z max   ( m / s 2 )29.21729.21726.64426.634
V I , max   ( m / s )41.88541.88541.35041.341
H d , max ( m )116.504116.504115.955115.867
α max ( ° )4.0524.0523.5163.514
Table 7. The values of I r for different fitness functions.
I r r p a z max V I , max H d , max α max
C1000100101010
D1000101001010
E1000101010010
F1000101010100
Table 8. Statistical values of the fitness function of the last generation population under different target priority value methods.
Indicators a z max   ( m / s 2 ) V I , max   ( m / s ) H d , max ( m ) α max ( ° )
MeanRangeMeanRangeMeanRangeMeanRange
C25.9651.613645.0421.2394146.8311.5473.39550.0094
D26.6680.105841.2910.1532115.880.96413.47860.0070
E28.0820.049841.7850.0165116.670.10913.79870.0030
F25.8212.530842.1573.1302122.7026.0833.49590.1140
Table 9. The most extreme values of various indicators in the simulation results.
a z max V I , max H d , max α max
37.3 m / s 2 49.8 m / s 151.3 m 5.77 °
Table 10. Comparison of simulation and flight test results.
IndicatorsSimulation/Test DataBias of Test Data Relative to SimulationTime to Reach Maximum
SimulationTestSimulationTest
H d , max m m 23.3 % s s
V I , max 42.2   m / s 48.86   m / s + 15.8 % s s
R q 3 27 ° / s 93 78 ° / s ——
a z max 29.1   m / s 2 26.3   m / s 2 9.6 % s s
R δ e 0 3.5 ° 9.2 9.4 ° ——
t p u l l u p s s
d p u l l u p s s
Disclaimer/Publisher’s Note: The statements, opinions and data contained in all publications are solely those of the individual author(s) and contributor(s) and not of MDPI and/or the editor(s). MDPI and/or the editor(s) disclaim responsibility for any injury to people or property resulting from any ideas, methods, instructions or products referred to in the content.