Abstract
The intelligent development of unmanned aerial vehicles (UAVs) will make power inspection work more convenient. However, challenges such as reliance on precise tower coordinates and the low accuracy in recognizing small targets limit its further development. In this regard, this study proposes an autonomous inspection method based on target detection, encompassing both flight route planning and defect detection. For route planning, the YOLOv8 model is lightly modified by incorporating the VanillaBlock module, the GSConv module, and structured pruning techniques to enable real-time tower detection. Based on the detection results and UAV states, an adaptive route planning strategy is then developed, effectively mitigating the dependence on predefined tower coordinates. For defect detection, the YOLOv8 model is further enhanced by introducing the SPD-Conv module, the CBAM, and the BiFPN multi-scale feature fusion network to improve detection performance for small targets. Compared with multiple baseline models, the computational cost of the improved lightweight model is reduced by 23.5%, while the detection accuracy is increased by 4.5%. Flight experiments further validate the effectiveness of the proposed route planning approach. The proposed fully autonomous inspection method provides valuable insights into enhancing the autonomy and intelligence of UAV-based power inspection systems.
1. Introduction
Electricity resources play significant roles in human life and industrial production fields. To fulfill the growing demand for electricity in urban areas, power resources will have to be transported through long-distance transmission lines. However, transmission systems are often damaged in harsh environments, which can affect the stable operation of the power supply grid. Therefore, maintenance is essential to ensure the normal operation of the transmission system [1]. Compared with manual inspection, several automated inspection methods, such as climbing robots, Unmanned Aerial Vehicles (UAVs), hybrid robots, and orbital robots, can be used to perform inspection tasks more efficiently. Among these methods, UAVs have shown significant advantages due to their flexibility and efficiency [2]. However, the UAV method relies on tower coordinates, the acquisition of which requires complete tower data and causes high demands on the UAV’s positioning accuracy.
In this study, we propose a self-autonomous inspection method, which can complete inspection for arbitrary location towers, only relying on onboard sensors. Our method is based on the You Only Look Once version 8 (YOLOv8) model, and we enhance its lightweightness and detection accuracy in detecting small targets. The lightweight model is used for tower detection, and the detection results are further fed to the route planning system to estimate the following waypoint, while the small target model is used for the detection of defects after the tower images have been acquired. The main characteristics of our method can be summarized as follows:
- An inspection route planning method based on object detection was proposed. Lightweight improvements were made to the YOLOv8 model with the introduction of the VanillaBlock module, Grouped Spatial Convolution (GSConv) module, and structured pruning techniques. The improved model reduces computation by 23.5% and inference elapsed time by 8.7% compared to the baseline. Later, based on the isometric conversion between the relative pixel and distance, the actual distance between the tower and the pixel center can be calculated by the conversion rate, thus allowing us to plan out the target.
- A defect detection model was improved in terms of its ability to work on captured images. A Space-to-Depth Convolution (SPD Conv) module, a Convolutional Block Attention Module (CBAM), and a Bidirectional Feature Pyramid Network (BiFPN), which is an efficient multiscale feature fusion network, were introduced to enhance model recognition of low-pixel occupancy defects. Compared with the baseline, the detection accuracy improved by 4.5%, the recall increased by 7.5%, and the average precision improved by 8.1%.
The efficiency of the proposed inspection method was finally verified through several flights in real sequential tower scenarios. The rest of this paper is organized as follows: in Section 2, the work related to tower inspection and UAV inspection is described; in Section 3, we explain the design and improvement process of the two inspection models; in Section 4, we then describe the inspection route planning process. The experimental and validation procedures were demonstrated in Section 5. Finally, conclusions and future directions for improvement were summarized in Section 6.
2. Related Work
As computer vision technology matures, object detection has found growing application in power system inspection. A variety of methods have been developed to address different inspection requirements, such as transmission line identification [3], swallow’s nest localization, and insulator defect detection, all of which have significantly contributed to the intelligent development of power inspection systems.
For bird’s nest detection, Ref. [4] proposed an optimized model based on YOLOv5s, which was deployed on a UAV, achieving 33.9 Frames Per Second (FPS) and an accuracy of 92.1%. Similarly, Ref. [5] presented another optimization of YOLOv5s for the same task, reporting a higher detection accuracy of 98.23%. However, these methods lack validation in real flight scenarios, and their real-time performance was not evaluated. For insulator defect detection, various deep learning-based approaches have been proposed. Ref. [6] introduced a multi-scale detection method based on the Detection Transformer; Ref. [7] developed a lightweight model based on an improved YOLOv7; Ref. [8] enhanced YOLOv5s by incorporating the Generalized Intersection over Union (GIoU) loss function, Mish activation, and the CBAM; Ref. [9] further proposed LiteYOLO-ID, a lightweight insulator defect detection model based on an improved YOLOv5s architecture; Ref. [10] combined deep learning with transfer learning to improve defect detection performance under complex environmental conditions. Additionally, Refs. [11,12] proposed YOLOv5-based methods for detecting insulators and surface damage, which were validated using simulated datasets.
To realize real-time object detection, Ref. [13] carried a thermal imaging camera on a UAV and proposed a method for insulator localization based on infrared images by combining with convolutional neural network (CNN) based on the anomalous thermal phenomenon of insulators. Ref. [14] proposed a globally optimized feature pyramid network for high-resolution UAV images. Similarly, Ref. [15] proposed an improved YOLOX detection method for large and small targets. Ref. [16] introduced an enhanced UAV target detection method, MCA-YOLOv7, which is built upon the YOLOv7 framework. Ref. [17] proposed a lightweight insulator target and defect recognition algorithm that utilizes GhostNet to reconstruct the YOLOv4 backbone network and introduces a depth-separable convolution in the feature fusion layer. This method is capable of maintaining feature extraction performance while also reducing model weight. Ref. [18] proposed an improved Faster R-CNN, which employs a zero-density generalized network and a region suggestion network to extract deep features of insulators images. Ref. [19] combined a single-lens multibox detector with a two-stage fine-tuning strategy to achieve insulator detection with satisfactory accuracy; however, in [18,19], the poor real-time performance limits their applicability in inspections. Similarly, Ref. [20] developed a railroad insulator fault detection network using a cascade architecture of detection and fault classification networks, yet with a processing delay of 231 ms per image.
Regarding flight route planning for UAV-based inspection, waypoint-based methods remain the mainstream approach. Ref. [21] developed an autonomous inspection framework leveraging high-precision positioning and communication technologies based on the BeiDou Navigation System. Ref. [22] designed a UAV system for autonomous power line cleaning, utilizing GPS for tower positioning and computer vision for insulator localization. In [1], an autonomous UAV system for transmission and distribution line inspection was proposed. Ref. [23] introduced an open-source UAV framework that integrates tower positioning, wire identification, and tracking functionalities. However, these methods rely heavily on predefined tower coordinates for navigation. As a result, system performance may degrade when tower locations or UAV localization are affected by external factors. In our group’s previous work [24], we proposed an intelligent inspection system based on a custom-developed UAV that integrates route planning, an airport docking mechanism, and fault diagnosis. In that study, a detection-based waypoint correction strategy was introduced to mitigate route deviation. Nevertheless, the method still requires prior access to waypoint information.
In summary, the currently prevalent UAV inspection methods confront two major challenges: reliance on tower prior knowledge and the trade-off between inference speed and accuracy of the detection model. To this end, this paper proposed methods to incorporate a lightweight model for flight route planning and an improved small target detection model for processing inspection results, which can effectively address the two major challenges summarized above.
3. Detection Model Improvement
3.1. Tower Dataset
This research focuses on distribution towers with relatively simple structures, for which publicly available datasets are scarce and are difficult to make match the requirements of this study. Therefore, a custom dataset was constructed by collecting 12,271 images of distribution towers using inspection UAVs. The dataset was subsequently divided into training, validation, and test sets in a ratio of 8:1:1.
According to the requirements of the proposed flight route estimation, the tower object is defined to include three key components: the tower head, tower body, and insulator, as illustrated in Figure 1, which are indicated by red, green, and blue bounding boxes, respectively. As shown in Figure 1, the tower head—serving as the primary reference point for UAV localization—possesses distinctive visual features, occupies more pixels in the image, and is less likely to be occluded, thereby providing stable and continuous localization information. Due to its slender structure, the tower body is typically the first component to enter the UAV’s field of view and can assist in tower localization when the tower head is not detectable. The insulator, on the other hand, is primarily used for close-range detection to avoid collisions when the UAV approaches the tower.
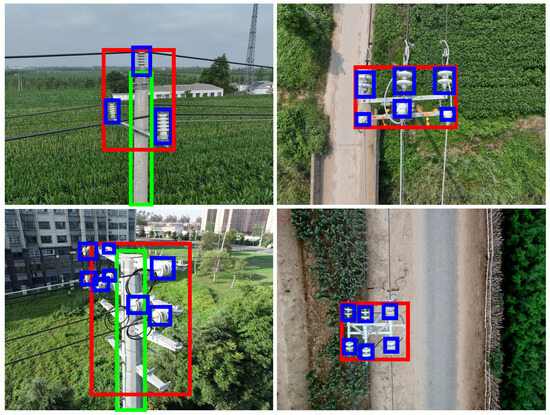
Figure 1.
Distribution tower labeling diagram: the red box indicates the tower head, the green box indicates the tower body, and the blue box indicates the insulator.
3.2. Onboard Lightweight Model
In this study, YOLOv8n was selected as the baseline model for lightweight improvement in tower detection. The enhancement includes three key modifications: (1) replacing the C2f (Faster Implementation of CSP Bottleneck with 2 Convolutions) module with the VanillaBlock module; (2) substituting the convolution modules in the neck network with GSConv; and (3) applying structured pruning to reduce model complexity.
(a) VanillaBlock Module. In this study, the VanillaBlock module is employed in place of the C2f module in the backbone network to enable the model to detect towers in real time with improved efficiency and to achieve a better trade-off between model lightweightness and accuracy [25,26].
The VanillaBlock introduces a deep training strategy in which an activation function is initially applied between two convolutional layers. As training progresses, this activation function is gradually transformed into the identity mapping. At the end of training, the activation function is removed and the two convolutional layers are merged, thereby reducing inference time. Formally, the activation function at iteration t is defined as follows:
where denotes the original nonlinear activation function, and represents the ratio of the current training iteration t to the total number of iterations T. In this way, the network gradually transitions from a strongly nonlinear mapping to a purely linear one. After convergence, the activation function degenerates into the identity mapping, and since no nonlinearity remains between the two convolutional layers, they can be merged into a single convolutional layer. The merging process first integrates the batch normalization layer with its preceding convolutional layer, which can be expressed as follows:
W and B are the parameters of convolutional layers, , , , are the batch normalization parameters. Here, and are the scale and shift factors, which are trainable parameters learned through gradient descent. and denote the batch mean and batch standard deviation, which are non-trainable parameters estimated from the input data. During training, they are computed for each mini-batch, while during inference, global running statistics are used to ensure stable performance. Then, the integrated two sets of convolutional layers can be further merged.
where , are the weight matrices of the two-layer convolution, and ∗ denotes the convolution operation.
In addition, the VanillaBlock module nonlinearly transforms features using a custom stacked activation function, whereas traditional convolutional blocks typically use a single activation function, and this stacked activation allows the network to adjust the strength of the nonlinear transformation at different training stages to enhance feature representation.
(b) GSConv Module. The GSConv convolution module is a core component of Slim-Neck, a lightweight neural network neck architecture [27], as illustrated in Figure 2. The GSConv module integrates Standard Convolution (SC) and Depthwise Separable Convolution (DSC) [28,29] to balance feature extraction capability and computational efficiency.
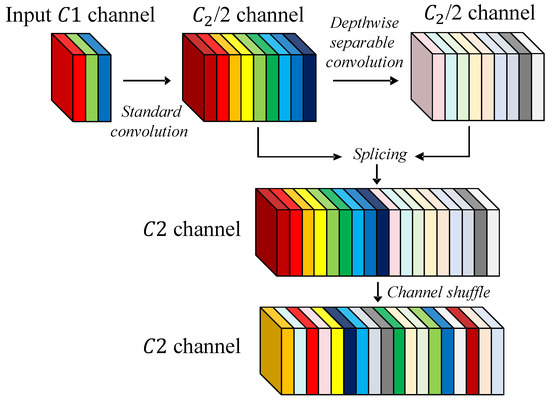
Figure 2.
GSConv convolution module: efficiently reduces computation and parameters while preserving feature extraction.
In the computation process, let the input channels be and the output channels be . First, the input undergoes a standard convolution operation to produce a feature map with channels. This branch mainly captures high-level semantic features across channels, thereby preserving the representational capacity of the network. Then, is further processed by depthwise separable convolution to generate an output , also with channels. This branch retains local feature extraction ability while significantly reducing computational cost and parameter count. Next, and are concatenated to form a feature map with channels. Finally, a channel shuffle operation is applied to break the isolation between branches, enabling information exchange and fusion, and yielding the final output y.
With this design, GSConv requires only about 60–70% of the computational cost of standard convolution while maintaining a comparable feature learning ability. Such an efficient feature representation and fusion mechanism allows the Slim-Neck structure to achieve remarkable lightweight performance without sacrificing detection accuracy, making it well-suited for real-time object detection and embedded applications.
(c) Model Pruning. Model pruning is a widely adopted technique for model compression that optimizes computational efficiency and reduces storage requirements by eliminating redundant weights or neurons, while also enhancing model generalization and improving inference speed [30,31]. In this study, channel pruning is applied to remove redundant channels from the convolutional layers. During the pruning process, the backbone network is primarily targeted to eliminate less important feature channels. The baseline models used for pruning are the VanillaBlock Lightweight Improved model and the GSConv Lightweight Improved model.
3.3. Defect Detection Model
After the completion of the inspection flight, the collected images require further analysis to detect defects, particularly in small targets. To accomplish this, three improvements were made to the YOLOv8 model: replacing the traditional convolutional modules, introducing an attention mechanism, and upgrading the neck network.
(a) Convolutional Module. Convolutional neural networks often experience feature degradation caused by stride convolution and pooling when detecting small targets. To address this issue, the SPD-Conv module was employed in this study to replace stride convolution, thereby preventing feature loss while maintaining the spatial resolution of the input image [32]. The structure of the SPD-Conv module is illustrated in Figure 3.
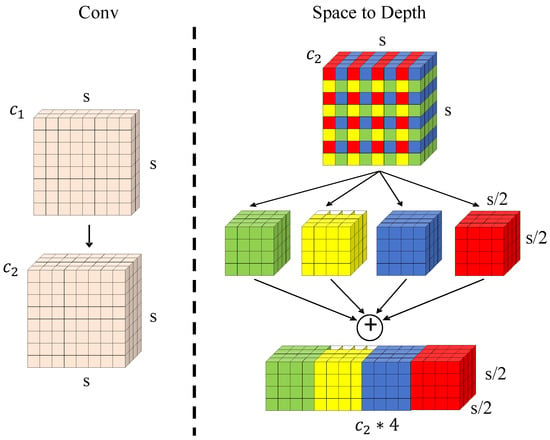
Figure 3.
SPD-Conv structure diagram.
In this structure, assume that the initial input feature map has a spatial size of and channels. First, a non-strided convolution layer is applied for feature encoding, which preserves the spatial resolution while expanding the channel dimension to . Then, an SPD transformation with a scale factor of 2 decomposes the original feature map into four sub-feature maps, each with a spatial size of , while the channel dimension is expanded to . This hierarchical feature transformation mechanism overcomes the limitations of conventional strided convolution and pooling operations: during spatial downsampling, it preserves spatial information by losslessly mapping it into the channel dimension, thereby effectively avoiding feature loss. Meanwhile, the fourfold channel expansion operation maintains the spatial distribution patterns of small objects, enabling deeper layers of the network to capture the geometric structures of tiny objects. Such a mechanism significantly alleviates the feature degradation problem caused by traditional downsampling and enhances the model’s performance in small object detection tasks.
(b) Attention Mechanism. This study also employs the CBAM, a feature enhancement module based on bidirectional attention synergy. It performs multi-dimensional feature calibration through a channel-spatial dual-attention mechanism, providing a dynamic feature selection capability for convolutional neural networks [33]. The structure of CBAM is illustrated in Figure 4.
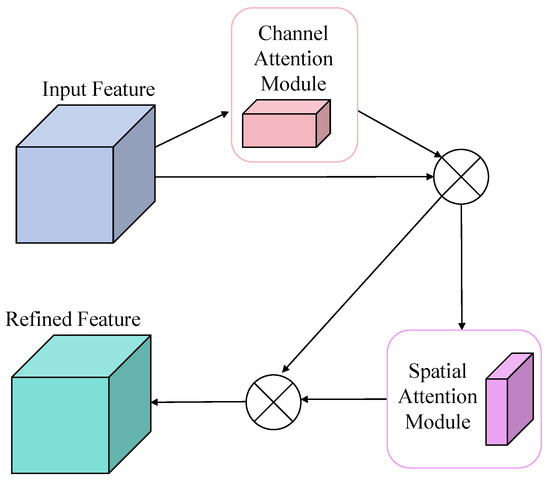
Figure 4.
CBAM.
This module adopts a cascaded architecture, which dynamically allocates feature weights across the channel and spatial domains, thereby significantly enhancing the model’s feature discrimination ability with almost no additional computational cost. Its core innovation lies in two aspects: the channel attention submodule employs dual-path feature compression through global average pooling and max pooling to construct an attention vector that models inter-channel dependencies, enabling the network to adaptively strengthen task-relevant feature channels; meanwhile, the spatial attention submodule combines two-dimensional feature compression with a convolutional layer to generate a spatially sensitive attention map, guiding the network to focus on key semantic regions. In small object detection scenarios, CBAM demonstrates unique advantages: the channel attention mechanism enhances the representation ability of low-pixel features, while the spatial attention mechanism effectively suppresses background noise. The synergistic effect of these two mechanisms significantly improves the accuracy of tiny object recognition.
(c) Neck Network. To enhance small object detection performance, the neck network was upgraded to a BiFPN architecture, which improves upon both the Feature Pyramid Network (FPN) and Path Aggregation Network (PANet) architectures. Efficient multi-scale feature fusion is achieved by constructing cross-layer information flow channels. Additionally, a new high-resolution detection head with an input size of and its corresponding layer structure were added based on the original feature map detection head. This enhancement significantly improves the network’s localization accuracy for tiny defects [34].
4. Inspection Route Planner
To eliminate the reliance on tower coordinates during UAV inspection tasks, this study proposes an adaptive route planning method based on object detection, which consists of transmission line direction estimation and waypoint coordinate estimation.
4.1. Estimation of Transmission Line Direction
The UAV’s flight route typically involves both waypoints and heading, with heading being a crucial parameter for position–coordinate interoperability. Therefore, this study combines line segment detection and tower identification to accomplish tower direction estimation based on the Line Segment Detector (LSD) algorithm [35].
As a classical line segment detection algorithm based on gradient information, LSD first converts the image to grayscale, computes the gradient magnitude and direction using a first-order differential operator, then aggregates pixels into connected regions and fits them into rectangles via region growing. Finally, it filters significant line segments using the saliency metric from a contrario theory by calculating the Number of False Alarms (NFA) to achieve edge extraction. However, this algorithm is sensitive to noise, especially in complex real-world backgrounds, making it unsuitable for direct use in heading estimation. To address this, we combine the pixel coordinates of towers obtained by the lightweight recognition algorithm with a round-center screening mechanism to achieve accurate transmission line direction estimation.
The LSD algorithm was originally used to extract image line segments, but the extracted segments contained a large amount of noise. To address this issue, we propose a center-based filtering method for target identification to eliminate interference: Figure 5a shows the LSD image after removing shorter segments using a threshold filtering method. However, transmission line segments and tower segments themselves remain. By drawing a circle centered at the tower’s center such that it fully encloses the tower, only segments intersecting this circle are retained. Pylon segments, which do not intersect the circle, are discarded, while target distribution lines that intersect the circle are retained. The final output preserves only distribution line segments, effectively eliminating background interference. The filtered result is shown in Figure 5b.
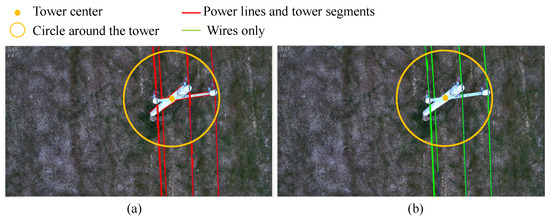
Figure 5.
Circle center screening: A tower-centered circle is used to filter line segments, only those intersecting the circle are retained, while background interference is removed. (a) shows the image before applying the center-based filtering method, where the red segments include both tower segments and transmission line segments. (b) shows the image after applying the center-based filtering method, revealing that the tower segments have been eliminated, leaving only the transmission line segments.
The process of obtaining segment angles is illustrated in Figure 6. Figure 6a shows the original image, while Figure 6b displays the result of extracting all segments from the original image using the LSD segment detection algorithm. As seen, numerous interfering segments remain in the image background. Figure 6c shows the result after applying a thresholding method to filter out segments shorter than a specified threshold. This initial filtering leaves only tower segments and transmission line segments. Figure 6d displays the segments obtained using the center-based filtering method, which filters out tower segments, leaving only transmission line segments. At this point, the preparatory work for cluster analysis is complete. Without segment filtering, these interfering lines would hinder the calculation of the direction between the current tower and secondary towers during cluster analysis, making autonomous drone inspections difficult to perform.
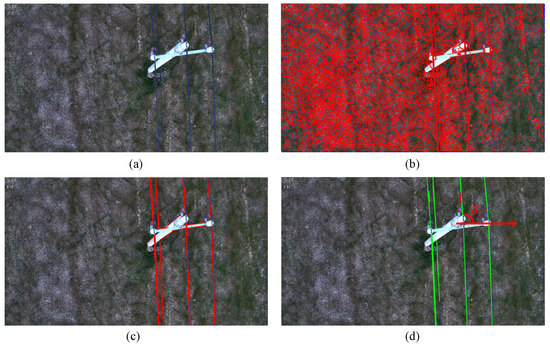
Figure 6.
Improved LSD wire detection algorithm: (a) is the original image, (b) is the image after initial extraction of wires by LSD wire segment detection algorithm, (c) is the image after shorter wire segments are eliminated by using threshold screening method, and, finally, (d) is the image after circle center screening method.
We traverse all detected line segments and denote the angle of the i-th segment by . Each cluster j maintains a current center angle and a sample count . When processing a new segment with angle , we find an existing cluster j whose center satisfies the following:
where denotes the minimal angular difference accounting for boundary wrap-around the following:
with angles expressed in radians. If such a cluster is found, is assigned to cluster j and the cluster center is updated by the incremental mean:
This formula follows from the arithmetic mean:
If no existing cluster satisfies the threshold, a new cluster is created with and .
4.2. Estimation of Waypoint Coordinates
To estimate the flight route, we proposed a real-time waypoint estimation method, which contains two stages, and , as shown in Figure 7. In stage , the UAV climbs vertically upwards and the gimbal camera distributes the front side of the tower for identification; In stage , the UAV flies above the tower, and the gimbal camera looks down on the tower for identification; For subsequent tower, it is realized by repeating stage .
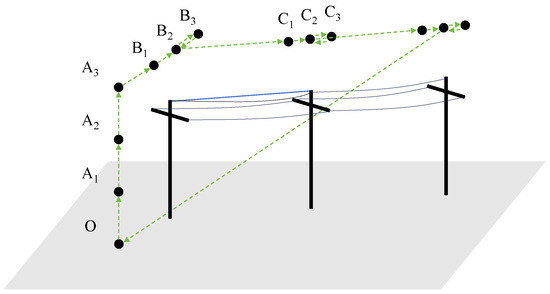
Figure 7.
Schematic diagram of inspection route planner. A, B, and C represent different stages in the drone inspection process, with Stage C being a repetition of Stage B. Each stage contains three key points.
Each stage contains three key points , , which were used to indicate the positional status of the UAV when the tower head was near , , and in the Field of View (FOV). Taking stage as example, when the UAV rises from to , the position of tower in the UAV FOV is shown in Figure 8.
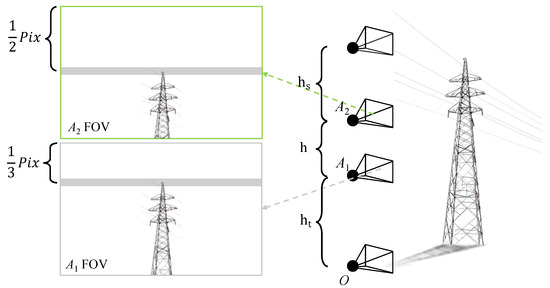
Figure 8.
Schematic of the UAV FOV in stage : When the tower head at of the image, this is noted as point , and when the tower head at , noted as point .
4.2.1. Route Planner: Stage A
In stage A, the UAV’s horizontal position is maintained at its initial coordinates ,, the heading is maintained at its initial of , and only vertical movement are performed, the camera FOV is oriented directly in front of the UAV. When tower head is detected and its pixel coordinates are located near 1/3 of image, which is noted as point . The onboard computer will command the UAV to hover, and records the UAV’s altitude and the pixel of the tower head. When the UAV flies to point , the UAV is flush with the tower head, and the height of the UAV is close to the tower height, recorded as . For safety reasons, we set that the UAV continue to rise a safe distance of , thus, the altitude target of the trajectory is , is the drone’s altitude when the tower head appears at the 1/3 point of the image.
Once the pixel coordinates of , , and are collected with the corresponding UAV states, the UAV-to-tower distance can be calculated with the following formula:
where is the vertical view field of the image, is the image resolution, denote the pixel coordinates of the tower head’s center point. h is the height UAV raised, and d is the approximate distance of UAV to tower, as shown in Figure 9.
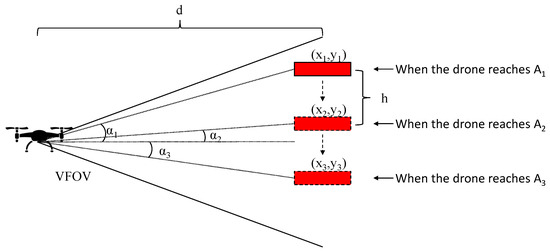
Figure 9.
Schematic diagram of tower distance calculation.
There exist three combinations of tower distance calculation, using points and , points and , and points and , respectively, according to Formula (9), and finally using the average result of the three values. Once the relative distance d is obtained, the location of the tower can be calculated by combining the UAV’s present yaw angle with its initial longitude and latitude (, ) through the formula below:
where is the eastward offset and is the northward offset. R is the radius of the earth, and (, ) are the geographic coordinates of the pole tower.
Eventually, through the process of stage A, the waypoint for the next stage can be estimated as (longitude,latitude,altitude), which is in stage B.
4.2.2. Route Planner: Stage B
Once the UAV finishes stage A, it controls the gimbal view toward the ground. It then enters stage B. At this time, the UAV flies with point estimated in stage A as the horizontal position target, as the altitude target, and as the heading target. In the process of flying towards point , when the tower head is recognized and its pixel coordinates are located at 1/3 of the image, which is recorded as point , then the processor sends a flag bit to the UAV to remind the tower head that it has been recognized, ensures that the UAV always remains within the recognized range of the pole tower, hovers and records the pixel coordinates (, ) and the positional coordinates at this point (, ). When the pixel coordinates are located at 1/2, 2/3 of the image, they are recorded as new and points, and the corresponding pixel and position coordinates are (, ), (, ) and (, ), (, ).
During the UAV inspection process, images captured by the camera are acquired by the image processing unit and transmitted as pixel values. However, in practical operations, it is necessary to convert pixel errors into actual spatial errors and calculate the geographic coordinates of the tower head by combining this with recorded latitude and longitude data. This enables the UAV to correct its deviation effectively. The principle of deflection correction is as follows: First, when a drone equipped with a camera takes photos in the air, the zoom factor needs to be adjusted to ensure that the target object is displayed at an appropriate magnification or reduction ratio in the image. Taking the width direction as an example, the formula for calculating the image distance v can be derived from the imaging formula:
where is the physical width of the camera sensor, W is the actual width of the target object, u denotes the object distance (the distance from the target object to the camera lens along the optical axis), and v denotes the image distance (the distance from the camera lens to the image plane along the optical axis). Substituting Formula (14) into Formula (13) yields the formula for calculating the focal length:
By combining the zoom formula and Formula (15), we can obtain the calculation method for the zoom ratio:
where and are the minimum focal length and actual focal length, respectively, and the value of u can be obtained based on the ranging radar installed in this system. The actual deviation error between the target object and the drone can be calculated in reverse using Formula (16):
where and denote the pixel resolution of the image in the horizontal and vertical directions, respectively. and are the pixel differences between the target and the center of the camera frame in the x and y directions, and represent the actual physical dimensions of the image sensor along the width and height, and and are the deviation errors between the target object and the drone in the width and height directions, respectively.
In the above, we recorded the pixel and geographic coordinates of , , and , and calculated the geographic coordinates of the tower head corresponding to each of the three points by Converting image pixel errors into actual distance errors, and merging the geographic coordinates of the three points through the following formula:
R stands for Earth’s radius, and the final geographic coordinates of the tower are represented by the average longitude and latitude from Formula (18).
Finally, the average result of the three values is used to control the UAV to fly to the tower head to achieve the purpose of deviation correction.
Taking stage B as an example, the schematic diagram under the UAV viewpoint at this time is shown in Figure 10. After estimating the precise coordinates of the tower, we employ the improved LSD cable detection algorithm introduced earlier to calculate the heading. Throughout this process, the drone camera remains oriented downward. The drone maintains altitude while performing positional correction and simultaneously implements heading correction. Upon completing heading correction, the drone will orient itself toward —the direction of the next tower.
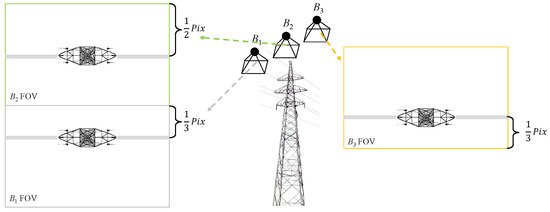
Figure 10.
Schematic diagram of the drone’s viewpoint at stage : When the tower top is located at the front 1/3 of the image, it is marked as point ; when the tower top is located at the middle 1/2 of the image, it is marked as a new point ; when the tower top is located at the rear 1/3 of the image, it is marked as point .
4.2.3. Height Adjustment
In summary, after stage B, the UAV temporarily takes as the target altitude and as the target heading, and the target heading can be derived from the estimation of the direction of the UAV’s transmission line introduced in Section 4.1 above. After adjusting the UAV heading to the target heading , the UAV then flies forward at a constant speed. Since the heights of the towers are not the same from one tower to another, if the height of the UAV is not adjusted during the inspection process, there is a possibility that the UAV may collide with the towers. It should be emphasized that the scenarios considered in this paper for autonomous UAV path planning are those with a series of cascading towers, and thus scenarios with significant variations in tower heights are not considered. However, for the sake of rigor in considering the problem, in order to avoid such a situation, we use an onboard millimeter-wave radar (MWR) to determine the distance between power transmission lines and drones. When the distance is less than the safety threshold , we adjust the gimbal camera to look forward and raise the height; when the tower head appears in the center of the camera in order to keep the UAV hovering, we record the height at this time, and then the UAV rises again to a safe height . Next, adjust the camera to look down, and the UAV will fly forward with the new height of ; when the UAV recognizes the tower head of the secondary tower and its pixel coordinates are at 1/3 of the image, then it starts to enter the C stage. The C stage is the same process as the B stage. By repeating this process, the continuous inspection of the multilevel tower is finally realized.
5. Experimental Verification
5.1. Validation of Target Detection Algorithms
5.1.1. Experimental Environment
The training of both models was conducted on a computer equipped with an Intel Core i7-13790F processor and an NVIDIA RTX 4070Ti graphics card. Due to dataset size and experimental environment constraints, the batch size was set to 16. After pre-training, the models began to converge around 100 epochs; therefore, the total number of training epochs was set to 200. The AdamW optimizer was employed with a learning rate of 0.001, and the input image size was . Considering that the lightweight model will ultimately be deployed on the UAV’s onboard computing device, performance metrics were also evaluated on the Jetson Orin Nano.
5.1.2. Comparative Experiments on Lightweight Models
To validate the practical effectiveness of the enhanced lightweight model, we first conducted ablation experiments to progressively evaluate performance changes. The experimental results are presented in Table 1, with metrics including computational cost, inference time, and mean Average Precision (mAP) [36].

Table 1.
Lightweight improvement ablation experiment.
The experimental results show that, after replacing the C2f module in the YOLOv8n backbone network with VanillaBlock, the mAP is improved and both the computation and the inference time consumed are reduced. After replacing the convolutional modules in the neck network with GSConv based on the former approach, the mAP decreased, but computational and inference times were further reduced. After structured pruning of the model, there is a slight increase in mAP, while GFLOPs and inference time all decrease. In the end, the lightweight model reduces computation by 23.5%, inference time consumed by 10.5%, by 0.8%, and by 1.3% compared to the benchmark model.
For target detection performance, this study uses different versions of the YOLO algorithm for comparison experiments. Under the premise of ensuring that the experimental conditions are as consistent as possible, comparisons are made with the minimal models of YOLOv7, YOLOv9, YOLOv10, and the latest YOLOv11, and the results are shown in Table 2.

Table 2.
Comparative experiment on lightweight improvement.
As shown in Table 2, the models exhibit similar recognition accuracy in terms of mAP. However, the other models demonstrate higher computational cost and longer inference time compared to the lightweight model proposed in this study. Although the YOLOv10n model achieves a slightly higher mAP than our improved lightweight model, its inference time is approximately 50% longer, resulting in weaker real-time performance. These results indicate that the lightweight improvement method proposed herein achieves a favorable balance between accuracy and speed, effectively fulfilling the goal of model lightweighting.
5.1.3. Lightweight Models Accelerate Reasoning
To further improve the inference speed of the lightweight model on the onboard computer, model conversion was performed for acceleration. The model conversion process is shown in Figure 11.

Figure 11.
Schematic diagram of model format conversion.
In this study, the PT models were converted and quantized at different precisions, resulting in three models INT8, FP16, and FP32, that were exported for performance testing. The test datasets are the same as those used previously, allowing direct comparison. The test results are summarized in Table 3.

Table 3.
Engine model testing comparison.
As shown in Table 3, the inference speed significantly increases after converting the PT model to the Engine model. Under FP16 and FP32 precision, model performance remains nearly unchanged, with mAP metrics on the test set comparable to those of the original PT model. However, when converted to INT8 precision, model performance sharply decreases, and high accuracy cannot be maintained even after quantization calibration. Therefore, the improved lightweight model was further converted to an Engine model with FP16 precision for inference. The image inference speed reaches 56 FPS, and the video inference speed reaches 45 FPS. Since most gimbal cameras operate at 30 FPS, the model fully utilizes the camera’s frame rate to meet real-time requirements.
5.2. Defect Detection Algorithm Validation
5.2.1. Defect Detection Model Ablation Experiment
To verify the optimization and improvement effects on small target recognition, this study uses the YOLOv8n model as the baseline. Keeping other parameters unchanged, the proposed improvements were analyzed through ablation experiments. The experimental results are presented in Table 4, showing comparisons of accuracy, recall, mAP, and model size.

Table 4.
Optimized ablation experiments for small target defect identification.
As can be seen from Table 4, the precision and recall rates are improved after the introduction of the SPD-Conv module; then, the precision and recall rates are further improved by the introduction of the CBAM; and, finally, the precision and recall rates continue to be improved by the introduction of the BiFPN feature fusion network. The final improved model improves the precision rate by 5.9%, the recall rate by 11.9%, the by 11.8%, and the by 19.2% compared to the baseline model, and the model recognition ability is greatly improved.
Using YOLOv8n as the baseline model, the aforementioned improvements were gradually incorporated to evaluate their impact on recognition performance. The results are shown in Figure 12. Taking these three scenarios as examples and comparing them with the ground truth labels, the baseline model missed a total of six defects without any false positives. After introducing the SPD-Conv convolutional module, the model missed five defects and produced one false positive. With the addition of the CBAM, the model missed four defects with one false positive. Finally, after integrating the BiFPN feature fusion network, the model missed only one defect and had no false positives. The results clearly show that the enhanced model achieves substantially higher recognition accuracy.
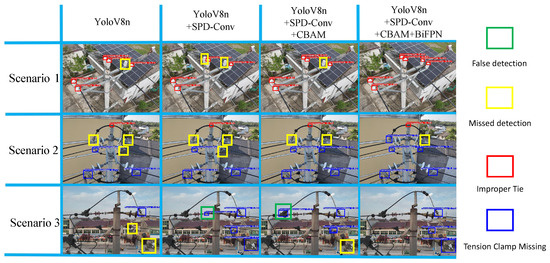
Figure 12.
Comparison of ablation experiment test results: From left to right: The baseline model’s detection results show six missed detections and no false positives. The improved detection results from SPD-Conv show five missed detections and one false positive. The improved detection results from SPD-Conv + CBAM show four missed detections and one false positive. The improved detection results from SPD-Conv + CBAM + BiFPN show only one missed detection and no false positives.
5.2.2. Comparative Experiments on Defect Detection Models
The minimal versions of YOLOv7, YOLOv9, YOLOv10, and YOLOv11 were selected for training. To ensure consistent experimental conditions, comparative experiments were conducted, and the results are presented in Table 5.

Table 5.
Comparative experiments on optimization of small objective defect recognition.
The small target defect detection algorithm for distribution network towers proposed in this study outperforms the other benchmark models in terms of precision, recall, and mAP. The trained models were evaluated on distribution network tower images to assess their practical detection performance and compare the recognition effectiveness across different models.
5.3. Inspection Program Validation
5.3.1. Inspection Platform
The UAV platform used in this study was independently developed by the team. A variety of key equipment was installed on the UAV platform, including the UAV flight control module, on-board computing equipment, gimbal camera, GNSS and various types of sensors. As shown in Figure 13. It should be noted that the GNSS sensor model used in this study is the u-blox NEO m8n. This sensor offers the advantage of low cost and features a dedicated protocol that directly outputs velocity in the NED direction. Compared to other GPS sensors on the market, it provides more accurate velocity data in the NED direction.
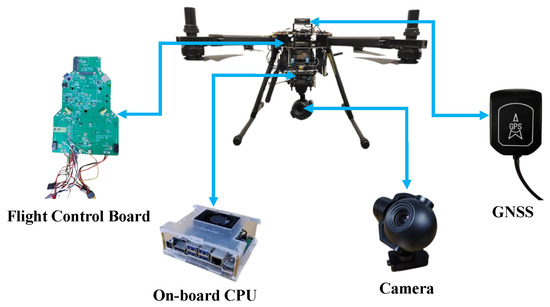
Figure 13.
Schematic diagram of the UAV platform.
Considering the strict requirements of UAV platforms on device size and power consumption, Jetson Orin Nano is selected in this study as the operation platform of the lightweight pole tower identification algorithm, The parameters of each experimental equipment are shown in Table 6.

Table 6.
Parameters of each device.
5.3.2. Inspection Flight Experiment
To validate the effectiveness of the two power target recognition enhancement algorithms proposed in this study, outdoor flight tests were conducted using a UAV. During the tests, the UAV was launched and its flight was recorded from a ground perspective. The actual flight trajectory is illustrated in Figure 14.
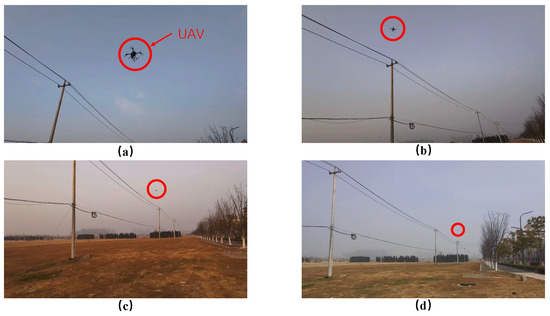
Figure 14.
Ground view of actual drone flight: Where (a) is the vertical climbing process of the drone in stage A, and (b) is the deviation correction of the drone above the tower in stage B, (c,d) indicating that the drone is inspecting the secondary and sub-secondary towers in turn.
During the UAV autonomous line patrol flight, the recognition of the power line pole tower under the UAV viewpoint is shown in Figure 15. Figure 15a,b are the recognition situation when the UAV is looking forward and downward at the utility pole tower during the actual flight of the UAV, respectively. The red box represents the tower head, the green box represents the tower body, and the blue box represents the insulators. From the figure, it can be seen that multiple targets of the utility pole tower are recognized, which can provide accurate position information for the UAV. Figure 15c,d display the identification results of the improved LSD conductor detection algorithm for transmission lines. Figure 15c presents a cluster analysis of identified conductor angles, where the horizontal x-axis denotes transmission line sequence numbers and the vertical y-axis represents the angle between the transmission line and the current tower. Brown indicates the angle between the current tower and the preceding transmission line, approximately −125°. Four conductors share this similar angle. Pink indicates the angle between the current tower and the next-level transmission line, approximately 60°. Six lines share this angle. Since the UAV flies forward, transmission lines with negative angles lie behind the UAV, while those with positive angles point toward the next tower. In Figure 15d, the identified wires are represented by pink and brown lines and the yellow lines represent the UAV target heading.
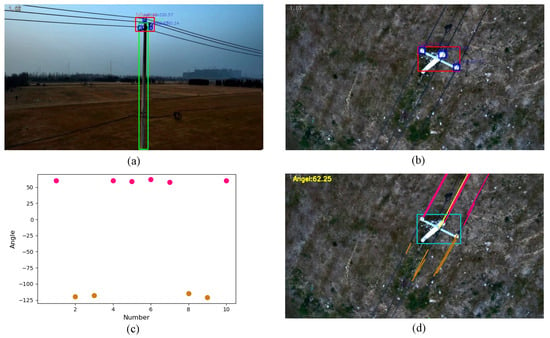
Figure 15.
Schematic diagram of the recognition effect of the UAV viewpoint: Where (a) is the recognition effect of the front view of the utility pole tower, (b) is the recognition effect of the top view of the utility pole tower, (c) is the angular clustering analysis diagram, and (d) is the recognition effect of the improved LSD wire detection algorithm. It should be noted that the differently colored dots in (c) correspond to the angles of the wires in (d).
During flight, the drone identifies tower heads, tower bodies, and insulators in real time while recording their pixel coordinates. In the pixel coordinate system, the origin is the upper-left corner of the image, with the horizontal rightward direction as the positive X-axis and the vertical downward direction as the positive Y-axis. The center pixel coordinates of identified tower heads, tower bodies, and insulators at each stage are presented in chart form, with the horizontal axis representing frame numbers and the vertical axis representing corresponding pixel values, as shown in Figure 16. Blue points denote the X-axis pixel values of target centers, while orange points denote the Y-axis pixel values of target centers. The figure indicates that the tower head maintains good recognition performance throughout the entire process, enabling continuous identification and providing real-time, accurate tower position information to the UAV. The tower body also exhibits good recognition performance. The blank space appearing during the identification of the tower body in the stage is due to the tower body gradually being obscured by the tower top as the drone flies toward it, preventing recognition of the tower body. Once the drone passes over the tower top, the tower body becomes identifiable again. Insulators, being smaller in size, exhibit slightly less optimal recognition compared to the tower head but still maintain good overall recognition performance. As is clearly visible in Figure 16, distinct segments appear on the Y-axis (orange dots) for each stage. These three segments correspond to the drone’s proximity to points , , and , indicating that the drone accurately identified and reached these three key points, executing the corresponding hovering maneuvers. It should be added that discontinuities in the pixel data of insulators in stage A is indeed due to the small size of insulators in the images. In stage A, the UAV was relatively far from the tower, which resulted in some insulators not being detected.
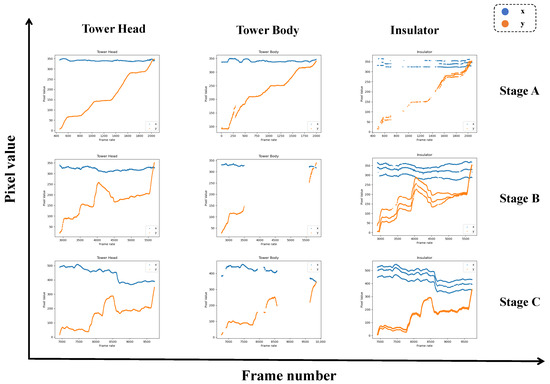
Figure 16.
Pixel data for each stage target. In stage A, the insulators were too small, resulting in intermittent pixel recognition. In stage B and C, the drone positioned directly above the tower caused the tower body to be obscured by the tower head and insulators, leading to missing pixels.
The actual flight trajectory is shown in Figure 17. This map was generated using GPS coordinates recorded by the drone’s flight controller. The inspection UAV takes off from the front side of the transmission tower and performs an autonomous inspection following the trajectory shown in the figure above. The process is as follows: takeoff; UAV passes through positions , , and ; ascends to a safe altitude ; camera adjusts to a downward-facing orientation; flies toward the tower; UAV passes through positions , , and ; corrects position to align with the tower top coordinates; adjusts heading; proceeds to the next tower for inspection; returns to home after completing the task. The inspection process corresponds to the autonomous UAV path planning strategy introduced in Section 4, confirming the UAV’s ability to perform inspections autonomously as intended.
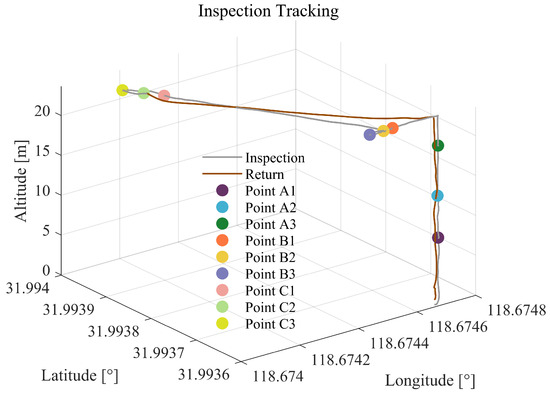
Figure 17.
UAV inspection trajectory. The colored dots in the diagram represent key points at various stages of the drone inspection process.
The UAV’s tracking of the tower coordinates is illustrated in the Figure 18. Since the UAV’s initial heading was aligned with the west direction and positioning relied on GPS, the tracking performance in the north-south direction was less pronounced. As shown in Figure 18b, the overall tracking error remained around 0.2 m on average, which falls within the acceptable range. The tracking performance in the east-west direction is presented in Figure 18a; after passing through positions , , and , the UAV was able to estimate the final latitude and longitude of the tower, thereby achieving tower coordinate estimation.
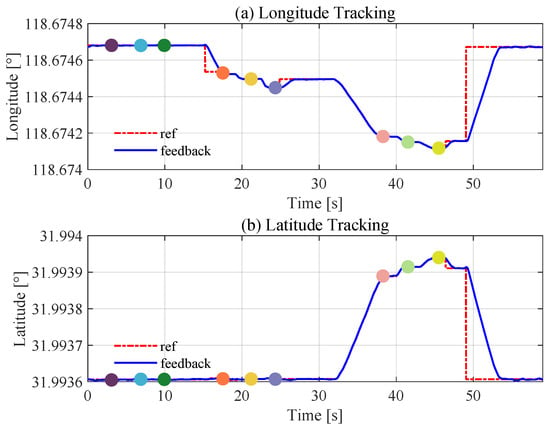
Figure 18.
UAV tower coordinate tracking. The step-like and smooth reference trajectories correspond to position control and velocity control stages, respectively; dashed lines denote references, and solid lines denote UAV feedback. The colored dots in the diagram represent key points at various stages of the drone inspection process, corresponding to the dots in Figure 17.
The UAV’s altitude tracking is shown in Figure 19. After takeoff, the UAV sequentially passes through positions , , and , during which the altitude at each position is recorded to assist in the preliminary estimation of the tower’s geographic coordinates. Once the UAV reaches position and records the corresponding altitude, it ascends to a predefined safety altitude and proceeds toward the target tower.
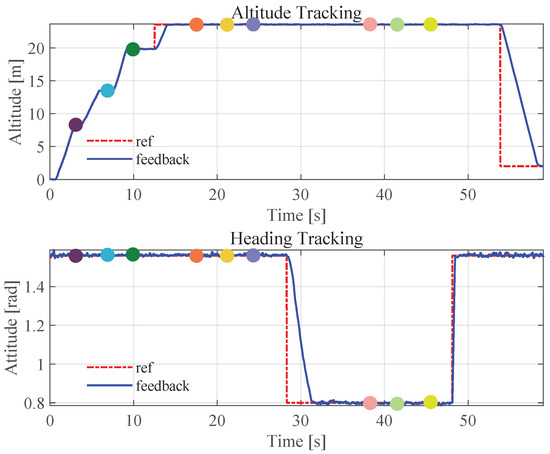
Figure 19.
UAV altitude and heading tracking. The colored dots in the diagram represent key points at various stages of the drone inspection process, corresponding to the dots in Figure 17.
Millimeter-wave radar data during the autonomous drone inspection process is shown in Figure 20. From stage B to stage C, the radar data consistently remained from around 3 to 4 m. Since the height of the tower inspected in the experiment was uniform, the radar data exhibited no significant variation.
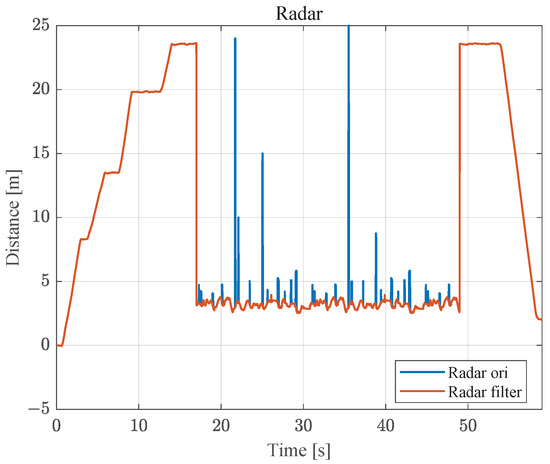
Figure 20.
Raw radar data and filtered radar data.
Finally, the UAV defect detection effect is tested. In this flight inspection of the three towers, the three towers insulators are tied standardized, no parallel clip missing phenomenon, so the defect detection algorithm detected three towers are in normal condition, the number of defects of tying irregularities and the number of defects of the parallel clip missing are all 0.
To evaluate the drone’s flight performance across various environments, we first conducted simulated experiments. These tests simulated object recognition under normal lighting, intense light, low light, motion, and foggy/rainy conditions. The experimental results are shown in Figure 21. The results indicate that bright light, low light, and motion all adversely affect the drone’s recognition capabilities. Among these conditions, insulator recognition is most significantly impacted, while recognition of larger targets such as tower bodies and tower heads is less affected.
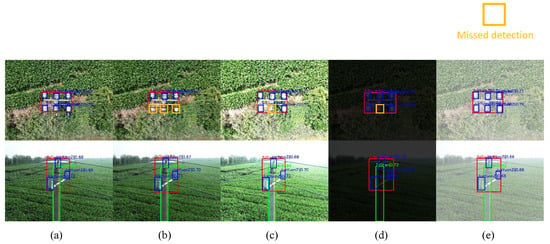
Figure 21.
Image recognition under simulated conditions. (a) Simulated drone images under normal lighting conditions. (b) Simulated drone images during flight. (c) Simulated drone images under high-intensity lighting. (d) Simulated drone images in low-light environments. (e) Simulated drone images in rainy and foggy conditions.
Based on simulated test results, illumination significantly impacts recognition performance. Therefore, for actual flight recognition tests, we selected a dusk environment. As shown in Figure 22, identification performance deteriorates for smaller objects like insulators under low-light conditions, with recognition typically only occurring at very close range. Conversely, larger targets such as tower bodies and heads demonstrate markedly better recognition. Since tower heads remain identifiable throughout the entire flight path, the drone’s autonomous flight capabilities remain fully operational.
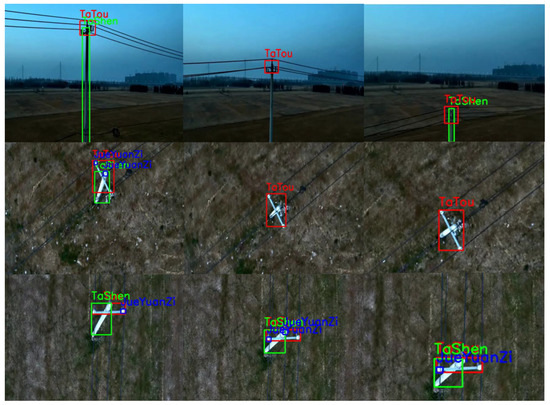
Figure 22.
Drone recognition flight in low-light environments.
6. Conclusions
In this study, we propose a deep learning based power inspection recognition algorithm and inspection scheme that is initially based on the Yolov8 model in order to lighten and improve it so as to enable it to be able to be deployed on UAVs. We use the VanillaBlock module to replace the C2f module in the backbone network, and then replace the convolutional module in the necking network with the GSConv module. Next, we lighten the network by pruning the network that removes redundant channels to further lighten the model. Finally, it is deployed on NVIDIA Jetson Orin Nano development version, and the pt model is further converted to the Engine model in order to realize accelerated inference and further improve its real-time performance. For defect detection of the inspection results, for its small-target characteristics, we use the SPD-Conv module to replace the convolutional module in the backbone network, introduce the CBAM, replace the neck network with a BiFPN feature fusion network, and also add a 160-size detection head for better extraction of small-target features. After that, we design an adaptive inspection path planning scheme by combining the real-time tower pixel coordinates with the UAV position so as to realize the flight path at the next moment. Finally, we proved the effectiveness of the scheme through actual flight tests.
Although the proposed scheme demonstrates promising results, several limitations remain. During stage B, the UAV flies with a fixed heading and velocity rather than actively tracking the power line, which may cause deviations under strong wind or other disturbances. Future work will focus on integrating line-tracking or adaptive heading correction mechanisms. In addition, the defect detection algorithm was tested on three towers without actual defects; so, while the results matched the ground truth, further validation on towers with real defects is needed. Finally, GPS and vision sensor timestamps were not explicitly synchronized in this study, as the UAV operated at low speeds, but future work will address this through GPS–IMU fusion or hardware-based synchronization to improve accuracy.
Author Contributions
Conceptualization, S.C.; methodology, S.C.; software, S.C.; validation, S.C. and J.Z.; formal analysis, S.C.; investigation, S.C. and J.Z.; data curation, S.C.; writing—original draft preparation, S.C.; writing—review and editing, W.W. and M.Y.; visualization, S.C. All authors have read and agreed to the published version of the manuscript.
Funding
This research received no external funding.
Data Availability Statement
The raw data supporting the conclusions of this article will be made available by the authors on request. Videos of the tower inspection experiments are available at: https://youtu.be/Rr0v_BfofLY (accessed on 14 September 2025) and https://youtu.be/o-JTgs5XYts (accessed on 14 September 2025).
Acknowledgments
The authors would like to express their sincere appreciation to those who provided assistance throughout the course of this research.
Conflicts of Interest
The authors declare no conflicts of interest.
References
- Takaya, K.; Ohta, H.; Kroumov, V.; Shibayama, K.; Nakamura, M. Development of UAV system for autonomous power line inspection. In Proceedings of the 2019 23rd International Conference on System Theory, Control and Computing (ICSTCC), Sinaia, Romania, 9–11 October 2019; pp. 762–767. [Google Scholar]
- Zhang, H.; Sun, M.; Li, Q.; Liu, L.; Liu, M.; Ji, Y. An empirical study of multi-scale object detection in high resolution uav images. Neurocomputing 2021, 421, 173–182. [Google Scholar] [CrossRef]
- Xu, C.; Li, Q.; Zhou, Q.; Zhang, S.; Yu, D.; Ma, Y. Power line-guided automatic electric transmission line inspection system. IEEE Trans. Instrum. Meas. 2022, 71, 1–18. [Google Scholar] [CrossRef]
- Li, H.; Dong, Y.; Liu, Y.; Ai, J. Design and implementation of uavs for bird’s nest inspection on transmission lines based on deep learning. Drones 2022, 6, 252. [Google Scholar] [CrossRef]
- Jiang, H.; Huang, W.; Chen, J.; Liu, X.; Miao, X.; Zhuang, S. Detection of bird nests on power line patrol using single shot detector. In Proceedings of the 2019 Chinese Automation Congress (CAC), Hangzhou, China, 22–24 November 2019; pp. 3409–3414. [Google Scholar]
- Li, D.; Yang, P.; Zou, Y. Optimizing Insulator Defect Detection with Improved DETR Models. Mathematics 2024, 12, 1507. [Google Scholar] [CrossRef]
- You, X.; Zhao, X. A insulator defect detection network based on improved YOLOv7 for UAV aerial images. Measurement 2025, 253, 117410. [Google Scholar] [CrossRef]
- Wei, L.; Jin, J.; Deng, K.; Liu, H. Insulator defect detection in transmission line based on an improved lightweight YOLOv5s algorithm. Electr. Power Syst. Res. 2024, 233, 110464. [Google Scholar] [CrossRef]
- Li, D.; Lu, Y.; Gao, Q.; Li, X.; Yu, X.; Song, Y. LiteYOLO-ID: A Lightweight Object Detection Network for Insulator Defect Detection. IEEE Trans. Instrum. Meas. 2024, 73, 1–12. [Google Scholar] [CrossRef]
- Yang, L.; Fan, J.; Song, S.; Liu, Y. A light defect detection algorithm of power insulators from aerial images for power inspection. Neural Comput. Appl. 2022, 34, 17951–17961. [Google Scholar] [CrossRef]
- Li, Q.; Zhao, F.; Xu, Z.; Wang, J.; Liu, K.; Qin, L. Insulator and damage detection and location based on YOLOv5. In Proceedings of the 2022 International Conference on Power Energy Systems and Applications (ICoPESA), Singapore, 25–27 February 2022; pp. 17–24. [Google Scholar]
- Rahman, E.U.; Zhang, Y.; Ahmad, S.; Ahmad, H.I.; Jobaer, S. Autonomous vision-based primary distribution systems porcelain insulators inspection using UAVs. Sensors 2021, 21, 974. [Google Scholar] [CrossRef] [PubMed]
- Zhao, Z.; Fan, X.; Xu, G.; Zhang, L.; Qi, Y.; Zhang, K. Aggregating deep convolutional feature maps for insulator detection in infrared images. IEEE Access 2017, 5, 21831–21839. [Google Scholar] [CrossRef]
- Zhao, X.; Zhang, H.; Song, C.; Li, H.; Guo, H. Multi-Scale Component Detection in High-Resolution Power Transmission Tower Images. IEEE Trans. Power Deliv. 2025, 40, 2391–2401. [Google Scholar] [CrossRef]
- Cheng, Y.; Luo, H.; Zhu, H.; Wang, W.; Yang, S. Improved YOLOX for Defect Detection Algorithm of Transmission Towers in Aerial Images. In Proceedings of the 2024 7th International Conference on Computer Information Science and Application Technology (CISAT), Hangzhou, China, 12–14 July 2024; pp. 251–254. [Google Scholar]
- Qin, Z.; Chen, D.; Wang, H. MCA-YOLOv7: An Improved UAV Target Detection Algorithm Based on YOLOv7. IEEE Access 2024, 12, 42642–42650. [Google Scholar] [CrossRef]
- Han, G.; Zhao, L.; Li, Q.; Li, S.; Wang, R.; Yuan, Q.; He, M.; Yang, S.; Qin, L. A Lightweight Algorithm for Insulator Target Detection and Defect Identification. Sensors 2023, 23, 1216. [Google Scholar] [CrossRef]
- Liu, X.; Jiang, H.; Chen, J.; Chen, J.; Zhuang, S.; Miao, X. Insulator detection in aerial images based on faster regions with convolutional neural network. In Proceedings of the 2018 IEEE 14th International Conference on Control and Automation (ICCA), Anchorage, AK, USA, 12–15 June 2018; pp. 1082–1086. [Google Scholar]
- Miao, X.; Liu, X.; Chen, J.; Zhuang, S.; Fan, J.; Jiang, H. Insulator detection in aerial images for transmission line inspection using single shot multibox detector. IEEE Access 2019, 7, 9945–9956. [Google Scholar] [CrossRef]
- Wang, Z.; Liu, X.; Peng, H.; Zheng, L.; Gao, J.; Bao, Y. Railway insulator detection based on adaptive cascaded convolutional neural network. IEEE Access 2021, 9, 115676–115686. [Google Scholar] [CrossRef]
- Hu, H.; Zhou, H.; Li, J.; Li, K.; Pan, B. Automatic and intelligent line inspection using UAV based on beidou navigation system. In Proceedings of the 2019 6th International Conference on Information Science and Control Engineering (ICISCE), Shanghai, China, 20–22 December 2019; pp. 1004–1008. [Google Scholar]
- Lopez Lopez, R.; Batista Sanchez, M.J.; Perez Jimenez, M.; Arrue, B.C.; Ollero, A. Autonomous UAV System for Cleaning Insulators in Power Line Inspection and Maintenance. Sensors 2021, 21, 8488. [Google Scholar] [CrossRef] [PubMed]
- Schofield, O.B.; Iversen, N.; Ebeid, E. Autonomous power line detection and tracking system using UAVs. Microprocess. Microsyst. 2022, 94, 104609. [Google Scholar] [CrossRef]
- Li, Z.; Zhang, Y.; Wu, H.; Suzuki, S.; Namiki, A.; Wang, W. Design and application of a UAV autonomous inspection system for high-voltage power transmission lines. Remote Sens. 2023, 15, 865. [Google Scholar] [CrossRef]
- Hu, H.; Peng, W.; Yang, J.; Di, X. Lightweight insulator defect detection algorithm based on improved Deeplabv3+ and YOLOv5s. In International Conference on Computer Vision and Image Processing (CVIP 2024); SPIE: Bellingham, WA, USA, 2025; pp. 159–165. [Google Scholar]
- Sohan, M.; Sai Ram, T.; Rami Reddy, C.V. A review on yolov8 and its advancements. In International Conference on Data Intelligence and Cognitive Informatics; Springer: Singapore, 2024; pp. 529–545. [Google Scholar]
- Li, H.; Li, J.; Wei, H.; Liu, Z.; Zhan, Z.; Ren, Q. Slim-neck by GSConv: A lightweight-design for real-time detector architectures. J. Real-Time Image Process. 2024, 21, 62. [Google Scholar] [CrossRef]
- Chollet, F. Xception: Deep learning with depthwise separable convolutions. In Proceedings of the IEEE Conference on Computer Vision and Pattern Recognition, Honolulu, HI, USA, 21–26 July 2017; pp. 1251–1258. [Google Scholar]
- Zablocki, É.; Ben-Younes, H.; Pérez, P.; Cord, M. Explainability of deep vision-based autonomous driving systems: Review and challenges. Int. J. Comput. Vis. 2022, 130, 2425–2452. [Google Scholar] [CrossRef]
- Zhang, Y.; Lin, M.; Lin, C.W.; Chen, J.; Wu, Y.; Tian, Y.; Ji, R. Carrying out CNN channel pruning in a white box. IEEE Trans. Neural Netw. Learn. Syst. 2022, 34, 7946–7955. [Google Scholar] [CrossRef] [PubMed]
- Cheng, H.; Zhang, M.; Shi, J.Q. A Survey on Deep Neural Network Pruning: Taxonomy, Comparison, Analysis, and Recommendations. IEEE Trans. Pattern Anal. Mach. Intell. 2024, 46, 10558–10578. [Google Scholar] [CrossRef]
- Sun, R.; Fan, H.; Tang, Y.; He, Z.; Xu, Y.; Wu, E. Research on small target detection algorithm for UAV inspection scene based on SPD-conv. In Proceedings of the Fourth International Conference on Computer Vision and Data Mining (ICCVDM 2023), Changchun, China, 20–22 October 2023; pp. 686–691. [Google Scholar]
- Zhang, M.; Bin, M.; Song, Y.; Liu, W.; Zou, Y. Deep Learning-based UAV Visual Recognition System in Distribution Network Defect Detection. In Proceedings of the 2025 International Conference on Electrical Automation and Artificial Intelligence (ICEAAI), Guangzhou, China, 10–12 January 2025; pp. 155–159. [Google Scholar]
- Doherty, J.; Gardiner, B.; Kerr, E.; Siddique, N. BiFPN-yolo: One-stage object detection integrating Bi-directional feature pyramid networks. Pattern Recognit. 2025, 160, 111209. [Google Scholar] [CrossRef]
- Von Gioi, R.G.; Jakubowicz, J.; Morel, J.M.; Randall, G. LSD: A fast line segment detector with a false detection control. IEEE Trans. Pattern Anal. Mach. Intell. 2008, 32, 722–732. [Google Scholar] [CrossRef] [PubMed]
- Henderson, P.; Ferrari, V. End-to-end training of object class detectors for mean average precision. In Proceedings of the Computer Vision–ACCV 2016: 13th Asian Conference on Computer Vision, Taipei, Taiwan, 20–24 November 2016; Revised Selected Papers, Part V 13. Springer: Cham, Switzerland, 2017; pp. 198–213. [Google Scholar]
Disclaimer/Publisher’s Note: The statements, opinions and data contained in all publications are solely those of the individual author(s) and contributor(s) and not of MDPI and/or the editor(s). MDPI and/or the editor(s) disclaim responsibility for any injury to people or property resulting from any ideas, methods, instructions or products referred to in the content. |
© 2025 by the authors. Licensee MDPI, Basel, Switzerland. This article is an open access article distributed under the terms and conditions of the Creative Commons Attribution (CC BY) license (https://creativecommons.org/licenses/by/4.0/).