Article

Unveiling Potential Industry Analytics Provided by Unmanned Aircraft System Remote Identification: A Case Study Using Aeroscope

1
Department of Aeronautical Science, Embry-Riddle Aeronautical University, Daytona Beach, FL 32114, USA
2
Department of Human Factors, Embry-Riddle Aeronautical University, Daytona Beach, FL 32114, USA
3
School of Graduate Studies, Embry-Riddle Aeronautical University, Daytona Beach, FL 32114, USA
*
Author to whom correspondence should be addressed.
Drones 2024, 8(8), 402; https://doi.org/10.3390/drones8080402
Submission received: 16 July 2024 / Revised: 13 August 2024 / Accepted: 14 August 2024 / Published: 16 August 2024

Abstract

:
The rapid proliferation of unmanned aircraft systems (UAS), commonly known as drones, across various industries, government applications, and recreational use necessitates a deeper understanding of their utilization and market trends. This research leverages UAS detection technology—specifically DJI’s Aeroscope—to track serial numbers and predict product usage, market penetration, and population estimation. By analyzing three years of data from Aeroscope sensors deployed around a major airport in the Southern United States, this study provides valuable insights into UAS operational patterns and platform lifespans. The findings reveal trends in platform utilization, the impact of new product releases, and the decline in legacy platform use. This offers critical data for informed decision-making in market trends, product development, and resource allocation.

1. Introduction

This paper explores potential data and analysis applications that Remote Identification (RID) capability can bring to the UAS industry. Using a DJI Aeroscope as a proxy for RID, the research team collected 34 months of sUAS detection data from DJI sUAS operating near Dallas-Fort Worth International Airport.

1.1. Problem

Currently, there is not an effective way to accurately track utilization and longevity of small UAS platforms. While the Federal Aviation Administration maintains data on sUAS registration, sighting reports, remote pilot/Recreational UAS Safety Test completion metrics, low-altitude authorization and notification capability (LAANC) requests, waivers, and Remote Identification registration; economic data; and other related data, these are all indirect measures of sUAS use [1].

1.2. Current Estimates of UAS Utilization and Longevity

The FAA [1] currently estimates that the total recreational/model aircraft fleet comprises just over 1.8 M drones, and the non-recreational fleet includes 951,000 drones in 2024. The FAA [1] estimates that the proportion of active drones includes 555,700 model aircraft/recreational drones and 369,000 non-recreational drones in 2024.
In 2023, the FAA included longevity questions to the UAS operator survey to estimate the lifespan of UAS. Operators reported owning UAS for an average of 4.1 years [1]. Recreational model aircraft operators reported a slightly longer ownership period of 4.3 years for UAS platforms vs. 3.6 years for non-recreational operators [1]. Recreational-only Part 107 operators reported an average of 3.3 years of platform ownership prior to discontinuing use [1].

1.3. Limitations of Existing Datasets and Analysis Methods

While these data sources provide a glimpse into sUAS operational behavior, they may not represent the best data sources to ascertain UAS operator platform utilization. To better illustrate these limitations, the authors overview each of the aforementioned data sources, with their potential limitations:
  • UAS Registration Database: In 2015, the Federal Aviation Administration released a rule requiring small-unmanned-aircraft operators to register sUAS weighing more than 0.55 lbs [2]. UAS registration data rely on individual operators to comply with registering their UAS to ensure database accuracy. FAA analysts acknowledge that the total size of the UAS fleet likely exceeds total registrations by 15% [1], with the excess likely caused by operator registration non-compliance.
  • UAS Sighting Reports: In 2023, the FAA recorded 1685 sighting reports—reports submitted by pilots, law enforcement, aviation stakeholders, and others—that indicated potentially dangerous activity involving unmanned aircraft. While these reports may highlight potential hazard areas for drone encounters, their utility is limited. Previous research has shown that the accuracy of UAS sighting reports is subject to significant human error [3,4,5] and likely does not accurately reflect the reality of encounters within the National Airspace System [6].
  • Remote Pilot Database: The Remote Pilot Database provides records of newly certified, renewed, and expired UAS pilots certified under 14 CFR 107 rules. While these records do provide a reasonable measure of one segment of the population of operators, the dataset does not accurately measure the extent of operations conducted by each operator. This approach fails to account for the operation of multiple UAS.
  • Recreational UAS Safety Test: In 2021, the FAA mandated that UAS operators flying for recreational purposes complete a short educational course designed to reinforce aeronautical knowledge and safety concepts [7]. Similar to the Remote Pilot Database, Recreational UAS Safety Test statistics merely measure the potential population of UAS hobbyists operating under model aircraft rules. This dataset also fails to account for non-compliant operators who fail to achieve required certification.
  • Low-Altitude Authorization and Notification Capability (LAANC) Requests/Approvals: In 2017, LAANC was created as a collaborative initiative between the FAA and UAS industry to establish a capability to disseminate airspace data and approve airspace usage requests, facilitated by a series of UAS Service Suppliers (USSs) [1,8]. LAANC provides near-real-time airspace access to remote pilots within controlled airspace areas by providing an automated process for managing and approving airspace requests within low-risk areas and altitudes defined by a grid system of UAS Facility Maps (UASFMs) [8]. Currently, 11 USS companies support the LAANC infrastructure, enabling access from PCs and a myriad of mobile devices [8]. As of 2023, LAANC covered 726 airports and provided 341,496 approvals for airspace access for non-recreational UAS operations and 155,418 approvals for recreational flights, and sent 43,760 requests for further FAA approval coordination [1]. LAANC approval data are perhaps the most accurate and informative dataset of the true state of UAS operations available to the FAA, without the use of supplemental sensor equipment.
  • UAS Waivers/Airspace Authorizations: Like LAANC requests and approvals, UAS waivers/airspace authorizations only reveal a partial story about the state of UAS operations in the NAS. They reflect data for only those operators desiring to deviate from permanently established regulation or restrictions. While they may serve as a reasonable gauge to assess the adequacy of permanent regulations in meeting UAS operator demand, this dataset is a relatively poor means of assessing operational trends.
  • Remote Identification Registration: In 2019, the FAA issued a notice of proposed rulemaking requiring that most unmanned aircraft systems incorporate Remote Identification Systems onboard to provide electronic conspicuity of UAS for safety and security purposes. Although the new rule generally addresses the inclusion of Remote ID systems on newly manufactured UAS, obtaining relevant data from this source requires UAS operators to properly register their drones to link their operator registration with the Remote ID serial number [9,10].
  • Drone Industry Economic Data: A market report by Drone Industry Insights [11] indicates that Da Jiang Industries (DJI) continues to dominate the drone industry, with an estimated 70% global market share. Since DJI is a privately held company, financial details such as product sales are not publicly reported [12]. Other generalized economic data may also play a role in estimating drone populations and operational activity. Unfortunately, these data can only provide estimates of questionable accuracy and generalizability.
  • Operator Survey Data: The FAA leverages survey data collected from UAS operators to inform upon UAS activities and trends, based on a stratified, random sampling of recreational and commercial UAS operators, and varied geographical locations around the U.S. [1]. As with many surveys, a low response rate creates challenges in achieving generalizability. For the most recent 2023 survey, the FAA received a 26.2% response rate from all sampled participants [1]. Another potential limitation of using survey data to assess operational factors is that survey results can be skewed by the operator’s perception of their activity. An operator might believe that they only fly 20 min per day, but operational activity might be significantly more or less. Without the benefit of implementing higher fidelity tracking means (such as operator activity logging), this measurement instrument also has limitations.
  • Additional Considerations: While regulatory data are well covered, it is essential to also consider the limitations in academic sources that used samples to predict similar sorts of information. Survey data, such as discussed by Huang et al. [13], often suffer from low response rates and potential biases in respondent self-reporting, which can affect the accuracy and generalizability of the findings. For example, the logistic regression analysis used in their study is robust but limited by the normality assumption and requires a careful consideration of socio-demographic factors [13].
  • Limitations of RID as a Source of Information: It is important to acknowledge the limitations of RID technology as source data. RID systems are vulnerable to spoofing, where fake identities can be transmitted by malicious drones, and they can be disabled or circumvented by operators [14]. Additionally, RID systems can experience technical failures or inaccuracies due to interference or errors in onboard modules [14].

1.4. Purpose

The purpose of this research is to better understand operational utilization patterns and lifespan of sUAS platforms using UAS detection systems. Understanding operational utilization characteristics enables improved policymaking, by informing the FAA of potential airspace hazards, enabling improved forecasting, supporting the identification of operational trends, and other factors.

1.5. Research Questions

The research team posed the following research questions:
  • What is the lifespan of sUAS systems?
  • How often are sUAS flown?
  • What can sUAS platform use inform us about market trends?

2. Background

2.1. Aeroscope

The DJI Aeroscope is a radio frequency sensor capable of real-time detecting and tracking of DJI-manufactured sUAS by monitoring datalink communications exchanged between the operator and aerial vehicle [15,16]. Aeroscope provides for continuous, passive monitoring for ranges extending to 50 km and provides a myriad of detailed operations’ data, including sUAS: identification (electronic serial number), location, altitude, speed, drone model, and the remote pilot’s location [15,17]. The Aeroscope recognizes one of four DJI-proprietary communication protocols, including Lightbridge, OcuSync, OcuSync 2, and Wifi. DJI [18] outlines the communication protocols used in DJI’s portfolio of sUAS platforms. As of March 2023, DJI announced it was discontinuing its production of its Aeroscope line of products [19]. While no rationale was provided by the company, it is believed that the inadvertent militarization of the technology by Russian forces in Ukraine coupled with new FAA Remote Identification requirements may have played a role in the company’s decision [19].

2.2. Remote Identification

Implemented in September 2023, the Federal Aviation Administration implemented rules requiring that most unmanned aircraft systems be equipped with detection, tracking, and identification systems to provide situational awareness to manned and unmanned aircraft [9]. These systems provide critical advancement towards Unmanned Traffic Management, as well as serve as a tool for law enforcement personnel to ensure public safety. The ultimate goal of this technology is to “distinguish compliant airspace users from those posing a safety or security risk” [9] (p. 72439). The rule enacts three methods of compliance: (1) there is Standard Remote Identification, in which RID systems are integrated into the UAS design and transmit RID messages from takeoff to shutdown; (2) a Remote ID Broadcast Module is attached to a UAS to retrofit it with Remote ID capability; or (3) both the unmanned aircraft and operator confine their operation inside a designated FAA-Recognized Identification Area (FRIA), where UAS are permitted to operate without Remote ID capability [10,18]. Remote Identification standards are defined by ASTM International, F3411-22a [20].

2.3. Similarities between Aeroscope and Remote Identification

Remote Identification and Aeroscope report very similar information. Both systems transmit individual UAS platform information, including identification or serial number, timestamp, takeoff or origination point, speed, altitude (Remote ID provides multiple altitude sources), instantaneous location, and related data. Aeroscope also provides a flight identifier, which enables distinguishing between different UAS sorties, or individual flights. While Remote ID does not have this capability, metrics can be used to infer flight differentiation, such as time differentials. Remote ID has additional features that enable determining the status of the platform, such as abnormal or emergency states, a feature not included in the Aeroscope. Aeroscope systems generally benefit from longer ranges than Remote ID systems, as Aeroscope systems are predicated on the demodulation of command and control signals, typically in the 2.4 GHz range, whereas Remote Identification signals operate within the low-power, short-range Industrial, Scientific, and Medical (ISM) frequency band, using protocols used for common electronic devices such as Wifi or Bluetooth [21]. Perhaps the most striking difference is that the Aeroscope system is proprietary, applicable only to DJI-manufactured UAS, whereas Remote ID is a federally mandated communication system applicable to all small unmanned aircraft systems. Despite their differences, these detection, tracking, and identification technologies provide largely similar information. That being stated, it is important to note that Aeroscope systems do not meet the federal requirements for Remote Identification, as defined in 14 CFR § 89. Recent legal interpretations from the Department of Justice, Department of Homeland Security, Federal Aviation Administration, and Federal Communications Commission suggest that some UAS detection technologies may run afoul of federal law, such as pen/trap and wiretapping rules, making the appetite of organizational use of systems like Aeroscope potentially legally contentious [22]. Conversely, most Remote Identification transmissions (with the noted exception of UAS owner identification information) are public, minimizing potential privacy concerns with utilizing such data.
Like Aeroscope data, Remote Identification data also have notable limitations. Unlike Aeroscope, where detection capability was designed to detect and interpret specific datalink communication protocols, RID must be equipped on an sUAS to be detectable. To ensure that RID enables accountability, serialized RID numbers must be self-registered by the operator with the FAA as a part of the UAS registration process. Neither RID compliance nor registration data are publicly reported by the FAA; it seems likely that initial adoption and compliance with new RID rules were problematic. When new RID rules became effective on 15 September 2023, the FAA announced a delayed compliance enforcement policy, giving operators an additional six months to adhere to new RID standards [23]. Technical elements of the new RID standard also present unique challenges. RID utilizes Bluetooth and Wifi communication frequencies and protocols [24]. While use of these unlicensed bands may have simplified implementation, technical limitations severely restrict the reception range and subsequent detectability of RID-equipped UAS. Unfortunately, RID protocols do not implement bit coding for sortie differentiation, making it difficult to distinguish between individual UAS flights originating from the same platform. Most of these shortfalls, however, can be overcome by establishing thorough detection coverage and implementing robust data analysis methods to address RID design limitations.

2.4. Advantages of Using UAS Tracking Data

The use of UAS detection data to facilitate the evaluation of UAS operations’ activity and platform longevity demonstrates several significant advantages over existing analysis methods:

2.5. Improved Data Granularity and Precision/Case Studies

Use of UAS detection data enables improved data granularity, enabling researchers and policymakers to evaluate specific usage patterns. UAS detection data can accurately identify critical operational metrics such as individual usage patterns, dates and times of operation, altitude utilization, flight duration, operator location, launch and landing locations, UAS flight profiles, flight distance, UAS speed, and other factors.

2.6. Operational Purpose Identification

A deep-level analysis of UAS flight patterns coupled with geolocation context can provide means of identifying flight purposes or mission sets. For example, the flight pattern presented in Figure 1 [left] likely indicates the capture of data to produce a 3D building model, whereas Figure 1 [right] shows an airport surface inspection. Other factors such as the altitude profile [altitude selection, consistency, or variation], cycle [takeoff and landing] patterns, speed variation, and other factors provide insights to identifying the mission purpose.

2.7. Real-Time Monitoring and Data Collection

While this study primarily leveraged historical UAS detection data, it is recognized that such data could provide the capability for near-real-time monitoring and analysis capabilities, potentially enabling immediate tracking of operational activity and a more rapid identification of potential National Airspace System hazards. Use of UAS detection systems to identify when UAS have entered into protected airspace, operations near aircraft, or flight in proximity to airports could enable rapid alerting and response capabilities to immediately intervene and mitigate these potential flight safety threats.

2.8. Comprehensive Data Coverage and Operator Inclusion

Passive UAS detection provides improved operator sampling over surveys or other active participation means. Data coverage is generally only limited by sensor line of sight and range. Researchers generally only need to ensure that UAS detection systems have access to power and data connectivity, ensuring maximum sensor up-time.

2.9. Longitudinal Data Collection

The collection of UAS detection data enables long-term, longitudinal evaluation, which is highly useful for assessing trends and identifying change. With passive, radio-frequency detection systems, passive monitoring can take place over the course of months or years, providing rich, highly detailed datasets with potentially hundreds of thousands or millions of data points.

2.10. Integration with Other Data Sources

The power of UAS detection data comes when it is integrated with other geolocation source material. These factors can be assessed contextually to better understand how and why UAS are operated in various patterns. For example, integrating UAS launch locations with community zoning databases enables better understanding of where UAS operators are operating. Fusing UAS operation times with weather information can determine predominant weather, wind, and visibility conditions in which UAS are being flown. Correlating UAS operating times with local, daily sunrise, sunset, and civil twilight times can advise if UAS operations are taking place at nighttime. Such data fusion provides answers to a myriad of operational questions.

3. Methodology

3.1. Instrument

A data sharing partnership was established between the DJI Aeroscope service provider, Dallas-Fort Worth International Airport, and the research team to collect and analyze Aeroscope data. A single G-16 Aeroscope was deployed atop a multistory hotel adjacent to Terminal D. According to DJI [15], this model of a stationary Aeroscope unit has a range up to 50 km (approximately 27 NM).

3.2. Sample

Based on the reported range of the detection device, the research team sampled an area of approximately 2290 NM2. This area encompasses primarily Class B airspace, and represents one of the busiest airspace areas in the country by air traffic volume. Other factors such as favorable year-round temperatures, moderate precipitation, and generally median wind speeds provide for an idealized environment for sUAS operations.
The research team analyzed 135 zip codes located within approximately 30 NM of the sample area to estimate the total population of sUAS within the area. As of Quarter 3 of CY2021, the FAA’s sUAS Registration Database indicated 9840 hobbyist/recreational registrations and 5089 Part 107/commercial registrations for a cumulative 14,929 sUAS within the sample area [23]. These data are imperfect for the following reasons: (1) registration is not required for sUAS weighing less than 0.55 lbs [24]; (2) recreational registrations do not correctly reflect the sUAS aircraft population, since they account for recreational operators rather than platforms [1]; and (3) there is likely to be a sizable proportion of drone operators who fail to register their sUAS for various reasons—such as a lack of knowledge of registration requirements or ambivalence to the registration policy. As a result, using the FAA’s sUAS Registration Database is likely to represent an artificially low value for the true number of drones operating in the sample airspace.

3.3. Data Collection and Analysis

Using the Aeroscope device, the research team collected date/time data, UAS serial number, location telemetry, altitude, speed, drone model, and remote pilot’s location information. The UAS serial number was used to differentiate individual UAS platforms; and a serialized flight identifier number is assigned by the Aeroscope to differentiate different flights. The research team culminated all UAS serial numbers detected within the sample area, identifying the first and last flight occurrence. The research team integrated platform specification info published by DJI to assess platform weights.
Upon the conclusion of the data collection period, the research team conducted a historical analysis of the dataset. All unique serial numbers were identified to create a population list. The research team identified the first calendar month in which each individual UAS serial number was detected. A similar process was used to determine the final month each serial number was detected. Platform lifespan was determined to be the lapsed duration between the initial detection and last detection of the respective serial number measured in calendar months. Data were aligned on a common datum to enable comparison. Basic metrics were used to calculate the frequency of flight operations, rate of utilization, and other factors.

3.4. Assumptions and Limitations

The research team acknowledges the following assumptions and limitations:
  • The Aeroscope was limited to detecting only DJI platforms. As of March 2020 (one month prior to this study), DJI commanded a 77% market share, with no other individual company exceeding a 4% market share [25]. In a recent study by Drone Industry Insights [11], DJI’s market share reportedly slipped to 70%.
  • The number of detected aircraft does not necessarily equate to the number of UAS operators. It is not uncommon for UAS operators to own several UAS platforms.
  • The flight identifier number is assigned by the Aeroscope cycles when the detection of a UAS serial number is interrupted. This can normally be attributed to landing the UAS, but can also occur if the line of sight between the UAS signal is broken or interrupted by an obstruction. The research team assumed that flight count was relatively accurate and did not assess or adjust flight counts for potential duplicate counting.
  • A UAS was considered active if the respective serial number was detected during any portion of a calendar month, regardless of flight frequency. Moreover, a detection occurs once the Aeroscope sensor detects the presence of the command and control datalink. This means that a flight will be counted once the UAS is activated, even if the aerial vehicle is not airborne. A UAS was considered inactive if the serial number was not detected during a calendar month.
  • Calculations related to lifespan excluded newly identified UAS serial numbers detected within the past six months of this study. This decision was intended to avoid inappropriately left-skewing lifespan values for UAS that potentially remained active after this study ended.

4. Findings and Discussion

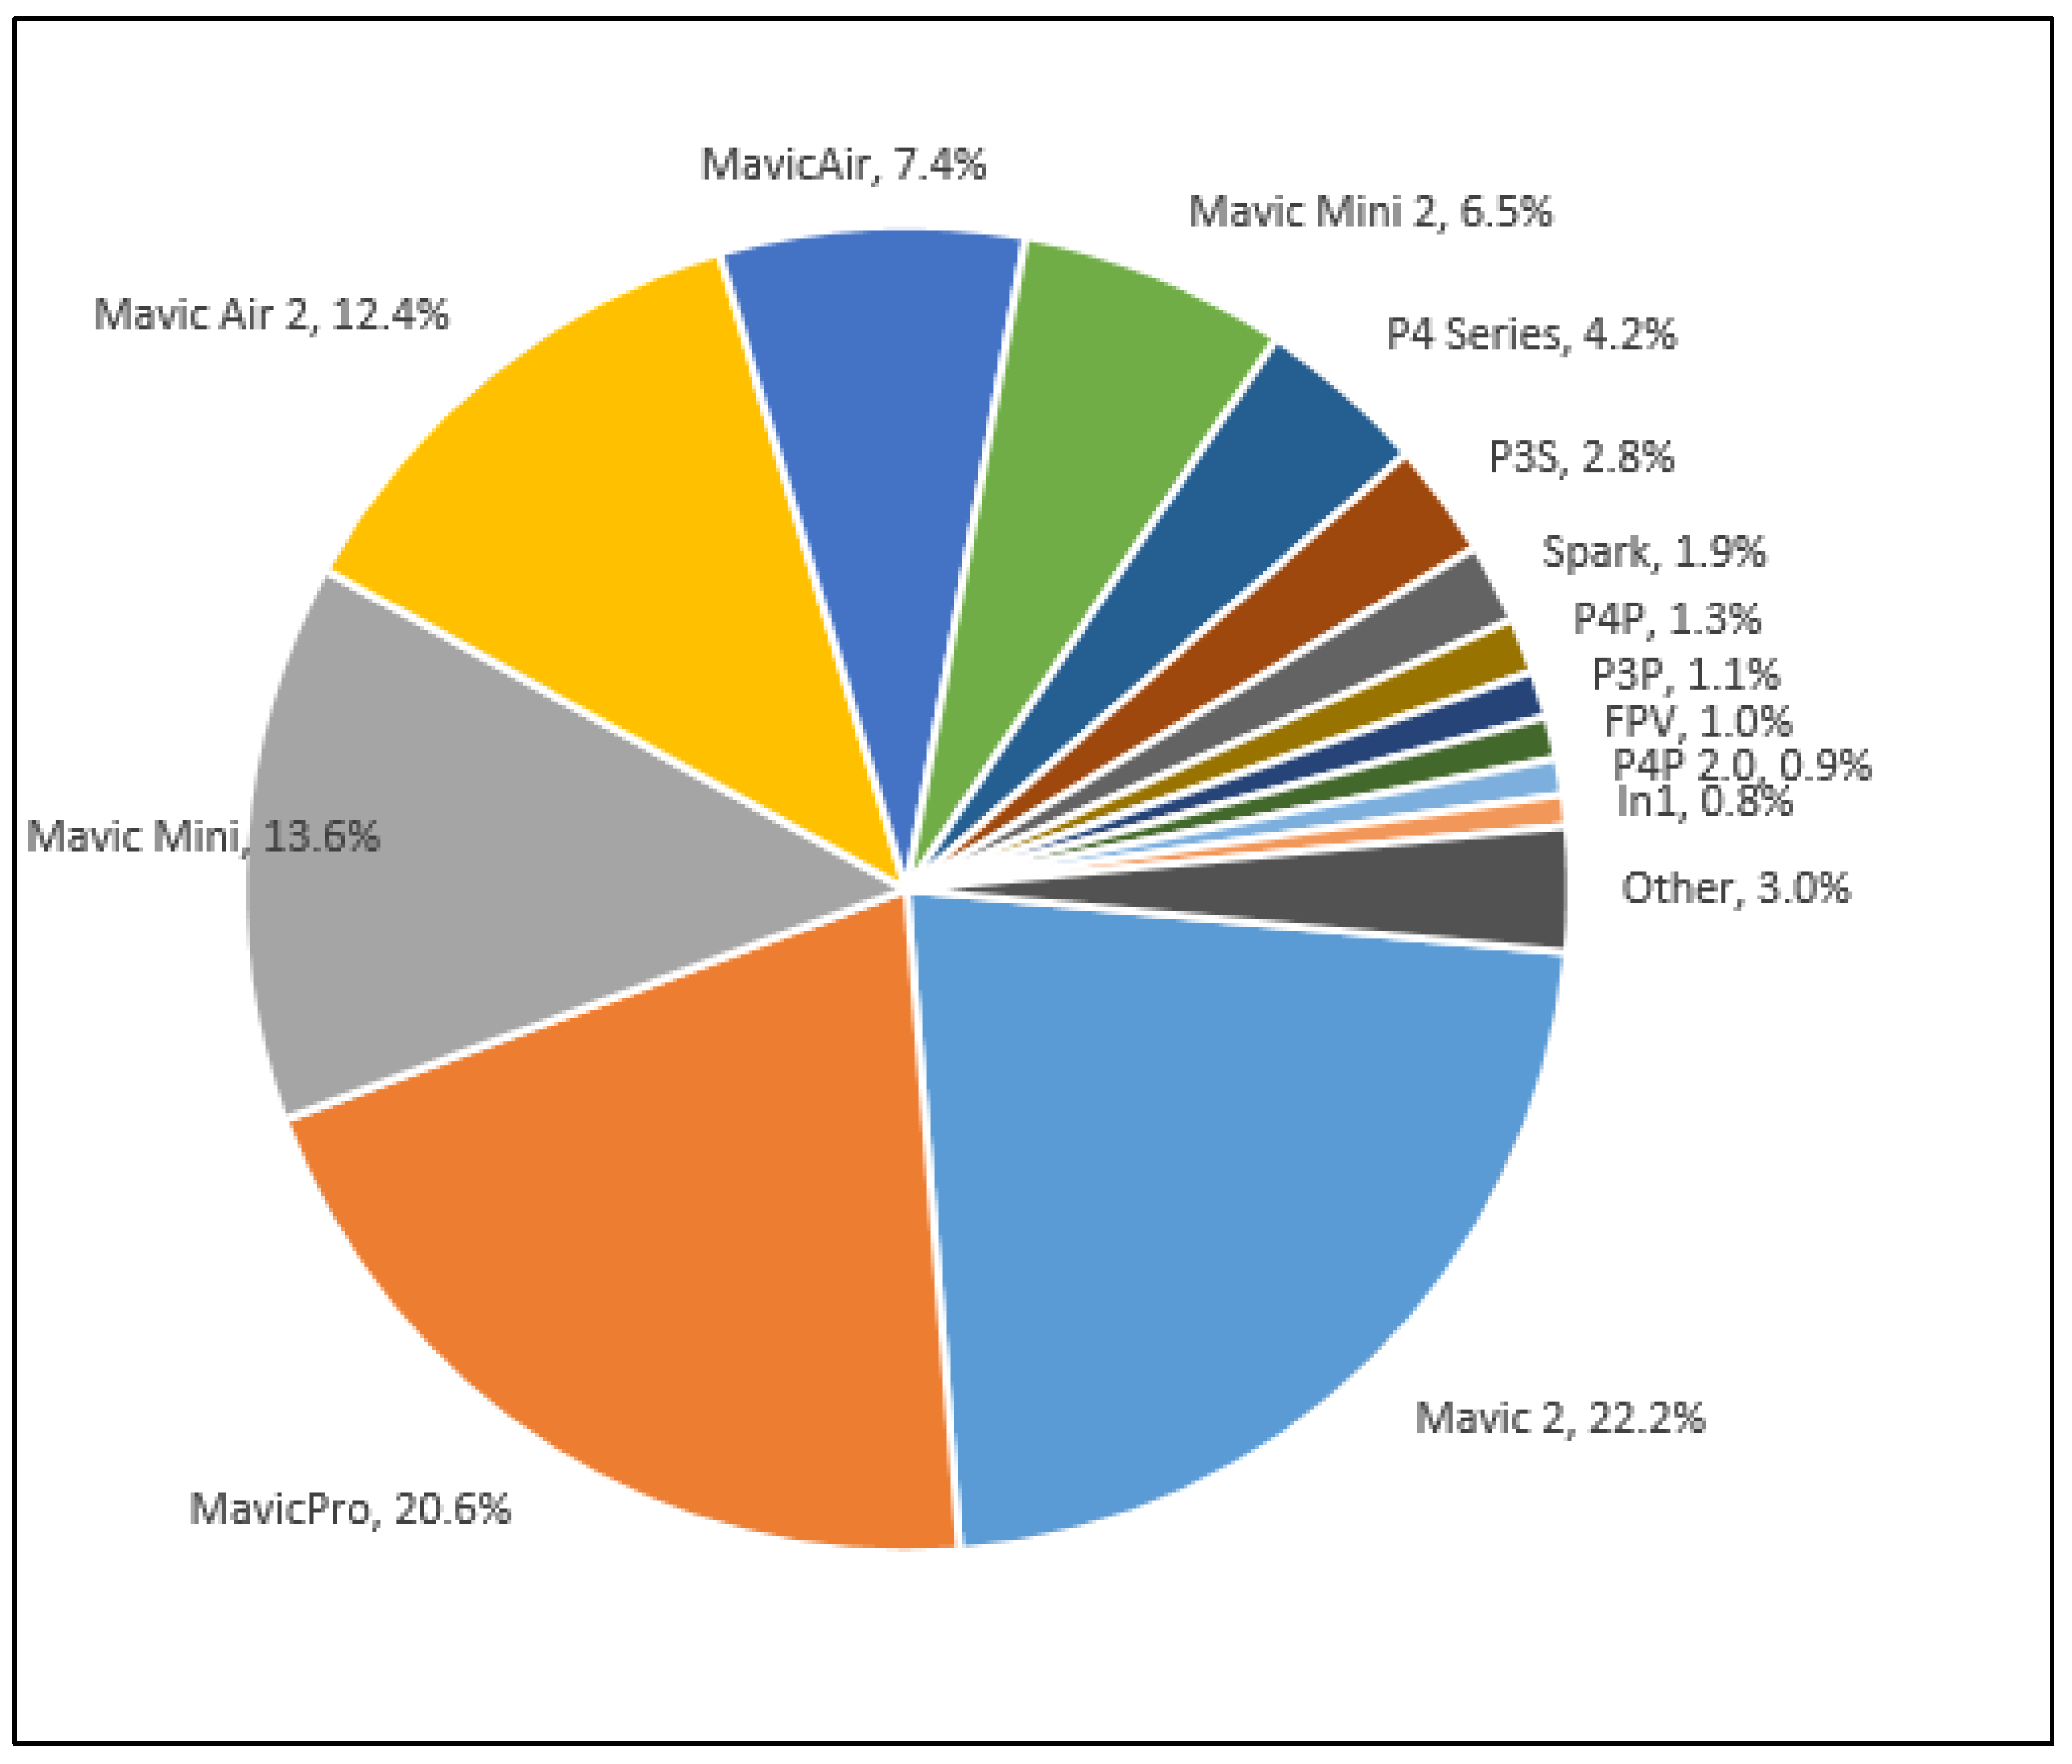
Data were collected from 22 August 2018 to 31 May 2021 (1013 days). During that timeframe, the Aeroscope recorded a cumulative 429,086 flight records from among a population of 27,011 separate DJI platforms. Figure 2 provides a breakdown of sUAS detections by model. The preponderance of models included the Mavic 2 (22.2%), MavicPro (20.6%), MavicMini (13.6%), Mavic Air 2 (12.4%), Mavic Air (7.4%), and MavicMini 2 (6.5%)—remaining models culminate less than one-fifth of the total population count. A detailed analysis of the sUAS population and operations within the sample area is provided by Wallace et al. [26].

4.1. sUAS Operations’ Census

The authors assessed sUAS platform activity on a monthly basis. Results are presented in Figure 3. Early in this study, operations were dominated by the MavicPro (Orange) and to a lesser extent the MavicAir (Blue) and Phantom 4 (Yellow) platforms. The rapid adoption of the Mavic 2 (Green), which was released during the first month of this study in August 2018, was prominently seen throughout the dataset. While the Mavic 2 would retain its dominance throughout this study, the MavicPro, MavicAir, and Phantom 4 would be displaced by new, smaller (<0.55 lb) MavicAir 2 (Gray) and MavicMini (Light Blue) platforms in 2020. The MavicMini would be largely supplanted by the MavicMini 2 (Light Green) in 2021. While the aforementioned platforms were widely adopted and used, some newly released platforms did not achieve market penetration. The DJI Spark (Dark Blue), released in May 2017, never achieved widespread use relative to other popular platforms.

4.2. sUAS Population Trend Analysis

Another interesting finding lies in the overall sUAS population trend. Over the course of late 2018 and 2019, the platform population was relatively stable, with some notable cyclical seasonal trends, which showed increased utilization in the summer months and decreased utilization in the winter. The relatively mild winters experienced in the sample area lead the research team to suspect that seasonal influences may have a stronger influence in areas where seasonal conditions are more extreme.
In early 2020, the population recorded substantial growth, experiencing a nearly 60% increase in active sUAS operations over prior years. It is likely that this rapid increase in operations can be fully or partially attributable to the COVID-19 pandemic. The research team asserts that many recreational operators took up their hobby during the early onset of the pandemic crisis, influencing a large adoption of the MavicMini and Mavic Air 2 platforms.

4.3. sUAS Activity Trend Analysis

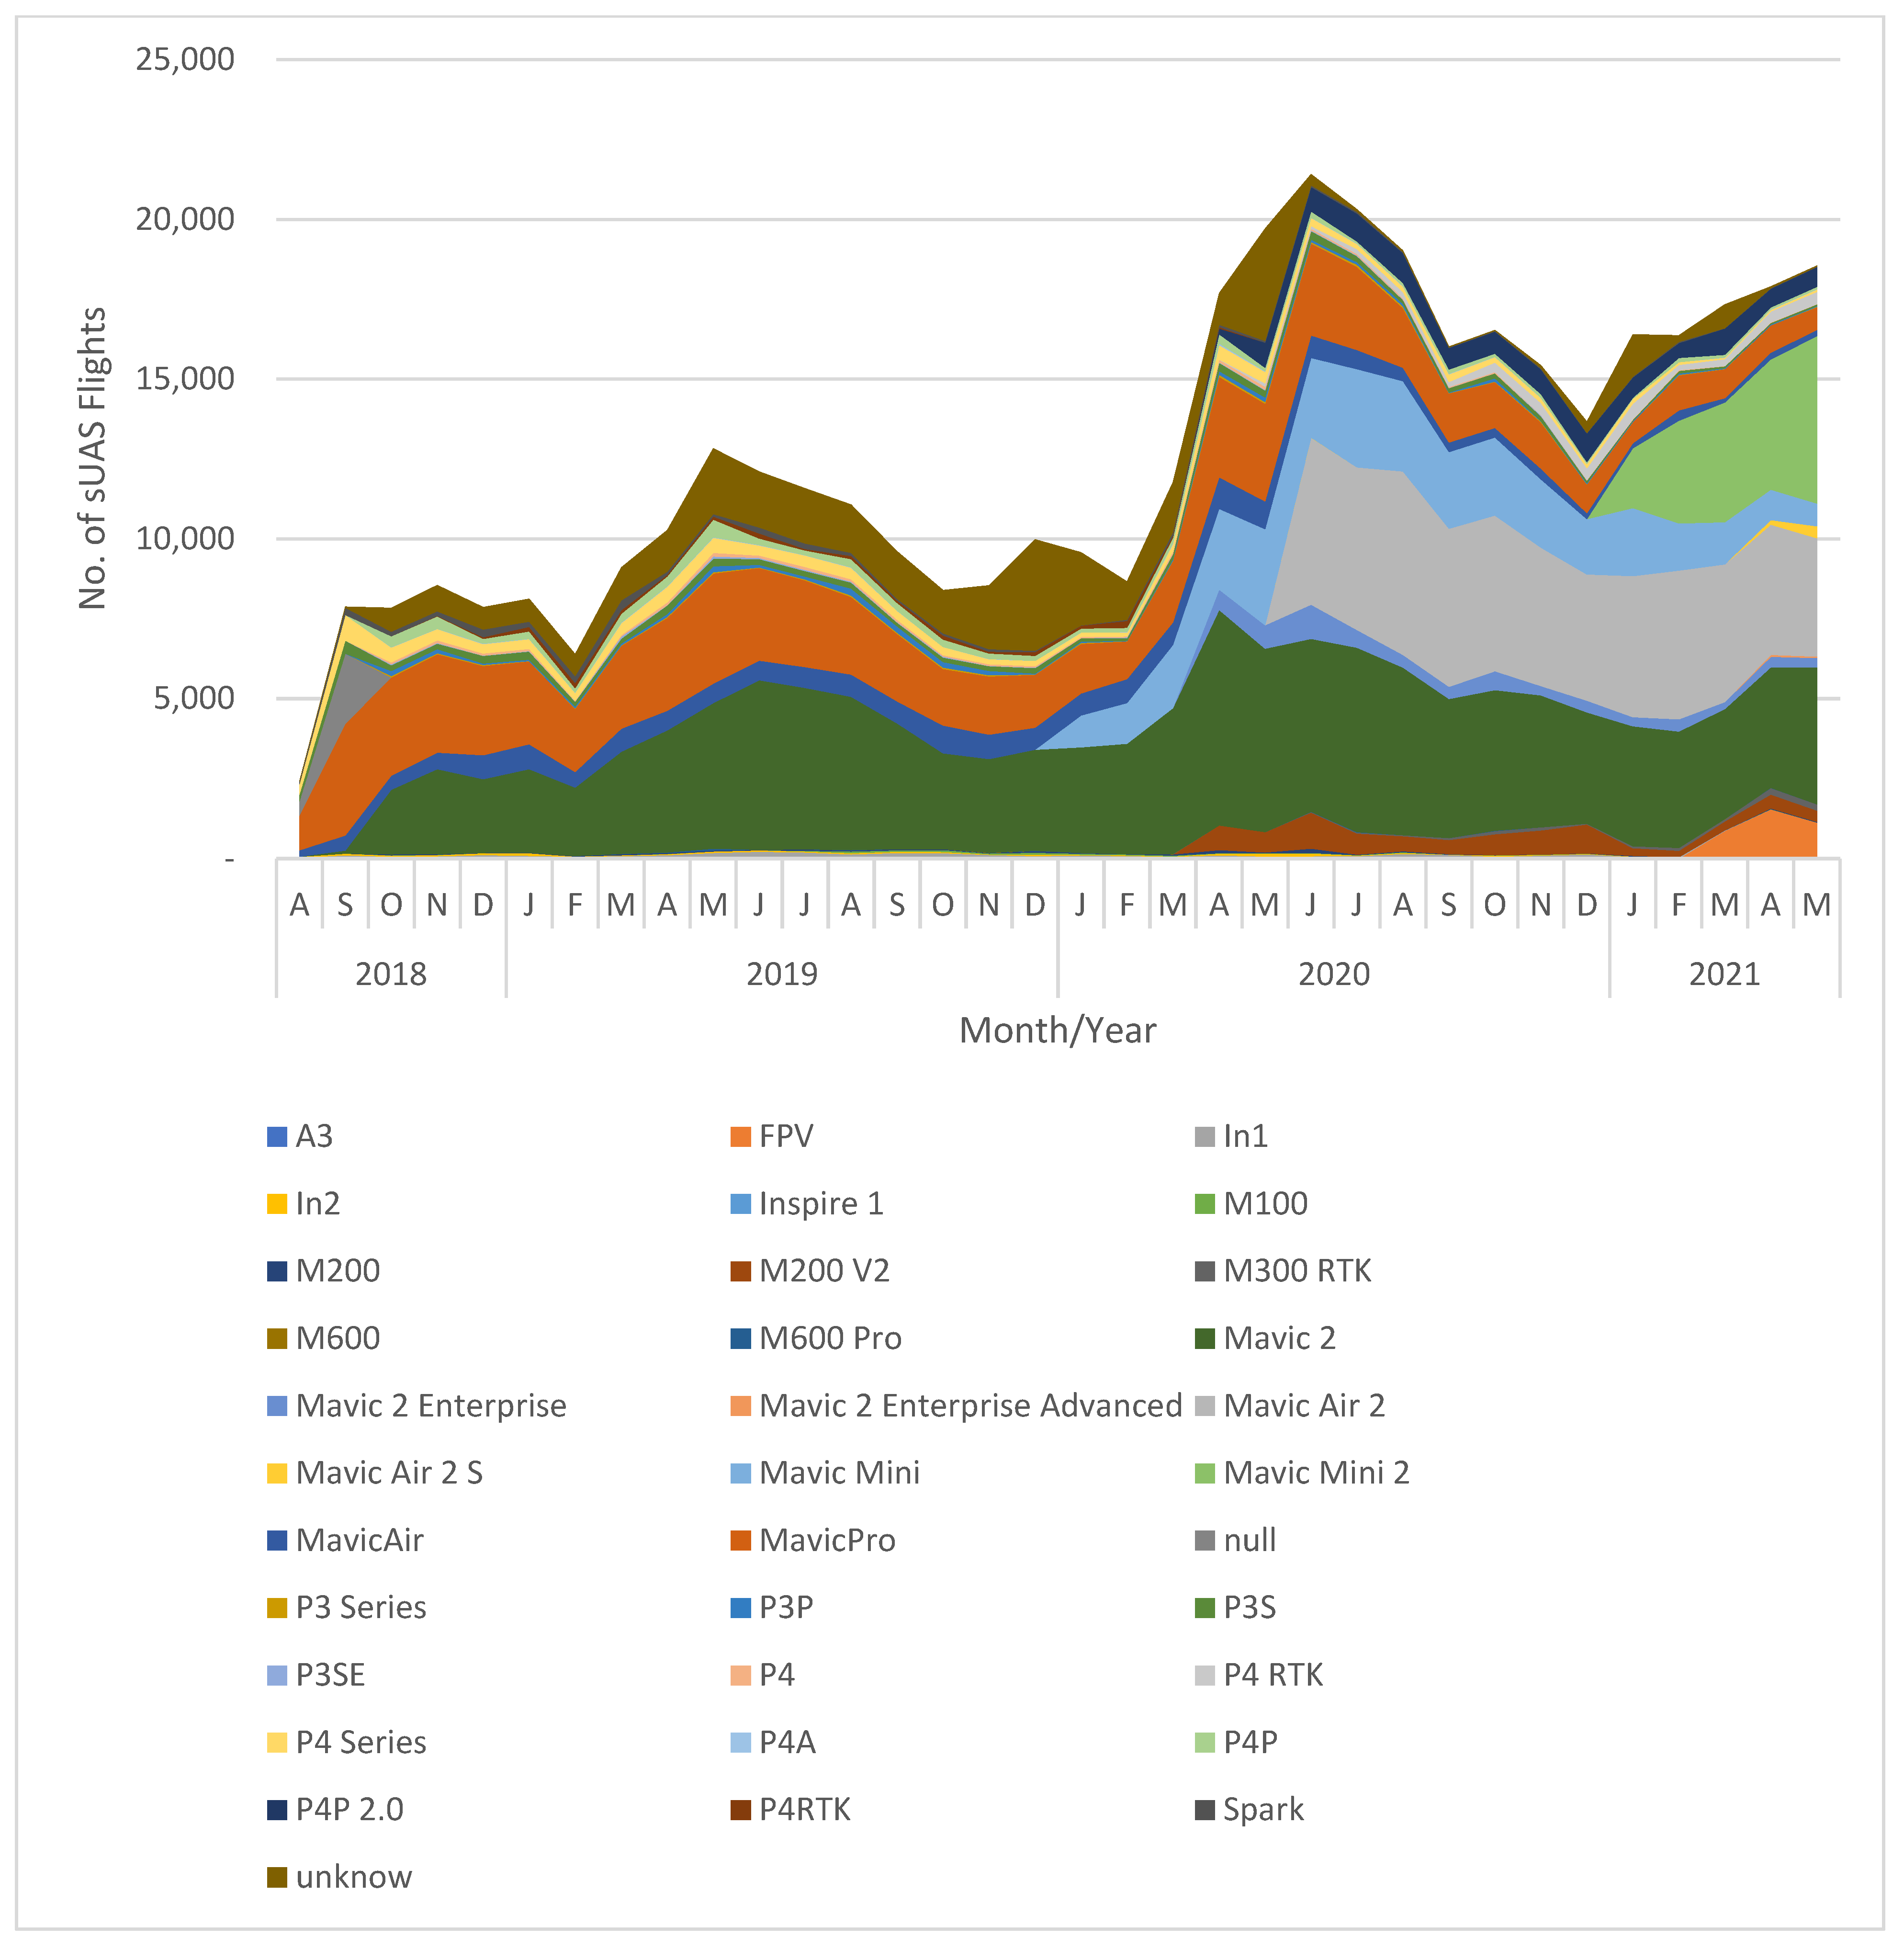
Figure 4 highlights the cumulative breakdown of monthly sUAS operations by platform model. The chart reveals platform trending information, as platform utilization grows (based on new product entrants) and wanes based on product obsolescence. The most popular consumer-grade platform by flight operations was the Mavic 2 (Dark Green), which peaked to more than 6788 operations per month in April 2020 and maintained prominent, but declining, utilization through the end of the sample period. This is in contrast to the MavicPro (Orange), which saw initially high utilization rates of 3452 operations in May of 2019, but steadily declined thereafter. The authors suspect that operators had abandoned these older platforms in favor of more capable products. The Phantom 4 (Yellow) series of platforms has been in steady decline as consumers transition to seemingly more popular smaller-profile platforms. There does appear to be a tipping point to consumer preferences, as the 249 g Mavic Mini (Light Blue) saw briefly high utilization rates, but quickly lost ground to the slightly larger 570 g Mavic Air 2 (Gray) in mid-2020. This trend may be shifting, however, as the initial utilization of the new Mavic Mini 2 (Light Green) shows strong growth into early 2021. Additionally, the new FPV (Peach), which some might call a “sport” or “racing” model, shows early promise, but lacks adequate data to accurately predict its operational trend into late 2021. On the prosumer side, a small number of Matrice 200 V2 (Burgundy) platforms are logging a steady number of operations. Similarly, the Mavic 2 Enterprise (Sky Blue) has seen small, but steady, utilization throughout 2020 and early 2021.
Cumulatively, detected platforms within the sample area logged more than 429,000 individual flights, an average of more than 423 flights per day (12,620/month). Similar to the monthly sUAS platform census, a cyclical relationship existed in the flight patterns, as well, with flight frequency generally increasing during the summer months and waning in the winter months. A strong correlational relationship [r(32) = 0.96, p < 0.001] existed between the monthly sUAS platform census and accompanying flight counts.
To better understand growth trends, the research team specifically assessed new platform entrants—previously unrecorded serial numbers detected for the first time. Results are presented in Figure 5. These platforms most likely represent new acquisitions or purchases. The researchers acknowledge that while it may be possible for previously undetected platforms to be displaced from another area for reasons such as operator relocation, we deem this to be relatively unlikely or rare. The same seasonal, cyclical pattern emerges for new entrants, as was reflected in the monthly platform census and flight counts’ datasets.

4.4. UAS Population by Weight Class

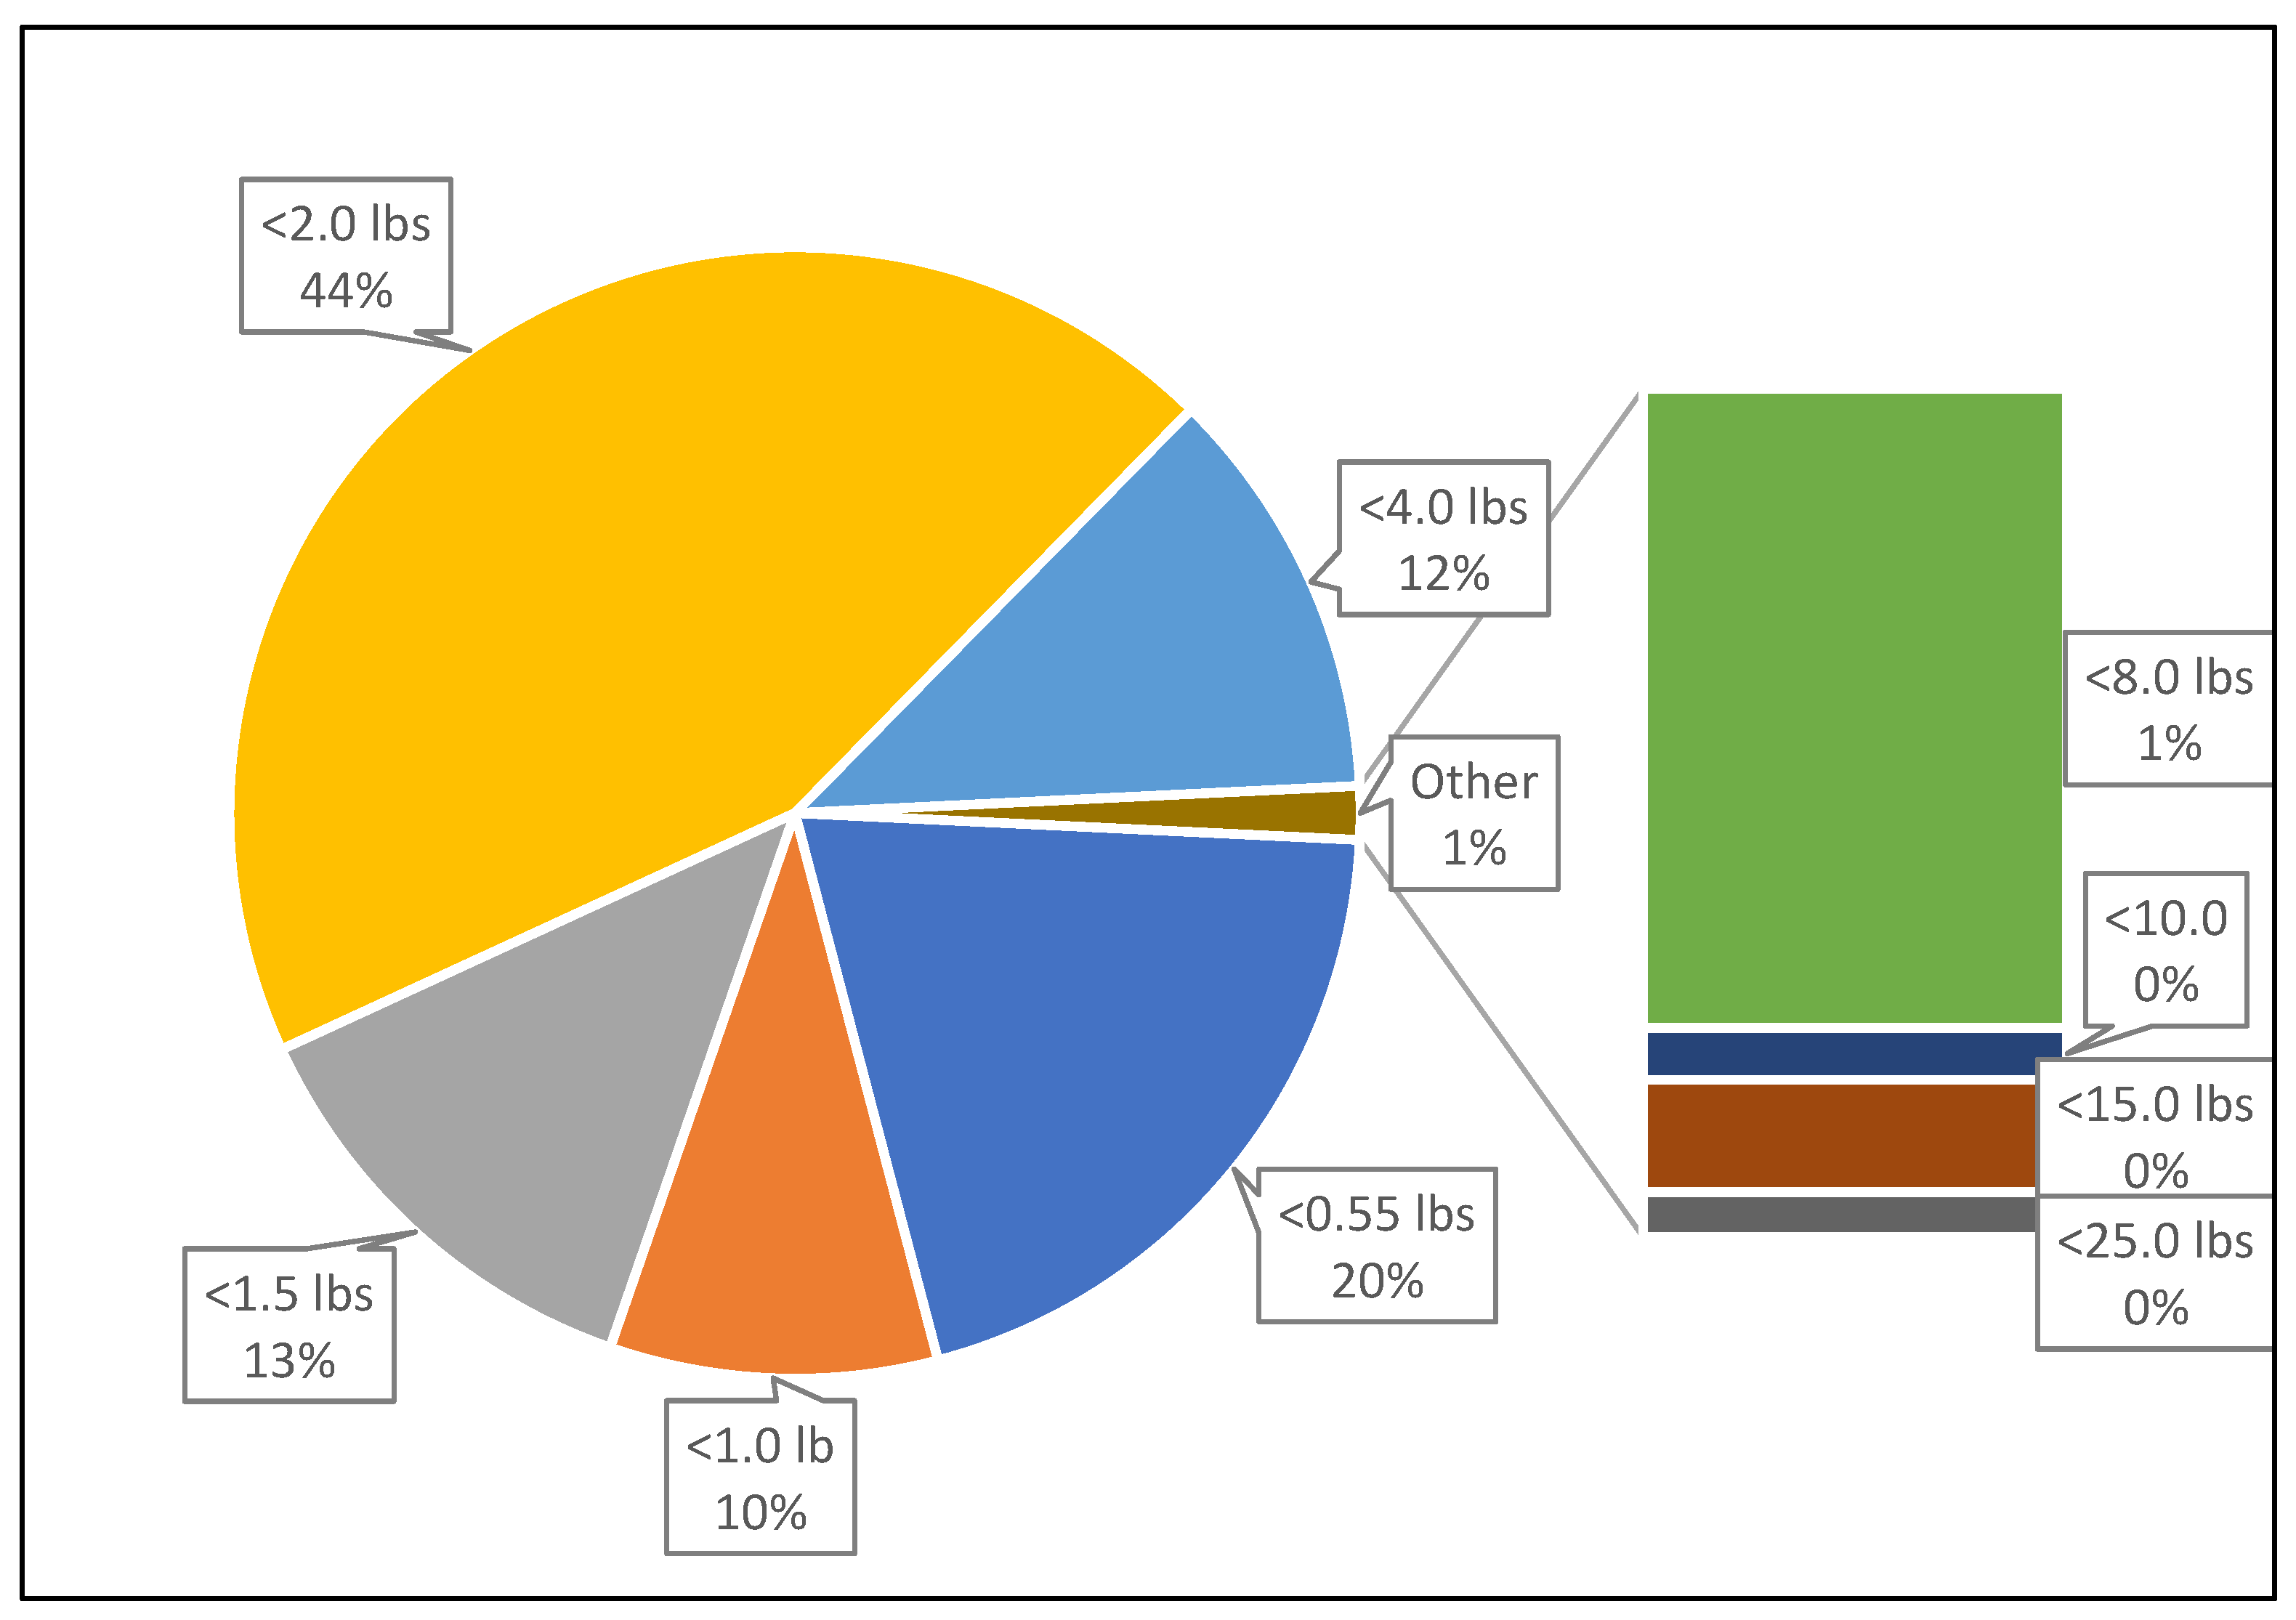
To provide better context, the authors assessed the cumulative detected UAS population by weight (see Figure 6). A weight analysis provides a better understanding of the potential risk posed by drones to other aircraft, as well as people on the ground. Multiple studies have shown that larger, heavier drones generally inflict more damage on aircraft during a collision [27,28,29], and cause more serious injury to persons on the ground [30].
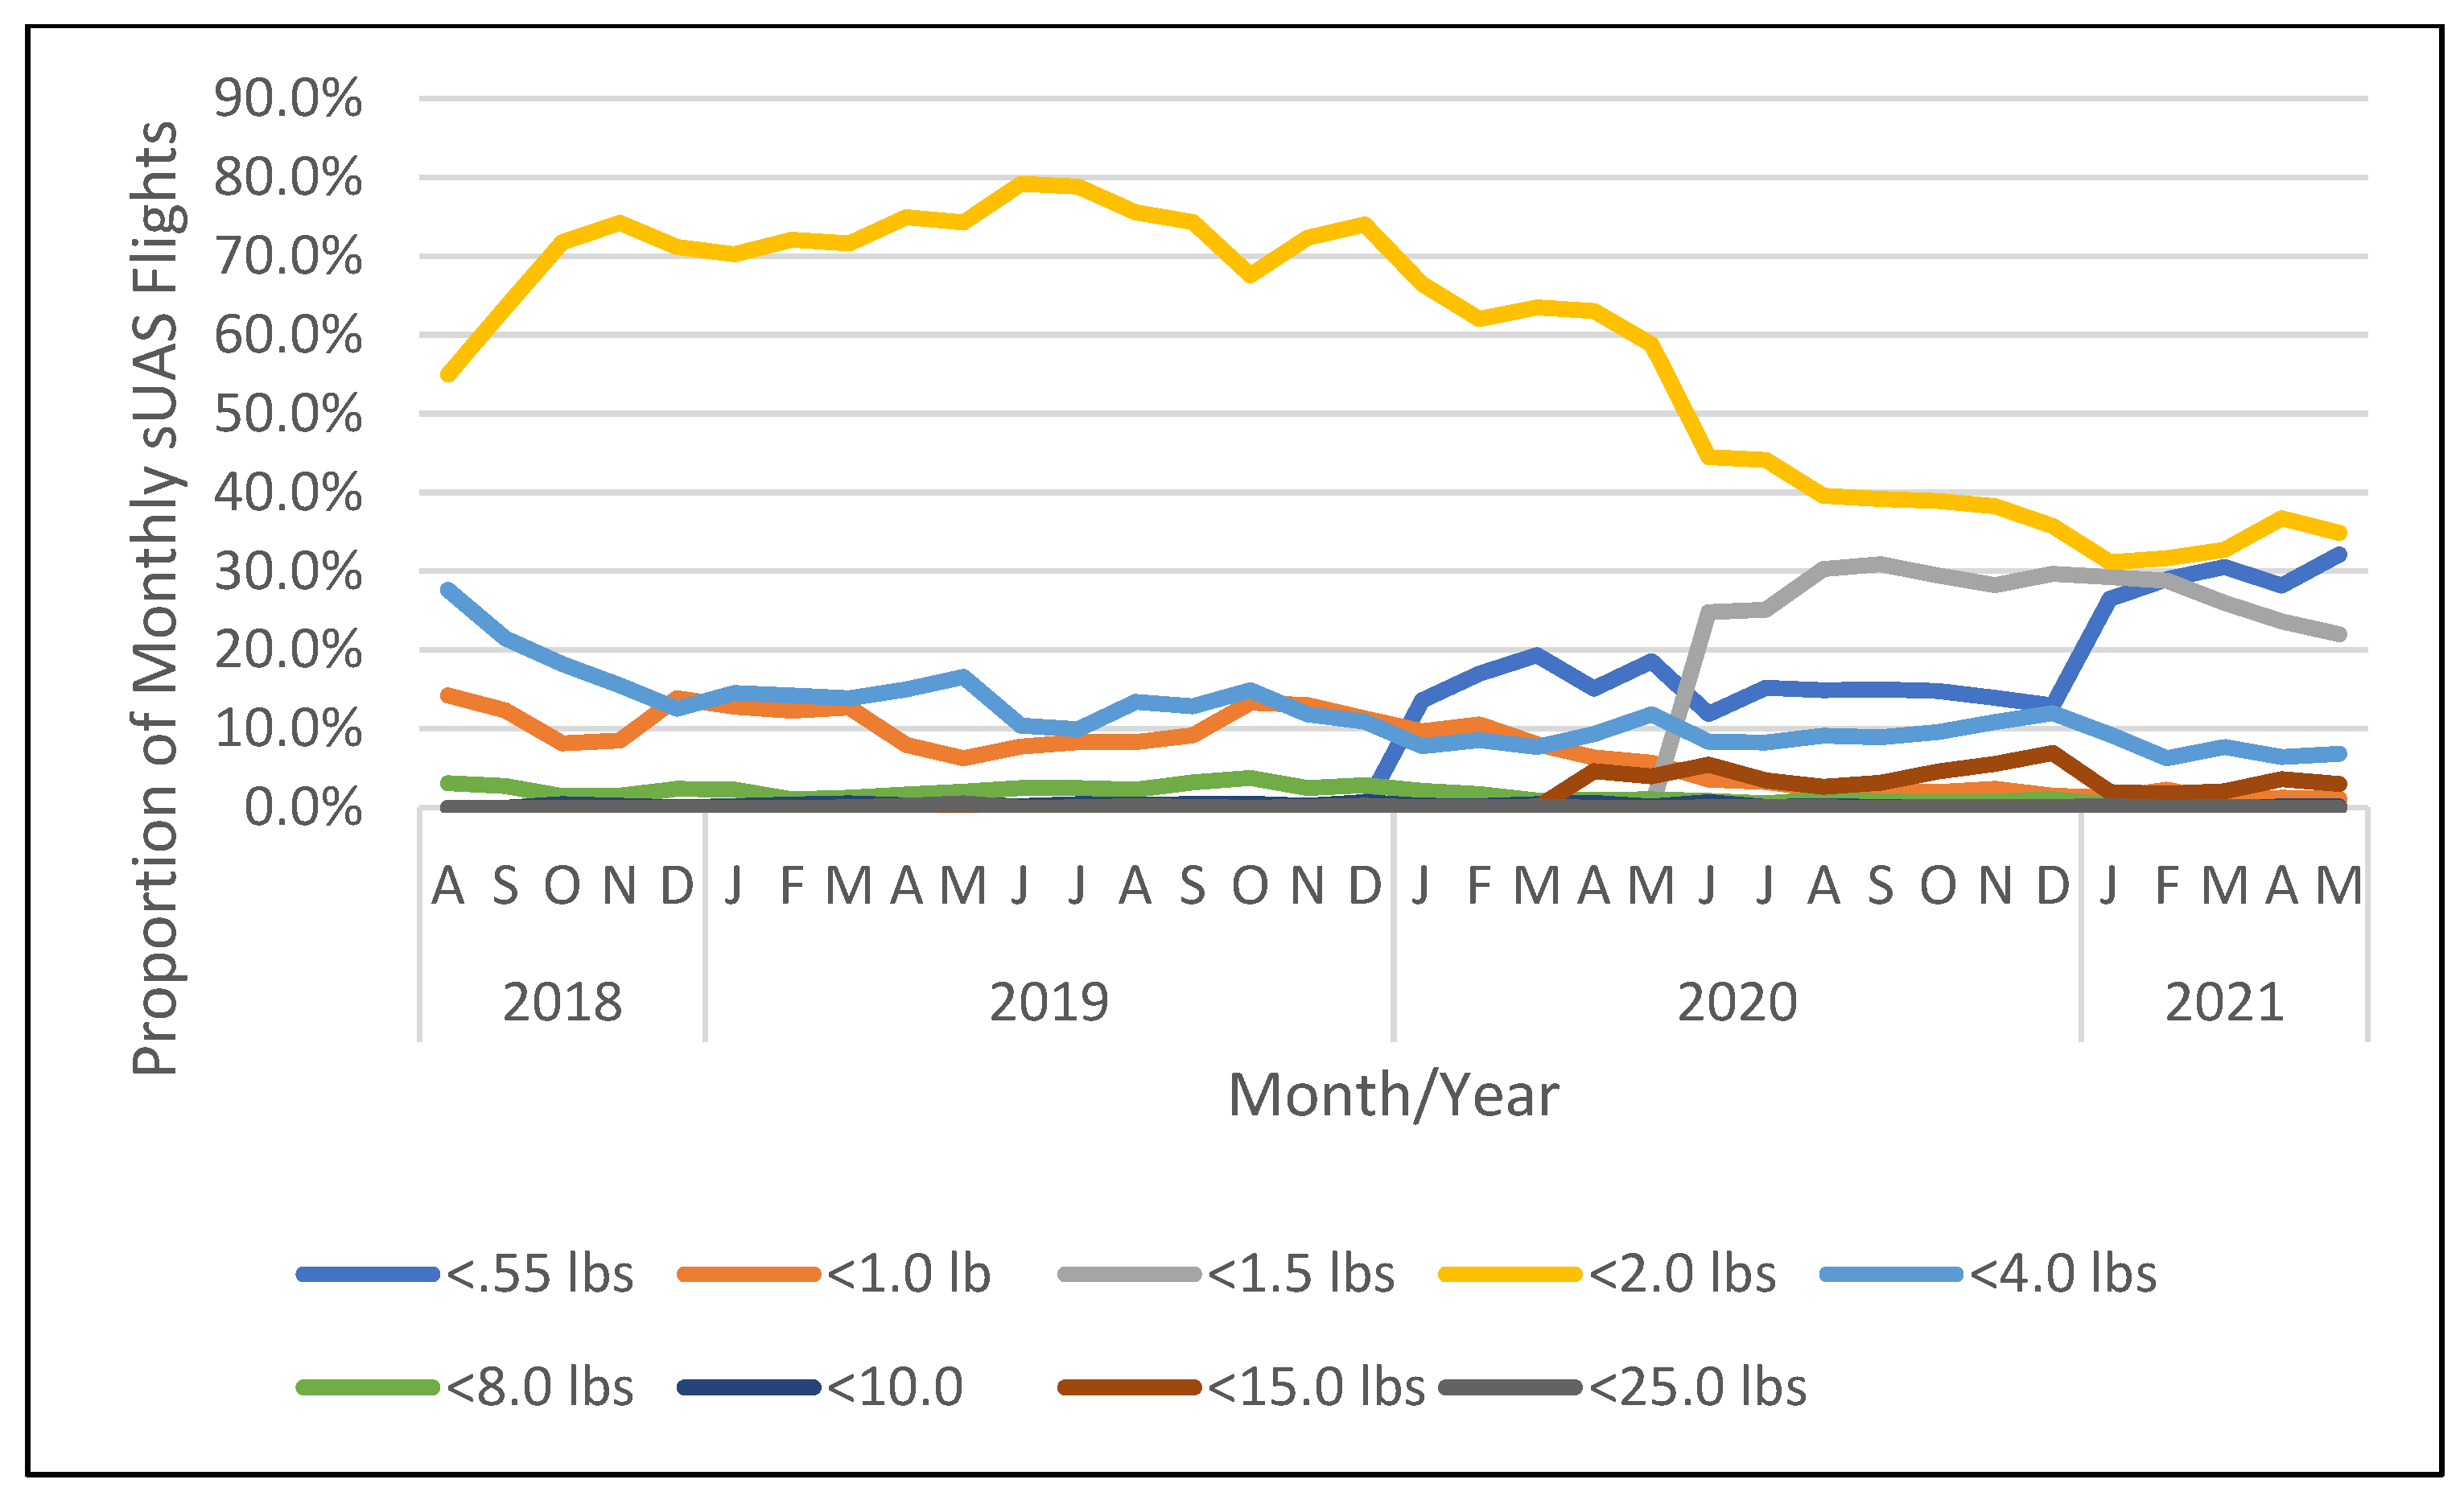
Small, lightweight UAS comprise the largest proportion of the detected population, with nearly 87% being less than 2 lbs, and at least 20% being less than 0.55 lbs, the threshold weight required for FAA registration. Only a very small margin of the detected population comprised larger, heavier UAS platforms. To provide further context, the authors included data showing the monthly distribution of sUAS flights by weight class over the sample period (see Figure 7). Figure 7 highlights fundamental shifts in the distribution of sUAS platform weights, with the release of several new platforms. As a general trend, towards the end of the sampling period, operators were flying a larger proportion of smaller, lighter sUAS (see Figure 8). The authors assess that the weights of platforms were unlikely to be the sole driver of this trend, but rather the availability of newer, more capable drone platforms drove operators to abandon older platforms in favor of newer, lighter ones. Moreover, the authors believe that this trend is also influenced by strategic decisions by DJI to manufacture smaller, lighter, more capable platforms. Improvements in manufacturing techniques, such as the integration of components on printed circuit boards and component miniaturization, enable DJI to manufacture lightweight platforms. Moreover, the manufacture of lightweight, small-footprint systems also has significant logistical and economic benefits, such as reduced storage and shipping costs. The authors believe that this manufacturing trend will likely continue for years to come.

4.5. Active sUAS Population and Lifespan

Tracking drone platform utilization and product lifespan can provide a great deal of illumination on the state of the UAS industry. Foremost, it offers a glimpse into the types of mission sets being carried out within the National Airspace System. Extensive flying by a DJI Spark, for example, implies a very different kind of flight mission than that of a Matrice 100. The first implies operation by a hobbyist, primarily due to the platform’s relatively low cost, small size, short flight duration, and limited sensor capabilities. Conversely, flight of larger, more expensive platforms such as the Matrice series implies a more professional, commercial-style operation, with the need for extended flight durations, sensor mounting, and accompanying mission requirements. Additionally, studying product lifespan provides insights about platform adoption, product reputation, customer satisfaction, demand for unique capabilities, and other factors. Finally, product lifespan can also hint about the current state of economics within the drone industry. A trend towards lower product lifespans with higher turnover—particularly for prosumer-grade platforms—may indicate stronger demand and healthy economic conditions for drone-related services across the industry. Such a trend may also suggest additional technological advancement, as consumers weigh replacing legacy platforms with more capable platforms with new capabilities.
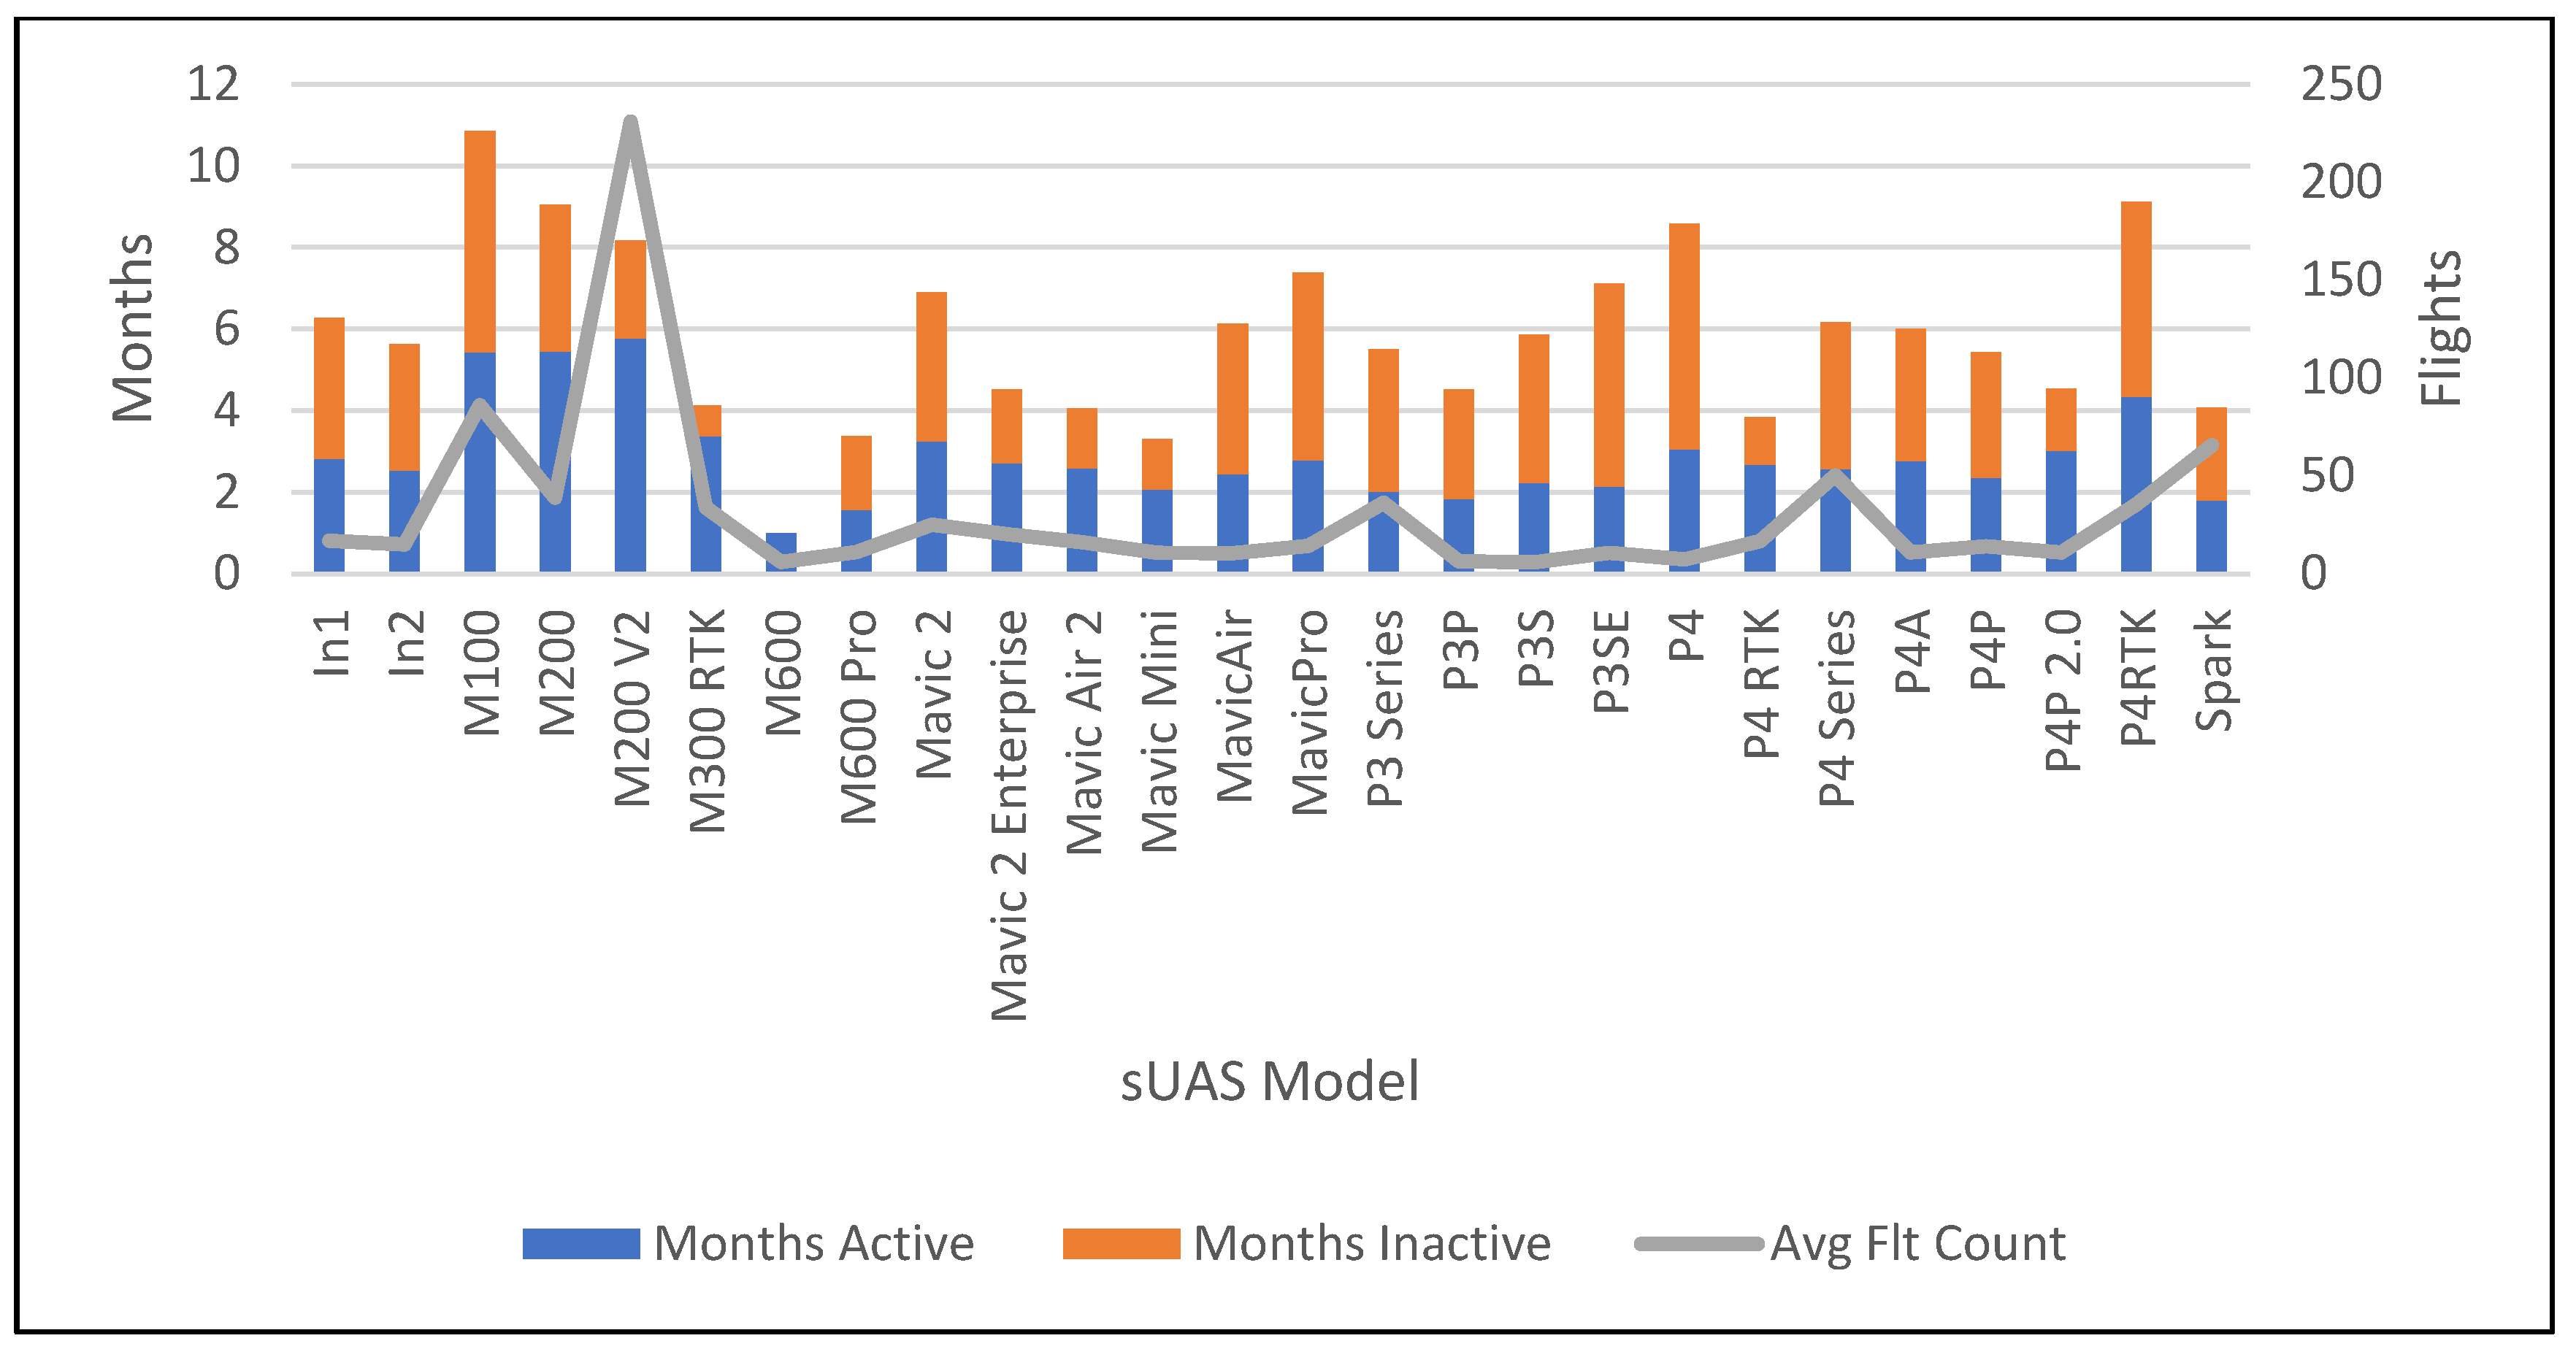
Figure 9 provides an overview of the number of months of activity of each respective platform model, relative to its lifespan. On a weighted average, platforms had an active-to-inactive duration ratio of 1.03 to 1.00. This means that the sampled UAS were only flown in about 50% of the calendar months of their total lifespan.
Generally, commercial-grade and prosumer UAS (drones designed for both professional and consumer use) have slightly longer lifespans than consumer-grade products. Within the sampled population, professional-grade drones included the Mavic 100, 200, 200V2, M300 RTK, M600, and M600 Pro, Mavic 2 Enterprise, and Phantom 4 RTK. Prosumer platforms include UAS models such as the Inspire 1, Inspire 2, Mavic 2, MavicPro, and related platforms.
By tracking sUAS utilization by serial number over time, the lifespan curve of tracked platforms was produced (see Figure 10). The lifespan was determined by the duration in months between initial UAS serial number detection and the final detection. Lifespans for all detected platforms were aligned on a single datum, representing lifespan duration. Figure 10 shows the proportion of the detected study population that remained in operation over time. Note that UAS operations were not necessarily continuous—most platforms had heavy activity during the month(s) of early detection, with several months of inactivity before being flown infrequently towards the end of their lifespan. For this analysis, researchers excluded UAS platforms initially detected within the past six months of this study, as described in the Assumptions and Limitations.
Figure 10 reveals a substantial drop in lifespan in the months after initial detection. On a weighted average, the platform lifespan dropped a precipitous 48.9% after the month of initial usage. After six months following initial detection, a weighted average of only 31% of the population for each platform were still in operation. This figure drops to only 15.7% of the population after one year. Less than 9% of the sample remained active at 18 months, and just 5.3% remained active after 24 months. Based on longevity of the MavicPro and Mavic 2 platforms, the two most numerous and longest-sampled platforms in the dataset, the research team estimates consumer sUAS lifespan at between 24 and 30 months, after which, platform usage becomes negligible. Interestingly, professional platforms, such as the Matrice 200, Matrice 100, and Phantom 4 RTK, seem to be more robust to this operational trend, with much steadier lifespan declinations. The research team believes initial precipitous declines to be primarily attributable to hobbyist and recreational operators, who exhibit initially high flight activity (in numbers of flights), but relatively low longevity. We believe that this trend represents recreational operators acquiring a new UAS platform, using it extensively within the first several months, and after exhausting the novelty of the platform, they end up shelving the unit after a burst of initial usage.
To provide further context to Figure 10, maximum lifespan values were placed in the legend. These duration values can generally be correlated to the initial release date of each platform, relative to the study duration. This means that newer platforms have an artificially steeper lifespan curve than older platforms. Take for example the Phantom 4 Pro 2.0 indicated by the Dark Green line in Figure 10. Initial lifespan data correspond to most other platforms, but with a steeper slope that ends at the 13-month mark (i.e., the platform was released approximately 13 months prior to the end of this study). Over time, the lifespan of most platforms normalized, showing between a 35 and 65% drop in lifespan after the first month, with most steadily decreasing in lifespan to less than 10% between months 18 and 24.
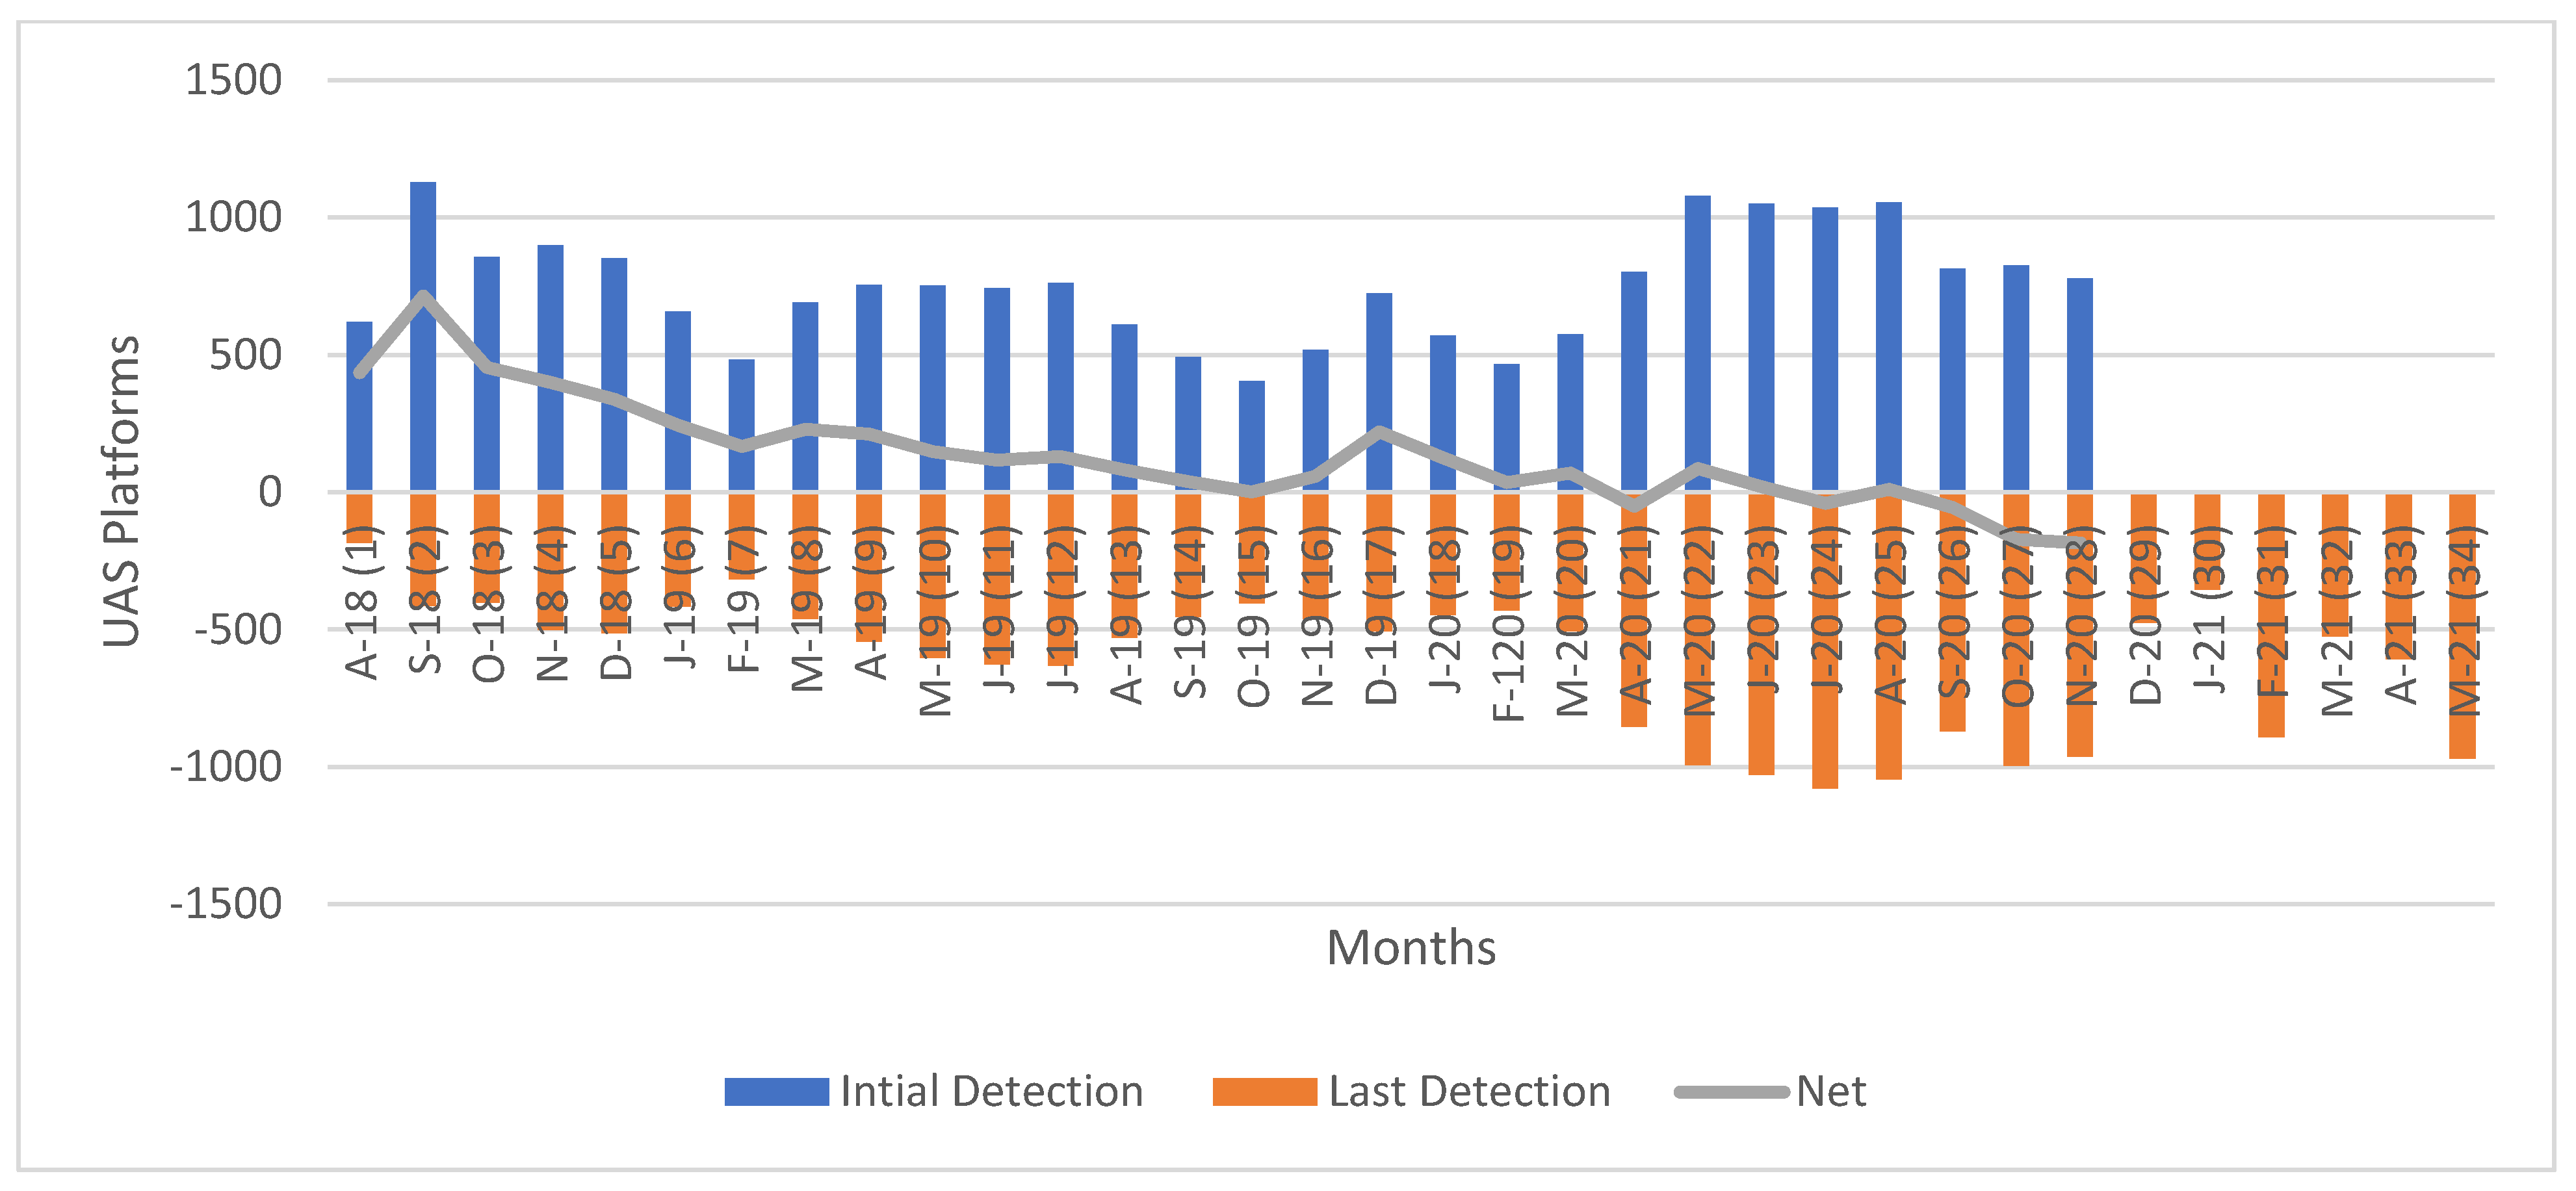
Another interesting and somewhat unexpected finding was the cyclical nature of platform drop outs over the calendar year. Upon the conclusion of the data collection period, the research team noted new platforms that entered service for the first time during each respective month, as well as platforms that were no longer detected from the prior months. In the months of March–November each year, new entrants peaked (see Figure 11). At the same time, there was an accompanying increase in platforms that were no longer detected. This trend became even more prominent in 2020, during the COVID-19 pandemic. The authors believe that this data trend represents consumers “shelving” their older UAS and acquiring and flying newer platforms.

5. Conclusions

During this study, the research team sought to answer the following questions:
  • What is the lifespan of sUAS systems?
  • How often are sUAS flown?
  • What can sUAS platform use inform us about market trends?

5.1. sUAS Lifespan

This study yielded significant results suggesting the lifespan of small unmanned aircraft systems. The research team noted initial, rapid declination in utilization after the first month. More than four out of five sUAS platforms ceased usage within one year, with steady declining usage continuing until platform obsolescence/disuse after an estimated 24–30-month lifespan. The number of platforms still in operation after 30 months was relatively negligible. Commercial and prosumer-grade sUAS were found to have a slightly longer lifespan than consumer-grade models.

5.2. How Often Are sUAS Flown?

Based on the dataset, small UAS flight activity maintains a nearly 1:1 ratio of monthly activity to inactivity until the end of its lifespan. The relationship between sUAS flights and platform count has a very strong, statistically significant 96% correlation coefficient. The accompanying slope calculation yielded an estimated 7.6 sUAS flights for each sUAS platform contained in the monthly census. Individual platform flight count trends were notably higher for professional and prosumer platforms than consumer platforms. Like population, flight activity seems to be influenced by seasonal factors, with increasing activity during the summer months and decreasing activity during the winter months. The researchers surmise that the extent of seasonality would likely be even more pronounced in locations that encounter harsher winters or cold weather.

5.3. Market Trends

This study yielded several interesting market trends. First, the sUAS market appears to be transitioning to newer, small-profile, low-weight models. Utilization trends suggest that consumers are replacing legacy platforms with these newer, smaller, more capable variants. Additionally, the data suggest that external trends, such as the 2020 COVID-19 pandemic, may have had a substantial influence on platform acquisition and usage.

5.4. Implications

The findings of this study on the lifespan and utilization patterns of small unmanned aircraft systems (sUAS) have significant implications for various stakeholders (e.g., policymakers, practitioners, and manufacturers). The rapid decline in platform usage after the first month suggests that many consumers—and particularly hobbyists—tend to abandon their drones after initial enthusiasm. This insight can inform policymakers in creating regulations and guidelines that promote sustainable use and proper disposal of electronic waste associated with obsolete drones. For practitioners in commercial sectors, understanding the typical lifespan of sUAS can aid in planning for equipment upgrades and budgeting for replacement cycles in order to optimize operational efficiency.
Manufacturers can leverage these insights to develop more durable and versatile products that meet the evolving demands of sUAS users. The trend toward shorter product lifecycles highlights an opportunity for innovation in creating modular or upgradable drone systems that extend usability and appeal to cost-conscious consumers. Additionally, the seasonal variations in sUAS activity underscore the importance of marketing strategies aligned with consumer behavior patterns. By understanding these dynamics, stakeholders can better anticipate market trends and align their strategies to enhance adoption and customer satisfaction.

5.5. Future Research

The authors plan to conduct a similar analysis utilizing Remote Identification signals. Use of Remote ID will enable tracking not only DJI platforms, but models from other manufacturers, as well. Additionally, tracking the presence of standard Remote ID vs. drones equipped with broadcast modules will enable a more accurate account of the continued use of legacy sUAS compared to newer platforms with integrated Remote ID systems. The authors also intend to conduct a more thorough analysis of potential seasonal trends by analyzing seasonality effects on sUAS populations and operations in varied geographical locations. Finally, additional emphasis will be placed on evaluating digital telemetry to establish a working model for correlating detected telemetry patterns to various sUAS mission sets. The authors may also apply data and subsequent findings in future work to developing measures of compliance for sUAS use, similar to the analysis performed by Henderson and Shelley [31]. Future research will also assess the potential implications of sUAS activity trends on Air Traffic Management (ATM) and Unmanned Traffic Management (UTM) systems.

Author Contributions

Conceptualization, R.J.W.; Methodology, R.J.W. and S.R.; Formal analysis, R.J.W.; Resources, S.-A.L.; Data curation, R.J.W.; Writing—original draft, R.J.W.; Writing—review and editing, S.R., S.-A.L. and S.R.W. All authors have read and agreed to the published version of the manuscript.

Funding

This research received no external funding.

Data Availability Statement

The datasets presented in this article are not readily available because of non-disclosure requirements. Requests to access the datasets should be directed to the corresponding author.

Conflicts of Interest

The authors declare no conflicts of interest.

References

  1. Federal Aviation Administration [FAA]. FAA Aerospace Forecast FY 2024–2044: UAS Compendium. 2024. Available online: https://www.faa.gov/data_research/aviation/aerospace_forecasts/unmanned_aircraft_systems.pdf (accessed on 13 August 2024).
  2. Registration and Marking Requirements for Small Unmanned Aircraft, 80 FR § 78594-78598. 2015. Available online: https://www.federalregister.gov/documents/2015/12/16/2015-31750/registration-and-marking-requirements-for-small-unmanned-aircraft (accessed on 13 August 2024).
  3. Loffi, J.M.; Wallace, R.J.; Jacob, J.D.; Dunlap, J.C. Seeing the Threat: Pilot Visual Detection of Small Unmanned Aircraft in Visual Meteorological Conditions. Int. J. Aviat. Aeronaut. Aerosp. 2016, 3, 13. [Google Scholar] [CrossRef]
  4. Wallace, R.J.; Vance, S.M.; Loffi, J.M.; Jacob, J.; Dunlap, J.C. Cleared to Land: Pilot Visual Detection of Small Unmanned Aircraft During Final Approach. Int. J. Aviat. Aeronaut. Aerosp. 2019, 6, 12. [Google Scholar] [CrossRef]
  5. Loffi, J.M.; Wallace, R.J.; Vance, S.M.; Jacob, J.; Dunlap, J.; Mitchell, T.A.; Johnson, D.C. Pilot Visual Detection of Small Unmanned Aircraft on Final Approach during Nighttime Conditions. Int. J. Aviat. Aeronaut. Aerosp. 2021, 8, 11. [Google Scholar] [CrossRef]
  6. Wallace, R.J.; Winter, S.R.; Rice, S.; Kovar, D.C.; Lee, S. Three Case Studies on Small Uncrewed Aerial Systems Near Midair Collisions with Aircraft: An Evidence-Based Approach for Using Objective Uncrewed Aerial Systems Detection Technology. SAW Int. J. Aerosp. 2023, 16, 2023. [Google Scholar] [CrossRef]
  7. Federal Aviation Association. Recreational UAS Safety Test (TRUST). 2024. Available online: https://www.faa.gov/uas/recreational_flyers/knowledge_test_updates (accessed on 13 August 2024).
  8. Federal Aviation Administration. UAS Data Exchange (LAANC). 2024. Available online: https://www.faa.gov/uas/getting_started/laanc (accessed on 13 August 2024).
  9. Remote Identification of Unmanned Aircraft Systems [RIDUAS], 84 FR § 72438-72524. 2019. Available online: https://www.federalregister.gov/documents/2019/12/31/2019-28100/remote-identification-of-unmanned-aircraft-systems (accessed on 13 August 2024).
  10. Federal Aviation Administration. Remote Identification of Drones. 2024. Available online: https://www.faa.gov/uas/getting_started/remote_id (accessed on 13 August 2024).
  11. Drone Industry Insights. Global Drone Market Report 2023–2030. 2023. Available online: https://droneii.com/product/drone-market-report (accessed on 13 August 2024).
  12. Forge. DJI IPO. 2024. Available online: https://forgeglobal.com/dji_ipo/ (accessed on 13 August 2024).
  13. Huang, C.; Chen, Y.C.; Harris, J. Regulatory compliance and socio-demographic analyses of civil unmanned aircraft systems users. Technol. Soc. 2021, 65, 101578. [Google Scholar] [CrossRef]
  14. Belwafi, K.; Alkadi, R.; Alameri, S.A.; Al Hamadi, H.; Shoufan, A. Unmanned aerial vehicles’ remote identification: A tutorial and survey. IEEE Access 2022, 10, 87577–87601. [Google Scholar] [CrossRef]
  15. DJI. DJI Aeroscope. 2021. Available online: https://www.dji.com/aeroscope (accessed on 13 August 2024).
  16. 911 Security. DJI Aeroscope has Robust Capabilities to Track DJI Brand Drones. 2021. Available online: https://www.911security.com/request-aeroscope-product-details?gclid=EAIaIQobChMIoNiS__Kt8QIVF-XICh0vGgDgEAAYASAAEgIlZvD_BwE (accessed on 13 August 2024).
  17. 911 Security. DJI Aeroscope Review: Features, Specs, and How It’s Used to Layered Drone Detection. 2020. Available online: https://www.911security.com/blog/dji-aeroscope-review-features-specs-and-how-its-used-in-layered-drone-detection (accessed on 13 August 2024).
  18. DJI. DJI Developer. 2018. Available online: https://developer.dji.com/mobile-sdk/documentation/introduction/product_introduction.html#remote-controller (accessed on 13 August 2024).
  19. Roth, E.; DJI Quietly Discontinues Its Drone Detecting Aeroscope System. The Verge. 2023. Available online: https://www.theverge.com/2023/3/5/23626057/dji-discontinues-aeroscope-drone-detecting-system (accessed on 13 August 2024).
  20. ASTM International. Standard Specification for Remote ID and Tracking. 2022. Available online: https://www.astm.org/f3411-22a.html (accessed on 13 August 2024).
  21. Military Aerospace Electronics. What Are the ISM Bands, and What Are They Used For? 2019. Available online: https://www.militaryaerospace.com/directory/blog/14059677/what-are-the-ism-bands-and-what-are-they-used-for (accessed on 13 August 2024).
  22. Federal Aviation Administration. Advisory on the Application of Federal Laws to the Acquisition and Use of Technology to Detect and Mitigate Unmanned Aircraft Systems. 2020. Available online: https://www.faa.gov/sites/faa.gov/files/uas/resources/c_uas/Interagency_Legal_Advisory_on_UAS_Detection_and_Mitigation_Technologies.pdf (accessed on 13 August 2024).
  23. Federal Aviation Administration. Geographic Listing of Hobbyist & Non-Hobbyist Small Unmanned Aircraft Systems (sUAS) Registry Enrollments & Registrants. 2023. Available online: https://www.faa.gov/foia/electronic_reading_room/uas#registrants (accessed on 13 August 2024).
  24. Federal Aviation Administration. How to Register Your Drone. 2024. Available online: https://www.faa.gov/uas/getting_started/register_drone (accessed on 13 August 2024).
  25. Schmidt, B.; Vance, A.; DJI Won the Drone Wars, and Now It’s Paying the Price. Bloomberg. 2020. Available online: https://www.bloomberg.com/news/features/2020-03-26/dji-s-drone-supremacy-comes-at-a-price (accessed on 13 August 2024).
  26. Wallace, R.J.; Winter, S.R.; Rice, S.; Loffi, J.M.; Misra, S.; Lee, S.; Park, J.; Neff, A.; McNall, C. An Examination of sUAS Operations in Proximity to a Major U.S. Airport. Technol. Soc. 2024, 76, 102433. [Google Scholar] [CrossRef]
  27. Olivares, G.; Divo, E.; Shah, H.; Gomez, L.; Khalili, F.; Sathyanarayanna, N. Volume V: UAS Airborne Collision Severity Evaluation—Assessment of sUAS deflections Due to Aerodynamic Interaction with a 14 CFR Part 25 Commercial Aircraft. 2021. Available online: https://assureuas.com/wp-content/uploads/2021/06/VLQN0XH.pdf (accessed on 13 August 2024).
  28. Olivares, G.; Gomez, L.; Marco, R. Volume VII: UAS Airborne Collision Severity Evaluation—14 CFR Part 23 General Aviation. 2022. Available online: https://assureuas.com/wp-content/uploads/2021/06/Volume-VII-Airborne-Collision-Severity-Evaluation-14-CFR-Part-23-General-Aviation.pdf (accessed on 13 August 2024).
  29. Olivares, G.; Gomez, L.; Marco, R.; Ly, H.; Calderon del Rey, J.; Duling, C.; Zwiener, M.; Perrin, Z. Volume VI: UAS Airborne Collision Severity Evaluation—14 CFR Part 29 Rotorcraft. 2022. Available online: https://assureuas.com/wp-content/uploads/2021/06/Volume-VI-Airborne-Collision-Severity-Evaluation-14-CFR-Part-29-Rotorcraft.pdf (accessed on 13 August 2024).
  30. Campolettano, E.T.; Bland, M.L.; Gellner, R.A.; Sproule, D.W.; Rowson, B.; Tyson, A.M.; Duma, S.M.; Rowson, S. Ranges of Injury Risk Associated with Impact from Unmanned Aircraft Systems. Ann. Biomed. Eng. 2017, 45, 2733–2741. [Google Scholar] [CrossRef] [PubMed]
  31. Henderson, I.L.; Shelley, A. Examining unmanned aircraft user compliance with Civil Aviation Rules: The case of New Zealand. Transp. Policy 2023, 133, 176–185. [Google Scholar] [CrossRef]
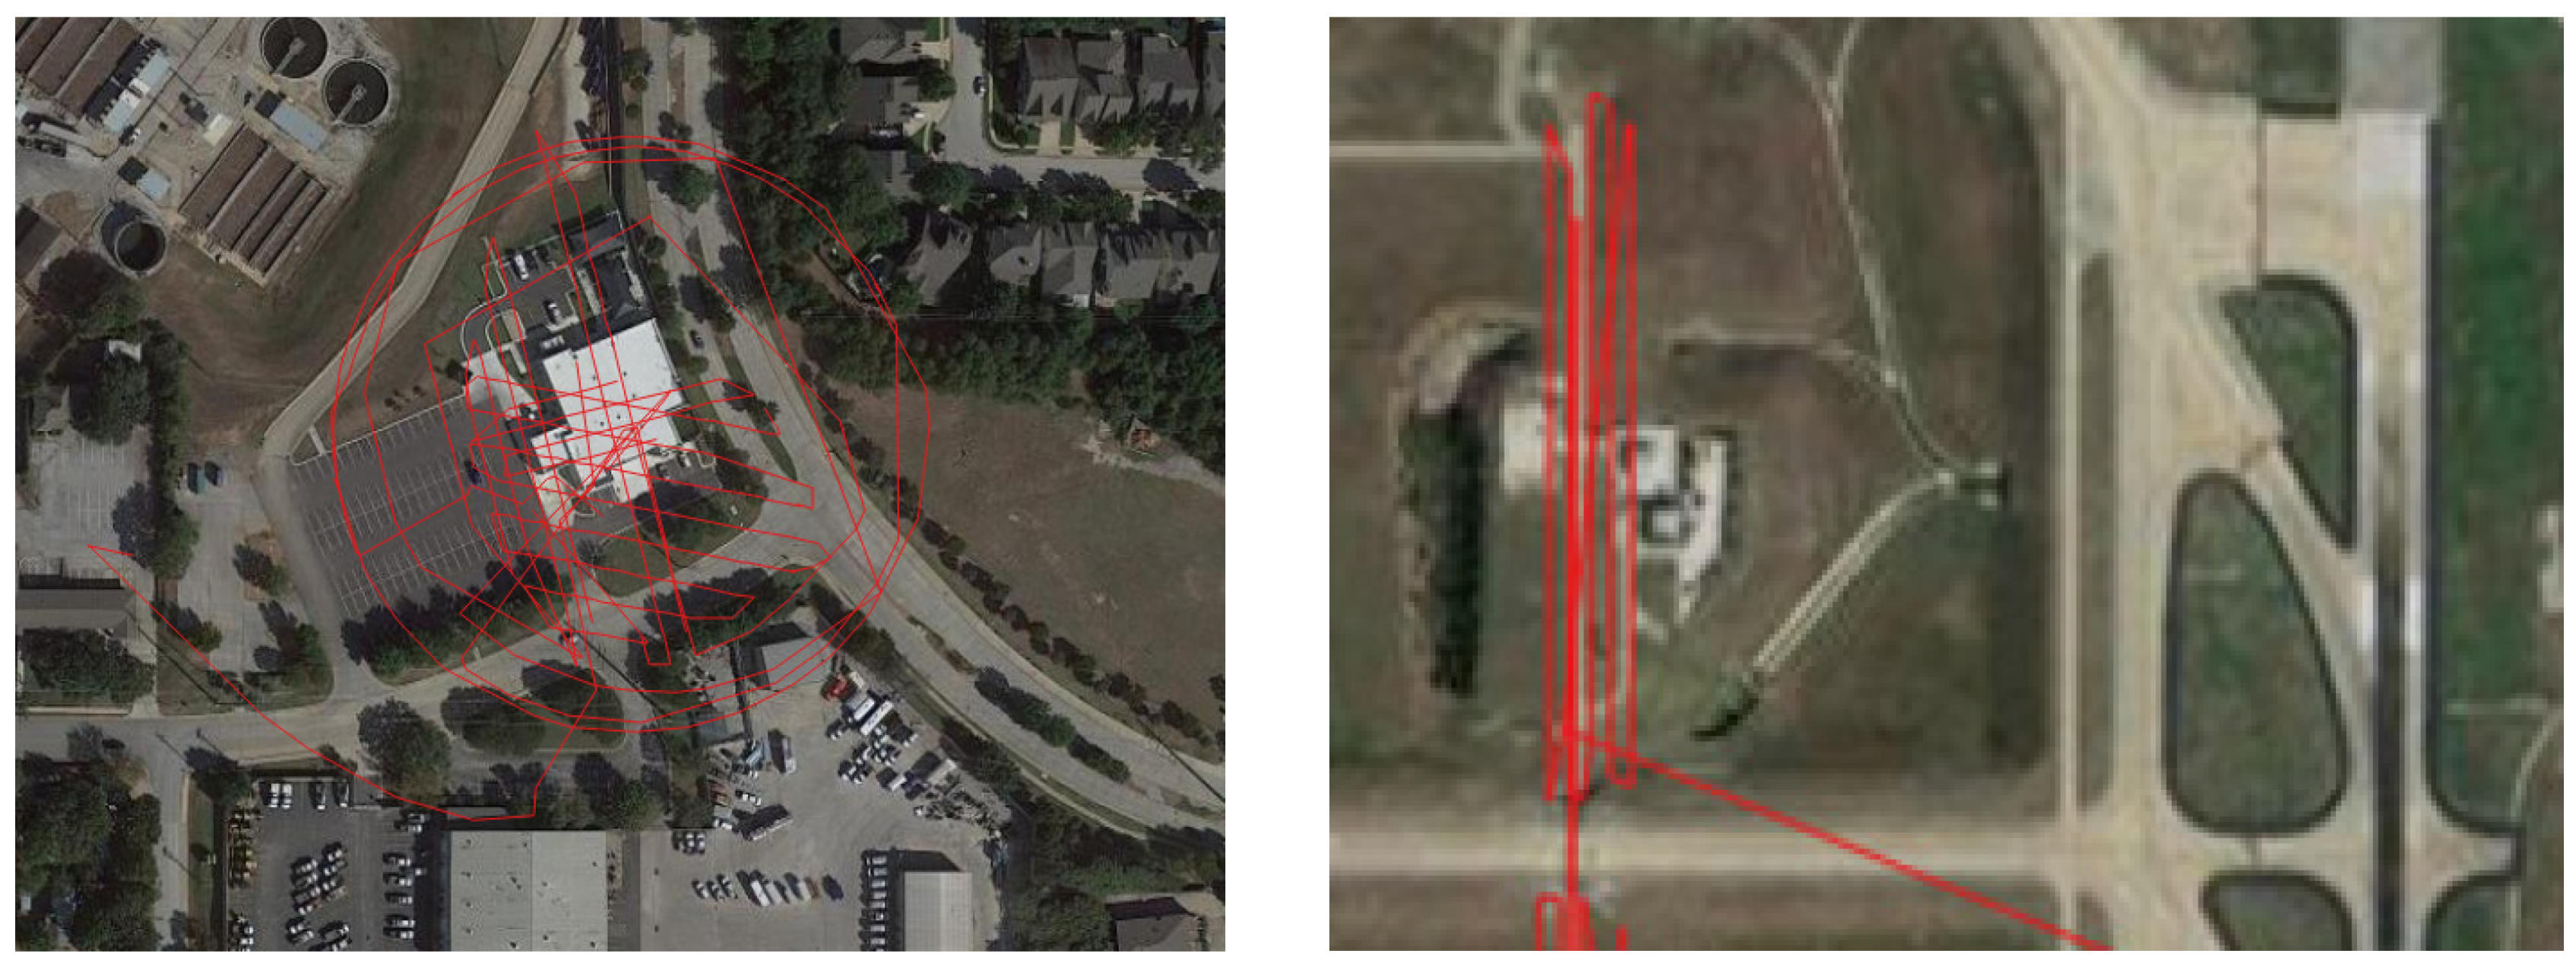
Figure 1. UAS telemetry samples for mission purpose identification.
Drones 08 00402 g001
Figure 2. Cumulative sUAS population by model. Note: Detections that did not provide model identification (n = 2293) were removed (N = 24,718).
Drones 08 00402 g002
Figure 3. Monthly sUAS population in collection area.
Drones 08 00402 g003
Figure 4. Monthly sUAS flights by sUAS platform.
Drones 08 00402 g004
Figure 5. Market entrants by model.
Drones 08 00402 g005
Figure 6. Cumulative sUAS population by weight. Note: N = 24,718. Note: The weight categories presented in Figure 6, Figure 7 and Figure 8 are mutually exclusive, and include sUAS below the threshold weight of the defined category, but exceeding the threshold weight of the next lighter category.
Drones 08 00402 g006
Figure 7. Distribution of sUAS platform flights by weight over time. N = 392,166.
Drones 08 00402 g007
Figure 8. Proportion of sUAS flights by weight over time. N = 392,166.
Drones 08 00402 g008
Figure 9. Active sUAS population within capture area. Note: (n = 18,210). Removed 6787 data points initially detected within six months of end of study to avoid left-skewing lifespan data. Removed 2014 data points within sample for lack of specified UAS platform information. Average monthly flight count by UAS model depicted by grey trend line on secondary axis.
Drones 08 00402 g009
Figure 10. Platform lifespan curve of select DJI sUAS platforms within sample area (months).
Drones 08 00402 g010
Figure 11. Initial and last platform detection month counts by UAS serial number. Note: Removed all initial detection data within past six months of project (n = 4584); same data excluded from last platform detection months to avoid artificially skewing lifespan lower than actuality. Gray trend line shows monthly net gain (initial detections)/loss (final detection) of platforms.
Drones 08 00402 g011
Disclaimer/Publisher’s Note: The statements, opinions and data contained in all publications are solely those of the individual author(s) and contributor(s) and not of MDPI and/or the editor(s). MDPI and/or the editor(s) disclaim responsibility for any injury to people or property resulting from any ideas, methods, instructions or products referred to in the content.