Article

Optimizing AoI in IoT Networks: UAV-Assisted Data Processing Framework Integrating Cloud–Edge Computing

College of Science, National University of Defense Technology, Changsha 410073, China
*
Author to whom correspondence should be addressed.
Drones 2024, 8(8), 401; https://doi.org/10.3390/drones8080401
Submission received: 12 June 2024 / Revised: 2 August 2024 / Accepted: 14 August 2024 / Published: 16 August 2024
(This article belongs to the Special Issue Advances in Perception, Communications, and Control for Drones)

Abstract

Due to the swift development of the Internet of Things (IoT), massive advanced terminals such as sensor nodes have been deployed across diverse applications to sense and acquire surrounding data. Given their limited onboard capabilities, these terminals tend to offload data to servers for further processing. However, terminals cannot transmit data directly in regions with restricted communication infrastructure. With the increasing proliferation of unmanned aerial vehicles (UAVs), they have become instrumental in collecting and transmitting data from the region to servers. Nevertheless, because of the energy constraints and time-consuming nature of data processing by UAVs, it becomes imperative not only to utilize multiple UAVs to traverse a large-scale region and collect data, but also to overcome the substantial challenge posed by the time sensitivity of data information. Therefore, this paper introduces the important indicator Age of Information (AoI) that measures data freshness, and develops an intelligent AoI optimization data processing approach named AODP in a hierarchical cloud–edge architecture. In the proposed AODP, we design a management mechanism through the formation of clusters by terminals and the service associations between terminals and hovering positions (HPs). To further improve collection efficiency of UAVs, an HP clustering strategy is developed to construct the UAV-HP association. Finally, under the consideration of energy supply, time tolerance, and flexible computing modes, a gray wolf optimization algorithm-based multi-objective path planning scheme is proposed, achieving both average and peak AoI minimization. Simulation results demonstrate that the AODP can converge well, guarantee reliable AoI, and exhibit superior performance compared to existing solutions in multiple scenarios.

1. Introduction

With the rapid advancements in microprocessor and network technologies, sensor-based terminals have become a crucial component of Internet of Things (IoT) systems [1,2]. Approximately millions of terminals are currently linked to IoT, generating gigabytes of data daily [3]. These devices revolutionize various fields through applications such as traffic management, environmental monitoring, and precision agriculture [4,5]. By combining real-time data collected by IoT devices with detailed architectural information in Building Information Modeling (BIM) systems, a highly accurate and dynamically updated digital twin (DT) system can be created [6]. In accordance with Moore’s Law, the computational and memory capabilities of IoT terminals continue to advance; however, their growth rates still fall behind the rapid expansion of data processing needs [7]. To tackle this difficulty, cloud computing has arisen as a promising resolution, allowing data with high computational demands to be offloaded to powerful cloud centers [8]. Nevertheless, the ever-increasing number of IoT terminals and the exponentially growing traffic demand pose potential issues such as network congestion, high latency, and compromised quality of service within the cloud [9]. This is primarily due to the centralized nature of remote cloud infrastructure, which contrasts with the distributed placement of data-intensive IoT terminals, a significant portion of which requires real-time processing. Conversely, edge computing, dispersed geographically and located closer to terminals, facilitate direct data computation and analysis at the edge, to some extent mitigating the limitations of cloud computing [10].
In current research, there has been a proliferation of studies centered on offloading computations for data processing [11,12,13,14,15]. In [16], Hu and Xiao constructed a cloud-based computational task scheduling model according to task priorities, aiming to achieve task offloading with a focus on minimizing the execution time. And Liu et al. [17] intended to reduce the total execution cost in scenarios with constrained CPU computing resources through offloading tasks to edge cloud. Overall, these studies typically address the limitations in terminal computing capabilities and energy constraints by exploring the offloading of complex data processing tasks to either local servers or remote cloud, aiming to decrease processing duration and power usage at the expense of increased transmission delay.
Note that high-complexity computation-intensive data may be processed more rapidly at remote cloud centers than at edge servers. However, the trade-off involves augmented transmission delay during the data transfer to the cloud servers. To tackle these challenges, we adopt a hybrid cloud–edge architecture for addressing distributed large-scale data processing, offering the flexible handling of computation-intensive and delay-sensitive data. Several studies have been dedicated to the design of intelligent offloading solutions in such cloud–edge hierarchical architectures, aiming to optimize the offloading performance [18,19,20,21]. Zhou et al. [22] modeled the interaction between edge and cloud servers using a Stackelberg game, and developed an offloading incentive mechanism in cloud–edge computing networks to maximize the system performance. In [23], Zhu et al. proposed a method for empowering resource-constrained multi-robot systems to handle complex tasks by harnessing the advantages of computing technology on the cloud and edge. In essence, these studies systematically consider the purpose of offloading to enhance the performance of the system. Yet still these studies are primarily grounded on the assumption that communication-capable terminals can directly access the network and transfer data to servers for processing. Nonetheless, in the context of smart cities, Agriculture 4.0, and similar applications, a significant number of on-demand deployed IoT terminals are utilized for environmental monitoring. These terminals, however, encounter limitations, as they are unable to directly communicate with the infrastructure, including servers at the edge [24]. Consequently, significant challenges exist in efficiently offloading data to the edge server for these deployed terminals.
Fortunately, recent years have witnessed rapid advancements in intelligent Unmanned Aerial Vehicles (UAVs), demonstrating cost-effectiveness, ease of operation, and controllable mobility [25,26]. UAVs can fly and collect sensor data to conduct monitoring activities within a region where IoT terminals are in use [27], which can be used to generate geometric models, enriching the semantic environment of the DT system [6]. This is crucial for achieving precise real-time monitoring and management. Moreover, they can collaboratively assist the passive IoT terminals in completing data transmission and offloading, thereby presenting substantial potential for critical applications. Furthermore, integrating UAVs into the architecture offers a novel solution to the challenges associated with offloading data to edge servers in scenarios where direct communication between terminals and servers is not feasible. This innovative approach not only enhances the efficiency of data transmission and processing, but also opens up new possibilities for addressing the limitations of traditional offloading methods.
However, in the rapidly evolving landscape of IoT and smart city applications, the freshness of information is paramount for timely decision-making and efficient operations. For instance, timely data on environmental conditions, such as temperature, humidity, and air quality, is crucial for maintaining optimal conditions in smart buildings and industrial processes. Therefore, with the time elapsed between the generation and delivery of information, and subsequently its processing carries substantial implications, the Age of Information (AoI) gives rise to and provides a metric for quantifying the freshness of information across various applications [28,29], including UAV-assisted wireless sensor networks, disaster relief operations, and real-time monitoring systems. Our research presents a comprehensive suite of scalable methods and insightful results concerning the generation of information-update packets at sensors, the design of efficient mechanisms for forwarding these packets to their destinations, and their computation analysis. This approach optimizes multi-UAV assisted data collection, path planning, and offloading decision-making, ultimately determining the reliability and stability of the system. To be specific, we introduce two metrics in terms of AoI to assess real-time data transmission and processing. One metric is the average AoI (AAoI), another is the peak AoI (PAoI). AAoI is formulated as the average time interval between the arrival of all sensor data at the receiving end within a specific period, PAoI represents the maximum time difference at which information arrives at the receiving end within a specific period. By analyzing the AAoI, the performance of information processing over time can be well evaluated, further providing valuable insights to optimize the stability and overall performance of information processing. The PAoI can be assessed to identify potential extreme data processing solutions, which allows for proactive measures to reduce the PAoI.
Particularly in densely distributed IoT terminal regions, a single UAV’s energy and mobility may not be sufficient to collect data from all terminals before returning to the control station (CS) for recharging, resulting in unsatisfied AoI. Therefore, cooperative efforts of multiple UAVs become essential to collect data within the region effectively, and strategically planning the trajectories of UAVs is crucial in optimizing the AoI. Taking into account the aforementioned analysis, it becomes clear that the distribution of IoT terminals can impact the flying distance of multiple UAVs. Additionally, the limited energy of these UAVs must be considered when planning their trajectories. Furthermore, the flexibility in determining whether the collected data should be offloaded in nearby edge server or processed on remote cloud is also of critical importance. These factors underscore the complexity and practical challenges involved in optimizing AoI of data processing for multi-UAV systems in IoT environments. Table 1 presents a comparative analysis of related studies and our proposed.
We study the data processing problem of a wireless sensor network system supported by multiple UAVs within the cloud–edge hierarchical architecture. Specifically, in order to expedite data collection and conserve energy, a novel sensor node (SN) clustering scheme is developed, where the SN locations and uploading time are ingeniously taken into consideration to effectively optimize the hovering position (HP) and establish associations between SNs and HPs. To further minimize the AoI of sensor data and UAVs’ energy usage, we design an HP clustering framework to enhance the optimal associations between HPs and UAVs. Then, a gray wolf algorithm-based multi-objective solution is developed to run with the clustering mechanism interactively, achieving the optimal trajectory planning, offloading decision-making, and simultaneous optimization of AAoI and PAoI.
We present the main contributions of the paper as follows:
  • To ensure the freshness of information in the IoT, we develop a multi-UAV-enabled cloud–edge hierarchical data processing framework to minimize the AAoI and PAoI. It can be achieved by jointly optimizing the uploading order, service associations, and UAVs’ trajectories, while making informed computation offloading decisions considering UAVs’ operational endurance constraints.
  • Building on the above framework, we devise an SN clustering model that considers SN geo-distributions and minimal uploading time to determine the optimal uploading order of SNs and the HPs. In addition, we develop an HP clustering scheme to dynamically adjust HP-UAV service associations, taking into account the processing time and energy consumption required for UAV task completion.
  • According to the HPs and the service association on HP-UAV, we propose an intelligent multi-objective strategy by improving the gray wolf optimization algorithm, which explores the better UAVs’ flight trajectories at every HP cluster to further optimize the AAoI and PAoI.
  • Simulation results demonstrate that our proposed AODP is able to efficiently accomplish data collection and processing under various parameter settings; it also has superiority in optimizing PAoI and AAoI and ensuring the energy saving of UAVs compared with four mainstream algorithms.
The rest of this paper is structured as follows: In Section 2, we present the system model, construct models regarding the AoI and energy, and formulate the optimization problem. Section 3 presents the proposed AODP frameworks and describes its operation mechanism, as well as analyzes the devised service association and path planing algorithms. Finally, Section 4 analyzes effectiveness of the AODP proposed and Section 5 summarizes this paper.

2. System Model and Problem Definition

2.1. System Model

As depicted in Figure 1, our study explores a scenario involving multiple UAVs enabled for aerial ecological monitoring. To ensure comprehensive area coverage and efficient data processing, UAVs operate synchronously to process data across the monitoring area. The UAV fleet is collectively represented as U = 1 , , U , while the data sources are a set A of IoT-based SNs, denoted as A = 1 , A . In a 2D space, each UAV’s coverage area is approximated as a circle centered on the projection of its hovering position (HP). A UAV stationed at an HP can communicate with SNs within a radius r u . Consequently, the UAVs implement a fly-and-hover strategy, departing from a control station (CS) and traversing through various predetermined HPs to collect the data newly sampled from the SNs associated to each HP on their flight paths.
If a UAV hovers every time it collects data from a single SN, this would significantly increase hovering instances, leading to higher energy consumption and longer task completion durations. To enhance area coverage and manage energy more efficiently, each UAV at a Hovering Point (HP) interacts with multiple IoT-based SNs within its coverage radius to gather monitoring data. Each SN packages the sampled data into a timestamped packet before uploading it to the UAV. After completing data collection from a series of HPs following a specific sequence across their trajectories, the UAVs return to the CS for further data offloading and analysis. Decisions on whether to process data locally at the ground server (GS) or transmit it to a remote cloud center (RCC) are based on data processing time and energy constraints. Therefore, for each UAV, the data processing procedure consists of: (1) flight procedure; (2) data collection operation; and (3) data offloading. This ensures flexibility in data handling and rapid response to environmental changes perceived by the SNs. Furthermore, an SN located within the coverage area of multiple UAVs is restricted to forming service association with only one UAV to avoid redundancy. To facilitate cooperative detection, UAVs are enabled to communicate with their adjacent counterparts, sharing information such as current positions, flight paths, and remaining energy. This inter-UAV communication allows for dynamic coordination, where UAVs can adjust their selection of SNs and determine the optimal HPs for service association, which in turn collaboratively decides their flight paths.
Additionally, in a three-dimensional coordinate system, the position of SN a A is denoted as C a = [ x a , y a , 0 ] , and the coordinate of an HP b B as C b = [ x u , y u , z u ] ; where z u indicates the altitude of the UAV, assumed to be the same for all UAVs to facilitate deployment. The horizontal distance from SN a to the UAV at HP b is calculated as d a , u b = ( x a x u ) 2 + ( y a y u ) 2 , with the constraint d a , u b r u . We include all HPs to be designed for the UAVs in the set B = { 1 , , B } . A binary variable ζ a , b = 1 indicates the establishment of a service association between SN a A and HP b B ; otherwise, ζ a , b = 0 . Similarly, the association establishment between an HP and a UAV is represented by η b , u = 1 ; otherwise, η b , u = 0 . As a result, we include the SNs associated with an HP b in the set A b = { a | ζ a , b = 1 , a A } and denote the HPs associated with a UAV in the set B u = { b | η b , u = 1 , b A } . In the event that a UAV stationed at an HP b has completed the collection of the data from all SNs in A b , the binary variable A ˜ b = 1 ; otherwise, A ˜ b = 0 .

2.2. Communication Model

For communication transmission, we consider the impact of obstacles and buildings in the environment on air-to-ground (A2G) signal propagation. In addition, during UAV placement, our focus is on the long-term variation of channel state information rather than instantaneous information transmission. Therefore, this study employs a probability path loss model to characterize the large-scale fading channel.
When UAV u is located at a certain position in the air to gather the data packet from SN a on the ground, let Γ ( d a , u ) denote the A2G path loss, which is calculated as [30,31]
Γ ( d a , u ) = δ 0 d a , u 2 χ l o s , los l i n k w i t h P a , u l o s δ 0 d a , u 2 χ n l o s , nlos l i n k w i t h P a , u n l o s
in which δ 0 = 4 π f c c , the variable f c stands for the carrier frequency, while c signifies the speed of light, χ l o s and χ n l o s denote the additional mean signal degradation for the Line of Sight ( l o s ) and Non-Line of Sight ( n l o s ) connections, respectively. Further, d a , u = ( x a x u ) 2 + ( y a y u ) 2 + z u 2 expresses spatial distance from UAV u to SN a. P a , u l o s and P a , u n l o s , respectively, represent the probability of l o s and n l o s communication links between UAV u and SN a. P a , u l o s can be expressed as follows:
P a , u l o s = 1 1 + ϕ 1 exp ( ϕ 2 [ 180 π arcsin ( z u d a , u ) ϕ 1 ] )
where ϕ 1 and ϕ 2 are two environmental constants associated with the wireless transmission, arcsin ( z u d a , u ) indicates the UAV’s elevation, P a , u n l o s = 1 P a , u l o s . Then, the expected path loss is given by
Γ ¯ ( d a , u ) = δ 0 d a , u 2 ( χ l o s P a , u l o s + χ l o s P a , u n l o s )
As a result, when SN a uploads a data packet to UAV u located at an HP b, denoting the channel bandwidth as B w a , SN’s transmission power as P a , t r and defining the noise power by σ u 2 , then the data rate is evaluated by
v a , u = B w a log 2 ( 1 + P a , t r / Γ ¯ ( d a , u ) σ u 2 )
Additionally, assuming the channel bandwidth is represented by B w u , the UAV’s transmission power as P u , t r , and defining the noise power as σ s 2 , the wireless data rate between a UAV and edge server is given by
v u , s = B w u log 2 ( 1 + P u , t r / Γ ¯ ( z u ) σ s 2 )

2.3. AoI Model

Let D a denote the size of the compressed and packaged sensed data. The time for collectting data from SN a by the UAV at HP b is given by
l a , b = E [ ζ a , b η b , u D a v a , u ] , u , b , a
in which E ( · ) denotes the expectation of path loss Γ ( d a , u ) . Further, the binary variables ζ a , b and η b , u represent service associations, ζ a , b = 1 confirms that SN a A is associated with HP b B , and η b , u = 1 indicates that the UAV u will stay at HP b B to collect data from SN a.
Compared to the time consumed for data uploading and flight, the SN’s data compression and packaging time can be disregarded. If time division multiple access method is adopted for uploading data, the uploading time of the SNs is solely dependent on the size of data packet. Subsequently, utilizing the SN-HP and HP-UAV associations, the UAV’s total duration of data collection is given by
L u c o l = b = 1 | B u | a = 1 | A b | l a , b = b = 1 | B u | a = 1 | A b | E [ ζ a , b η b , u D a v a , u ]
The total amount of data for the UAV to offload upon returning to CS is given by b = 1 | B u | a = 1 | A b | A ˜ b D a . Thus, the time of UAV u for offloading to the edge server is evaluated by
L u , s t r = E [ b = 1 | B u | a = 1 | A b | A ˜ b D a v u , s ]
Let c a represent the computational resources needed to process one bit of data and φ s c a p denote the computational capability of server s. Hence, the data processing time is given by
L u , s c o m = b = 1 | B u | a = 1 | A b | A ˜ b D a c a φ s c a p
When edge server further transmits the data received from UAV to RCC for analysis, since the high-speed fiber communication connections linking server s and RCC, the data rate between them, designated as v s , r c c , is commonly a fixed value. Hence, the transmission time from the UAV to RCC is determined by
L s , r c c t r = E [ b = 1 | B u | a = 1 | A b | A ˜ b D a v s , r c c ]
Let denote the computational capability of RCC as φ r c c c a p , indicating the CPU chip’s clock frequency the computing time needed for analyzing the data on RCC can be expressed as
L u , r c c c o m = b = 1 | B u | a = 1 | A b | A ˜ b D a c a φ r c c c a p
Hence, the time duration for UAV to accomplish data offloading and computing analysis using one of offloading modes can be denoted by Equation (12). Given the the server’s robust transmission capacity and the minimal data output, the duration for transmitting the analytical results of the monitoring area can be disregarded.
L u o f f = L u , s t r + L u , s c o m , υ = 0 ( e d g e c o m p u t i n g ) L u , s t r + L s , r c c t r + L u , r c c c o m , υ = 1 ( c l o u d c o m p u t i n g )
As shown in Figure 2, we illustrate the time sequence that depicts the data processing procedure of the UAV in the scenario. In Figure 2, L c s , b 1 f l i g h t represents the UAV’s flight time from the CS to the first HP to be visited, and l A b [ 1 ] , b 1 expresses the duration for the UAV u to collect data from the first associated SN at HP b 1 B u . Similarly, L b , b + 1 f l i g h t denotes the flight time from the b-th HP to ( b + 1 ) -th HP associated with UAV, while L b , c s f l i g h t indicates time duration of the returning trip from the final HP to CS.
From the above analysis, the time needed by the UAV for completing the task of data collection and offloading can be denoted as follows:
L u a l l = L c s , b 1 f l i g h t + L u c o l + b = 1 | B u | 1 L b , b + 1 f l i g h t + L b , c s f l i g h t + L u o f f L ^
Due to the implementation of a generate-at-will model as described in [17], each SN can produce data for upload at any moment. Data sampling for each SN is event-activated, triggered when the UAV hovers overhead and establishes a communication link with the SN. The SN then packages the data into time-stamped packets before uploading them to the UAV to ensure information freshness. The time needed for sampling and communication delay for each SN is minimal compared to the time required for data upload and the UAV’s flight time, thereby having a negligible impact. We adopt ξ a u ( t ) to represent the AoI of the SN a at any time t. Then, at any time t, the AoI for SN a, designated as the j-th upload associated with the k-th HP on the UAV’s trajectory, is formally expressed as
ξ a u ( t ) = ξ j k = ( t t j k ) + , ( x ) + = max { 0 , x }
where t j k represents the moment when the data are sampled and produced by the j-th SN.
The AoI of the SN is influenced by the moment t j k . If we use T k to represent the moment when the UAV reaches the k-th HP in its flight path. By disregarding the time taken for sampling and building communication link, we can assume t 1 k = T k for the first SN scheduled by the k-th HP. Upon arrival at the CS, the UAV offloads the data for analysis immediately. Thus, at the moment that the data processing is completed by the UAV, the AoI for SN a, designated as the j-th upload associated with the k-th HP on the UAV’s trajectory, is computed as
ξ a u = ξ j k ( t ) = a = A b [ j ] | A b | l a , b + b = B u [ k + 1 ] | B u | a = 1 | A b | l a , b + b = B u [ k ] | B u | 1 L b , b + 1 f l i g h t + L b , c s f l i g h t + L u o f f
where the first two components is the duration for uploading the sensed data starting from this SN a, the next two items account for the UAV’s travel time starting from the k + 1 -th HP, while the final term represents the data offloading and processing time. In addition, a a , a = A b [ j ] , a A b , b = B u [ k ] , b + 1 B u .
The AAoI of the data for all SNs is given by
ξ ¯ = 1 A u = 1 U a = 1 A ξ a u
The PAoI is denoted as the age at which the corresponding data are initially uploaded to the UAV among all SNs, which can be computed by
ξ ^ = max u U b = 1 | B u | a = 1 | A b | l a , u u p + b = 1 | B u | 1 L b , b + 1 f l i g h t + L b , c s f l i g h t + L u o f f

2.4. Energy Usage Model

The UAV’s total energy consumption comes mainly from its propulsion process, collecting and offloading data. The energy used for data collection is minimal when compared to the propulsion energy, amounting to just a few watts compared to several hundred watts; therefore, it can be excluded from the energy usage model. Additionally, as the UAV maintains steady velocity or hovers while collecting data, the duration of acceleration or deceleration is brief, resulting in relatively minimal energy usage during these periods. As a result, the energy usage for acceleration or deceleration of the UAV can be disregarded, then the UAV’s propulsion power model is expressed as [32]
P ( x ) = w 0 ( 1 + 3 x 2 x t i p 2 ) + w 1 ( 1 + x 4 4 x ˜ 0 4 x 2 2 x ˜ 0 2 ) + 1 2 d r ρ r s r d x 3
In Equation (18), for a UAV, the speed is denoted as x, w 0 and w 1 , respectively, indicate the aerodynamic profile power and induced power of UAV. The above formula still applies when the UAV is hovering.
Additionally, x t i p indicates the rotor blade tip speed, x ˜ 0 expresses the average rotor induced speed during hovering, and d r represents a fuselage drag coefficient. The air density can be denoted as ρ , r s stands for the rotor solidity, and while r d corresponds to the rotor disc area.
Furthermore, when UAV performs task, the energy consumption for propulsion can be divided into flying and hovering energy consumption, where the energy consumed for flight is formulated as
E u f l i g h t = ( L c s , b 1 f l i g h t + b = 1 | B u | L b , b + 1 f l i g h t + L b | B u | , c s f l i g h t ) P ( x )
The hovering energy consumption for the UAV is modeled as
E u h o v e r = b = 1 | B u | a = 1 | A b | l a , b P ( x | x = 0 ) = b = 1 | B u | a = 1 | A b | l a , b ( w 0 + w 1 )
The energy consumed for transmitting data by the UAV can be expressed as
E u o f f = P u t r L u , s t r
From the above analysis, the energy consumption restriction of the UAV can be expressed as
E u a l l = e u f l i g h t + e u f o v e r + e u o f f E ^ u

2.5. Problem Definition

The AoI optimization problem in multi-UAV-supported ecological monitor system is considered, the AAoI and PAoI of SN’s data illustrate different features, respectively. The AAoI showcases the overall AoI trend of all SNs, the PAoI refers to the age of the SN that is collected earliest by the UAV, acting as an upper bound for AoI. Consequently, AAoI provides a measure of overall system performance, reflecting the general freshness of the information across the sensor network; PAoI addresses the worst-case scenario where the maximum delay in updating information can critically affect decision-making processes. Balancing these two metrics is crucial to enhance the responsiveness and effectiveness of data collection performance. Therefore, the aim of this paper is to minimize the AAoI and PAoI by jointly finding appropriate a set of HPs B , establishing SN-HP association η = { η b , u , b , u } , determining the uploading sequence of SNs ( ϑ = { A b [ n ] , 1 n | A b | , A b A , b B u , u U } ), planing the UAV’s trajectory ( ς = { ς u | ς u = { B u [ n ] , 1 n | B u | } ), and selecting computing mode ( υ = { υ u , u U } ). We formulate the problem as follows:
P 1 : min B , ϑ , ς , υ ξ ¯ ( B , ϑ , ς , υ ) = 1 A u = 1 U a = 1 A a = A b [ j ] | A b | l a , u u p + b = B u [ k + 1 ] | B u | a = 1 | A b | l a , u u p + b = B u [ k ] | B u | 1 L b , b + 1 f l i g h t + L b , c s f l i g h t + L u o f f P 2 : min B , ϑ , ς , υ ξ ^ ( B , ϑ , ς , υ ) = min B , ϑ , ς , υ max u U b = 1 | B u | a = 1 | A b | l a , u u p + b = 1 | B u | 1 L b , b + 1 f l i g h t + L b , c s f l i g h t + L u o f f s . t . C 1 : E u a l l ( B , ϑ , ς , υ ) E ^ u , u U C 2 : L u a l l ( B , ϑ , ς , υ ) L ^ , u U C 3 : b = 1 B ζ a , b = 1 , a A C 4 : u = 1 U η b , u = 1 , b B C 5 : u = 1 U b = 1 B a = 1 A ζ a , b η b , u A C 6 : f s , u c a p ( t ) φ s c a p , u U
where l a , u u p indicates the uploading time of SN a to UAV u, which is evaluated by Equation (6), the optimization problems P 1 and P 2 are subject to several constraints. C 1 specifies the UAV’s energy consumption and C 2 expresses the delay constraint; C 3 stipulates that every SN is exclusively associated with only one HP during uploading data packet; C 4 means that one HP is allowed to be visited by only one UAV at the same period; C 5 limits the SNs in HPs visited by all UAVs to no more than the total number of SNs in system. Finally, C 6 states that the computing resources allocated to a UAV at any given time slot should not surpass the server’s maximum computing capacity.
Solving the above mixed integer nonlinear problems using a convex optimization algorithm presents challenges for the reasons that (1) the scale of η b , u and η b , u varies with the number of distributed SNs; (2) the optimization objectives are influenced by trajectory design and the SN-HP association. Thereby, we devise an effective algorithm for solving these complex problems in the following section.

3. Solution Design

In this section, we partition the optimization problem into multiple sub-problems. Following this, we study the solutions to these sub-problems and explore the optimal strategies.

3.1. Joint SN Clustering and HP Exploration Scheme Using the Affinity Propagation (AP) Algorithm

With the aim of minimizing the overall uploading time of SNs using the Affinity Propagation (AP) algorithm, we develop a joint SN clustering and HP exploration scheme, called JSCHE, this model will identify appropriate SN clusters and cluster centers to establish the service association SNs-HPs between SNs and HPs to collect sensor data. The coverage radius r u affects the number of SNs within its range that can be accessed for data collection. Therefore, in JSCHE, as shown in Equation (24), we include the SNs that can be regarded as the neighbors of SN a in a set N ( a ) , where C a C b expresses the spatial distance between SN a and b. In addition, we define N + ( a ) = { a } N ( a ) .
N ( a ) = { b | C a C b   r u , a b , a , b A }
Then the optimization problem to be addressed in the JSCHE model is further defined by Equation (25).
min ζ a , b a = 1 A a = 1 A ζ a , b l a , b + ϖ a = 1 A ζ b , b s . t . C 7 : b N + ( a ) ζ a , b = 1 , a , C 8 : ζ b , b = max a N + ( a ) ζ a , b , b , C 9 : ζ a , b { 0 , 1 } ,
in which ζ a , b signifies that SN b is selected as the cluster center of SN a, l a , b expresses the uploading time of SN a to the UAV hovering over SN b, while ϖ indicates a weight coefficient, and ϖ > 0 , signifying the potential of SNs to serve as cluster centers, also known as the horizontal positions of HPs. Further, some main constraints are presented, where C 7 guarantees that each set of the SNs possesses a cluster head, C 8 specifies that certain SNs can be designated as cluster heads. and C 9 ensures that the SN-HP association is limited to binary values of 0 and 1, determining their association status.
In the JSCHE scheme, the clustering operation involves message exchanges between neighboring SNs, i.e., (1) SN a transmits message ϑ a , b to SN b, expressing the extent to which SN b can be the cluster head covering SN a. (2) SN i transmits message π a , b to SN a, indicating the suitability of SN a as the cluster head for the cluster to which SN b belongs. Let l a , b represent the parameter corresponding to the objective in Equation (25), expressed as
l a , b = l a , b ϖ a = b l a , b a b
The iterative update of the messages is represented as
π a , b = j N ( b ) max ϑ j , b , 0 , a = b min 0 , ϑ b , b + j N ( b ) { a } max { ϑ j , b , 0 } , a b
ϑ a , b = l a , b max j N + ( a ) { b } { l a , j + π a , j }
Once convergence is achieved, SN b is designated as a cluster head if π b , b + ϑ b , b exceeds zero, and we obtain a group of cluster heads and their corresponding indexes, which can be represented as
B = { b | π b , b + ϑ b , b > 0 }
Consequently, the scheme obtains B = | B | clusters, and each SN a is grouped together with a cluster head b that satisfies the condition b = arg min b B l a , b , and the SN-HP service ζ = [ ζ a , b ] association is established correspondingly. Using this clustering outcome, a series of HPs B alongside their respective locations { C b } can be derived, i.e., C b = arg min { C b } max { a | ζ a , b = 1 } C a { C b } . In view of the above, Algorithm 1 concludes the flow of the devised JSCHE scheme.

3.2. Improved Expectation-Maximization Algorithm for Gaussian Mixture Models-Based HP-UAV Association Scheme

In our work, the number of UAVs needed to be deployed accounts for the amount of HP clusters; therefore, it is necessary to study how to construct the optimal association between multi-UAVs and HPs, i.e., HP-UAV association, so as to determine the HPs that the UAV should stay to collect data. We devise a new improved expectation-maximization (IEM) algorithm for optimizing the Gaussian Mixture Model (GMM)-based HP clustering, named HUAEM scheme. According to the spatial distribution of HPs and CS on the ground, the HPs can be divided into clusters with similar distance features. For the GMM in HUAEM, relative distances between HPs and CS is considered as the observed data, which is formulated as a mixture probability distribution from distinct Gaussian distributions, and each Gaussian distribution component represents an HP cluster. Thereby, the distance from all HPs to CS can be expressed by { d b } = { b | C b C s b B } , which constitutes observed data d = { d 1 , , d B } . We assume that the d b comes from one of K Gaussian distributions with unknown parameters; here, K refers to the number of HP clusters, then the GMM is given by
P ( d ρ ) = k = 1 K w k f ( d ρ k ) , ρ k = ( μ k , σ k 2 ) , k = 1 , , K
where w k is a weight parameter, w k [ 0 , 1 ] , f ( d ρ k ) signifies the Gaussian density function, while μ k and σ k 2 , respectively, denote the mean and variance in the Gaussian component k.
Algorithm 1 JSCHE: Joint SN Clustering and HP Exploration Scheme based on AP Algorithm
Input: 
r u , ϖ , t m a x , C a = [ x a , y a , 0 ] and a A ;
Output: 
B , { C b } , ζ = [ ζ a , b ] .
1:
Initialize ϑ a , b = 0 , π a , b = 0 , ζ a , b = 0 , t = 0 ;
2:
Evaluate uploading time l a , b of SN a by Equation (6);
3:
while  t < t m a x   do
4:
   Compute ϑ a , b and π a , b by Equations (27) and (28);
5:
   if convergence reaches then
6:
     Break;
7:
   else
8:
      t t + 1 ;
9:
   end if
10:
end while
11:
if any ϑ b , b + π b , b > 0  then
12:
    b B , compute SN-HP association ζ = [ ζ a , b ] ;
13:
end if
14:
Explore the all HPs’ coordinates { C b } by C b = arg min { C b } max { a | ζ a , b = 1 } C a { C b } ;
Then, using the likelihood estimation of the observed data, the HUAEM iteratively updates the parameters ρ k and w k of K Gaussian distributions. The iterative updating is presented as following steps:
(1) Set number of HP clusters K, randomly initialize GMM parameters ρ k = ( μ k , σ k 2 ) and w k .
(2) Based on the parameters ρ k and w k , evaluate the response of the Gaussian component k to the observed data d b , given by
R ^ b , k = w k f ( d ρ k ) k = 1 K w k f ( d ρ k ) , b , k
According to the R ^ b , k , the scheme proposed will include the HP to a Gaussian component with the highest response degree.
(3) For each Gaussian component, update the parameters by Equations (32)–(34), respectively.
μ ^ k = b = 1 B R ^ b , k d b b = 1 B R ^ b , k , b , k
σ k 2 = b = 1 B R ^ b , k ( d b μ k ) 2 b = 1 B R ^ b , k , b , k
w ^ k = h = 1 H R ^ b , k B , b , k
(4) Assuming the probabilities that HP b are contained in clusters k and k as P k ( b ) and P k ( b ) , respectively. For a HP, considering that when the probability of being classified into two clusters is close, the probability of misclassification is higher; conversely, the probability of misclassification is lower. Therefore, we use the relative entropy to evaluate the difference between P k ( b ) and P k ( b ) , which is regarded as a measure for evaluating clustering performance. The greater its value, the more elevated the credibility to the clustering outcome; otherwise, the credibility is lower. The relative entropy for P k ( b ) and P k ( b ) is represented as
τ b ( P k ( b ) P k ( b ) ) = b P k ( b ) log 2 P k ( b ) P k ( b )
where τ b is 0 when P k ( b ) = P k ( b ) , otherwise τ b is greater than 0. The HUAEM counts the number of samples during iteration, represented as S t , for which the relative entropy τ b is less than a specific threshold ε . We calculate the relative entropy using the two largest probability values, which is vital in mitigating the potential for misclassification of the HPs.
The following formula is used to count S t , given by the following functions:
f t ( d b ) = 1 , τ b ( P k ( b ) P k ( b ) ) < ε 0 , τ b ( P k ( b ) P k ( b ) ) ε
S t = b = 1 B f t ( d b )
When S t reaches a minimum value in a certain iteration t, the optimal parameters μ ^ k , σ k 2 and w ^ k for any k are obtained. Therefore, if S t S t 1 and S t S t + 1 , the algorithm converges after completing t-th iteration, and produces HP-UAV association result η = { η b , u , b , u }. In view of the above discussion, Algorithm 2 summarizes the flow of the proposed HUAEM scheme.
Algorithm 2 HUAEM: HP-UAV Association Optimization Scheme based on IEM Algorithm
Input: 
Coordinates of CS and HPs: C s , C b , b B , relative entropy’s threshold ϵ , maximum iterations t m a x , number of HP clusters K, t = 1 ;
Output: 
HP-UAV associations η = { η b , u , b , u Initialize GMM parameters ρ k and w k randomly, k Evaluate observed data d = { d 1 , , d B } .
1:
while  t < = t m a x   do
2:
   Evaluate R ^ b , k using Equation (31);
3:
   Update parameters μ ^ k , σ k 2 , w ^ k by Equations (32)–(34);
4:
   Determine S t using Equations (35)–(37) by comparing the relative entropy between P k ( b ) and P k ( b ) with ϵ ;
5:
   if  S t S t 1 and S t S t + 1  then
6:
     Break;
7:
   else
8:
      t t + 1 ;
9:
   end if
10:
end while

3.3. AoI-Oriented Multi-Objective Gray Wolf Optimization for Path Planing

Planning appropriate paths for multi-UAVs is crucial in minimizing the combinatorial optimization problem defined in Equation (23). To tackle this issue, we design a path planning model based on multi-objective gray wolf optimization (GWO), named PMGWO, and propose an intelligent path planning algorithm with respect to the PMGWO model.
GWO model is lead by the hunting behavior of gray wolves, where each gray wolf represents a potential solution, and the gray wolves are categorized into four ranks represented by α , β , δ , and ω . The top three wolves with the highest fitness values are labeled as α , β , δ wolves, while the remaining wolves are referred to as ω wolves. The ω wolves undertake exploring or hunting prey by following the location movement of α , β , δ . A detailed description of the devised PMGWO model is provided as below.
(1) Central location operator: We assume that the location vector of a gray wolf g, as X g , is composed of a sequence of HPs associated with a UAV u, i.e., X g = { x g , 1 , , x g , | B u | } . The PMGWO incorporates a central location operator for leader wolves α , β , δ to facilitate the update of wolf locations, which employs the interchanging location selection approach to produce a central location vector. Specifically, the location vectors X α , X β , and X δ constitute a matrix, and the matrix’s first column is designated as the selection offset S o , while the selection length is specified as S l ; then, the operator Ξ for central location vector X c e n is expressed as
X c e n = Ξ ( X α , X β , X δ , S o , S l )
The detailed operation mechanism for Ξ is illustrated in Figure 3. Assuming the total number of HPs B = 8 , the location vectors X α , X β , X δ constitute a matrix with 3 rows and 8 columns. Also, S o = 3 and S l = 4 , the length of X c e n to be produced is S l , we use a variable I D to point to a column, and it is initialized to have the same value as S o . At each iteration, three elements from the I D -th column of the matrix will be selected and sequentially attempted to be stored in X c e n . The storing attempt is not allowed if either of two conditions are met. The first condition is the presence of an element with the same value as one that already exists in X c e n , in which case subsequent attempts will proceed. The second condition is met when the element count in X c e n reaches S l , in which case all subsequent attempts will terminate and return X c e n . I D is then updated by increasing one after each column, allowing it to proceed to the next column.
(2) Location update operator: To compute S l and S o in Equation (38), we introduce two scalar variables ϱ 1 and ϱ 2 , which is calculated as
ϱ 1 = 2 κ r 1 κ , ϱ 2 = 2 r 2
where both r 1 and r 2 are two random numbers, r 1 follows a uniform distribution in [ 0 , 1 ] , and r 2 follows a triangular distribution in ( 0 , 0.5 , 1 ) ; the controlling variable κ continues to diminish from 2 to 0.
Let S d denote the offset of the wolfpack’s location vector; then, the variables S l , S o , and S d can be calculated as the following Equations (40)–(42), respectively.
S l = | B u | × ( 1 | ϱ 1 / 2 | )
S o = r o u n d ( r 3 × ( B S l ) )
S d = ϱ 2 × S o , ϱ 2 × S o ( B S l ) , [ ϱ 2 × S o ] ( B S l ) , otherwise ,
In Equation (40), with κ decreasing gradually, S l converges towards the number of HPs | B u | , indicating a progressive approach of the gray wolf towards the central location of leader wolves. In Equation (41), r 3 is a set of random numbers distributed in [ 0 , 1 ] uniformly. Equations (41) and (42) control the offset of location vectors with respect to leader wolves and wolfpack, respectively; this causes the wolfpack to move to a random location in a specified range from the central location of the leader wolves, thus allowing the gray wolf to advance towards the prey randomly.
Moreover, if the current location of the gray wolf g is denoted as X g t , the location update from the previous iteration to the current one can be expressed using the following operator λ :
X g t + 1 = λ X c e n , S l , X g t , S d
Equation (43) illustrates a segment with S l dimensions, i.e., X c e n , to be positioned at the [ S d , S d + S l 1 ] location within X g t + 1 . The components of X g t differing from those of X c e n are placed at positions [ 1 , S d 1 ] and [ S d + S l , | B u | ] of X g t + 1 .
(3) Wolf exploration operator: Wolf exploration is to perform selection and crossover with certain probabilities P s and P c , respectively. For the selection operation, the number of individuals involved is determined by Equation (44); then, the last N g individuals in the population are replaced by the first N g individuals. The crossover is then executed on consecutive pairs of gray wolf individuals in the sorted population, with the crossover width c w and the crossover site c s determined by Equation (45), respectively.
N g = N w × P s × 2 κ 4
c w = r 5 × d X 2 , c s = r 6 × ( d X c w + 1 )
where N w indicates the number of wolves’ individuals, r 5 and r 6 are two random numbers within the [ 0 , 1 ] , d X denotes the dimension of X g , and here the maximum dimension of X g is the total number of HPs associated with the UAV.
(4) Stagnation-compensated wolf update operator: To avoid the model falling into local optimization, in the application of the stagnation-compensated gray wolf update method, the total iteration times t n in which the model reaches the same optimal solution are calculated to assess the level of stagnation in global optimum. Then, a stagnation adjustment factor S a f is designated to adaptively update the control variable κ by Equation (46)
κ = min 2 2 × t c u r t max + S a f × 2 × t n t max , 2
where t c u r and t max denote the current and maximum iterations, respectively.
(4) Encoding and decoding: The encoding procedure aims to define the location vector of the gray wolf. The location vector is defined as a vector with | B u | dimensions, i.e., X g = x g , 1 , , x g , b , x g , | B u | , which is a permutation of 1 to | B u | . For example, the gray wolf’s location vector can be X g = ( 1 , 3 , 6 , 5 , 2 , 4 ) when the number of HPs | B u | = 6 . Decoding is to transform a gray wolf’s location vector into a solution regarding the path planing. The procedures are given as follows:
(a) A UAV initially takes off from the CS, so the current path of a UAV is set as D u = { 0 } , and we denote the current energy of UAV u as E u c u r , i.e., E u c u r = E ^ u . In addition, all the paths for all UAVs can be included in a set D ˜ , which is an empty set at the initial stage.
(b) The HP b B u is chosen and then the energy usage E t e m 1 for flying from the current location to the HP b, the energy consumption E t e m 2 for hovering at HP b, and the energy consumption E t e m 3 for flying from HP b to the CS are computed, respectively. Finally, the overall energy consumption E t e m a l l is acquired through summing these values.
(c) If E t e m a l l < E u c u r , the current location is set as x g , b . Thus, D u = { 0 , x g , b } and E u c u r = E u c u r E t e m 1 E t e m 2 , b = b + 1 ; otherwise, we add zero to D u , the UAV’s current location is set to zero, and E u c u r = E ^ u .
(d) If any HP in B u has not been iterated, return to step (b); once all the HPs associated with the UAV have been traversed, designate D ˜ as the respective path for X g .
(5) Fitness function design: Due to each gray wolf being able to be considered as a potential solution, based on the definition of the optimization problem defined in Equation (23), the corresponding fitness function is employed to assess the gray wolves and identify superior individuals. As such, aiming at minimizing the AAoI and PAoI, two fitness functions are designated as follows:
f ξ ¯ ( X ) = e x p ( ξ ¯ )
f ξ ^ ( X ) = e x p ( ξ ^ )
Typically, the population of gray wolves is sorted in descending order based on fitness values. In PMGWO, according to the fitness evaluation, the dominant solution is removed, while the non-dominant solution is included in the Pareto-optimal solution set. For instance, given two gray wolf individuals X i and X j , If X i X j , then X i dominates X j . If X j is not dominated by other solutions in this iteration, it is added to the Pareto solution set. The definition of X i X j is described as
f ξ ¯ ( X i ) > f ξ ¯ ( X j ) a n d f ξ ^ ( X i ) f ξ ^ ( X j ) o r f ξ ¯ ( X i ) f ξ ¯ ( X j ) a n d f ξ ^ ( X i ) > f ξ ^ ( X j )
In each iteration, the nondominated solutions are identified based on the fitness and contained in the set of Pareto-optimal solutions. Afterward, the newly incorporated solutions are compared against the solutions already existing in the Pareto-optimal solution set S p o s , and any dominant solutions affected by the addition are eliminated. As iterations increase, so does the number of solutions in the Pareto-optimal set, resulting in slower convergence speed and reduced computational efficiency. Hence, the maximum capacity ( N ^ p o s ) of S p o s is introduced. If the number of solutions in surpasses N ^ p o s , several solutions need to be removed from the set, then all solutions are prioritized based on the fitness error ratio ( F E R ). The F E R is given by
F E R ( X ) = F E ξ ¯ ( X ) a v f ξ ¯ ( X ) 2 + F E ξ ^ ( X ) a v f ξ ^ ( X ) 2
F E ξ ¯ ( X ) = 0 , i f f ξ ¯ ( X ) a v f ξ ¯ ( X ) a v f ξ ¯ ( X ) f ξ ¯ ( X ) , o t h e r w i s e
F E ξ ^ ( X ) = 0 , i f f ξ ^ ( X ) a v f ξ ^ ( X ) a v f ξ ^ ( X ) f ξ ^ ( X ) , o t h e r w i s e
a v f ξ ¯ ( S p o s ) = 1 N ^ p o s X S p o s f ξ ¯ ( X )
a v f ξ ^ ( S p o s ) = 1 N ^ p o s X S p o s f ξ ^ ( X )
where a v f ξ ¯ ( S p o s ) and a v f ξ ^ ( S p o s ) are used to indicate the mean values of f ξ ¯ ( ) and f ξ ^ ( ) from all global optimum solutions in S p o s , correspondingly. Aiming at minimizing the AAoI and PAoI, when the number of solutions surpasses N ^ p o s , we remove the solutions with the highest FER until the count of solutions in S p o s is within the limit of N ^ p o s . Finally, as the iteration continues, the best leader X α will be produced and regarded as the optimal path. Based on the PMGWO model and illustrations above, the intricate procedures are summarized in Algorithm 3.
Algorithm 3 PMGWO-based multi-UAV Path Planning
Input: 
Coordinates C a C b C s , SN-HP and UAV-HP associations ζ a , b and η b , u , a A , b B , u U , N ^ p o s , t m a x ;
Output: 
Flight trajectory ς = { ς u | ς u = { B u [ n ] , 1 n | B u | } .
  1:
Initialize the population size N w , the grey wolf’s location vector X g ( g = 1 , 2 , , N w ) and the leaders α , β , δ ;
  2:
Set f ξ ¯ ( X α ) = 0 ,   f ξ ^ ( X α ) = 0 ,   f ξ ¯ ( X β ) = 0 ,   f ξ ^ ( X β ) = 0 ,   f ξ ¯ ( X δ ) = 0 ,   f ξ ^ ( X δ ) = 0 , t n = 0 , t c u r = 1 , Pareto optimal solution set S p o s , S p o s = ;
  3:
while  t c u r < t m a x   do
  4:
   for each grey wolf X g  do
  5:
     Decoding: convert X g into a path D u with a sequence of HPs based on energy usage E t e m 1 , E t e m 2 , E t e m 3 , E t e m a l l and E u c u r ;
  6:
     Evaluate fitness f ξ ¯ ( X g ) and f ξ ^ ( X g ) ;
  7:
   end for
  8:
   Rank X g by calculating their Pareto frontiers based on f ξ ¯ ( X g ) and f ξ ^ ( X g ) ;
  9:
   Stagnation compensation: update t n and κ ;
10:
   Perform selection and crossover for all wolves;
11:
   Update X g ( g = 1 , 2 , , N w ) ;
12:
   for each X g  do
13:
     Calculate a central location X c e n using Equation (38);
14:
     Compute ϱ 1 , ϱ 2 , S l , S o , S d using Equations (39)–(42);
15:
     Update the wolf location by Equation (43);
16:
   end for
17:
   Determine nondominated solutions and add them to S p o s ;
18:
   Evaluate FER using Equations (50)–(54);
19:
   while the number of solutions in S p o s > N ^ p o s  do
20:
     Remove solution with the highest FER from S p o s ;
21:
   end while
22:
   Update leaders α , β , δ with respective to the S p o s ;
23:
    ς u X α ;
24:
    t c u r = t c u r + 1 .
25:
end while

3.4. AODP: An AoI Optimization Data Processing Framework

As shown in Algorithm 4, we present a comprehensive framework for the proposed AODP, aiming at finding the optimal solution for the AoI optimization specified in Equation (23). The AODP framework integrates the SN clustering and HP exploration scheme, as well as the IEM-based HP-UAV association scheme, while also incorporating the AoI-oriented PMGWO-based multi-UAV path planning mechanism. In AODP framework, Algorithm 1 is employed to acquire the SN-HP association and spatial distribution of HPs. Subsequently, Algorithms 2 and 3 are executed iteratively, effectively implementing dynamic adjustment to the number of HP clusters. This ensures that the consumption of task completion time and energy of the UAV is confined within the specified time threshold and on-board energy range. Meanwhile, dynamic adjustment facilitates coordination among multi-UAVs to cover all SNs in the scenario. The AODP algorithm finally outputs the optimal solution in terms of the coordinates { C b } of a set of HPs B , SN-HP association ζ = [ ζ a , b ] , uploading sequence of SNs ( ϑ = { A b [ n ] , 1 n | A b | ), the UAVs’ flight trajectories ( ς = { ς u | ς u = { B u [ n ] , 1 n   | B u | } ), and computing mode υ .
Algorithm 4 AODP: AoI Optimization Data Processing
Input: 
Coordinates C a , C s tolerant time: L ^ , battery energy: E ^ u ;
Output: 
B , ζ , A = { A b [ n ] ,   1 n | A b | ,   b B u } , ς = { ς u | ς u =   { B u [ n ] ,   1 n   | B u | } , υ = { υ u } .
  1:
Execute Algorithm 1 to determine a set of HPs B , Coordinates of HPs { C b } , and SN-HP association ζ = [ ζ a , b ] ;
  2:
Initialize the number of HP clusters K = 1 ;
  3:
B K ;
  4:
Run Algorithm 2 to obtain the HP-UAV association η = { η b , u , b , u };
  5:
for each UAV u U  do
  6:
   Perform Algorithm 3 to explore the optimal flight trajectory ς u and make offloading decision υ u ;
  7:
   Evaluate task completion time L u a l l and energy consumption E u a l l using Equation (13) and Equation (22), respectively;
  8:
   if  L u a l l > L ^ | | E u a l l > E ^ u  then
  9:
        K K + 1 , return to 3;
10:
   end if
11:
end for

4. Simulation Evaluation

We assess and verify the effectiveness of the proposed AODP scheme by conducting simulation experiments in this section. In the simulation, based on the system model shown in Figure 1, the SNs are uniformly distributed across the geographical area with 800 × 800 m, the CS situates at the coordinate origin, the UAVs maintain a safe distance when performing tasks in the area, with a constant elevation of 30 m. Then, the coverage radius of the UAV is set as r u = 30 m, the flying speed of the UAV is 20 m/s, the hovering power is set to be 170 W, and the flying power is 160 W [33]. For the channel parameters, the power can be set to a fixed value [34]: thereby, the transmission power P a , t r = 0.5 W and P u , t r = 10 W [35]; bandwidth B w a = 0.5 MHz [36] and B w u = 10 MHz [37]; the noise power σ s 2 = σ u 2 = 110 dBm [38]. For the parameters involved in the A2G path loss model, χ l o s = 3 dB, χ n l o s = 23 dB, ϕ 1 = 9.61 and ϕ 2 = 0.16 [39]. The size of package of data D a is uniformly distributed in [ 20 , 30 ] Mbits. Referring to [40,41], the computational capability φ s c a p and φ r c c c a p follow uniform distribution in [ 1 , 2 ] and [ 2 , 3 ] GHz, respectively; meanwhile, the computational resources needed to process one bit of data is set as c a = 1000 CPU cycles/bit. In addition, the air density ρ is 1.225 kg/m3 [42], the model parameter ϖ in Algorithm 1 can be distributed in [ 10 , 18 ] uniformly. Finally, we summarize the simulation parameters in Table 2.
For the performance analysis and evaluation, we consider four benchmarks, which are (1) simulated annealing-based multi-objective intelligent trajectory optimization solution SATO [43]; (2) muti-arm bandit-based path planing algorithm MABP [44]; (3) genetic algorithm-based path optimization solution GAPO [45]; (4) Q-learning-based multi-objective UAV trajectory planning solution QLTD [46]. These algorithms are then simulated under the same system scenario for comparison.
First, the convergence of our AODP algorithm is evaluated. As depicted in Figure 4 and Figure 5, in the scenario, there are 50 SNs and 4 UAVs, with the number of iterations increasing, in each iteration, for the best solution attained in AODP, we plot the fitness corresponding to AAoI and PAoI, respectively. From Figure 4 and Figure 5, at the initial iterations, the algorithm experiences a rapid increase in fitness respective to both AAoI and PAoI, and then tends to plateau. Within 28 iterations, the AODP algorithm converges, which reflects the proposed AODP scheme achieves a stable convergence effect.
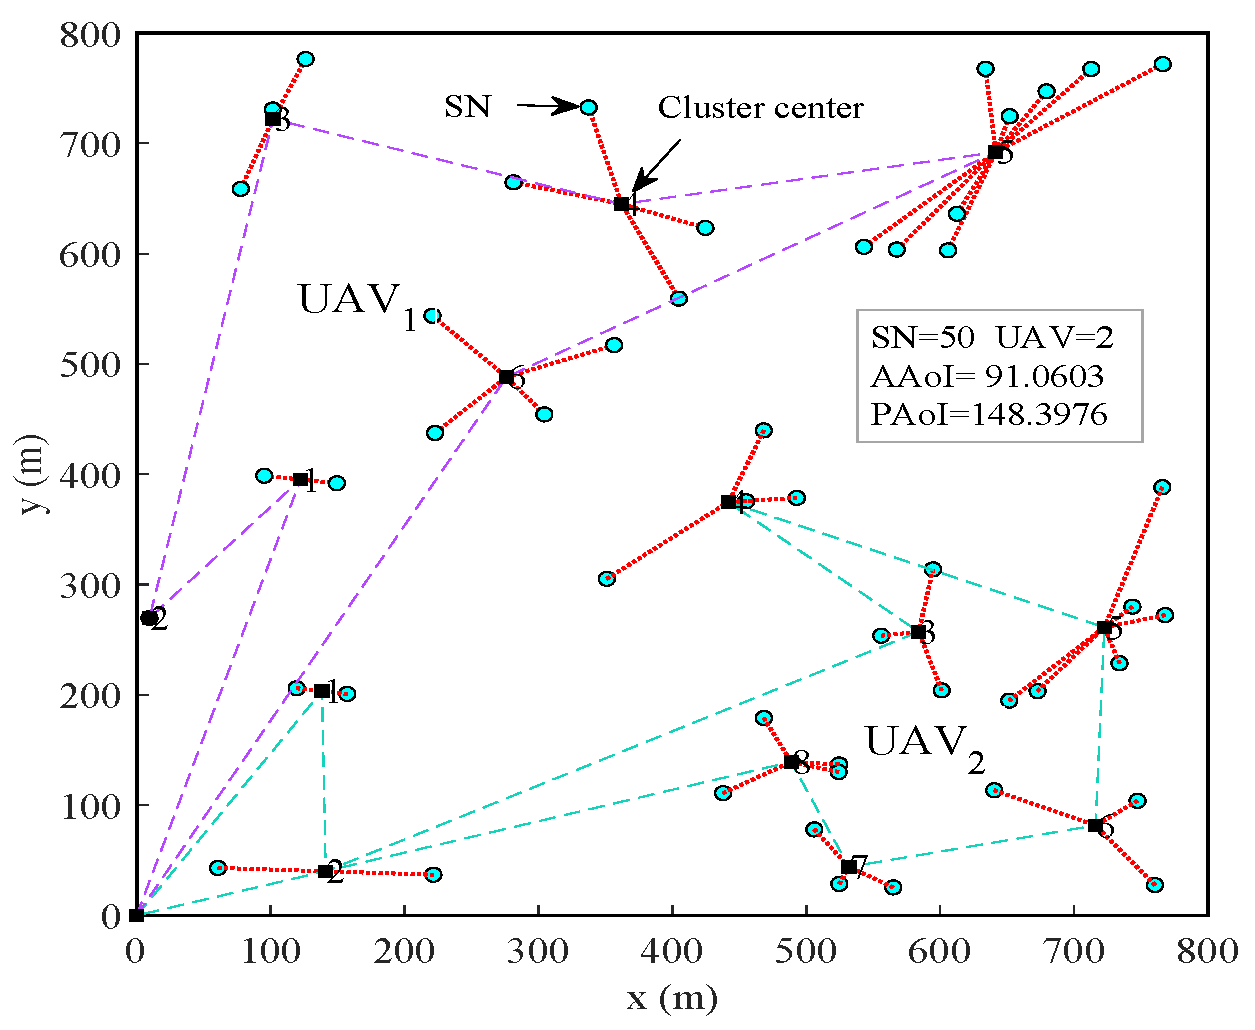
To ascertain the accuracy of the proposed AODP in designing UAVs’ trajectories, in the scenario of deploying varying numbers of UAVs and setting 50 SNs, we trace the trajectory curves of UAVs. As shown in Figure 6 and Figure 7, respectively, each UAV’s data collection trajectory is formed through connecting the starting point, the associated HPs in a specific sequence, and the end point with segmented lines. The beginning and end points indicate the control station on the ground, and the sequence in which the HPs are traversed is labeled with numerical annotations. From Figure 6 and Figure 7, when there are only two UAVs, we observe an AAoI value of 91.0603 and a PAoI value of 148.3976. However, when the number of UAVs grows to three, the AAoI drops to 84.8609 while the PAoI decreases to 146.6011. Therefore, more UAVs participating in data processing can minimize the PAoI and AAoI, and these results validate the accuracy of our proposed scheme.
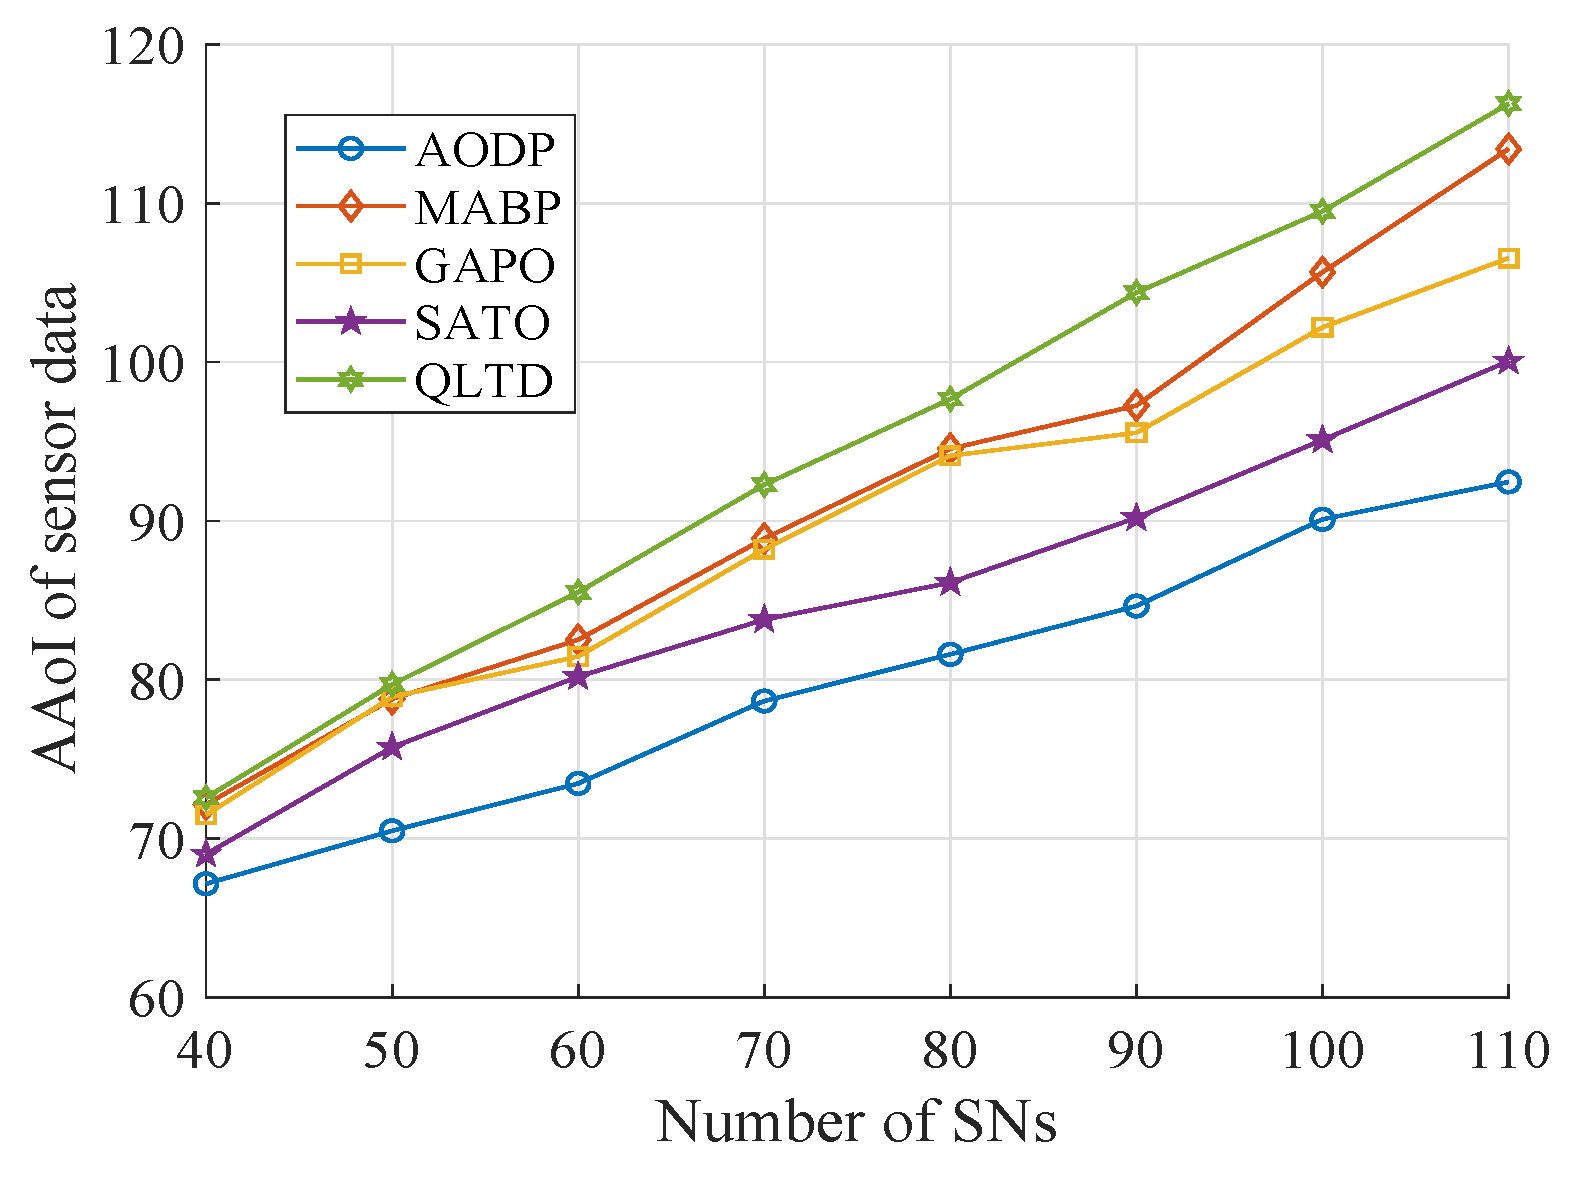
By changing the number of SNs from 40 to 110 and with a total of 4 UAVs, we further assess the performance of AAoI and PAoI of sensor data, investigate the average time and energy usage of task completion of the UAVs. Specifically, multiple executions are conducted for the proposed AODP and four other benchmarks, and the average numerical results are evaluated to provide more accurate validation. Firstly, Figure 8 depicts the AAoI of five algorithms. From Figure 8, as the SNs increase, the AAoI tends to goes up continuously, because more data wait to be processed and the limited availability of system resources, the time for the processing of sensor data is extended. However, the AAoI in our AODP model can maintain stable growth compared with other schemes. To guarantee data freshness, by minimizing the overall data uploading time and determining the uploading sequence, our scheme effectively identifies the appropriate SN-HP associations. On the other side, our strategy achieves optimal HP-UAV association based on the time tolerance and onboard energy, thereby enhancing coordination among multiple UAVs to cover all SNs, while also reducing the AAoI. Moreover, in AODP, the devised gray wolf optimization mechanism enables efficient optimization of UAV trajectories within a reasonable iterations. Overall, our method reduces the AAoI by at least 7.60 % when compared to other algorithms.
Figure 9 illustrates the PAoI acquired within various methods. As expected, it can observe that an obvious increase in PAoI as the SNs’ scale expands. To guarantee information freshness, it is essential to minimize the PAoI and facilitate a focused data processing in monitor system. The AODP proposed still maintains a leading position in terms of PAoI performance, owing to its well-designed and effective model for establishing service associations and scheduling trajectories, obtaining a more comprehensive approach to the AoI optimization. From Figure 9, it can be found that the SATO scheme achieves a lower PAoI compared with the GAPO. Ultimately, our AODP proposed improves PAoI performance by at least 11.87 % in contrast to that of the rest four benchmarks.
To showcase the efficacy of our proposed strategy, as the number of SNs expands, Figure 10 evaluates the UAVs’ average task completion time. We can observe a larger increase in the time consumption, while our policy demonstrates superior performance compared to other strategies. In our model, through the joint optimization of hovering locations and upload sequences, and by considering the coordinated service coverage among multiple UAVs, the UAVs’ task completion time for data collection and processing is effectively compressed. The QLTD method presents inadequate time performance, due to its ineffective consideration on the SN-HP association. While SATO exhibits better delay performance than GAPO, but the improper trajectory planning leads to increased latency compared to the proposed AODP solution. Overall, our scheme reduces the task completion time by at least 6.54 % in comparison to the four other solutions.
Figure 11 illustrates average energy usage by UAVs in relation to the number of SNs. In Figure 11, all energy curves across different schemes present an increasing trend as the SNs’ scale expands. Because the increase in data amount to be processed expands the energy usage during hovering, while the limited communication resources prolong the offloading time, resulting in the need for additional energy supply. But, due to our effective consideration of the sequential upload order, energy consumption in AODP surpasses that of other comparative solutions. In AODP, the design of the HP-UAV association is crucial for energy saving, additionally, to satisfy the energy limitation, AODP ensures coordination balance among multi-UAVs by iteratively adjusting the number of HP clusters. As a result, our algorithm saves the energy by at least 8.09 % compared to the four other solutions.
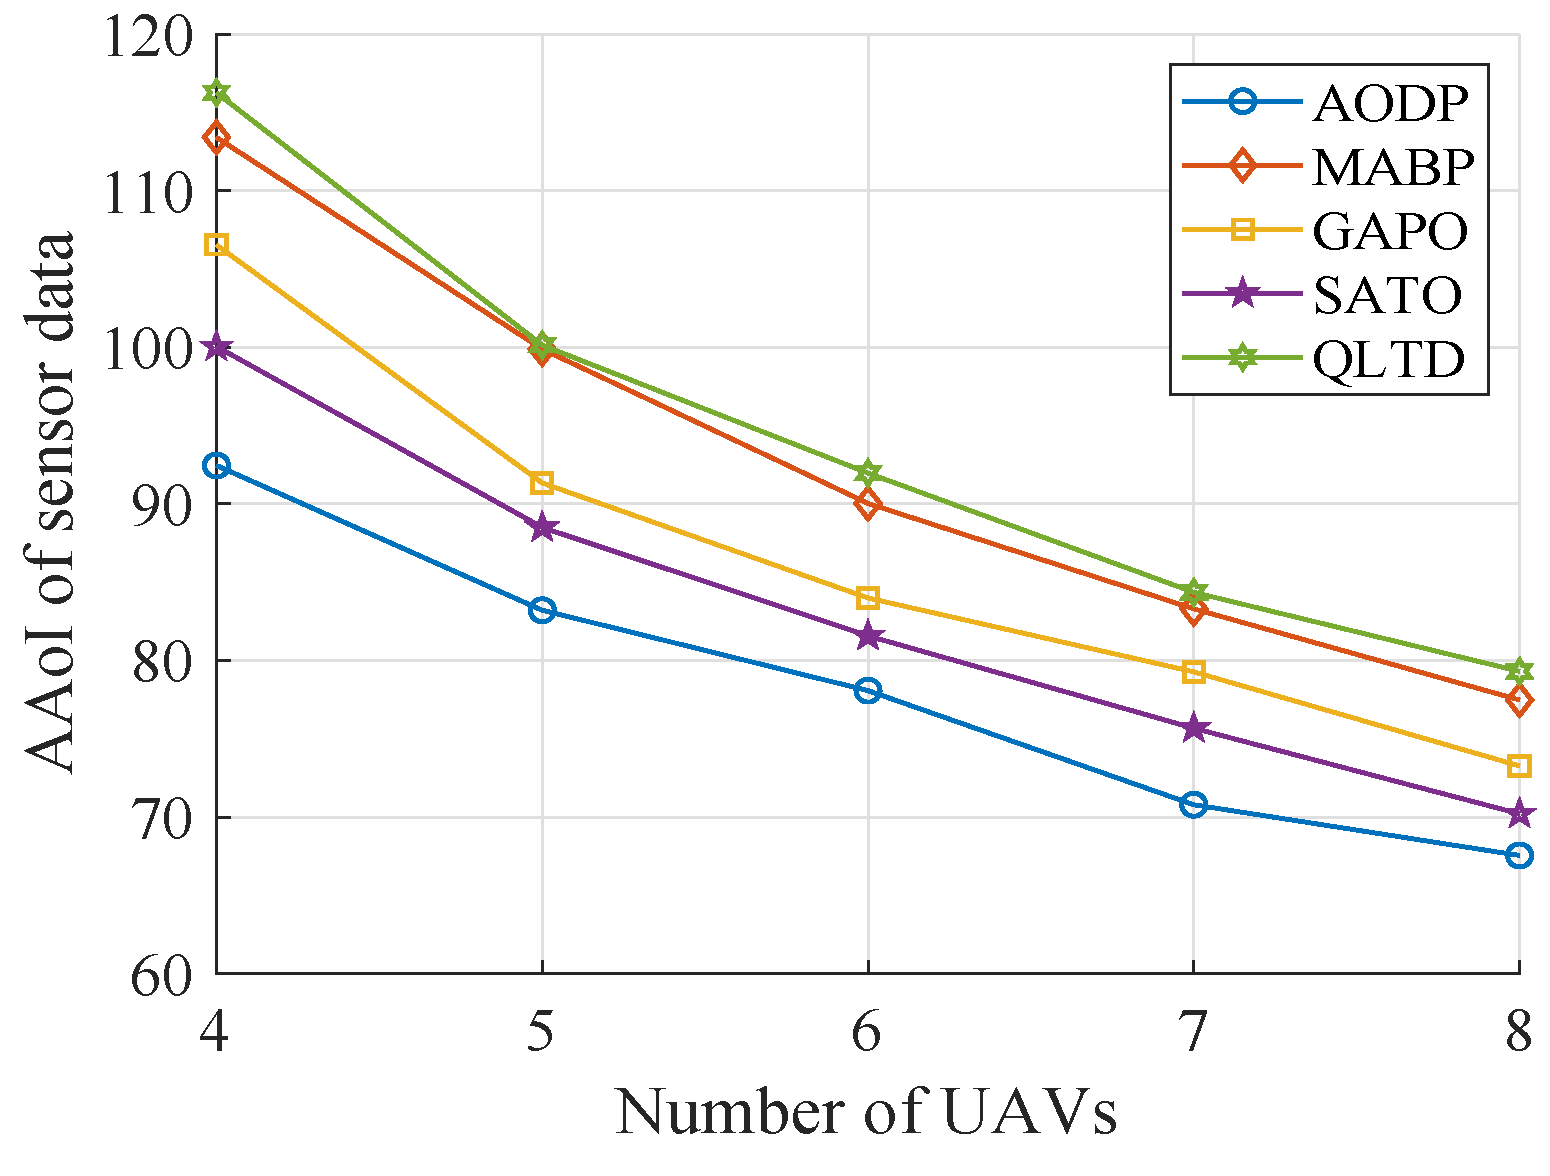
To validate the scalability and adaptive ability of the proposed AODP when applied in different scenarios, we investigate the AAoI and PAoI of the sensor data by expanding the scale of UAV deployment. Meanwhile, according to Equations (13) and (22), we also assess the time required to complete tasks and the energy usage of the UAVs for processing sensor data, respectively. In the scenario, there are 110 SNs, and the count of UAVs is continuously raised from 4 to 8. Figure 12 illustrates the influence of changing the scale of UAVs on AAoI. The trend shows that the AAoI continues to decrease as the count of UAVs increases, because the burden associated with data collection and transmission for a single UAV can be reduced through collaboration among multiple UAVs. Additionally, our proposed mechanism achieves the smallest AAoI among five algorithms. This is due to the AODP effectively executing distributed optimization for the problem. More specifically, the AP-based and IEM-based optimization algorithms optimize the visiting order of SNs and identify the associations of SN-HP and HP-UAV, respectively. Based on the association results, the flight trajectories are determined through adjusting the HP clusters and exploring the optimal solutions interactively in AODP. In conclusion, as the count of UAVs increases, our solution optimizes the AAoI by at least 3.79 % in contrast to other methods.
Figure 13 illustrates the variation of the PAoI obtained in different algorithms. It is evident that the PAoI decreases significantly in all solutions. However, the decline becomes more moderate when the UAVs’ scale expands, and AODP model presents superior performance in terms of PAoI. Since the PMGWO-based algorithm devised in our AODP possesses an adaptive nature, the strategies of the gray wolves change adaptively with those of leaders. Additionally, the algorithm is capable of maintaining a diverse set of non-dominated solutions, providing a range of trade-off options that enable UAVs to make informed decisions while considering time tolerance and on-board energy. Contrarily, the QLTD cannot keep the PAoI in a lower value due to insufficient path planning. Finally, when compared to other schemes, our method optimizes PAoI by at least 13.89 % as the number of UAVs increases.
In the previously described scenario, we proceeded to assess the average task completion time of UAVs. Figure 14 indicates a distinct downward trend in task completion time as the number of UAVs increases. Our innovative AODP solution minimizes uploading time by sequentially collecting data based on SN-HP association results. Simultaneously, while taking into account time tolerance and energy limitations, the flying time is optimized through iterative adjustments of the number of HP clusters. Furthermore, the AODP also makes effective offloading decisions, contributing to the optimization of offloading time. Consequently, compared to other baselines, the proposed AODP reduces latency by at least 4.89 % .
Figure 15 shows the average energy the UAVs consume for processing the sensor data. Due to the limited endurance energy in the scenario, a greater number of UAVs can share the pressure of processing large amounts of data in the system to optimize the AoI; thereby, the energy consumption is reduced with the scale of UAVs extends. Overall, the AODP proposed provides an energy saving of at least 1.88 % in comparison with other schemes.
In order to more reliably evaluate the benefits of our approach, similar to the experimental methodology employed in [34] for assessing the performance of algorithms under varying conditions, we conduct further tests to explore the impact of varying the transmission power and bandwidth of SNs on the performance optimization of AoI. In these experiments, 110 SNs and 4 UAVs are deployed.
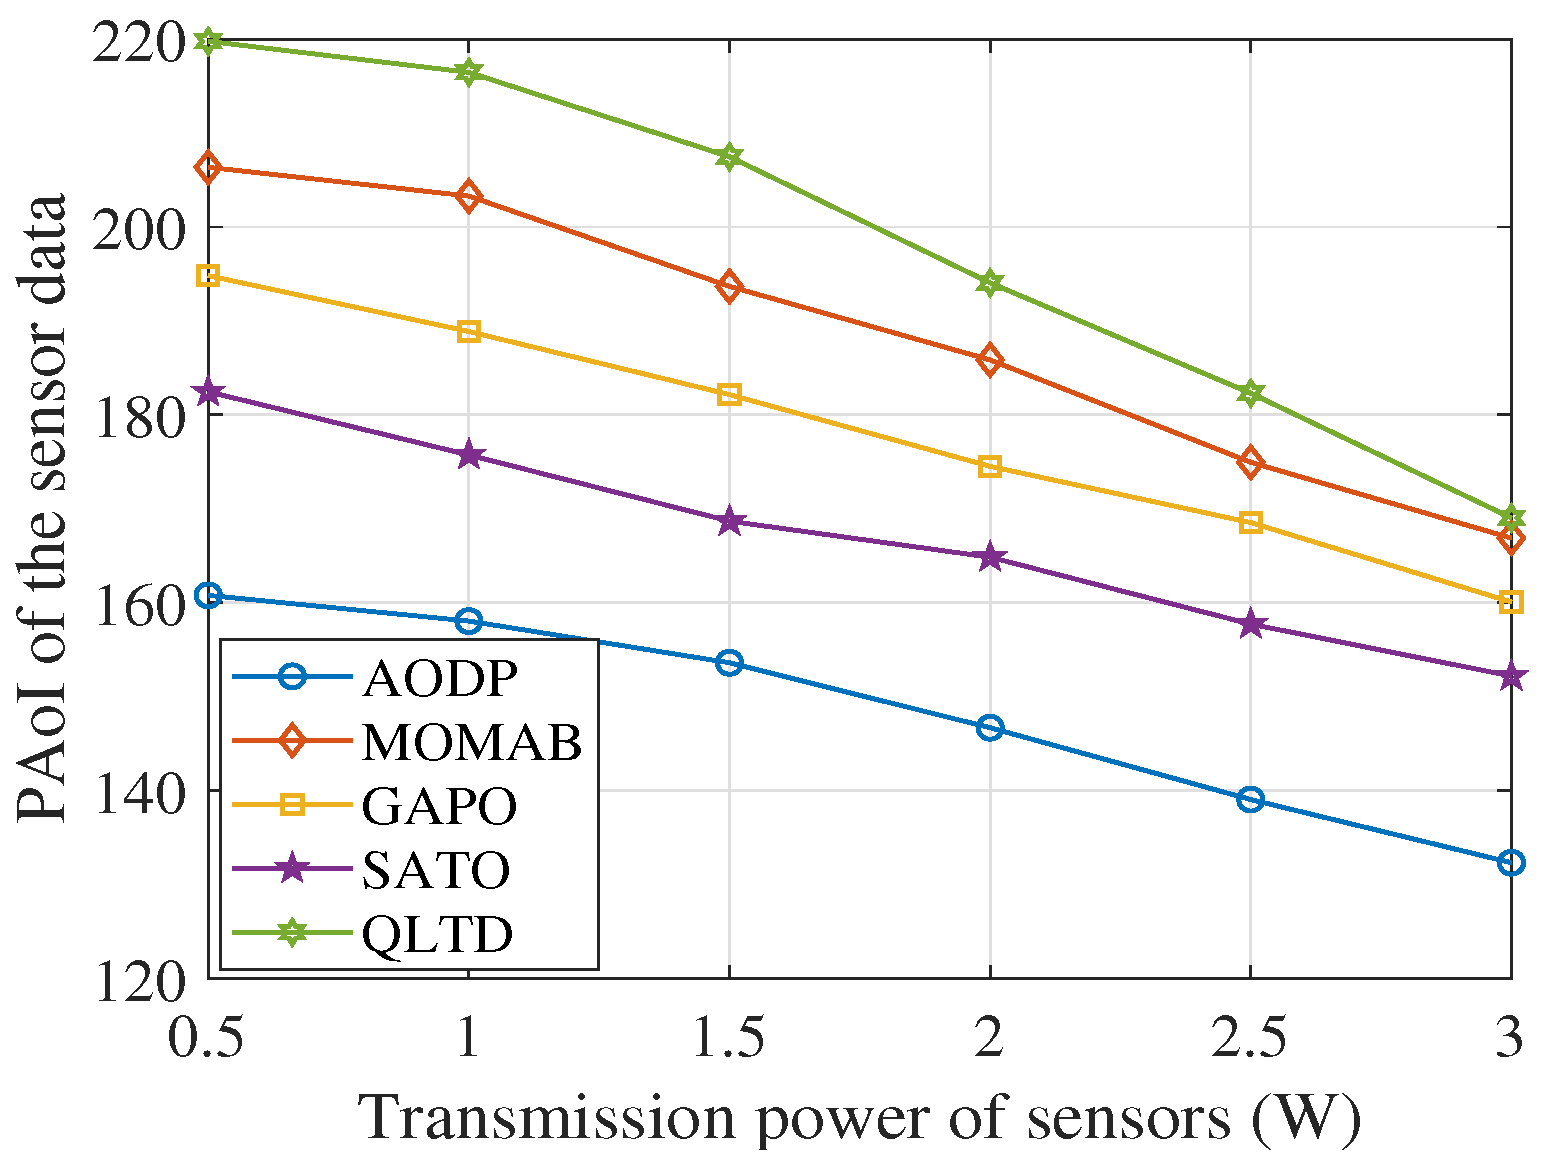
To more reliably evaluate the benefits of our approach, by referring to the experimental methodology employed in [34] for assessing the performance of algorithms under varying conditions, we will conduct further tests, which will explore the impact of varying the transmission power and bandwidth of sensor nodes (SNs) on the performance optimization of AoI. In these experiments, 110 SNs and 4 UAVs are deployed. Figure 16 and Figure 17, respectively, show the AAoI and PAoI achieved by our scheme and four other comparison algorithms when varying the data transmission power of SNs. It is evident that both AAoI and PAoI decline with the increase in transmission power. This phenomenon can be attributed to the enhancement in the quality of the communication link between the SNs and the UAVs brought by higher transmission power, which consequently reduces the data upload time. Our AODP scheme effectively prioritizes the upload sequence of the SNs based on the minimum upload time. Compared to other algorithms, our approach reduces the AAoI and PAoI by at least 6.55 % and 13.05 % , respectively.
Finally, Figure 18 and Figure 19 show the AAoI and PAoI obtained by different schemes when the channel bandwidth of the communication link between SNs and UAVs is varied. As can be seen from the figures, the curves of both AAoI and PAoI exhibit a consistent downward trend across all algorithms with the increase in bandwidth. This is because increasing the link bandwidth significantly reduces the data upload time of the sensors, thereby improving the real-time performance of data acquisition and consequently reducing both AAoI and PAoI. Our model effectively improves the AoI performance as bandwidth increases. Compared to the other algorithms, the proposed scheme reduces AAoI and PAoI by 7.16 % and 14.8 % , respectively.

5. Conclusions

We studied the data processing challenge within a hierarchical cloud–edge computing framework supported by multiple UAVs in an IoT context. By considering a practical scenario where IoT terminals are extensively distributed, and multiple UAVs are employed to collect data, we innovatively proposed the AODP strategy. This strategy integrates service association, path planning, and computation offloading to minimize the Peak Age of Information (PAoI) and Average Age of Information (AAoI). Our simulation results confirm that AODP outperforms existing benchmarks, providing enhanced stability and efficacy in dynamic operational conditions. This suggests that AODP can effectively leverage network and computational resources, enabling UAVs to adaptively collect and intelligently offload data, thereby reducing the AoI significantly. The implications of our findings are meaningful, offering a robust blueprint for enhancing data freshness in IoT networks—a critical factor in environments where timely data are paramount, such as disaster response and urban management. And a significant limitation of our work is the absence of real-world testing for AoI optimization, especially in dynamic environments that require continuous connectivity and real-time data flows. Therefore, future efforts will focus on developing an adaptive scheme that optimizes the AoI while ensuring continuous connectivity and real-time data flows between devices and systems. This approach will also explore the influence of beaconing intervals on AoI optimization. The ultimate goal is to significantly enhance the efficiency and reliability of critical applications by integrating AoI minimization strategies with methods that maintain continuous connectivity. This includes addressing challenges in real-time data synchronization and enhancing the efficiency and reliability of critical applications. We also intend to carry out real-world testing to verify the effectiveness of the approach further.

Author Contributions

Conceptualization, M.M.and Z.W.; methodology, M.M.; writing—original draft, M.M.; writing—review and editing, Z.W. All authors have read and agreed to the published version of the manuscript.

Funding

This work was supported by the National Key R&D Program of China (No. 2020YFA0713504).

Data Availability Statement

The data presented in this study are available in article.

Conflicts of Interest

The authors declare no conflicts of interest.

References

  1. Khadka, G.; Nemati, M.; Zhou, X.; Choi, J. Index Modulation in Backscatter Communication for IoT Sensor Based Applications: A Review. IEEE Sens. J. 2022, 22, 21445–21461. [Google Scholar] [CrossRef]
  2. Zhao, Q.; Wang, G.; Wang, Y.; Wang, Z. A Load-Aware Energy-Efficient Clustering Algorithm in Sensor-Cloud. J. Grid Comput. 2023, 21, 50. [Google Scholar] [CrossRef]
  3. Chawla, D.; Mehra, P.S. A roadmap from classical cryptography to post-quantum resistant cryptography for 5G-enabled IoT: Challenges, opportunities and solutions. Internet Things 2023, 24, 100950. [Google Scholar] [CrossRef]
  4. Zhu, A.; Zeng, Z.; Guo, S.; Lu, H.; Ma, M.; Zhou, Z. Game-theoretic robotic offloading via multi-agent learning for agricultural applications in heterogeneous networks. Comput. Electron. Agric. 2023, 211, 108017. [Google Scholar] [CrossRef]
  5. Wan, X. Dynamic Resource Management in MEC Powered by Edge Intelligence for Smart City Internet of Things. J. Grid Comput. 2024, 22, 29. [Google Scholar] [CrossRef]
  6. Borkowski, A.S. Low-Cost Internet of Things Solution for Building Information Modeling Level 3B—Monitoring, Analysis and Management. J. Sens. Actuator Netw. 2024, 13, 19. [Google Scholar] [CrossRef]
  7. Bhambri, P.; Rani, S.; Gupta, G.; Khang, A. Cloud and fog Computing Platforms for Internet of Things; CRC Press: Boca Raton, FL, USA, 2022. [Google Scholar]
  8. Ghandour, O.; El Kafhali, S.; Hanini, M. Computing Resources Scalability Performance Analysis in Cloud Computing Data Center. J. Grid Comput. 2023, 21, 61. [Google Scholar] [CrossRef]
  9. Zhu, A.; Ma, M.; Guo, S.; Yang, Y. Adaptive Access Selection Algorithm for Multi-Service in 5G Heterogeneous Internet of Things. IEEE Trans. Netw. Sci. Eng. 2022, 9, 1630–1644. [Google Scholar] [CrossRef]
  10. Zhu, A.; Ma, M.; Guo, S.; Yu, S.; Yi, L. Adaptive multi-access algorithm for multi-service edge users in 5G ultra-dense heterogeneous networks. IEEE Trans. Veh. Technol. 2021, 70, 2807–2821. [Google Scholar] [CrossRef]
  11. Jin, X.; Hua, W.; Wang, Z.; Chen, Y. A survey of research on computation offloading in mobile cloud computing. Wirel. Netw. 2022, 28, 1563–1585. [Google Scholar] [CrossRef]
  12. Sofla, M.S.; Kashani, M.H.; Mahdipour, E.; Mirzaee, R.F. Towards effective offloading mechanisms in fog computing. Multimed. Tools Appl. 2022, 81, 1997. [Google Scholar] [CrossRef] [PubMed]
  13. Wen, X.; Sun, H.M. Parking Cooperation-Based Mobile Edge Computing Using Task Offloading Strategy. J. Grid Comput. 2024, 22, 8. [Google Scholar]
  14. Naouri, A.; Wu, H.; Nouri, N.A.; Dhelim, S.; Ning, H. A novel framework for mobile-edge computing by optimizing task offloading. IEEE Internet Things J. 2021, 8, 13065–13076. [Google Scholar] [CrossRef]
  15. Li, M.; Lei, H.; Guo, H.; Sulaiman, R.; Deebani, W.; Shutaywi, M. Efficient data offloading using markovian decision on state reward action in edge computing. J. Grid Comput. 2023, 21, 25. [Google Scholar] [CrossRef]
  16. Hu, S.; Xiao, Y. Design of cloud computing task offloading algorithm based on dynamic multi-objective evolution. Future Gener. Comput. Syst. 2021, 122, 144–148. [Google Scholar] [CrossRef]
  17. Liu, J.; Guo, S.; Wang, Q.; Pan, C.; Yang, L. Optimal multi-user offloading with resources allocation in mobile edge cloud computing. Comput. Netw. 2023, 221, 109522. [Google Scholar] [CrossRef]
  18. Guo, K.; Zhang, R. Fairness-oriented computation offloading for cloud-assisted edge computing. Future Gener. Comput. Syst. 2022, 128, 132–141. [Google Scholar] [CrossRef]
  19. Qu, X.; Wang, H. Emergency task offloading strategy based on cloud-edge-end collaboration for smart factories. Comput. Netw. 2023, 234, 109915. [Google Scholar] [CrossRef]
  20. Du, R.; Liu, C.; Gao, Y.; Hao, P.; Wang, Z. Collaborative cloud-edge-end task offloading in NOMA-enabled mobile edge computing using deep learning. J. Grid Comput. 2022, 20, 14. [Google Scholar] [CrossRef]
  21. Chen, S.; Chen, J.; Miao, Y.; Wang, Q.; Zhao, C. Deep reinforcement learning-based cloud-edge collaborative mobile computation offloading in industrial networks. IEEE Trans. Signal Inf. Process. Over Netw. 2022, 8, 364–375. [Google Scholar] [CrossRef]
  22. Zhou, H.; Wang, Z.; Cheng, N.; Zeng, D.; Fan, P. Stackelberg-Game-Based Computation Offloading Method in Cloud—Edge Computing Networks. IEEE Internet Things J. 2022, 9, 16510–16520. [Google Scholar] [CrossRef]
  23. Zhu, A.; Lu, H.; Guo, S.; Zeng, Z.; Ma, M.; Zhou, Z. SyRoC: Symbiotic robotics for QoS-aware heterogeneous applications in IoT-edge-cloud computing paradigm. Future Gener. Comput. Syst. 2024, 150, 202–219. [Google Scholar] [CrossRef]
  24. Zhu, A.; Lu, H.; Guo, S.; Zeng, Z.; Zhou, Z. CollOR: Distributed collaborative offloading and routing for tasks with QoS demands in multi-robot system. Ad Hoc Netw. 2024, 152, 103311. [Google Scholar] [CrossRef]
  25. Ma, M.; Wang, Z. Distributed Offloading for Multi-UAV Swarms in MEC-Assisted 5G Heterogeneous Networks. Drones 2023, 7, 226. [Google Scholar] [CrossRef]
  26. Liu, Z. A Multi-joint Optimisation Method for Distributed Edge Computing Resources in IoT-Based Smart Cities. J. Grid Comput. 2023, 21, 58. [Google Scholar] [CrossRef]
  27. Zhu, A.; Lu, H.; Ma, M.; Zhou, Z.; Zeng, Z. DELOFF: Decentralized Learning-Based Task Offloading for Multi-UAVs in U2X-Assisted Heterogeneous Networks. Drones 2023, 7, 656. [Google Scholar] [CrossRef]
  28. Sun, Y.; Kadota, I.; Talak, R.; Modiano, E. Age of Information: A New Metric for Information Freshness; Springer Nature: Berlin, Germany, 2022. [Google Scholar]
  29. Aoki, S.; Yonezawa, T.; Kawaguchi, N.; Steenkiste, P.; Rajkumar, R.R. Time-Sensitive Cooperative Perception for Real-Time Data Sharing over Vehicular Communications: Overview, Challenges, and Future Directions. IEEE Internet Things Mag. 2022, 5, 108–113. [Google Scholar] [CrossRef]
  30. Fu, R.; Ren, X.; Li, Y.; Wu, Y.; Sun, H.; Al-Absi, M.A. Machine-Learning-Based UAV-Assisted Agricultural Information Security Architecture and Intrusion Detection. IEEE Internet Things J. 2023, 10, 18589–18598. [Google Scholar] [CrossRef]
  31. Niu, Z.; Yang, H.; Zhou, L.; Farag Taha, M.; He, Y.; Qiu, Z. Deep learning-based ranging error mitigation method for UWB localization system in greenhouse. Comput. Electron. Agric. 2023, 205, 107573. [Google Scholar] [CrossRef]
  32. Liu, K.; Zheng, J. UAV trajectory optimization for time-constrained data collection in UAV-enabled environmental monitoring systems. IEEE Internet Things J. 2022, 9, 24300–24314. [Google Scholar] [CrossRef]
  33. Diao, X.; Yang, W.; Yang, L.; Cai, Y. Uav-relaying-assisted multi-access edge computing with multi-antenna base station: Offloading and scheduling optimization. IEEE Trans. Veh. Technol. 2021, 70, 9495–9509. [Google Scholar] [CrossRef]
  34. Hernández-Rojas, D.L.; Fernández-Caramés, T.M.; Fraga-Lamas, P.; Escudero, C.J. Design and Practical Evaluation of a Family of Lightweight Protocols for Heterogeneous Sensing through BLE Beacons in IoT Telemetry Applications. Sensors 2018, 18, 57. [Google Scholar] [CrossRef]
  35. Liu, Y.; Dai, H.N.; Wang, Q.; Imran, M.; Guizani, N. Wireless powering Internet of Things with UAVs: Challenges and opportunities. IEEE Netw. 2022, 36, 146–152. [Google Scholar] [CrossRef]
  36. Zhang, Z.; Chang, Q.; Yang, S.; Xing, J. Sensing-Communication Bandwidth Allocation in Vehicular Links Based on Reinforcement Learning. IEEE Wirel. Commun. Lett. 2023, 12, 11–15. [Google Scholar] [CrossRef]
  37. Zhou, W.; Fan, L.; Zhou, F.; Li, F.; Lei, X.; Xu, W.; Nallanathan, A. Priority-aware resource scheduling for uav-mounted mobile edge computing networks. IEEE Trans. Veh. Technol. 2023, 72, 9682–9687. [Google Scholar] [CrossRef]
  38. Wang, W.; Qu, R.; Liao, H.; Wang, Z.; Zhou, Z.; Wang, Z.; Mumtaz, S.; Guizani, M. 5G MEC-Based Intelligent Computation Offloading in Power Robotic Inspection. IEEE Wirel. Commun. 2023, 30, 66–74. [Google Scholar] [CrossRef]
  39. Kang, H.; Chang, X.; Mišić, J.; Mišić, V.B.; Fan, J.; Liu, Y. Cooperative UAV Resource Allocation and Task Offloading in Hierarchical Aerial Computing Systems: A MAPPO Based Approach. IEEE Internet Things J. 2023, 10, 10497–10509. [Google Scholar] [CrossRef]
  40. Zhang, H.; Liao, K.; Tai, Y.; Ma, W.; Cao, G.; Sun, W.; Xu, L. Decentralized and Fault-Tolerant Task Offloading for Enabling Network Edge Intelligence. IEEE Syst. J. 2024, 18, 1459–1470. [Google Scholar] [CrossRef]
  41. Gong, X.; Chen, M.; Li, D.; Cao, Y. Delay-Optimal Distributed Computation Offloading in Wireless Edge Networks. IEEE/ACM Trans. Netw. 2024, 1–16. [Google Scholar] [CrossRef]
  42. Zeng, Y.; Xu, J.; Zhang, R. Energy minimization for wireless communication with rotary-wing UAV. IEEE Trans. Wirel. Commun. 2019, 18, 2329–2345. [Google Scholar] [CrossRef]
  43. Ait-Saadi, A.; Meraihi, Y.; Soukane, A.; Ramdane-Cherif, A.; Benmessaoud Gabis, A. A novel hybrid Chaotic Aquila Optimization algorithm with Simulated Annealing for Unmanned Aerial Vehicles path planning. Comput. Electr. Eng. 2022, 104, 108461. [Google Scholar] [CrossRef]
  44. Zhou, P.; Zhao, W.; Li, J.; Li, A.; Du, W.; Wen, S. Massive Maritime Path Planning: A Contextual Online Learning Approach. IEEE Trans. Cybern. 2021, 51, 6262–6273. [Google Scholar] [CrossRef] [PubMed]
  45. Indu; Singh, R.P.; Choudhary, H.R.; Dubey, A.K. Trajectory Design for UAV-to-Ground Communication With Energy Optimization Using Genetic Algorithm for Agriculture Application. IEEE Sens. J. 2021, 21, 17548–17555. [Google Scholar] [CrossRef]
  46. Chang, J.; Dong, N.; Li, D.; Ip, W.H.; Yung, K.L. Skeleton Extraction and Greedy-Algorithm-Based Path Planning and its Application in UAV Trajectory Tracking. IEEE Trans. Aerosp. Electron. Syst. 2022, 58, 4953–4964. [Google Scholar] [CrossRef]
Figure 1. An illustrative model of the multi-UAV-assisted data processing with cloud–edge infrastructure.
Drones 08 00401 g001
Figure 2. The time sequence of data processing for a UAV.
Drones 08 00401 g002
Figure 3. An illustrative example of generating central location vector.
Drones 08 00401 g003
Figure 4. Fitness variation with the iterations for AAoI.
Drones 08 00401 g004
Figure 5. Fitness variation with the iterations for PAoI.
Drones 08 00401 g005
Figure 6. UAV flight trajectory in 2 UAV scenario.
Drones 08 00401 g006
Figure 7. UAV flight trajectory in 3 UAV scenario.
Drones 08 00401 g007
Figure 8. AAoI of sensor data versus different numbers of SNs.
Drones 08 00401 g008
Figure 9. PAoI of sensor data versus different numbers of SNs.
Drones 08 00401 g009
Figure 10. Average task completion time of UAVs versus different numbers of SNs.
Drones 08 00401 g010
Figure 11. Average energy consumption of UAVs versus different numbers of SNs.
Drones 08 00401 g011
Figure 12. AAoI of sensor data versus different numbers of UAVs.
Drones 08 00401 g012
Figure 13. PAoI of sensor data versus different numbers of UAVs.
Drones 08 00401 g013
Figure 14. Average task completion time of UAVs versus different numbers of UAVs.
Drones 08 00401 g014
Figure 15. Average energy consumption of UAVs versus different numbers of UAVs.
Drones 08 00401 g015
Figure 16. AAoI of sensor data versus transmission power of the SNs.
Drones 08 00401 g016
Figure 17. PAoI of sensor data versus transmission power of the SNs.
Drones 08 00401 g017
Figure 18. AAoI of sensor data versus link bandwith between SN and UAV.
Drones 08 00401 g018
Figure 19. PAoI of sensor data versus versus link bandwith between SN and UAV.
Drones 08 00401 g019
Table 1. The comparison of some related works.
Ref.ObjectiveStrengthsEnvironmentContributionMetrics
[16]Minimize execution time with energy constraintEnhanced offloading for terminalsCloud onlyA theoretical basis for offloadingNo AoI metrics
[17]Minimize time and energyConsideration of the multi-user competitionEdge onlyAddresses the constraints of mobility and limited resourcesNo AoI focus
[18]Reduce response timeConsideration of trade-offs in resource allocationCloud–edgeOptimization of data transmission and cloud–edge cooperationNo AoI metrics
[19]Reduce execution timePrioritization for the key tasks’ offloadingCloud–edgeOptimization of task execution during emergenciesNo AoI metrics
[23]Improve system performanceConsideration of muti-robot task executionCloud–edgeProposal of optimal data transmission solutionNo AoI metrics
[25]Minimize time and energyUse of UAVsUAV-assisted edgeRealize cost-effective transmission and offloadingNo AoI metrics
[26]Minimize time and energyCollaborative UAVsUAV-assisted cloud–edgeEnsuring optimal task scheduling and energy efficiencyNo AoI metrics
[28]Ensure real-time data processingAnalyze AoINot specifiedHighlighting AoI importanceNo UAVs
[29]Reduce data processing timeTimely data transmissionCloud–edgeStudying the cooperative data perception solutionNo UAVs
OursMinimize AAoI and PAoI, optimize energy usageCollaborative UAVs and timely data processingComprise UAV, cloud and edge layersStudy the optimal data transmission, trajectory planning and offloading solutionAoI focus
Table 2. Simulation parameters.
SymbolValuesSymbolValues
z u (m)30 P a , t r (W)0.5
r u (m)30 P u , t r (W)10
B w a (MHz)0.5 B w u (MHz)10
σ s 2 (dBm)−110 σ u 2 −110
χ l o s (dB)3 χ n l o s (dB)23
ϕ 1 9.61 ϕ 2 0.16
D a (Mbits)[20, 30] c a (cycles/bit)1000
φ s c a p (GHz)[1, 2] φ r c c c a p (GHz)[2, 3]
f c (GHz)2 ρ (kg/m3)1.225
Disclaimer/Publisher’s Note: The statements, opinions and data contained in all publications are solely those of the individual author(s) and contributor(s) and not of MDPI and/or the editor(s). MDPI and/or the editor(s) disclaim responsibility for any injury to people or property resulting from any ideas, methods, instructions or products referred to in the content.