Article

A General Method for Pre-Flight Preparation in Data Collection for Unmanned Aerial Vehicle-Based Bridge Inspection

Department of Civil Engineering, New Mexico State University, Las Cruces, NM 88003, USA
*
Authors to whom correspondence should be addressed.
Drones 2024, 8(8), 386; https://doi.org/10.3390/drones8080386
Submission received: 26 June 2024 / Revised: 5 August 2024 / Accepted: 6 August 2024 / Published: 9 August 2024
(This article belongs to the Special Issue Applications of UAVs in Civil Infrastructure)

Abstract

:
Unmanned Aerial Vehicles (UAVs) have garnered significant attention in recent years due to their unique features. Utilizing UAVs for bridge inspection offers a promising solution to overcome challenges associated with traditional methods. While UAVs present considerable advantages, there are challenges associated with their use in bridge inspection, particularly in ensuring effective data collection. The primary objective of this study is to tackle the challenges related to data collection in bridge inspection using UAVs. A comprehensive method for pre-flight preparation in data collection is proposed. A well-structured flowchart has been created, covering crucial steps, including identifying the inspection purpose, selecting appropriate hardware, planning and optimizing flight paths, and calibrating sensors. The method has been tested in two case studies of bridge inspections in the State of New Mexico. The results show that the proposed method represents a significant advancement in utilizing UAVs for bridge inspection. These results indicate improvements in accuracy from 7.19% to 21.57% in crack detection using the proposed data collection method. By tackling the data collection challenges, the proposed method serves as a foundation for the application of UAVs for bridge inspection.

1. Introduction

According to studies from the U.S. Department of Transportation, 67,000 of the 607,380 bridges are classified as structurally deficient, while an additional 85,000 are considered functionally obsolete [1]. Moreover, according to the 2022 statistics of the Federal Highway Administration (FHWA), the American Road and Transportation Builders Association (ARTBA) estimated that the cost of identified repairs for all bridges is approximately USD 260 billion [2]. The strategic allocation of the budget highlights the pressing need for efficient and cutting-edge solutions in bridge management. Considering the remarkable advancements of Unmanned Aerial Vehicles (UAVs) in recent decades [3], especially the substantial attention on them within the civil engineering domain [4], implementing UAVs for bridge inspection emerges as a promising solution to address challenges associated with traditional methods. This approach offers key benefits, including enhanced safety, cost efficiency, and uninterrupted traffic flow [5]. Figure 1 shows a general framework for conducting bridge inspection with UAVs. This involves the selection of appropriate hardware based on specific objectives of the bridge or other remote sensing project, flight or mission planning, and data collection. This framework is applicable whether the UAV is operated under the control of a ground pilot or autonomously.
Developments in artificial intelligence (AI) and image processing, particularly in machine and deep learning, have promoted UAV-based bridge inspection. The automation of bridge inspections becomes feasible through the integration of AI combined with diverse data collected by UAVs. A model capable of identifying faults from UAV photos and films is essential for the success of automated bridge inspection [6]. In recent years, various methodologies have been developed for crack detection and quantification via image processing [7], computer vision [8], machine learning [9], etc. These developed methods offer promising solutions for interpreting data in UAV-based bridge inspections [10]. While most recent studies have focused on the data interpretation stage to develop various algorithms for the automated interpretation of UAV-collected data, it is essential to acknowledge that these methods heavily rely on data, making the quality of the data crucial for accurate interpretation. Utilizing these techniques for data processing, and employing UAVs in general, without consideration for data collection and its quality could potentially lead to less precise and efficient outcomes. This highlights the critical importance of effective data collection. To fully harness the potential of these new technologies and methods while overcoming the challenges, devising a robust pre-flight and data collection strategy becomes a vital and indispensable step in the process. Some studies have been performed to investigate UAV-based bridge data collection in past years.
Considerable research has been conducted in recent years on bridge inspection-related UAV pre-flight and data collection [11,12]. Some studies investigated different cameras and sensors for UAVs, their applications, and the calibration techniques of the payloads during the last decade [13,14,15,16,17,18]. Cramer et al. present a benchmark study of nine different UAV-based camera systems and focus on the geometrical calibration of these cameras [14]. Nasimi et al. studied the development and field application of a low-cost sensor-equipped UAV for non-contact bridge inspections [18]. Moreover, Ameli et al. provide a comprehensive review of the potential of UAVs for bridge inspections and explore the impact of hardware options on their mission capabilities. The authors summarize the key challenges and limitations of using UAVs for bridge inspections, including handling large volumes of data, environmental conditions, navigation and flight stability, collision avoidance, and image processing [16]. Another field in data collection that has been studied during the last decade is flight path planning for UAVs. Different flight path optimization techniques such as graph theoretical methods and metaheuristic algorithms [19,20], autonomous flight planning, 3D flight path planning, and obstacle avoidance planning are some of the most significant sub-topics that have been studied [21,22,23]. Debus et al. propose a multi-scale flight path planning algorithm by the careful selection of camera positions which leads to a reduction in the number of required images while achieving the expected resolution in all areas [23]. In addition, some studies have been performing reviews for UAV-based bridge inspection applications and addressing the challenges and future trends [21,22,23]. Mohsan et al. did a comprehensive review of ongoing studies and developments for UAVs considering different UAV types, standardization, and charging techniques, and also provided some solutions and future trends to overcome the current challenges of UAVs [4,24,25,26,27,28,29]. Chan et al. provided a comprehensive review and practical insights into the utilization of UAVs for bridge inspections. The findings highlight the critical role of UAVs in enhancing the effectiveness, safety, and accuracy of visual condition assessments, contributing to the continuous serviceability of bridges [30]. While UAVs offer a potential solution to challenges in traditional bridge inspection, they introduce a unique set of obstacles. Issues such as fisheye camera effects, image distortion, managing a large number of images, image matching, UAV instability, vibration effects, meeting safety requirements, and navigating limitations in accessing certain parts of structures further emphasize the complexities associated with utilizing UAVs for inspection purposes [4]. In this context, a comprehensive and systematic investigation of the data collection strategy for bridge inspection is still missing.
In this study, a framework for the pre-flight phase and data collection process for UAV-based bridge inspection using an HD camera has been developed. The proposed methodology aims to improve the accuracy and quality of the collected data specifically for damage detection for bridges, and consequently to improve the accuracy of the results. Also, this study aims to overcome the challenges related to pre-flight and data collection by proposing simple steps that can be used for real-world bridge inspections by the Department of Transportation (DOT) considering the Specifications for the National Bridge Inventory (SNBI). In the following sections, the study will focus on flight planning and camera calibration, and propose solutions along with a framework for data collection. The remainder of the paper is structured as follows: Section 2 details the methodology for data collection, including flight purpose, hardware selection, flight planning, and sensor calibration; Section 3 discusses the experiments and results; and Section 4 presents the conclusions of this paper.

2. Methodology

This section describes the methodology used to develop the general data collection flowchart of UAV-based bridge inspection, which consists of two phases: pre-flight and an on-site data collection phase. Figure 2 presents the flowchart of the methodology developments. The pre-flight phase consists of defining the inspection purpose, selecting suitable hardware including the UAV platform and camera/sensor, in-lab calibration, and flight planning. Then, on-site calibration and data collection comprise the second phase, where the data (images) for on-site camera calibration and damage detection will be collected at the same time by a remote pilot in control, and finally, these collected data will be processed for damage detection. Although data processing will be used to evaluate the feasibility of the proposed methodology, the main focus of the study is the above-mentioned steps for accurate and high-quality data collection which will also affect the accuracy of the data processing results. It is worth mentioning that this flowchart can be used in a loop to achieve a better data collection methodology by repeating the steps if these phases need to be adjusted multiple times.

2.1. Inspection Purpose and Hardware Selection

The inspection purpose is the primary determinant for equipment selection and flight planning. Neglecting to establish a clear inspection purpose may lead to the choice of inappropriate hardware, resulting in issues such as low-quality data and improper data collection. In the practice of inspection, the quantity of cracks is one of the crucial parameters to assess damage levels.
In this study, we focus on prototyping the pre-flight framework for crack detection and quantification. One of the critical challenges in crack detection is identifying fatigue cracks that can be as small as 0.1 mm in diameter and have lengths less than 7 mm. The effectiveness of UAV-based fatigue crack detection depends on factors such as the choice of platform, environmental conditions, and lighting considerations [31]. Before integrating UAVs into the airspace, careful consideration of various aspects is essential to ensure safe and effective operations [1]. These aspects encompass equipment features, pilot protocols, object qualities, surroundings, and adherence to safety rules. A comprehensive understanding of these factors is crucial for the successful deployment of UAVs. Various factors need to be considered while selecting the UAV platform, including the size and design of the aerial system, the payload capacity, the compatibility with different payloads, the battery capacity, and the control range, including the safe flight distance and duration [32].
Typically, a UAV consists of a frame, motors, a control unit, onboard sensors, a communication system, and a power supply [10,33]. Maximizing UAV performance for bridge inspections involves navigating several challenges, particularly in finding the right balance between payload capacity, endurance, vehicle stability, and navigational capabilities. Figure 3 shows the key parameters that need to be considered for UAV platform and payload selection for bridge inspection purposes. Considering and integrating these parameters and vehicle characteristics into the UAV platform ensures the bridge inspection’s efficiency, safety, and data accuracy. A comprehensive literature review was conducted to evaluate different UAV platforms, gathering information on various UAVs, as shown in Table 1. It is worth noting that these prices are updated in the paper’s publication and might have been changed later. The comparison of each platform’s cost and endurance is illustrated in Figure 4. This kind of comparison and visualization would help to select more suitable hardware. In this study, just price and endurance are shown, but generating more charts of this kind for the price–payload capacity, price–stability, or the endurance–payload capacity would be more beneficial.

2.2. Flight Path Planning

A well-planned flight path is of paramount importance when using UAVs for inspection operations. To unlock the full potential of the UAV, the mission must be carefully designed to encompass all inspection targets [23]. However, path planning for UAV-based bridge inspection presents challenges in finding the optimal or near-optimal path [42]. The flight path comprises a set of camera positions from which images will be captured. These camera positions are determined by their horizontal and vertical distance from the object, as well as the angle of the camera. In this section, camera positions and flight path planning will be discussed to explore the crucial aspects of these elements in UAV-based bridge inspection.
In the process of selecting camera positions, one of the key considerations is the ground sampling distance (GSD). The ground sampling distance refers to the distance between two consecutive pixel centers measured on the ground. It plays a crucial role in determining the spatial resolution of the image and the level of visible details. A larger GSD value corresponds to lower spatial resolution, resulting in fewer visible details in the captured images. Figure 5 provides a visual representation of the GSD and its associated parameters, illustrating its significance in the context of UAV-based bridge inspection.
As shown in Figure 5, H is the flight height in meters, imW is the image width in pixels, F is the real focal length of the camera in millimeters, S W is the sensor width in millimeters, and GSD is the ground sampling distance in centimeters/pixels.
The equation for calculating the GSD is:
G S D = S w × H F × i m W × 100
It is important to decide on the GSD value before starting the image acquisition in order to adjust the flight height and the camera specifications to the project requirements. From Equation (1), the required flight height can be calculated if the GSD is defined for an inspection as below:
H = G S D × F × i m W S w × 100
Also, by knowing the image width and height (imW and imH), it is possible to calculate the width and height of the covered area (image footprint on the ground) in each image as shown in the equation below:
D w = G S D × i m W
D w = G S D × i m W
where imH is the image height in pixels, and D w   a n d   D H are the width and height of a single image footprint on the ground in meters, respectively.
The selection of the GSD and camera positions depends on the specific purpose of the inspection and the characteristics of the payload. Debus et al. propose three distinct levels of interest for conducting the inspection [23]. Pixel specifications of 2.0 mm/pixels, 1.0 mm/pixels, and 0.1 mm/pixels are defined as level 1 (for rough geometry), level 2 (for detailed geometry), and level 3 (for crack detection) of interest, respectively, which provides valuable guidance for tailoring the GSD and camera positions to effectively meet the inspection objectives. Also, according to the Specifications for the National Bridge Inventory 2022 (SNBI) [43], the following quantitative standards are considered to categorize the cracks by their width:
  • Insignificant—crack width less than 0.1016 mm (prestressed) or 0.3048 mm (reinforced), or medium-width cracks that have been sealed.
  • Medium—crack width ranging from 0.1016 to 0.2286 mm (prestressed) or 0.3048–1.27 mm (reinforced).
  • Wide—crack width wider than 0.2286 mm (prestressed) or 1.27 mm (reinforced).
While the defined levels of interest are valuable as a starting point, it is crucial to recognize that they may need to be adjusted based on the specific requirements of each inspection task. Different cases may demand varying levels of interest to effectively address the inspection objectives. To ensure comprehensive coverage and accurate data collection, it is generally recommended to have at least a 50% overlap of images between consecutive camera positions, as suggested by various studies [25]. This overlapping ensures that critical details are captured redundantly, minimizing the risk of missing essential information.

2.3. Camera Calibration

Camera calibration is an essential step to extract metric data from 2D photos in 3D computer vision. Over the years, numerous studies have explored camera calibration, initially in the field of photogrammetry and more recently in the computer vision community [13,14]. In aerial images, pre-calibration or on-the-job calibration is frequently used to handle camera parameters, such as intrinsic parameters and lens distortion coefficients. The goal of camera calibration is to establish the relationship between the 3D-world coordinates of the object and their corresponding 2D-image coordinates, forming the projection matrix.
We assume a point on the object such as X w and the projection of this point in the captured image such as U. Coordinates of these points are as shown below:
X w = x w y w z w
U = u v
where x w ,   y w ,   a n d   z w are the coordinates of a known object in millimeters or inches, and u and v are the coordinates of the projection of that known point in the captured image in pixels. This can be performed for every corresponding point of an object and captured image. For each corresponding point i in the scene and image, we obtain a mapping from the point in 3D coordinates to the image coordinates in 2D using a projection matrix:
u ( i ) v ( i ) 1 = p 11 p 12 p 13 p 14 p 21 p 22 p 23 p 24 p 31 p 32 p 33 p 134 x w ( i ) y w ( i ) z w ( i ) 1
As shown in Equation (7), the only unknown matrix is the projection matrix which should be estimated.
With the fundamental steps for camera calibration, specifically for reference object-based calibration, various patterns and benchmarks can be utilized to perform the calibration. In this study, the commonly used and straightforward checkerboard pattern is employed. Figure 6 displays the two checkerboard patterns utilized for camera calibration in this study. Checkerboard patterns are selected because of their simplicity and almost all the calibration tools are compatible with this type of benchmark. The control points for this pattern are the corners that lie inside the checkerboard. Because corners are extremely small, they are often invariant to perspective and lens distortion. The calibrator apps can also detect partial checkerboards, which can be useful when calibrating cameras with wide-angle lenses. A checkerboard should contain an even number of squares along one edge and an odd number of squares along the other edge, with two black corner squares along one side and two white corner squares on the opposite side. This enables the app to determine the orientation of the pattern and the origin. The calibrator assigns the longer side as the x-direction. A square checkerboard pattern can produce unexpected results for camera extrinsics.
In general, the checkerboard size will not affect the camera calibration process or intrinsic and extrinsic camera parameters very much in mathematical representation. It is important practically but, if their size is within the recommended ranges for calibration tools (such as 15, 20, 30, 40, 50, or 60 mm) considering the distance from the target, it will not affect the crack detection. If the check squares are very small, probably the corners of the squares will not have an appropriate quality and that will make the data “noisier”. It is worth noting that more squares (more corners between squares) will give better results since there will be a more overdetermined system of equations to be solved [44].
For the purpose of camera calibration in this study, the MATLAB camera calibration toolbox will be used, which uses a robust feature detection algorithm based on Zhang’s method [45,46], and this approach will help to reduce potential errors related to feature point detection. By using this method and the checkerboard benchmarks shown above, the internal and external parameters of the camera will be determined. The first important parameter is the reprojection error, which is the distance between a pattern key point detected in a calibration image and a corresponding world point projected into the same image. The acceptable and recommended mean reprojection error is less than 1 pixel but an error less than 0.5 of a pixel is better for a good alignment [47]. Another parameter to consider is the focal length in the x and y directions ( f x , f y ) which is in pixels, and the relation between this focal length and real focal length (F) is shown below:
f x = F × s x
f y = F × s y
where F is the focal length in millimeters, and s x   a n d   s y are the number of pixels per millimeter in the x and y direction, respectively.
In the methodology proposed in this study, there are two kinds of camera calibrations. In-lab camera calibration is a one-time calibration, and it is beneficial for flight path planning based on the intrinsic and extrinsic parameters of the drone’s camera where this calibration gives a better understanding of the required flight plan considering different camera positions (different heights and angles) and their corresponding reprojection errors and distortion. On the other hand, the results of the on-site calibration will give the parameters considering the real-world conditions for the bridge inspection, and due to the stability issues with the drones, these parameters from on-site calibration will result in calculating the exact GSD for the collected data which is crucial for the data processing and crack detection. While the required flight height was determined by using the GSD from the previous section, considering the stability issue with UAVs, there would be a tolerance in the on-site flight. But, using the focal length in pixels from calibration and by knowing the real focal length of the camera in millimeters, the exact GSD for each image can be easily found by using Equations (8) and (9) which would be beneficial for more accurate crack detection. Other than stability, another source of error could be lighting conditions which have been considered and explained in the experiments. Also, some other potential sources of error could be lens distortion, human error, and other environmental factors. To mitigate these errors, as will be presented in the experiments, multiple images have been collected.
Finally, the other important parameter is the radial distortion in the x ( R D x ) and y ( R D y ) directions. Radial distortion is the displacement of image points along radial lines extending from the principal point and it occurs when light rays bend more near the edges of a lens than they do at its optical center.

3. Case Studies and Results

3.1. Inspection Purpose and Hardware Selection

To evaluate the feasibility of the proposed framework, two case studies have been carried out. The purpose of the inspection is generally to detect cracks on the top surface and side surface of the bridge decks. Considering the budget limit, DJI Mavic is the optimal solution for this study.
Two bridges have been selected for the case study. The first bridge is located at 4.8 Mi N of Sierra C/L, New Mexico, United States (NBI bridge number: 01791). This bridge is in fair condition and consists of five simple spans at 39’ each, six steel girders per span, full-height concrete abutments with concrete wingwalls, concrete pier caps on concrete pier walls, and a CIP concrete deck, as shown in Figure 7. The second bridge is in satisfactory condition according to the reports of the New Mexico Department of Transportation and is located at 1.9 Mi W of NM-28/NM-359, New Mexico, United States (NBI bridge number: 06255). The bridge consists of eight spans, two units of four continuous spans at 54 ft, 69 ft-5 in, 69 ft-5 in, and 54 ft, five rolled steel girders per span, concrete stub abutments, concrete pier caps on steel piles, and a CIP concrete deck, as shown in Figure 8.

3.2. In-Lab Calibration

In-lab calibration using various camera positions would be helpful to understand the camera parameters which would be beneficial for flight path planning. Considering the flight height range based on inspection purposes and GSD, various images are captured from different heights, angles, and directions. The results of the camera calibration for these sets of images will lead to better flight path planning and a better selection of camera positions for on-site bridge inspection.
The in-lab calibrations take place in a parking lot at New Mexico State University. During this calibration process, three distinct sets of images are captured from various heights, angles, and directions. Each set contains 36 photos with different heights and angles (shown in Table 2), resulting in a total of 108 different images used for camera calibration. The calibration results are then categorized into three parts, corresponding to the camera’s direction, namely south, east, and north. In Figure 9, an example of captured images is depicted, along with their detected and projected points used for in-lab calibration. This approach of using different groups of images in three separate sets makes it more convenient for an inspector or pilot to create a flight plan, taking into account the calibration results from these different image groups. This division aids in tailoring the flight plan according to specific camera orientations and ensures accurate imaging during the inspection process.
Figure 10, Figure 11 and Figure 12 display the reprojection errors, overall mean error, and trendline obtained from data captured by the camera in the eastward, northward, and southward directions, respectively. The overall mean reprojection error, as well as the focal length in the x and y directions, and radial distortion in the x and y directions are calculated based on Equation (7), and by using MATLAB camera calibration, and presented in Table 3 for all three groups of images. When comparing the overall mean reprojection error with the individual error of each image within each group, it is observed that 41.7%, 33.3%, and 36.1% of the images have a higher error than the mean error for eastward, northward, and southward groups, respectively. Also, the images captured from the south direction have a noticeably lower overall mean error. It is worth mentioning that two images from the east side were rejected during calibration data processing due to the high reflection of sunlight on the benchmark. This analysis provides valuable insights into the accuracy and consistency of the calibration results for this set of images. By considering these results, the southward pictures which are in the direction of the back to the sun have less mean reprojection error than the other sides and in this set of images, pictures with a height between 2 m and 3 m have fewer reprojection errors. Finally, the images which have been captured from angles 30 to 45 have less reprojection error. This information will be used in the next step for better flight path planning.

3.3. Flight Path Planning

It is important to note that the real focal length of the visual camera provided by the manufacturer is 4.3 mm, which will be utilized for flight planning, particularly in determining camera positions, and the image size is 4056 × 3040 pixels. In order to facilitate flight planning for this camera, various heights have been generated using the GSD equations and the camera’s given specifications.
For the purpose of this study and experiment, which focuses on the top and side surface crack detection on bridge decks (level 3 interest), two different flight heights have been chosen for the inspection of the surface of the deck (2 and 3 m) and three horizontal distances have been chosen for the inspection of the side of the deck (2, 3, and 4 m) considering the GSD calculations from flight path planning section and the results of the in-lab camera calibration to achieve less image distortion and fewer reprojection errors in order to obtain more accurate results after data processing for crack detection.
Regarding the bridge inspection, the focus is on the deck of the bridge, and the FAA regulations require the flight to be conducted away from the traffic. Therefore, the flights should be performed off the road near the edge of the deck. Also, it is worth mentioning that the UAV is equipped with LiDAR sensors to avoid obstacles or unexpected objects.
The first bridge is oriented along the southeast to northwest direction, and for optimal lighting conditions, the flight will take place in the morning. It is preferred to capture photos from the east part of the deck to position the camera with the sunlight behind it. This arrangement will improve the image quality by minimizing unwanted reflections. Also, the second bridge is oriented along the east-to-west direction, and for the conditions mentioned above, the photos are captured from the south part of the bridge. Considering the length of the bridges, images are captured at intervals of 10 ft, ensuring a minimum overlap of 50% between consecutive images. A visual representation of the flight plan is depicted in Figure 13 for the first bridge. As shown in this figure, the flight paths for the top and side of the deck are straight lines parallel to the bridge orientation and with the transverse distances from the deck of the bridge as shown in Table 4 and Table 5. The positions of the UAV on the east part of the deck for photo capture are indicated by orange signs. Additionally, black rectangular signs mark the locations of benchmarks for camera calibration, located on the shoulder of the road, which will be discussed later. It is worth mentioning that the flight plan for the second bridge is similar to that of the first bridge and only the length of the bridge is different. Additionally, for the second bridge, only one unit of the bridge is inspected to have the same number of images for both bridges to ensure the comparison of the results will be more realistic.
For the data collection, four different flight plans are generated for the top surface of the deck for each bridge, and three flight plans are generated for the side surface of the deck for each bridge. These flight plans maintain the same locations for the UAV positioned along a straight line, but they differ in terms of flight height, camera angles, and transverse distances from the edge of the deck. Table 4 shows the flight plans for the top surface of the bridges and Table 5 shows the flight plans for the side surface of the bridges.

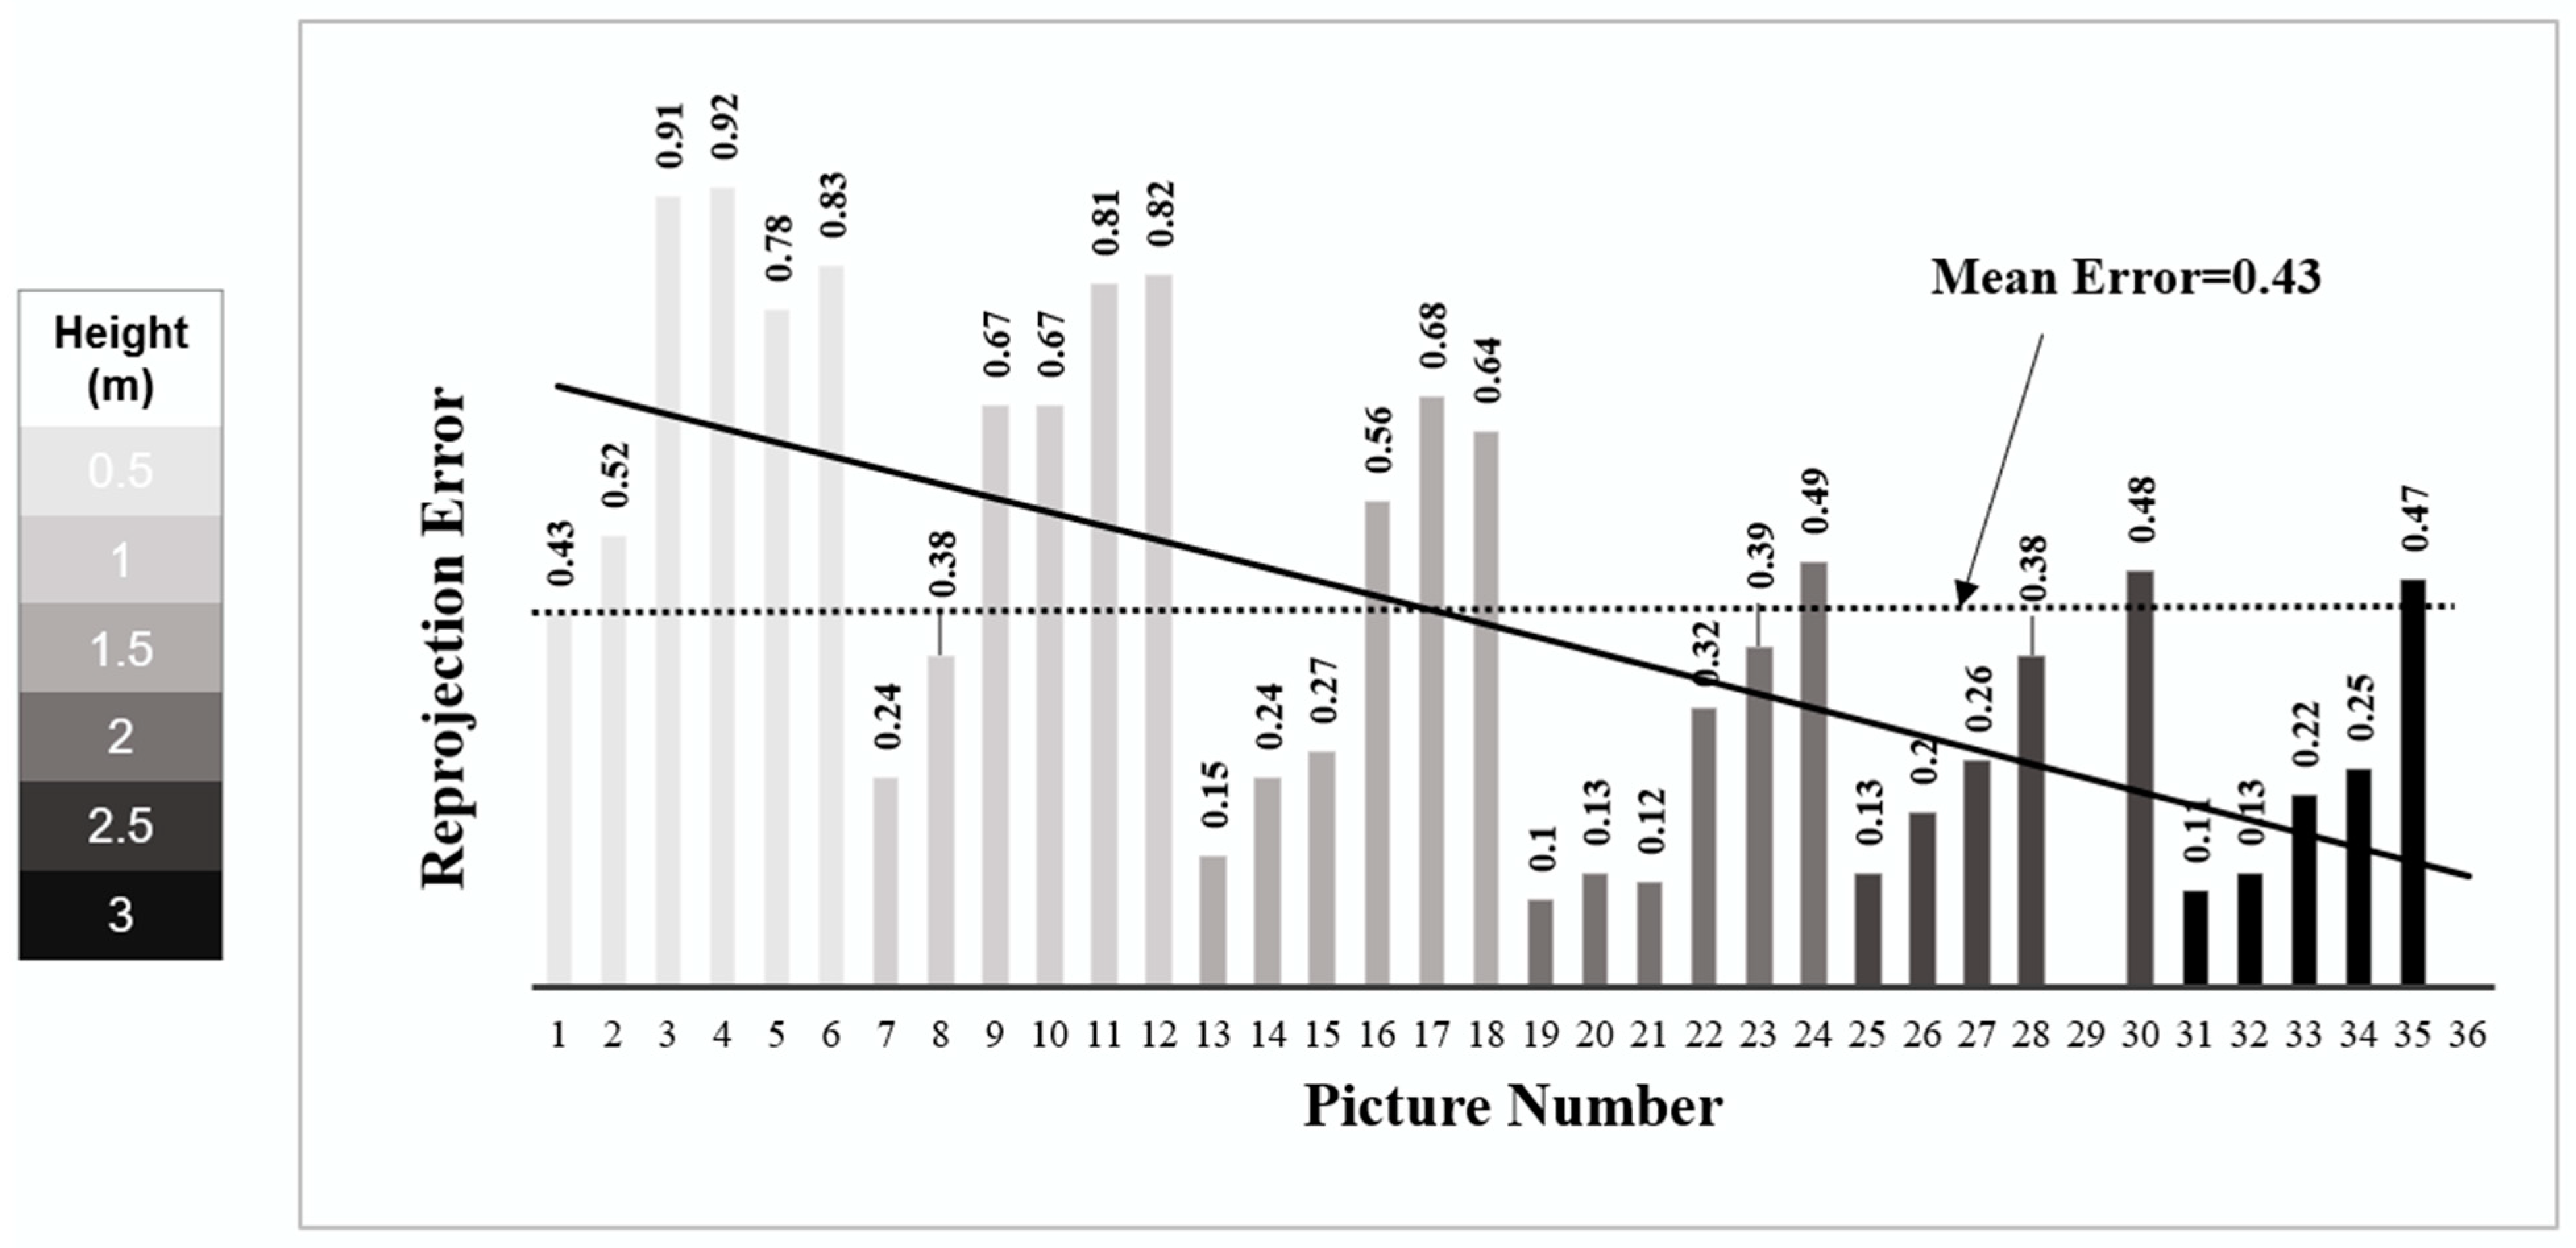
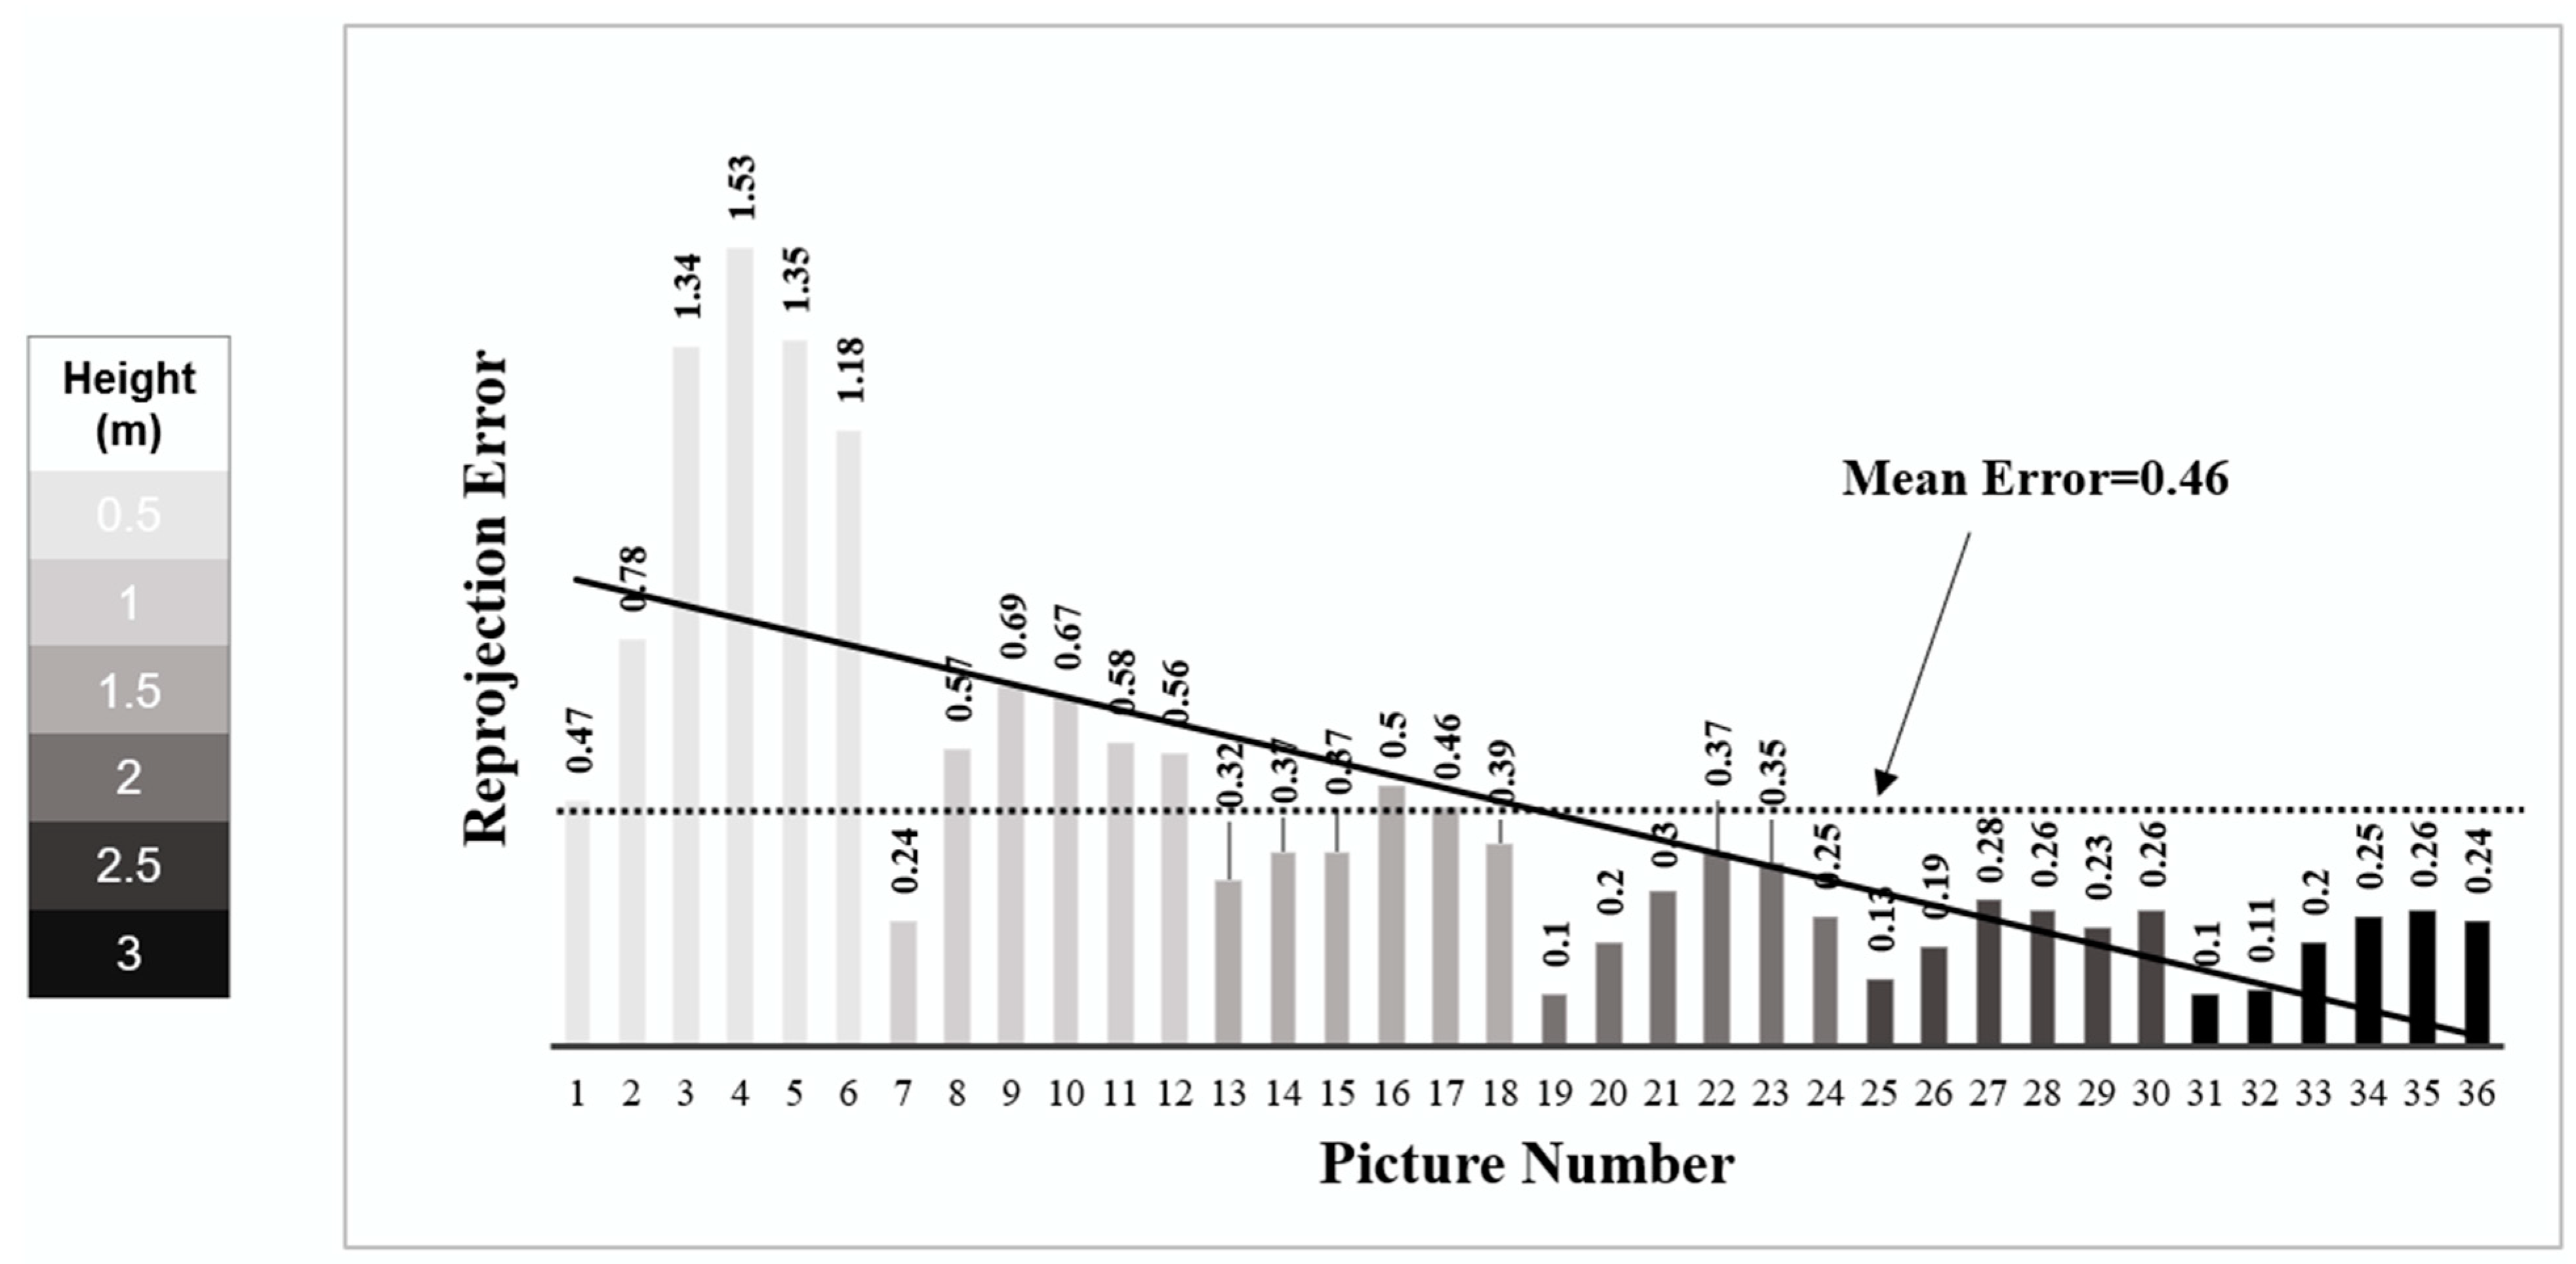
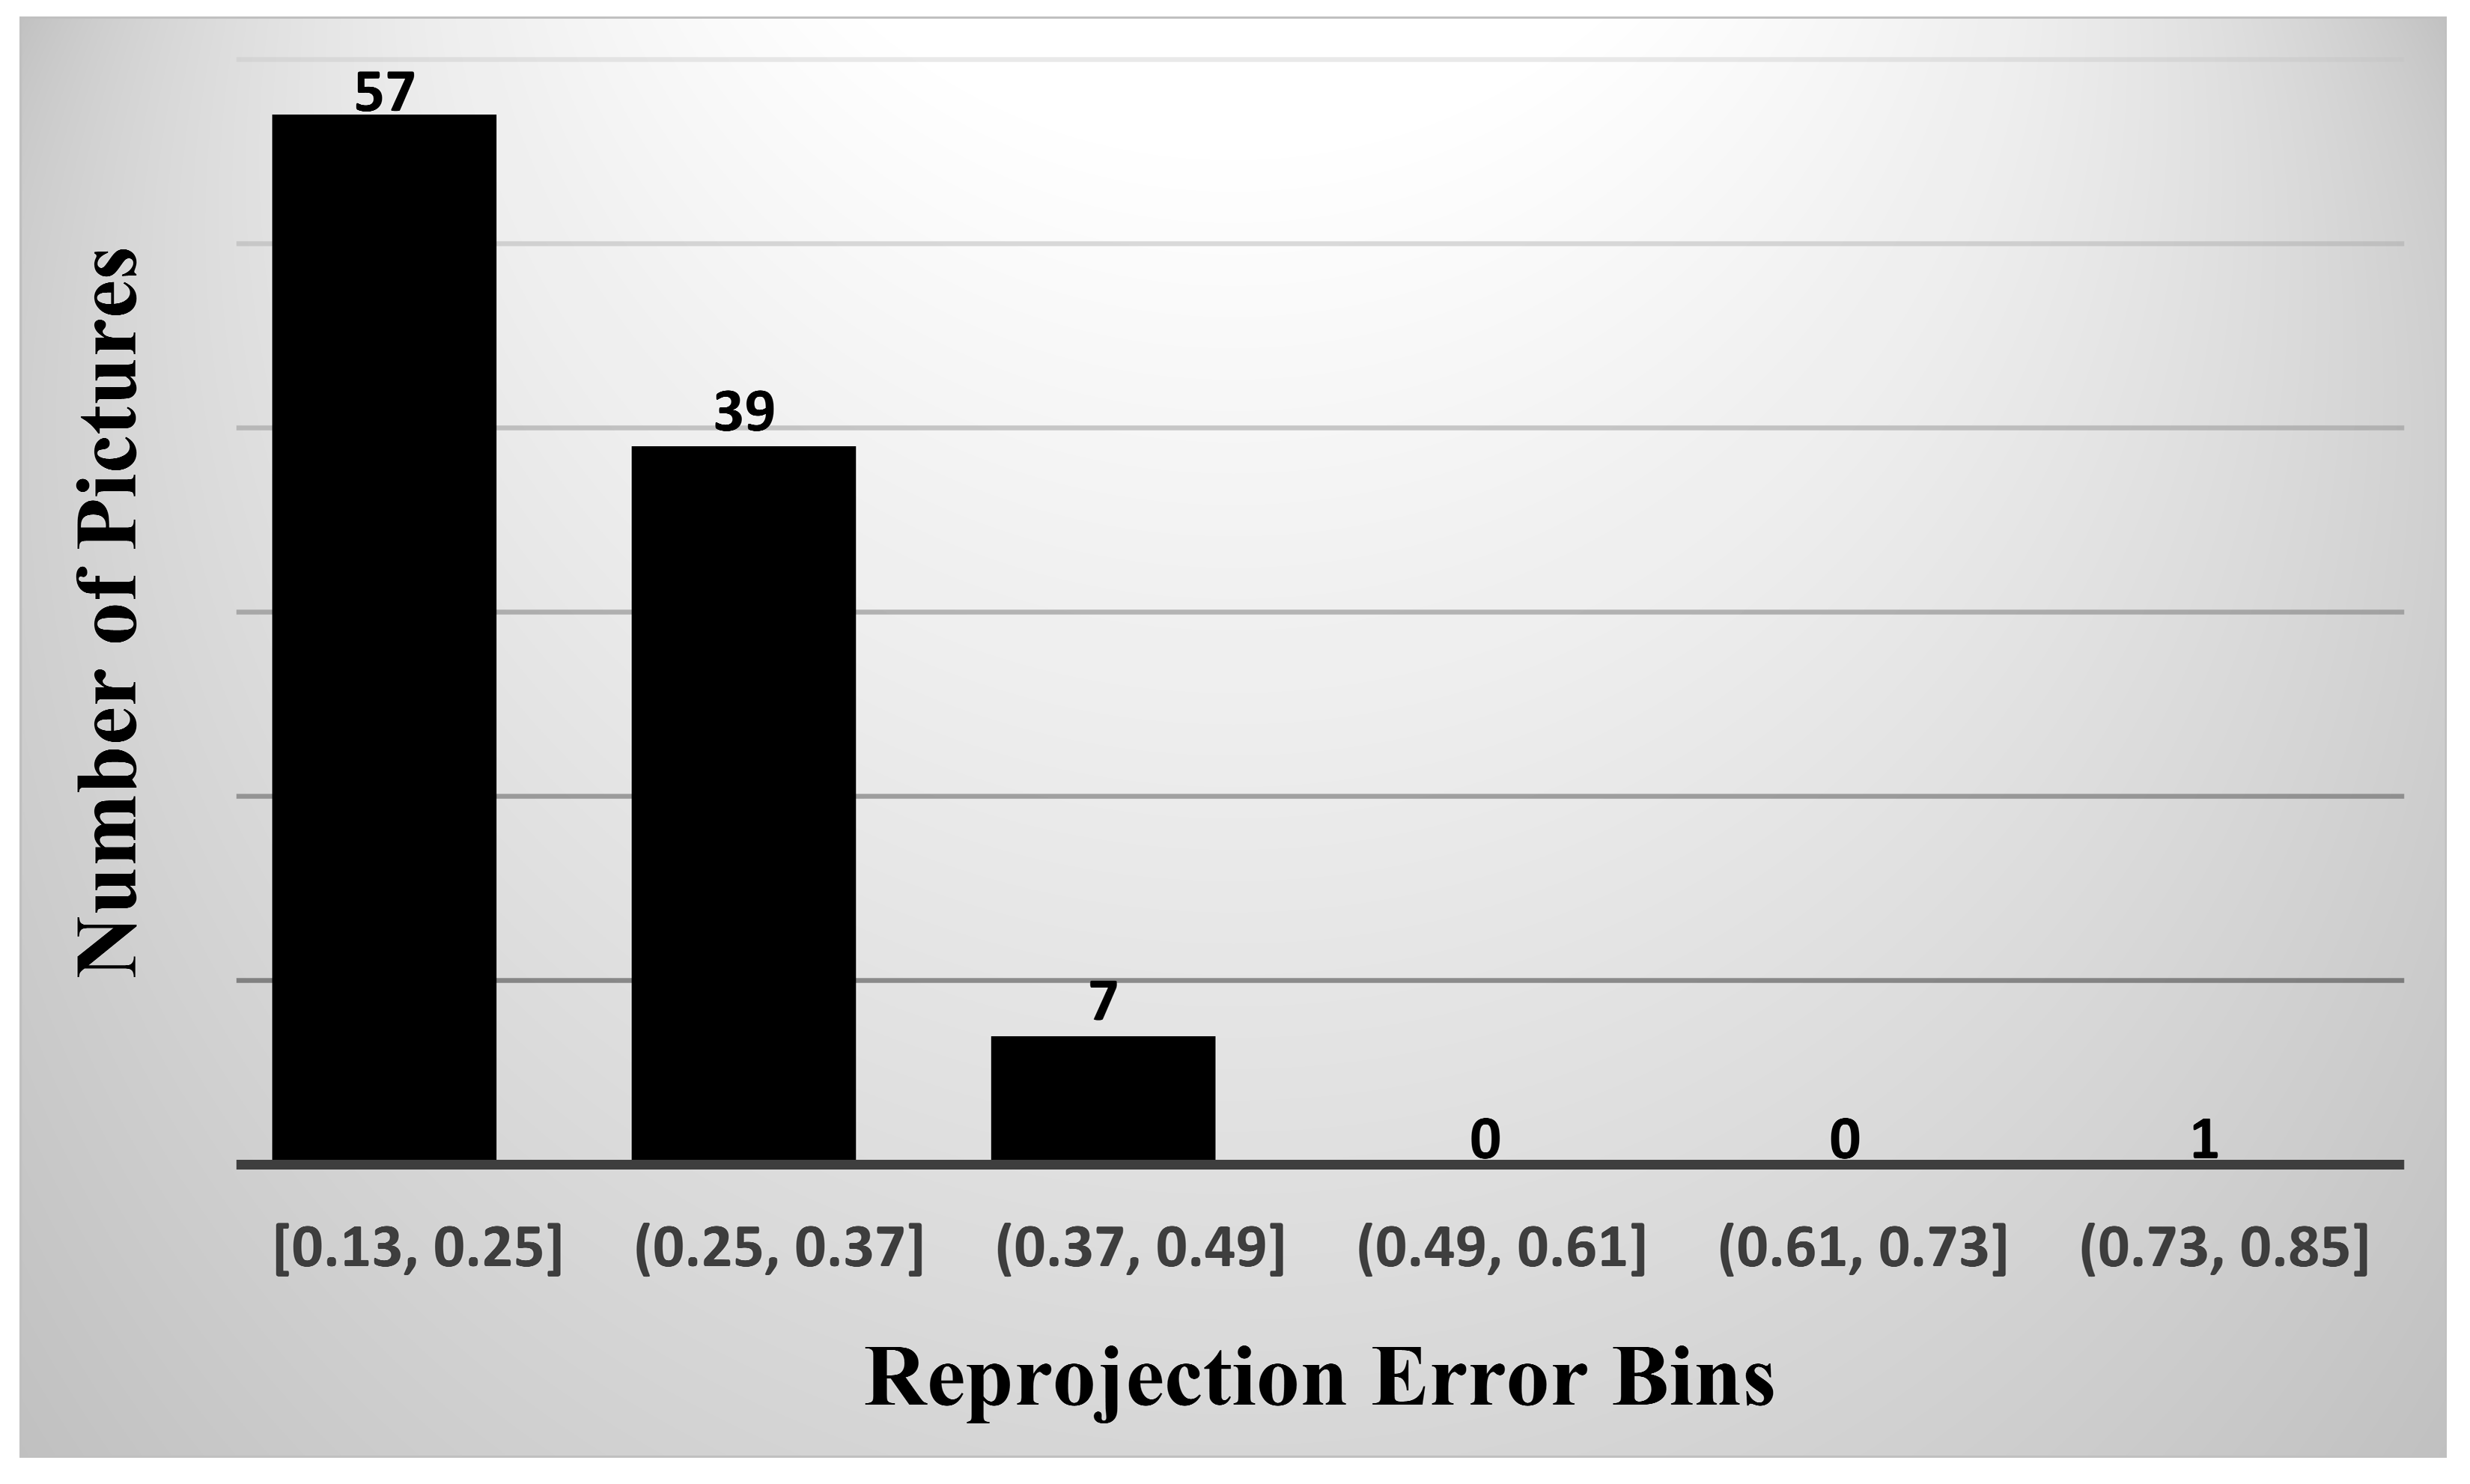
3.4. On-Site Camera Calibration

On-site camera calibration offers the advantage of using the same camera parameters and distortion values for the collected bridge inspection data. To achieve on-site camera calibration, benchmarks are attached to specific parts of the bridge that will be covered in the inspection images. Then, the camera calibration can be performed directly during the bridge inspection simply by capturing the photos. Also, the study is not only limited to the top of the deck, and a calibration process is tested for the side of the deck for both bridges. Although the results of camera calibration for the top of the deck can be used for the side of the deck, a separate calibration for the side surface would give better and more accurate results to use for the inspection of the side of the deck. The reason for this difference in the calibration of the top and side of the deck is generated from the different photographic situations and parameters. As an example, the camera angle during the data collection for the top of the deck is different from the angle of the camera for the side of the deck, which is zero. Another example for this reason is the lighting and reflection of the light which is different for the top of the deck and the side of the deck.
In Figure 14, a collection of images is displayed from the on-site camera calibration process conducted on the first bridge for the top surface and side surface of the deck for this study’s experiment. As indicated in the flight path schematic, a total of 13 benchmarks are strategically placed on the bridge deck, positioned near the edge of the bridge at regular intervals of approximately 20 feet.
A total of 104 images from the bridge inspection dataset are utilized from each bridge’s top surface for camera calibration and the estimation of camera parameters and reprojection errors. The specific details of these images, such as flight height, transverse distance from the edge of the deck, and camera angles have been presented in Table 4. For the side of the deck, six benchmarks have been used and a total of 18 images (from 3 flights) are captured for each bridge. The details of the flight are shown in Table 5.
In Table 6, the overall mean reprojection error, as well as the focal length in the x and y directions, and the radial distortion in the x and y directions for the top surface of the first bridge are displayed for these 104 images undergoing on-site calibration. Also, in Table 7, the mentioned results are displayed for the side surface of the first bridge.
Figure 15 visually represents the histogram of the reprojection mean errors of the images for the top of the first bridge and Figure 16 represents the same histogram for the side surface of the bridge. The first bin in each histogram shows the number of images with a mean error lower than the overall mean error. This graphical representation aids in understanding the distribution and dispersion of the reprojection errors within the dataset. Comparing the mean error of each image with the overall mean error reveals that 55% of the images have a lower mean error than the overall mean error for the top surface of the first bridge and 56% of the images for the side surface have a lower mean error than the overall mean error. This analysis provides insights into the variations in calibration accuracy among the different images. Also, as mentioned before, these low reprojection errors are achieved by considering the results of the in-lab calibration, and the main advantage of this approach will be discussed in validation.
In Figure 17, a collection of images is displayed from the on-site camera calibration process conducted on the second bridge for the top and side surfaces of the deck for this study’s experiment.
In Table 8 and Table 9, the overall mean reprojection error, as well as the focal length in the x and y directions, and the radial distortion in the x and y directions for the top and side surfaces of the second bridge are displayed for undergoing on-site calibration.
Figure 18 visually represents the histogram of the reprojection mean errors of the images for the top of the second bridge and Figure 19 represents the same histogram for the side surface of the bridge. The first bin in each histogram shows the number of images with a mean error lower than the overall mean error. This graphical representation aids in understanding the distribution and dispersion of the projection errors within the dataset. Comparing the mean error of each image with the overall mean error reveals that 68% of the images have a lower mean error than the overall mean error for the top surface of the bridge and 69% of the images for the side surface of the bridge have a lower mean error than the overall mean error. Comparing the results for the side and top of the deck for both bridges indicates that the percentage of images with lower mean errors than the overall mean error is almost the same for the side and top of each bridge (only a 1% difference for the side and top of each bridge).
It is worth mentioning that among all the flight plans mentioned before, the minimum reprojection mean error for both bridges is achieved in the flight with a 3 m height, a 1 m transversal distance, and a camera angle of 30 for the top surface and transverse distance of 3 m for the side surface, which aligns with the results of in-lab calibration. This result will be beneficial for future inspection and flight plans.

3.5. Validation

To evaluate the feasibility of the proposed method, validations have been conducted for case studies. Two cracks from the bridge deck side surface were chosen for validation investigations. The widths of the cracks were measured from both the raw and calibrated images and subsequently compared with the ground truth measured by the inspector.
The width of the first crack is 0.51 mm, and the width of the second crack is 1.53 mm. The cracks are shown in Figure 20 and Figure 21 respectively. For crack detection in this study, the GSD is known from flight height and moreover, the accurate GSD is known from the calibration results, which is another benefit of on-site camera calibration. By knowing the GSD, each pixel represents a known number of millimeters. The crack width is detected from raw data by image processing techniques, then the crack width is detected from the images after correction by using the calibration and reprojection results. For this purpose, first, the original image is converted to grayscale and the contrast of the grayscale image is enhanced. Then, adaptive thresholding is applied to create a binary image and finally, Gaussian smoothing is applied to the binary image to reduce noise and create smoother edges, facilitating more accurate crack detection.
The crack width detection results considering the flight plans for the side of the deck are shown in Table 10 for the first crack and in Table 11 for the second crack. Finally, the percentage of the detection accuracy is compared between these two results. For both cracks, the results indicate that the result accuracy improvement is higher for the higher flight heights (more distance from the object). Also, the detected crack width is closer to the measured width in flight 2 which has a 3 m distance from the object and it completely aligns with the results of camera calibration where the 3 m flight had the minimum reprojection error. Moreover, it is worth mentioning that for small dimension cracks, the human measurement has more error, and using this kind of accurate crack detection technique leads to better assessments of the bridge condition.
The validation for the case studies indicates an improvement in result accuracy from 7.19% to 21.57% and it shows that the improvement is higher for longer distances, which means that inspection can be carried out even over longer distances where more area is covered by each image and consequently less camera points are needed, which leads to a shorter flight time.

4. Conclusions

Utilizing UAVs presents a promising alternative to address certain challenges associated with traditional bridge inspection methods. While this platform offers numerous benefits, it also comes with its own set of challenges. Overcoming these obstacles is crucial to achieving an efficient, time-saving, and cost-effective bridge inspection process. To fully harness the potential of UAVs, continued advancements in UAV technology, sensors, and data processing methods are essential, encouraging further exploration and research in various domains to enhance the platform’s efficiency. This paper has outlined a comprehensive method for pre-flight preparation and data collection in bridge inspection using UAVs, which significantly impacts data quality and data processing. Diverse aspects of data collection, including flight objectives, hardware selection, flight path planning, and camera calibration, have been thoroughly examined in this study. Moreover, the efficacy of the proposed method has been validated through its successful application in a real bridge inspection project. The findings underscore that the implementation of the proposed pre-flight planning approach enhances the accuracy of damage detection and facilitates the quality assurance of the collected data. In conclusion, this study lays a solid foundation for the dependable implementation of UAV-based infrastructure inspections. By addressing key challenges and offering practical solutions, UAVs have the potential to revolutionize bridge inspection, making it more effective and efficient for maintaining and evaluating critical infrastructure.

Author Contributions

The authors confirm contributions to the paper as follows: study conception and design: Q.Z. and Z.W.; data collection: P.A. and Y.X.; analysis and interpretation of results: P.A., Y.X., R.P., Q.Z. and Z.W.; draft manuscript preparation: P.A., R.P., Q.Z., J.B., D.J. and Z.W. All authors have read and agreed to the published version of the manuscript.

Funding

New Mexico Department of Transportation.

Data Availability Statement

Dataset available on request from the authors.

Acknowledgments

The research reported in this paper was conducted under a project sponsored by the NMDOT Research Bureau. Q.Z. acknowledges the startup fund from the College of Engineering at the New Mexico State University.

Conflicts of Interest

The authors declare no conflicts of interest.

References

  1. Feroz, S.; Abu Dabous, S. UAV-Based Remote Sensing Applications for Bridge Condition Assessment. Remote Sens. 2021, 13, 1809. [Google Scholar] [CrossRef]
  2. Black, A.P. 2022 Bridge Report; American Road & Transportation Builders Association. 2022. Available online: https://artbabridgereport.org/reports/2022-ARTBA-Bridge-Report.pdf (accessed on 1 January 2020).
  3. Zhang, Q.; Ro, S.H.; Wan, Z.; Babanajad, S.; Braley, J.; Barri, K.; Alavi, A.H. Automated Unmanned Aerial Vehicle-Based Bridge Deck Delamination Detection and Quantification. Transp. Res. Rec. J. Transp. Res. Board 2023, 2677, 036119812311554. [Google Scholar] [CrossRef]
  4. Xiang, T.-Z.; Xia, G.-S.; Zhang, L. Mini-Unmanned Aerial Vehicle-Based Remote Sensing: Techniques, applications, and prospects. IEEE Geosci. Remote Sens. Mag. 2019, 7, 29–63. [Google Scholar] [CrossRef]
  5. Duque, L.; Seo, J.; Wacker, J. Bridge Deterioration Quantification Protocol Using UAV. J. Bridge Eng. 2018, 23, 04018080. [Google Scholar] [CrossRef]
  6. Aliyari, M.; Droguett, E.L.; Ayele, Y.Z. UAV-Based Bridge Inspection via Transfer Learning. Sustainability 2021, 13, 11359. [Google Scholar] [CrossRef]
  7. Mohan, A.; Poobal, S. Crack detection using image processing: A critical review and analysis. Alex. Eng. J. 2018, 57, 787–798. [Google Scholar] [CrossRef]
  8. Deng, J.; Singh, A.; Zhou, Y.; Lu, Y.; Lee, V.C.-S. Review on computer vision-based crack detection and quantification methodologies for civil structures. Constr. Build. Mater. 2022, 356, 129238. [Google Scholar] [CrossRef]
  9. Li, H.; Wang, W.; Wang, M.; Li, L.; Vimlund, V. A review of deep learning methods for pixel-level crack detection. J. Traffic Transp. Eng. (Engl. Ed.) 2022, 9, 945–968. [Google Scholar] [CrossRef]
  10. Sreenath, S.; Malik, H.; Husnu, N.; Kalaichelavan, K. Assessment and Use of Unmanned Aerial Vehicle for Civil Structural Health Monitoring. Procedia Comput. Sci. 2020, 170, 656–663. [Google Scholar] [CrossRef]
  11. Dorafshan, S.; Thomas, R.J.; Coopmans, C.; Maguire, M. A Practitioner’s Guide to Small Unmanned Aerial Systems for Bridge Inspection. Infrastructures 2019, 4, 72. [Google Scholar] [CrossRef]
  12. Almasi, P.; Premadasa, R.; Rouhbakhsh, S.; Xiao, Y.; Wan, Z.; Zhang, Q. A Review of Developments and Challenges of Preflight Preparation for Data Collection of UAV-based Infrastructure Inspection. CTCSE 2024, 10. [Google Scholar] [CrossRef]
  13. Yanagi, H.; Chikatsu, H. Camera Calibration in 3d Modelling for UAV Application. Int. Arch. Photogramm. Remote Sens. Spatial Inf. Sci. 2015, XL-4/W5, 223–226. [Google Scholar] [CrossRef]
  14. Cramer, M.; Przybilla, H.-J.; Zurhorst, A. UAV Cameras: Overview and Geometric Calibration Benchmark. Int. Arch. Photogramm. Remote Sens. Spatial Inf. Sci. 2017, XLII-2/W6, 85–92. [Google Scholar] [CrossRef]
  15. Aasen, H.; Honkavaara, E.; Lucieer, A.; Zarco-Tejada, P. Quantitative Remote Sensing at Ultra-High Resolution with UAV Spectroscopy: A Review of Sensor Technology, Measurement Procedures, and Data Correction Workflows. Remote Sens. 2018, 10, 1091. [Google Scholar] [CrossRef]
  16. Ameli, Z.; Aremanda, Y.; Friess, W.A.; Landis, E.N. Impact of UAV Hardware Options on Bridge Inspection Mission Capabilities. Drones 2022, 6, 64. [Google Scholar] [CrossRef]
  17. Mahama, E.; Karimoddini, A.; Khan, M.A.; Cavalline, T.L.; Hewlin, R.L.; Smith, E.; Homaifar, A. Testing and Evaluating the Impact of Illumination Levels on UAV-assisted Bridge Inspection. In Proceedings of the 2022 IEEE Aerospace Conference (AERO), Big Sky, MT, USA, 5–12 March 2022; pp. 1–8. [Google Scholar] [CrossRef]
  18. Nasimi, R.; Moreu, F.; Fricke, G.M. Sensor Equipped UAS for Non-Contact Bridge Inspections: Field Application. Sensors 2023, 23, 470. [Google Scholar] [CrossRef] [PubMed]
  19. Kaveh, A.; Almasi, P.; Khodagholi, A. Optimum Design of Castellated Beams Using Four Recently Developed Meta-heuristic Algorithms. Iran J. Sci. Technol. Trans. Civ. Eng. 2023, 47, 713–725. [Google Scholar] [CrossRef]
  20. Kaveh, A.; Zaerreza, A. Shuffled Shepherd Optimization Method: A New Meta-Heuristic Algorithm. In Structural Optimization Using Shuffled Shepherd Meta-Heuristic Algorithm; Studies in Systems, Decision and Control; Springer Nature: Cham, Switzerland, 2023; Volume 463, pp. 11–52. [Google Scholar] [CrossRef]
  21. Jung, S.; Song, S.; Kim, S.; Park, J.; Her, J.; Roh, K.; Myung, H. Toward Autonomous Bridge Inspection: A framework and experimental results. In Proceedings of the 2019 16th International Conference on Ubiquitous Robots (UR), Jeju, Republic of Korea, 24–27 June 2019; pp. 208–211. [Google Scholar] [CrossRef]
  22. Bolourian, N.; Hammad, A. LiDAR-equipped UAV path planning considering potential locations of defects for bridge inspection. Autom. Constr. 2020, 117, 103250. [Google Scholar] [CrossRef]
  23. Debus, P.; Rodehorst, V. Multi-scale Flight Path Planning for UAS Building Inspection. In Proceedings of the 18th International Conference on Computing in Civil and Building Engineering; Toledo Santos, E., Scheer, S., Eds.; Lecture Notes in Civil Engineering; Springer International Publishing: Cham, Switzerland, 2021; Volume 98, pp. 1069–1085. [Google Scholar] [CrossRef]
  24. Morgenthal, G.; Hallermann, N.; Kersten, J.; Taraben, J.; Debus, P.; Helmrich, M.; Rodehorst, V. Framework for automated UAS-based structural condition assessment of bridges. Autom. Constr. 2019, 97, 77–95. [Google Scholar] [CrossRef]
  25. Liu, Y.; Nie, X.; Fan, J.; Liu, X. Image-based crack assessment of bridge piers using unmanned aerial vehicles and three-dimensional scene reconstruction. Comput.-Aided Civ. Infrastruct. Eng. 2020, 35, 511–529. [Google Scholar] [CrossRef]
  26. Li, H.; Chen, Y.; Liu, J.; Zhang, Z.; Zhu, H. Unmanned Aircraft System Applications in Damage Detection and Service Life Prediction for Bridges: A Review. Remote Sens. 2022, 14, 4210. [Google Scholar] [CrossRef]
  27. Kim, I.-H.; Yoon, S.; Lee, J.H.; Jung, S.; Cho, S.; Jung, H.-J. A Comparative Study of Bridge Inspection and Condition Assessment between Manpower and a UAS. Drones 2022, 6, 355. [Google Scholar] [CrossRef]
  28. Toriumi, F.Y.; Bittencourt, T.N.; Futai, M.M. UAV-based inspection of bridge and tunnel structures: An application review. Rev. IBRACON Estrut. Mater. 2023, 16, e16103. [Google Scholar] [CrossRef]
  29. Mohsan, S.A.H.; Othman, N.Q.H.; Li, Y.; Alsharif, M.H.; Khan, M.A. Unmanned aerial vehicles (UAVs): Practical aspects, applications, open challenges, security issues, and future trends. Intel. Serv. Robot. 2023, 16, 109–137. [Google Scholar] [CrossRef] [PubMed]
  30. Chan, B.; Guan, H.; Jo, J.; Blumenstein, M. Towards UAV-based bridge inspection systems: A review and an application perspective. Struct. Monit. Maint. 2015, 2, 283–300. [Google Scholar] [CrossRef]
  31. Dorafshan, S.; Campbell, L.E.; Maguire, M.; Connor, R.J. Benchmarking Unmanned Aerial Systems-Assisted Inspection of Steel Bridges for Fatigue Cracks. Transp. Res. Rec. 2021, 2675, 154–166. [Google Scholar] [CrossRef]
  32. Xu, Y.; Turkan, Y. BrIM and UAS for bridge inspections and management. ECAM 2019, 27, 785–807. [Google Scholar] [CrossRef]
  33. Greenwood, W.W.; Lynch, J.P.; Zekkos, D. Applications of UAVs in Civil Infrastructure. J. Infrastruct. Syst. 2019, 25, 04019002. [Google Scholar] [CrossRef]
  34. Dorafshan, S.; Maguire, M. Bridge inspection: Human performance, unmanned aerial systems and automation. J. Civil. Struct. Health Monit. 2018, 8, 443–476. [Google Scholar] [CrossRef]
  35. Kalaitzakis, M. Uncrewed Aircraft Systems for Autonomous Infrastructure Inspection. Ph.D. Thesis, University of South Carolina, Columbia, SC, USA, 2022. [Google Scholar]
  36. Seo, J.; Duque, L.; Wacker, J. Drone-enabled bridge inspection methodology and application. Autom. Constr. 2018, 94, 112–126. [Google Scholar] [CrossRef]
  37. Wells, J.; Lovelace, B.; Collins Engineers, Inc. Unmanned Aircraft System Bridge Inspection Demonstration Project Phase II Final report. MN/RC 2017-18, Jun. 2017. Available online: https://rosap.ntl.bts.gov/view/dot/32636 (accessed on 2 January 2017).
  38. Phung, M.D.; Hoang, V.T.; Dinh, T.H.; Ha, Q. Automatic Crack Detection in Built Infrastructure Using Unmanned Aerial Vehicles. arXiv 2017, arXiv:1707.09715. [Google Scholar]
  39. Dorafshan, S.; Thomas, R.J.; Maguire, M. Fatigue Crack Detection Using Unmanned Aerial Systems in Fracture Critical Inspection of Steel Bridges. J. Bridge Eng. 2018, 23, 04018078. [Google Scholar] [CrossRef]
  40. Omar, T.; Nehdi, M.L. Remote sensing of concrete bridge decks using unmanned aerial vehicle infrared thermography. Autom. Constr. 2017, 83, 360–371. [Google Scholar] [CrossRef]
  41. Escobar-Wolf, R.; Oommen, T.; Brooks, C.N.; Dobson, R.J.; Ahlborn, T.M. Unmanned Aerial Vehicle (UAV)-Based Assessment of Concrete Bridge Deck Delamination Using Thermal and Visible Camera Sensors: A Preliminary Analysis. Res. Nondestruct. Eval. 2018, 29, 183–198. [Google Scholar] [CrossRef]
  42. Canny, J.; Reif, J. New lower bound techniques for robot motion planning problems. In Proceedings of the 28th Annual Symposium on Foundations of Computer Science (sfcs 1987), Los Angeles, CA, USA, 27–29 October 1987; pp. 49–60. [Google Scholar] [CrossRef]
  43. Specifications for the National Bridge Inventory. 2022. Available online: https://link.springer.com/chapter/10.1007/978-3-030-00764-5_57 (accessed on 1 January 2020).
  44. Yu, S.; Zhu, R.; Yu, L.; Ai, W. Effect of Checkerboard on the Accuracy of Camera Calibration. In Proceedings of the Advances in Multimedia Information Processing–PCM 2018: 19th Pacific-Rim Conference on Multimedia, Hefei, China, 21–22 September 2018. [Google Scholar]
  45. MATLAB. The MathWorks, Inc., (R2023b). Available online: https://www.mathworks.com (accessed on 1 January 2020).
  46. Zhang, Z. A flexible new technique for camera calibration. IEEE Trans. Pattern Anal. Machine Intell. 2000, 22, 1330–1334. [Google Scholar] [CrossRef]
  47. Pix4D. Reprojection Error. Available online: https://support.pix4d.com/hc/en-us/articles/202559369-Reprojection-error (accessed on 1 January 2020).
Figure 1. General workflow of UAV-based bridge inspection.
Drones 08 00386 g001
Figure 2. Flowchart of preparation steps of data collection for UAV-based bridge inspection.
Drones 08 00386 g002
Figure 3. Considerable parameters for UAV platform and payload selection.
Drones 08 00386 g003
Figure 4. Cost–endurance relation of different UAV platforms.
Drones 08 00386 g004
Figure 5. GSD example with related parameters.
Drones 08 00386 g005
Figure 6. Checkerboard patterns for camera calibration. (a) Size of 297 mm × 400 mm with check square size of 50 mm. (b) Size of 400 mm × 600 mm with check square size of 40 mm.
Drones 08 00386 g006
Figure 7. Profile view of the first bridge facing north (NBI number: 01791).
Drones 08 00386 g007
Figure 8. Profile view of the second bridge facing south (NBI number: 06255).
Drones 08 00386 g008
Figure 9. Different pictures from in-lab calibration with shown detected and reprojected points.
Drones 08 00386 g009
Figure 10. The reprojection errors of the pictures from the east side and the overall mean error.
Drones 08 00386 g010
Figure 11. The reprojection errors of the pictures from the north side and the overall mean error.
Drones 08 00386 g011
Figure 12. The reprojection errors of the pictures from the south side and the overall mean error.
Drones 08 00386 g012
Figure 13. Schematic view of the flight plan for the first bridge (NBI number: 01791).
Drones 08 00386 g013
Figure 14. On-site camera calibration examples for the first bridge (NBI bridge number: 01791).
Drones 08 00386 g014
Figure 15. Histogram for the distribution of the images according to their mean reprojection errors for the top surface of the first bridge (NBI bridge number: 01791).
Drones 08 00386 g015
Figure 16. Histogram for the distribution of the images according to their mean reprojection errors for the side surface of the first bridge (NBI bridge number: 01791).
Drones 08 00386 g016
Figure 17. On-site camera calibration examples for the second bridge (NBI bridge number: 06255).
Drones 08 00386 g017
Figure 18. Histogram for the distribution of the images according to their mean reprojection errors for the top surface of the second bridge (NBI bridge number: 06255).
Drones 08 00386 g018
Figure 19. Histogram for the distribution of the images according to their mean reprojection errors for the side surface of the second bridge (NBI bridge number: 06255).
Drones 08 00386 g019
Figure 20. The first crack with a width of 0.51 mm on the side of the first bridge.
Drones 08 00386 g020
Figure 21. The second crack with a width of 1.53 mm on the side of the first bridge.
Drones 08 00386 g021
Table 1. Examples of UAVs with some specs and related research.
UAV PlatformPrice ($)Max Endurance (Minutes)Payload Capacity (kg)Related Research
DJI Mavic 22700311[34]
Aurelia X6 Standard LE5700455[35]
DJI Phantom 43000301[36]
senseFly Albris200022N/A[37]
3DR Solo1000151.5[38]
3DR Iris750220.4[39]
DJI Inspire 1 Pro3900183.4[40]
Bergen hexacopter6000305[41]
Table 2. Heights and angles for in-lab calibration for each direction.
Heights (m)Angles (°)
0.5, 1, 1.5, 2, 2.5, 315, 30, 45, 60, 75, 90
Table 3. Results of the camera calibration for the images from the east side.
East Direction
Overall Mean Error (pixels)x Focal Length (pixels)y Focal Length (pixels)x Radial Distortion (pixels)y Radial Distortion (pixels)
0.43 f x = 3199 f y = 3193 R D x = 0.0548 R D y = 0.2710
North Direction
Overall Mean Error (pixels)x Focal Length (pixels)y Focal Length (pixels)x Radial Distortion (pixels)y Radial Distortion (pixels)
0.46 f x = 2993 f y = 2995 R D x = 0.0184 R D y = 0.2410
South Direction
Overall Mean Error (pixels)x Focal Length (pixels)y Focal Length (pixels)x Radial Distortion (pixels)y Radial Distortion (pixels)
0.28 f x = 3110 f y = 3121 R D x = 0.0265 R D y = 0.0198
Table 4. Flight plans for the top surface of the bridges.
Flight NumberFlight Height (m)Transverse Distance (m)Camera Angles (°)
12130, 35
22230, 35
33130, 35
43230, 35
Table 5. Flight plans for the side surface of the bridges.
Flight NumberFlight Height (m)Transverse Distance (m)Camera Angles (°)
1020
2030
3040
Table 6. Results of the camera calibration for the images from on-site calibration for the top surface of the first bridge (NBI bridge number: 01791).
Overall Mean Error (Pixels)x Focal Length (Pixels)y Focal Length (Pixels)x Radial Distortion (Pixels)y Radial Distortion (Pixels)
0.25 f x = 3141 f y = 2965 R D x = 0.0161 R D y = 0.0298
Table 7. Results of the camera calibration for the images from on-site calibration for the side surface of the first bridge (NBI bridge number: 01791).
Overall Mean Error (Pixels)x Focal Length (Pixels)y Focal Length (Pixels)x Radial Distortion (Pixels)y Radial Distortion (Pixels)
0.20 f x = 4513 f y = 4367 R D x = 0.0746 R D y = 1.3192
Table 8. Results of the camera calibration for the images from on-site calibration for the top surface of the second bridge (NBI bridge number: 06255).
Overall Mean Error (Pixels)x Focal Length
(Pixels)
y Focal Length
(Pixels)
x Radial Distortion (Pixels)y Radial Distortion
(Pixels)
0.29 f x = 3165 f y = 3002 R D x = 0.0277 R D y = 0.0519
Table 9. Results of the camera calibration for the images from on-site calibration for the side surface of the second bridge (NBI bridge number: 06255).
Overall Mean Error (Pixels)x Focal Length
(Pixels)
y Focal Length
(Pixels)
x Radial Distortion (Pixels)y Radial Distortion
(Pixels)
0.14 f x = 6627 f y = 6585 R D x = 0.1661 R D y = 6.9088
Table 10. Results of the crack detection for the first crack from raw and corrected images.
FlightDistance (m)Measured Width (mm)Detected Width from Raw Images (mm)Detected Width after Correction (mm)Result Accuracy Improvement (%)
120.510.710.669.80
230.510.710.6217.65
340.5110.919.61
Table 11. Results of the crack detection for the second crack from raw and corrected images.
FlightDistance (m)Measured Width (mm)Detected Width from Raw Images (mm)Detected Width after Correction (mm)Result Accuracy Improvement (%)
121.531.781.677.19
231.531.771.5514.38
341.532.131.8021.57
Disclaimer/Publisher’s Note: The statements, opinions and data contained in all publications are solely those of the individual author(s) and contributor(s) and not of MDPI and/or the editor(s). MDPI and/or the editor(s) disclaim responsibility for any injury to people or property resulting from any ideas, methods, instructions or products referred to in the content.

