Abstract
The use of unmanned aerial vehicles (UAVs), or drones, as mobile aerial base stations (MABSs) in Disaster Response Networks (DRNs) has gained significant interest in addressing coverage gaps of user equipment (UE) and establishing ubiquitous connectivity. In the event of natural disasters, the traditional base station is often destroyed, leading to significant challenges for UEs in establishing communication with emergency services. This study explores the deployment of MABS to provide network service to terrestrial users in a geographical area after a disaster. The UEs are organized into clusters at safe locations or evacuation shelters as part of the communication infrastructure. The main goal is to provide regular wireless communication for geographically dispersed users using Long-Term Evolution (LTE) technology. The MABS traveling at an average speed of 50 km/h visits different cluster centroids determined by the Affinity Propagation Clustering (APC) algorithm. A combination of graph theory and a Genetic Algorithm (GA) was used through mutators with a fitness function to obtain the most efficient flyable paths through an evolution pool of 100 generations. The efficiency of the proposed algorithm was compared with the benchmark fitness function and analyzed using the number of serviced UE performance indicators. System-level simulations were used to evaluate the performance of the proposed new fitness function in terms of the UEs served by the MABS after the MABS deployment, fitness score, service ratio, and path smoothness ratio. The results show that the proposed fitness function improved the overall service of UEs after MABS deployment and the fitness score, service ratio, and path smoothness ratio under a given number of MABS.
1. Introduction
The deployment of mobile aerial base stations (MABSs) offers significant advantages compared to traditional ground-based infrastructure. These advantages include multi-dimensional communication power and the flexibility of aerial deployment, which surpass the limitations of terrestrial systems. The ubiquitous and line-of-sight (LOS) connectivity provided by the MABSs is especially beneficial for mobile data and coverage. By utilizing the MABS, the network costs can be significantly reduced for the densely distributed small-cell deployments, thus alleviating the burden on overloaded terrestrial systems. During natural disasters, such as the Hurricane Maria in Puerto Rico, cell-on-wings (COW) drones were deployed to restore Long-Term Evolution (LTE) cellular coverage. This shows the vital role that a MABS can play in supporting mission-critical communication and its ability to provide real-time data, video, and multimedia at high speed. The design of an LTE-advanced Disaster Response Network (DRN) faces significant challenges in maintaining uninterrupted and ubiquitous coverage, which is critical during emergencies. The limited availability of active terrestrial base station infrastructure further complicates the achievement of universal broadband coverage. A DRN, described in the FirstNet network as an example in the US, can offer broadband coverage to more than 90% of the geographic area and User Equipment (UE). Another critical issue during disasters is the tendency of the public (cellular users) to converge in protected places, which can lead to network congestion as the terrestrial network of the region is constrained. To alleviate this problem, several efforts have been made to study the achievable gains regarding coverage and other important metrics. These efforts (see Section 2.1) have shown the significant benefits of deploying mobile aerial base stations in such critical situations.
1.1. Problem Identification and Novelty
The current study investigates the problem of reaching global communication in disaster areas where the lack of proper telecommunication infrastructure obstructs communication. The article aims to study the feasibility of aerial base stations, which are UAVs fitted with cellular base station equipment, as a means of reaching coverage in disaster areas. This study is aimed at researching conventional MABS path planning in a DRN. The study also analyses how topographic features in disaster areas impact cellular network design. Drones flying at low altitudes can effectively cover regions with lower population density, while high-power base stations might be necessary for UEs requiring high data transmission volumes and reliability. Furthermore, the study emphasizes the critical role of stable telecommunications infrastructure in rural and disaster regions. Without reliable connectivity, communities struggle to achieve cultural and economic growth due to the increasing reliance of most applications on a functioning internet connection.
As compared to the works in Section 2, this paper studies a practical environment where drones offer coverage to a post-disaster area of significant size that involves the destruction of the existing BS infrastructure in the area either partially or fully. In the studied scenario, the BS percentage loss ranges from 10% loss and reaches 90% loss, respectively. These locations are termed Voronoi cells, reflecting a much larger area than the conventional pico-hotspots. For such macro-hotspots, it is more meaningful for drones to fly over the entire area to serve as many users as possible instead of limiting themselves to predefined small regions. In this scenario, the following challenges arise:
- Because of the availability of MABS mobility over the entire service region, the user often has a chance to choose among the different MABSs for their respective communication. For this reason, users must be allowed to return to the area of MABS which was selected again to repeat the process.
- MABS units only navigate over and around the cluster centroid zone where some user’s coverage might be missed. Optimization of the routing path of the MABS to cover users without service all over the area is required.
1.2. Contributions
In this paper, we address all of the challenges mentioned above. Our contributions can be summarized as follows:
- An efficient path planning method based on Genetic Algorithm (GA) to effectively deploy MABSs in the affected areas. The study demonstrates that the proposed path planning can optimize MABS paths in terms of the proposed fitness function score and reduce the number of required drones in the network. The deployment model also effectively provide coverage and optimize communication efficiency in DRN.
- An improved fitness function that demonstrates the evolution of pathways and the emergence of diverse patterns and configurations within the path segments, thereby illustrating the adaptability and versatility of MABS deployment strategies.
1.3. Organization of This Paper
The remainder of this paper is organized as follows: Section 2 reviews the related work. Section 3 delves into environmental modeling, while Section 4 presents the proposed optimal MABS path planning and the corresponding fitness function. In Section 5, a performance evaluation of the proposed solution and discussion are presented, and conclusions are given in Section 6.
2. Related Works
The literature on deploying mobile aerial base stations in disaster scenarios is classified into two categories based on their relevance to the problem studied in this paper. Firstly, a broad category involves the use of mobile aerial base stations to provide coverage services. Secondly, another category involves works that investigate path planning and trajectory optimization, especially using genetic algorithms and considering Voronoi tessellations.
2.1. Mobile Aerial Base Stations for Coverage Services in Disasters
A number of academic research papers have studied the benefits of MABS to provide universal coverage in DRN. These studies include [1,2,3,4,5,6,7,8,9,10].
In [1], the authors examine the efficiency and performance of a multi-tier data relaying scheme using UAVs to enhance communication in disaster scenarios. They propose a multi-tier cooperative communication scheme supported by UAVs, demonstrating a promising solution for maintaining efficient and reliable communication. The statistical framework proposed in [2] offers a detailed characterization and modeling of extensive DRN cellular networks using UAVs in clustered hotspots, where conventional terrestrial BS have become inoperative due to destruction. An elaboration on this framework is provided in [4], which introduces a sophisticated strategy for the placement of multiple UAVs. This strategy ingeniously incorporates the movement patterns of ground users to enhance the resilience of communication systems in DRN scenarios. Building on this work, Authors in [5] investigates the deployment of UAVs to ensure reliable service provision in disaster-prone regions. It focuses on enhancing real-time deployment techniques and resource allocation for UAV-aided relay systems in emergency communication. The utilization of UAVs for disaster assessment and the optimization of flight paths in UAV-supported emergency communication setups are extensively scrutinized in [3] with the Internet of Things (IoT) framework, with a particular emphasis on the effective allocation of resources. Work [3], underscores the critical importance of maximizing throughput in emergency scenarios to ensure efficient communication flow. Finally, the authors in [6] explore the application of UAVs for delivering wireless services during post-disaster periods, with a key objective of maximizing the coverage of ground users by optimizing the three-dimensional flight trajectories throughout the UAV flight missions.
UAVs have a significant impact on enhancing disaster resilience, particularly due to the uneven distribution of ground terminals caused by people concentrating in evacuation centers [7]. The exploration of real-time surveillance applications for disaster management is detailed in [8], where the authors introduce a novel computing and networking framework specifically designed for such purposes. In the context of emergency response post disaster, scholars have extensively discussed the concept of cooperative UAV communication to support communication among a large fleet of emergency response ground vehicles [9]. Similarly, another study investigates the efficient utilization of bandwidth and strategic positioning of UAVs in disaster scenarios for optimal outcomes [10]. UAVs are increasingly recognized for their vital role in handling disaster management strategies, offering unique capabilities to support various operations during and after a natural disaster. The integration of UAV technology in disaster response efforts has demonstrated the potential to revolutionize traditional approaches, which significantly improves overall disaster preparedness and response effectiveness. While routing Optimization generally focuses on minimizing transportation time and cost, disaster scenarios present unique challenges. Factors like damaged infrastructure and dynamic human movement patterns require adaptable solutions. UAV routing optimization in disaster response leverages algorithms that can handle these uncertainties, like those described in [11,12], which can be employed to plan efficient flight paths for UAVs delivering critical supplies or conducting search and rescue missions. These algorithms consider factors like battery life, payload capacity, and real-time updates on obstacles or changing needs on the ground.
2.2. Path Planning and Trajectory Design
In the last few decades, there has been a substantial amount of research conducted on autonomous air traffic control using robotics, focusing on the exploration of path planning and trajectory design for Unmanned Aerial Vehicles (UAVs/drones), thus solidifying UAVs as a fundamental component within this domain [13,14]. Various algorithms, models, and tools have been developed specifically to streamline this process. The A* algorithm, for instance, is designed to identify the most efficient path by estimating the overall cost for different trajectories of UAVs/drones [15]. Research findings indicate that this algorithm is particularly ideal for applications in a simplistic grid-based model. Upon the release of the D-star algorithm, it has been recognized as an effective tool for finding the optimal trajectories of UAVs/drones in dynamic environments due to their rapid changes [16]. By using heuristics to detect obstacles and map the surrounding environment, this algorithm becomes exceptional in most of its identified ways [17].
The authors of [18] propose a novel hybrid method, VDGA (Voronoi Diagram and Genetic Algorithm), to optimize data collection networks in the Internet of Things (IoT). The VDGA method leverages the strengths of both techniques: the Voronoi Diagram (VD) for initial positioning and the Genetic Algorithm (GA) for fine-tuning placement to achieve optimal network coverage. The VD divides the region of interest (RoI) into cells, providing a basic layout for deploying IoT devices. The GA then refines these positions to maximize coverage while minimizing network load. This approach is inspired by applications of VD and GA in robotics, where VD identifies obstacles and GA finds collision-free paths for mobile robots [19]. The authors of [19] evaluate the VDGA method’s effectiveness in optimizing the zoning problem for deployment. Their findings demonstrate that VDGA outperforms both standard GA and VD approaches in terms of network coverage and load distribution. This emphasis on optimizing network coverage aligns perfectly with the needs of data collection in the IoT.
Data-gathering devices for the IoT rely on multi-functional devices equipped with detection, processing, memory, and communication units. The intensity of the RoI in data collection networks is imperative to have a successful data collection [20,21]. To address this challenge, the authors of [22] introduce a novel UAV flight method that considers the non-uniformity user across the RoI. Traditional methods often assume a uniform user distribution that lead to inefficiencies. The proposed method leverages VD to predict the location of other UAVs and distribute them strategically based on user density. The analysis indicates the success of the suggested approach in increasing the number of messages captured and delivered, especially where users are deployed in a non-uniform pattern or are randomly distributed. Study [22] proposes existing approaches that do not consider the distribution of users. The Voronoi-based approach is superior in performance in this experimental scenario. As a result, the research considers the efficiency of serving the destinations within the Voronoi cell, evaluating centroid and random point implementation, and compares the results [11,12,23,24].
A comprehensive examination of current UAV path-planning methodologies is provided in [13,14], where most suggested algorithms employ heuristic or metaheuristic strategies. In [25], a path-planning problem is explored using Particle Swarm Optimization (PSO), with primary objectives being risks and battery consumption reduction while maximizing the number of waypoints visited. In [26], a 3D multi-objective UAV path-planning technique is investigated utilizing digital pheromone PSO, with the aims of minimizing enemy threat and battery consumption while meeting the constraints. In [27], the researchers introduce a deductive methodology to address sequencing challenges. Initially, they partition a series of checkpoints into clusters using fuzzy c-means clustering, followed by the application of the PSO technique to establish a sequence of routes. The regional clusters of waypoints are combined, and an initial particle derived from a potential global solution is utilized as the starting point for the global optimizer. In [28], the authors formulate an enhanced PSO algorithm incorporating a binary coding matrix and an adaptive inertia weight adjustment strategy, illustrating that the proposed PSO algorithm represents an effective approach for generating feasible solutions for the reconnaissance decision-making process.
In [18], GA is proposed as a solution for the multi-UAV path planning problem, incorporating timing and path constraints. This methodology uses Voronoi diagrams to avoid physical threats like power lines, hostile drones activity, and other obstacles, aiming to maximize the exploration of desired areas while avoiding no-fly zones. In study [29], the problem of checkpoint-based multi-UAV path planning is expanded to encompass control regions . These control regions define specific areas where UAVs need to operate or follow certain flight regulations, and it is leveraged utilizing newly introduced evolutionary operators within the GA framework. Researchers in work [28] employ a GA for generating feasible trajectories for multi-UAV systems flying at the same altitude within a known environment. Initially, a viable task schedule is established through a parallel GA, followed by a path smoothing procedure utilizing Bezier curves during the path planning process. Nevertheless, given the intricacy of the problem, the analysis is limited to a 2D scenario. In [30], an innovative genetic path planning algorithm featuring adaptive operator selection is introduced to address the optimization challenge of constrained coverage path planning. The proposed methodology is compared with traditional approaches and a modified Dijkstra’s algorithm [31]. A detailed comparison of related works is provided in Table 1.

Table 1.
Summary of MABS path planning-related works.
3. Environment Modelling
This section introduces the basic assumptions of the system scheme and the solution for the first phase in case of emergency after a natural disaster. The objective, therefore, is to provide instant connectivity for the UE using MABS based on an algorithm that exploits APC, graph theory, and GA. The system model holds a general design, including MABS, as shown in Figure 1 depicting the considered setup for this study. With the BS coverage initially being circular, the system assumes that the BS has failed and requires an MABS to be deployed in that area. Specifically, designing and positioning these MABSs to provide cellular coverage to the affected area is the goal. MABSs serve as movable antenna base stations aiming to overcome the gaps in coverage and establish global connectivity for the DRNs. The green UE denotes the UE’s that are not affected by the disaster, while the red UE and the isolated user devices receive connection from the temporary coverage of MABS, as can be seen in Figure 1. The concentration is mainly on the unconnected UEs, symbolized by the density of buildings placed and the MABS. A set of UEs is represented in the distribution of points over a 25 km × 25 km area designating a small town. The number of UEs is determined using the Poisson distribution for UE and for BS, which offers the representation of various possible UE distributions after the BS loss. This can be seen in Table 2.
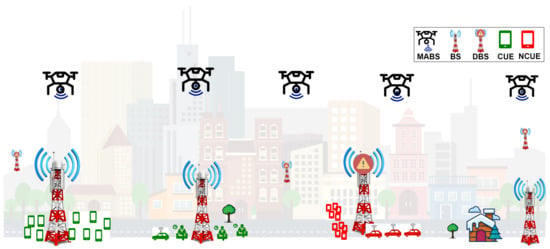
Figure 1.
Considered environmental setup. It is assumed that BS circular with radius fails, and UAVs are deployed into the same region to provide cellular coverage or for assessment.

Table 2.
Parameter settings for the experiment [42].
The minimum required bandwidth capacity for each user UE is at least 200 kilobits per second (Kbps), and it is calculated using the Shannon Capacity Equation (1), with C symbolizing the capacity in bits per second (bps) and Bw denoting the bandwidth in hertz (Hz). The signal-to-noise ratio (SNR) is calculated using Equation (2), where Pi is the power received by the MABS or base station (BS) from a designated UE and Pj is the power received by a BS or MABS from a non-designated UE, along with a ground noise element set to −112 decibels [43]. For these calculations, the BS power is set to 46 decibels, the MABS power is set to 30 decibels, and the maximum power for a UE is 10 decibels [43,44,45,46]. It is assumed that multiple UE access methods are employed for a single UE in a multiple-input multiple-output (MIMO) configuration.
The Okamura–Hata familiar curve fitting [47,48,49], a propagation Path Loss (PL) model, is utilized to offer a rough approximation of a general scenario. Specifically, the carrier frequency of 700 MHz is implemented, which aligns with LTE Band 14. The main equation is provided in Equation (3), and the corresponding A and B are in Equations (4) and (5), respectively.
Considering our disaster scenario, is the output value of the function based on the input height , while f is the frequency parameter in the equation and is the logarithm of the frequency parameter, and constant values 1.1, 0.7, 1.56, and 0.8 are used in the equation to scale and adjust the impact of the frequency on the output value. Equation (6) is crucial in modelling scenarios specific to disaster scenario, with factors like height and frequency. Environment plays a significant role. Equation (7) sets the environmental variable to zero, indicating a specific condition or scenario where the environmental variable has no effect or presence.
The MABS is kept constant at a speed of 50 km/h [22], and factors such as wind speed, weather conditions, and the presence of wildlife are not considered. A set of UEs that was affected by the disaster is clustered by the Affinity Propagation algorithm [50,51], and a damping factor of 0.6 is considered. The UE distribution scenarios are based on Poisson distribution, while the base station outage varies between 10% and 90%; for example, Figure 2 shows the case of an 80% outage of the base station.
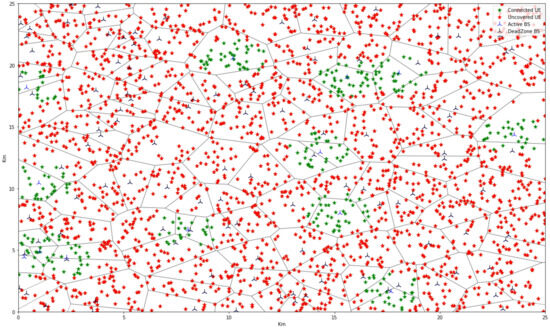
Figure 2.
Distribution of UEs in the environment. In this example, there is an 80 percent of base station outage.
Here, UEs with service are denoted by a green asterisk, and those without service are drawn with a red asterisk, as seen in the Voronoi cells, which depict the clusters of these forms. The blue tri-down shows the active base station, while the black tri-down shows the affected base station due to the disaster. The whole experiment is conducted in a square area of 25 km2. The MABS provides all the affected UEs in the cluster with temporal communications; it also meets UEs and proceeds to the next centroid.
3.1. Problem Formulation
The model is portrayed similarly to the Multi-visit Traveling Salesman Problem (MTSP), which lacks common starting points. The graphs are noted as , where V denotes the cluster set from UE density distribution in certain areas, and E represents the distance of links among the cluster centers between each other. The model can be displayed through Equation (8) as an optimization function. In this role, the path number is smaller. In (8)–(11), is the Boolean variable indicating whether a drone would visit cluster and stands for the cumulative capacity requirement, where cumulative capacity (C) is summing all the capacities for the UE from the corresponding Clusters (9) and (10), showing an equation that limits each drone to access only one node. Equation (11) [22,52] only allows one node per cluster entrance .
The MTSP problem is modified to account for the provision in (12), which stipulates that any path must include at least one MABS. It is important to note that the MABS employed in this research is either remotely piloted or autonomous and does not necessitate a human pilot for the flight. The optimization function helps in determining the optimal values of decision variables that minimize the overall cost or objective function as formulated in (13).
The number of MABS mission members denoted as NMABS and the cardinal direction of the cluster center serve as a marker for a specific MABS, denoted , a critical part of the mission. The iteration indexed by specifies a cluster with a given capacity requirement, and the route is traversable only by the MABS unit in this model. Considering that a UE can carry out short non-traditional messaging activities in a brief moment of connection, we conclude that recurring short connection time is the appropriate model to adopt. In contrast to the constraints in (9)–(11), this must be true. This is because a circle is drawn; thus, the point where the trip begins cannot be pinpointed. In this case, one path may branch out from a specific point, like the beginning of the tour, or there may be no predefined starting point; all the points on the paths are starting points. Therefore, the total number of edges is given by (13) [53].
3.2. Parameter Settings
Table 2 specifies parameters that govern the model of the simulation environment along with the algorithmic setting. This provides information on the high-level elements of the experiment, parameters of the simulation environment, and algorithm configuration. Also, the number of UEs is represented as 2500, while the number of drones (D) is from 1 to 5. The use of drones in this network allows for us to observe the phenomenon of how it can handle a large number of users (scalability) and how effective it is in providing coverage (effectiveness). Spatial domain (A) is a square area of 25 km × 25 km spatial boundaries over which network operations are assessed. Within the GA framework, S is set to 50 so that diversity and exploration are high, while M begins with the mutation rate of 0.25, 0.5, and 1 to determine whether it impacts convergence to final solutions. A total of 100 P cycles (1 random population startup cycle + 99 generations) are performed to fine-tune the periodic solutions. Table 2 also shows BS loss changes from 10% to 90%, which depicts the capability of the system to withstand BS failure. This multi-faceted range of parameters, in general, allows for a holistic view of the experimental scenario and therefore leads to an in-depth analysis of the proposed network model’s working characteristics.
4. Proposed Optimal MABS Path Planning
4.1. Description of Genetic Algorithm Framework for MABS Path Planning
This sub-section describes the design of the MABS path planning Genetic Algorithm (MABS-GA), which incorporates the process of evolution to identify the optimal solution for a given problem.
To address this, GA employs a metaheuristic approach. This algorithm mimics the natural principles of evolution, where mutations introduce new patterns. In this evolutionary approach, unique survival products, often known as specimens, exist alongside both mutation and reproduction to create new, somewhat better specimens capable of dealing with modern circumstances [54,55].
Each chromosome comprises adjustable parameters to be polished according to the problem’s requirements. It is valuable to examine every chromosome critically and decide what is suitable for mutations. This analysis, termed fitting, provides the stress, or rather the load the system has to sustain while the species are chosen. In UE, the clustering, affinity propagation clustering, is a non-supervised approach that is employable when several geo-dispersed UEs demand clustering centroids centered on spatial density. Initially, given the advantages of k-means clustering (simplicity and effectiveness), it was chosen. Nevertheless, it was rejected in favor of using several clusters to group the unserved UEs. Unlike the competition, affinity propagation determines this balance through an implicit message exchanged between each node and its neighbors using a broadcast mechanism. An internal relation matrix shows how one entity should present the other.
In contrast, the external relation matrix provides information about the other entity’s representation level by the other entity. The process begins by proposing UEs as potential representatives. The next step involves using proximity for vectorization, with the final step ensuring that the cluster centers remain unchanged. In [56], this approach is proposed as a UE clustering method based on the ownership and management of networks with responsibilities and accessibility.
In the field of GA, chromosomes serve as the elementary particle or gene of the species that must undergo mutation or combine with another chromosome to endow the future generation with objects that possess better attributes, such as inventiveness [54] and robustness [55], After classifying a group of chromosomes into clusters, Equations (14) and (15) are identified for the graph. In the graph, centroid V and Euclidean distances between segments are called E. According to Equation (16), A slot refers to a measured segment point. Theoretically, chromosome length (m) should be greater than or equal to three.
Figure 3a indicates that the specimen comprises two chromosomes. Each genetic locus is evaluated on an individual basis, with differently influenced markers, as previously described. Chromosome 1 pases through study points A, B, D, C, and E, whereas Chromosome 2 passes through units F, G, H, I, and J. This is the case when mutators are applied to create a kind of detailed development within organizational limits. In this way, each specimen involved is divided into three and six other specimens, in accordance with their type and nimber of chromosomes they had. Chromosome transfers involve a variable number of chromosomes per material and employ transposition systems to complete the crossover process [23,24]. This does not allow for effective reproduction through a chromosomal mix or mutation. In addition, a uniform random distribution is utilized for any random selection procedure within the mutation functions to achieve randomness.
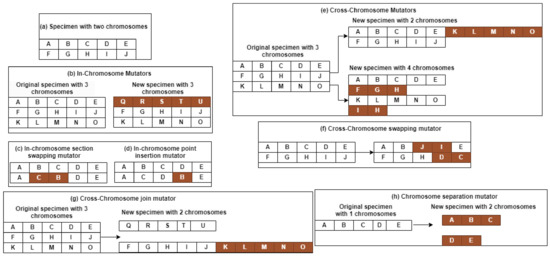
Figure 3.
Illustration of Chromosome Construction Visualization (a), In-chromosome mutators (b), In-chromosome section swapping mutator (c), In-chromosome point insertion mutator (d), Cross-chromosome mutators (e), Cross-chromosome swapping mutator (f), Cross-chromosome join mutator (g), and Chromosome separation mutator (h).
The mutator assembly is intended to produce a new specimen with the same chromosome length as the original ancestor [54,55]. The mutators strive to ensure the optimum visiting sequence of the cluster centres with a given number of drones. This method creates a one-chromosome specimen with the same number of chromosomes and a mutated chromosome, as shown in Figure 3b. In this case, Chromosome 1 is changed from A, B, C, D, and E to Q, R, S, T, and U, which results in the same number of chromosomes. The in-chromosome section swapping mutator is called a random chromosome from the selected specimen and chooses a segment of that chromosome for swapping, creating new chromosomes and new specimens [23,24].
Figure 3c shows how points B and C are selected to change the order; the resulting configuration is shown in the figure. In the swapping mutator, two points are randomly chosen for exchange, as shown in Figure 3d. This results in a more complex order than the original combination operators. The in-chromosome point insertion mutator removes only one point on the selected chromosome and inserts it into another location [23,24]. Figure 3e shows how point B receives a boost of four spots. The new chromosome does not significantly interfere with the original chromosome.
The ability of cross-chromosomal interactions to create or destroy chromosomes in a specimen results in either the reduction in or addition of the genetic paths needed for the survival of a specimen. This concept is illustrated in Figure 3f, where one specimen can give rise to many individuals. The mutations are reproduced by a number of chromosomes and the points within each chromosome, which must not be less than three to establish a sound, closed graph for the number of mutators. In two-chromosome-swapping mutators, a pair of the two selected chromosomes are exchanged, and the resulting specimen keeps the same number of chromosomes as its parents. Still, chromosomes shuffle [23,24].
This makes the pairing of chromosomes easier, and pairs that provide an advantage to the offspring are favored. The Cross-Chromosome Join Mutator generates a third chromosome by fusing two desired chromosomes from a specimen, which results in a specimen with one chromosome less than the initial instance. Similarly, Chromosomes 2 and 3 as shown in Figure 3g are combined to create a single one. This makes the subject’s genome much shorter and requires fewer sampling drones. However, the Chromosome Separation Mutator divides away from a three-horizon-long section of the chromosome, leading to two chromosomes for new beings. As shown in Figure 3h, Chromosome 1 is divided in half. The following specimens have two chromosomes rather than one. This mutator yields another deterministic specimen that may be consumed based on fitness evaluation.
4.2. Integration of Proposed Fitness Function and Mutation for Optimization
The fitness functions are constructed to evaluate the specimens based on various parameters. Then, the magnitudes of the specimen’s performance in a given scenario can be measured [23,24]. In this research, five fitness function metrics were implemented to ensure that the sample worked out. The drone path was evaluated, which is the most effective, efficient, and sound option to solve the problem. The weight of the fitness function is computed based on the score of a particular specimen according to Equation (17). This equation serves to combine SR (Service Ratio), AR (Angle Ratio), DR (Distance Ratio), IR (Intersection Ratio), and PSR (Path Smoothness Ratio), obtained from corresponding fitness functions of service, angle, distance, intersection, and path smoothness.
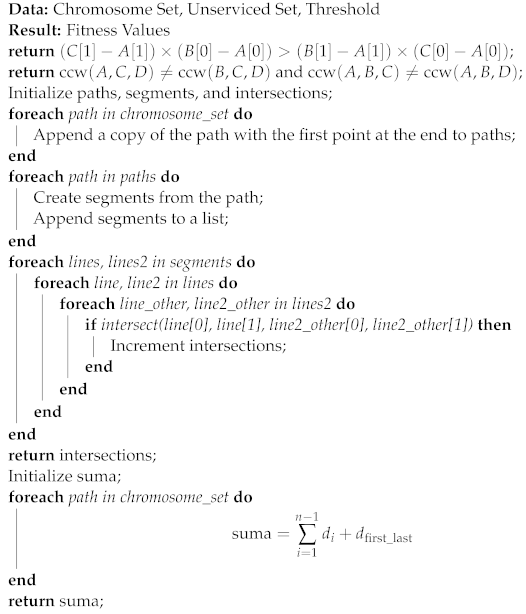
The solution to the optimization process used the proposed fitness function described in Algorithm 1. It is used to act on a set of chromosomes, a population of unchecked chromosomes, and a threshold for determining fitness values. This structure is divided into two parts. The first part of the condition considers the product of the (A) and (B) differences and compares it against a specific value. The second part analyzes the direction () and returns a particular number when the conditions are achieved. Subsequently, the function initializes paths, segments, and intersections, and then, after copying each path to the chromosome set to the end of the path, it appends it into the segments. It splits each path into pieces and then adds them to a list. The intersection analyzer then studies the intersections of various lines and updates the intersection count by iterating over the parts. Additionally, it sums the sum of the distances between the points next to each other during each path to another variable, named “suma”. It also calculates and records the distance between the first and the last points of each path.
The optimization procedure is described in Algorithm 2 that represents the fitness function. The systolic function compares different ideas in establishing MABS in disaster response networks using path qualities such as angle, capacity, and unserviced area. By assigning fitness scores to the routes of MABS deployment, the algorithm can select the best and most efficient path to follow. This rating uses an algorithm to score the different paths and investigate the most effective ones. Fitness functions are calculated to compare specimens with other parameters, thus showing their fitness in that specific scenario. Five fitness functions were used in this study to select a particular solution that is the most suitable and can adequately deal with the problem of choosing a specimen, which is the MABS path. The weight coefficient for score specimens is calculated using (18). It takes into account the SR, AR, DR, IR, and PSR as the result of the fitness functions of the specimens.
| Algorithm 1: Fitness Function—Part 1 |
 |
Our proposed Equation (18) is the best fit for the given example, resulting from the weighting and compensation analysis of a specific population [22,23,24]. In this case, assigning 0.5 of the ponderation to SR implies that the candidate with the most extensive coverage have a higher likelihood of propagation. In the selection process, specimens with superior flying range are favored, even if they have slightly worse coverage, prioritizing distance over comprehensiveness. The AR performs better regarding the side score than the DR and IR, ensuring it is always in the best-effort mode to avoid close angles. The resultant specimens show flyable paths, one of the most critical parameters. Lastly, DR and IR are just as vital and share similarities with the other two ratios to finalize the adjustment. In the next step, all specimens within a population are characterized by similar scores for SR, PSR, and AR. Thus, DR and IR are distinguishing traits and should be kept among the chosen traits for reproduction. Therefore, the shortest and most likely free-from-path crossing is selected. This function computes the number of unserviced UEs with at least a single connection for all drone travel paths. To achieve this, Equations (1) and (3) are employed, where the constant height is 50 m. To save some computer power requirements, the unserviced UE dataset is updated whenever a UE is considered with service, and calculations are performed every 3 km along the drone path. For AR, this function computes a ratio by employing (19) and (20), where n is the total number of angles in the given path (i.e., chromosome) and N is the total number of the paths (i.e., the total number of chromosomes) within the specimen [22].
| Algorithm 2: Fitness Function—Part 2 |
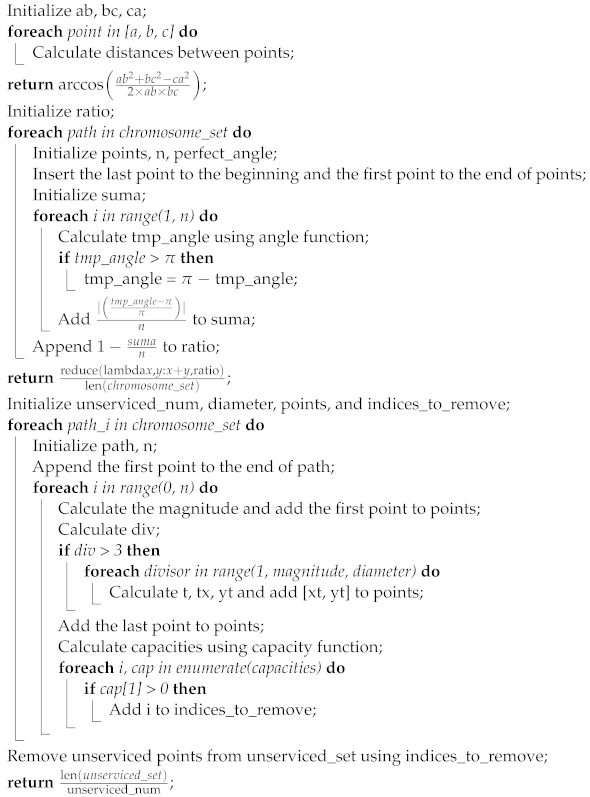 |
As Equations (18) and (19) are used, the score of the specimen is boosted with a path flow featuring more acute angles; this is because the single-angle ratio is calculated based on the accuracy with which it approximates a straight angle, which is defined as in Radians. Additionally, the mean of all ratios AR of the angles is given equal significance; therefore, an acute angle negatively affects the solution. If a triangular formation exists despite the high obtuse angle, it still leaves two acute angles, which, in a triangular path, cause a lower score for that sample. The single-angle () values for each specimen are presented in Table 3 from left to right. Consequently, AR cannot be perfect because no graph that approximates a line graph with parallel lines can be drawn. The Distance Fitness Function DR is chosen as there is no way to determine the optimal distance from the inside perspective of a specimen. The method of considering all the specimens and their relative values is adopted to determine the distance value () using (20). Here, (15) determines E.

Table 3.
Single-Angle Ratio Table.
The minimum value (min ()) is desired to achieve the shortest distance. Consequently, the value of each is tested with ; therefore, DR = according to (21). By contrast, i takes the place of the value of presented for a particular entity.
Also, it is worth noting that this role does not guarantee an all-sufficient result for a specific situation, as many suitable candidates may have been overlooked. Nevertheless, this particular method brings up operations that may ensure different approximations for each of the values obtained. Function Intersecting Line Segments IR was developed to determine whether two line segments overlap or cross at a given point. In this case, it is unnecessary to distinguish between zero-recombination genome specimens and the best specimen with two or more recombination events, so the whole population is selected. This is based on the fact that each exhibit is () crossed not only in one path but also in all possible paths or chromosomes. Therefore, the minimum value of chromosomes min () at all possible intersections is considered, and this value is used here as a comparison criterion. Having (22) implies that the number of intersections in this viewed data contrasts the minimum value.
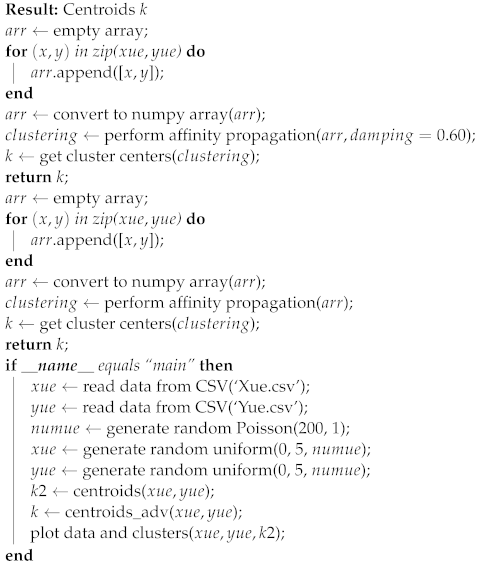
In addition, Algorithm 3 enables an indirect comparison of the lowest to the Distance function without the guarantee that the specimen with the lowest is the fittest in the cluster. The APC algorithm was proposed to determine the clustering of centroids in the disaster recovery network, and the function of the cluster centroids was employed to generate an empty array by an initial assignment of UE coordinates provided by iterations. The assignment was converted to a numpy array using a damping value of 0.6. When trained, the algorithm only keeps the resulting k-clusters, which are further stored in “k” as a variable. The main code reads UE data from a CSV file. The code then uses a Poisson distribution model to simulate the random placement of UEs across a designated area. These simulated UE coordinates are then used to calculate the optimal location of cluster centroids, which are central points representing groups of UEs. The algorithm computes the cluster centroids, which are crucial for deciding the suitable locations for deployment of MABS that can regularly provide wireless communications to widely dispersed users. Cluster centres are instrumental in planning the shortest paths and coverage of disaster-affected regions.
| Algorithm 3: UE Cluster Centroids |
 |
As shown in Figure 4, it is the first example of UEs within the epicenter of the disaster response network that is captured by the clustering algorithm. It entails emergency managers assigning people to clusters that may be placed at suitable structures/temporary accommodation centres. The initial organization of the UE is of significant importance because it determines the way to include and utilize the MBSs in the DRN. UE distributions plays a crucial role in the entire process of the MABS communication services, and therefore it should be at the very top of the priorities during disaster relief response. The detailed placement of UEs improves monitoring of coverage gaps, connectivity problems, and network performance at large, which are the fundamental issues for increasing the quality of service available to the users who happen to be in the accessible area.
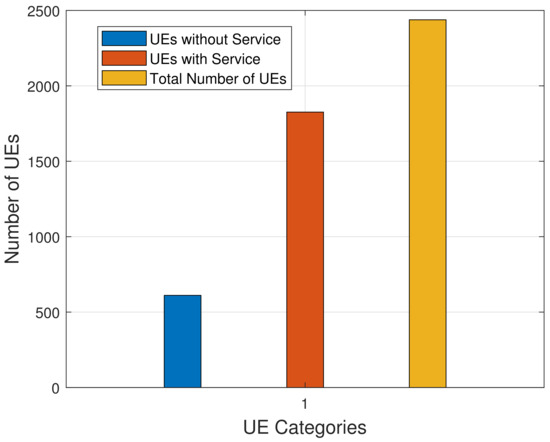
Figure 4.
Initial Setup of UEs.
Figure 5 illustrates the correlation between the number of locations where the base station fails to provide network service (unserviced centroids) and the percentage of loss experienced by the BS during its operation. The unserviced centroids vs. base station percentage loss is a crucial factor for evaluating the effectiveness of the MABS deployment strategy and understanding the impact of unserviced centroids on the overall performance of the BS. Analyzing this relationship enables researchers and practitioners to identify areas for improvement in disaster response networks and optimize the path planning of the MABS to minimize unserviced centroids and percentage loss. The BS failure to provide network service at centroids due to the issues experienced is shown, with the number of unserviced centroids defining the degree of loss undergone. Through this analysis, we can identify flaws in the emergency response network and develop strategies to minimize both percentage loss and the number of unserviced centroids.
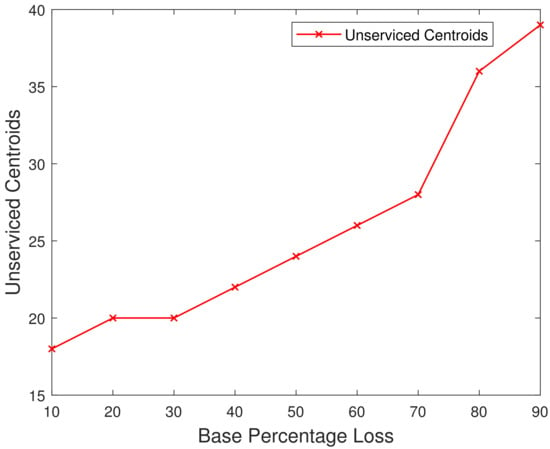
Figure 5.
Unserviced Centroids vs. Base Station Percentage Loss.
5. Performance Evaluation of Proposed MABS Solution
5.1. Performance Evaluation Selection Criterion
The criteria for performance evaluations were carefully chosen not only to evaluate the optimality of the path planning aspect, but also to thoroughly assess the overall performance of the proposed solution in various disaster response scenarios [57]. Analysis of Percentage Loss compared to the Best Fitness Score and the results of UE after the MABS implementation plays a crucial role in gaining a deeper insight into the impact of the solution on network coverage as well as the quality of service provided. Furthermore, the comparison between the Allowed Drones and the Best Fitness Score, as well as between the Allowed Drones and the Number of Candidates, offers valuable perspectives on the solution’s efficiency in resource allocation and scalability. It is important to note that each criterion highlights the proposed solution’s effectiveness by showcasing tangible enhancements in model performance, operational efficiency, and service quality within the context of Disaster Response Networks.
5.2. Performance Evaluation Design and Algorithm Validation
To evaluate the fitness of the presented algorithms, several cases that contain various MABS and UE that interact with one another are considered. For each situation, a count of the number of users is provided. The position of the UE base station and users is randomly distributed following the Poisson distribution with a spatial density of 25 × 25 square kilometers. The assessment is conducted using a two-part path planning evaluation. This evaluation is judged based on the optimality of path planning. The second part of the assessment features a few elements of the framework like the Percentage Loss vs. Best Fitness Score, Allowed Drones vs. Best Fitness Score, Allowed Drones vs. Number of Candidates, Percentage Loss vs. Number of Candidates, and UE Resulting after MABS Implementation. Application entails the demonstration of how these factors contribute to the test results.
These MABS assessments were systematically designed to involve the five UAVs in steps. Every UAV was rated on a scale of one to five, describing the operation efficiency of the vehicle. Furthermore, along with this value, a loss metric was used to grade the loss level on a scale of one to nine, where one signifies a 10% loss and nine is massive 90% loss. For each drone, the ultimate performance was determined through all ranges of damage of one through nine using trial and error. To analyze those critical conditions, the systematic approach utilized on all five drones calibrated the losses. The datasets attained in this way add to the useful knowledge about drone adaptability and deployment capabilities when the drones are deployed into various operational conditions. These research observations shed light on the limitations and effectiveness of UAVs when operating under restricted conditions.
5.3. Comparison among Five Drones and 10 to 90% Base Station Loss
Table 4 evaluates GA specimens based on the values of the parameters. Each row on the table designates a different specimen, and the corresponding columns display the parameters and results such as the specimen’s number, loss percentage, score, and number of drones. The table depicts the performance of each scored GA specimen and the number of UAVs/drones used. Individual values of the scores are between 0.74 and 0.90, demonstrating the efficiency of each sample for path planning of MABS. Also, the number of drones employed differs between one and five for each specimen. The table shows that samples scoring higher are all related to a more significant number of drones. This explains why the overall score also depends on the number of drones. The comparison of specimens obtained from spaces that differ in their settings provides valuable knowledge in the GA’s discovery of the perfect disaster response method by increasing the efficiency of MABS path planning.

Table 4.
Comparison between GA specimen with different parameters (5 drones allowed using 10–90% base station loss).
Our general finding is that scores showed an increasing trend as the loss of the BS and UAV count increased from 10% to 90% for all the specimens. Nevertheless, differences in scoring varied between the specially selected samples and UAV observation counts. Some samples demonstrated a steady drop-off of obtained scores alongside more significant losses, and some showed a steeper slope. However, with all the specimens experiencing a reduction in scores at each higher loss rate and lower UAV count, some specimens performed better than others in depicting different loss levels and numbers of UAVs. Certain species with specific parameter settings outperform those with higher communication loss in challenging environments. Therefore, despite the difficulty, these resilient species received higher scores.
On average, each specimen generally showed some deviation in the scores, which was proportional to the number of UAVs in the area. In other cases, increasing the number of UAVs resulted in even higher performance scores. This indicates that some tasks were performed more efficiently, particularly those involving coverage or communication constraints. However, while increasing the number of UAVs generally leads to score improvement, other factors might come into play for a very high number of UAVs, leading to stable or even declining scores (this suggests additional factors like communication overload might affect scores at high UAV numbers.). GA effectively helps to achieve an efficient path for the UAV BS which reasonably makes up for the BS communication loss. This resilience allows for the algorithm to maintain functionality even in adverse conditions, potentially leading to more robust and reliable solutions. The specimen scored relatively higher at differing levels of BS loss, displaying robustness and resilience towards communication disruptions and responses.
The conclusions drawn from the simulation are critical to the practical application of MABS-based system scenarios where communication channel propagation may be poor or in other environments where connectivity is compromised. The data presented in the table can be summarised as a rating tool for the operation of GA to improve MABS deployment by considering different levels of BS loss. These examples could include optimizing parameter settings, deployment strategies, or species selection for the MABS based on the expected level of signal degradation. Understanding the dynamics, trends, and impacts is essential in creating and maintaining drone networks for various purposes, including surveillance, emergencies, and delivery.
5.4. Loss vs. Best Score
Figure 6 indicates how the loss of base stations impacts the best score achieved in the experiment.
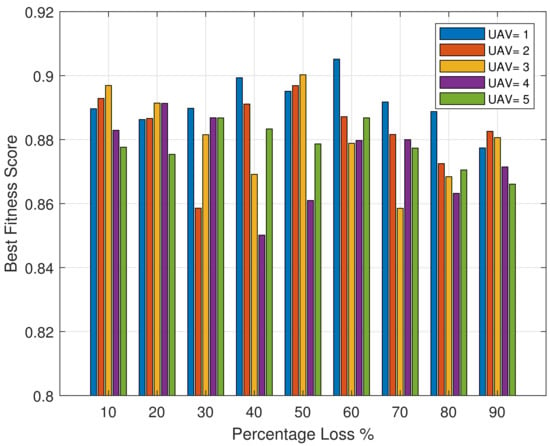
Figure 6.
Percentage Loss vs. Best Fitness Score.
Figure 6 shows the relationship between the percentage loss and the best fitness score in the study context. Percentage loss represents the base station loss that is related to signal strength, connectivity issues, or other performance metrics. Within the GA used in the study, the term “best fitness score” signifies the optimal solution or the most efficient path discovered by the algorithm. For almost all the losses from 10% to 90%, the fitness values are nearly one, which is the best because it assesses the effectiveness of the path planning strategy in minimizing losses and optimizing the deployment of MABS for disaster response. Nevertheless, the simulations show that the strength differs from each specific configuration, and it is more sensitive to the loss rate with increasing UAV numbers. Furthermore, the figure shows the key features of distinct UAV configurations; the best strategies suitable for reducing losses and maximizing fitness scores in real life are also shown.
5.5. Allowed Drones vs. Best Score
Figure 7 shows how the number of drones allowed impacts the best score achieved in the experiment.
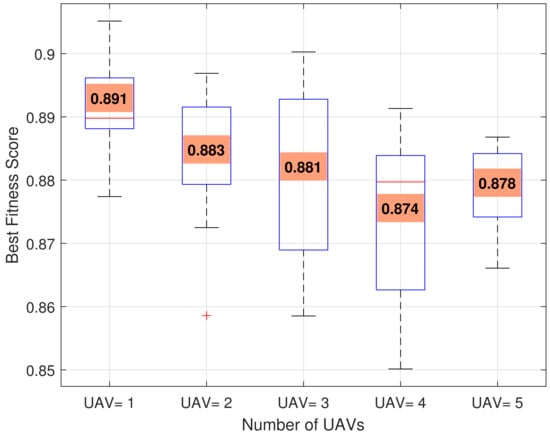
Figure 7.
Allowed Drones vs. Best Fitness Score.
The figure depicts the connection between the allowed number of drones and the optimal fitness score achieved in the study. It also shows the correlation between the number of drones that can be deployed and the corresponding best fitness score attained through the optimization process utilizing the GA. It shows the effect of altering the number of drones on the overall efficiency and performance of the disaster response system. This visual aid facilitates comprehension of the trade-off between the number of drones employed and the resulting fitness score, which helps make decisions regarding optimal drone deployment strategy by increasing the number of drones. It further shows how varying the number of UAVs impacts the optimal fitness score when operating with different loss thresholds in the network system. The x-axis shows the UAV configurations from one to five, while the y-axis shows the best fitness score every time. The figure also depicts the dispersion of fitness among the various UAV configurations. At the same time, the interquartile range (IQR) is represented by boxes, and the horizontal line within each box represents the median fitness. The whiskers from the boxes correspond to the estimated fitness range, while the outlier cases are the data points. The box plot details the fitness scores across various UAV combinations, thereby making it possible for the algorithm to compare the performance of the network optimization algorithm. Thus, using this comparison, the configuration of each UAV can be evaluated regarding the way in which it leads to the best performance scores for different loss of percentage and for detecting the possible outliers. To sum it up, the box diagram is a valuable tool to assess the stability and efficiency of separate drone deployment strategies in optimizing communication networks.
5.6. Allowed Drones vs. Candidates
Figure 8 highlights the relationship between the number of allowed drones and the resulting pool of suitable candidates identified during the simulation run. The figure keeps track of the performance of the highest-scoring UAV (best candidate), identified by its fitneess score. It also maintains a record of all candidate UAVs and their associated score.
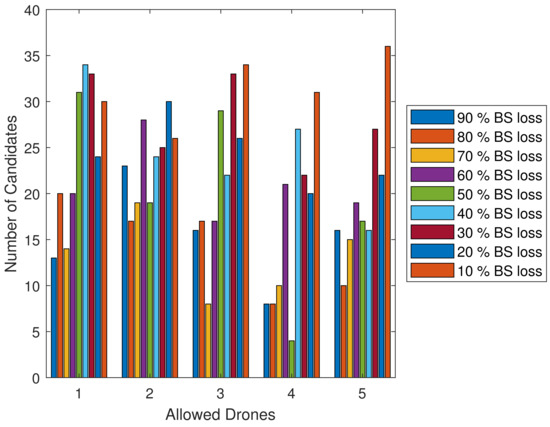
Figure 8.
Allowed Drones vs. Number of Candidates for different coverage loss percentages.
Figure 8 displays the correlation between the allowed number of drones and the number of candidates in the study context. This figure illustrates the allowable number of drones that can be utilized in the scenario and the range of available options or choices. It is essential to determine the optimal equilibrium between the number of drones that can be deployed and the number of possible candidates to choose from. This helps in evaluating the practicality and efficiency of the drone deployment plan based on the pool of available candidates.
5.7. Loss vs. Candidates
Figure 9 shows how base station loss impacts the number of viable candidates.
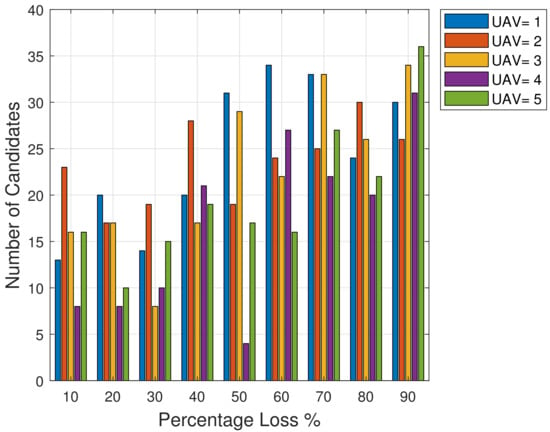
Figure 9.
Percentage Loss vs. Number of Candidates.
The graph in Figure 9 illustrates the correlation between the loss percentage and the number of candidates, which is essential for the study. This chart displays the percentage loss ranging from 10% to 90% for base stations. On the other hand, the number of candidates refers to the total number of candidates being considered in a particular scenario. Analyzing how the percentage loss changes in the number of candidates offers valuable insights into the system’s efficiency and effectiveness. By optimizing the number of candidates to minimize the percentage loss, the system’s overall performance can be enhanced.
5.8. UE with Service after MABS Implementation
In Figure 10, the x-axis shows the position of base station percentage loss indicating the extent of performance degradation or failure of the base station. Base station percentage loss ranges from 10% to 90%. The y-axis shows “UE with Service”, which refers to the UE that has service under a certain base station percentage loss. Scenario A (green): UEs with serviced before the implementation of the MABS. This line describes the number of UEs in the beginning state, with 10% base station loss and the corresponding number of UEs with service. Under the condition of increasing base station percentage loss, the number of UEs with services appears to be becoming worse. Scenario B (black): The number of UEs with service is indicated in this line following the introduction of the MABS. Compared to Scenario A, it demonstrates that the service to a greater number of UEs would be maintained across different base station portion loss levels. The graph represents the effectiveness of the implementation of the MABS in DRNs. Scenario B indicates that after deploying MABS, the availability of the UE service improves significantly. This is further supported by the data, which shows that Scenario B demonstrates higher reliability for the UE service.
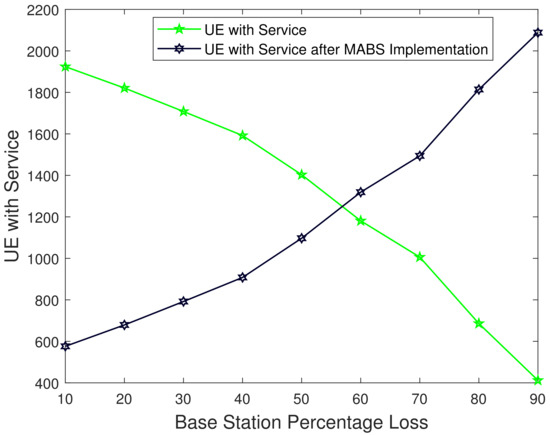
Figure 10.
UE with Service after MABS Implementation.
The use of MABS either compensates or reduces the influence of the base station’s failure or degradation on user services.
The algorithms discussed in Algorithms 1 and 2 were validated using Python libraries. The goal was to combine the benchmark fitness function with the proposed fitness function. In Figure 11, the statistical results for both functions are shown for BS loss values ranging from 10% to 90%. The proposed fitness function outperformed the benchmark function [22], indicating that it is better suited for DRN path planning. The average fitness score increased from approximately 0.71 for the benchmark method to approximately 0.84 for the proposed method. This demonstrates a clear improvement in the performance of the proposed method. The absolute gain of 0.13 in the fitness score indicates that the proposed method consistently performs better across the measured instances. This improvement is tangible and suggests a meaningful enhancement in the method’s efficiency or effectiveness. There is an 18% improvement in the fitness score, which is substantial, particularly in the disaster scenario where incremental gains are highly valued. The results suggest a possible improvement in the fitness scores gained by the proposed fitness function compared with the benchmark. Overall, the proposed fitness scores typically improves the performance of the model across all numbers of allowed drones compared with the original fitness scores.
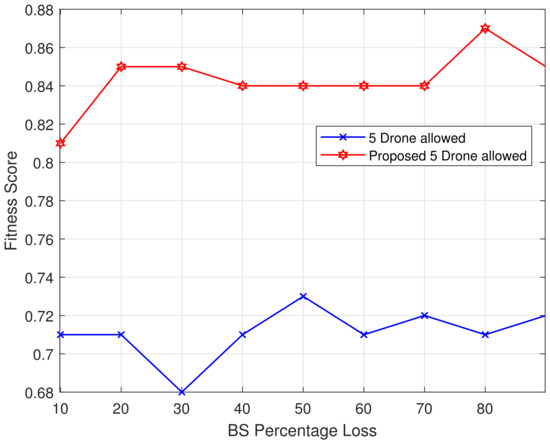
Figure 11.
Fitness Score for of Proposed Fitness Function and the Benchmark.
MABS, as UAVs for the DRN network, have significantly contributed to the timely restoration of the communication infrastructure in the studied disaster scenario. The concentration was specifically on the hurdles of deploying MABS to restore communication network services to the ground users, which is common in disaster relief missions, via LTE technology and state-of-the-art path planning to provide communication coverage not only for clustered and dispersed users. The innovative path-planning method that integrates GA and VD has significantly facilitated the optimization of MAB deployment. The GA and VD success in this path-planning process indicates it significantly outperforms the existing method.
The solution under consideration distinguishes itself by being dynamic and becoming better able to address the dynamic network conditions. MABSs are allowed to roam freely instead of taking the static paths predetermined on the main routes; the fitness values of each path are collected and analyzed ahead of time to optimize the path. This adaptability allows the GA algorithm to effectively deal with the uncertainty that is always present in disaster response operations and ensuring adequate communication coverage as the disastersituation evolves and changes.
From the performance evaluation results, it is evident that our proposed MABS-GA outperforms the baseline approach. The fitness function was assessed by comparing it with the baseline method, and the proposed fitness function consistently surpassed the baseline in all scenarios, regardless of user density and base station distance. This trend suggests that the measures implemented can implicitly enhance the effectiveness of service quality and system efficiency in DRNs.
The scalability of the solution is effectively showcased by evaluating various criteria, such as the comparison shown in Figure 7 as well as the relationship in Figure 8. This demonstration illustrates how the solution is able to adjust and accommodate different levels of resource availability (such as the number of MABS) and network demands, indicating its versatility and adaptability. Nevertheless, it is important to acknowledge that certain limitations may be expected in specific scenarios characterized by exceptionally dense user populations or complex geographical terrains. In such situations, the path planning algorithm deployed within the solution might encounter challenges in optimizing operations with maximum efficiency. Consequently, there may be instances where the solution is deemed unsuitable for deployment in large-scale disaster scenarios that feature highly dynamic environments.
6. Conclusions
This study introduces a path-planning algorithm that leverages the GA to deploy MABSs in DRNs. This model addresses the challenges of providing communication coverage to terrestrial users in post-disaster situations where traditional infrastructure is destroyed. Our strategy employs LTE technology and innovative path-planning techniques to ensure reliable and consistent communication coverage for users dispersed over a vast area. This proposed algorithm for path planning offers significant advancements in optimizing MABS deployment. By utilizing an evolutionary process, the system generates feasible paths while optimizing the fitness values of each path and ensuring comprehensive coverage of DRNs. The inclusion of the Voronoi diagram and GA in the path-planning process not only enhances coverage but also surpasses conventional methods. Our simulation results demonstrate our proposed method’s potential to enhance several performance metrics, including the fitness score, service ratio, and path smoothness ratio. These improvements indicate the effectiveness of our proposed approach in improving communication service quality and system efficiency in distributed radio networks.
While the current study primarily focuses on the problem of DRN emergency response, future research should explore the impact of drone flight trajectories on allocation effectiveness. Additionally, the techniques proposed in this research have the potential to address various task allocation problems beyond DRN emergency response. Therefore, future research should focus on enhancing the algorithm and addressing trajectory-related challenges further to improve the usability and effectiveness of our approach.
Author Contributions
Conceptualization, R.N. and M.S.A.; methodology, M.S.A., R.N. and O.A.A.; software, M.S.A.; validation, M.S.A., N.F.A. and A.A.-S.; formal analysis, M.S.A. and N.F.A.; investigation, M.S.A., A.A.-S. and O.A.A.; resources, R.N., N.F.A. and M.H.A.; data curation, M.S.A., A.A.-S. and O.A.A.; writing—original draft preparation, M.S.A. and O.A.A.; writing—review and editing, R.N., N.F.A., A.A.-S. and M.H.A.; visualization, M.S.A. and O.A.A.; supervision, R.N., N.F.A. and A.A.-S.; project administration, R.N. and N.F.A.; funding acquisition, R.N. and M.H.A. All authors have read and agreed to the published version of the manuscript.
Funding
This work was supported by the DIP-2022-020 by the Universiti Kebangsaan Malaysia.
Institutional Review Board Statement
Not applicable.
Data Availability Statement
The code used in this research is made openly available in the GitHub repository https://github.com/Ya-abba/MABS.git, accessed on 15 May 2024.
Acknowledgments
We would like to express our gratitude to José Antonio Matamoros Vargas for enlightening us about his work and making his code accessible. This significantly contributed to our understanding of his framework as a reference for the study. In this paper, we extend his work by introducing Path Smoothness Ratio (PSR) and providing a comparison in Figure 11. The details can be found in Section 3, Section 4 and Section 5.
Conflicts of Interest
The authors declare no conflicts of interest.
Abbreviations
The following abbreviations are used in this manuscript:
| UAVs | Unmanned Aerial Vehicles |
| MABS | Mobile Aerial Base Stations |
| DRN | Disaster Response Networks |
| UE | User Equipment |
| BS | Base Station |
| Density value for Poisson Distribution | |
| bps | Bits Per Second |
| C | Capacity in bps |
| Bw | Bandwidth for a channel in Hz |
| SNR | Signal Noise Ratio |
| PL | Path Loss |
| A | Frequency Incidence factor |
| B | Base Station Antenna Height factor |
| and Env | Environment Correction factors |
| ƒ | Frequency in MHz |
| hb | Height of the Base Station |
| hm | Height of the Mobile Aerial Base Station |
| GA | Genetic Algorithm |
| LOS | Line of Sight |
| COW | Cell on Wings |
| RoI | Region of Interest |
| VD | Voronoi Diagram |
| VDG | Voronoi Diagram Graph |
| KBPS | Kilobits Per Second |
| MHZ | Megahertz |
| BPS | Bits Per Second |
| HZ | Hertz |
| SNR | Signal-to-Noise Ratio |
| BS | Base Station |
| MIMO | Multiple-Input Multiple-Output |
| C | Capacity |
| SR | Service Ratio |
| AR | Angle Ratio |
| DR | Distance Ratio |
| IR | Intersection Ratio |
| PSR | Path Smoothness Ratio |
| PSO | Particle Swarm Optimization |
| CSV | Comma-Separated Values |
| IQR | Interquartile Range |
| LTE | Long-Term Evolution |
References
- Mezghani, F.; Mitton, N. Opportunistic multi-technology cooperative scheme and UAV relaying for network disaster recovery. Information 2020, 11, 37. [Google Scholar] [CrossRef]
- Hayajneh, A.M.; Zaidi, S.A.R.; McLernon, D.C.; Di Renzo, M.; Ghogho, M. Performance analysis of UAV enabled disaster recovery networks: A stochastic geometric framework based on cluster processes. IEEE Access 2018, 6, 26215–26230. [Google Scholar] [CrossRef]
- Tran, D.H.; Nguyen, V.D.; Chatzinotas, S.; Vu, T.X.; Ottersten, B. UAV relay-assisted emergency communications in IoT networks: Resource allocation and trajectory optimization. IEEE Trans. Wirel. Commun. 2021, 21, 1621–1637. [Google Scholar] [CrossRef]
- Peer, M.; Bohara, V.A.; Srivastava, A. Multi-UAV placement strategy for disaster-resilient communication network. In Proceedings of the 2020 IEEE 92nd Vehicular Technology Conference (VTC2020-Fall), Victoria, BC, Canada, 18 November–16 December 2020; pp. 1–7. [Google Scholar]
- Do-Duy, T.; Nguyen, L.D.; Duong, T.Q.; Khosravirad, S.R.; Claussen, H. Joint optimisation of real-time deployment and resource allocation for UAV-aided disaster emergency communications. IEEE J. Sel. Areas Commun. 2021, 39, 3411–3424. [Google Scholar] [CrossRef]
- Amrallah, A.; Mohamed, E.M.; Tran, G.K.; Sakaguchi, K. Optimization of UAV 3D trajectory in a post-disaster area using dual energy-aware bandits. IEICE Commun. Express 2023, 12, 403–408. [Google Scholar] [CrossRef]
- Ishigami, M.; Sugiyama, T. A novel Drone’s height control algorithm for throughput optimization in disaster resilient network. IEEE Trans. Veh. Technol. 2020, 69, 16188–16190. [Google Scholar] [CrossRef]
- Lorincz, J.; Tahirović, A.; Stojkoska, B.R. A novel real-time unmanned aerial vehicles-based disaster management framework. In Proceedings of the 2021 29th Telecommunications Forum (TELFOR), Belgrade, Serbia, 23–24 November 2021; pp. 1–4. [Google Scholar]
- Zhang, S.; Liu, J. Analysis and optimization of multiple unmanned aerial vehicle-assisted communications in post-disaster areas. IEEE Trans. Veh. Technol. 2018, 67, 12049–12060. [Google Scholar] [CrossRef]
- Neetu, R.; Gupta, A.; Ghatak, G.; Srivastava, A.; Bohara, V.A. Joint bandwidth and position optimization in UAV networks deployed for disaster scenarios. In Proceedings of the 2021 National Conference on Communications (NCC), Kanpur, India, 27–30 July 2021; pp. 1–6. [Google Scholar]
- Lu, F.; Chen, W.; Feng, W.; Bi, H. 4PL routing problem using hybrid beetle swarm optimization. Soft Comput. 2023, 27, 17011–17024. [Google Scholar] [CrossRef]
- Lu, F.; Jiang, R.; Bi, H.; Gao, Z. Order Distribution and Routing Optimization for Takeout Delivery under Drone–Rider Joint Delivery Mode. J. Theor. Appl. Electron. Commer. Res. 2024, 19, 774–796. [Google Scholar] [CrossRef]
- Qadir, Z.; Ullah, F.; Munawar, H.S.; Al-Turjman, F. Addressing disasters in smart cities through UAVs path planning and 5G communications: A systematic review. Comput. Commun. 2021, 168, 114–135. [Google Scholar] [CrossRef]
- Cabreira, T.M.; Brisolara, L.B.; Paulo R, F.J. Survey on coverage path planning with unmanned aerial vehicles. Drones 2019, 3, 4. [Google Scholar] [CrossRef]
- Ju, C.; Luo, Q.; Yan, X. Path planning using an improved a-star algorithm. In Proceedings of the 2020 11th International Conference on Prognostics and System Health Management (PHM-2020 Jinan), Jinan, China, 23–25 October 2020; pp. 23–26. [Google Scholar]
- Kadry, S.; Alferov, G.; Fedorov, V.; Khokhriakova, A. Path optimization for D-star algorithm modification. AIP Conf. Proc. 2022, 2425, 080002. [Google Scholar]
- Zhang, Z.; Wu, J.; Dai, J.; He, C. A novel real-time penetration path planning algorithm for stealth UAV in 3D complex dynamic environment. IEEE Access 2020, 8, 122757–122771. [Google Scholar] [CrossRef]
- Alolaiwy, M.; Hawsawi, T.; Zohdy, M.; Kaur, A.; Louis, S. Multi-objective routing optimization in electric and flying vehicles: A genetic algorithm perspective. Appl. Sci. 2023, 13, 10427. [Google Scholar] [CrossRef]
- Lamini, C.; Benhlima, S.; Elbekri, A. Genetic algorithm based approach for autonomous mobile robot path planning. Procedia Comput. Sci. 2018, 127, 180–189. [Google Scholar] [CrossRef]
- Al-Qurabat, A.K.M.; Kadhum Idrees, A. Data gathering and aggregation with selective transmission technique to optimize the lifetime of Internet of Things networks. Int. J. Commun. Syst. 2020, 33, e4408. [Google Scholar] [CrossRef]
- Hamidouche, R.; Aliouat, Z.; Abba Ari, A.A.; Gueroui, A.M. Optimized data gathering in a heterogeneous Internet of Things network. Int. J. Commun. Syst. 2021, 34, e4998. [Google Scholar] [CrossRef]
- Matamoros Vargas, J.A. Aerial Base Station Deployment for Post-Disaster Public Safety Applications. Master’s Thesis, University of Nebraska-Lincoln, Lincoln, NE, USA, 2019. [Google Scholar]
- Glover, F.W.; Kochenberger, G.A. Handbook of Metaheuristics; Springer Science & Business Media: New York, NY, USA, 2006; Volume 57. [Google Scholar]
- Burke, E.K.; Hyde, M.R.; Kendall, G.; Ochoa, G.; Özcan, E.; Woodward, J.R. A classification of hyper-heuristic approaches: Revisited. In Handbook of Metaheuristics; Springer: Cham, Switzerland, 2019; pp. 453–477. [Google Scholar]
- Shi, L.; Xu, S. UAV path planning with QoS constraint in device-to-device 5G networks using particle swarm optimization. IEEE Access 2020, 8, 137884–137896. [Google Scholar] [CrossRef]
- Zhong, X.; Huo, Y.; Dong, X.; Liang, Z. QoS-compliant 3-D deployment optimization strategy for UAV base stations. IEEE Syst. J. 2020, 15, 1795–1803. [Google Scholar] [CrossRef]
- Bhandari, S.; Wang, X.; Lee, R. Mobility and location-aware stable clustering scheme for UAV networks. IEEE Access 2020, 8, 106364–106372. [Google Scholar] [CrossRef]
- Shao, S.; Peng, Y.; He, C.; Du, Y. Efficient path planning for UAV formation via comprehensively improved particle swarm optimization. ISA Trans. 2020, 97, 415–430. [Google Scholar] [CrossRef]
- Tang, J.; Song, J.; Ou, J.; Luo, J.; Zhang, X.; Wong, K.K. Minimum throughput maximization for multi-UAV enabled WPCN: A deep reinforcement learning method. IEEE Access 2020, 8, 9124–9132. [Google Scholar] [CrossRef]
- Shi, L.; Xu, S.; Liu, H.; Zhan, Z. QoS-Aware UAV Coverage path planning in 5G mmWave network. Comput. Netw. 2020, 175, 107207. [Google Scholar] [CrossRef]
- Fan, D.; Shi, P. Improvement of Dijkstra’s algorithm and its application in route planning. In Proceedings of the 2010 Seventh International Conference on Fuzzy Systems and Knowledge Discovery, Yantai, China, 10–12 August 2010; Volume 4, pp. 1901–1904. [Google Scholar]
- Tan, Z.; Qu, H.; Zhao, J.; Zhou, S.; Wang, W. UAV-aided edge/fog computing in smart IoT community for social augmented reality. IEEE Internet Things J. 2020, 7, 4872–4884. [Google Scholar] [CrossRef]
- Ausonio, E.; Bagnerini, P.; Ghio, M. Drone swarms in fire suppression activities: A conceptual framework. Drones 2021, 5, 17. [Google Scholar] [CrossRef]
- Cheng, L.; Zhong, L.; Zhang, X.; Xing, J. A staged adaptive firefly algorithm for UAV charging planning in wireless sensor networks. Comput. Commun. 2020, 161, 132–141. [Google Scholar] [CrossRef]
- Wang, H.; Wang, J.; Ding, G.; Chen, J.; Gao, F.; Han, Z. Completion time minimization with path planning for fixed-wing UAV communications. IEEE Trans. Wirel. Commun. 2019, 18, 3485–3499. [Google Scholar] [CrossRef]
- Li, K.; Ge, F.; Han, Y.; Wang, Y.; Xu, W. Path planning of multiple UAVs with online changing tasks by an ORPFOA algorithm. Eng. Appl. Artif. Intell. 2020, 94, 103807. [Google Scholar] [CrossRef]
- Hu, X.; Pang, B.; Dai, F.; Low, K.H. Risk assessment model for UAV cost-effective path planning in urban environments. IEEE Access 2020, 8, 150162–150173. [Google Scholar] [CrossRef]
- Qu, C.; Gai, W.; Zhong, M.; Zhang, J. A novel reinforcement learning based grey wolf optimizer algorithm for unmanned aerial vehicles (UAVs) path planning. Appl. Soft Comput. 2020, 89, 106099. [Google Scholar] [CrossRef]
- Wu, X.; Xu, L.; Zhen, R.; Wu, X. Bi-directional adaptive A* algorithm toward optimal path planning for large-scale UAV under multi-constraints. IEEE Access 2020, 8, 85431–85440. [Google Scholar] [CrossRef]
- Yu, X.; Li, C.; Zhou, J. A constrained differential evolution algorithm to solve UAV path planning in disaster scenarios. Knowl.-Based Syst. 2020, 204, 106209. [Google Scholar] [CrossRef]
- Behjati, M.; Nordin, R.; Zulkifley, M.A.; Abdullah, N.F. 3D Global Path Planning Optimization for Cellular-Connected UAVs under Link Reliability Constraint. Sensors 2022, 22, 8957. [Google Scholar] [CrossRef]
- 38.901, G.T. Study on channel model for frequencies from 0.5 to 100 GHz, 2017. Available online: https://www.etsi.org/deliver/etsi_tr/138900_138999/138901/14.00.00_60/tr_138901v140000p.pdf (accessed on 15 June 2024).
- Merwaday, A.; Mukherjee, S.; Güvenç, I. HetNet capacity with reduced power subframes. In Proceedings of the 2014 IEEE Wireless Communications and Networking Conference (WCNC), Istanbul, Turkey, 6–9 April 2014; pp. 1380–1385. [Google Scholar]
- Rupasinghe, N.; Yapıcı, Y.; Güvenç, I.; Kakishima, Y. Non-orthogonal multiple access for mmWave drone networks with limited feedback. IEEE Trans. Commun. 2018, 67, 762–777. [Google Scholar] [CrossRef]
- Kumbhar, A.; Singh, S.; Guvenc, I. UAV assisted public safety communications with LTE-Advanced HetNets and FeICIC. In Proceedings of the 2017 IEEE 28th Annual International Symposium on Personal, Indoor, and Mobile Radio Communications (PIMRC), Montreal, QC, Canada, 8–13 October 2017; pp. 1–7. [Google Scholar]
- Kumbhar, A.; Guvenc, I.; Singh, S.; Tuncer, A. Exploiting LTE-Advanced HetNets and FeICIC for UAV-assisted public safety communications. IEEE Access 2017, 6, 783–796. [Google Scholar] [CrossRef]
- Madani, B.; Ndiaye, M.; Salhi, S. Hybrid truck-drone delivery system with multi-visits and multi-launch and retrieval locations: Mathematical model and adaptive variable neighborhood search with neighborhood categorization. Eur. J. Oper. Res. 2024, 316, 100–125. [Google Scholar] [CrossRef]
- Hoomod, H.K.; Al-Mejibli, I.; Jabboory, A.I. Analyzing study of path loss propagation models in wireless communications at 0.8 GHz. J. Phys. Conf. Ser. 2018, 1003, 012028. [Google Scholar] [CrossRef]
- Armoogum, V.; Soyjaudah, K.; Mohamudally, N.; Fogarty, T. Propagation Models and Their Applications in Digital Television Broadcast Network Design and Implementation; IntechOpen: London, UK, 2010. [Google Scholar]
- Pedregosa, F.; Varoquaux, G.; Gramfort, A.; Michel, V.; Thirion, B.; Grisel, O.; Blondel, M.; Prettenhofer, P.; Weiss, R.; Dubourg, V.; et al. Scikit-learn: Machine learning in Python. J. Mach. Learn. Res. 2011, 12, 2825–2830. [Google Scholar]
- Buitinck, L.; Louppe, G.; Blondel, M.; Pedregosa, F.; Mueller, A.; Grisel, O.; Niculae, V.; Prettenhofer, P.; Gramfort, A.; Grobler, J.; et al. API design for machine learning software: Experiences from the scikit-learn project. arXiv 2013, arXiv:1309.0238. [Google Scholar]
- Roy, S.K.; Maity, G. Minimizing cost and time through single objective function in multi-choice interval valued transportation problem. J. Intell. Fuzzy Syst. 2017, 32, 1697–1709. [Google Scholar] [CrossRef]
- Voloshin, V.I. Introduction to Graph Theory; Nova Science Publishers: Hauppauge, NY, USA, 2009. [Google Scholar]
- Yang, X.S. Nature-Inspired Metaheuristic Algorithms; Luniver Press: London, UK, 2010. [Google Scholar]
- Yang, X.S. Engineering Optimization: An Introduction with Metaheuristic Applications; John Wiley & Sons: Hoboken, NJ, USA, 2010. [Google Scholar]
- Wang, K.; Zhang, J.; Li, D.; Zhang, X.; Guo, T. Adaptive affinity propagation clustering. arXiv 2008, arXiv:0805.1096. [Google Scholar]
- Bi, H.; Lu, F.; Duan, S.; Huang, M.; Zhu, J.; Liu, M. Two-level principal–agent model for schedule risk control of IT outsourcing project based on genetic algorithm. Eng. Appl. Artif. Intell. 2020, 91, 103584. [Google Scholar] [CrossRef]
Disclaimer/Publisher’s Note: The statements, opinions and data contained in all publications are solely those of the individual author(s) and contributor(s) and not of MDPI and/or the editor(s). MDPI and/or the editor(s) disclaim responsibility for any injury to people or property resulting from any ideas, methods, instructions or products referred to in the content. |
© 2024 by the authors. Licensee MDPI, Basel, Switzerland. This article is an open access article distributed under the terms and conditions of the Creative Commons Attribution (CC BY) license (https://creativecommons.org/licenses/by/4.0/).