Abstract
In response to potential denial environments such as canyons, gullies, islands, and cities where users are located, traditional Telemetry, Tracking, and Command (TT&C) systems can still maintain core requirements such as availability, reliability, and sustainability in the face of complex electromagnetic environments and non-line-of-sight environments that may cause service degradation or even failure. This paper presents a single-station emergency solution that integrates communication and TT&C (IC&T) functions based on radar chaff cloud technology. Firstly, a suitable selection of frequency bands and modulation methods is provided for the emergency IC&T system to ensure compatibility with existing communication and TT&C systems while catering to the future needs of IC&T. Subsequently, theoretical analyses are conducted on the communication link transmission loss, data transmission, code tracking accuracy, and anti-multipath model of the emergency IC&T system based on the chosen frequency band and modulation mode. This paper proposes a dual-way asynchronous precision ranging and time synchronization (DWAPR&TS) system employing dual one-way ranging (DOWR) measurement, a dual-way asynchronous incoherent Doppler velocity measurement (DWAIDVM) system, and a single baseline angle measurement system. Next, we analyze the physical characteristics of the radar chaff and establish a dynamic model of spherical chaff cloud clusters based on free diffusion. Additionally, we provide the optimal strategy for deploying chaff cloud. Finally, the emergency IC&T application based on the radar chaff cloud relay is simulated, and the results show that for severe interference, taking drones as an example, under a measurement baseline of 100 km, the emergency IC&T solution proposed in this paper can achieve an accuracy range of approximately 100 m, a velocity accuracy of 0.1 m/s, and an angle accuracy of 0.1°. In comparison with existing TT&C system solutions, the proposed system possesses unique and potential advantages that the others do not have. It can serve as an emergency IC&T reference solution in denial environments, offering significant value for both civilian and military applications.
1. Introduction
Telemetry, tracking, and command (TT&C) in denial environments is a very difficult problem. In addition to being challenging in the military field, it is also a very tricky issue in the civilian field, especially for the work of emergency services and rescue and other related aspects. In recent years, frequent natural disasters worldwide, including major geological, meteorological, and fire disasters, have led to devastating consequences [1]. These events have caused power, transportation, and communication systems to become paralyzed and unable to recover quickly [2,3,4]. This has resulted in significant difficulties for emergency relief efforts and public communication and has further increased losses of life and property. As a response, government departments worldwide are focusing on deploying mobile and flexible emergency TT&C systems in complex environments such as canyons, gullies, islands, and cities, restoring radio services in affected areas and providing timely disaster reports. These tasks are crucial to saving lives and limiting property damage during times of crisis. Future trends necessitate that telemetry, tracking, and command (TT&C) systems be capable of achieving all-weather, all-airspace, and all-time communication as well as integration (IC&T) applications [5]. As a result, establishing a comprehensive IC&T system has become a current research focus.
Looking back at the development process of TT&C systems, in the early 1940s, Germany’s V2 missile successfully applied the TT&C system for the first time [6], which can be considered as the opening masterpiece of TT&C systems, as an important technological means of space-based TT&C systems. Satellite navigation and positioning systems were successfully launched into orbit by the Soviet Union in 1957 [7], marking a new epoch in the field of TT&C for all humankind. The world also entered a new era of satellite applications. In 1964, the US Navy successfully built the navy navigation satellite system (NNSS), also known as the Transit system [8], which was the first generation of satellite navigation systems. The satellites in the NNSS sent signals to ground stations, which synchronized the received signals and then calculated the positioning information. The actual measurement accuracy of the system after a successful launch was 70 m, which was upgraded to 30 m in 1976 [9]. However, with the development of satellite technology, NSSS withdrew from the historical stage in 1996, being replaced by a global positioning system (GPS) with a better performance. The deep space network (DSN) in the US is the world’s largest and most sensitive TT&C network. Since the full use of new digital receivers by the DSN in 1997, the system can an achieve ranging accuracy of better than 0.6 m and a velocity measurement accuracy of 0.03 m/s [10]. The European space agency (ESA) proposed the navigation satellite (Navsat) program in 1982. If the Navsat system uses spread spectrum code for positioning, the accuracy can reach 10 m. If uses continuous carrier positioning, the accuracy is relatively low, within an error range of about 100 m. In 2002, the ESA built a new deep space base station with a ranging accuracy of better than 0.9 m [11]. The global navigation satellite systems (GNSSs) represented by GPS are a more successful engineering implementation that can achieve global coverage and all-weather positioning. When using a new spread spectrum pseudocode algorithm, the positioning accuracy can reach up to 1 m [12]. As another type of space-based TT&C method, the tracking and data relay satellite system (TDRSS), is also the main space-based measurement and control means. In 1983, the US launched the first TDRSS satellite, TDRS-1, ushering in a new era of space-based TT&C. TDRSS mainly uses data relay as a technical means [13]. Medium-orbit spacecrafts transmit information to ground stations through the relay function of low-orbit spacecrafts. This space-based TT&C thinking improves the coverage range of communication and TT&C of the entire satellite system.
The accomplishments of the aforementioned satellite systems are remarkable. However, when encountering denial environments due to extreme challenges, despite having corresponding anti-interference or multi-path mitigation technical capabilities, traditional TT&C and navigation systems overly depend on satellites. For example, in the GNSSs denial environment, drone positioning is enhanced through multiple terrestrial signals of opportunity (SOPs), the use of a small number of expensive heterogeneous agents, or asynchronous multi-sensor information fusion. Additionally the internet LEO constellation replaces the traditional GNSS to ensure the drones’ location service [14,15,16,17,18,19,20]. However, traditional solutions with poor real-time performance and excessive reliance on high-precision sensors or LEO satellite systems may result in unsustainable auxiliary means corresponding to TT&C systems and even an inability to provide services [21,22]. This leads to the guided weapons in the military field being unable to play a role. In the civil field, similar services such as freight, aerial photography, traffic patrol, disaster search and rescue, environmental monitoring, dangerous area detection, and relay emergency response cannot be carried out normally. Therefore, researchers began to research space-based emergency TT&C methods in the restricted environment. In the 1950s, meteor remnant communication and TT&C began to be studied [23] due to their complete independence from meteorological conditions such as sunspot eruptions, magnetic storms, and ionospheric disturbances. These advantages were the shortcomings of satellite communication. Therefore, meteor residual trace communication is a very ideal means of emergency communication and TT&C. However, due to the excessive reliance on meteors, the system’s pass rate was low, its stability was poor, and it had significant random burst characteristics and strictly limited service times which could not meet the relay TT&C requirements in denial environments. Observation balloons were one of the most intuitive and easily mastered battlefield observation devices before the advent of reconnaissance aircrafts, satellites, and other technologies. They were widely used in both World War I and World War II [24], but they are not considered strict emergency TT&C systems. Essentially, they are reconnaissance and air blockage defense systems. With the rapid development of unmanned platform technology, the use of mobile tethered balloons and small remote-controlled airships on lighter than air craft (LTAC) platforms equipped with various communication, observation, monitoring, and other communication relay electronic devices can temporarily build emergency TT&C systems [25]. However, the coverage of relay TT&C systems based on LTAC platforms is limited, and they are severely affected by environmental factors. Therefore, they do not have the conditions for all-weather use. Radar chaff was the earliest and most effective jamming equipment in passive radar jamming technology. Widely used during World War II [26], it had the advantages of wide frequency bands, strong adaptability, convenient use, obvious jamming effects, and low costs. Its application is becoming increasingly widespread. Dropping chaff-jamming bombs can form chaff clouds to attract missile tracking and protect platform safety. Due to the light weight of the chaff, it has a slow descent speed in the air and can float in the air for a long time. Chaff clouds can be formed by ground artillery firing, aircraft, or aerial vehicle deployment to designated heights. These clouds can then be used as relay communication and TT&C systems [27,28,29].
The traditional TT&C structure and function are separate and single, although the current research on TT&C is more in-depth [28,29,30,31,32,33,34,35,36,37,38,39,40,41,42]. The functions and connotations of TT&C have evolved from TT&C systems to IC&T systems, but with the development of TT&C technology, various applications have also put forward new requirements for TT&C. However, research on IC&T mostly remains in the conception stage. There is very little systematic theoretical research work, and engineering achievements are almost blank. In view of this, in this paper, a single station emergency IC&T technique in a denial environment is studied using chaff clouds as relay systems. In response to emergency situations where various support systems are unable to function and existing emergency communication and monitoring systems are subject to various limitations, based on the excellent characteristics of the radar chaff, through its reasonable deployment, a cloud can be formed to provide emergency IC & T services then establish a new emergency IC&T system suitable for emergencies. This system is flexible and can adapt to a variety of complex environments, which can provide timely and effective IC&T services in the affected area after an emergency.
In this paper, we comprehensively consider the complex environments that users may be in, such as canyons, gullies, islands, and cities, considering the future trend of integrated communication and TT&C (IC&T). A single-station emergency solution based on radar chaff cloud construction with IC&T functions is proposed, which can effectively solve the problem of service degradation or even failure in complex electromagnetic environments and non-line-of-sight environments. The second section introduces the principle of emergency IC&T of radar chaff cloud relays, the third section analyzes and models the physical characteristics of the radar chaff and the aerodynamics of the chaff cloud. In the fourth section, the corresponding theories of the third section are simulated and analyzed, respectively. The fifth section provides algorithm comparisons, and the last section give the conclusions and prospects of this paper. This research can further enrich the theoretical system of IC&T and provide theoretical support for subsequent engineering. The research results can be applied to measurement services such as distance, velocity, angle measurement and time–frequency synchronization. Support business types such as TT&C, communication, broadcasting, and messaging, serving users such as manned/unmanned cluster aircrafts, vehicles, and ships, it suitable for practical scenarios such as in the air, low altitudes, surface, sea, and underground. It can be used as an IC&T reference solution for extreme challenging environments such as mountains, canyons, jungles, straits, bays, island cities, streets, and underground mines.
2. Principle of Single-Station Emergency IC&T
2.1. IC&T Modulation Manners and Signal Models
2.1.1. Selection of Modulation Manners
Currently, in the fields of communication and TT&C, there are specific modulation modes that are suitable for achieving information interactions. Great accomplishments have been made in this area, with these modulation systems representing the mainstream and maturity in current practices. In communication applications, Gaussian filtered minimum shift keying (GMSK) modulation technology is commonly used, which is an improvement of minimum shift keying (MSK) [43]. It involves inserting a Gaussian low-pass pre-modulation filter before the MSK modulator, thereby improving spectrum utilization and communication quality. In 3G and 4G systems, quadrature phase shift keying (QPSK) modulation technology is adopted. In the current research hot 5G system [44,45], the supported modulation is more diverse, mainly including carrier phase variation and amplitude unchanged π/2-binary phase shift keying (BPSK) modulation methods.
For TT&C applications, after the digitization of TT&C baseband signals, the current trend is to use the digital modulation mode represented by frequency shift keying (FSK) to obtain high-power efficiency [46]. In addition, considering the demand for constant envelope characteristics in TT&C as well as bandwidth limitations, MSK and GMSK are also recommended [47,48]. For spread-spectrum TT&C, typical direct sequence spread spectrum technology usually uses BPSK modulation [33,49,50,51,52]. BPSK is also the foundation of other direct spread-spectrum modulation methods in the field of TT&C [53].
Considering the significant applications of BPSK modulation in the communication and TT&C fields, to meet the compatibility requirements for IC&T, we adopt BPSK modulation as the universal modulation signal for IC&T. Next, we briefly introduce the signal model of BPSK.
2.1.2. BPSK-R (n) Signal Model
BPSK is a common phase communication modulation with strong noise resistance and simple operation. Its signal baseband form is as follows [54]:
where ak is a pseudocode sequence with a value of ±1, Tc is the pseudocode width, μTc is the spreading symbol, usually a rectangular pulse, and k represents the k-th spreading symbol.
Specifically, if μTc is a rectangular pulse, BPSK modulation can be referred to as BPSK-R modulation, where R represents a rectangle. We know that the pseudocode rate and code width are reciprocal of each other, i.e., [53]:
where f0 is the reference frequency; for BPSK modulation, its value is 1.023 MHz. n is the modulation coefficient, such as n = 0.511, 5.11, 1, 4, 5, 10, etc. Therefore, BPSK-R modulation can be referred to as BPSK-R (n) modulation.
The power spectral density function and autocorrelation function of BPSK-R (n) can be obtained by performing a Fourier transform and inverse transform on Equation (1) as follows:
Figure 1 shows the power spectrum characteristics and autocorrelation characteristic curves of commonly used BPSK modulation signals.
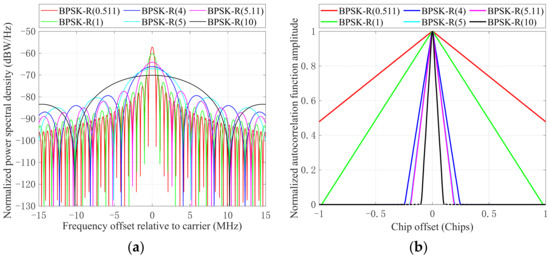
Figure 1.
Simulation of power spectrum and autocorrelation characteristics of commonly used modulation signals in the fields of IC&C. (a) Power spectrum characteristics. (b) Autocorrelation characteristics.
In Figure 1, it can be seen that the power spectrum of the BPSK-R (n) modulated signal is an even symmetric function, and the center of symmetry is at zero frequency. In general, we call the interval between the first zero crossing between the main lobe and the center of symmetry of the signal power spectrum the bandwidth; that is, the bandwidth of the BPSK-R(n) signal is B = 2nf0 = 2n/Tc, which accounts for about 90% of the total signal power. Taking n = 1 as an example, since the bit rate of BPSK-R(1) signal is 1.023 × 10⁶ cps, its bandwidth is 2B = 2.046 × 10⁶ cps. Other signals are similar, and the main lobe width increases with increases in the modulation index n. According to the relationship between power spectrum and autocorrelation, the wider the main lobe is, the narrower the autocorrelation peak is, and the sharper the autocorrelation peak is. The corresponding code tracking accuracy is also higher. Therefore, in the specific application of IC&T, the appropriate modulation index n can be selected according to the actual needs to obtain the corresponding power and tracking accuracy.
2.2. Single-Station Emergency IC&T Model Based on Radar Chaff Cloud Relay
2.2.1. Theory of Communication, Data Transmission, and Measurement Quality Analysis
(1) Communication Link Transmission Loss Model Based on Radar Chaff Cloud
The free space propagation model is used to predict the strength of the received signal in the LOS environment, which can be calculated using the Friis formula. The mathematical model is as follows [55]:
where Pt is the transmission power, Gt is the gain of the transmitting antenna, Gr is the gain of the receiving antenna, λ is the emission wavelength, d is the distance between the transmitter and receiver, Lp is the system loss coefficient independent of the transmission environment, which is usually greater than 1. When there is no hardware loss in the system, Lp = 1.
The Friis model is a generalized path loss model that is only applicable to clear and unobstructed paths between transmitters and receivers. However, in more realistic environments such as IC&T services between ground transmitters, airborne radar chaff clouds, and moving terminals, due to nonideal propagation, the logarithmic normal shadow fading model can be used. Its mathematical model is as follows [56]:
where d0 is the reference distance. At or near the reference distance, the path loss has the characteristic of free space loss. m is the path loss index, whose value changes with the environment, and Xσ represents a Gaussian random variable with a mean of zero and a standard deviation (STD) of σ.
(2) Data transmission theory based on radar chaff cloud
A communication channel is a transmission medium that connects communication devices at the sending and receiving ends. When the information is transmitted through the channel, there will be attenuation, and the interference and noise on the channel will also affect the signal, resulting in signal distortion. To correctly decode the received data without significant errors, it is necessary to research the information transmission performance under common channels. Common channels include AWGN, Rayleigh, and Rice channels. AWGN channels are mainly additive of Gaussian white noise. Commonly used to describe constant parameter channels, Rayleigh channels are the channels that reach the receiver without direct path signals. They are mainly used to describe multipath channels and Doppler frequency shift phenomena. Rician channels add LOS signals under Rayleigh channel conditions, and the strength of the LOS component is measured by the K-factor. The K-factor is defined as the energy ratio of the direct component to the Rayleigh random variable [57], which is as follows:
Based on BPSK modulation and omitting the tedious derivation process, the bit error rates (BER) for AWGN channels and Rayleigh channels can be obtained as follows:
where SNR is the signal-to-noise ratio; Q(x) is the right tailed function of the standard normal distribution, also known as the complementary cumulative distribution function, defined as ; erfc(x) is the complementary error function, defined as , where, erfc(x) = or Q(x) = ; and l is the channel attenuation coefficient.
The Rice channel is a constant value added to the Rayleigh channel. The Rice channel is generally represented as follows [58]:
where if lRichan are different, it indicates that they correspond to different distributions, which leads to different bit error rates. Kf = 0 indicates Rayleigh fading, and Kf = +∞ means no fading. Kf reflects the severity of fading, with smaller Kf values indicating more severe fading and larger Kf values indicating less severe fading.
(3) Theory of Code-tracking Accuracy of Link Measurement Signals
For a given measurement system, the quality of the measurement performance depends on the signal system and measurement algorithm used, where the evaluation of signal measurement performance includes two main factors: code tracking accuracy and anti-multipath performance.
The code-tracking error based on noncoherent early–late processing (NELP) is commonly used to evaluate the code tracking performance of signals. The evaluation mathematical model is as follows [59,60]:
where BL represents the loop noise bandwidth, Tco represents the pre-detection integration time, Lc represents the length of the chip, Pl is the carrier power of the interference signal on an infinite bandwidth, CNR = Ps/N0, Ps represents the expected signal carrier power on an infinite bandwidth, N0 represents the unilateral power spectrum of Gaussian white noise, δ is the interval between leading and lagging chips, Gsig (f) represents the normalized power spectral density function of the expected signal, and Gl (f)is the normalized power spectral density function of the interference signal.
When δ→0, the code-tracking Cramér–Rao bound of the signal in the NELP loop can obtain as follows:
where , , .
(4) Link measurement signal anti-multipath theory
Although there are already a large number of multipath reduction technologies, multipath error remains one of the main sources of error in measurement systems. Therefore, performance in multipath environments is an important reference indicator for evaluating link measurement performance. The commonly used anti-multipath models are based on pseudocode and the carrier phase.
For pseudocode anti-multipath models [61]:
When δ→0, the limit of the multipath error envelope can be obtained, which is the Cramér–Rao bound of the code-tracking multipath error envelope obtained by the NELP delay loop lock, i.e.,
In Equations (13) and (14), α represents the amplitude of the multipath reflection signal relative to the direct signal, and τm represents the delay of the multipath reflection signal relative to the direct signal. In addition, when the phase of the multipath reflection signal relative to the direct signal is an even multiple of 2π, the “±” symbol is taken as “+”, and when it is an odd multiple, it is taken as “−”.
Similarly, for the carrier-phase multipath error model, the calculation formula for the carrier phase measurement error caused by the multipath is as follows [62]:
where θm represents the phase d of the direct signal, and p is an integer.
2.2.2. TT&C Performance Analysis Theory
Without loss of generality, in this paper, a single station and the measured moving targets are researched as two measuring bodies M1 and M2. Among them, the typical representatives of the measured moving targets are drones, unmanned vehicles, and individual handheld equipment. Drones are widely used for their excellent performance in military operations and daily life, including military reconnaissance, relay communications, emergency communications, and disaster monitoring; therefore, we focus on drones as an example for analysis, focusing on three research topics that measure distance, velocity, angle, and time synchronization.
(1) Dual-way asynchronous precision ranging and time synchronization (DWAPR&TS) system based on dual one-way ranging (DOWR) measurement
According to the principle of dual one-way ranging (DOWR) measurement [63], a schematic diagram of a dual-way asynchronous precision ranging and time synchronization (DWAPR&TS) system can be constructed as shown in Figure 2.
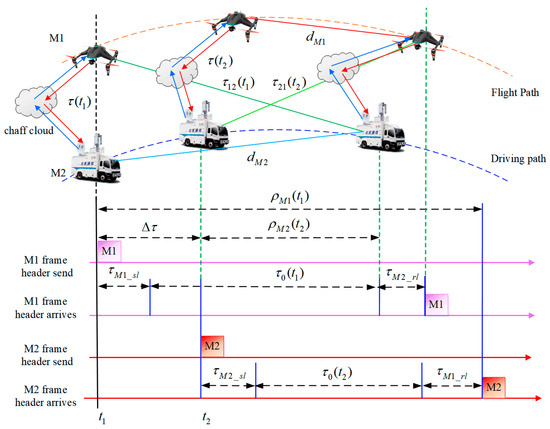
Figure 2.
DWAPR&TS system measurement principle and time sequence relationship.
In Figure 2, the parameter definitions or explanations are as follows:
- (1)
- ρM1(t1): at time t1, the local pseudo-range of the measuring body M1 is obtained by sampling the DWAPR&TS frame header;
- (2)
- τM1_sl: transmission delay of measuring body M1;
- (3)
- τM1_rl: receiving delay of measuring body M1;
- (4)
- τ0l (t1): at time t1, the transmission delay of electromagnetic waves passing through the radar chaff cloud between the antenna phase centers of measuring bodies M1 and M2;
- (5)
- Δτ: the calculation value of the time difference, which is the difference in timing between the measuring bodies M1 and M2 at time t1.
- (6)
- τ (t1): using the clock of measuring body M1 as a reference, at the beginning of the t1 transmission time slot, the distance transmission delay between measuring bodies M1 and M2 is measured through radar chaff cloud scattering;
- (7)
- τ12 (t1): the spatial propagation delay that occurs when the signal emitted by the measuring body M1 reaches the measuring body M2 through the radar chaff cloud at time t1;
- (8)
- dM1: the distance vector that measuring body M1 moves within this propagation delay.
In addition, the meanings of ρM2(t2), τM2_sl, τM2_rl, τ0 (t2), τ (t2), τ21 (t2), and dM2 are similar to the above parameter definitions. Based on the DOWR measurement principle and combined with Figure 2, the baseline measurement results and corresponding time synchronization errors of measuring bodies M2 and M1 can be obtained as follows:
where τM1M2 = τM1_sl + τM2_rl and τM2M1 = τM2_sl + τM1_rl represent the total delay of measuring bodies M1 and M2 from sending to receiving, respectively. c is the propagation speed of electromagnetic waves, and vm is the average value of the relative velocity v between the measuring bodies within Δτ.
Equations (16) and (17) are the basis for emergency IC&T ranging and time synchronization and will be used in subsequent analysis processes. Specifically, Equation (16) can be used for incoherent spread spectrum ranging systems in dual-way asymmetric channels.
According to reference [64], the time interval, time synchronization error, and baseline calculation formula between measuring bodies can be obtained for time synchronization as follows:
where τdelay− and τdelay+ both represent the combined drift. After calibration, the error usually can be less than 0.1 ns [64,65]. δτ− ≤ β0τ, δτ+ ≤ β0τ, , and . ΔfM1(t), and ΔfM2(t) represent the local spread code clock frequency deviation generated by the local frequency standards of measuring bodies M1 and M2, respectively. fcode1 and fcode2 represent the local spread code clock frequency value generated by the local time frequency standards of measuring body M1 and body M2, respectively. δΔfM1M2+ = , .
For baseline measurement and time synchronization error elimination and adjustment between measuring bodies, alternate iterations can be used to calculate and achieve time synchronization error elimination and adjustment based on relevant radio ranging theory and research references [66,67,68]. After analysis and derivation, the current sampling time interval, time synchronization error, and measuring bodies’ baseline can be calculated using the following formula:
According to Equations (18) and (19), the residuals after time synchronization adjustment are as follows:
According to the first equation in Equation (20), we make the following transformation:
Namely:
Let |Δt(k)| ≥ μ0|δτ−| (Ɐ k = 1, 2, 3, …). According to the properties of basic inequality operations, we can obtain:
According to optimization theory, the iterative algorithm given in Equation (23) is an optimization algorithm under the condition of convergence factor γ0 << 1, and its result will converge to μ0|δτ−|. Combining Equations (20) and (23), it can be concluded that after several rounds of iterative calculation and time synchronization error elimination adjustment, the calculated residual of the sampling time interval Δt(k) between the two measuring bodies can converge to μ0|δτ−|. At the same time, the theoretical measurement error of the time synchronization error ΔtM1M2(k) will eventually converge to γ0 (μ0|δτ−|) + |δτ−|, while the theoretical measurement error δτ (k) of baseline τ (k) between measuring bodies will converge to γ0 (μ0|δτ−|) + |δτ+|. It is evident that the theoretical measurement errors of Δt(k), ΔτM1M2 (k), and δτ (k) are all smaller than μ0β0τ, which can be ignored.
According to Equation (23), for the specific analysis of convergence performance, if the initial value of the i-th local measurement point before the time synchronization error elimination adjustment is set to Δt(i), then after k times of time synchronization adjustment, the value of the (i + k)-th measurement point of Δt(i + k) is as follows:
Table 1 presents the statistical results of residuals under different adjustment time intervals and times with an initial value of μ0|δτ−| < 0.1 ps and γ0 = 2 × 10⁻⁶. It can be found that for different adjustment intervals, after five adjustments, the residuals can converge to the negligible limit value, which can be considered as converging to 0. The convergence speed of the algorithm is also very fast.

Table 1.
Residual statistical results under different adjustment time intervals and number of adjustments given initial values.
(2) Dual-way asynchronous incoherent Doppler velocity measurement (DWAIDVM) system
Doppler frequency velocimetry is a conventional method for measuring dynamic targets. This paper proposes a dual-way asynchronous incoherent Doppler velocity measurement (DWAIDVM) system that is suitable for emergency IC&T based on the dual-way asynchronous communication link between measuring bodies. This system is based on the signals received by the two links from each other. It then uses a local carrier loop to perform local Doppler measurements on the received signals, thereby obtaining the local pseudo velocity.
For measuring body M1, the clock frequency is the sum of its nominal frequency f01 and clock frequency δf1, i.e., f01 + δf1. The RF carrier frequency is fRF1 = N1(f01 + δf1), where N1 is a positive integer. The Doppler frequency of the signal emitted by measuring body M2 measured by measuring body M1 is as follows:
where θ1(k) is the carrier phase count value of the local carrier loop in the k-th step of the measuring body M1, and T is the refresh interval.
Similarly, it can be concluded that the Doppler frequency of the signal emitted by measuring body M1 measured by measuring body M2 is as follows:
Since v is usually less than the speed of light, v/c < 1 × 10⁻⁶. In addition, due to the commonly used nominal frequencies of crystal oscillators ranging from 1 to 200 MHz, such as 8 MHz, 12 MHz, 24 MHz, and 125 MHz, higher output frequencies are also commonly doubled by phase lock loops to 1 GHz or higher. However, the clock frequencies of measuring bodies M1 and M2 are very small. Usually, δf1/f01 and δf2/f02 are smaller than 1 × 10⁻⁸, so they can be considered infinitesimal. Therefore, using Taylor expansion and first-order approximation, we can obtain the following:
where
v1(k) and v2(k) represent the local pseudo-velocity measurement values of measuring bodies M1 and M2, respectively. When f01 = f02 = f0, Equations (27) and (28) can degenerate into the following:
Equations (27) and (29) provide the calculation expressions for the relative velocity and clock frequency difference between measuring bodies M1 and M2, while Equations (28) and (30) are the local pseudo velocity calculation formulas for measuring bodies M1 and M2.
(3) Angle measurement system based on a single baseline
Due to the current use of low-frequency carrier measurement technology, it can only meet the accuracy of angle measurement at the second level, and the baseline used is relatively long. In the denial environment, due to limitations such as measurement volume, without relying on GNSS, by installing a short baseline on the measuring body, selecting high-frequency carriers, and combining pseudocode-assisted carrier technology to improve carrier-tracking accuracy, high-precision angle measurement results can be obtained. Figure 3 shows the principle diagram of angle measurement based on a single baseline.
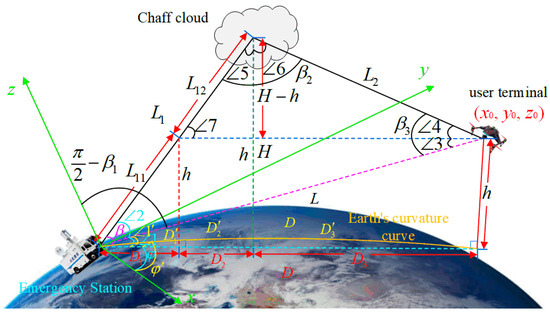
Figure 3.
Schematic diagram of angle measurement based on a single baseline.
According to the principle of single baseline angle measurements [69], in the triangle formed by the emergency station, chaff cloud, and drone, β1 can be calculated using a single baseline measurement algorithm. β2 is the same, but this angle is not the true angle between the emergency station and drone. Therefore, the pseudocode needs to calculate the included angle ∠1′ ≈ ∠1 between the emergency station, drone, and sea level. Based on basic geometric knowledge, we can consider that D′1 + D′2 ≈ D1 + D2, then:
According to the cosine theorem, we can obtain the following:
And we can solve:
where L1 is the LOS distance between the emergency station and the radar chaff cloud, L2 is the LOS distance between the drone and the radar chaff cloud, L is the non-LOS distance between the emergency station and the drone, H is the deployment height between the radar chaff cloud, and h is the sea level height of the drone. Since h is relatively small compared to L, it can be considered as the projection value of D ≈ D′.
Assuming that a drone’s position in the spherical coordinate system is (L, π/2 − β1, φ′) ≈ (L, π/2 − β1, φ) and its position in the Cartesian coordinate system is (x0, y0, z0), the conversion relationship is as follows:
In the actual measurement process, the commonly obtained drone spherical coordinates are (L + ΔL, π/2 − (β1 + Δβ1), φ + Δφ), where ΔL is the distance measurement error, Δβ1 is the angle measurement error, and Δφ is the direction measurement error. The conversion relationship between the spherical coordinates and the Cartesian coordinates is as follows:
According to Equations (37) and (38), the error between the true value and the measured value can be obtained as follows:
Substituting Equations (37) and (38) into (39) yields the following:
When L >> ΔL, Equation (40) becomes the following:
When L = 100 km and the accuracy of the angle measurement and direction measurement are both 0.1 °, the positioning error can be obtained to be within 247.5 m, which meets the requirements for emergency IC&T and positioning. If the accuracy continues to increase to 0.01 ° or 0.001 °, the corresponding positioning accuracy will be 24.75 m and 2.47 m, respectively. This is a significant improvement in system performance.
3. Physical Characteristic Analysis of Radar Chaff and Aerodynamic Modeling of Chaff Cloud
3.1. Effective Radar Cross Section (RCS) of Radar Chaff
In practical applications, the scattering characteristics of the chaff and chaff cloud can be analyzed based on the effective radar cross section (RCS) of a single radar chaff and the effective RCS of a radar chaff cloud formed by a large number of radar chaff bombs. These all have great reference significance.
3.1.1. Effective RCS of a Single Radar Chaff
If the radar chaff is considered as an ideal half-wavelength conductor, based on the definition of RCS, the RCS of this half-wavelength radar chaff can be derived as follows [70]:
where λ is the working wavelength of the IC&T system, and θ is the angle between the electric field intensity formed by the incident electromagnetic wave and the radar chaff.
3.1.2. Average RCS of Radar Chaff Cloud
When a large number of radar chaffs are dropped into physical space, at this time, the orientation of each chaff in the physical space is random, and it moves in a disorderly and irregular way. Then, in Equation (42), θ can be regarded as a random variable with an equal probability distribution in a specific physical space. Therefore, it is only necessary to determine the average effective RCS of a single radar chaff. Based on the scattering characteristics of clutter, the total effective RCS of N radar chaffs is as follows [71]:
where Sλ/2 is the average effective RCS of a single radar chaff.
If the radar chaffs are randomly distributed with an equal probability in two-dimensional space, the average effective RCS of the radar chaff is as follows [72]:
3.2. Radar Chaff Aerodynamic Modeling
3.2.1. Optimal Deployment of Radar Chaff Cloud
(1) Optimal Location of Radar Chaff Cloud
When the ground emergency station tracks the radar chaff cloud, it is tracking the effective RCS equivalent energy center, i.e., the center of mass, of the radar chaff cloud. The radar chaff cloud should be located as close as possible to the tracking antenna, i.e., above the tracking antenna. The optimal position for the radar chaff cloud is [73]:
where D is the LOS distance between a single station and a moving target, R = 4/3 × 6371 km is the equivalent radius of the Earth, and H is the height of the radar chaff cloud above the ground.
Considering the descent speed of the chaff, the irregularity of the ground, and the influence of the curvature of the Earth, it is possible to increase the height of the chaff cloud appropriately in practice so that the optimal position of the radar chaff cloud is located at a sufficiently high position above the tracking antenna.
(2) Optimal strategy for deploying radar chaff clouds
The different performance evaluation criteria for single-station emergency IC&T systems based on chaff cloud relays result in different optimal deployment strategies for chaff clouds. Among them, regarding optimal deployment, there are several types, including optimal deployment strategies based on launch power, transmission loss, situational awareness, and meteorological conditions. Due to the impact of the deployment location of the chaff cloud on the transmission loss of the link, in this paper, we present an optimal deployment strategy based on transmission loss, as shown in Figure 4.
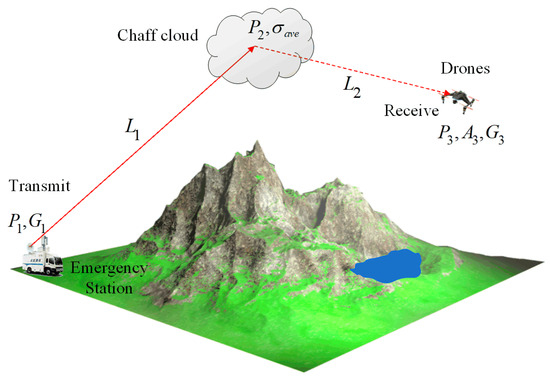
Figure 4.
Schematic diagram of optimal deployment strategy based on transmission loss.
Below, we present an optimal deployment strategy based on transmission loss. According to Figure 4, and combined with the antenna transmission theory, we can obtain:
where P1 is the radiated power of the transmitter, G1 is the average transmission antenna gain in the direction of the radar chaff cloud, P2 is the effective radiation power of the transmitter incident on the radar chaff cloud, σave is the average radar cross-section of the chaff cloud, A3 is the effective area of the receiving antenna, and G3 is the gain of the receiving antenna.
According to Equation (46), the position with the smallest product of L1L2 should be optimal, which means that the transmission loss is minimized. The chaff cloud should be as close as possible to the antenna of one side, and the optimal deployment strategy can be represented by a mathematical model as follows:
3.2.2. Modeling of the Motion Characteristics of Radar Chaff Clouds
When a radar chaff bomb explodes in physical space, it produces a large amount of chaff, which quickly spreads in all directions in the air. During this process, it is affected by air resistance, gravity, buoyancy, and wind, and the radar chaff cloud continuously expands over time. Due to the relatively stable stratospheric airflow, the diffusion speed of radar chaff clouds is relatively small, but the convective airflow is strong with large temperature changes, and the diffusion speed of the radar chaff cloud is high. The diffusion of the chaff cloud is related to its initial thickness, the degree of dispersion of the descent speed, and the magnitude of the wind speed gradient. The descent speed of the radar chaff cloud is influenced by many factors, not only related to the properties of the radar chaff itself, such as material, mass, shape, and length, but also related to the atmospheric parameters of the airspace where the chaff is deployed.
In the horizontal direction, the radar chaff cloud can reduce its deployment speed to 0 within 0.2 s. At this time, the motion of the radar chaff cloud is only affected by wind speed. Therefore, in the horizontal direction, the motion speed of the radar chaff cloud is:
where Ddif is the diffusion coefficient, which is related to the atmospheric temperature and the aerodynamic characteristics of the chaff itself. The negative sign indicates diffusion from areas with high densities to areas with low densities. dρ/dx represents the rate of change of the radar chaff cloud density along the x-axis. Table 2 shows the diffusion velocity of the aluminum chaff cloud under different wind gradients [74].

Table 2.
Diffusion rates of aluminum chaff cloud under different wind gradients.
In the vertical direction, under the combined effects of air buoyancy and self-gravity, the motion of the radar chaff can regard as a uniform equilibrium motion state. The descending speed is related to the specific altitude [75]:
where μm is the average molecular weight, g0 = 9.8 m/s2 is the gravitational acceleration, H is the height at which the radar chaff cloud is located, kB = 1.38 × 10⁻²³ J/K is the Boltzmann constant, J is the energy unit, and K is the thermodynamic temperature unit. Tm is the temperature in degrees Celsius corresponding to the height, and its conversion relationship with the thermodynamic temperature is K0 = Tm + 273.15 °C, kBTm = 0.02852 eV (when Tm = 300 K), which represents the relevant reduced unit. The value of vy is generally between 0.4 and 0.8 m/s [76].
4. Simulation Analysis
The composition and evaluation system of the entire single-station chaff cloud emergency IC&T system is shown in Figure 5. Among them, the system mainly consists of chaff clouds formed by the explosion of chaff projectiles, as well as IC&T platforms and terminals. Correspondingly, the evaluation involves three major parts: the chaff cloud evaluation system, the communication evaluation system, and the TT&C evaluation system. The corresponding performance evaluation involves several performance analysis modules, including the dynamic model and deployment strategy of the chaff cloud, communication and data transmission quality, and TT&C performance. For detailed indicator analysis, we will conduct a simulation analysis separately.
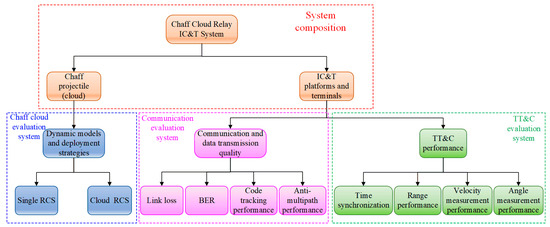
Figure 5.
Schematic diagram of the composition and evaluation system of the single-station chaff cloud emergency IC&T system.
4.1. Radar Chaff Effective RCS Simulation Analysis
According to the theoretical analysis in Section 3.1, Figure 6 presents the corresponding simulation results of the average RCS of a single radar chaff and a radar chaff cloud, where the operating frequency of the IC&T system is set between 1 GHz and 40 GHz, covering the L to Ka frequency bands. That is to say, the converted wavelength is between 0.075 m and 0.3 m.
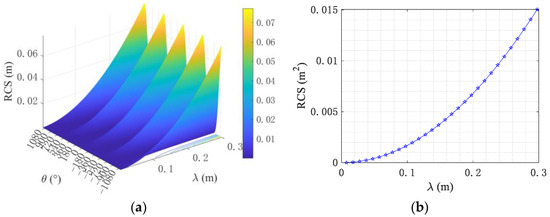
Figure 6.
Radar chaff and cloud RCS simulation results. (a) Single radar chaff RCS. (b) Average RCS of the radar chaff cloud.
Based on the simulation results in Figure 6, it can be seen that, for subgraph (a), the RCS of a single chaff is closely related to the electromagnetic wave operating frequency band f used, the electromagnetic intensity, and the angle θ between the radar chaff. The lower the frequency band, the longer the wavelength. At a specific angle, the larger the RCS, the stronger the electromagnetic scattering, which is more conducive to communication and TT&C. For subgraph (b), it can be seen that as the working wavelength λ of the electromagnetic wave increases (that is, the frequency decreases), the corresponding average RCS also gradually increases, which is more conducive to communication and TT&C.
But, the selection of IC&T frequency bands involves many factors, including signal attenuation, atmospheric absorption, rain attenuation, and the distance between terminals. The lower the frequency of the L-band, the smaller the propagation loss, the longer the coverage distance, and the stronger the diffraction ability. However, this results in crowded frequency resources, resource depletion, and limited system capacity in L-band. The S-band has the advantages of low atmospheric attenuation, small ionospheric attenuation, wavelength, propagation characteristics, bandwidth capability, component maturity, etc. However, the available bandwidth of the band is narrow, and the directivity of the ground terminal antenna is poor. The C-band and X-band have special military applications; therefore, the high-frequency band can be chosen as the IC&T business frequency band, which also has its own advantages. The high-frequency band has abundant frequency resources and a large system capacity. A high frequency corresponds to short wavelengths, enabling more information to be transmitted within the same time. For instance, the K frequency band exhibits short wavelengths, facilitating fast transmission speeds and strong anti-interference abilities. The characteristics of the Ku frequency band are similar to those of the Ka frequency band, although the rain decline is greater. However, the available bandwidth is also larger, and the effect can be weakened by appropriately increasing the antenna aperture. In addition, using high-frequency bands can also help reduce data transmission error rates and improve the quality of IC&T services. Therefore, for IC&T applications, we can choose the appropriate frequency band to carry out business according to the actual situation.
4.2. Simulation Analysis of Radar Chaff Motion Model
According to Equations (48) and (49), the number of radar chaffs is set to 30, 300, 3000, and 30,000, respectively. We simulate the initial motion state at an altitude of 5000 m and the diffusion state after 0 s, 300 s, and 600 s. Among them, the wind speed is 10 m/s, and the descent speed of the synthesized radar chaff is 0.8 m/s. The final motion trajectory of the chaff in the geographic coordinate system can be obtain as shown in Figure 7.
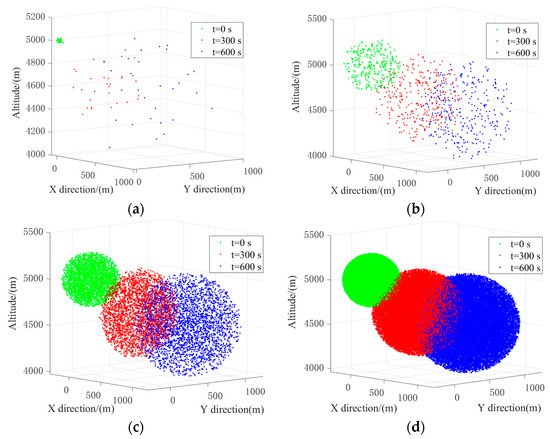
Figure 7.
Simulation of the diffusion state of a radar chaff cloud at t = 0 s, 300 s, and 600 s. (a) 30 radar chaffs. (b) 300 radar chaffs. (c) 3000 radar chaffs. (d) 30,000 radar chaffs.
Based on the simulation results in Figure 7, it can be seen that as the number of radar chaffs increases from 30 to 30,000, their distribution in the air becomes denser, which is more conducive to the development of emergency IC&T services in the system. When the diffusion time ranges from 0 s to 600 s, the radar chaff will spread around from densely populated areas to sparsely populated areas, which is consistent with the actual free diffusion situation. Figure 8 shows the corresponding statistical results of the chaff density distribution.
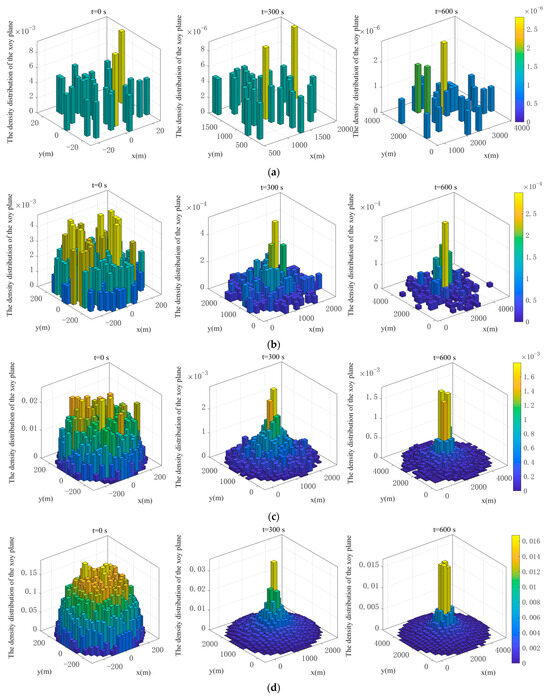
Figure 8.
The density distribution of radar chaff clouds under different number after diffusing over different time periods. (a) Number of chaffs = 30 and t = 0 s, 300 s, and 600 s. (b) Number of chaffs = 300 and t = 0 s, 300 s, and 600 s. (c) Number of chaffs = 3000 and t = 0 s, 300 s, and 600 s. (d) Number of chaffs = 30,000 and t = 0 s, 300 s, and 600 s.
From the statistical results in Figure 8, it can be seen that regardless of whether the number of radar chaffs is 30, 300, 3000, or 30,000, the density of the chaff clouds in the air gradually becomes sparser over time. The space occupied also expands, which is consistent with the results shown in Figure 7.
4.3. Simulation of Single-Station Emergency IC&T Application Based on Radar Chaff Cloud Relay
4.3.1. Simulation Analysis of Communication and Data Transmission Quality
(1) Simulation Analysis of Link Transmission Loss Based on Radar Chaff Clouds
According to the theoretical analysis in the Section 2.2.1, Figure 9 shows the simulation results of the path loss of the communication and TT&C link based on radar chaff clouds with distance variations under the conditions of Gt = Gr = 1 and different frequencies. Among them, the reference distance is 100 km, and the setting of the IC&T system’s frequency points covers the frequency band of 1~40 GHz, representing seven frequency bands including L, S, C, X, Ku, K, and Ka.
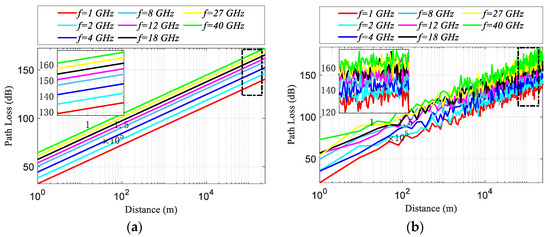
Figure 9.
Simulation results of communication and TT&C link transmission losses based on radar chaff clouds. (a) Free space path loss. (b) Lognormal shadow path loss.
Based on the simulation results in Figure 9, it can be clearly seen that for the free space path loss, as the frequency increases, the path loss also increases. This is not difficult to explain based on Equation (5). When Gt = Gr = 1 and d = 100 km, for the same path, the path loss in free space is related to the frequency band of the signal used by the TC&T system. The higher the frequency, the shorter the wavelength, and the smaller the corresponding path loss. From Figure 9a, it can be seen that when k = 100 km, the path loss in the frequency band of f = 1 GHz~40 GHz is about 130 dB~165 dB. From Figure 9b, for the logarithmic shadow loss model, there is also a law of increasing path loss with increasing frequency, which can be explained by Equation (6). At this time, the path loss is also positively correlated with the signal wavelength of the TC&T system. When k = 100 km, the path loss in the frequency range of f = 1 GHz~40 GHz is about 125~170 dB. Compared with the free space loss model, the fluctuation range is expanding. This is not difficult to explain. By introducing a path loss index n that changes with the environment, the free space path loss model can be modified. Its essence is to superimpose the random effects generated by shadows on the deterministic free space path loss model. As the surrounding environment changes with the actual position of the receiving terminal, even if the distance between the transmitter and receiving terminal are the same, each path will have different path losses, which is closer to the actual situation. Finally, it is not difficult to conclude that the selection of signal frequency points for the TC&T system also needs to be comprehensively balanced based on actual conditions, including factors such as coverage distance, system capacity, and transmission rate.
(2) Simulation of Transmission Quality Based on Radar Chaff Cloud
According to the theoretical analysis model summarized in Section 2.2.1, for the data transmission of the radar chaff cloud, it is assumed that BPSK modulation is used for modulation. Figure 10 shows the simulation results of information transmission performance under common AWGN channels, Rayleigh channels, and Rice channels. BER is used as the evaluation index here.
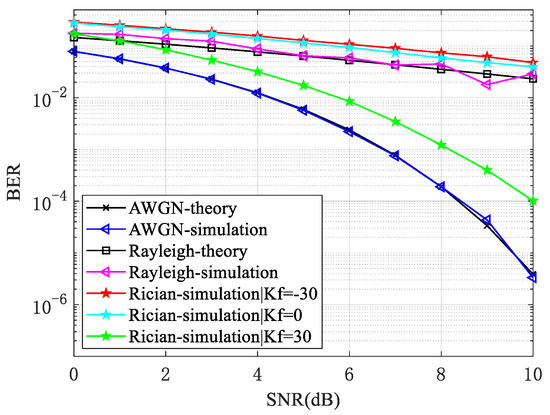
Figure 10.
Simulation results of BER of BPSK signals in AWGN, Rayleigh, and Rician channels.
From Figure 10, it can be seen that for the same SNR, the larger the variance of the channel coefficient l, the lower the BER. Under the same SNR conditions, Rayleigh fading has a higher BER than AWGN channel conditions, especially at a high SNR. Due to the randomness of channel coefficients, as a result, the SNR deteriorates, which leads to an increase in the BER. The BER of Rician fading depends on the K-factor. When K is small, it can be considered that there is no LOS signal, and the Rician fading channel evolves into a Rayleigh fading channel. Thus, the numerical simulation BER curve will approach Rayleigh. When Kf is large, it is equivalent to the signal power being concentrated on the LOS component. At this time, the BER curve is closer to the AWGN numerical simulation curve, which is consistent with the theoretical analysis conclusion. In addition, in the Rice fading channel, there may be strong direct waves. Therefore, when using BPSK modulation, the Rice factor needs to be added for improvement.
(3) Simulation Analysis of Tracking Accuracy of Link Measurement Signal
According to the theoretical analysis model summarized in Section 2.2.1, Figure 11 shows the simulation results of the code tracking root mean square error (CT-RMS) with the expected carrier-to-noise ratio (CNR), as well as the rate of change of CT error with respect to the CNR of common BPSK-modulated signals.
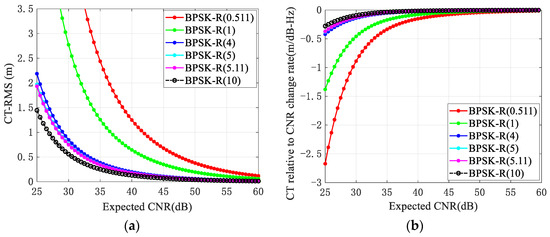
Figure 11.
Simulation results of CT-RMS with the expected CNR and the rate of change in CT error with respect to the CNR of common BPSK-modulated signals. (a) CT-RMS. (b) CT relative CNR change rate.
According to the simulation results in Figure 11, for Figure 11a, firstly, overall, the code tracking error of all the signals decreases with increases in the CNR. Secondly, as the modulation index n increases, the corresponding code-tracking performance improves. That is, the BPSK-R (10) modulation signal has the best code-tracking performance, while BPSK-R (0.511) has the worst performance. In addition, the higher the modulation index n, the lower the expected CNR required to approach the Cramér–Rao lower bound of the code tracking error. In the figure, the BPSK-R (n)-modulated signals with modulation indexes of 4, 5, 5.11, and 10 are about 45 dB, while the BPSK-R (1) and BPSK-R (0.511)-modulated signals need to be close to 60 dB. For Figure 11b, there is a similar conclusion, which will not be repeated here. Therefore, when considering the modulation signal of IC&T systems, BPSK signals with high modulation indexes n should select to improve the system’s code-tracking performance, and corresponding techniques should also be adopted to improve the CNR.
(4) Simulation analysis of anti-multipath performance of link measurement signals
According to Equations (13) and (14), Figure 12 shows the simulation results of the pseudocode multipath error envelope of common BPSK-R (n) modulation signals with varying pre-correlation bandwidths of 4 MHz, 8 MHz, 16 MHz, and 30 MHz, respectively.
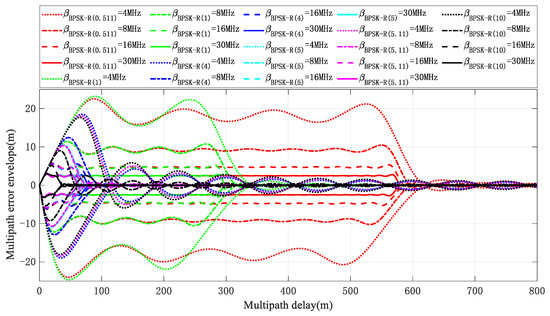
Figure 12.
Pseudo-code multipath error envelope of common BPSK (n) signals under pseudocode anti-multipath model.
From the simulation results in Figure 12, it can be seen that as the modulation index n increases, the envelope error of the corresponding BPSK-R (n) modulation signal gradually decreases, and the corresponding multipath delay also decreases. In addition, as the pre-correlation bandwidth increases, it is beneficial to reduce the multipath envelope error. This trend becomes more pronounced with the increase in modulation index n, but under certain pre-correlation bandwidth limitations, the multipath error envelope cannot be equal to 0 even when the early–late correlator spacing δ tends to 0. Specifically, the pseudocode pseudo-range measurement error caused by near multipath signals is relatively larger than that caused by far multipath signals. So, when considering the modulation signal of IC&T systems, the same emphasis should be placed on BPSK signals with high modulation indices n, and the pre correlation bandwidth should also be appropriately increased to improve the system’s anti-multipath performance.
Figure 13 shows the simulation results of the variation of carrier multipath error with multipath delay for common BPSK-R (n) modulation signals.
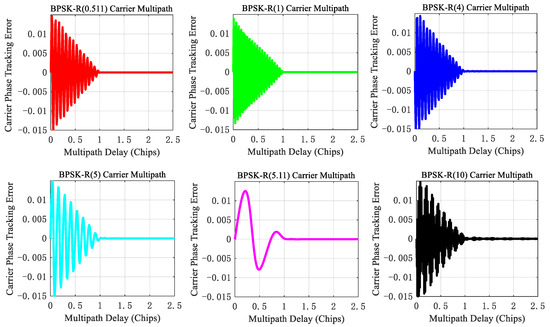
Figure 13.
Carrier multipath error envelope of common BPSK-(n) signals under carrier anti-multipath model.
From Figure 13, it can be seen that regardless of the modulation index n, when the multipath delay is greater than one chip, the multipath delay has almost no effect on the carrier multipath error, at this point, any modulation index n BPSK signal can be used. Consistent with the conclusion of the pseudocode multipath, it is not difficult to understand that the carrier-phase pseudo-range measurement error caused by near multipath signals is relatively larger than that of far multipath signals.
4.3.2. Simulation Analysis of IT&C System Performance
Based on the DWAPR&TS, DWAIDVM, and single baseline angle measurement system proposed in Section 2.2.2, the simulation validation analysis will be performed here. Among them, to simulate the real measurement environment of distance, velocity, and angle, for the measurement baseline of 100 km, considering the complexity of multipath interference and measurement noise in the actual environment, especially at small elevation angles where multipath interference is more severe, the levels of multipath and measurement noise interference on ranging are set to 300 m, 200 m, and 100 m, respectively. Consequently, the interference coefficients of multipath and noise relative to the measurement baseline of 100 km are γ = 0.003, γ = 0.002, and γ = 0.001, respectively. The errors caused by the measurement sensor are set to 10 m, 0.01 m/s, and 0.01°, respectively.
For all the simulation validation experiments, we selected two experimental scenarios for simulation verification. In the first experimental scenario, we set the drones’ velocity to 20 m/s to simulate their measurement performance under different interference intensities. The second experimental scenario is to simulate the measurement performance of drones under different velocities for a specific interference intensity. In both types of experimental scenarios, for ranging and velocity measurements, we assume that the drones move along the extension line connecting the drone and the ground emergency station. For the angle measurement, we assume that the drones are moving in the direction of the extension line at their respective velocity while also descending at a uniform velocity of 1 m/s. Furthermore, we assume that all three measurement experiments were conducted in a mild environment with a wind velocity of 0.1 m/s. The ranging, velocity measurement, and angle measurement results and errors are shown in Figure 14, Figure 15 and Figure 16, respectively. Table 3 shows the statistics corresponding to the measurement mean and STD.
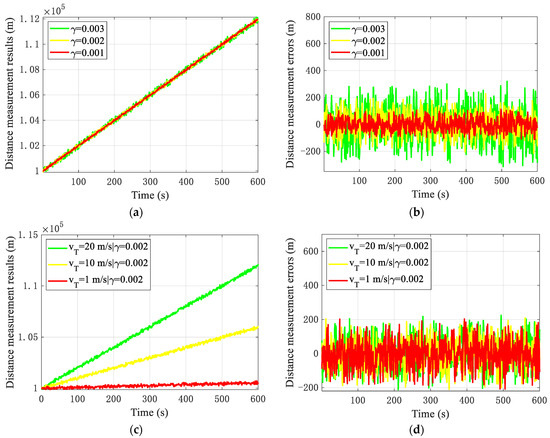
Figure 14.
Ranging simulation results. (a) v = 20 m/s, ranging results. (b) v = 20 m/s, ranging errors. (c) γ = 0.002, ranging results. (d) γ = 0.002, ranging errors.
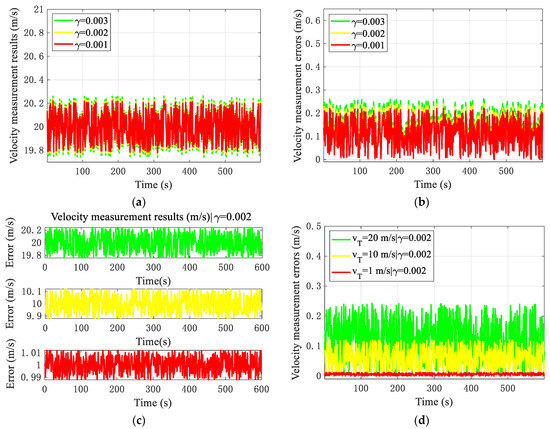
Figure 15.
Velocity measurement simulation results. (a) v = 20 m/s, velocity measurement results. (b) v = 20 m/s, velocity measurement errors. (c) γ = 0.002, velocity measurement results. (d) γ = 0.002, velocity measurement errors.
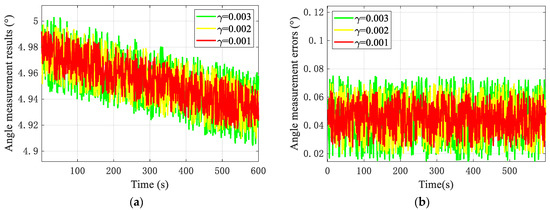
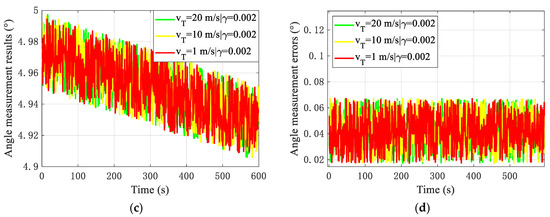
Figure 16.
Angle measurement simulation results. (a) v = 20 m/s, angle measurement results. (b) v = 20 m/s, angle measurement errors. (c) γ = 0.002, angle measurement results. (d) γ = 0.002, angle measurement error.

Table 3.
T&C system measurement performance statistics.
Based on the simulation results in Figure 14, Figure 15 and Figure 16 and Table 3, the following conclusions can be made regarding a 100 km measurement baseline:
- (1)
- About ranging, for drones at a flight velocity of 20 m/s, the ranging error fluctuates within 300 m. As the interference intensity decreases, the ranging performance gradually improves, with ranging accuracies of approximately 140 m, 90 m, and 50 m, respectively. For drones at different dynamic fly velocities of 20 m/s, 10 m/s, and 1 m/s, the ranging error fluctuates within 200 m. Under the same interference intensity, the ranging performance of drones with larger dynamics is relatively poor, but the difference is not significant, and the ranging accuracy is around 90 m. Therefore, it is not difficult to find that the main factor that has the greatest impact on the ranging performance is the interference intensity. Therefore, under the interference of large multipath and noise caused by small elevation angles, ranging errors can be improved by improving multipath interference. However, in emergency situations, the communication and TT&C business requirements are sufficient.
- (2)
- Regarding the velocity measurement, for drones at a flight velocity of 20 m/s, the velocity measurement error fluctuates within 0.25 m/s. As the interference intensity decreases, the velocity measurement performance also improves to a certain extent, and the velocity measurement accuracy is about 0.08 m/s. For drones at different dynamic fly velocities of 20 m/s, 10 m/s, and 1 m/s, under the same interference intensity, the velocity measurement error also fluctuates within 0.25 m/s. The larger the drone, the greater the error fluctuation, and the poorer the corresponding velocity measurement accuracy. This is consistent with the actual situation in terms of the speed measurement; the velocity measurement accuracy is about 0.07 m/s, 0.04 m/s, and 0.05 m/s, respectively. But high dynamics are more sensitive to the measurement of drone velocity under the same interference. The larger dynamic of the drone, the greater the velocity measurement error.
- (3)
- About angle measurement, for drones at a flight velocity of 20 m/s, the angle measurement error fluctuates within 0.08°. As the interference intensity decreases, the measurement error of the angle also improves to a certain extent, and the angle measurement accuracy is about 0.07°. For drones at different dynamic fly velocities of 20 m/s, 10 m/s, and 1 m/s, under the same interference intensity, the angle measurement error fluctuates within 0.07°, but the measurement accuracy of drones with different motion velocities does not differ significantly. Therefore, the same interference has little effect on the angle measurement of drones with different velocities, and the angle measurement accuracy is also about 0.07°.
Based on the above analysis, overall, the ranging error is relatively large, but this is related to larger multipath and noise interference, especially in low-elevation situations. However, whether in terms of velocity measurement or angle measurement performance, in emergency situations, it can meet the TT&C business requirements with certain accuracy requirements.
5. Comparative Analysis of System Performance
To visually analyze the measurement accuracy of this paper, this section selects a measurement system and algorithm that are similar to this paper for comparative analysis. In this paper, the first experimental scenario with an interference factor of γ = 0.001 and drone velocity of v = 20 m/s was selected for the comparative analysis. The following comparative references were used: Reference [10] is based on satellite systems ranging through incoherent forwarding, with a measurement baseline of 10 km. Reference [77] is based on an offshore platform and achieves dual-way ranging and direction-finding between two stations through a relay, with a measurement baseline of 100 km. Reference [78] uses GPS carrier phase measurement technology to achieve a relatively short baseline for direction-finding. Reference [79] measured the distance and direction-finding of missile misses based on single-station radar measurement data, with a baseline of 40 km. Reference [80] used the time baseline method to fuse BDS and GPS data for velocity measurements. Reference [81] is based on the principle of GPS Doppler velocity measurement, combined with broadcast ephemeris to achieve single-station velocity measurements, where the baseline interval is 600 km. Reference [82] uses a time differential carrier phase to construct a velocity measurement model and measure the instantaneous velocity of the target. Finally, reference [83] completed target velocity measurements based on the single-station BDS-3 phase and considering carrier heading constraints. Table 4 presents the comparison results of the statistical indicators between the other algorithms and this paper, where the symbol “-” indicates that the corresponding references did not provide corresponding indicators or did not carry out statistics.

Table 4.
Statistics of algorithm comparison indicators.
Based on the comparative statistical results in Table 4, it can be seen that, in terms of ranging accuracy, the DWAPR&TS system proposed in this scheme, despite the relatively large measurement interference of 100 m, has a relatively small mean error. Although the measurement accuracy of reference [10] is the highest, it is impossible to carry out measurement work in a GNSS denial environment due to the use of satellite systems for the measurements. For reference [77], due to its use of dual stations for measurement, equipment costs and business processing workload in emergency situations should also be considered. In terms of velocity measurement accuracy, the DWAIDVM system proposed in this scheme has significant advantages compared to using the time differential carrier phase to construct a velocity measurement system. Similarly, although other velocity measurement systems relying on GNSS systems have high measurement accuracies, similar velocity measurement schemes using GNSS cannot be implemented in GNSS denial environments. For angle/direction-finding accuracy, the accuracy achieved using this scheme is comparable to that of the other angle measurement methods using GNSS systems, with no significant difference, and is even better than the dual-way ranging and direction-finding system.
6. Conclusions and Prospects
This paper focuses on the TT&C denial of service issues that users may face in complex environments. The cloud formed by radar chaff explosions is used as a relay platform for IC&T, and the communication, data transmission, and measurement principles of emergency IC&T using BPSK signals are analyzed. We propose the DWAPR&TS system, DWAIDVM system, and an angle measurement system based on a single baseline for emergency TT&C in GNSS denial environments. Based on the theory of the radar chaff scattering model, a free sphere diffusion model of a chaff cloud under specific conditions and the optimal deployment plan were established. Based on the simulation analysis, the following conclusions can be made:
- (1)
- By selecting appropriate frequency bands based on actual business situations, the compatibility issue between communication and TT&C integrated business frequency bands can be effectively solved, which can allow for both communication and TT&C business.
- (2)
- By using BPSK modulation, it can adapt well to various channel models, achieve high-quality information transmission, and also have a good code-tracking performance and anti-multipath performance.
- (3)
- The established free sphere diffusion model of the chaff cloud is very close to the actual diffusion situation of the chaff cloud, and through reasonable deployment, the link transmission loss can be minimized, thereby improving the business quality of IC&T.
- (4)
- Based on the proposed ranging and time synchronization system, velocity measurement system, and angle measurement system, although emergency IC&T in a denial environment is taken as the demand background and various interference factors are considered, the final simulation results show that in emergency situations, TT&C services with certain accuracy requirements can be met.
In addition, the integrated system that combines the basic functions of communication and TT&C is very suitable for many current international applications, especially emergency response systems in denial environments. It can not only provide users with reliable information transmission but also measure distance and velocity, providing greater flexibility for the IC&T system’s communication and measurement functions, especially compared to traditional satellite TT&C, drone TT&C, and drone TT&C platforms that do not need to solve platform load problems. More importantly, due to the slow dynamic characteristics of the chaff cloud, data transmission is not greatly affected compared to others high-speed or highly mobile platforms. This system has broad application prospects in both military and civilian applications, and it has a great promoting effect on social development.
However, although the current research is primarily theoretical and holds theoretical reference significance, there still remains a significant amount of engineering work to be accomplished, particularly in breaking through key technologies. For instance, the higher K and Ka frequency bands experience substantial losses in free space propagation, are prone to absorption by the atmosphere, and are exposed to attenuation from atmospheric noise, ionospheric scintillation, rainfall attenuation, and other factors. This leads to weak signals reaching the user’s receiving terminal and very low signal-to-noise ratios, necessitating the resolution of channel transmission issues. Additionally, the overall efficiency of chaff clouds is influenced by factors such as the physical cross-section, chaff scattering velocity, motion characteristics, and scattering cross-sectional area. Due to their specific usage, limited information is available in academia, making it essential to acquire measured data on chaff cloud motion through a multitude of experiments. Finally, to achieve a longer float time, it is necessary to research the material and delivery method of the chaff to endow it with characteristics such as a large scale, good scalability, high reliability, and low delay, and to better achieve emergency IC&T services.
Author Contributions
L.Y. and Y.Y. (Yikang Yang) conceived the conceptualization and algorithm, L.Y. completed the algorithm implementation and validation of the methodology, the writing of the paper, and supported the writing—review and editing process. Y.Y. (Yikang Yang) and S.C. acquired the provided funding. B.C., D.P. and F.Y. completed some investigations and formal analysis. F.Y. reviewed and provided suggestions for the revision of the paper. Y.Y. (Yangdong Yan) and F.S. provided project administration. All authors have read and agreed to the published version of the manuscript.
Funding
This project was supported by the China Project Management Center (Grant Nos. 80903010202), Science and Technology on Electromechanical Dynamic Control Laboratory fund (Grant Nos. 9140A17060115BQ42242, 6142601190210).
Institutional Review Board Statement
Not applicable.
Informed Consent Statement
Not applicable.
Data Availability Statement
The original contributions presented in the study are included in the article, further inquiries can be directed to the corresponding author.
Conflicts of Interest
The authors declare no conflicts of interest.
References
- Croke, L. On the Frontlines: Responding to Natural Disasters. AORN J. 2022, 116, P8–P13. [Google Scholar] [CrossRef] [PubMed]
- Wang, Y.; Wang, H.; Cui, P.; Chen, D.; Tang, J.; Ou, T.; Hao, J.; Wang, J.; Zhang, G.; Lei, Y.; et al. Disaster effects of climate change and the associated scientific challenges. Chin. Sci. Bull. 2024, 69, 286–300. [Google Scholar] [CrossRef]
- El Khaled, Z.; Mcheick, H. Case studies of communications systems during harsh environments: A review of approaches, weaknesses, and limitations to improve quality of service. Int. J. Distrib. Sens. Netw. 2019, 15, 1550147719829960. [Google Scholar] [CrossRef]
- Yinyin, G.E.; Lili, D.U.; Hongxing, Y.E. Co-optimization approach to post-storm recovery for interdependent power and transportation systems. J. Mod. Power Syst. Clean Energy 2019, 7, 688–695. [Google Scholar]
- Xing, W. Integrated TT & C technology, the future of commercial space TT & C. Satell. Netw. 2020, 8, 42–47. [Google Scholar]
- The Editors of Encyclopaedia Britannica. “V-2 rocket”. Encyclopedia Britannica. 4 February 2024. Available online: https://www.britannica.com/technology/V-2-rocket (accessed on 14 February 2024).
- Goossen, A.; Benjamin, W. The Year of the Earth (1957–1958): Cold War Science and the Making of Planetary Consciousness; Harvard University: Cambridge, MA, USA, 2021. [Google Scholar]
- Barklay, C.; Hoffman, R.; Pohl, G.; Williams, B. A Novel Design Approach for Post-Reentry Impact Survivability of Radioisotope Thermoelectric Generator Fuel. In Proceedings of the IEEE Aerospace Conference, Big Sky, MT, USA, 4–11 March 2023; pp. 1–6. [Google Scholar]
- Beidou Satellite Navigation System. “Transit”—The World’s First Satellite Navigation System. Available online: http://www.beidou.gov.cn/zy/kpyd/201710/t20171011_4706.html (accessed on 6 May 2024).
- Wang, J. Key Technology Research on Integration of Communication and Measurement Control; Information and Communication Engineering Beijing Institute of Technology: Beijing, China, 2018. [Google Scholar]
- Wu, W.; Li, H.; Li, Z.; Wang, G.; Tang, Y. Status and prospect of China’s deep space TT&C network. Sci. Sin. Inf. 2020, 50, 87–108. [Google Scholar]
- Cheng, L.; Chen, J.; Liu, Y.; Zhu, Q. Variable Projection Algorithm for GPS Positioning in Multipath Environments Based on Aitken Acceleration Method. IEEE Trans. Ind. Inform. 2024, 20, 6404–6412. [Google Scholar] [CrossRef]
- Gaglione, D.; Braca, P.; Soldi, G.; Meyer, F.; Hlawatsch, F.; Win, M. Fusion of Sensor Measurements and Target-Provided Information in Multitarget Tracking. IEEE Trans. Signal Process. 2022, 70, 322–336. [Google Scholar] [CrossRef]
- Yang, Y.; Khalife, J.; Morales, J.; Kassas, Z. UAV Waypoint Opportunistic Navigation in GNSS-Denied Environments. IEEE Trans. Aerosp. Electron. Syst. 2022, 58, 663–678. [Google Scholar] [CrossRef]
- Deng, C.; Wang, S.; Wang, J.; Xu, Y.; Chen, Z. LiDAR Depth Cluster Active Detection and Localization for a UAV with Partial Information Loss in GNSS. Unmanned Syst. 2024, 1–13. [Google Scholar] [CrossRef]
- Ruan, L.; Li, G.; Dai, W.; Tian, S.; Fan, G.; Wang, J.; Dai, X. Cooperative Relative Localization for UAV Swarm in GNSS-Denied Environment: A Coalition Formation Game Approach. IEEE Internet Things J. 2022, 9, 11560–11577. [Google Scholar] [CrossRef]
- Xu, Y.; Chen, Z.; Wang, S.; Wang, J. An Active Landing Recovery Method for Quadrotor UAV: Localization, Tracking and Buffering Landing. In Proceedings of the 22nd World Congress of the International Federation of Automatic Control (IFAC), Yokohama, Japan, 9 July–14 July 2023; Volume 56, pp. 3366–3372. [Google Scholar]
- Ye, L.; Yang, Y.; Ma, J.; Deng, L.; Li, H. A Distributed Formation Joint Network Navigation and Positioning Algorithm. Mathematics 2022, 10, 1627. [Google Scholar] [CrossRef]
- Ye, L.; Yang, Y.; Jing, X.; Li, H.; Yang, H.; Xia, Y. Dual-Satellite Alternate Switching Ranging/INS Integrated Navigation Algorithm for Broadband LEO Constellation Independent of Altimeter and Continuous Observation. Remote Sens. 2021, 13, 3312. [Google Scholar] [CrossRef]
- Ye, L.; Yang, Y.; Jing, X.; Li, H.; Yang, H.; Xia, Y. Altimeter + INS/Giant LEO Constellation Dual-Satellite Integrated Navigation and Positioning Algorithm Based on Similar Ellipsoid Model and UKF. Remote Sens. 2021, 13, 4099. [Google Scholar] [CrossRef]
- Li, Y.; Shi, X.; Wang, X.; Lu, Y.; Cheng, P.; Zhou, F. Intelligent Detection Method for Satellite TT&C Signals under Restricted Conditions Based on TATR. Remote Sens. 2024, 16, 1008. [Google Scholar] [CrossRef]
- Ye, L.; Yang, Y.; Jing, X.; Ma, J.; Deng, L.; Li, H. Single-Satellite Integrated Navigation Algorithm Based on Broadband LEO Constellation Communication Links. Remote Sens. 2021, 13, 703. [Google Scholar] [CrossRef]
- Sulimov, A.; Karpov, A.; Lapshina, I.; Khuzyashev, R. Analysis and Simulation of Channel Nonreciprocity in Meteor-Burst Communications. IEEE Trans. Antennas Propag. 2017, 65, 2009–2019. [Google Scholar] [CrossRef]
- Sables, T. The Historic Lasting Power of Military Balloons. I Forces|Net. 10 February 2023. Available online: https://www.forces.net/heritage/history/historic-lasting-power-military-balloons (accessed on 4 May 2024).
- Zheng, T.; Wang, M.; Ouyang, Z.; Xiang, S.; Tang, B. Mission and Application of Military Balloons. Int. Aviat. 2023, 7, 21–26. [Google Scholar]
- Pei, L.; Zhou, W.; Liu, J. Research on arrangement method of motorized chaff screen based on cuckoo bird search algorithm. Syst. Eng. Electron. 2024, 46, 814–823. [Google Scholar]
- Tang, B.; Guo, K.Y.; Wang, J.P.; Sheng, X.; Zhou, X. The Correlation Characteristics of Channel Matrix of Chaff-Supported MIMO System. IEEE Antennas Wirel. Propag. Lett. 2014, 13, 509–1512. [Google Scholar] [CrossRef]
- Liu, J. Spacecraft TT&C and Information Transmission Theory and Technologies; Springer: Berlin/Heidelberg, Germany, 2016; ISBN 978-3-662-51306-4. [Google Scholar]
- Zhang, S.-H.; Zhang, M.; Li, J.-X.; Jiang, W.-Q.; Wei, P.-B. Investigation of the Shielding and Attenuation Effects of a Dynamical High-Density Chaff Cloud on the Signal Based on Voxel Splitting. Remote Sens. 2022, 14, 2415. [Google Scholar] [CrossRef]
- Marcucci, A.; Di Stefano, A.; Giorgio, P. Ranging performance evaluation on secure tracking, telemetry and command system. In Proceedings of the 2016 International Workshop on Tracking, Telemetry and Command Systems for Space Applications (TTC), Noordwijk, The Netherlands, 12–16 September 2016; pp. 1–5. [Google Scholar]
- Li, C.; Jiao, Y.; Fu, S.; Wu, T. Software defined TT&C system architecture and key technology. Chin. Space Sci. Technol. 2023, 43, 14–24. [Google Scholar]
- Zhu, C.; Li, X.; Shi, L.; Liu, Y.; Yao, B. Influence of Time-Varying Plasma Sheath on the Lock Condition of Phase-Locked Loop for TT&C Carrier Tracking System. IEEE Trans. Plasma Sci. 2017, 45, 636–643. [Google Scholar]
- Raghavan, S.H.; Ardeshiri, M.M. Measurement Sensitivity of Modulation Indices in Telemetry, Tracking and Command Systems. In Proceedings of the 2019 IEEE Aerospace Conference, Big Sky, MT, USA, 2–9 March 2019; pp. 1–6. [Google Scholar] [CrossRef]
- Xue, L.; Li, X.; Wu, W.; Yang, Y. Design of Tracking, Telemetry, Command (TT&C) and Data Transmission Integrated Signal in TDD Mode. Remote Sens. 2020, 12, 3340. [Google Scholar] [CrossRef]
- Ye, L.; Gao, N.; Yang, Y.; Li, X. A High-Precision and Low-Cost Broadband LEO 3-Satellite Alternate Switching Ranging/INS Integrated Navigation and Positioning Algorithm. Drones 2022, 6, 241. [Google Scholar] [CrossRef]
- Laquerbe, V.; Fragnier, R. Metallic S-Band Antenna for Satellite TT&C Links. IEEE Antennas Wirel. Propag. Lett. 2022, 21, 715–719. [Google Scholar]
- Ye, L.; Gao, N.; Yang, Y.; Deng, L.; Li, H. Three Satellites Dynamic Switching Range Integrated Navigation and Positioning Algorithm with Clock Bias Cancellation and Altimeter Assistance. Aerospace 2023, 10, 411. [Google Scholar] [CrossRef]
- Modenini, A.; Ripani, B. A Tutorial on the Tracking, Telemetry, and Command (TT&C) for Space Missions. IEEE Commun. Surv. Tutor. 2023, 25, 1510–1542. [Google Scholar]
- Liu, G.; Guo, J.; Xin, W.; Cheng, C.; Wang, L. The Channel Fading Influence of the Receiver Operating Characteristics of the TT&C Receiver Based on the Dual-Sequence Frequency Hopping. Int. J. Aerosp. Eng. 2024, 2024, 1850204. [Google Scholar] [CrossRef]
- Li, L.; Qinzhuan, Z. Analysis of the Trend of Development of Spacecraft TT&C and Communication Technologies and Suggestions. J. Spacecr. TTC Technol. 2014, 33, 463–468. [Google Scholar]
- Xuedong, Z. Research of Telemetry Relay System Based on Medium-high Altitude Unmanned Aerial Vehicle. Comput. Meas. Control. 2019, 27, 67–70+86. [Google Scholar]
- Chen, L.; Li, H.; Fan, F.; Man, H.; Kong, J.; Han, Q.; Han, S.; Lu, W.; Wang, M.; Ping, J. Method and Application of High-Precision Open-Loop Velocity Measurement of Tianwen-1 Probe. Space Sci. Technol. 2024, 4, 0105. [Google Scholar] [CrossRef]
- Majumder, S.P.; Jumana, M.A. Performance analysis of a space-frequency block coded OFDM wireless communication system with MSK and GMSK modulation. In Proceedings of the 2014 International Conference on Electrical Engineering and Information & Communication Technology, Dhaka, Bangladesh, 21 March 2014; pp. 1–5. [Google Scholar] [CrossRef]
- Hu, L.; Wang, F.; Lu, J. Low PAPR Filter Bank Single Carrier for 5G mMTC. IEEE Internet Things J. 2019, 6, 6887–6895. [Google Scholar] [CrossRef]
- Sum, C.; Funada, R.; Wang, J.; Baykas, T.; Rahman, M.; Harada, H. Error performance and throughput evaluation of a multi-Gbps millimeter-wave WPAN system in the presence of adjacent and co-channel interference. IEEE J. Sel. Areas Commun. 2009, 27, 1433–1442. [Google Scholar]
- Finocchiaro, S.; Ardito, A.; Barbaglio, F.; Baldi, M.; Chiaraluce, F.; Maturo, N.; Ricciutelli, G.; Simone, L.; Abello, R.; Buendia, J.; et al. Improving deep space telecommunications during solar superior conjunctions. In Proceedings of the 2017 IEEE Aerospace Conference, Big Sky, MT, USA, 4–11 March 2017; pp. 1–13. [Google Scholar] [CrossRef]
- Simone, L.; Gelfiisa, D.; Cocchi, S.; Comparini, M.; Fiore, D.; Piloni, V.; Rapposelli, A.; Capannolo, M. A novel digital platform for deep space transponders: The transmitter side. In Proceedings of the 2004 IEEE Aerospace Conference Proceedings, Big Sky, MT, USA, 6–13 March 2004; Volume 3, pp. 1446–1452. [Google Scholar] [CrossRef]
- Jiang, Y.; Wang, Y.W.; Zhang, H. The Research on Signal Modulation Mode Recognition Based on BP Neural Network. In Proceedings of the 2022 IEEE 6th Information Technology and Mechatronics Engineering Conference (ITOEC), Chongqing, China, 18–19 October 2022; pp. 1813–1817. [Google Scholar] [CrossRef]
- Pereira de Lucena, A.M.; Sombra da Silva, A.; Dutra Viot, D.; Ambrosio, A.M. Design of a Fully Digital BPSK Demodulator Integrated into a TT&C Satellite Transponder. IEEE Lat. Am. Trans. 2020, 18, 1511–1520. [Google Scholar]
- Zhao, N.; Chang, Q.; Wang, H.; Zhang, Z. An Unbalanced QPSK-Based Integrated Communication-Ranging System for Distributed Spacecraft Networking. Sensors 2020, 20, 5803. [Google Scholar] [CrossRef] [PubMed]
- Yang, Y.; Zhao, Y.; Chen, Z.; Deng, X.; Wei, L. A Novel Channel Amplitude and Phase Correction Algorithm Based on Phased Array Space-based TT&C Communication. J. Phys. Conf. Ser. 2020, 1626, 012026. [Google Scholar] [CrossRef]
- Nguyen, H.; Grant, S.; Nguyen, T.; Chew, H. The Aerospace Emission Bandwidth Toolbox (AEBT). In Proceedings of the 2021 IEEE Aerospace Conference (50100), Big Sky, MT, USA, 6–13 March 2021; pp. 1–8. [Google Scholar] [CrossRef]
- Xie, G. Principle of GNSS: GPA, GLONASS, and Galileo; Publishing House of Electronics Industry: Beijing, China, 2013; ISBN 978-7-121-36044-2. [Google Scholar]
- Lvyang, Y.E. Simulation Generate and Performance Analyse on BDS-3 B1C Signal; University of Chinese Academy of Sciences: Beijing, China, 2019. [Google Scholar]
- Yates, D.C.; Holmes, A.S.; Burdett, A.J. Optimal transmission frequency for ultralow-power short-range radio links. IEEE Trans. Circuits Syst. I Regul. Pap. 2004, 51, 1405–1413. [Google Scholar] [CrossRef]
- Büyükçorak, S.; Vural, M.; Kurt, G.K. Lognormal Mixture Shadowing. IEEE Trans. Veh. Technol. 2015, 64, 4386–4398. [Google Scholar] [CrossRef]
- Sorrentino, A.; Cappa, S.; Gifuni, A.; Ferrara, G.; Migliaccio, M. The rice K-factor distribution within a mode-stirred reverberating chamber. In Proceedings of the 2017 International Symposium on Electromagnetic Compatibility—EMC EUROPE, Angers, France, 4–7 September 2017; pp. 1–5. [Google Scholar] [CrossRef]
- Tepedelenlioglu, C.; Abdi, A.; Giannakis, G.B. The Ricean K factor: Estimation and performance analysis. IEEE Trans. Wirel. Commun. 2003, 2, 799–810. [Google Scholar] [CrossRef]
- Betz, J.W.; Kolodziejski, K.R. Generalized Theory of Code Tracking with an Early-Late Discriminator Part I: Lower Bound and Coherent Processing. IEEE Trans. Aerosp. Electron. Syst. 2009, 45, 1538–1556. [Google Scholar] [CrossRef]
- Betz, J.W.; Kolodziejski, K.R. Generalized Theory of Code Tracking with an Early-Late Discriminator Part II: Noncoherent Processing and Numerical Results. IEEE Trans. Aerosp. Electron. Syst. 2009, 45, 1557–1564. [Google Scholar] [CrossRef]
- Qu, B.; Wei, J.; Tang, Z.; Yan, T.; Zhou, Z. Analysis of Combined Effects of Multipath and CW Interference on Coherent Delay Lock Loop. Wirel. Pers Commun. 2014, 77, 2213–2233. [Google Scholar] [CrossRef]
- Kalyanaraman, S.K.; Braasch, M.S.; Kelly, J.M. Code tracking architecture influence on GPS carrier multipath. IEEE Trans. Aerosp. Electron. Syst. 2006, 42, 548–561. [Google Scholar] [CrossRef]
- Kim, J.; Tapley, B.D. Simulation of Dual One-Way Ranging Measurements. J. Spacecr. Rocket. 2003, 40, 419–425. [Google Scholar] [CrossRef]
- Ye, L.; Yang, Y.; Ma, J.; Deng, L.; Li, H. Research on an LEO Constellation Multi-Aircraft Collaborative Navigation Algorithm Based on a Dual-Way Asynchronous Precision Communication-Time Service Measurement System (DWAPC-TSM). Sensors 2022, 22, 3213. [Google Scholar] [CrossRef] [PubMed]
- Li, X.; Liu, L.; Yang, Y. Intra-satellite baseline measurment via asynchronous communication link of autonomous formation flyer. J. Astronaut. 2008, 4, 1369–1396. [Google Scholar]
- Kaplan, E.D.; Hegarty, C.J. Understanding GPS: Principles and Applications, 2nd ed.; Artech House Publishers: Boston, MA, USA, 2005. [Google Scholar]
- Bao-Yen, T.J. Fundamentals of Global Positioning System Receivers: A Software Approach, 7th ed.; John Wiley & Sons Incorporation: New Jersey, NJ, USA, 2005. [Google Scholar]
- Li, X.; Zhang, Q.; Xi, Q.; Zhong, X.; Zhong, X.; Xiong, Z. Inter-satellite Baseline Measurement Technology via Asynchronous Communication Link. J. Electron. Inf. Technol. 2008, 30, 1525–1529. [Google Scholar] [CrossRef]
- Zhang, K.; Hao, J.; Zhang, Y.; Li, Q.; Yang, T. BDS and GPS Ultra-Short Baseline Measurement Performance Comparison and Analysis. In Proceedings of the China Satellite Navigation Conference, Xi’an, China, 13–15 May 2015. [Google Scholar] [CrossRef]
- Marcus, S.W. Electromagnetic Wave Propagation Through Chaff Clouds. IEEE Trans. Antennas Propag. 2007, 55, 2032–2042. [Google Scholar] [CrossRef]
- Seo, D.W.; Nam, H.-J.; Kwon, O.-J.; Myung, N.H. Dynamic RCS Estimation of Chaff Clouds. IEEE Trans. Aerosp. Electron. Syst. 2012, 48, 2114–2127. [Google Scholar] [CrossRef]
- Kim, J.S.; Seo, D.W. Employing Vector Radiative Transfer to Estimate RCS of Chaff Cloud in Real-Time. In Proceedings of the 2023 IEEE Region 10 Symposium (TENSYMP), Canberra, Australia, 6–8 September 2023; pp. 1–4. [Google Scholar] [CrossRef]
- Jing, C. Principles of Radar Chaff Jamming; National Defense Industry Press: Beijing, China, 2007. [Google Scholar]
- Xiangping, L. Principles of Electronic Countermeasures; National Defense Industry Press: Beijing, China, 1982; Volume 2. [Google Scholar]
- He, L. Aerial Movement of Chaff Cloud and Electromagnetic Scattering’s Modeling and Simulation; Xidian University: Shaanxi, China, 2018. [Google Scholar]
- Guo-Chao, H.; Shu, L. Research into The Simulation and Modeling of Ship Chaff Jamming Process. Shipboard Electron. Countermeas. 2017, 4, 69–77. [Google Scholar]
- Panpan, L.; Su, G.; Wang, X.; Fu, L. Error analysis of ranging and direction finding between ocean mobile platforms. RADAR ECM 2023, 43, 24–36. [Google Scholar]
- Cui, J.; Yang, L.; Ren, K.; Zhang, H. GPS-based orientation determination of short baseline and its precision analysis. J. Geomat. 2008, 33, 12–14. [Google Scholar]
- Hu, Y.; Liu, B.; Qi, X.; Xu, R.; Liu, T. Research on Calculation Method of Missile Miss Distance Based on Single Station Radar Measurement Data. In Proceedings of the 2022 IEEE 6th Advanced Information Technology, Electronic and Automation Control Conference (IAEAC), Beijing, China, 3–5 October 2022; pp. 1896–1903. [Google Scholar] [CrossRef]
- Wang, X.; Zhen, J.; Wang, Z.; Sheng, Y.; Ji, S.; Chen, W. Single Station Velocity Estimation: GPS vs. BDS. J. Navig. Position. 2015, 3, 39–55. [Google Scholar]
- Li, L.; He, K.; Wang, Z.; Zhao, Q. Error Comparison and Accuracy Analysis between Stand-Alone and Relative Velocity Determination Using GPS. J. Geod. Geodyn. 2019, 39, 1063–1069. [Google Scholar]
- Laihong, Z. Research on Stand-Alone Real-Time GNSS Dynamic Instantaneous Velocimetry Technology; China University of Mining and Technology: Beijing, China, 2021. [Google Scholar]
- Wang, Q.; Hu, C.; Wang, Z. Single station velocity determination of BDS-3 carrier phase observations with the constraints of heading angle. Acta Geod. Cartogr. Sin. 2023, 52, 871–883. [Google Scholar]
Disclaimer/Publisher’s Note: The statements, opinions and data contained in all publications are solely those of the individual author(s) and contributor(s) and not of MDPI and/or the editor(s). MDPI and/or the editor(s) disclaim responsibility for any injury to people or property resulting from any ideas, methods, instructions or products referred to in the content. |
© 2024 by the authors. Licensee MDPI, Basel, Switzerland. This article is an open access article distributed under the terms and conditions of the Creative Commons Attribution (CC BY) license (https://creativecommons.org/licenses/by/4.0/).