1. Introduction
In recent years, with the rapid advancement of unmanned aerial vehicles (UAVs) technology and the increasing maturity of wireless communication technology, UAVs have demonstrated extensive potential applications in aerial photography, logistics distribution, search and rescue. Some researchers have conducted detailed studies in areas such as spectrum for air-to-ground (A2G) communication and wireless communication environments [
1,
2]. However, existing UAVs communications still inevitably be limited by factors such as controller or WIFI connection modes, resulting in restricted communication range, low data transmission rates and susceptibility to interference. The cellular network is a widely distributed mobile communication network with high capacity. Integrating UAVs into the cellular network can enhance communication distance, achieve higher data transmission rate and lower latency, as well as supplement positioning accuracy in adverse weather conditions or when obstacles affect GPS signals, thereby mitigating environmental impacts on communications. Consequently, cellular-connected UAVs communication emerges as a promising research area [
3].
Despite the aforementioned advantages of cellular-connected UAVs communication, there are still several challenges that need to be addressed. Firstly, in order to cater to a larger number of ground users, the antenna orientation of the ground base station (GBS) is typically optimized for ground coverage, which may result in inadequate air communication coverage [
4]. Secondly, three-dimensional (3D) obstacles such as buildings may obstruct the communication link [
5]. Additionally, building upon prior research on the A2G channel model [
6,
7,
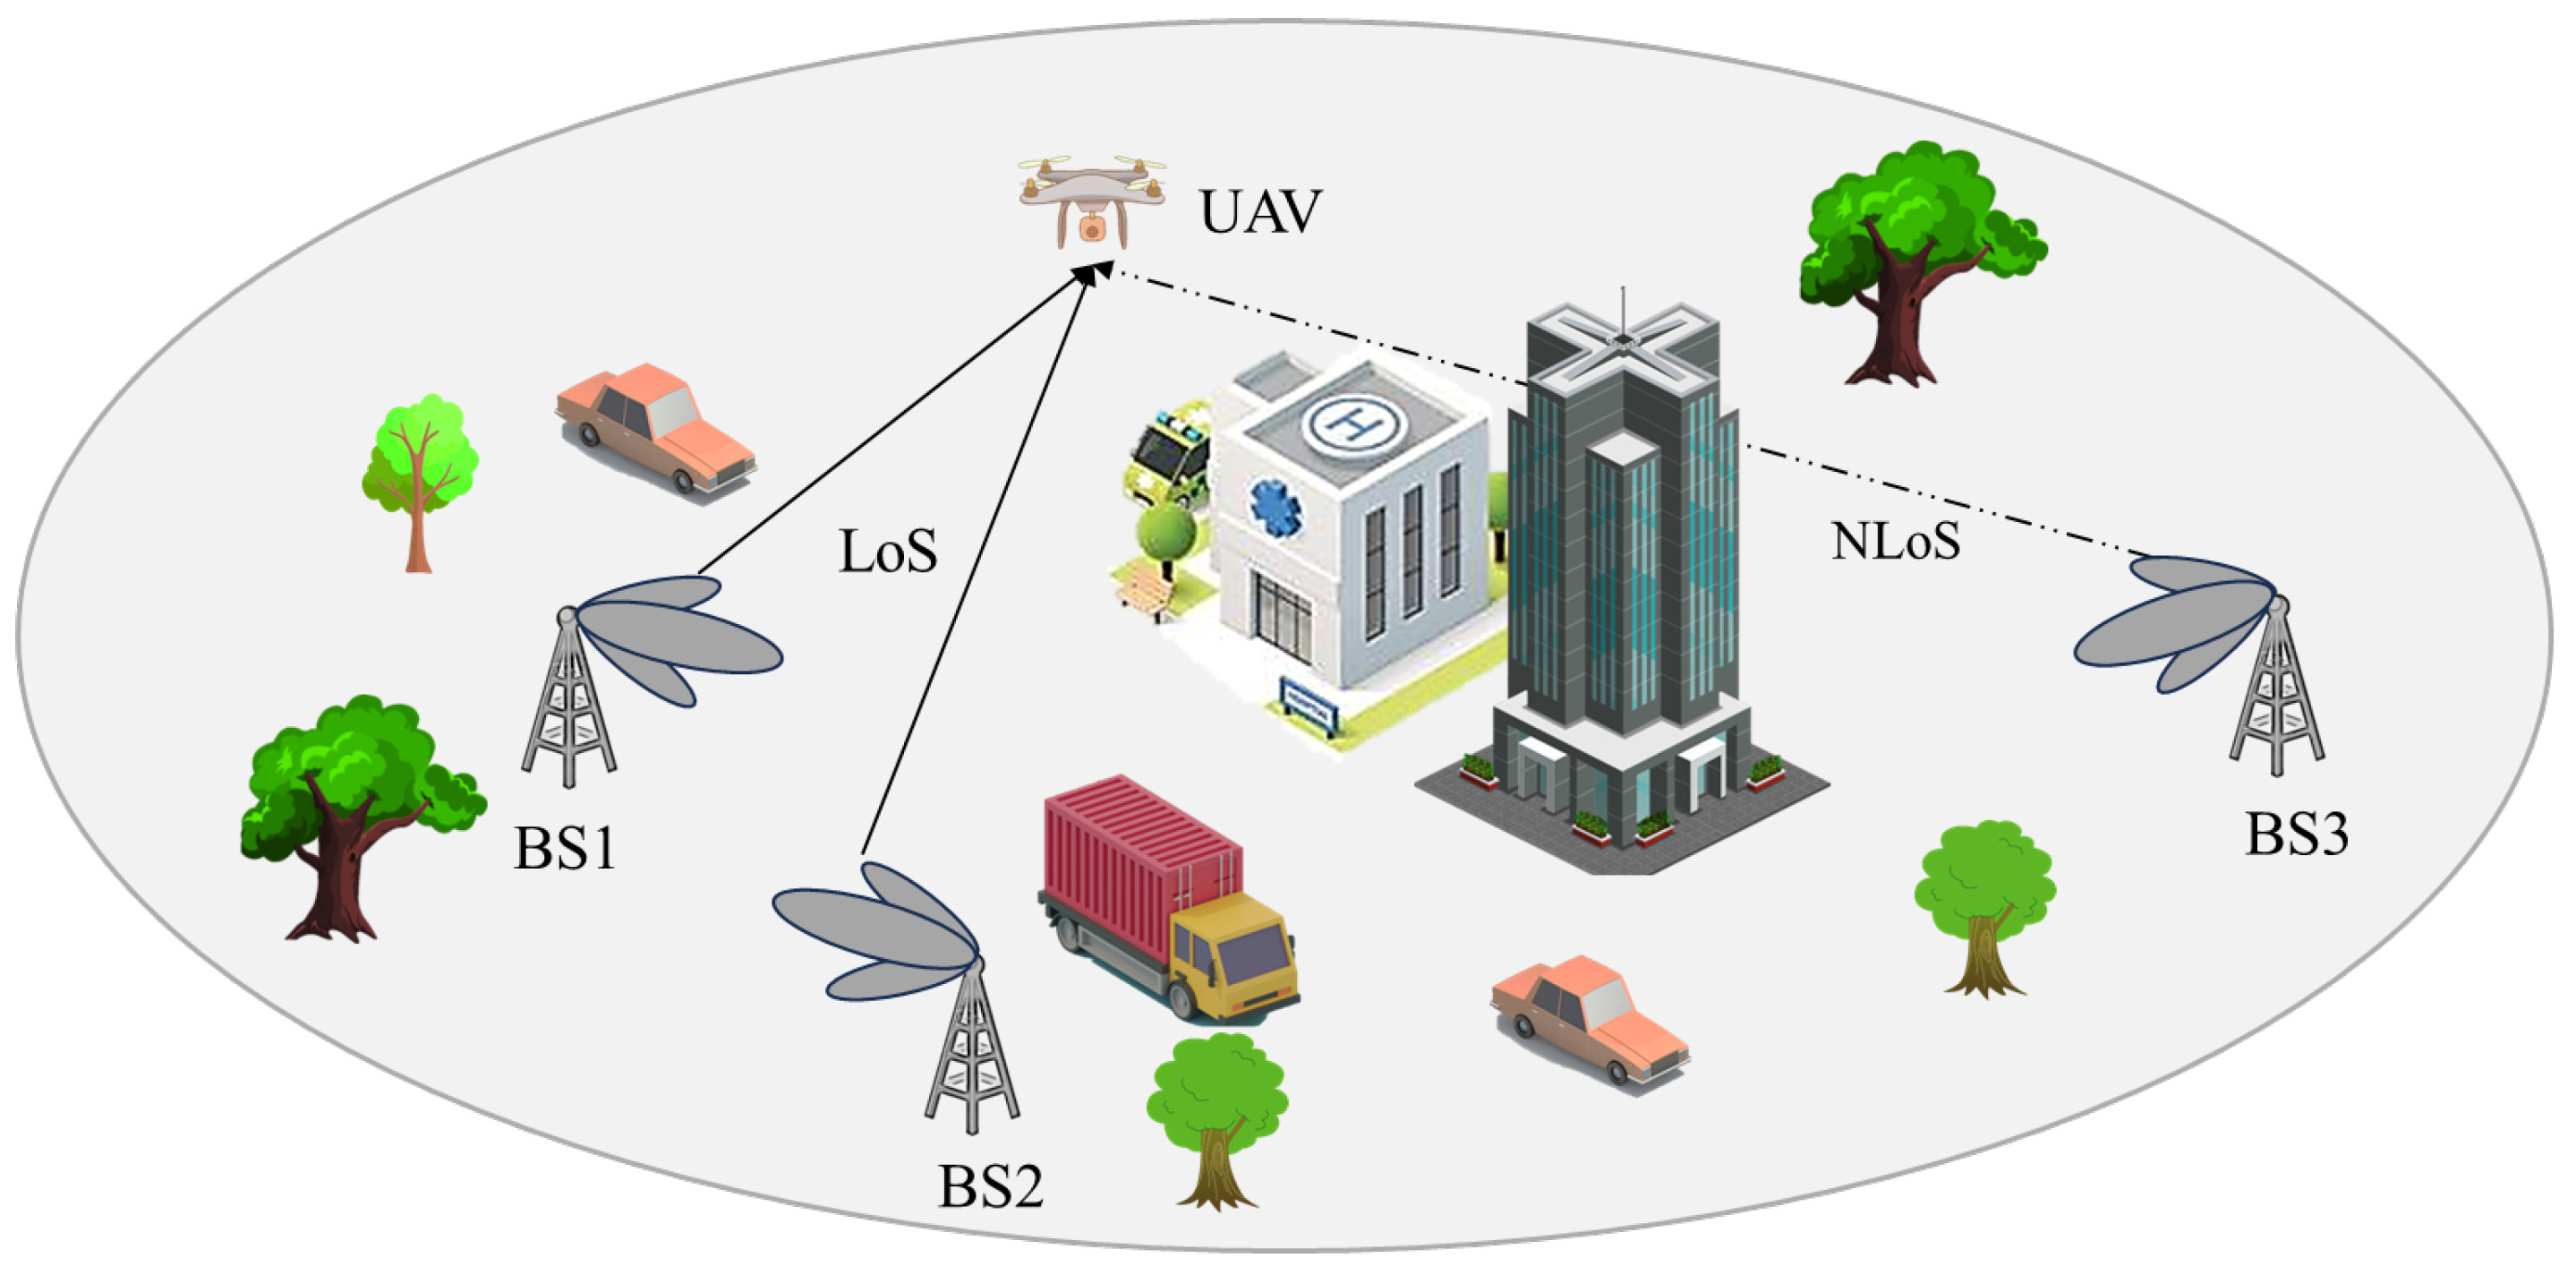
8], cellular-connected UAVs may encounter significant signal interference due to potential line-of-sight channel issues between the UAVs and non-associated base station (BS), as shown in
Figure 1.
To address the aforementioned issues, the authors in [
9] combined with the analysis of uplink/downlink 3D coverage performance, introduced the generalized Poisson multinomial distribution to simulate interference information and demonstrated the impact of different downdip angles of GBS antennas on 3D coverage. Additionally, Ref. [
10] employed deep reinforcement learning to train aerial BS layout decision strategies, thereby enhancing coverage in complex environments. Ref. [
11] investigated the performance of cellular connected UAVs under actual antenna configurations and revealed how the number of antenna units influences coverage probability and handover rate. Ref. [
12] optimized the downdip angle of GBS antennas to maximize received signal quality for UAVs while ensuring throughput performance for ground users and reducing switching times. To mitigate strong ground-to-air interference, various anti-interference techniques were proposed [
13,
14,
15,
16]. For instance, Ref. [
13] presented a novel cooperative interference elimination strategy for multi-beam UAVs uplink communication that aims to eliminate co-channel interference on each occupied GBS while maximizing the summation rate of available GBS.
Efficient path planning should ensures optimal air-ground communication conditions, high data transmission rates, and reliable connectivity while minimizing unnecessary movements of UAVs, thereby enhancing energy efficiency [
17,
18]. In [
19], the problem of shortest path planning under the constraint of minimum reception SNR was investigated. In [
20,
21], the authors employed graph theory to design the shortest path under the minimum SINR constraint and deduced an optimal UAV path by solving an equivalent shortest path problem in graph theory. Ref. [
22] proposed the constraction of a received signal intensity map using a distributed recursive Gaussian process regression framework. This approach achieves higher positioning accuracy with lower complexity and storage requirements, making it an efficient solution for positioning applications. Similar problems have been addressed in [
23,
24,
25]. Some traditional trajectory optimization schemes simplified channel models in various environments for ease of solution. However, environmental models such as those assuming path loss of channels or isotropic radiation of antennas are not applicable to real-world scenarios [
26]. Moreover, the trajectory optimization problem is non-convex, and its complexity increases dramatically with the number of optimization variables, which is difficult to solve effectively. Fortunately, machine learning techniques have emerged as another solution for non-convex optimization problems. For instance, Ref. [
27] presents a two-dimensional (2D) radio map-based approach for path planning in conjunction with machine learning techniques. Nevertheless, 2D path planning has limitations regarding its applicability and susceptibility to local optima; thus further research should focus on 3D path planning.
Some recent studies, such as [
28], have proposed a Multi-Layer Trajectory Planning (MTTP) method, addressing the challenges of ensuring air-to-ground communication services and avoiding collisions in complex urban environments. The work referenced in [
29] introduces a two-step centralized development system for 3D path planning of drone swarms. Additionally, Both articles [
30,
31] take into account energy consumption during the 3D trajectory planning process for UAVs. Ref. [
32] proposed collaborative UAV trajectory optimization using federated learning to overcome challenges in ensuring reliable connectivity in 3D space. In this paper, we propose a novel synchronous path planning approach based on an improved deep reinforcement learning (DRL) algorithm, integrated with radio mapping techniques, to optimize the 3D trajectory of UAV. This method aims to efficiently navigate UAVs by avoiding areas with weak communication coverage and reaching the destination in minimal time. The major contributions and novelties of this paper are summarized as follows:
We propose a 3D path optimization strategy that aims to minimize the weighted sum of task completion time and communication interruption time, thereby enhancing the efficiency and reliability of the system.
We employ a multi-step dueling double deep Q network (D3QN) method incorporating with prioritized experience reply (PER) mechanism to efficiently optimize the proposed objective function and acquire the optimal path.
We propose a simultaneous navigation and radio mapping (SNARM) framework that leverages 3D radio mapping and simulates flight processes to optimize the cost-effectiveness of real flights while enhancing learning accuracy.
The remainder of the article is organized as follows.
Section 2 introduces the system model and problem formulation.
Section 3 presents the improved DRL-based 3D path planning strategy. The simulation results and analysis are provided in
Section 4. The conclusions are drawn in
Section 5.
2. System Model and Problem Formulation
2.1. 3D Flight Environment Model
In this paper, the UAV operates in the airspace above a dense urban area measuring 2 km × 2 km. The height and locations of urban buildings are generated using the statistical model recommended by the International Telecommunication Union (ITU). This model involves three parameters:
, which represents the ratio of land area covered by buildings to the total land area;
, which denotes the average number of buildings per unit area; and
, a variable determining the distribution of building heights following a Rayleigh distribution, with a mean value of
(
).
Figure 2 shows the 2D views of one particular realization of the building locations and heights with
,
, and
. For convenience, the building height is clipped to not exceed 70 m.
The UAV’s flight parameters include a flying height ranging from to , a constant flight speed of V m/s, and the UAV’s position at any given moment denoted as . The starting and ending points of the UAV’s flight are represented as and , respectively.
Within the target area, a total of 7 GBS are distributed in a honeycomb pattern, as indicated by black star markers in
Figure 2. The GBS antenna stands at a height of
, and each GBS site comprises 3 sectors, resulting in a total of M = 21 sectors. The GBS antenna is a vertically oriented 8-element uniform linear array (ULA) with a half-power beamwidth of 65° in both horizontal and vertical directions. The main lobe is tilted 10° to the ground, forming a directional antenna array.
2.2. Reception Signal Model
In the system model, we simulate path loss using the Urban Microcell (UMI) model specified by 3GPP. It is worth noting that the statistical building model has been widely used to estimate the line-of-sight (LoS) probability of ground-to-air links [
33]. However, this model only reflects the average characteristics of large-scale geographic areas with similar types of terrain. For each local area with given building positions and heights, the presence/absence of LoS links with cellular base stations can be accurately determined by examining whether the communication path between the base stations and UAVs is obstructed by any buildings. The path loss for the LoS link between the UAV and sector
m is represented as follows
where
represents the free-space path loss,
represents the altitude of the UAV at time
t,
represents the distance between the UAV and sector
m, and
is the carrier frequency. When the communication path between the base station sector
m and the UAV is obstructed by obstacles, a non-line-of-sight (NLoS) channel is formed, characterized by a path loss denoted as
The channel gain between the UAV and sector
m, denoted as
, is primarily determined by three factors, GBS antenna gain, large-scale channel fading, and small-scale fading. According to [
34], the received instantaneous signal power at the UAV from sector
m can be mathematically expressed as
where the constant
represents the transmit power of GBS in sector
m, while
and
respectively denote GBS antenna gain and large-scale channel fading. The variable
signifies the channel gain under small-scale fading, and
can be determined by the building’s location between the UAV and GBS
The sector associated with the UAV at time
t is denoted as
. Consequently, the descending instantaneous SIR can be mathematically formulated as
The small-scale fading
introduces randomness to the variable
at any given location
and its associated unit
. To assess the reliability of the UAV-to-target cell link, we introduce the interrupt probability function as follows
The interruption of the connection to the GBS-UAV is considered when the SIR falls below the interruption threshold , where event probability indicates its likelihood.
The direct solution of
being unattainable, we reformulate the instantaneous
as a function of
,
, and small-scale fading
. Subsequently, we define the interrupt indicator function as follows
Then, the interrupt probability function in (
6) can be expressed as the expectation of small-scale fading
, i.e.,
The interruption probability of each time point
t is obtained by conducting J-time signal measurements on M sectors within a short duration using the UAV. The j-th measurement of the small-scale fading is denoted as
, the corresponding SIR and the outage indication function are denoted as
and
, therefore the corresponding communication interruption probability can be expressed as
According to the large number theorem,
can provide an accurate approximation of the actual interruption probability at
when J is sufficiently large. The optimal associated cell can be denoted as
where
signifies the argument or input value that minimizes the corresponding functionand and the estimation of the interruption probability at any given location can be calculated by
According to the aforementioned analysis, the anticipated interruption probability of UAV at any given location can be derived, enabling the construction of a 3D coverage probability graph (CPG). The constructed coverage probability map will be shown in
Section 4, where coverage probability
.
2.3. UAV Motion Model
The rotor UAV utilized in this experiment primarily consumes energy in two main aspects. The first aspect pertains to communication, encompassing signal processing, radiation, and circuitry. The second aspect involves propulsion energy, which is essential for sustaining the UAV’s flight and movement. It is noted that the communication-related energy consumption of UAVs is considered negligible due to its typically smaller magnitude compared to the propulsion energy of UAVs [
35]. According to [
36], the instantaneous propulsion energy of a rotor UAV with a velocity of
V can be expressed as
where
and
are constants, representing the UAV’s blade profile power and induced power in hovering states, respectively.
represents the mean rotor induced velocity in hover,
signifies the tip speed of the rotor blade, and
and
s denote the fuselage drag ratio and rotor solidity, respectively.
and
A denote air density and rotor disc area, respectively. In a given environment, with all environmental parameters and UAV settings held constant, the power required for UAV flight remains constant for a given speed. Therefore, the consumed energy of the rotary-wing UAV during time
T can be expressed as
. It can be deduced that the energy consumption of UAVs is directly proportional to their flight time, indicating that longer flight durations result in higher energy consumption.
In this study, we prioritize flight time over energy consumption as our research metric. By imposing a maximum flight time constraint, we ensure the safe operation of UAVs. Additionally, we introduce the concept of communication interruption time, denoted as , to represent the communication quality of UAVs within a given time period. The main objective of our study is to train UAVs to acquire optimal flight strategies. If UAVs solely focus on energy consumption, they would instinctively choose the shortest path from the starting point to the destination, inevitably compromising the communication quality between UAVs and associated ground stations. Similarly, if only communication quality is prioritized, it would significantly increase the energy consumption of UAVs. To address this trade-off, we introduce a weighting coefficient, denoted as , which combines the flight time and estimated interruption time of the UAV. By minimizing the weighted sum of both factors, we aim to achieve a balanced optimization between energy consumption and communication quality between UAVs and ground stations.
Based on the obtained CPG of 3D space, the optimization objective equation can be formulated as follows
where
represents the trade-off between the flight time and the expected outage time. A higher value of
indicates a greater emphasis on maintaining connectivity between the UAV and the GBS, but at the cost of potentially increased travel distance for the UAV. The constraints on the starting and ending positions are represented by (
14) and (
15), while the limitation of the UAV velocity is denoted by (
16). Additionally, (
17)–(
19) specify the constraints on the 3D motion space of the UAV.
The path planning problem can be formulated as a markov decision process (MDP) that is amenable to solution using DRL. However, addressing the continuous optimization aspect of (
13) introduces challenges due to the inherent complexity arising from continuous state and action spaces. This often leads to instability or non-convergence during DRL training. To mitigate these issues, we convert problem (
13) into a discrete-time formulation by discretizing the time period, which can be expressed as
where
,
, and the time interval should be sufficiently small so that within each time step, the distance between the UAV and any GBS in the target area remains approximately constant, while ensuring that both the antenna gain and channel state parameters between the UAV-GBS remain nearly constant.
3. 3D Path Planning Based on Improved DRL
To address problem (
20), we employ the multi-step D3QN model in DRL to optimize the objective function, and use PER mechanism instead of the conventional random experience replay (RER) approach to enhance learning efficiency and expedite convergence. Moreover, for assisting path planning, a radio mapping network is incorporated to generate simulated 3D radio maps and simulate flight processes. This incorporation not only mitigates flight costs, but can also enhances the accuracy of the D3QN network model. The improved framework based on DRL is then applied to UAV path planning, enabling efficient identification of an optimal route that satisfies all constraints from any given starting point.
3.1. Multi-Step D3QN Model
In this section, we will briefly introduce the relevant knowledge of DRL and provide an overview of the specific components of the multi-step D3QN model employed in this paper.
In the reinforcement learning model, the agent and the environment play crucial roles. The agent selects actions
based on the current state
provided by the environment, while its own state changes to
according to state transition function, with rewards
being fed back to the environment. By iteratively following this process, the agent can efficiently converge towards an optimal strategy within a specific environment. Execution of this optimal policy leads to maximum cumulative reward
for agent movements, which can be defined as
where
represents the discount factor, denoting the future reward discounted at the prevailing rate. A higher value of
signifies greater emphasis on long-term gains, while a lower value indicates prioritization of short-term benefits.
Since the cumulative reward
is unknown prior to the completion of the agent’s trajectory, we estimate the expected reward instead of its actual value to derive the action value function
where
represents the state transition function, denoting the probability of an action
being performed by the agent while in a particular state
. The action value function
signifies the expected return obtained by adhering to a given policy
. If there exists a strategy function capable of selecting the optimal action for the agent at each state during its trajectory, it is referred to as the optimal strategy
. Under this guidance, the optimal action value function
can be expressed as follows
In principle, by exhaustively traversing all possible sequences
and iteratively optimizing, we can obtain the optimal value for
and subsequently determine the optimal strategy
. However, to address the limitation of Q-learning in dealing with continuous high-dimensional state or action spaces, we employ the classical DQN network model instead of the Q table as a function approximator, and update the network parameters by minimizing the loss function
where
denotes neural network parameter vector. However, the direct utilization of (
31) in the standard training algorithm may give rise to the issue of overestimating Q value, thereby leading to learning instability and inefficiency. To address this challenge, we introduce Double DQN into our research, aiming to mitigate overestimation. This approach separates the selection of the target Q value from the estimation process by leveraging the policy network to determine the optimal action and utilizing the target network to estimate the corresponding Q value. In accordance with the Double DQN model, we can reformulate the loss function as
where
denotes the parameter vector of target network. Additionally, to enhance the effectiveness of learning state value information and address bias-variance trade-off in training, this study introduces the dueling network and n-step bootstrapping techniques to improve the Double DQN model, and the improved model was represented as multi-step D3QN model. The dueling network models both the state value function
and the action advantage function
, respectively, enabling the network to learn the relative value of each state as well as the advantages of different actions. By decomposing the network’s output into status value and action advantages, we obtain a comprehensive Q value by combining these two components, which can be expressed as
where
and
are the parameters of the advantage stream and the value stream, respectively, and
represents the size of the action space.
Multi-step bootstrap is an improved learning style in reinforcement learning that aims to improve the efficiency of learning by considering the rewards of multiple future time steps
, which can be expressed as
It is worth noting that the return accumulates to a maximum of N steps, when
The loss function of the D3QN model, incorporating multi-step bootstrap technology, can be summarized as follows
3.2. Priority Experience Replay
Experiential playback is a crucial technique in DRL. Its fundamental concept involves storing the experiences acquired through agent-environment interactions and sampling them randomly for learning, thereby reducing sample correlation. However, randomly selecting samples may result in the loss of crucial experiences, thereby impacting the learning efficacy and, consequently, the effectiveness of UAV path planning. To address this issue, we propose employing PER instead of traditional RER by assigning priorities to each experience. During the process of sample extraction, samples with higher priority are more likely to be selected, thus enhancing the efficiency of sample training.
The PER mechanism assigns sampling weights based on the absolute value of the temporal difference error (TD-error). In this mechanism, the priority of each experience is set to
, where
represents TD-error, and the parameter
is a constant greater than 0, which is used to ensure all
. Notably, higher TD-errors correspond to greater experience priorities. Consequently, the sampling probability for each experience can be defined as follows
the hyperparameter
controls the intensity of priority playback, while
represents traditional random experience playback where each experience is sampled with equal probability. Additionally,
denotes the sum of all experience priorities in the buffer. The sampling probability
can be utilized for calculating the loss function.
To mitigate the computational complexity arising from priority sampling as the number of experiences increases, we employ a sum-tree data structure to store priorities and conduct sampling operations. Given a sample size of
k, priority
is divided into an average of intervals. A random value is generated in each interval and the corresponding transition sample is extracted from the sum-tree. However, changing the priority of the sample will introduces errors into the data distribution. To compensate for this error, importance sampling weights are introduced and can be expressed as follows
where
is a hyperparameter that determines how much PER affects the convergence result, and the loss function in (
35) can be rewritten as
3.3. SNARM Framework
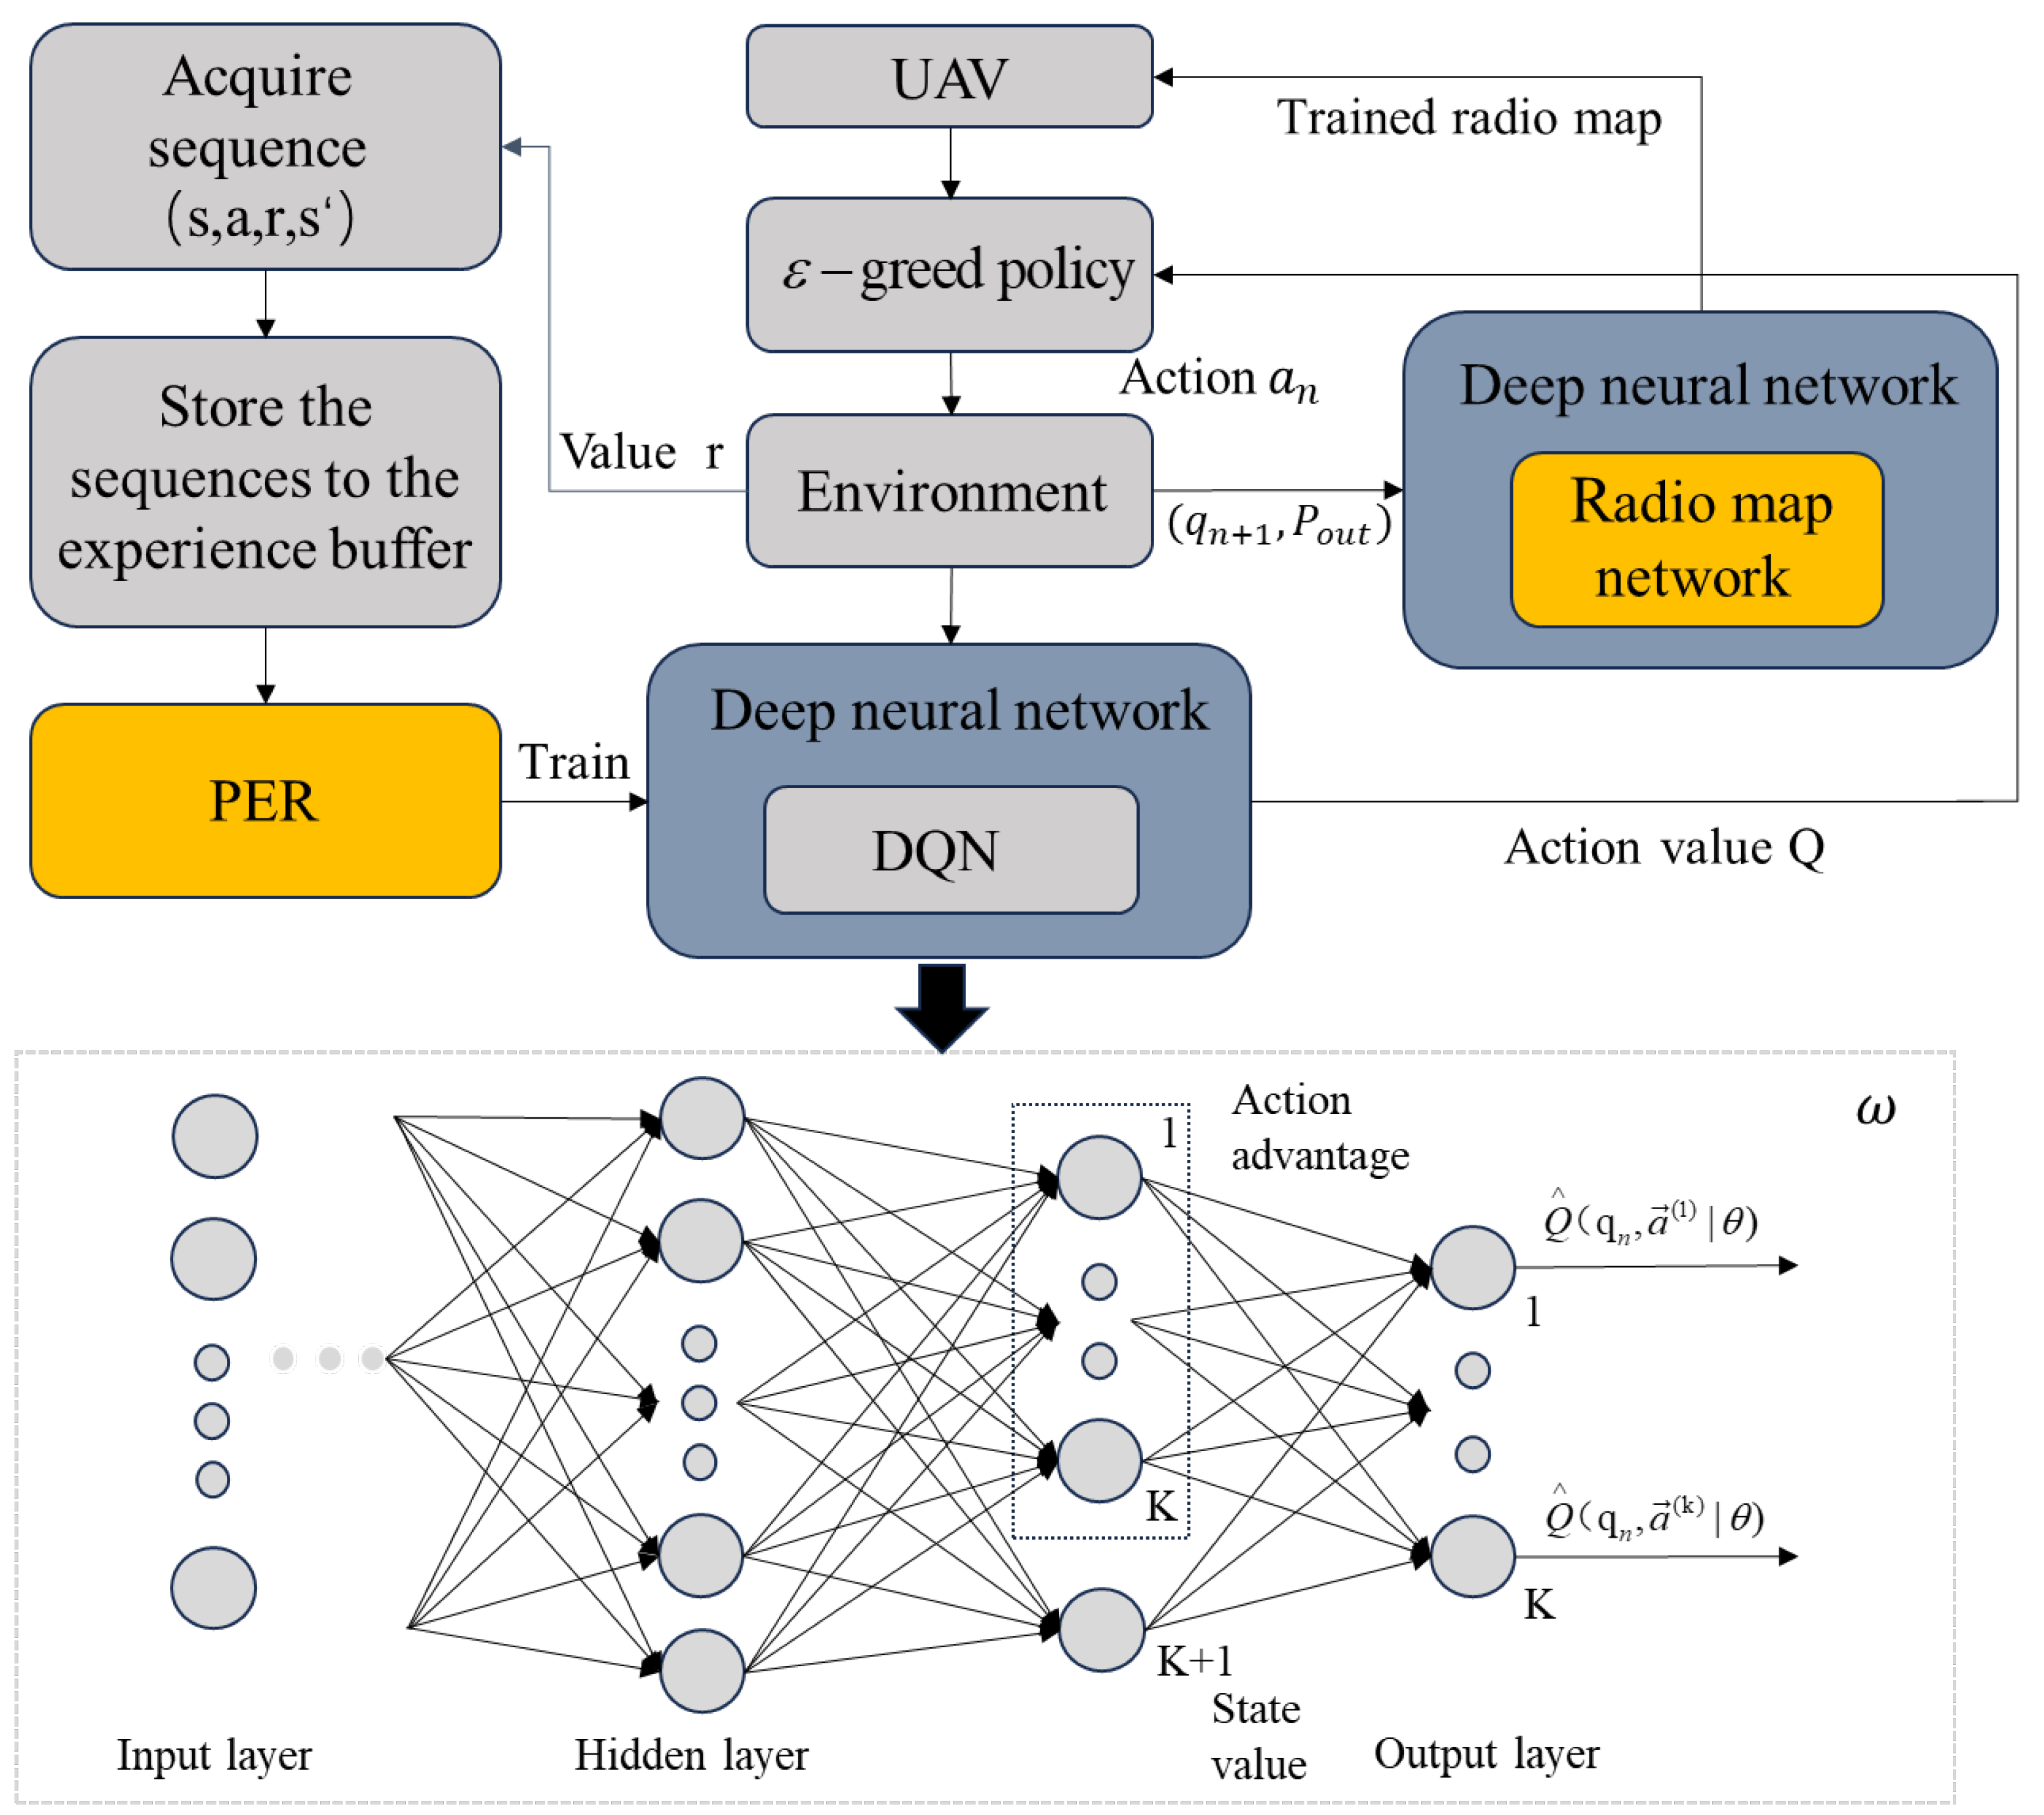
Due to the lack of prior environmental knowledge, relying solely on the actual flight of UAVs not only incurs high training costs and a slow learning process, but also poses a significant risk of accidents. To address this issue, we propose the SNARM framework in this paper, which utilizes UAV measurement signals during flight to generate a simulated 3D radio map and create a virtual flight trajectory. By doing so, the UAV can predict the expected outcome for each path without physically traversing, thereby reducing the cost of measured flight and mitigating potential risks. Furthermore, we employ the Dyna framework to integrate simulation experience with real-world experience in updating UAV flight strategies within deep learning algorithms, thus enhancing the accuracy of neural network. The Dyna framework is shown in
Figure 3 below.
Notably, the simulated trajectory is utilized more frequently than the actual path, and for each real episode taken by the UAV, episodes are employed in the simulated trajectory. Initially, the limited efficacy of the map model in learning resulted in a relatively low reference value for simulation experience, leading to a reduced contribution of simulation experience towards neural network updates. As the accuracy of the local map model improves, there will be an increased proportion of simulation experience involved in network updates. Since acquiring simulation experience does not necessitate actual UAV measurements, it is possible to appropriately increase the proportion of simulation experience without concerns about additional UAV operating costs and algorithm runtime consumption.
3.4. Path Planning Based on Improved DRL
In the enhanced DRL model, the UAV functions as an autonomous agent that strategically selects the optimal course of action based on its current state, subsequently receiving rewards from the environment and transitioning to subsequent states. The comprehensive depiction of the state space, action space, and reward function is expounded upon in meticulous detail as follows:
State: The state serves as the input of the neural network, representing the UAV’s 3D positions. The state space S encompasses all potential UAV positions within the terrain of interest . For each episode, the initial location of the UAV is randomly generated, while the final location is predetermined.
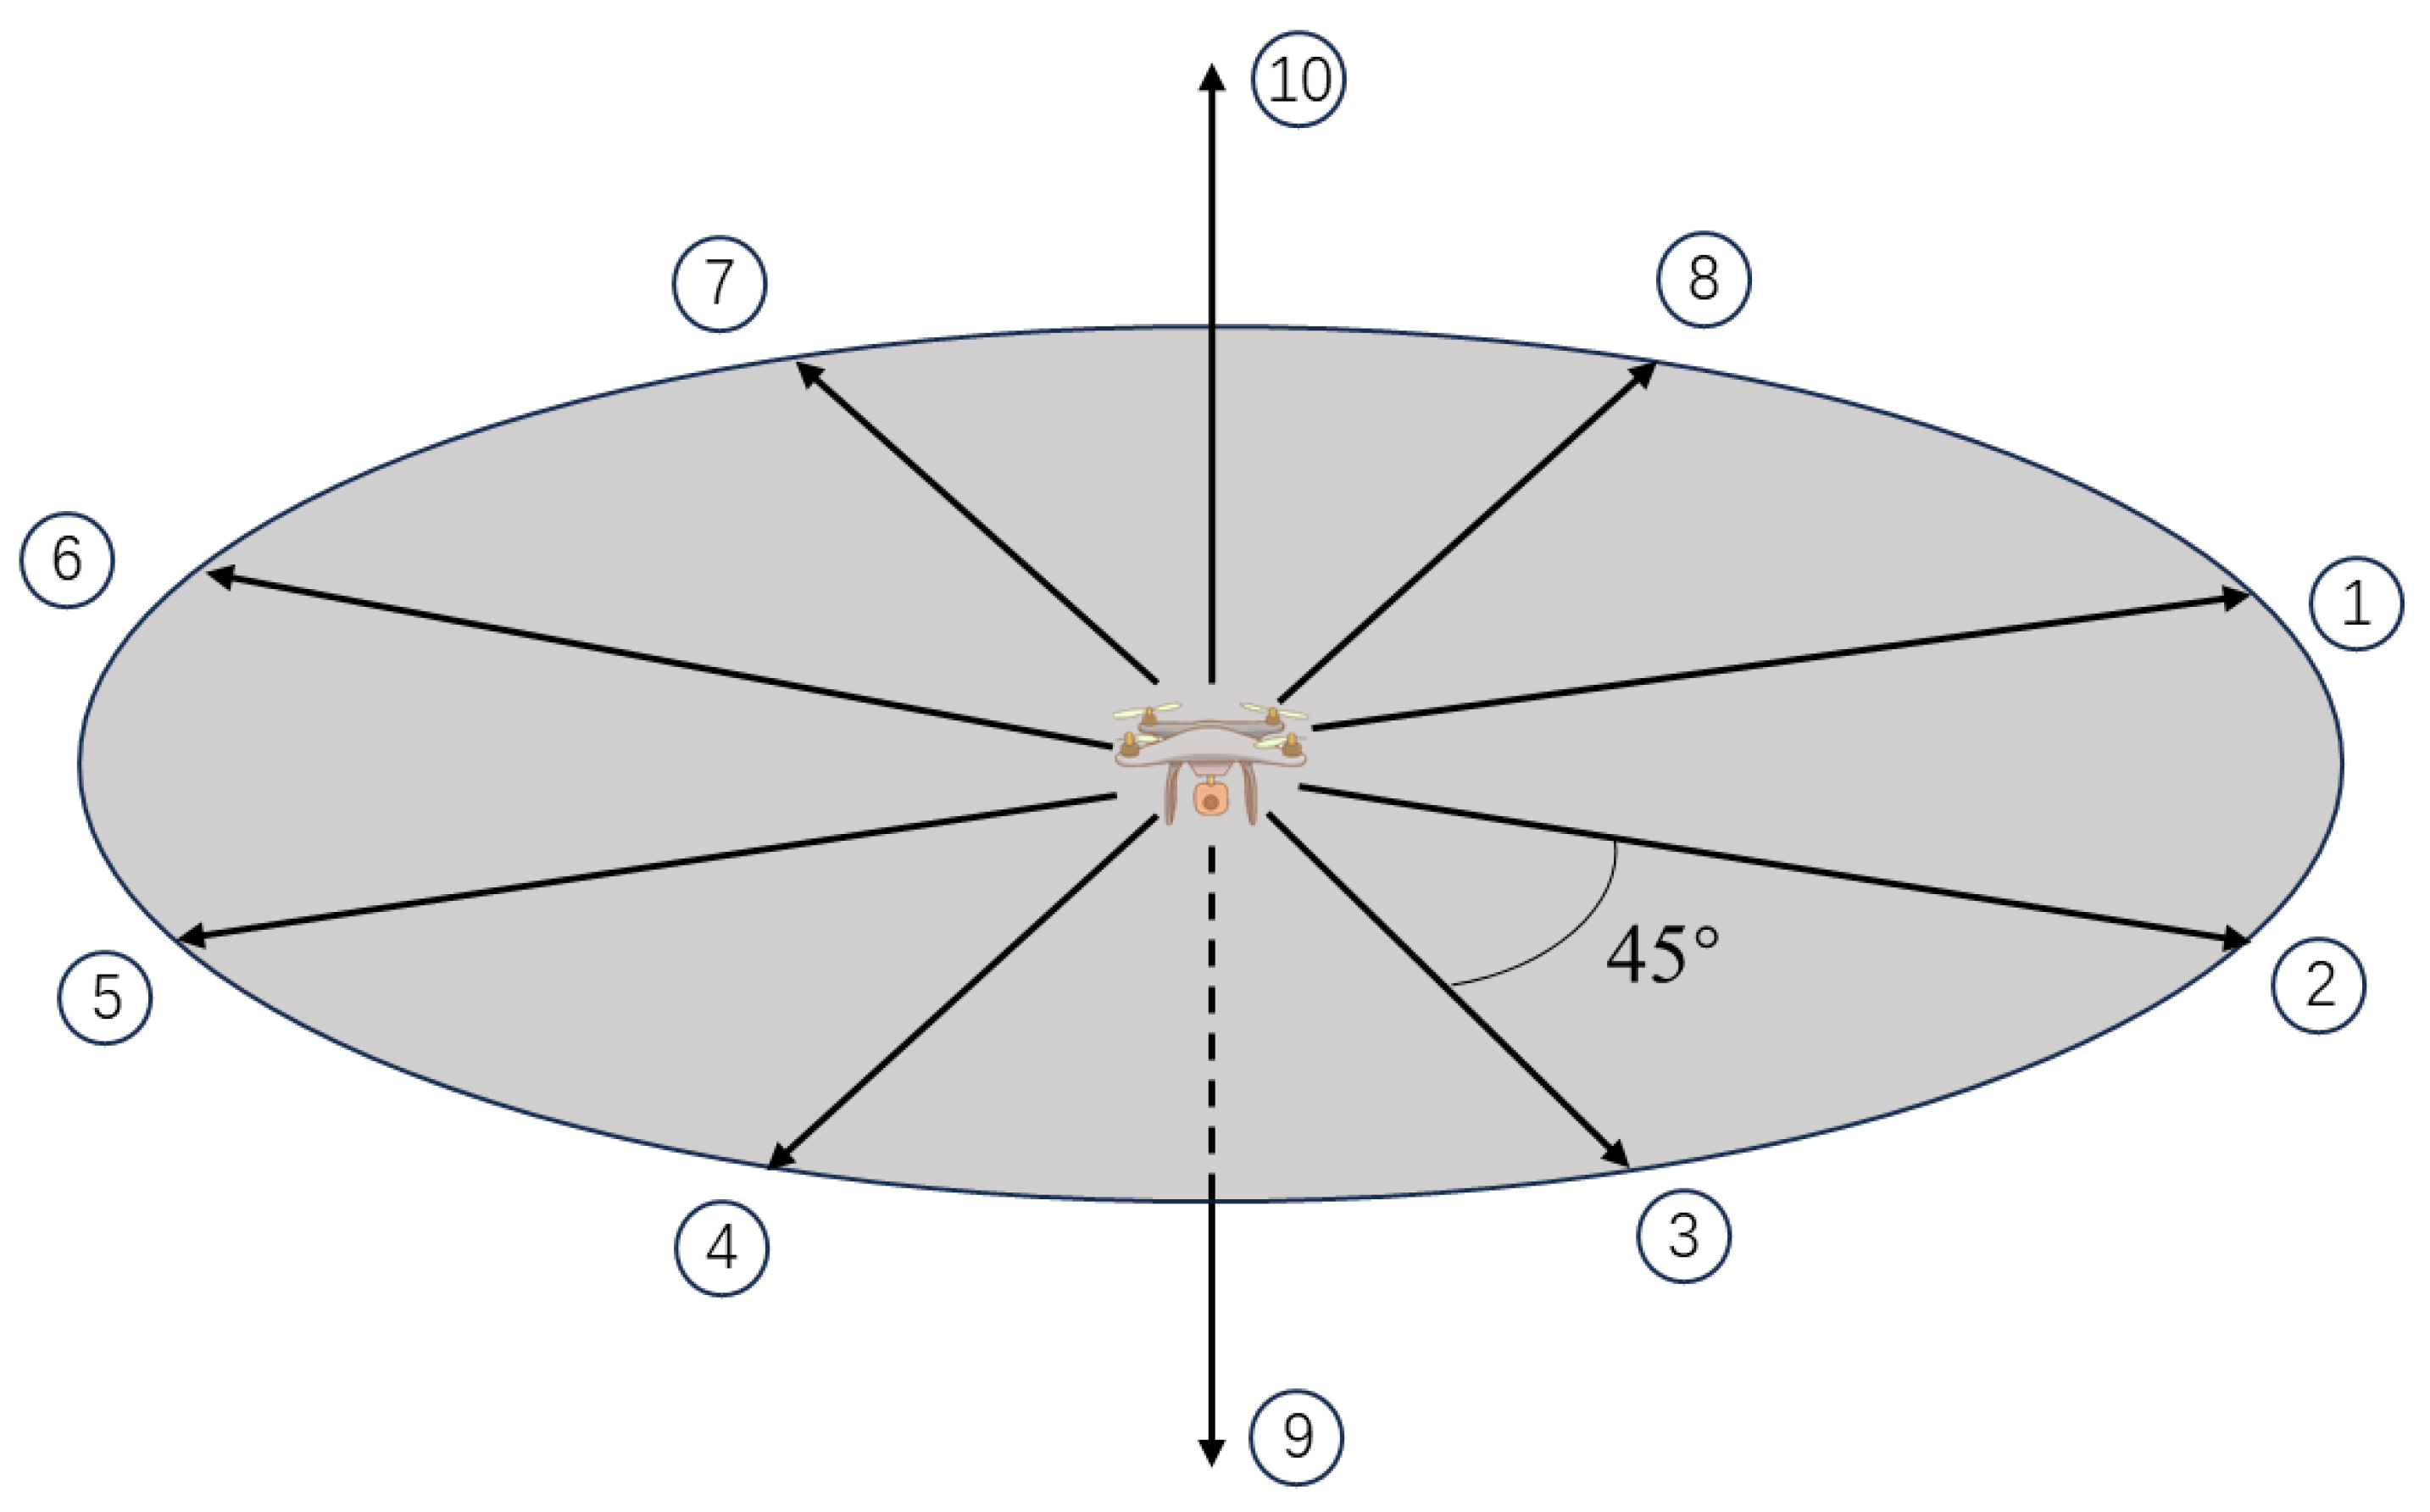
Action: The action space A corresponds to the UAV flying direction. Considering the limited vertical range of the UAV’s flying area, the action space of the UAV consists of 10 directions, including 8 horizontal directions spaced 45 degrees apart, as well as upward and downward directions, as shown in
Figure 4. The selection of UAV motion direction relies on the model’s estimation of the Q value for each direction in specific position.
Reward: The reward R is defined as , and the UAV incurs a penalty of 1 for each step taken before reaching the endpoint . Additionally, if it enters an area with weak coverage, it will be penalized by a weighted value of . This encourages the UAV to consider both flight time and interruption time to determine the optimal path towards the endpoint.
| Algorithm 1 N1-Step D3QN with PER for Connectivity-Aware UAV Path Planning |
Initialize: number of episodes , maximum number of steps per episode , number of multi-step learning steps , experience buffer D of size C, initial exploration rate , exploration decay rate and experience extraction number B Initialize: Q network with parameter , target network with parameter , network update rate , and radio map network E with parameter
- 1:
for do - 2:
Initialize the sliding window W of size N, the actual starting position , the simulated starting position , and the flight step , - 3:
Select the action with -greedy policy - 4:
Perform action to obtain the next state , measure the probability of communication interruption , and save it in map network E - 5:
Update the map network E with - 6:
Set single-step reward and store sequence in slide window W - 7:
When , calculate and store in experience buffer D - 8:
Extract B sequence and its priority from D according to PER mechanism - 9:
Set - 10:
Perform a gradient descent step on with respect to network parameters - 11:
for do - 12:
Perform steps (3–4,6–10) for the simulated experience, where the interrupt probability of is predicted by map network E. - 13:
- 14:
Until , ; or , reinitialize , - 15:
end for - 16:
, - 17:
Repeat steps 3–16 until , ; or , - 18:
After every episodes, set the target network parameters - 19:
end for
|
In the multi-step D3QN model, the UAV obtains the state from the state space and selects the action from the action space according to
strategy, i.e.,
where
represents the random exploration rate,
denotes a multi-step D3QN network parameter, and the value of
gradually decreases as the number of iterations increases. During the initial learning stage, the UAV conducts random exploration with a high probability to gather sufficient environmental information. As the UAV accumulates more experience, it becomes more inclined to select directions corresponding to maximum Q values. To enhance algorithm convergence, parameter
is initialized based on the distance between the UAV and endpoint. After initialization,
can be obtained, where
represents the next state of UAV after action
a is performed in state
q, and
signifies the endpoint coordinate. This encourages optimal path selection when radio environment understanding is limited during early stages. Additionally,
serves as a parameter for radio map network E and undergoes random initialization. The 3D path planning framework of UAV is shown in
Figure 5.
4. Simulation Verification and Analysis
In order to validate the efficacy of the proposed approach, this section conducts simulations on radio mapping and path planning based on the enhanced DRL algorithm. Furthermore, we conduct a comparative analysis between 2D and 3D trajectories in the path planning simulation to substantiate the indispensability of incorporating 3D path planning for UAVs under connection constraints. In simulations, each GBS has a transmitting power
, with an interrupt SIR threshold set at
. Other simulation parameters are presented in
Table 1.
4.1. Radio Mapping Based Environmental Learning
For radio mapping, we employ artificial neural networks (ANN) for map learning, which are trained using Adam optimizers to minimize mean square error (MSE) losses. The radio map network comprises five hidden layers with 512, 256, 128, 64, and 32 neurons respectively. The input consists of the UAV’s 3D coordinates , while the output represents the predicted probability of interruption at that location. The objective of network learning is to accurately align the 3D radio map with the real environment, thereby providing precise interconnection probabilities for each spatial point during simulated flight and enhancing the accuracy of the multi-step D3QN algorithm.
The actual global coverage of the 3D region under consideration is depicted in
Figure 6a, which is obtained through numerical simulations using a computer based on the aforementioned model of the 3D environment and channel. Therefore, direct utilization of this simulated data in the algorithm is not feasible. As shown in
Figure 6a, due to the combined influence of GBS antenna inclination and building occlusion, the coverage map exhibits irregularities in high altitude areas, while low altitude areas demonstrate a more regular pattern.
Figure 6b illustrates the spatial 3D coverage probability map acquired from radio mapping. By comparing
Figure 6a with
Figure 6b, it is evident that the acquired CPG exhibits a remarkable alignment with its corresponding actual counterpart, thereby substantiating the effective application of SNARM in path learning. The algorithm effectiveness was further verified through simulations, which evaluated the MSE and mean absolute error (MAE) of the learned radio map in relation to the episode count, as depicted in
Figure 7. MSE and MAE are derived by comparing predicted outage probabilities obtained from radio network measurements against actual outage probabilities at randomly selected locations. Episodes ranging from 0 to 500 correspond to an initial learning stage where large MSE and MAE values indicate poor quality of initially learned radio maps. However, as episode count increases, accumulating more signal measurement data leads to gradual decline in both MSE and MAE values, indicating improved approximation between learned radio maps and real maps.
4.2. UAV Path Planning
The UAV operates within a 3D environment established in
Section 2.1. It is assumed that the UAV’s starting point is randomly generated, while its endpoint is located at coordinates [1400,1600,100] and labelled by the big blue triangle in simulated graph. When the UAV reaches the specified altitude and the distance between it and the endpoint satisfies condition
, it is considered to have reached the endpoint.
The multi-step D3QN network consists of five hidden layers, with 512, 256, 128, 128, and 11 neurons respectively. The last hidden layer consists of one neuron representing the estimated state value, while the remaining ten neurons represent action advantages. These action advantages capture the discrepancy between each state’s action value and its corresponding state value. By aggregating these differences in the output layer, we obtain ten estimates for action values. The objective of multi-step D3QN network learning is to accurately estimate the Q value for each action, enabling the UAV to determine an optimal flight strategy that minimizes the cumulative flight time and interruption-weighted time.
Authors in the paper [
27] thoroughly investigate the 2D trajectory planning of UAVs subject to connectivity constraints. Nonetheless, overlooking the 3D attributes of the environment and neglecting the vertical movement of UAVs may lead to missed opportunities for optimal connectivity points and improved communication pathways. In this section, we conducted simulations of both 3D and 2D trajectories for UAVs, as outlined below.
Comparing the 2D and 3D motion trajectories of the UAVs in
Figure 8, it is evident that UAV prioritizes descending during 3D motion to seek better communication conditions. When the UAV is at the lowest altitude of 80 m, the convergence of its trajectory is lower compared to the 2D trajectory due to weakened spatial connectivity constraints. Nevertheless, upon comparing the weighted time of 2D and 3D trajectories from the same starting point in
Figure 9, it is observed that the UAV’s flight process with 3D motion has lower weighted time. Even at starting point 6, its weighted time is only half of that of the 2D trajectory. Therefore, it can be inferred that within the confines of connectivity limitations, the superiority of UAVs’ 3D motion compared to 2D motion becomes apparent.
To further emphasize the merits of the proposed SNARM-PER technique in path planning, a comparative analysis is conducted with other approaches such as SNARM-RER [
27] and D3QN-PER [
34].
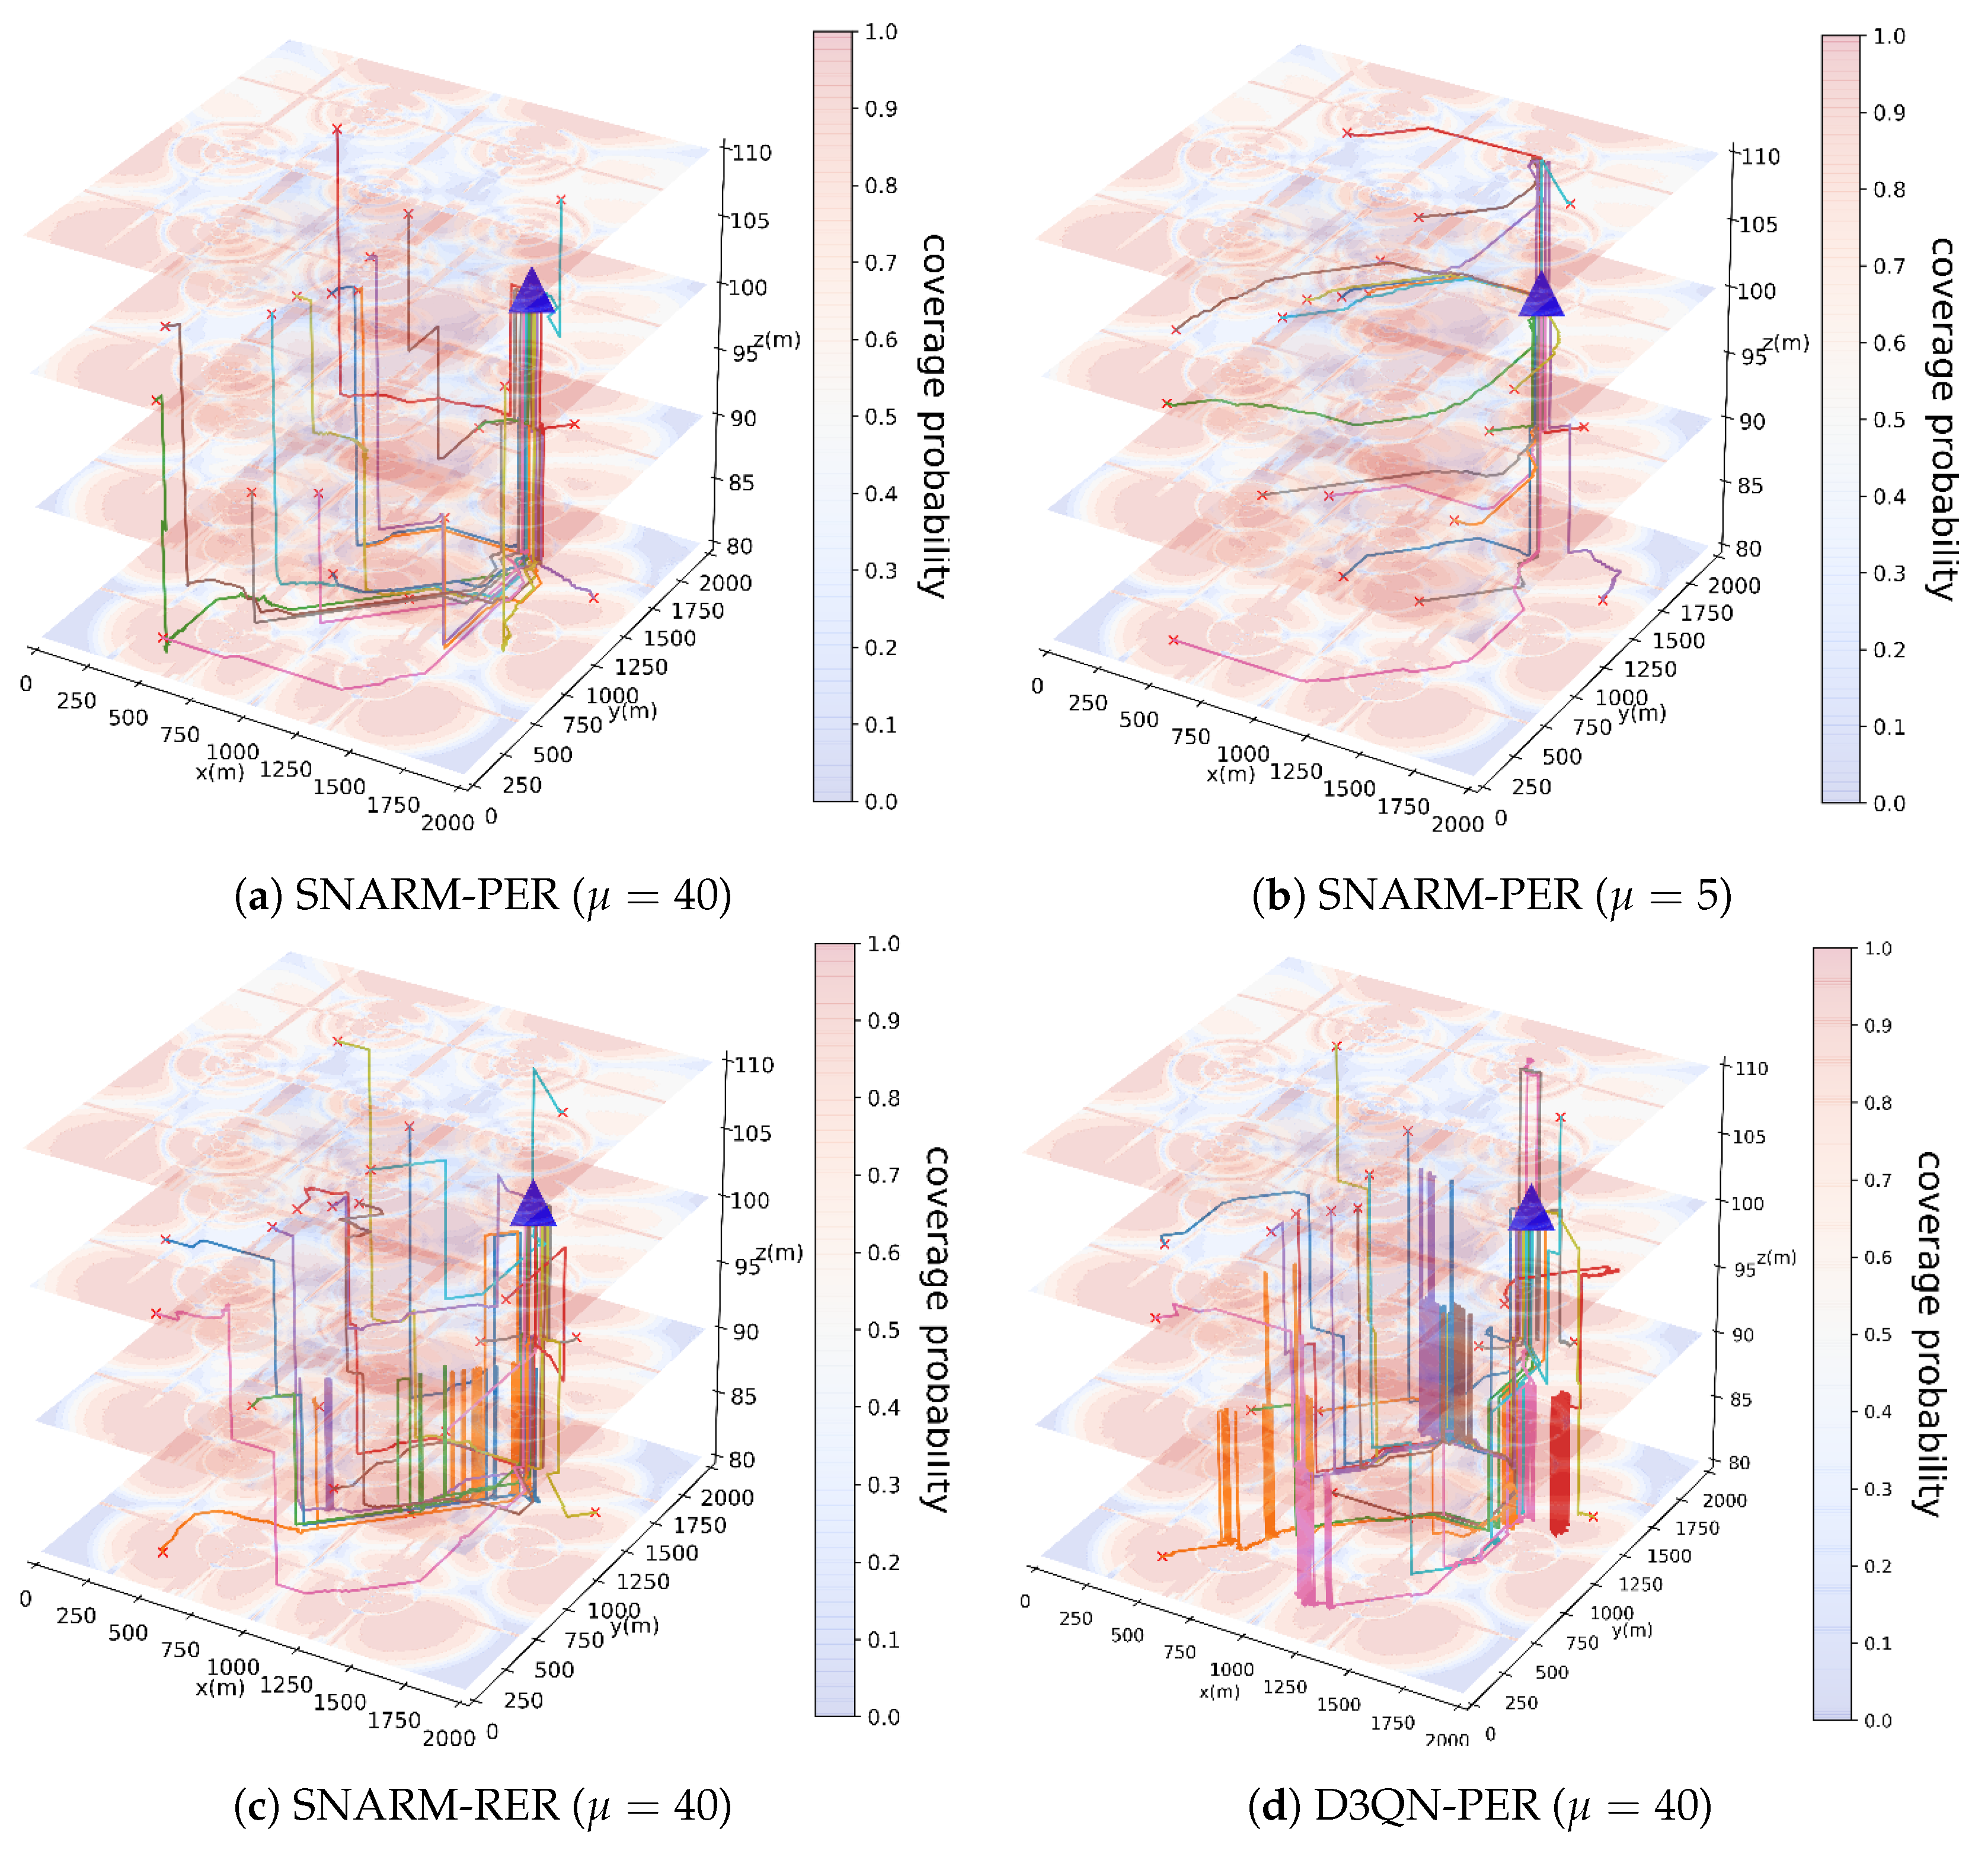
Figure 10 illustrates the final 20 episodes of UAV flight paths under different simulation conditions. Among them, the SNARM-PER algorithm integrates a multi-step D3QN algorithm with a radio map network and a PER mechanism, while the SNARM-RER and D3QN-PER algorithms serve as comparative algorithms, incorporating a multi-step D3QN algorithm with a radio map network and a RER mechanism, and utilizing a PER mechanism without a radio map network, respectively. In
Figure 10a,b depict flight trajectory maps using the target algorithm with different weight values. It can be observed that when the weight value is sufficiently large, UAVs tend to prioritize avoiding areas with weak communication coverage by descending to seek better communication conditions. Conversely, when the weight value is small, UAVs tend to follow more direct paths towards the destination with less consideration given to communication connectivity. This demonstrates the influence of weight coefficients
in the objective function (
20) on UAV flight paths. Specifically, a higher weight coefficient directs the UAV’s focus more towards maintaining connectivity with the base station, consequently diminishing its emphasis on seeking the shortest route.
Following the principle of controlling variables, we compare (a) with (c) and (d) in the
Figure 10. Under the same weighting coefficients, UAVs exhibit significant differences in their trajectories. it is evident that UAVs using the proposed SNARM-PER algorithm exhibit more convergent flight paths, allowing for precise avoidance of communication weak coverage areas, and completion of flight missions over shorter distances. However, UAVs using the comparative algorithms, due to insufficient learning of their Q-networks, show only partial convergence in their flight paths, along with oscillations in trajectory altitude.
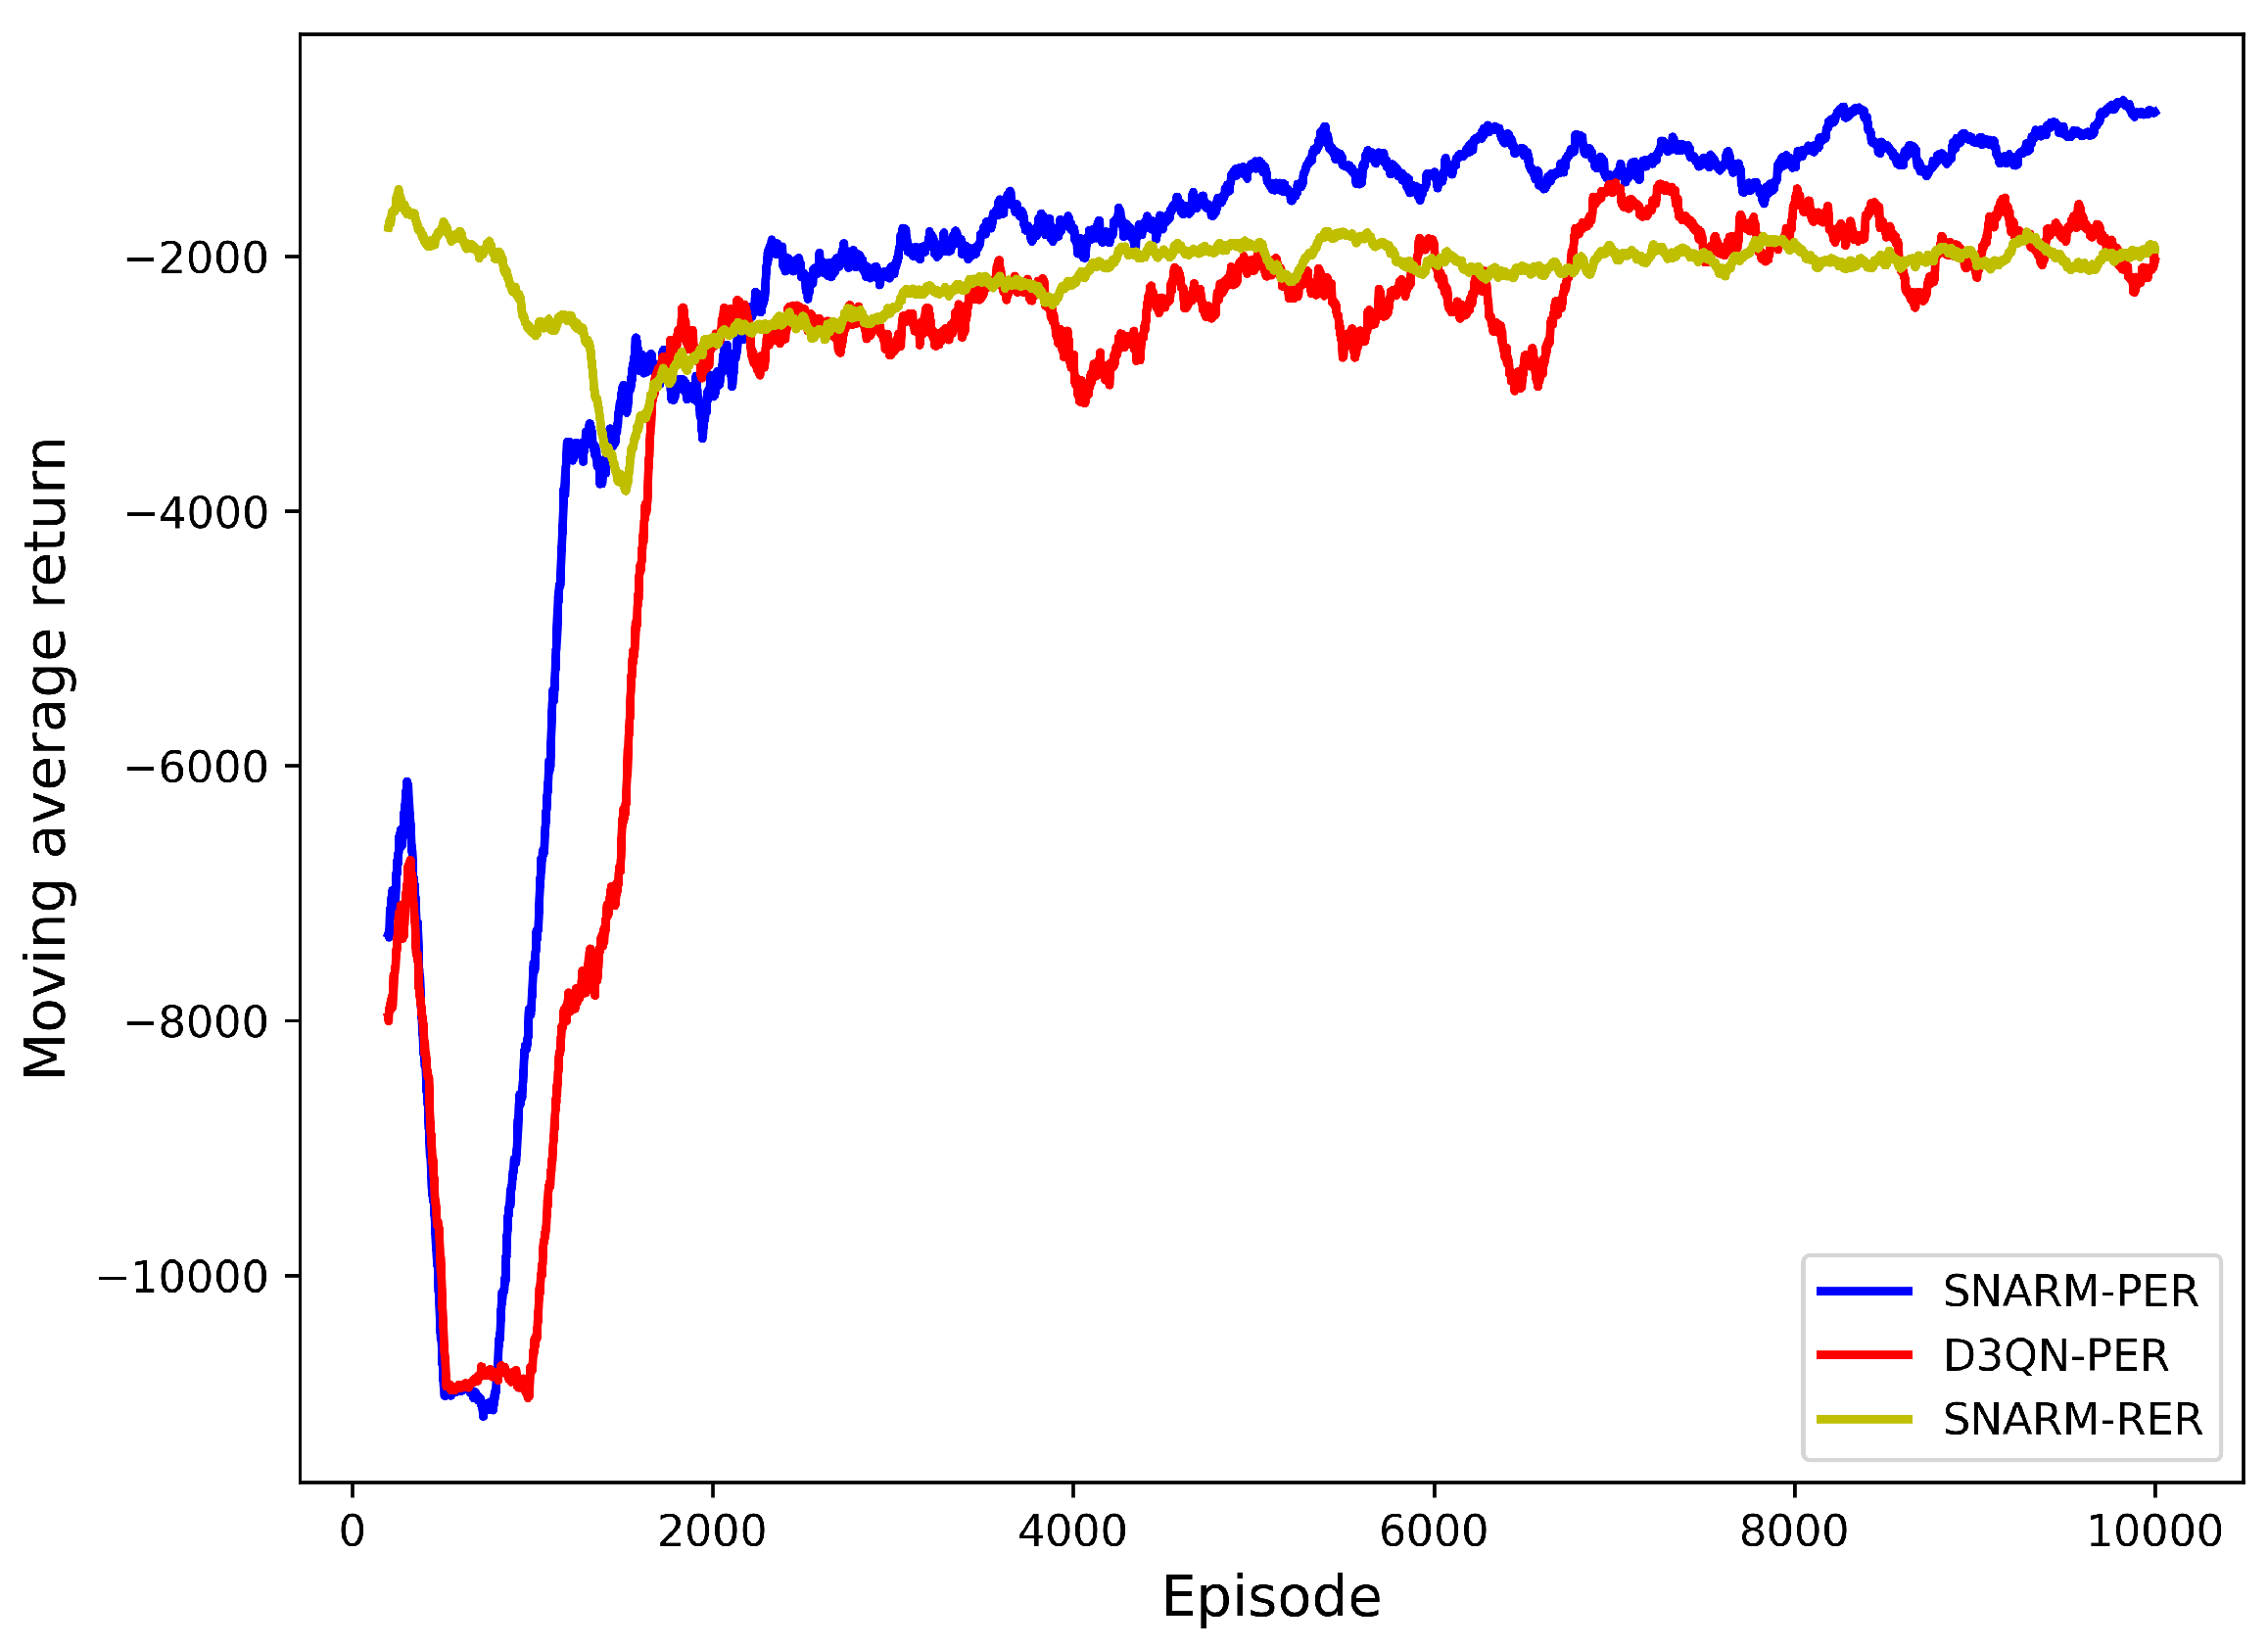
Figure 11 illustrates how the average return of the UAV flight path changes with the number of episodes across various algorithms. The average return of the path is calculated as the mean value of the returns from the previous 200 episodes, thereby introducing data smoothing and enhancing trend visibility through averaging within a moving window. The average mobile return serves as a pivotal index for assessing the overall efficacy of UAV movement processes. Incorporating the settings of return values as outlined in
Section 3.4, a higher average movement return indicates lower cumulative flight and interruption times. A clear observation from
Figure 11 is that, in the learning phase after 1000 episodes, UAVs leveraging the SNARM-PER algorithm, as proposed in this paper, exhibit notably superior average movement returns and enhanced motion performance compared to the contrasting algorithms.
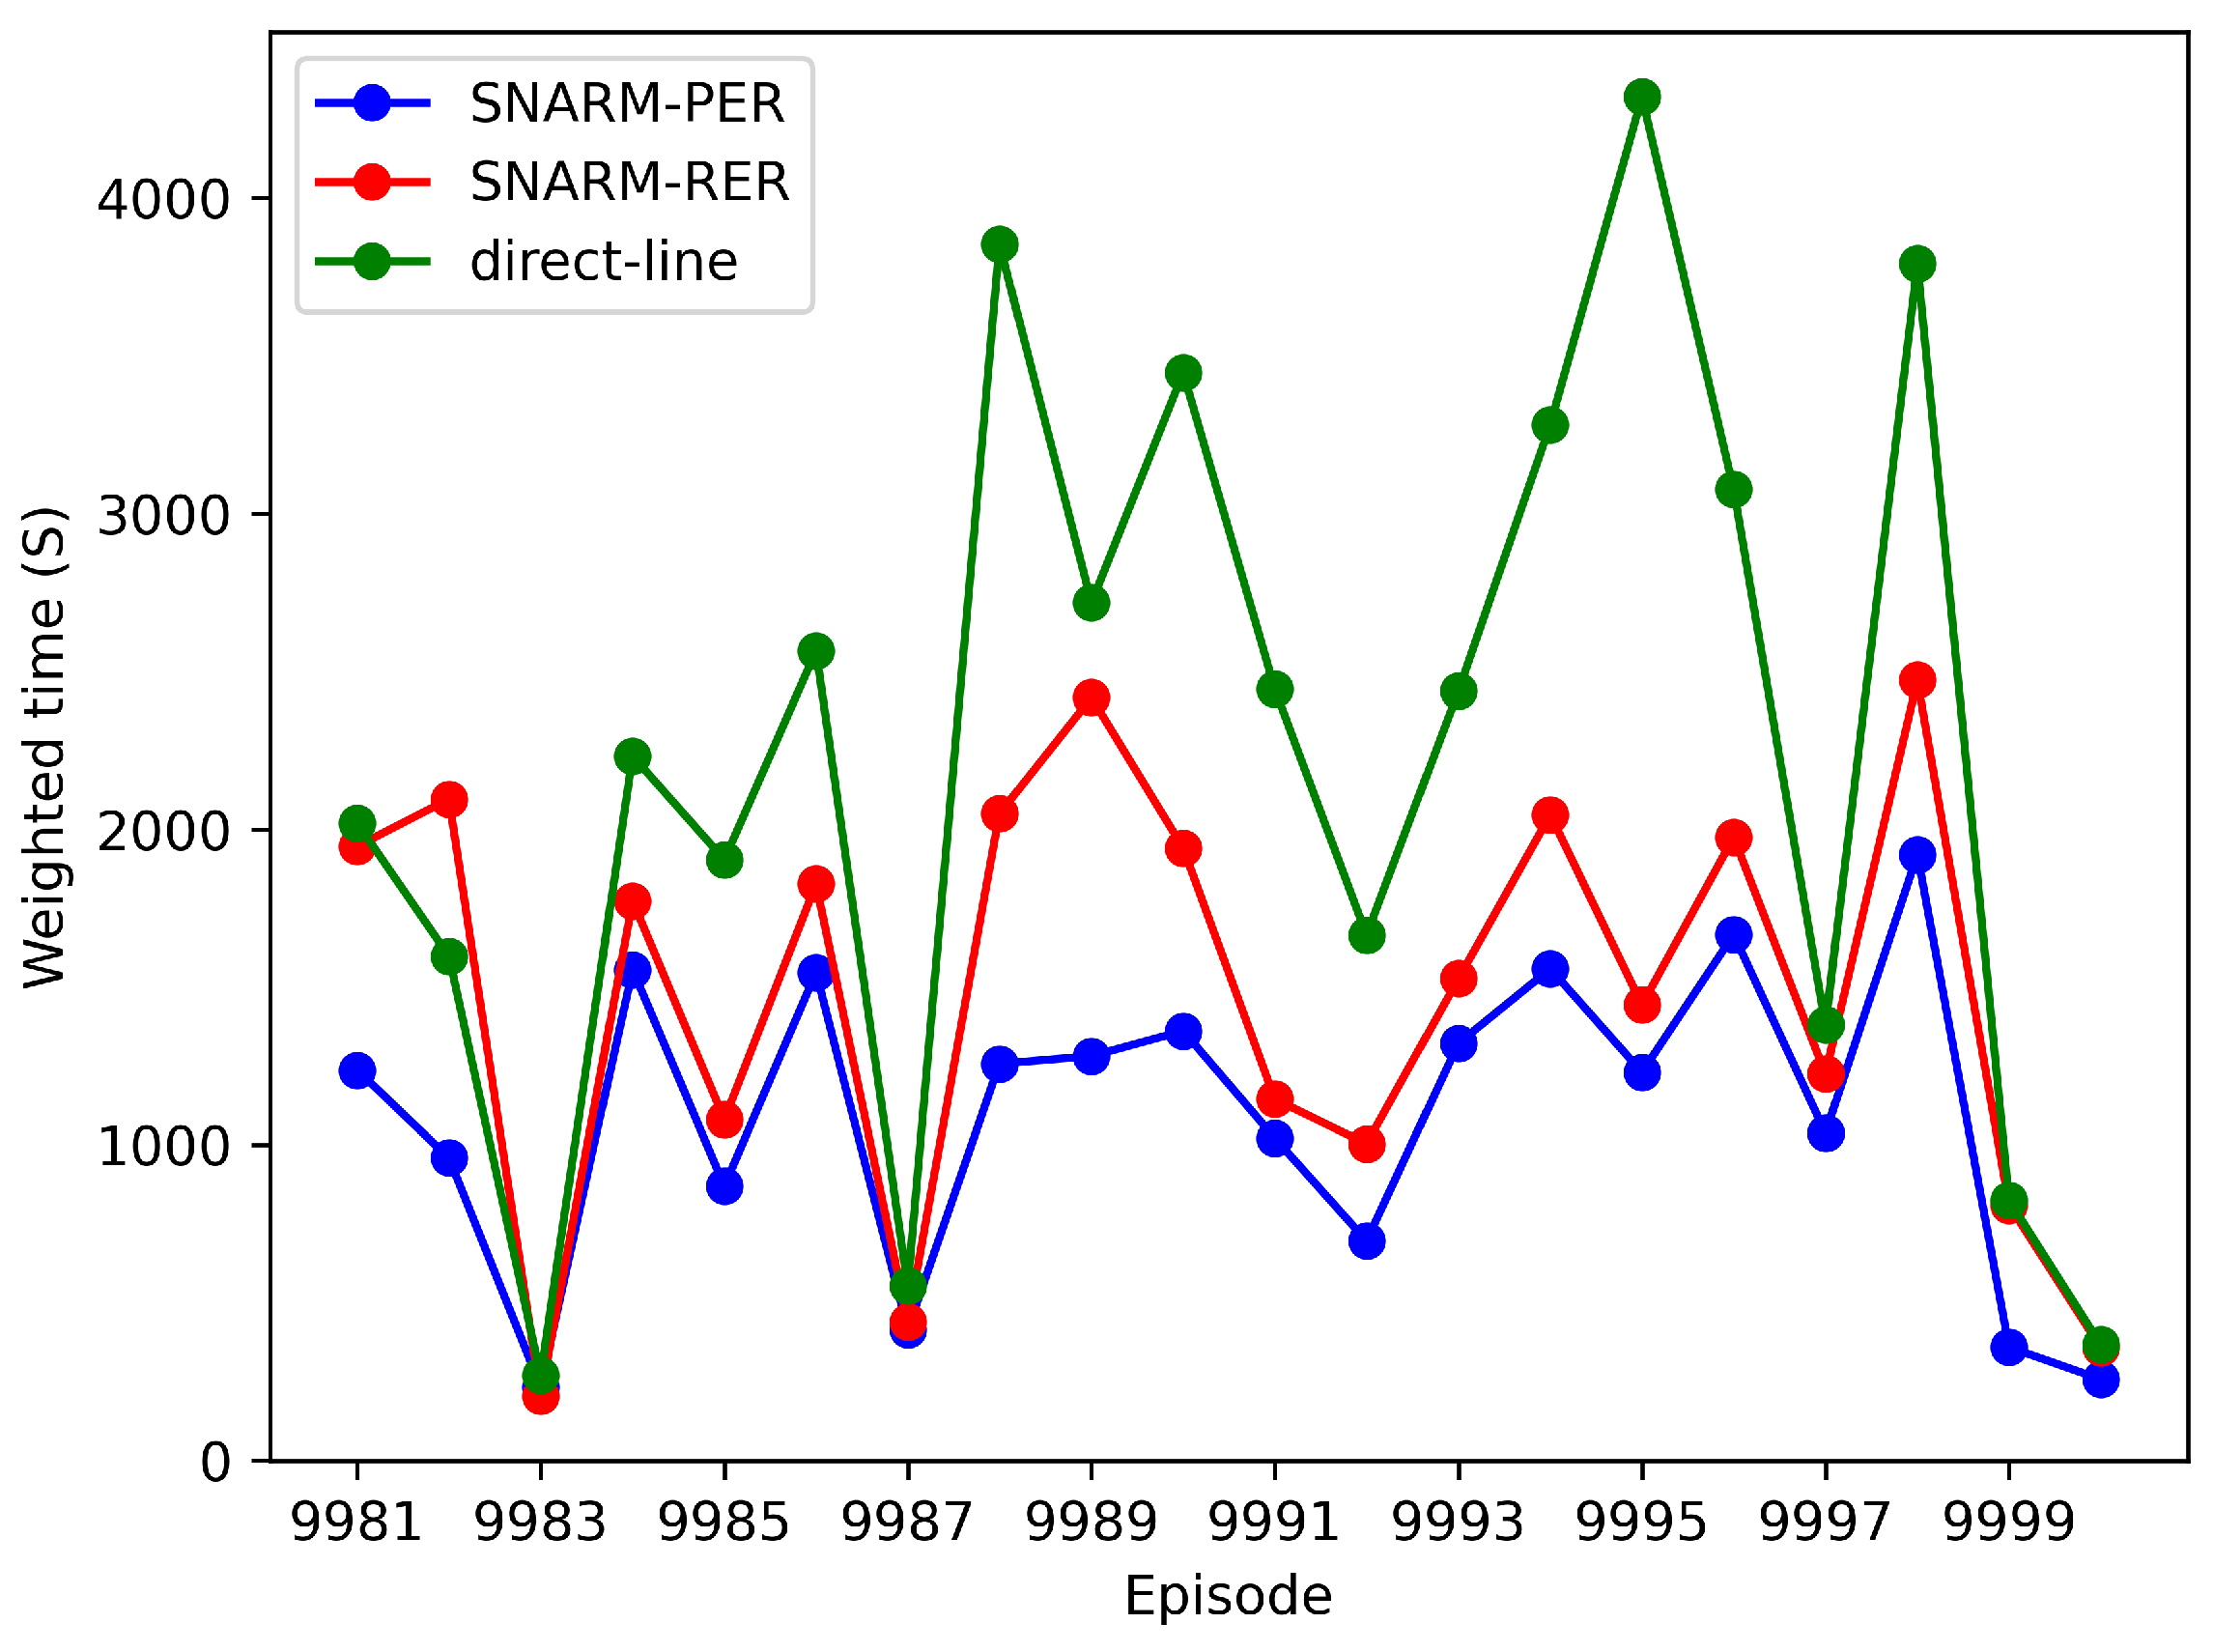
Figure 12 illustrates the total mission time of different algorithms during the last 20 episodes, representing a weighted sum of actual flight time and estimated interruption time. The weighted time of the last 20 episodes serves as an indicator of learning outcomes. As depicted in
Figure 12, compared to SNARM-RER and direct-line approaches, the SNARM-PER algorithm excels in minimizing the weighted sum of UAV flight time and interruption time. Consequently, the UAV achieves a better balance between flight energy conservation and the avoidance of areas with weak communication coverage. All these findings serve to numerically validate the superiority of the proposed algorithm over other comparative methods. The UAV employing the SNARM-PER algorithm demonstrates enhanced capability in path planning under connectivity constraints while minimizing the weighted sum of flight time and interruption time.
