Article

Characteristics Analysis and Modeling of Integrated Sensing and Communication Channel for Unmanned Aerial Vehicle Communications

1
School of Integrated Circuits, Shandong University, Jinan 250101, China
2
The National Mobile Communications Research Laboratory, School of Information Science and Engineering, Southeast University, Nanjing 210096, China
3
The Purple Mountain Laboratories, Nanjing 211111, China
4
School of Information Science and Engineering, Shandong Normal University, Jinan 250101, China
*
Author to whom correspondence should be addressed.
Drones 2024, 8(10), 538; https://doi.org/10.3390/drones8100538
Submission received: 27 August 2024 / Revised: 15 September 2024 / Accepted: 23 September 2024 / Published: 1 October 2024

Abstract

:
As an important part of 6th generation (6G) communication, integrated sensing and communication (ISAC) for unmanned aerial vehicle (UAV) communication has attracted more and more attention. The UAV ISAC channel model considering the space-time evolution of joint and shared clusters is the basis of UAV ISAC system design and network evaluation. This paper introduces the UAV ISAC channel characteristics analysis and modeling method. In the UAV ISAC network, the channel consists of a communication channel and a sensing channel. A joint channel parameter is a combination of all (communication and sensing) multiple path component (MPC) parameter sets, while a shared path is the intersection of the communication path and sensing path that have some of the same MPC parameters. Based on the data collected from a ray-tracing (RT) UAV-to-ground scenario, the joint paths and shared paths of ISAC channels are clustered. Then, by introducing the occurrence and disappearance of clusters based on the birth–death (B–D) process, the space-time evolution of different clusters is described, and the influence of the addition of sensing clusters and the change in flight altitude on the B–D process is explored. Finally, the effects of the sensing cluster and flight altitude on the UAV ISAC channel characteristics, including the angle, time–varying characteristics, and sharing degree (SD), are analyzed. The related UAV ISAC channel characteristics analysis can provide reference for the future development of UAV ISAC systems.

1. Introduction

With the advancement of the 6th generation (6G) communication, new requirements are being set for integrated sensing and communication (ISAC) [1]. Sensing enhances communication accuracy by detecting surrounding objects and providing timely feedback on related environment information [2]. Unmanned aerial vehicle (UAV) communication, as a crucial application scenario of 6G [3,4], has attracted more attention and is widely used in many fields. The combination of UAV and ISAC can offer reliable communication support for future 6G emergency communication, including in mountainous areas, traffic scenarios, and rescue operations. However, technologies and theoretical models for UAV ISAC system remain immature. Thus, further study of the UAV ISAC channel characteristics analysis and modeling is needed.
In the existing literature, some channel measurement and modeling works for UAV and ISAC have been carried out respectively [5]. For UAV scenario, it was characterized by fast flight speeds, wide coverage, and complex channels. Thus, exploring unique UAV channel characteristics is essential [6]. In [7], air-to-ground (A2G) channel measurements in rural scenarios at various flight altitudes were analyzed. The results showed that the number of MPCs and the path loss exponential (PLE) in rural areas are related to UAV flight height. In [3], an efficient, accurate, and flexible A2G channel sounder was developed for 3.5 GHz measurements in campus scenarios, analyzing several channel characteristics. In [8], an Internet of Things (IoT)-integrated sensing, computing, and communication (ISCAC) model for UAVs was proposed. The UAVs sensed user equipment (UE) to obtain radar-detection information, which provides a reference for the UAV ISAC network.
In radio propagation, scatterers between the transmitter (Tx) and receiver (Rx) channels are manifested in clusters. For ISAC channel, the cluster-based modeling methods have been investigated. The effects of sensing clusters on communications, and the intra–cluster characteristics of ISAC channels have been further analyzed. In [9], a random channel model of the ISAC system based on shared clustering was proposed. The related channel measurements were conducted indoors at 28 GHz. Scatterers shared by communication and sensing channels were observed using power angular-delay profiles (PADPs), and a KPowerMeans-based joint clustering algorithm (KPM-JCA) was introduced to cluster shared and unshared scatterers. In [10], a three-dimensional (3D) geometry-based stochastic model (GBSM) with an extended ISAC channel model was proposed. This model described communication and sensing CIR as a combination of shared and unshared clusters. The parameter S was introduced to extract shared targets/scatterers and clusters. The sharing degree (SD) measures the power ratio of the shared cluster to the total cluster in both the communication channel and sensing channel. The SD increases with more shared clusters, which is an important performance index of the ISAC channel. The angular channel correlation for ISAC systems in vehicle-to-infrastructure (V2I) and vehicle-to-vehicle (V2V) scenarios, as well as urban and highway environments, was studied through ray-tracing simulations in [11]. Particle filtering was used to estimate scatterer positions in [12], with further analysis of related channel statistical properties. Although the above literature has studied the unique channel characteristics in UAV scenarios and ISAC scenarios, few articles have measured and modeled the channel in UAV ISAC scenarios. Therefore, an accurate channel model considering the unique characteristics of UAV ISAC channel is required.
To address these issues, this paper studies the ISAC channel characteristics in UAV scenarios. This article’s innovations are as follows:
(1)
The UAV-to-ground ISAC channel datasets at the heights of 20 m and 30 m are constructed. Based on the acquired channel data, the optimal cluster number is selected by a combined index. The number of clusters can vary according to the complexity of the scene, which provides a reference for the subsequent evolution of clusters.
(2)
A 3D automatic tracking algorithm for UAV ISAC channels is proposed, which can reflect the B–D process of clusters. It is found that in the B–D process of clusters, the number of clusters is distributed around the optimal number. By fitting the survival time of the cluster, the effects of flight altitude and the addition of sensing clusters on the channel characteristics are investigated.
(3)
The impact of height variation on the channel delay characteristics, angle characteristics, and SD is investigated, and the influence of the addition of a sensing channel on channel characteristics is analyzed. It is found that the increase in the flight altitude makes the angle and delay characteristics in the cluster more concentrated, and the SD decreases. Furthermore, the pervasive channel simulator is used to verify the validity of the results.
The remainder of this paper is outlined as follows. In Section 2, the network architecture of the UAV ISAC channel is introduced. In Section 3, the clustering and automatic tracking algorithms are introduced, and the B–D process of the cluster is depicted. Then, the time–varying characteristics of the intra– and inter-cluster characteristics are analyzed and an ISAC channel model for UAV communication based on the B–D process is established in Section 4.

2. Network Architecture of UAV ISAC Communications

In the UAV-to-ground ISAC system, the UAV is equipped with a Tx and a sensing receiving antenna R x S . The Tx communicates with the ground communication receiving antenna R x C . As a sensing end, the R x S detects and locates ground objects by receiving reflected echo signals. Due to their higher flight altitude, UAVs detect a wider range and more complex environments. Parameters such as delay, azimuth angle of departure (AAoD), and elevation angle of departure (EAoD) determine the position of the first shot scatterer and are crucial for the channel model [13]. Figure 1 illustrates the proposed UAV ISAC channel model and describes the clustering and evolution of MPCs in the UAV-to-ground communication.
Due to the positional limitation of the R x C , the signal reception at the communication end is restricted. In contrast, with fewer limitations, the R x S can detect a broader range of objects. The addition of the sensing end makes the degree of object detection more accurate. Therefore, adding the sensing end improves both the sensing accuracy and range of the communication system. To explore the influence of adding the sensing end on the channel, this paper examines the channel characteristics of sensing clusters, communication clusters, shared clusters, and joint clusters from the perspectives of clustering and cluster evolution. According to [9], the shared clusters arise from both communication and sensing paths. Thus, the combination of these paths is defined as joint clusters. MPCs with similar channel characteristics, such as angles, are termed shared clusters. As the UAV flies, some of the scatterers will gradually disappear, and some new scatterers will be generated. The cluster that disappears is called the dead cluster, and the cluster that appears becomes the new cluster. Therefore, for UAV ISAC channel, the modeling of space-time evolution which can mimic the birth and death processes of clusters are essential.

3. Joint Clustering and Tracking for UAV ISAC Channels

3.1. RT-Based UAV ISAC Channel Database

Ray Tracing (RT) is capable of tracing rays corresponding to various propagation mechanisms, including reflection, scattering, and diffraction phenomena, and is validated through extensive measurements. Multiple attributes of each ray can be outputted from the RT results, such as ray position, arrival time, power, and various angles [14]. The channel propagation scenarios were constructed using the Wireless InSite [15].
The simulation is conducted in the Software Park Campus of Shandong University in Jinan, China. This area represents a typical campus environment with buildings that typically reach up to 5 floors, and average building heights and road widths of 15 m and 10 m, respectively. The test area also includes trees and grasslands, with tree heights ranging realistically from 3 to 10 m and grass height at 0.2 m. The flight heights of the UAV are set at 20 m and 30 m respectively. The UAV, equipped with both a Tx and a Rx, is placed in nearly identical positions to form an echo channel. This setup simulates the process of acquiring target information through the channel [16]. Both the Tx and the Rx use omnidirectional antennas to comprehensively perceive their surroundings. The flight path of the UAV, depicted in Figure 2a, covers a considerable distance and included a diverse range of building types along its route. The height of the ground-based receiving end is set at 2 m, utilizing the omnidirectional antenna as well. In RT simulations, the accurate calculation of reflected and scattered rays depends on precise electromagnetic and scattering materials parameters. Therefore, obtaining accurate parameters is an important step in the proposed example [17]. The simulation scenario is shown in Figure 2b, and the simulation details and parameter settings are shown in Table 1.

3.2. Clustering under Combined Indicators

Clustering MPCs based on multiple features aids in further analyzing intra-cluster characteristics. Traditional clustering algorithms effectively capture channel similarities but fail to fully integrate communication and sensing channels. To address this issue, a joint clustering algorithm based on a KPM-JCA is adopted [9]. Based on the traditional K-means algorithm, the KPM-JCA uses the MCD and the distances are weighted by the powers of the MPCs. In order to improve the accuracy of clustering and ensure the diversity of selected parameters, new parameters are added on the basis of traditional two-dimensional clustering. The delay, EAoD, and AAoD are used to implement channel clustering. Given the varying sizes of raw channel data, the delay is normalized to nanoseconds (ns) and scaled to [0, 360] before clustering. Data from communication and sensing scenarios are combined into joint paths. Shared clusters are defined as those sharing similar parameters (like EAoD and AAoD) between communication and sensing channels. Additionally clustering joint clusters, this algorithm can find shared clusters in joint clusters and classify them.
For clustering performance evaluation, Davies–Bouldin (DB) and Calinski–Harabaz (CH) are two well-known metrics [18,19]. Lower values of the DB indicator indicate closer paths within clusters, while higher values of the CH indicator indicate more separation between clusters. To determine the optimal number of clusters, a method considering both DB and CH indexes [9] is used to automatically evaluate and select the best number of clusters. The combined index Δ * is calculated as
Δ * = a r g m a x 1 2 · [ m i n ( κ D B ) κ D B + κ C H m a x ( κ C H ) ]
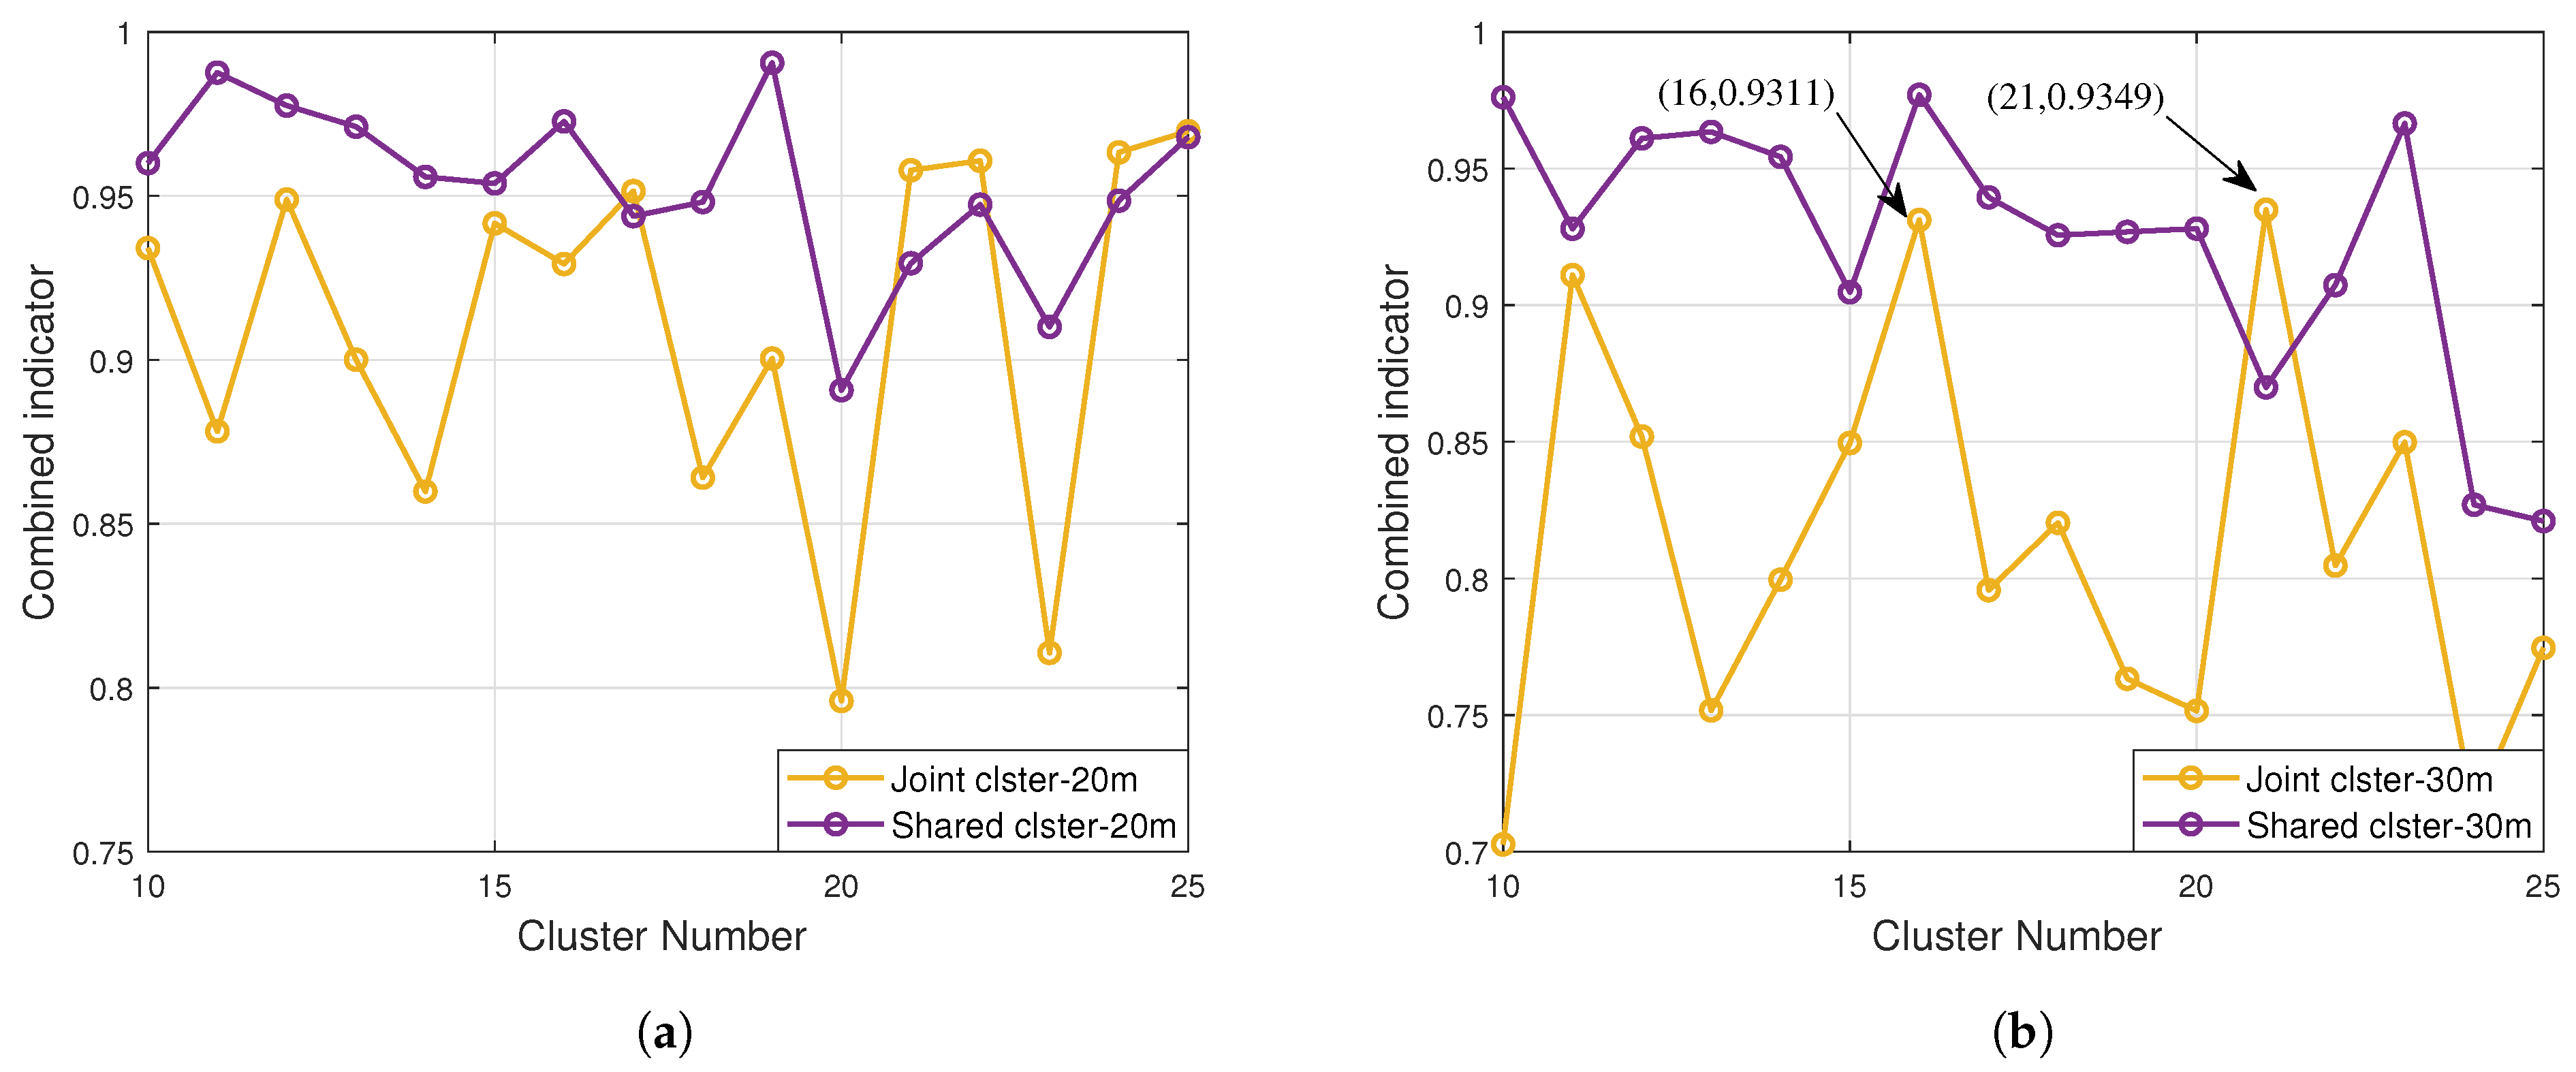
where κ D B and κ C H represent the DB and CH values for clustering with Δ-th clusters, respectively. The m i n ( κ D B ) and m a x ( κ C H ) denote their optimal values. The combined index ranges from [ 0 ,   1 ] with higher values indicating better clustering effectiveness. Referring to the relationship between the scene and the number of clusters in [9,20], the number of clusters is chosen to be in the range of (10, 25). The quantified results of the simulation channel, obtained by applying Equation (1), are shown in Figure 3. At the height of 20 m, when Δ * = 25 and 19, the combined indicator reaches its optimal value for joint and shared clusters. At 30 m height, the optimal numbers are 21 for joint clusters and 16 for shared clusters.
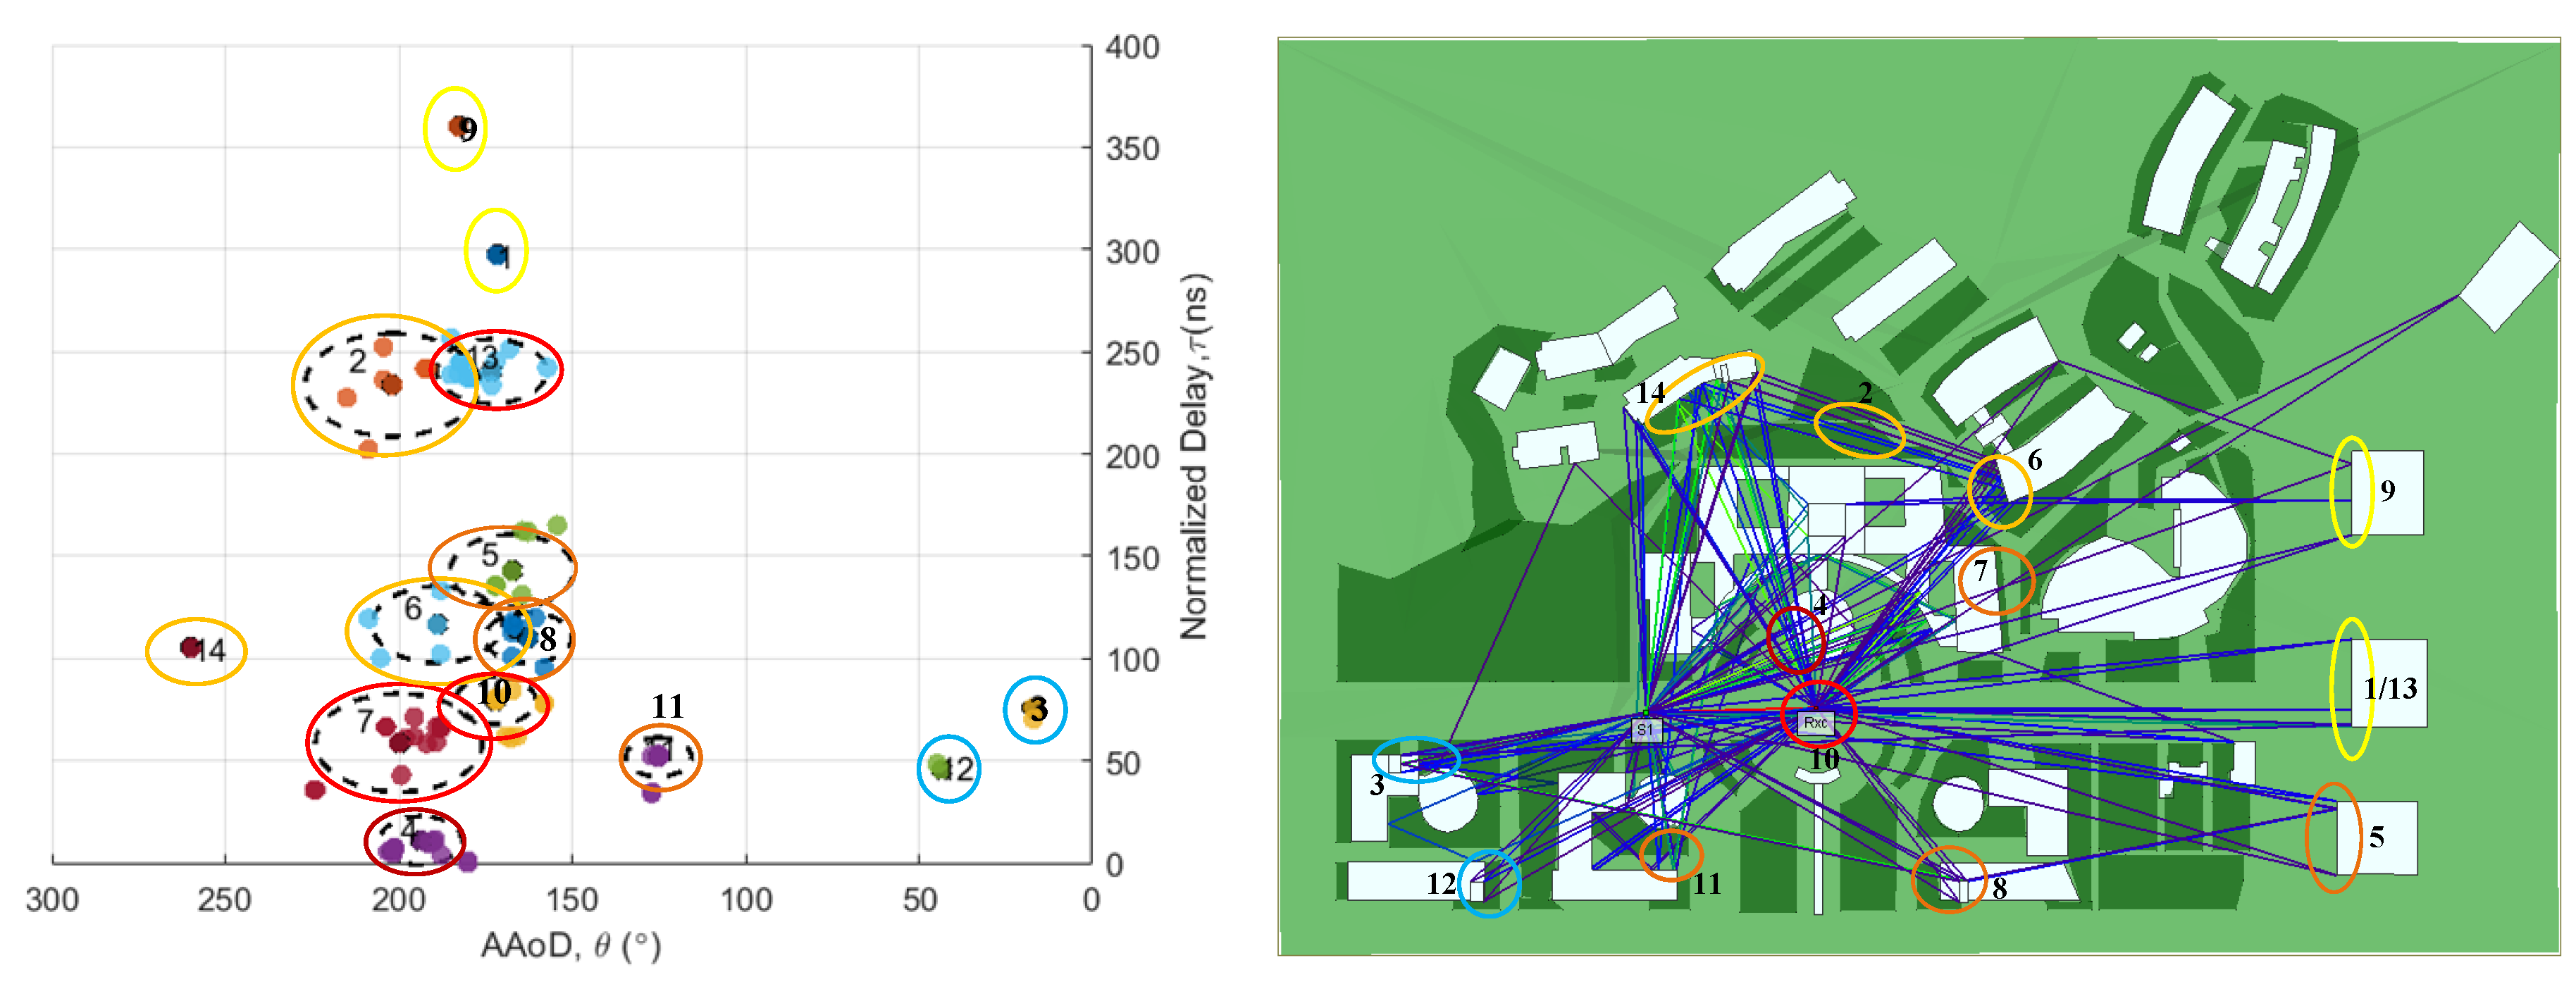
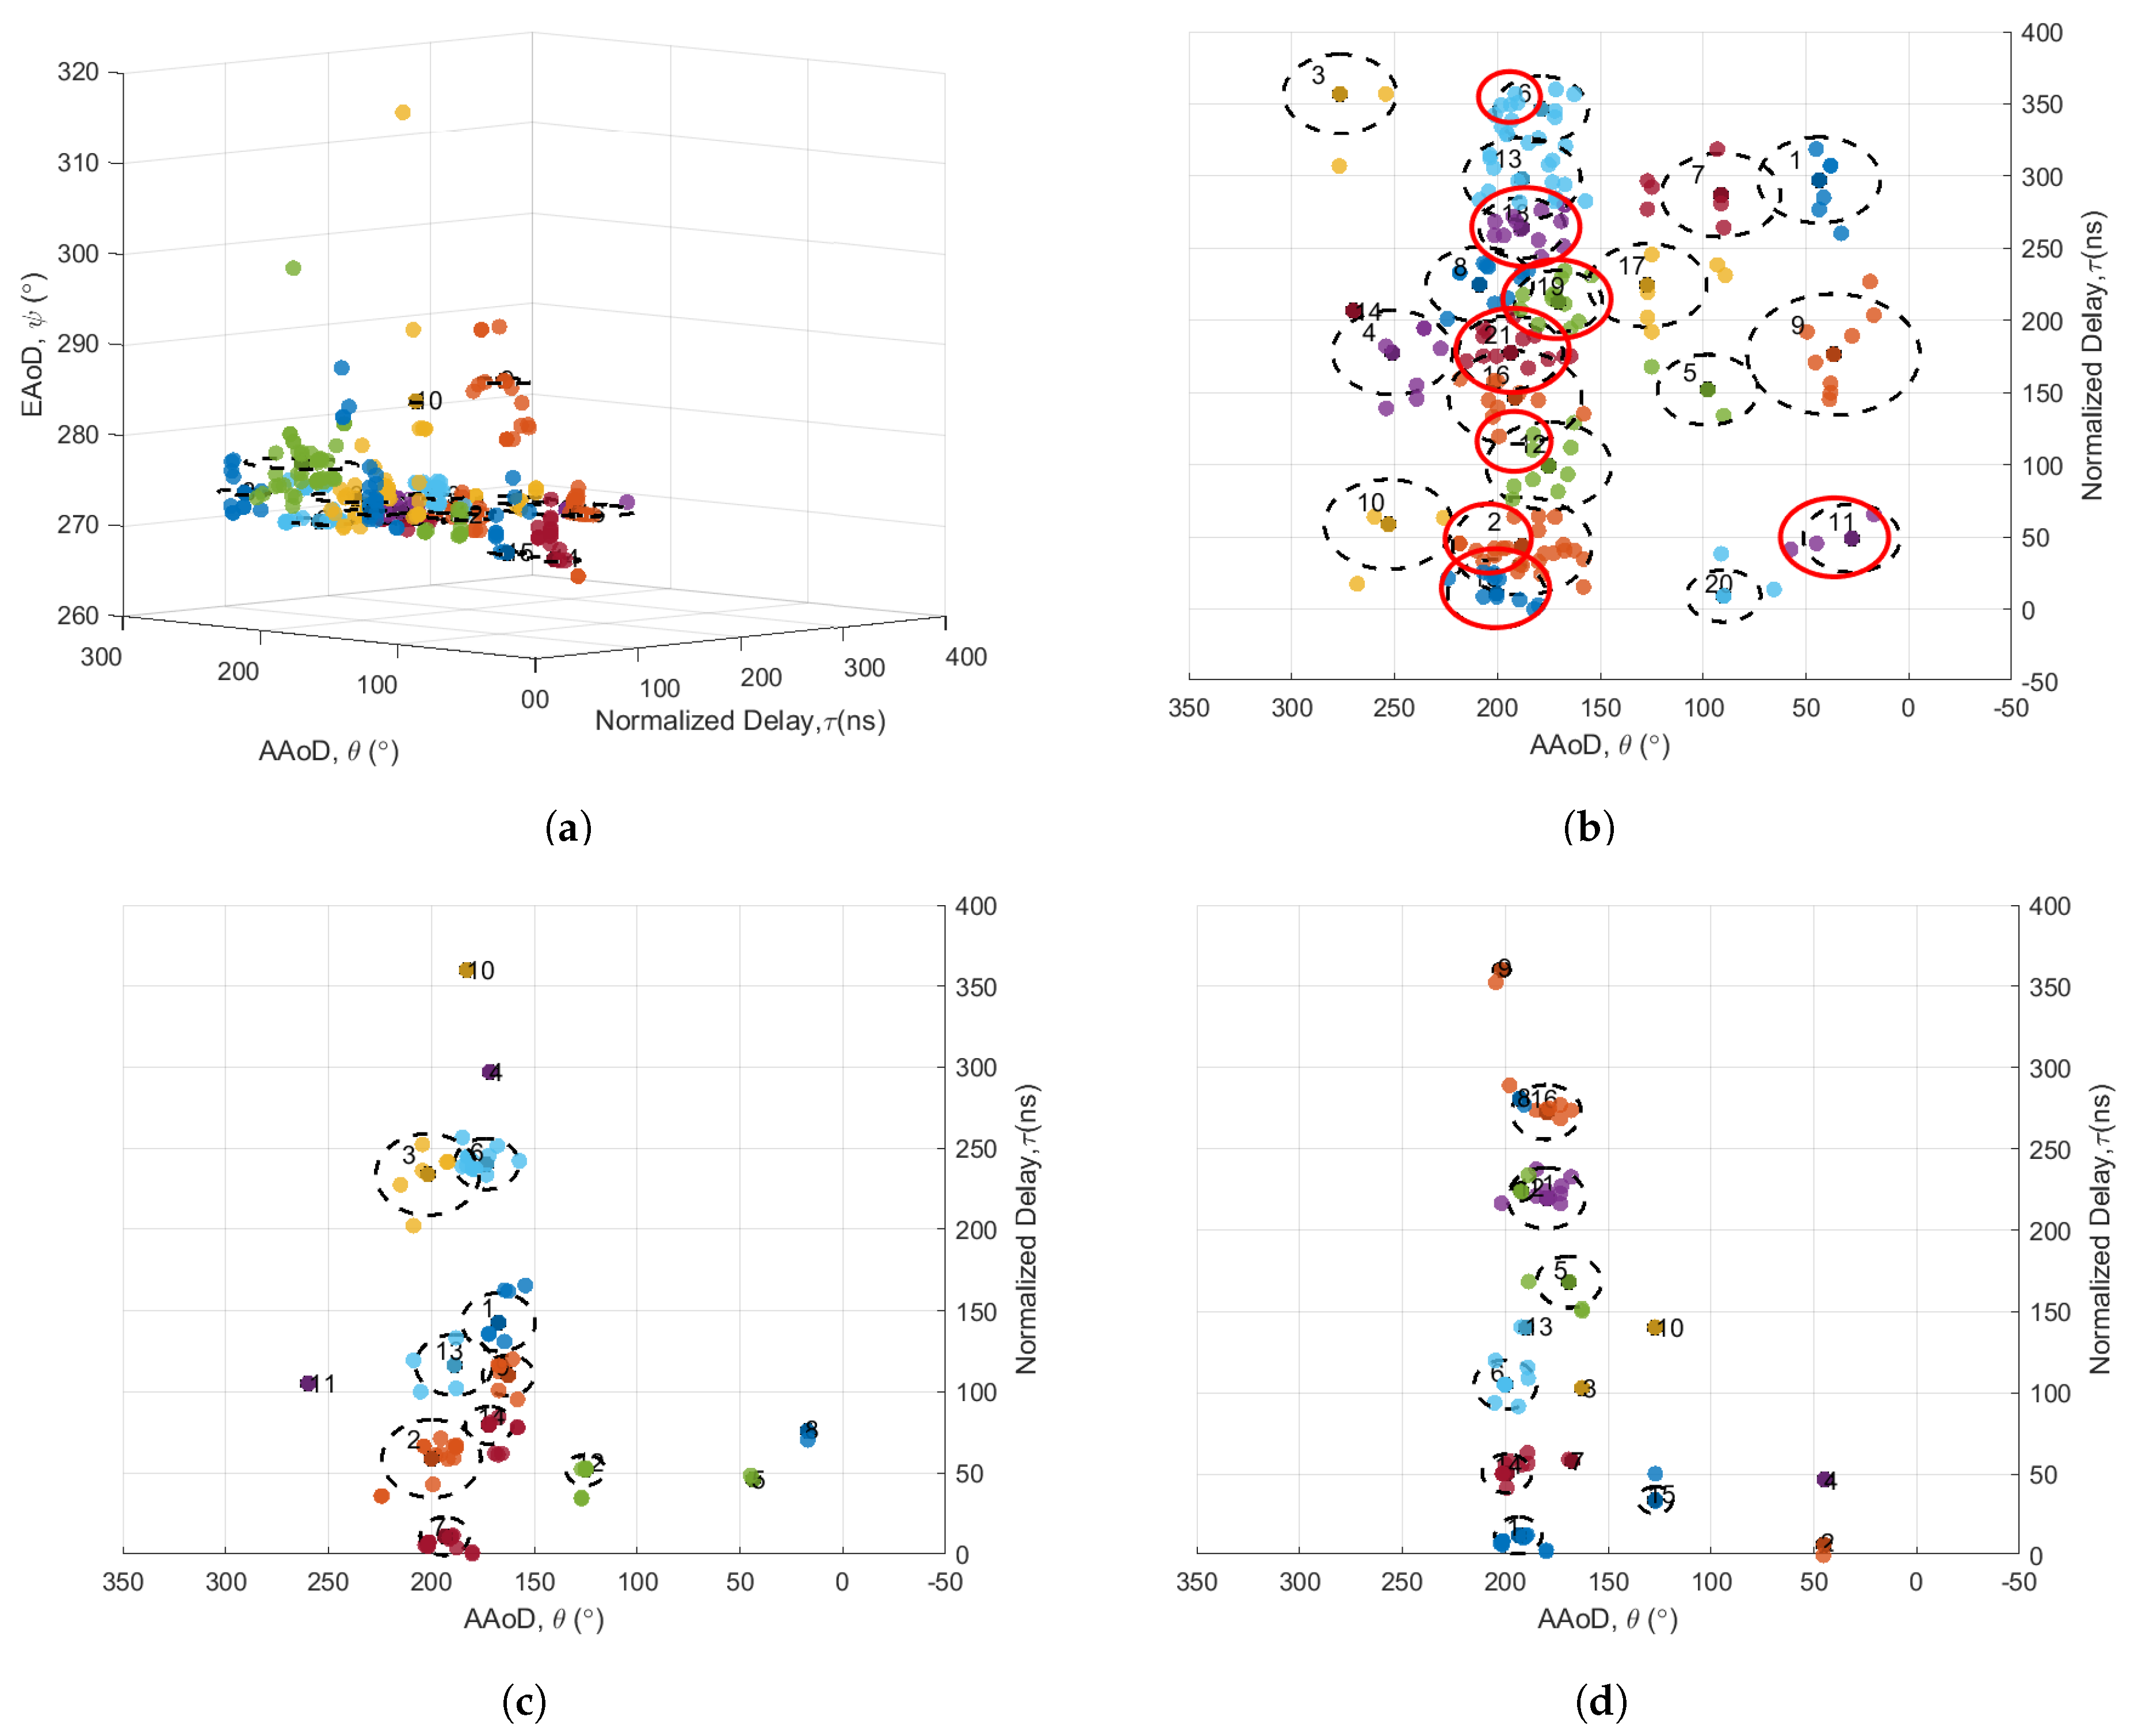
The matching diagram between the clustering results and the simulation scene is shown in Figure 4. The cluster diagram corresponds to the sequence numbers of the buildings in the simulation diagram. The communication cluster at a height of 30 m is taken as an example. It can be seen that most of the clustered paths are divided into one scatterer. Most of the detected buildings in the figure are divided into one or two scatterers. The angle and delay characteristics of the first jump are selected in the calculation. Therefore, only the scatterer of the first jump is detected. Figure 5a shows the clustering results. To better observe the distribution of clusters, the clustering results are shown from a vertical angle. Figure 5 displays the distribution of joint clusters, shared clusters, and communication clusters. For ease of observation, different clusters are represented by different colors. Because of the randomness of K-means algorithm, there is no necessary relation between the sequence numbers of clusters. The shared part of the joint cluster is represented by a red circle in Figure 5b. It can be seen from the figure that the shared cluster is part of the joint cluster. All the shared scatterers can be found in the joint cluster.

3.3. 3D Automatic Tracking Algorithm

To evaluate and analyze the dynamic characteristics of UAV-to-ground sensing channels, the evolution features of MPCs need to be characterized. The B–D process of the clusters reflects the spatial changes of the UAV channel during motion. As the UAV moves, the power of different clusters changes. Some clusters may appear or disappear. The B–D process thus indicates the non-stationary properties of these clusters. For the unique characteristics of ISAC channels, joint and shared clusters are tracked. During this tracking, some clusters may appear and disappear rapidly. In such cases, a reassignment process is used to accurately track dynamic clusters in time-varying channels. An automated tracking approach is employed, which is divided into two steps:
Step 1: Calculate the MCD between current and previous cluster centroids and assign the closest MCD to each point with the same cluster ID as the previous time. At this point, all paths in current time inherit from the previous time, but further investigation into inheritance conditions is necessary. The MCD calculation formula between two paths is
M C D k , j = ( M C D k , j τ ) 2 + ( M C D k , j E A O D ) 2 + ( M C D k , j A A O D ) 2
where j is the snapshot at the j-th time and k is the center of mass of the k-th cluster. In order to avoid the same effect of high power and low power on MPCs, the power is added to the centroid calculation, and the weighted centroid C k ( j ) is
C k ( j ) = j m k ( j ) P j · p j j m k ( j ) P j
where p j is the coordinates of the scatterer in cluster k at time j, and P j is the power of the scattering point in cluster k.
Step 2: Based on the clustering results of Step 1, two thresholds are defined to further classify the IDs of clusters. η 1 is the maximum radius of each cluster, that is, the maximum MCDs from the point in each cluster to the center of mass of the cluster.
η 1 = m a x ( M C D k , j 1 )
where j 1 is the dataset of the previous time, and η 2 is the minimum volume density per cluster, i.e., the minimum number of scatterers per unit volume of each cluster.
η 2 = m i n ( n u m b e r ( k ) 4 3 × [ M C D k , j 1 ] 3 )
In the k-th cluster, the number of scatterers is denoted as number k, and MCD represents the dataset at time j 1 .
Next, cluster IDs are determined based on η 1 and η 2 . For η 1 , if the current data point’s distance from the cluster center D m i n exceeds the maximum boundary, a new ID is assigned to this scatter point. However, this ID is defined as a new cluster only if the number of monitored points N n e w in this ID exceeds ξ . Otherwise, these points are treated as noise and removed. The η 2 is used to validate new clusters. If the density of a new cluster is less than η 2 , there may be a local centralized distribution of MPCs. Therefore, the density-based spatial clustering of applications with noise (DBSCAN) algorithm with noise [21] should be used for re-clustering all MPCs in the cluster. Then, the index of each MPC should be reassigned based on the clustering results.
In this algorithm, the current-time clusters’ IDs are inherited from previous-time clusters. New clusters are assigned new IDs, while IDs that are not inherited represent the death of a cluster. The line of sight (LoS) components are divided into separate rays and therefore are not divided into clusters. The B–D process of clusters is tracked by this algorithm, and the flowchart of the algorithm is depicted in Figure 6.

4. Simulation and Evolution Results Analysis

4.1. Inter-Cluster Characterization

The clustering index of each MPC and the total number of clusters can be obtained by the automatic tracking algorithm. Further calculations based on these allow the characteristics within the clusters to be obtained. The specifics are as follows.

4.1.1. Clustering and Evolution Results

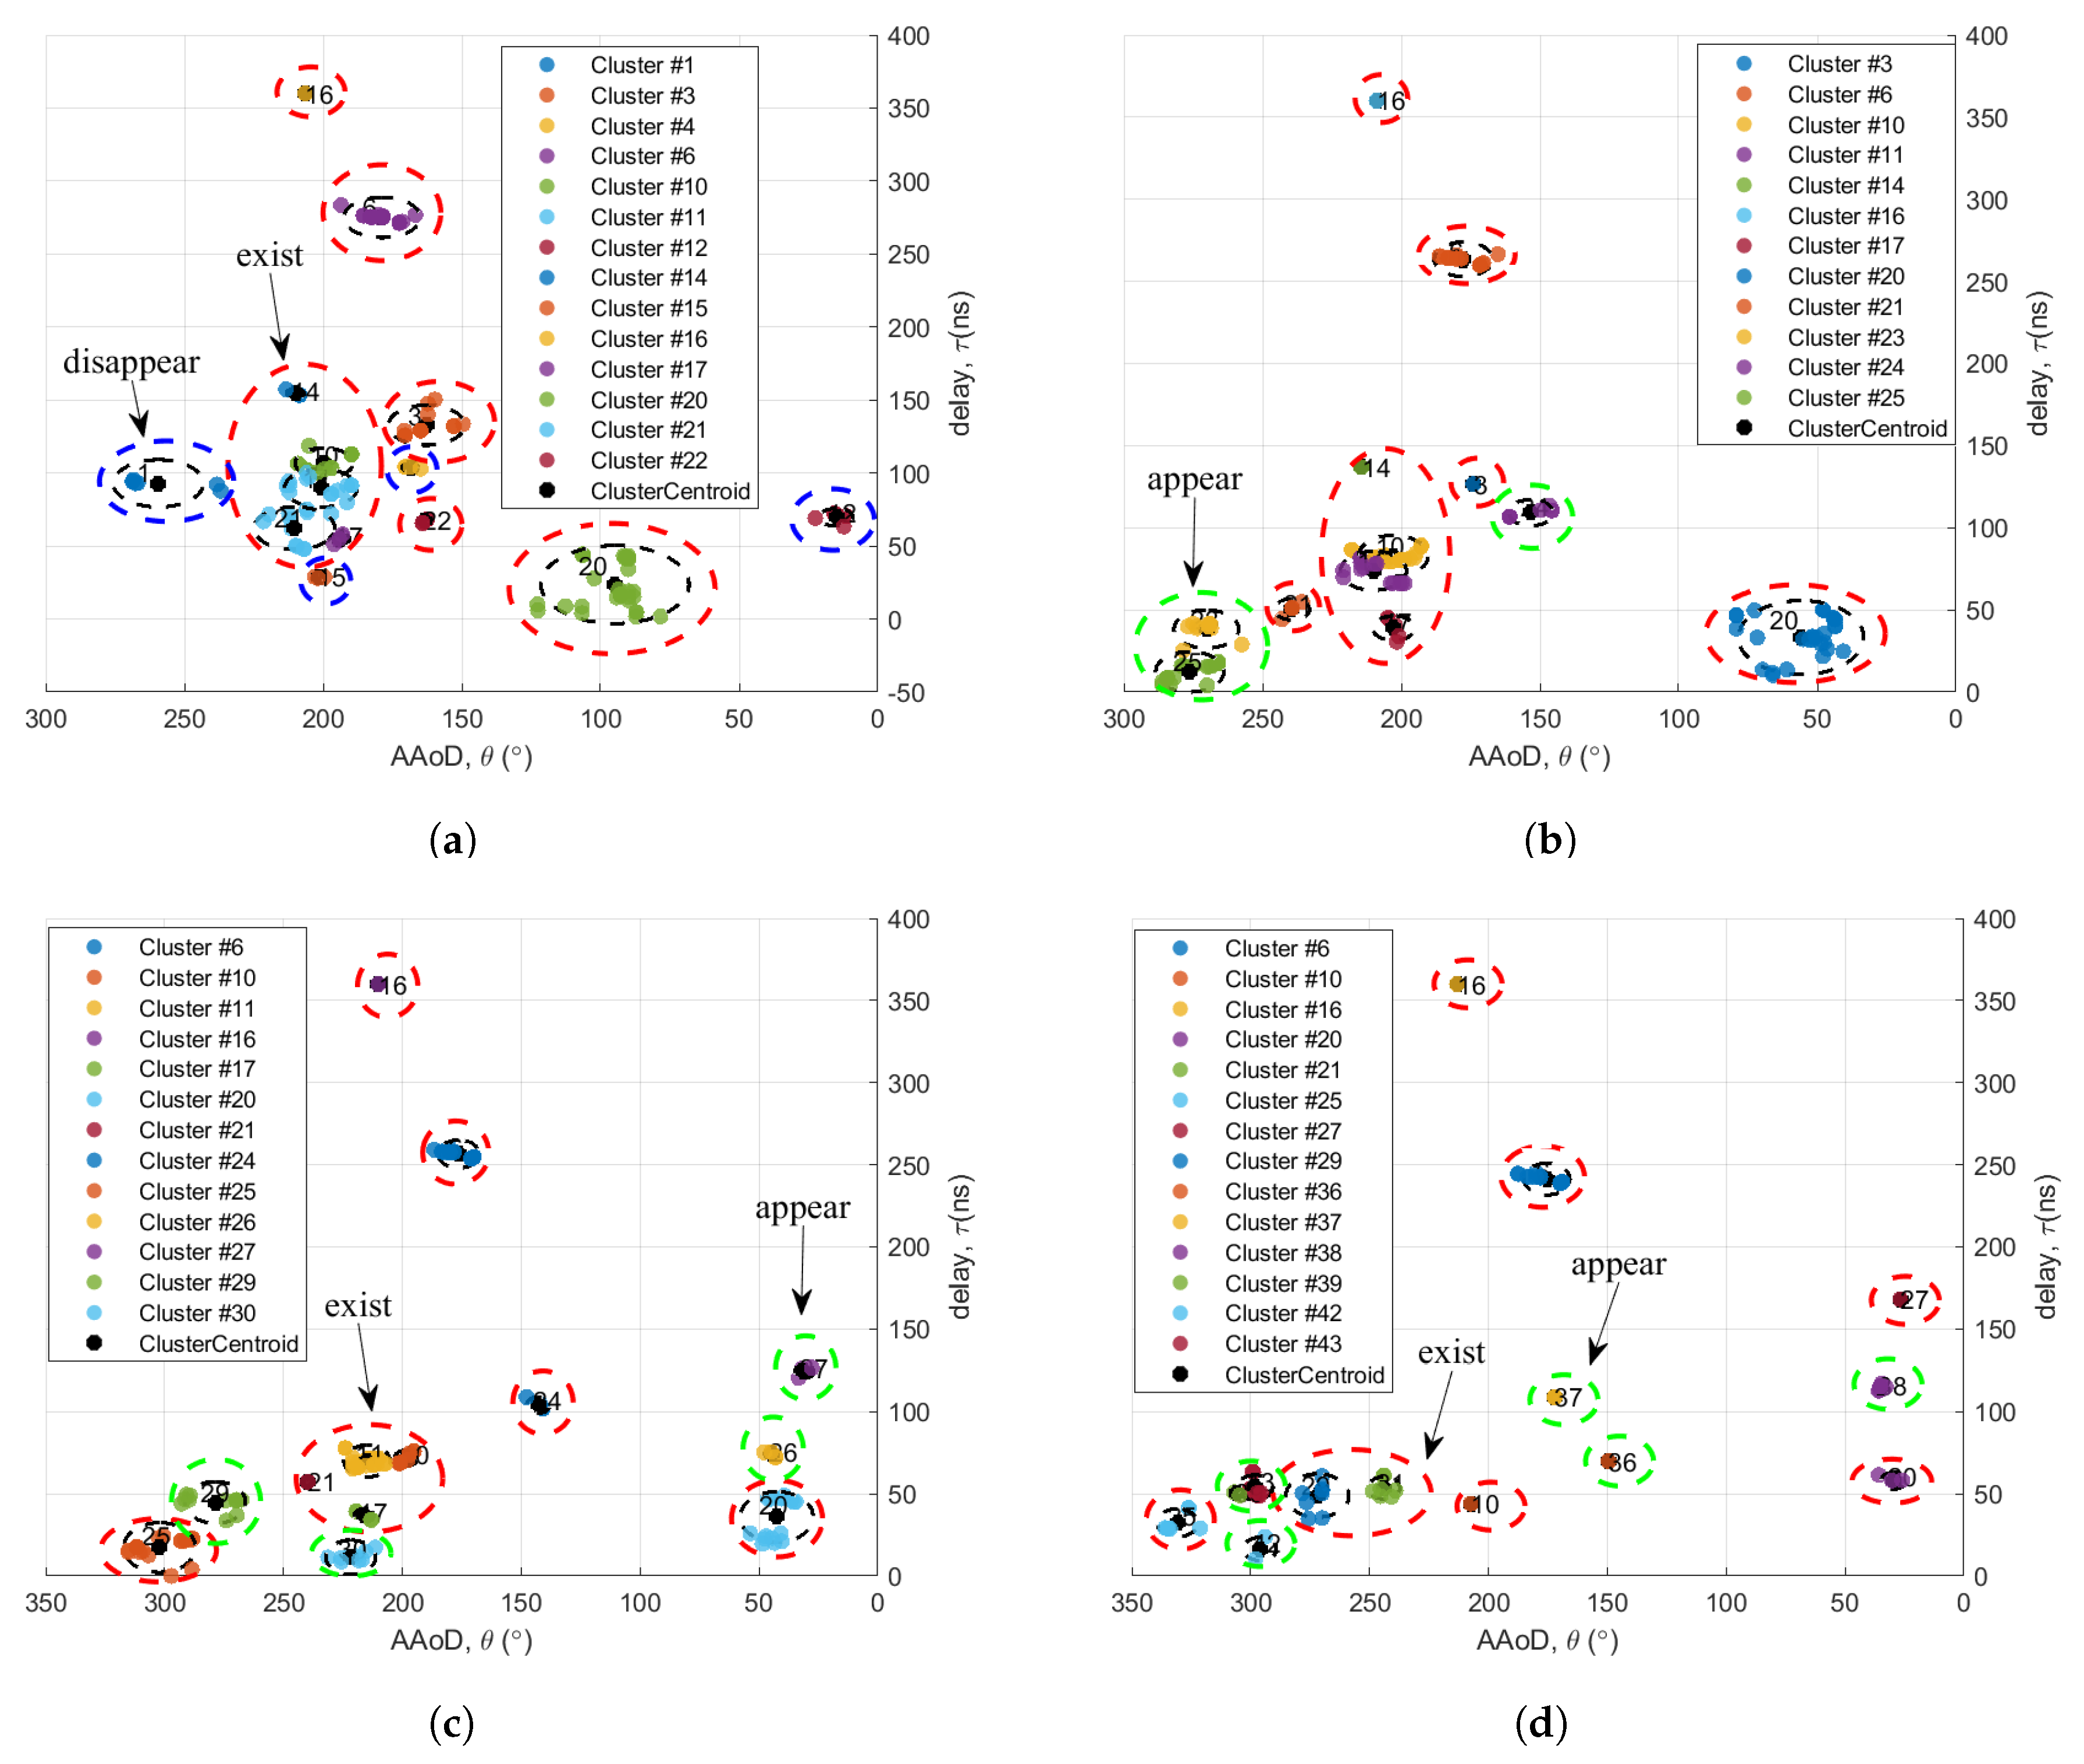
Throughout the entire flight path, 100 snapshots are taken. The total flight distance is 150 m. The total flight time is 10 s. The algorithm in Section 2 is used to track the B–D process of clusters for 100 snapshots. The distribution of the first snapshot clusters is shown in Figure 4 and Figure 5. Taking the communication clusters at the height of 30 m as an example, the B–D conditions of the clusters in the snapshots 20, 30, 40 and 50 are analyzed. Clusters are represented by circles of different colors with the colors assigned by sequential cluster IDs to clearly show the evolution. MPCs considered as noise in each snapshot are removed from the results. In Figure 7, the red dashed circles represent existing clusters, the blue circles indicate disappeared clusters, and the green circles denote newly generated clusters, all of which are compared to the preceding image. During the UAV flight, some clusters disappear, while new ones emerge. Characteristics such as the angle and delay of the clusters changed; for instance, due to the proximity of the Tx and the Rx, the delay of some clusters gradually decreases. Changes in building positions also impact the delay characteristics.

4.1.2. The Lifetime of the Cluster

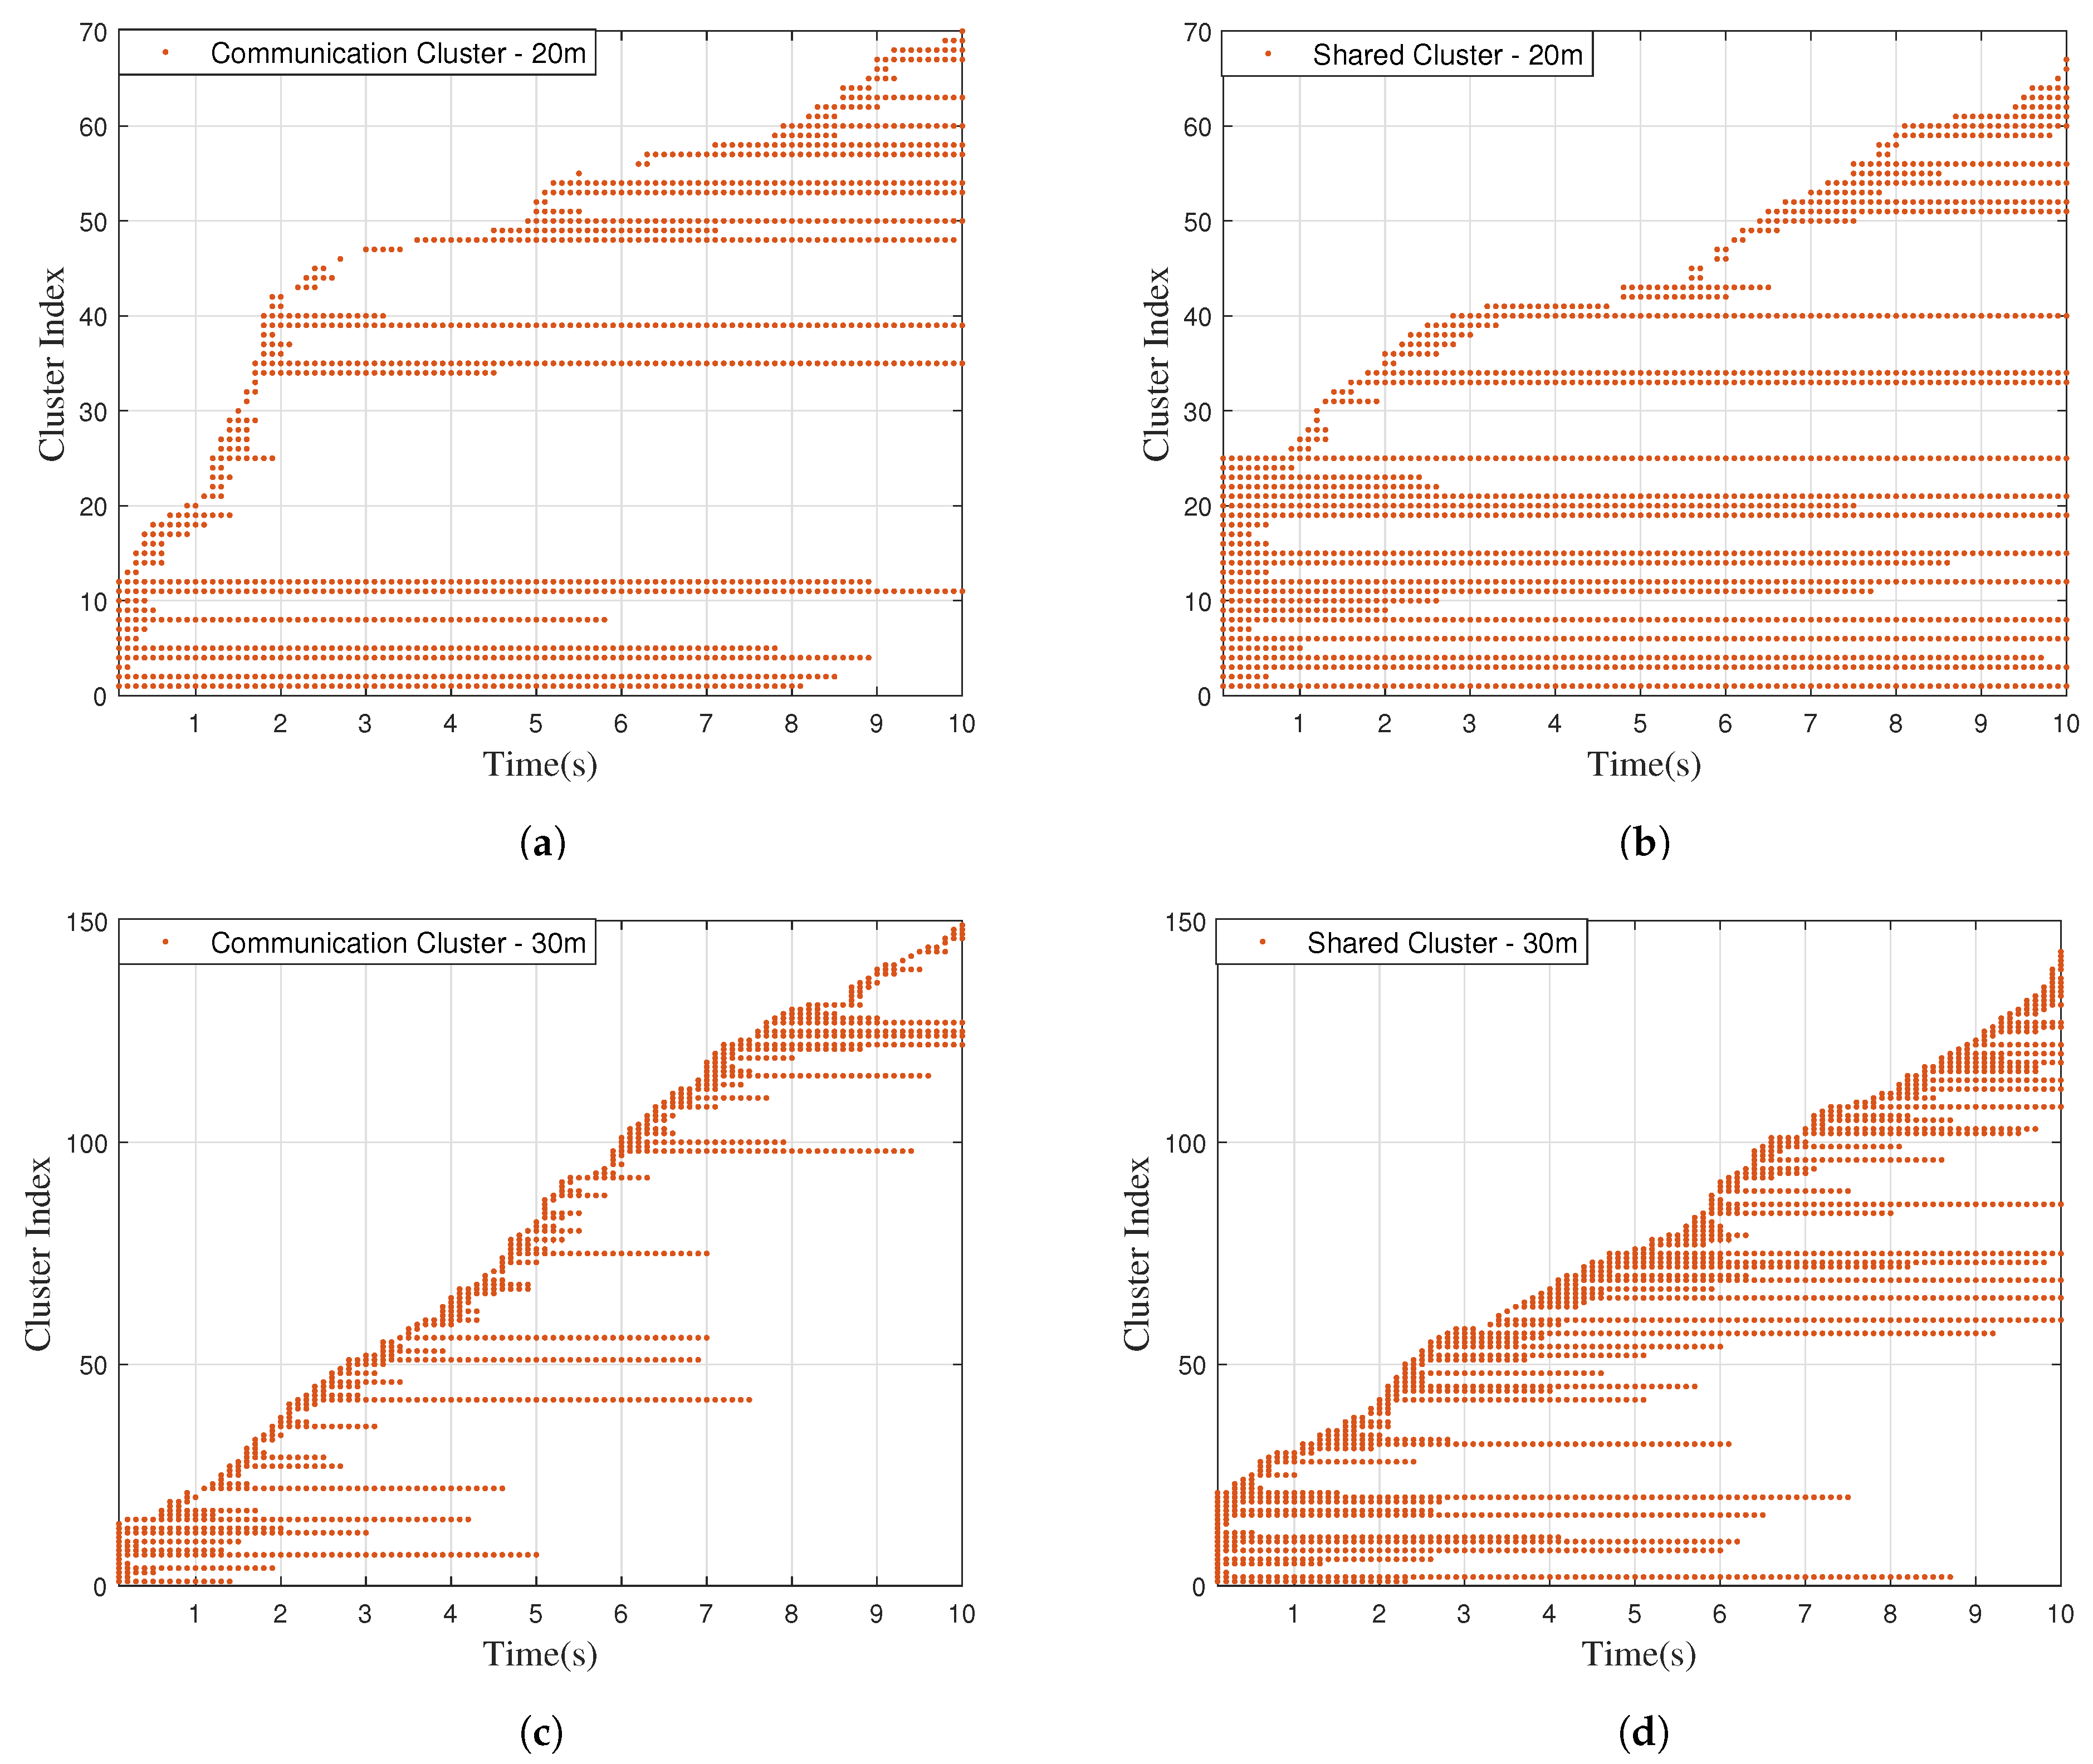
The high maneuverability of the UAV during flight results in the fast time-varying characteristics of the channel. As a result, clusters experience the B–D phenomenon. Figure 8 shows the cluster tracking results when the flight time of the UAV is 10 s. The new cluster index is assigned to the new cluster, and the old cluster inherits the cluster index of the previous cluster [22]. Many clusters exist for only one time period, and there is an obvious B–D phenomenon. Additionally, numerous clusters appear solely in static regions and are not consistently monitored. Throughout the entire flight path, at a height of 20 m, the number of communication and shared cluster IDs is 70. At 30 m, this number rises to 150. The x-axis represents the duration of each cluster’s existence.
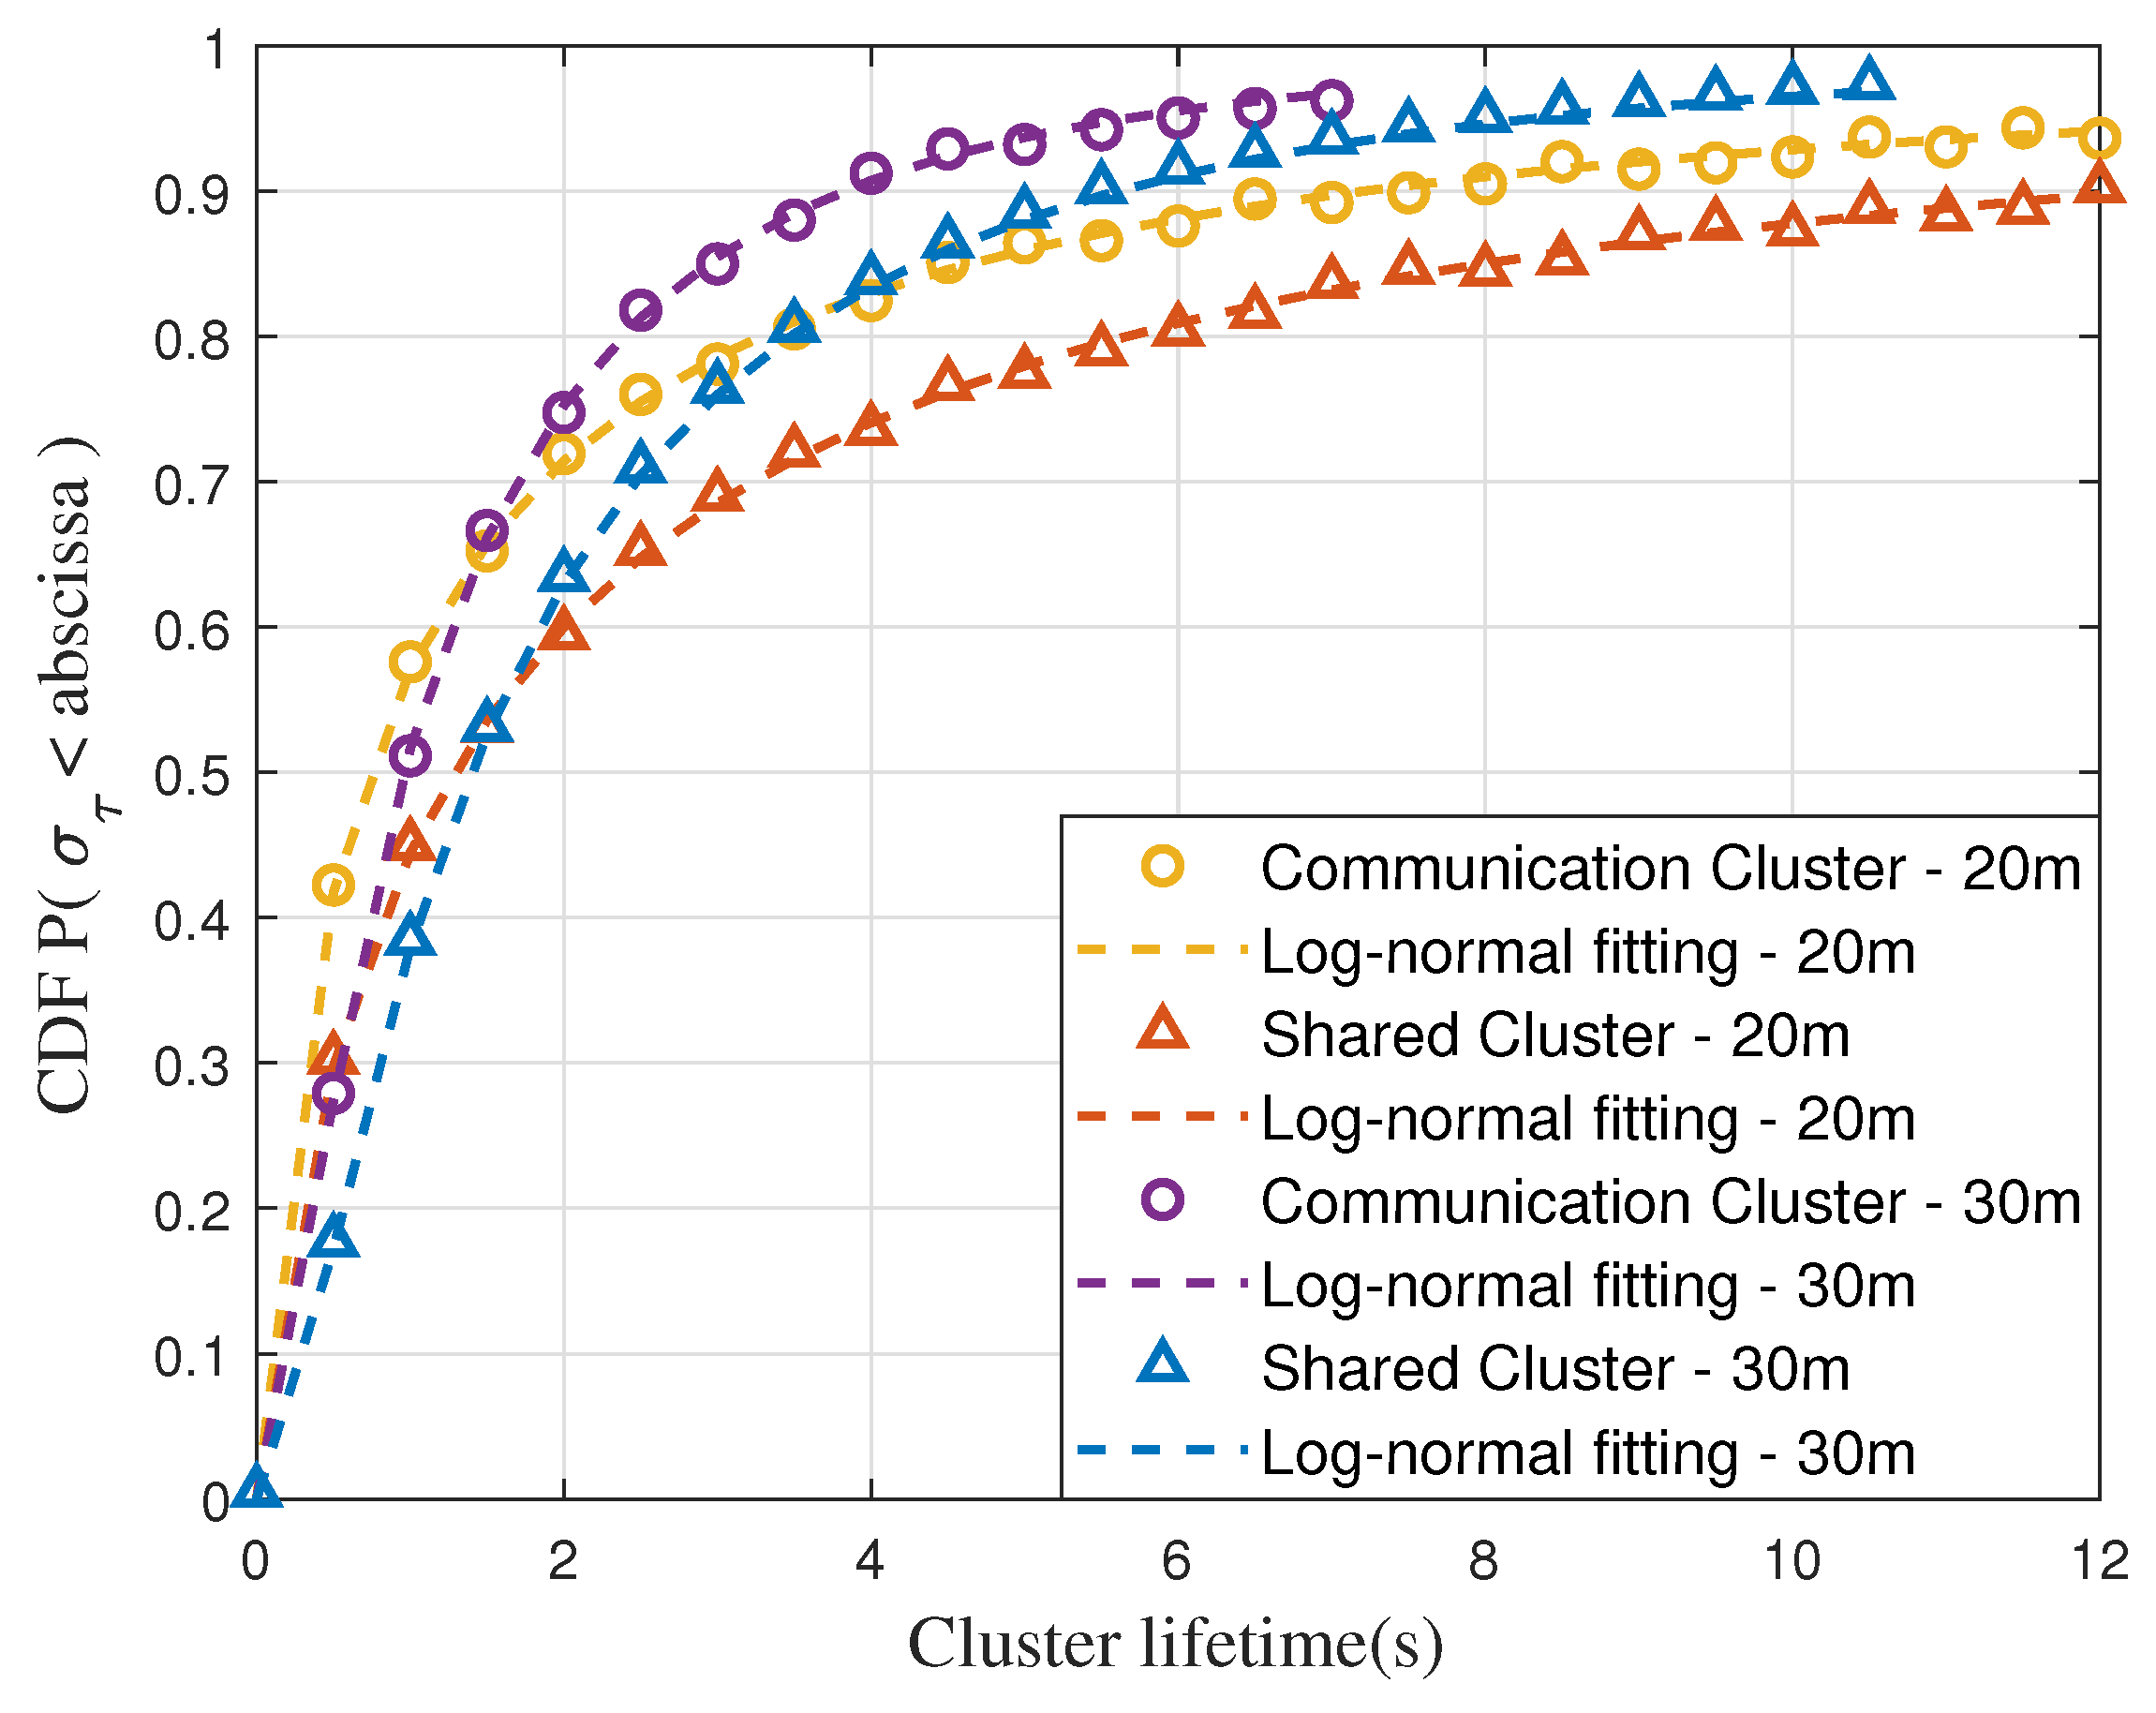
The cumulative distribution function (CDF) of the cluster survival time at various flight altitudes is illustrated in Figure 9. Log-normal distribution is employed to model these data. The fitting parameters are presented in Table 2. At 80%, it is evident that the survival time of the communication cluster is shorter, while the survival time of the shared cluster is longer at the same flight altitude. This occurs because the addition of sensing clusters increases the number of paths within the clusters, thus enhancing the stability of associative clusters. At different flight altitudes, the survival time decreases as the altitude increases. This is due to the increased monitoring range of the UAV, which reduces paths within the cluster and diminishes stability. Figure 8 further reveals that although sensing clusters influence the survival time at the same height, the total cluster index is only affected by the flight altitude. The cluster index remains constant at the same altitude. The B–D processes of clusters are thus influenced by both communication mode and flight altitude.

4.1.3. Number of Clusters

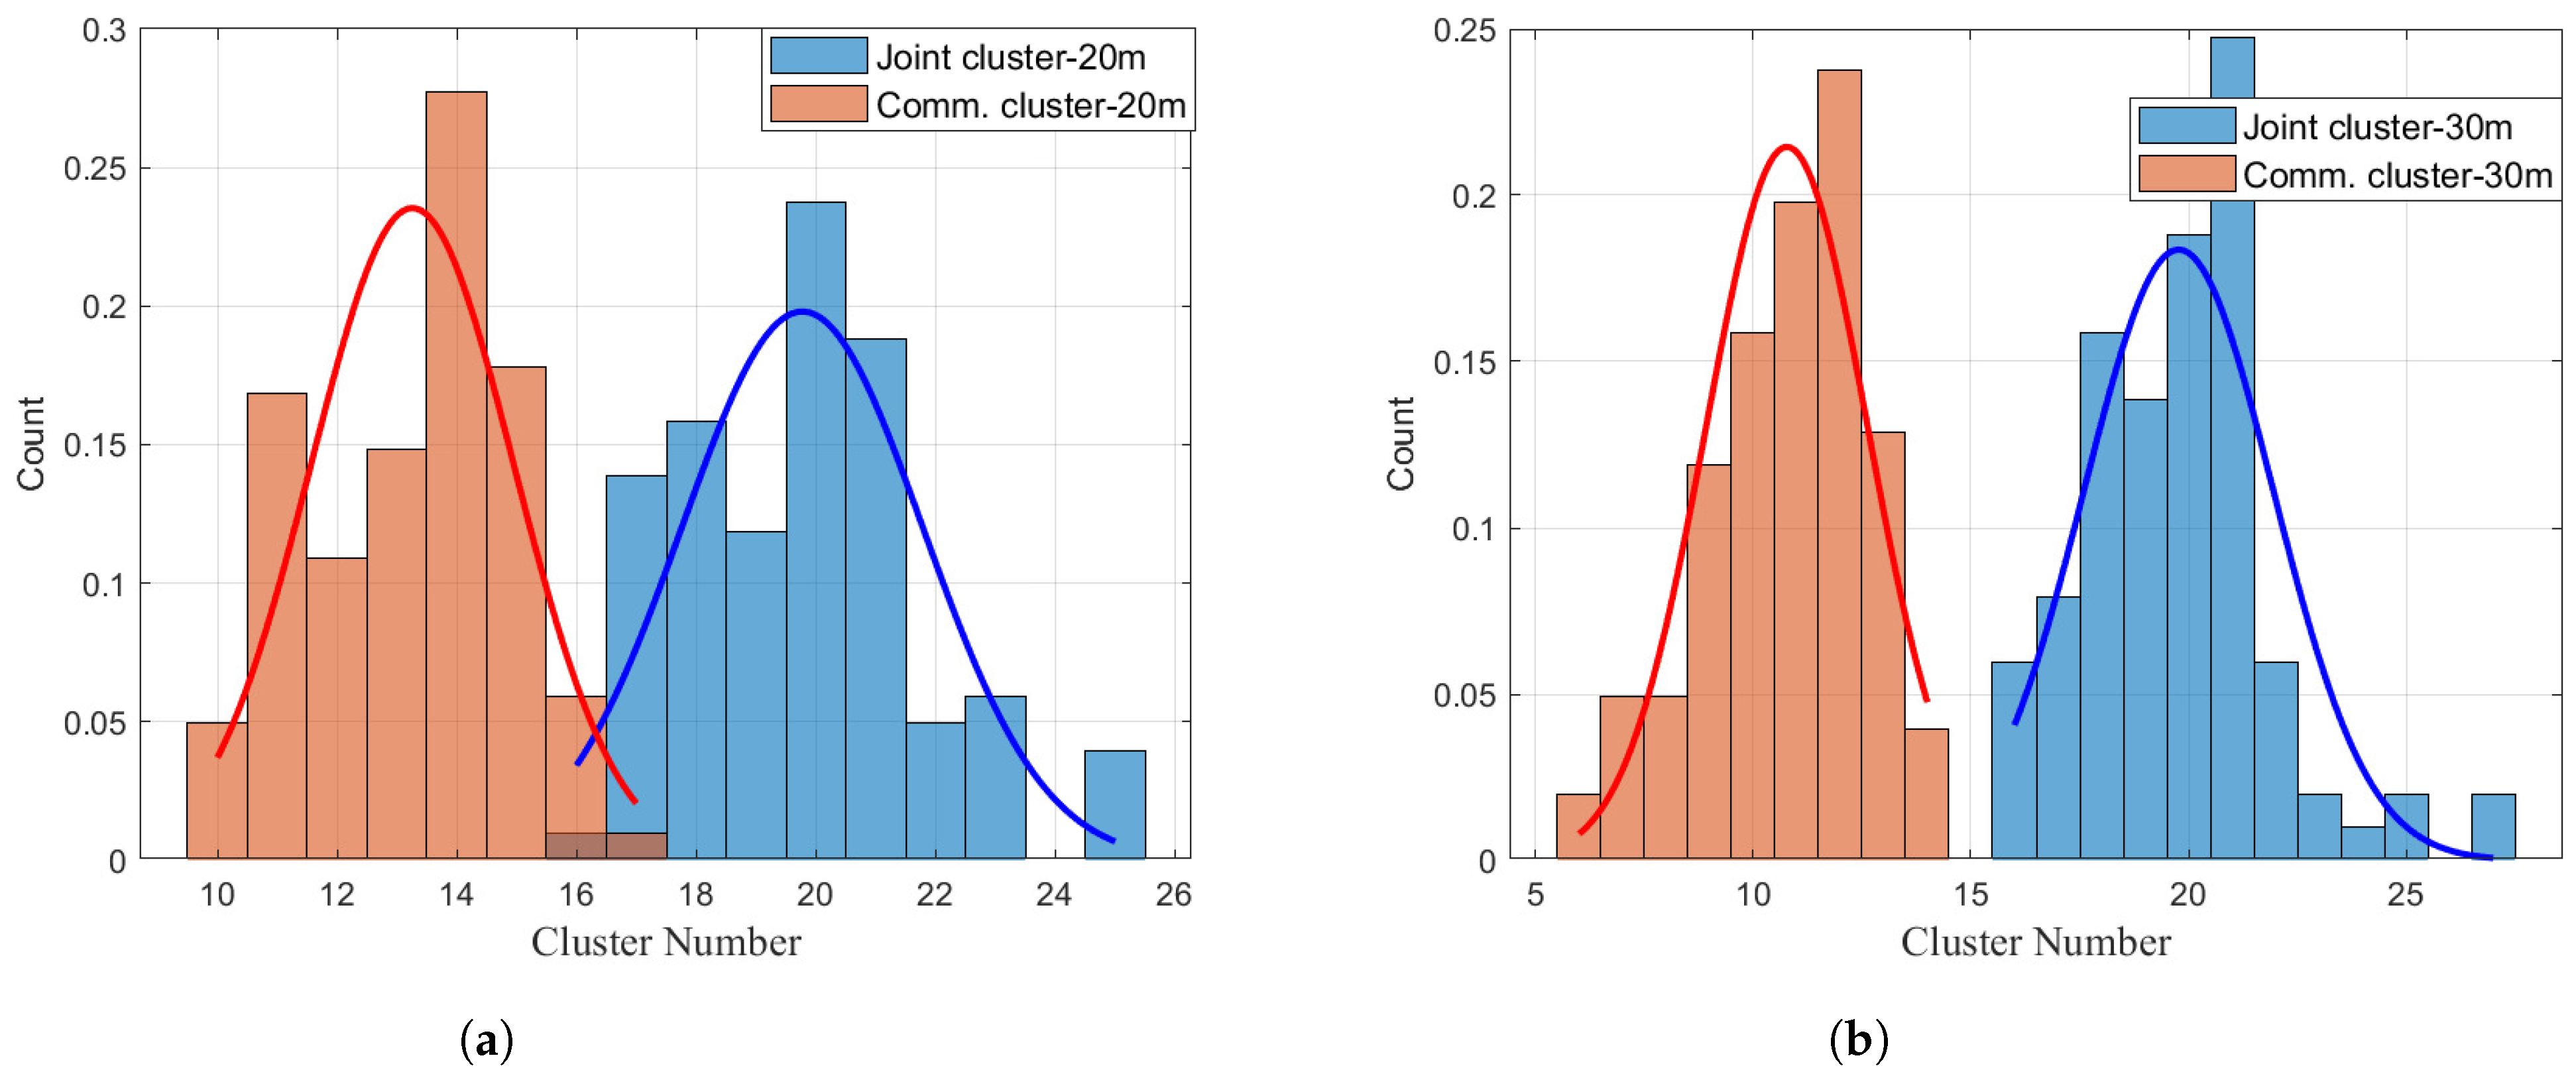
The number of clusters indicates the density of clusters in the UAV ISAC. Figure 10 displays the number of clusters throughout the B–D process at heights of 20 m and 30 m. At 20 m, the probability is highest when the number of communication clusters is 14, while for joint clusters, it is 20. At 30 m, when the number of clusters is 12, the probability is highest, and for joint clusters, it is 21. The concentration of the cluster number distribution reveals that the number of clusters effectively reflects the number of surrounding scatterers in the B–D process of clusters.

4.2. Intra-Cluster Characterization

In the third section, we explored the influence of the addition of a sensing cluster and the change of flight altitude on the channel B–D process. In this section, we explore the influence of the addition of a sensing cluster and the change of flight altitude on the characteristics of the cluster. In [9], it has been proved that the addition of a sensing cluster changes the in-cluster angle and delay characteristics of the communication cluster. On this basis, we study the effect of UAV height variation on the channel characteristics in the cluster. To better design the future UAV ISAC communication system, the related channel characteristics analysis and modeling are essential and crucial. The statistical modeling results for the features within a cluster are summarized in Table 2. The details are provided as follows.

4.2.1. RMS DS

In a communication system, signals travel through different paths, resulting in multipath transmission. The signal arrives at Rx at different moments, which further leads to frequency selectivity [9]. Root-mean-square (RMS) delay spread (DS) is used to describe the time-dispersion characteristics of MPCs in ISAC channels. The intra-cluster RMS DS is expressed as σ r m s , and its calculation method is
σ r m s = c = 1 C P ( τ c ) · τ c 2 c = 1 C P ( τ c ) ( c = 1 C P ( τ c ) · τ c c = 1 C P ( τ c ) ) 2
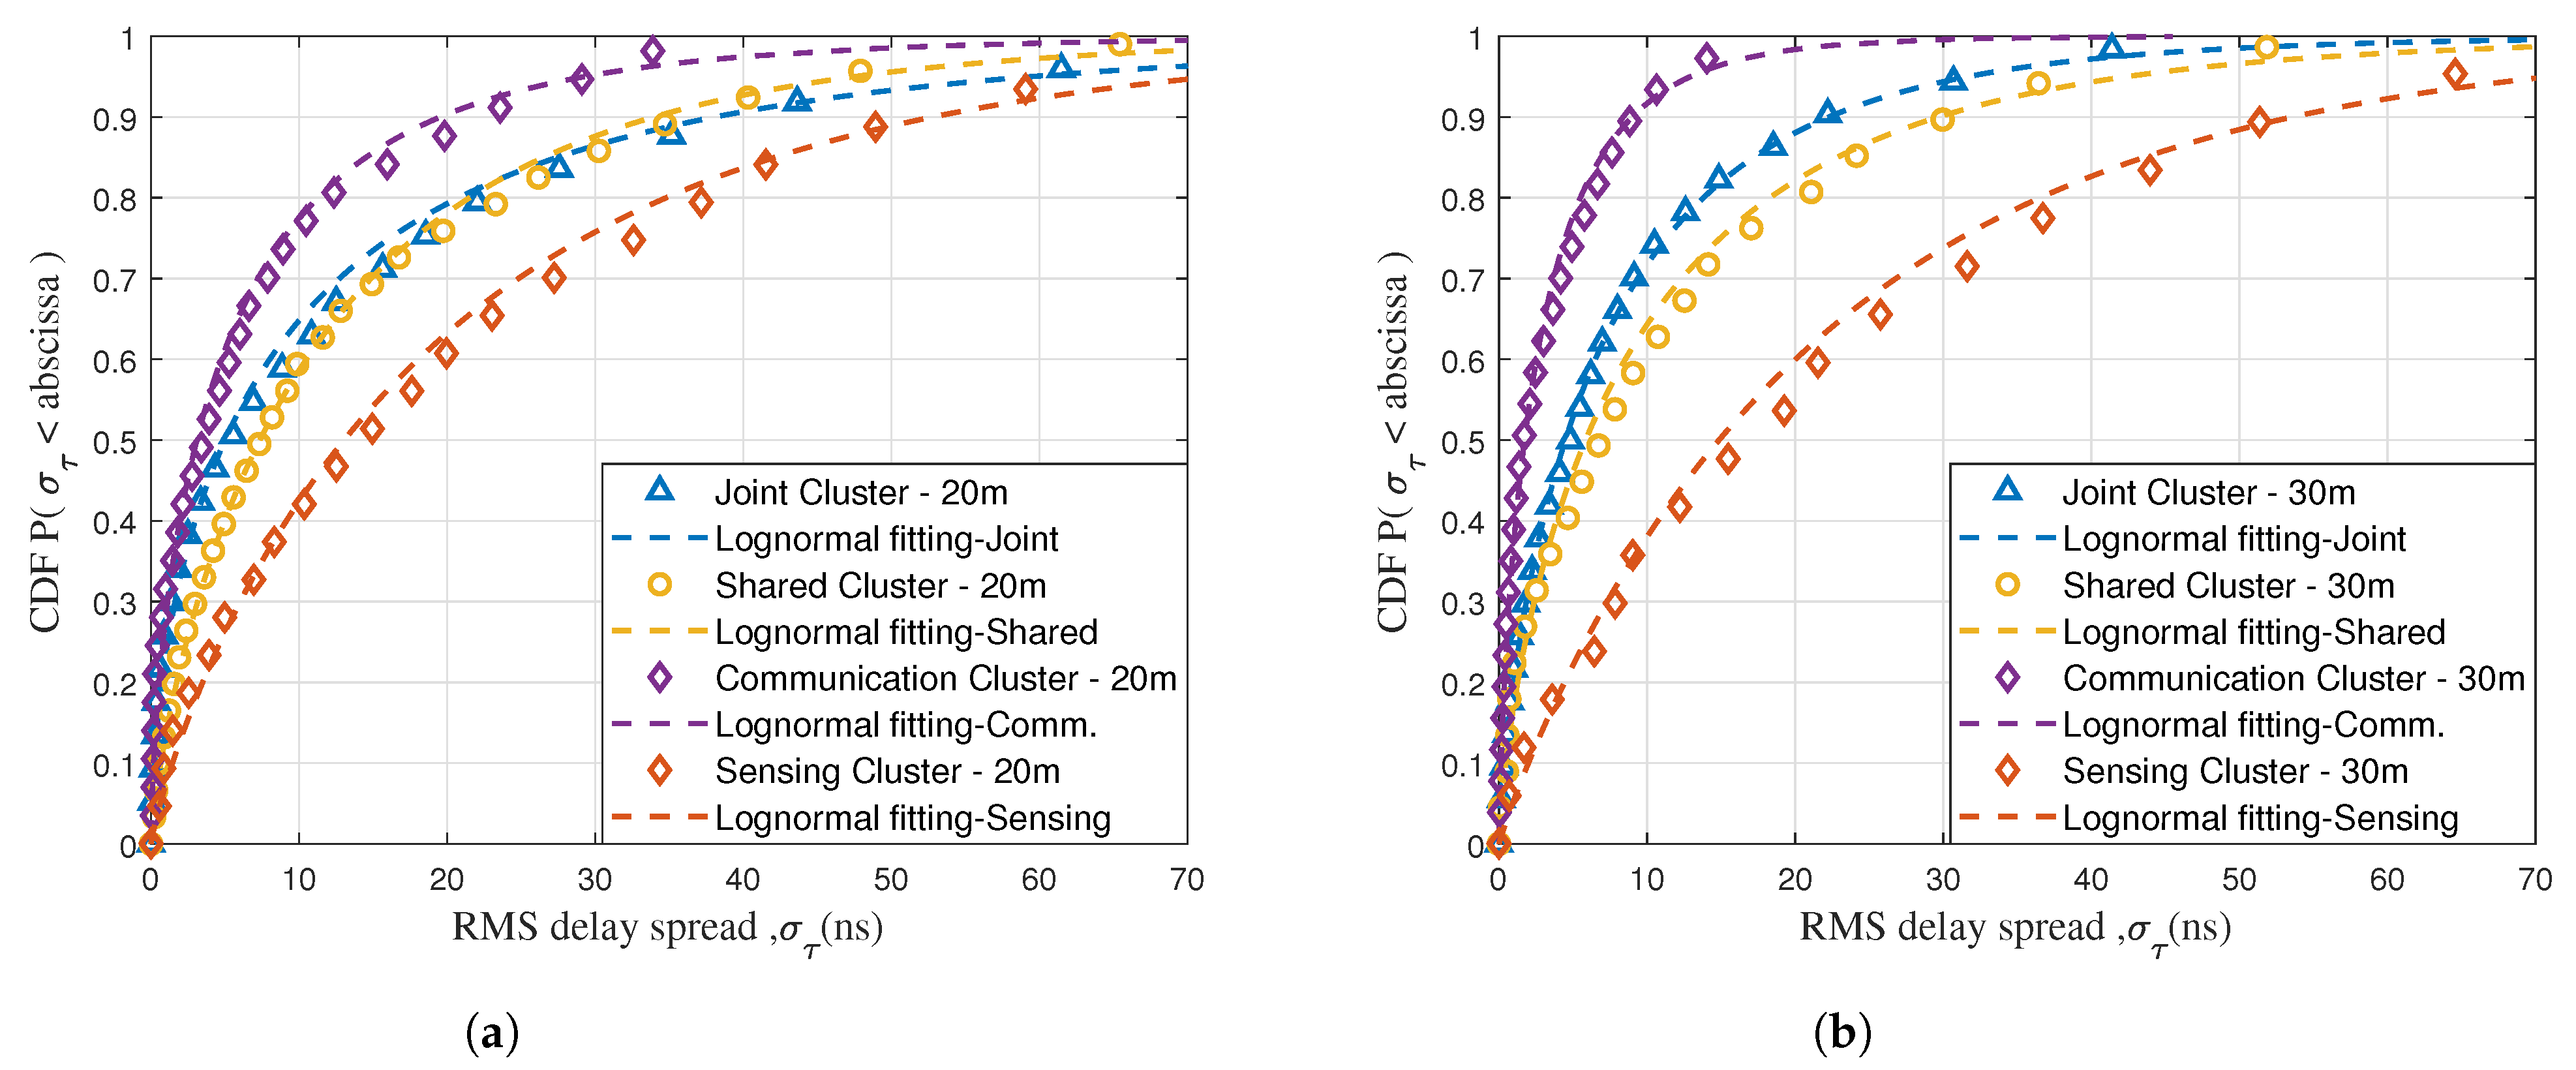
where τ c is the delay corresponding to the diameter c and P ( τ c ) is the power corresponding to the diameter c. The fitting results of the RMS DS are shown in Figure 11, and the log-normal distribution is used to fit them. From the perspective of mean and 80 % RMS DS share, it is observed that the spread of communication clusters > shared cluster spread ≈ joint cluster spread > sensing cluster spread. Comparing corresponding sub-clusters in Figure 11a,b reveals that at a height of 20 m, the μ value (1.7801) of the shared communication sub-clusters in the DS fitted distribution is higher with a σ value (1.6713) lower than that of shared communication sub-clusters (1.1872 and 2.0062) at 30 m. This indicates that sensing clusters exhibit a discrete nature, while communication clusters demonstrate sparsity [9]. Similarly, shared clusters, joint clusters, and shared sensing sub-clusters follow the same pattern. This finding suggests that MPCs within clusters at 20 m height have a more discrete distribution, but the overall structure is more stable compared to clusters at 30 m height.

4.2.2. RMS AS

The RMS angle spread (AS) is calculated as follows:
ψ r m s = c = 1 C P ( ϕ c ) · ϕ c 2 c = 1 C P ( ϕ c ) ( c = 1 C P ( ϕ c ) · ϕ c c = 1 C P ( ϕ c ) ) 2
where ϕ c is the angle corresponding to the diameter c and P ( ϕ c ) is the power corresponding to the diameter c. Log-normal distribution is used to fit the distribution of RMS AS. From the perspective of 80 % RMS AS share, the RMS AS values of communication and sensing clusters ( 47 . 6924 and 87 . 0153 ) are demonstrated to exhibit concentrated and dispersed distributions within the angular domain, and they balance the values of joint clusters ( 59 . 4728 ). The results in Table 2 indicate that the μ and σ values of shared sensing sub-clusters at a height of 20 m (1.2918 and 1.1226) exceed those at 30 m height (1.1991 and 0.9546). It is confirmed that within the angular domain, the MPCs distribution within clusters at 30 m height is more concentrated and sparse compared to 20 m height, exhibiting a more stable structure.

4.2.3. Delay Offset

The delay offset is defined as the difference between the delay of sub-paths within a cluster and the average delay of the cluster, i.e., ( σ o f f s e t = τ c m e a n ( τ c ) ) . It reflects the variability of sub-path delays within the cluster: a large difference between a sub-path’s delay and the average cluster delay results in a larger delay offset; conversely, a smaller difference results in a smaller offset. Similarly, the angle offset can reflect the dispersion of sub-path angles within the cluster, which are calculated as ( ϕ o f f s e t = ψ c m e a n ( ψ c ) ) . The Laplace distribution is employed to model the delayed migration of the cluster [23]. The scale parameter b determines the breadth of the delay shift distribution. In this study, the b value for the shared communication sub-clusters at a height of 20 m is 7.2543, while that for the shared communication sub-clusters at a height of 30 m is 4.8562, further confirming that MPCs in the cluster at a height of 20 m exhibit a more discrete distribution.

4.2.4. SD

SD is used to measure the sharing characteristics of an ISAC channel, which is defined as the ratio of the power of the sharing sub-cluster to the total power of the cluster, and the expression of the sensing SD is
S D s = P s s h a r e d P s t o t a l
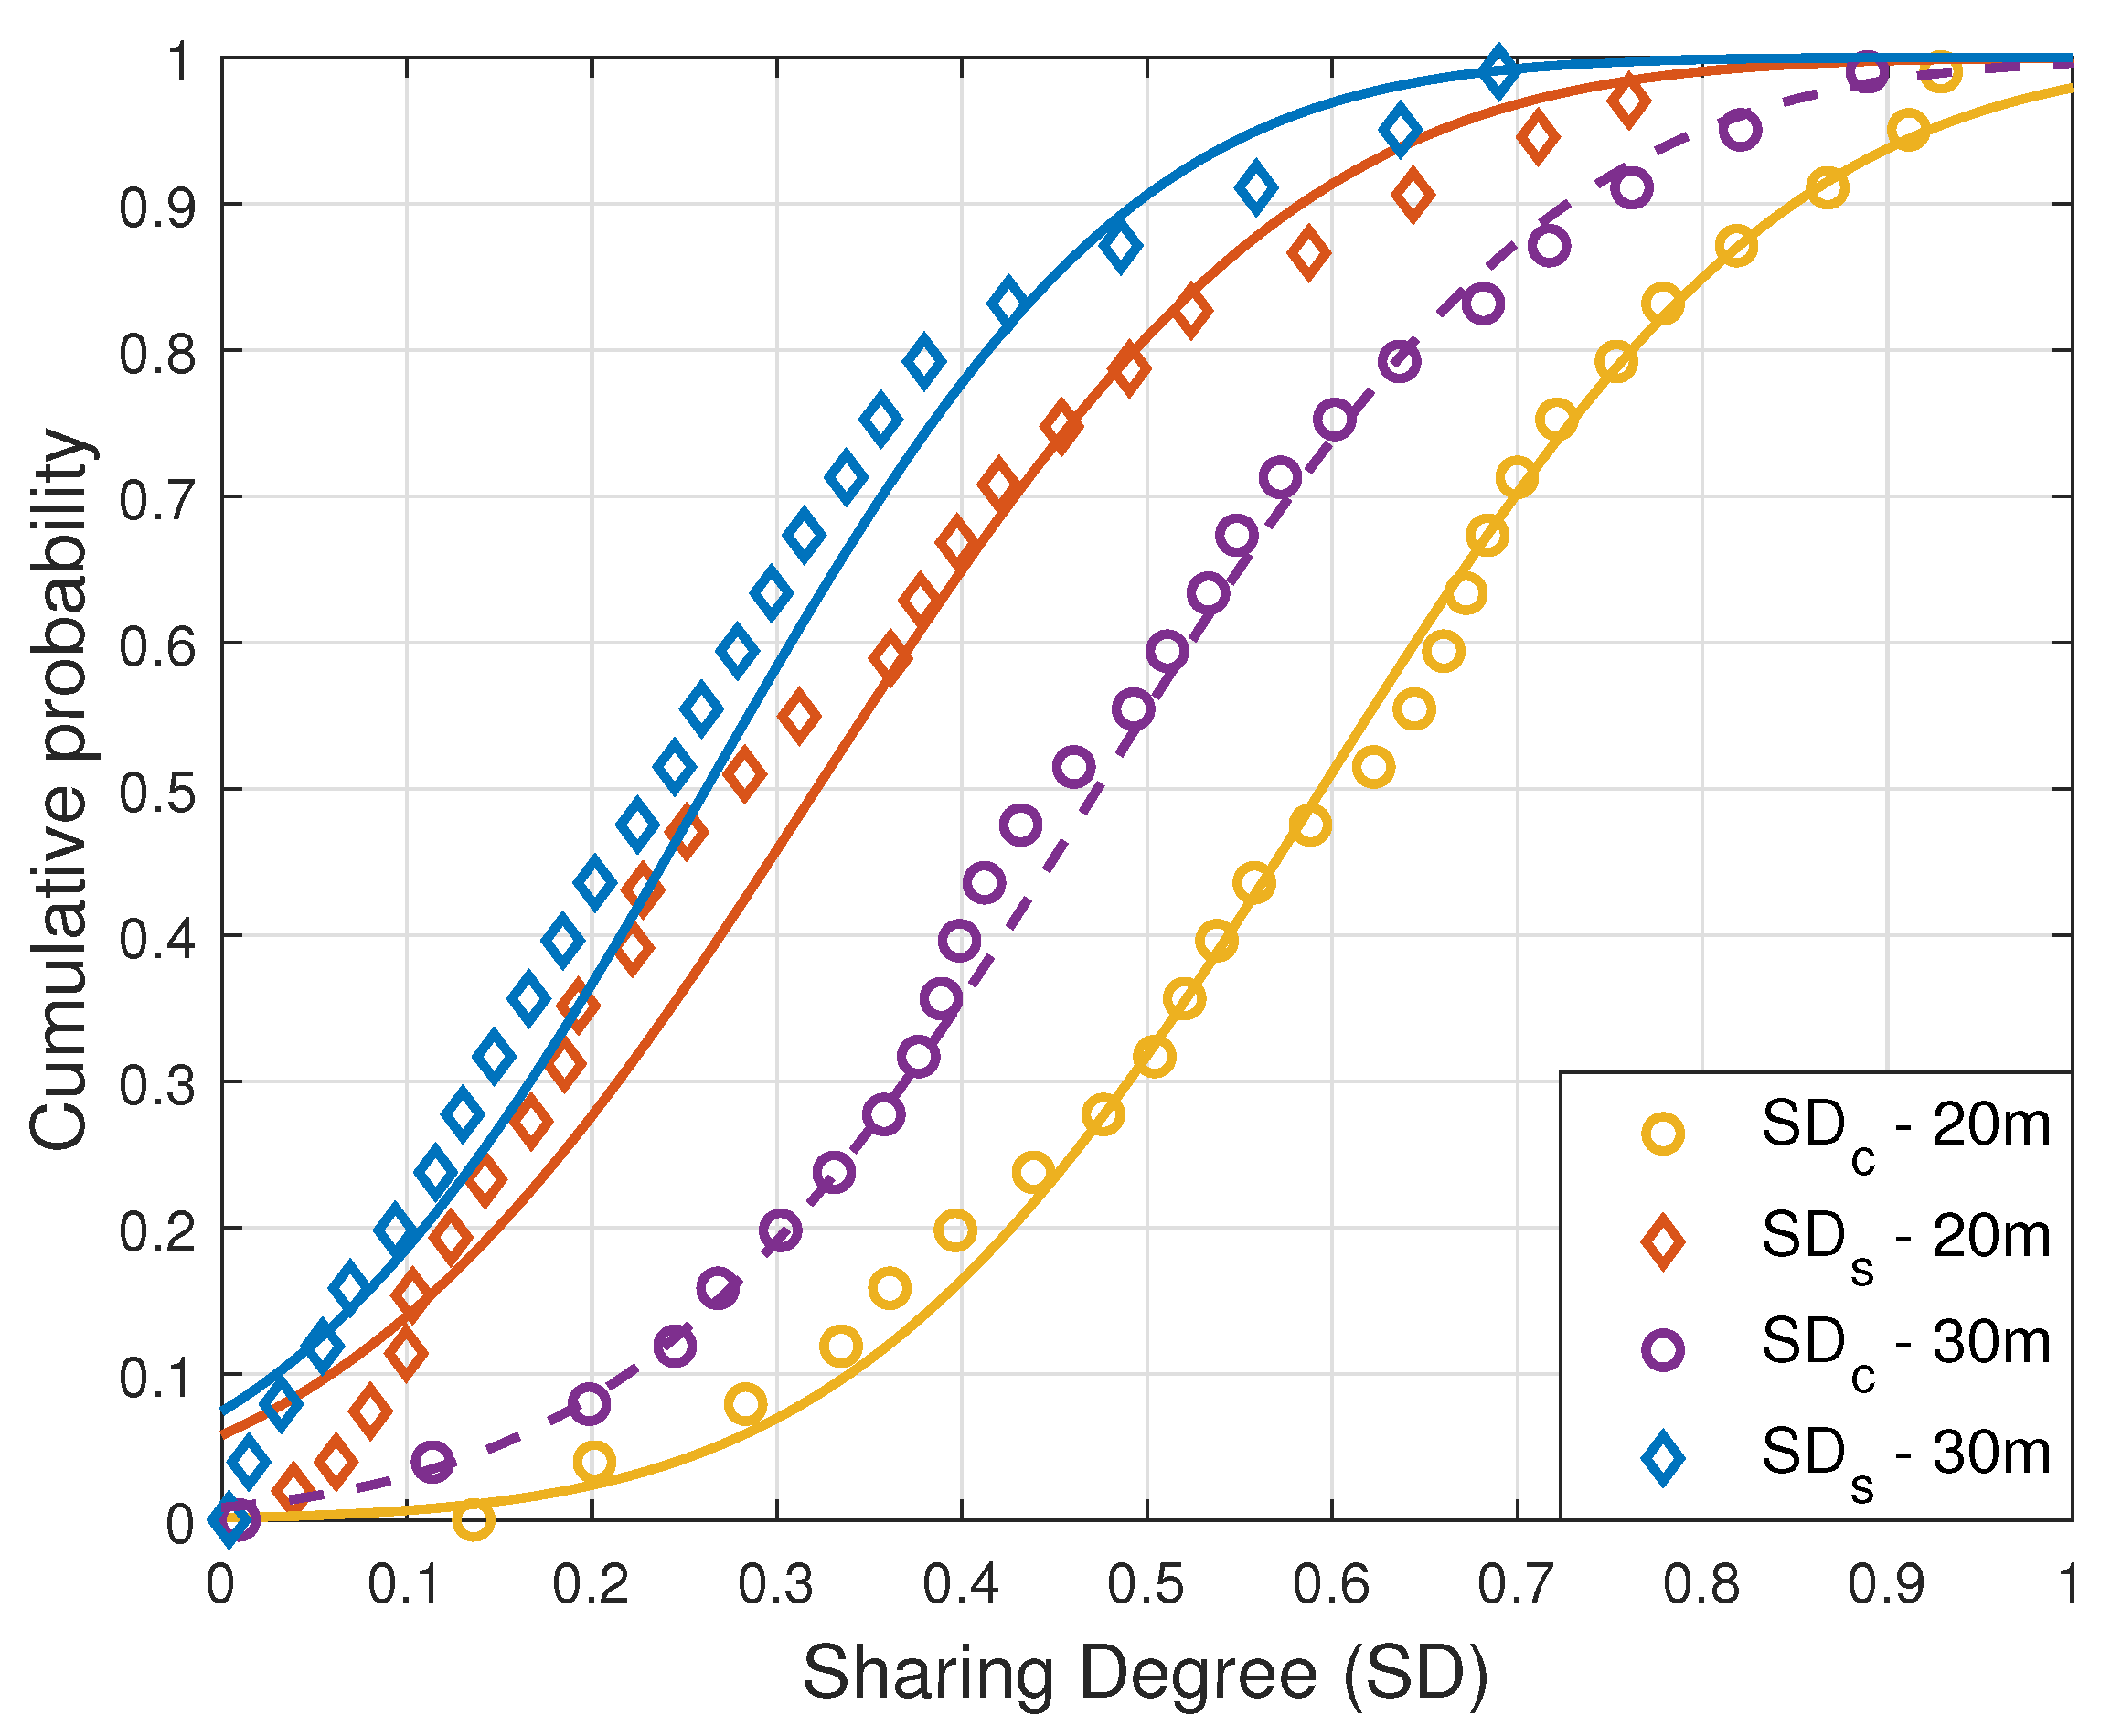
where P s s h a r e d and P s t o t a l are the power of shared sensing sub-clusters and total clusters, respectively. Similarly, the communication SD is expressed as P c s h a r e d / P c t o t a l . In these formulas, P s h a r e d / P t o t a l stands for the proportion of shared parts in the respective received power[lym]. From this, the CDFs fitting curve for communication SD is derived. A normal distribution is utilized to model the SD [9]. Considering an 80% SD share, S D c = 0.76 and S D s = 0.49 at a height of 20 m, while S D c = 0.64 and S D s = 0.41 at 30 m height. As can be seen from Figure 12, in comparison with the 20 m scenario, the S D decreases at 30 m altitude, indicating that flight altitude impacts the S D . In addition, different communication modes also affect the S D , and the S D of the sensing cluster is obviously higher than that of the communication cluster.

4.3. Simulation Verification

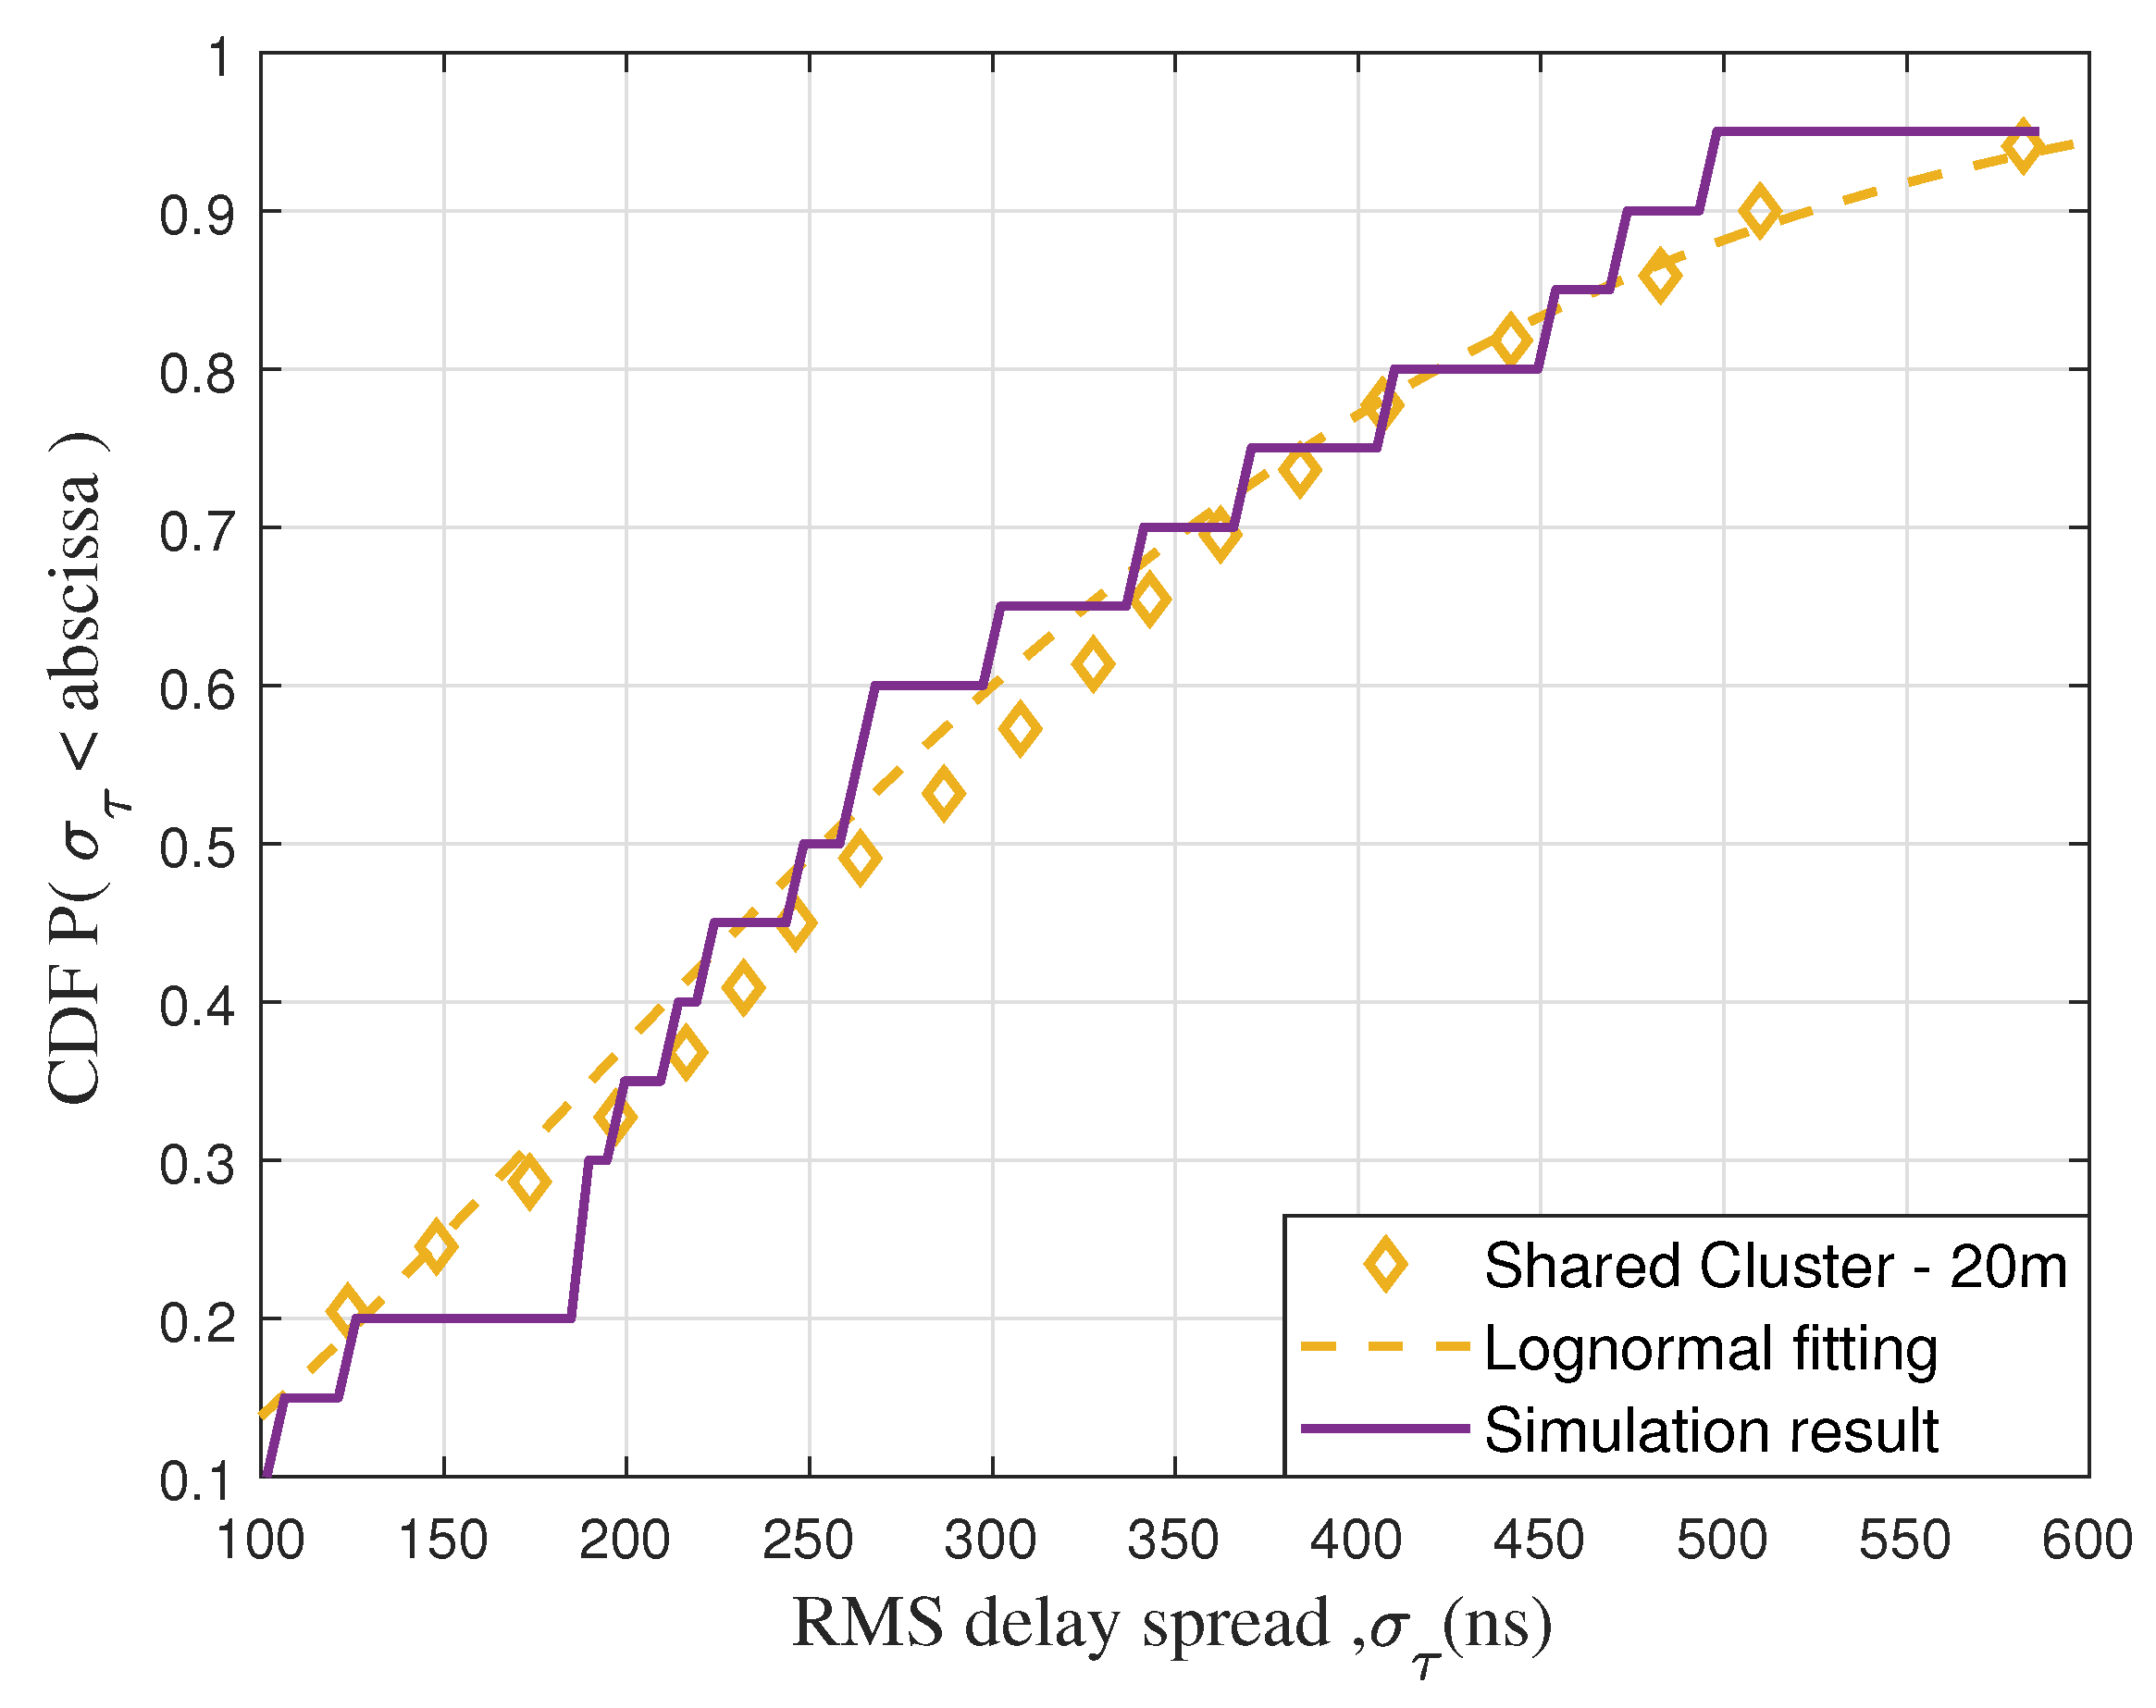
To verify the model’s accuracy, the Southeast University Purple Mountain Laboratory 6G ubiquitous channel simulator is used. This model, based on ubiquitous channel modeling theory, employs a unified geometric stochastic channel modeling method and framework. It features a unified channel impulse response expression and introduces a 6G ubiquitous channel model that integrates characteristics across all frequencies and scenarios. It supports Sub-6 GHz integrated sensing scenarios [24,25]. To ensure consistency between the simulator and RT results, the parameters for both are set identically. The antenna is modeled as a point antenna with the transmitter at 20 m in height, moving in a straight line. The receiver is positioned 2 m above the ground. The simulation scene is an urban microcell similar to a campus environment. The initial number of clusters is set to 19 with an inner diameter of 10 m. The simulation results are compared with ISAC characteristics in the cluster at a height of 20 m. The results, shown in Figure 13, indicate that the intra-cluster delay characteristics of the simulation curve align closely with the model’s delay characteristics, validating the model’s accuracy.

5. Conclusions

This paper has presented an ISAC channel evolution model for UAV communication. The UAV ISAC channel has been clustered and tracked using the KPM–JCA algorithm and an automatic tracking algorithm. The classical channel characteristics with intra-cluster and inter-cluster variations have been further analyzed. The results have shown that the birth and death processes of the UAV ISAC channel are affected by flight altitudes and sensing clusters. As the height increases, more clusters have been detected, but the survival time of clusters has decreased. At the same flight altitude, the addition of sensing clusters can only increase the survival time of clusters without affecting the number of detected clusters. The increase of flight altitude has increased the concentration of the cluster, but the stability within the cluster has decreased. Moreover, the changes in flight altitude have also affected the SD. This characteristics analysis has provided valuable insights into the evolution of clusters in the UAV ISAC scenarios channel, which can provide a crucial reference for future UAV ISAC system design and network optimization.

Author Contributions

Conceptualization, Y.L.; formal analysis, X.L., Y.L., X.Z. and Y.Z.; funding acquisition, Y.L.; investigation, X.L., X.Z. and Y.Z.; methodology, X.L., J.B. and J.H.; resources, Y.L.; software, X.L., J.B. and J.H.; supervision, Y.L.; validation, X.L., Y.L., J.H. and J.B.; writing—original draft X.L.; writing—review and editing, Y.L., J.H., J.B. and Y.Z. All authors have read and agreed to the published version of the manuscript.

Funding

This work was supported by the National Natural Science Foundation of China (NSFC) under Grants 62471279, 62271147 and 62101311, the Future Plan Program for Young Scholars of Shandong University, and the Innovation and Technology Support Program for Young Scholars of Colleges and Universities in Shandong Province under Grant 2022KJ009.

Data Availability Statement

The datasets generated and analyzed during the current study are available from the corresponding author on reasonable request.

Conflicts of Interest

The authors declare no conflicts of interest.

References

  1. Wang, C.X.; You, X.; Gao, X.; Zhu, X.; Li, Z.; Zhang, C.; Wang, H.; Huang, Y.; Chen, Y.; Haas, H.; et al. On the Road to 6G: Visions, Requirements, Key Technologies, and Testbeds. IEEE Commun. Surv. Tutor. 2023, 25, 905–974. [Google Scholar] [CrossRef]
  2. Mozaffari, M.; Saad, W.; Bennis, M.; Nam, Y.H.; Debbah, M. A Tutorial on UAVs for Wireless Networks: Applications, Challenges, and Open Problems. IEEE Commun. Surv. Tutor. 2019, 21, 2334–2360. [Google Scholar] [CrossRef]
  3. Mao, K.; Zhu, Q.; Qiu, Y.; Liu, X.; Song, M.; Fan, W.; Kokkeler, A.B.J.; Miao, Y. A UAV-Aided Real-Time Channel Sounder for Highly Dynamic Nonstationary A2G Scenarios. IEEE Trans. Instrum. Meas. 2023, 72, 1–15. [Google Scholar] [CrossRef]
  4. Meng, K.; Wu, Q.; Xu, J.; Chen, W.; Feng, Z.; Schober, R.; Swindlehurst, A.L. UAV-Enabled Integrated Sensing and Communication: Opportunities and Challenges. IEEE Wirel. Commun. 2024, 31, 97–104. [Google Scholar] [CrossRef]
  5. Cheng, X.; Li, Y.; Bai, L. UAV Communication Channel Measurement, Modeling, and Application. J. Commun. Inf. Netw. 2019, 4, 32–43. [Google Scholar] [CrossRef]
  6. Mao, K.; Zhu, Q.; Wang, C.X.; Ye, X.; Gomez-Ponce, J.; Cai, X.; Miao, Y.; Cui, Z.; Wu, Q.; Fan, W. A Survey on Channel Sounding Technologies and Measurements for UAV-Assisted Communications. IEEE Trans. Instrum. Meas. 2024, 73, 1–24. [Google Scholar] [CrossRef]
  7. Ye, X.; Li, H.; Mao, K.; Zhu, Q.; Ali, F.; Chen, X.m.; Qiu, Y.; Li, H. Measurement-Based Channel Characteristics for Air-to-Ground Communications Under Rural Areas. In Proceedings of the 2024 18th European Conference on Antennas and Propagation (EuCAP), Glasgow, UK, 17–22 March 2024; pp. 1–5. [Google Scholar]
  8. Zhou, Y.; Liu, X.; Zhai, X.; Zhu, Q.; Durrani, T.S. UAV-Enabled Integrated Sensing, Computing, and Communication for Internet of Things: Joint Resource Allocation and Trajectory Design. IEEE Internet Things J. 2024, 11, 12717–12727. [Google Scholar] [CrossRef]
  9. Liu, Y.; Zhang, J.; Zhang, Y.; Yuan, Z.; Liu, G. A Shared Cluster-Based Stochastic Channel Model for Integrated Sensing and Communication Systems. IEEE Trans. Veh. Technol. 2024, 73, 6032–6044. [Google Scholar] [CrossRef]
  10. Liu, Y.; Zhang, J.; Zhang, Y.; Gong, H.; Jiang, T.; Liu, G. How to Extend 3-D GBSM to Integrated Sensing and Communication Channel With Sharing Feature? IEEE Wirel. Commun. Lett. 2024, 13, 2045–2049. [Google Scholar] [CrossRef]
  11. Inca, S.; Mrozowski, A.; Prado-Alvarez, D.; Monserrat, J.F.; Zhang, Y.; Yang, W.; Chen, Y. Angular Correlation Study of Sensing and Communication Channels in V2X Scenarios for 6G ISAC Usage. In Proceedings of the 2023 IEEE Globecom Workshops (GC Wkshps), Kuala Lumpur, Malaysia, 4–8 December 2023; pp. 1189–1194. [Google Scholar]
  12. Yang, R.; Wu, Y.; Huang, J.; Wang, C.X. A Novel 3D Non-stationary Localization-assisted ISAC Channel Model. In Proceedings of the 2023 IEEE Wireless Communications and Networking Conference (WCNC), Glasgow, UK, 26–29 March 2023; pp. 1–6. [Google Scholar]
  13. Salmi, J.; Richter, A.; Koivunen, V. Detection and Tracking of MIMO Propagation Path Parameters Using State-Space Approach. IEEE Trans. Signal Process. 2009, 57, 1538–1550. [Google Scholar] [CrossRef]
  14. Yin, X.; Steinbock, G.; Kirkelund, G.E.; Pedersen, T.; Blattnig, P.; Jaquier, A.; Fleury, B.H. Tracking of Time-Variant Radio Propagation Paths Using Particle Filtering. In Proceedings of the 2008 IEEE International Conference on Communications, Beijing, China, 19–23 May 2008; pp. 920–924. [Google Scholar]
  15. Remcom. Wireless InSite. Available online: https://www.remcom.com/wireless-insite-em-propagation-software (accessed on 1 May 2024).
  16. Li, Y.; Chen, Y.; Yan, D.; Guan, K.; Han, C. Channel Characterization and Ray Tracing Assisted Stochastic Modeling for Urban Vehicle-to-Infrastructure Terahertz Communications. IEEE Trans. Veh. Technol. 2023, 72, 2748–2763. [Google Scholar] [CrossRef]
  17. Guan, K.; Ai, B.; Peng, B.; He, D.; Li, G.; Yang, J.; Zhong, Z.; Kürner, T. Towards Realistic High-Speed Train Channels at 5G Millimeter-Wave Band—Part I: Paradigm, Significance Analysis, and Scenario Reconstruction. IEEE Trans. Veh. Technol. 2018, 67, 9112–9128. [Google Scholar] [CrossRef]
  18. Czink, N.; Cera, P.; Salo, J.; Bonek, E.; Nuutinen, J.p.; Ylitalo, J. A Framework for Automatic Clustering of Parametric MIMO Channel Data Including Path Powers. In Proceedings of the IEEE Vehicular Technology Conference, Montreal, QC, Canada, 25–28 September 2006; pp. 1–5. [Google Scholar]
  19. Li, Y.; Zhang, J.; Ma, Z.; Zhang, Y. Clustering Analysis in the Wireless Propagation Channel with a Variational Gaussian Mixture Model. IEEE Trans. Big Data 2020, 6, 223–232. [Google Scholar] [CrossRef]
  20. Wang, Q.; Ai, B.; He, R.; Guan, K.; Li, Y.; Zhong, Z.; Shi, G. A Framework of Automatic Clustering and Tracking for Time-Variant Multipath Components. IEEE Commun. Lett. 2017, 21, 953–956. [Google Scholar] [CrossRef]
  21. Ester, M.; Kriegel, H.P.; Sander, J.; Xu, X. A Density-Based Algorithm for Discovering Clusters in Large Spatial Databases with Noise; AAAI Press: Washington, DC, USA, 1996; pp. 226–231. [Google Scholar]
  22. Zhou, T.; Qiao, Y.; Salous, S.; Liu, L.; Tao, C. Machine Learning-Based Multipath Components Clustering and Cluster Characteristics Analysis in High-Speed Railway Scenarios. IEEE Trans. Antennas Propag. 2022, 70, 4027–4039. [Google Scholar] [CrossRef]
  23. Yang, M.; Ai, B.; He, R.; Wang, G.; Chen, L.; Li, X.; Huang, C.; Ma, Z.; Zhong, Z.; Wang, J.; et al. Measurements and Cluster-Based Modeling of Vehicle-to-Vehicle Channels With Large Vehicle Obstructions. IEEE Trans. Wirel. Commun. 2020, 19, 5860–5874. [Google Scholar] [CrossRef]
  24. Wang, C.X.; Lv, Z.; Gao, X.; You, X.; Hao, Y.; Haas, H. Pervasive Wireless Channel Modeling Theory and Applications to 6G GBSMs for All Frequency Bands and All Scenarios. IEEE Trans. Veh. Technol. 2022, 71, 9159–9173. [Google Scholar] [CrossRef]
  25. Wang, C.X.; Lv, Z.; Chen, Y.; Haas, H. A Complete Study of Space-Time-Frequency Statistical Properties of the 6G Pervasive Channel Model. IEEE Trans. Commun. 2023, 71, 7273–7287. [Google Scholar] [CrossRef]
Figure 1. The architecture of clustering and evolution phenomenon for UAV-to-ground ISAC communication channels.
Drones 08 00538 g001
Figure 2. The flight details for UAV ISAC scenarios of (a) satellite image and (b) simulation scene.
Drones 08 00538 g002
Figure 3. Clustering evaluation by combined indicator in (a) 20 m conditions and (b) 30 m conditions.
Drones 08 00538 g003
Figure 4. Matching between the clustering results and the simulation results.
Drones 08 00538 g004
Figure 5. The clustering results of (a) 3D perspective, (b) joint clusters, (c) communication clusters and (d) shared clusters.
Drones 08 00538 g005
Figure 6. The flowchart of UAV ISAC channel clustering process.
Drones 08 00538 g006
Figure 7. Channel clustering and tracking process at different snapshots of (a) S20, (b) S30, (c) S40 and (d) S50.
Drones 08 00538 g007
Figure 8. Time-varying cluster tracking results in (a) communication clusters at 20 m, (b) shared clusters at 20 m, (c) communication clusters at 30 m and (d) shared clusters at 30 m.
Drones 08 00538 g008
Figure 9. The CDFs of cluster lifetime under different height.
Drones 08 00538 g009
Figure 10. The count histogram of the cluster number in joint and communication cluster at (a) 20 m and (b) 30 m.
Drones 08 00538 g010
Figure 11. The CDFs of cluster RMS DSs at different heights: (a) 20 m height and (b) 30 m height.
Drones 08 00538 g011
Figure 12. Simulation CDFs of SDs and SDc with varying heights.
Drones 08 00538 g012
Figure 13. The CDFs of RMS DS with RT simulation and model simulation data.
Drones 08 00538 g013
Table 1. The simulation details and parameters of ray-tracing model.
Details of Simulation
Simulation ParametersParameterValue
Frequency/Bandwidth3.5 GHz/200 MHz
Transmit Power10 dBm
Tx AntennaOmnidirectional
Rx Communication/Sensing AntennaOmnidirectional
Reflection/Difraction/Transmission6/1/1
Material ParametersMaterialPermittivityConductivity (S/m)Thickness (m)
Wet Earth25.0000.0200-
Concrete7.0000.0150.300
Forest0.0500.0005250
Asphalt5.7200.00040.300
Glass6.2700.2287/0.19150.003
Table 2. Intra- and inter-cluster channel characterization parameters.
Channel ParametersStatistical DistributionValue
20 m30 m
Cluster lifetimeLog-normal distribution
[mean μ C L , s t d σ C L ]
μ C L 1 = 0.3206 , σ C L 1 = 2.0838
μ C L 4 = 0.2457 , σ C L 4 = 2.0679
μ C L 1 = 0.0445 , σ C L 1 = 1.2032
μ C L 4 = 0.3327 , σ C L 4 = 1.2103
Cluster
delay
distribution
RMS
DS
( μ s)
Log-normal distribution
[mean μ D S , s t d σ D S ]
μ D S 1 = 0.8223 , σ D S 1 = 1.8067
μ D S 2 = 2.3017 , σ D S 2 = 1.6187
μ D S 3 = 1.7801 , σ D S 3 = 1.6713
μ D S 4 = 1.7157 , σ D S 4 = 1.6720
μ D S 1 = 0.2418 , σ D S 1 = 1.8182
μ D S 2 = 1.4277 , σ D S 2 = 1.9549
μ D S 3 = 1.1872 , σ D S 3 = 2.0062
μ D S 4 = 1.0955 , σ D S 4 = 1.9891
delay
offset
( μ s)
Zero-mean Laplace
distribution
[scale b D S ]
b D S 1 = 30.0943
b D S 2 = 30.0943
b D S 3 = 10.9967
b D S 4 = 31.8206
b D S 1 = 12.5676
b D S 2 = 11.5843
b D S 3 = 5.9613
b D S 4 = 17.4156
Cluster
angle
distribution
RMS
AS
(rad)
Log-normal distribution
[ m e a n μ A S , s t d σ A S ]
μ A S 1 = 0.5473 , σ A S 1 = 0.7649
μ A S 2 = 1.2918 , σ A S 2 = 1.1226
μ A S 3 = 0.8297 , σ A S 3 = 1.0632
μ A S 4 = 0.7916 , σ A S 4 = 0.9742
μ A S 1 = 0.5255 , σ A S 1 = 0.3774
μ A S 2 = 1.1991 , σ A S 2 = 0.9546
μ A S 3 = 0.6954 , σ A S 3 = 0.6414
μ A S 4 = 0.7973 , σ A S 4 = 0.6728
AOD
offset
(rad)
Zero-mean Laplace
distribution
[scale b A S ]
b A S 1 = 7.2543
b A S 2 = 6.8972
b A S 3 = 2.7272
b A S 4 = 2.0126
b A S 1 = 4.8562
b A S 2 = 3.5956
b A S 3 = 1.7663
b A S 4 = 1.7828
The subscripts 1, 2, 3, and 4 represent the corresponding communication cluster, sensing cluster, joint cluster, and shared cluster, respectively.
Disclaimer/Publisher’s Note: The statements, opinions and data contained in all publications are solely those of the individual author(s) and contributor(s) and not of MDPI and/or the editor(s). MDPI and/or the editor(s) disclaim responsibility for any injury to people or property resulting from any ideas, methods, instructions or products referred to in the content.