Article

Rockfall Analysis from UAV-Based Photogrammetry and 3D Models of a Cliff Area

by
Daniele Cirillo
1,2,3,*,
Michelangelo Zappa
4,
Anna Chiara Tangari
2,5,
Francesco Brozzetti
1,2,3 and
Fabio Ietto
6
1
Laboratorio di Geologia Strutturale Cartografia e Modellazione Geologica, DiSPuTer, Università G. d’Annunzio, 66100 Chieti, Italy
2
Dipartimento DiSPuTer, Università G. d’Annunzio, 66100 Chieti, Italy
3
CRUST Centro InteRUniversitario per L’analisi Sismotettonica Tridimensionale, 66100 Chieti, Italy
4
Independent Researcher, 87030 Falconara Albanese, Italy
5
Dipartimento di Ingegneria Civile, Università della Calabria, 87036 Arcavacata di Rende, Italy
6
Department of Biology, Ecology and Earth Science, University of Calabria, 87036 Arcavacata di Rende, Italy
*
Author to whom correspondence should be addressed.
Drones 2024, 8(1), 31; https://doi.org/10.3390/drones8010031
Submission received: 20 December 2023 / Revised: 17 January 2024 / Accepted: 19 January 2024 / Published: 22 January 2024

Abstract

:
The application of Unmanned Aerial Vehicles (UAVs), commonly known as drones, in geological, geomorphological, and geotechnical studies has gained significant attention due to their versatility and capability to capture high-resolution data from challenging terrains. This research uses drone-based high-resolution photogrammetry to assess the geomechanical properties and rockfall potential of several rock scarps within a wide area of 50 ha. Traditional methods for evaluating geomechanical parameters on rock scarps involve time-consuming field surveys and measurements, which can be hazardous in steep and rugged environments. By contrast, drone photogrammetry offers a safer and more efficient approach, allowing for the creation of detailed 3D models of a cliff area. These models provide valuable insights into the topography, geological structures, and potential failure mechanisms. This research processed the acquired drone imagery using advanced geospatial software to generate accurate orthophotos and digital elevation models. These outputs analysed the key factors contributing to rockfall triggering, including identifying discontinuities, joint orientations, kinematic analysis of failures, and fracturing frequency. More than 8.9 × 10⁷ facets, representing discontinuity planes, were recognised and analysed for the kinematic failure modes, showing that direct toppling is the most abundant rockfall type, followed by planar sliding and flexural toppling. Three different fracturation grades were also identified based on the number of planar facets recognised on rock surfaces. The approach used in this research contributes to the ongoing development of fast, practical, low-cost, and non-invasive techniques for geomechanical assessment on vertical rock scarps. In particular, the results show the effectiveness of drone-based photogrammetry for rapidly collecting comprehensive geomechanical data valid to recognise the prone areas to rockfalls in vast regions.

1. Introduction

Rockfalls pose significant threats to human life and infrastructure, so these phenomena have been the subject of extensive research and analysis in the last decades. Theoretical and technological endeavours to safeguard the areas from rockfall risks are driven by minimizing the potential loss of human life [1,2].
Several researchers highlighted the significance of comprehending the instability mechanisms impacting various rock formations [3,4,5,6]. They emphasize the necessity of gathering accurate geological, geomorphological, geophysical, and geomechanical data to ensure a robust model of the instability phenomena, e.g., [7,8,9]. In assessing the risks associated with rockfall events, it is essential to identify and comprehend the different types of rockfall scenarios [10], such as planar sliding, flexural toppling, or direct toppling [11,12]. Historically, research in this field has primarily consisted of localised rockfall tests, e.g., [13,14] without establishing comprehensive mechanisms for these events.
Discontinuities are a major predisposing factor for rockfalls. They represent structural planes of mechanical weakness, typically resulting from tectonic stress, rock folding, and fracturing within the rock mass [15]. The presence of one or more types of discontinuities, such as joints, fragile bedding planes, weakness zones, and faults (sensu [16]), results in a fragmented rock mass structure separated by planes of mechanical weakness.
Traditionally, geologists assess the rock masses’ geomechanical features by collecting and recording information within specific in situ measurement stations. Rebound values, roughness, aperture, presence and type of infilling material, and dip direction of various fracture sets, affecting the rock masses planes, are usually collected in each station [17,18,19]. These measurements are usually estimated using the scanline survey method, e.g., [20], where some instruments such as the Schmidt hammer, roughness measuring instrument, and compass-clinometers are employed. This approach is still commonly used despite having several limitations. In this regard, several authors, e.g., [9,21], asserted that data gathered from infield surveys depend on visual examination and manual measurements, often related to the experience and judgment of the surveyors. This subjective process can lead to biased results, affecting the assessment of rock instability and the hazard assessment. Furthermore, traditional methodologies have often relied on labour-intensive field surveys, which can be resource-intensive, time-consuming, and subject to potential risks for surveyors in hazardous environments.
Over the past five decades, remote sensing from satellite imagery has been used to monitor and map landslides. Various space-borne platforms, including ENVISAT, ALOS, Cosmo-SkyMed, and Sentinel, have been employed to observe huge to medium-scale landslide movements in the microwave portion of the spectrum [22,23,24,25,26,27].
In addition to satellite imagery, in recent decades, considerable attention has been given to using terrestrial laser scanning (TLS), airborne laser scanner (ALS) LiDAR, and close-range photogrammetry techniques in rock slope investigations. These technologies precisely identify location-dependent rock structures by analysing point clouds. Numerous studies have highlighted the benefits and constraints of employing remote sensing ASL and TSL techniques to identify, characterise, and monitor rockfall sources at different scales [28,29,30,31,32,33].
In recent years, geological survey techniques have undergone a notable transformation, integrating traditional methods with cutting-edge technologies such as utilizing Unmanned Aerial Vehicles (UAVs) for remotely capturing high-resolution imagery [34,35,36,37,38,39,40,41,42,43,44]. This technological advancement also found significant employment in geostructural and geomechanical surveys on rock scarps, contributing to managing natural hazards in human-inaccessible areas [45,46,47,48,49]. This new approach was employed in several studies [9,34,38,46,49,50,51,52,53,54,55,56,57] that have demonstrated the efficacy of photogrammetric processing in generating high-resolution Digital Terrain Models (DTM) and Digital Outcrop Models (DOM). The process involves the conversion of aerial photographs into georeferenced digital models with exceptional levels of detail in both imagery and topography. Several software tools are available for the processing of aerial photogrammetric data, such as the well-known applications of Agisoft Metashape Professional version 1.8.5 [https://www.agisoft.com/ (accessed on 17 January 2024)], CloudCompare version 2.13 [https://www.danielgm.net/cc/ (accessed on 17 January 2024)], and Esri ArcMap 10.8/ArcGIS Pro [https://www.esri.com/en-us/home (accessed on 17 January 2024)]. These platforms are pivotal in transforming raw drone imagery into precise geological insights.
The use of UAVs compared to TLS or ALS offers significant advantages. In the first scenario, in coastal areas with very high cliffs directly overlooking the sea, TLS encounters difficulty positioning the acquisition instrument on a stable surface to gather data. In the second case, the use of ALS instruments, which are larger and must have a significant load capacity to support a LIDAR, complicates transportation operations due to their bulky dimensions. Disadvantages of using a UAV may include the lack of direct acquisition of dense point clouds and the difficulty of immediate vegetation removal. However, these drawbacks can be mitigated using advanced software that allows for more accurate vegetation removal during processing phases.
Comparing the use of UAVs with satellite image acquisition, the main advantage is economic. Obtaining high-resolution images through satellites would be expensive, and to generate a minimum DTM, purchasing a pair of images would be necessary. However, this would not address the issues in cliff areas with steep slopes, resulting in the loss of crucial elements for rockfall analyses. Lastly, the resolution obtained with the UAV is much higher than the previous one.
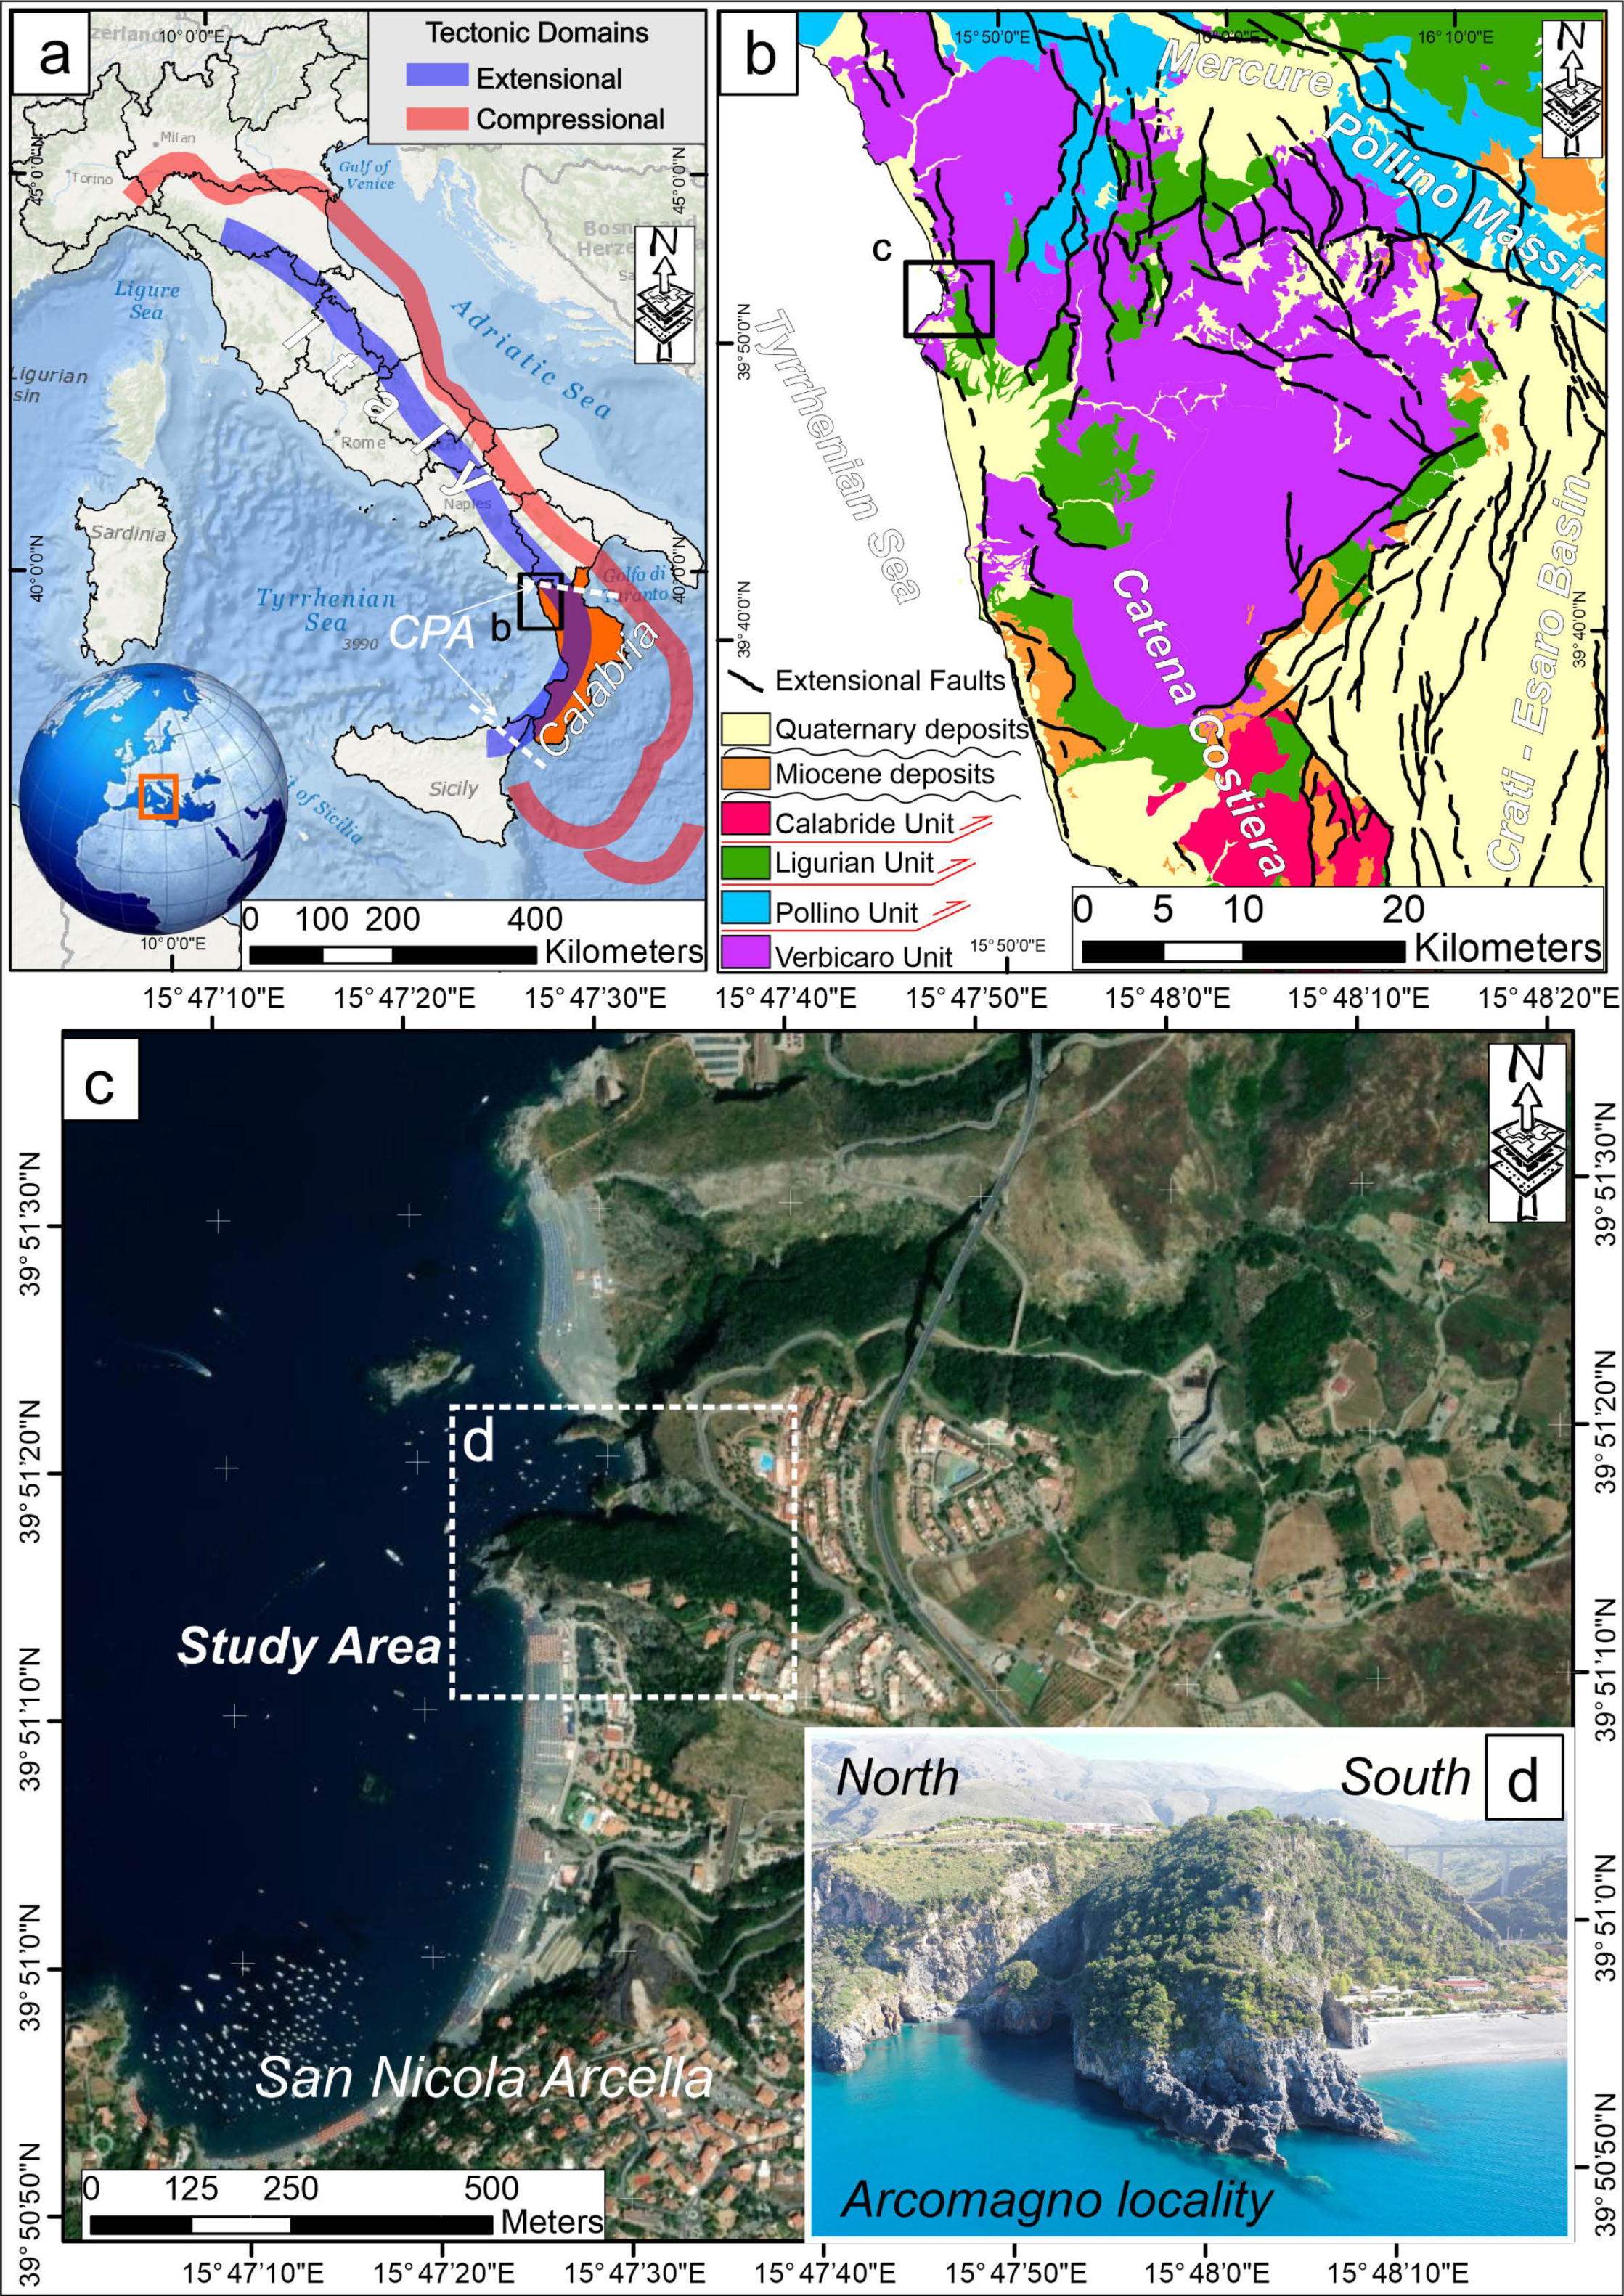
The present research focuses on UAV capabilities to overcome in-situ survey limitations, showing a fast and precise approach to surveying and managing geomechanical data for rockfall assessment. Moreover, the approach that we propose is combining the information analysis between different software with an accurate statistical analysis made with GIS software, which consents to establish the areas that were able to withstand the rockfalls and mitigate the impact on the loss of humans. In our methodological approach, we conducted tests to define areas with a high susceptibility to rockfalls. This was achieved through statistical analyses considering the frequency of the degree of jointing on steep rock walls. Indeed, the confirmation of our approach was testified by an event in an area of our study. After some heavy rainfall, a rockfall occurred in the zone we had previously identified and mapped as very high-risk. The study area is located on the Tyrrhenian side (Figure 1a,b) of northern Calabria (southern Italy), dominated by several vertical rock scarps exposed directly to sea wave energy and characterised by complex geological formations and challenging topography. The approach used in this study can also be extended to other similar geological contexts worldwide to analyse the geomechanical conditions of vertical rock scarps.

1.1. Study Area

The study area is located in the southern Apennines of Italy, along the Tyrrhenian coast of northern Calabria (Figure 1); it extends on a surface of 50 ha and spans from 15°47′00″ E to 15°48′00″ E longitudes and from 39°51′00″ N to 39°51′40″ N of latitudes. The area is a rocky promontory surrounded by the Tyrrhenian Sea and located near San Nicola Arcella village (Figure 1c) in Cosenza Province. This stretch of the coast is among the most important tourist destinations of the Tyrrhenian Calabria because of its wonderful landscape and beaches, including the Arcomagno locality (Figure 1d). The area is characterised by several vertical scarps directly exposed to the sea-wave activity at the foot of the slopes. Several rockfall phenomena have been triggered along the rock scarps in the last decades, posing a high threat to human safety. Different orientations characterise the slope faces of the vertical scarps, and the altitude ranges from 20 m to 100 m a.s.l. The area falls within the Catena Costiera Calabra, close to the southernmost portion of the Pollino Massif (Figure 1b). This Massif represents a high morpho-structural landform, reaching over 2000 m and strongly influencing local climate conditions [58]. The latter is characterised by a Mediterranean climate with mild and wet winters and hot, dry summers [59]. The rainiest months are generally November and December when frequent thunderstorm-like rains occur due to the clash between warm and cooler air masses from the northern quadrants. These phenomena often lead to flooding and landslides throughout the surrounding area, e.g., [60,61,62]. The period between June and August is the driest period of the year, with only a few intense and short downpours. Additionally, the high and low topographic elevations and the presence of the sea have contrasting thermal properties that impact the local climate conditions, accentuating and affecting precipitation patterns through orographic altitude ([63] and references therein). This climate regime is mainly influenced by the Mediterranean Sea’s proximity, which is a significant moderating factor for temperature fluctuations.

1.2. Geological Settings

The Calabria–Peloritani Arc (CPA) [64,65], in southern Italy (Figure 1a), is a part of the central Mediterranean orogen extruded towards the oceanic crust of the Ionian Basin during the final stage of Africa–Europe collision [66,67,68]. In particular, the CPA is a stack of crystalline basement nappes, locally covered by Meso-Cenozoic sedimentary deposits. The CPA is split into two main sectors: the northern and the southern sectors, separated by the Catanzaro Trough [69,70,71,72]. The study area (Figure 1b) falls in the northern sector of CPA and is characterised by Meso-Cenozoic carbonates of the Verbicaro Unit affected by an HP-LT metamorphism [73,74,75,76]. In particular, the local lithology consists mainly of Late Triassic metadolostones, Giurassic metalimestone, and metapelites and metarenites of Early Cretaceous age [77,78]. Several studies [69,79,80,81,82] agree in referring this Unit to the Western Tethys oceanic paleodomain. The Verbicaro Unit is tectonically overlapped onto the Pollino Unit, e.g., [83,84,85], consisting of platform carbonates, Triassic–Early Miocene in age, locally intruded by basaltic rocks [69,74,76,79,80,86,87]. The ophiolitic Ligurian Unit, constituted by ophiolites and deep-sea sedimentary deposits, originated during the Late Jurassic–Early Cretaceous period and subsequently overthrusted both the previous Units [80,82,88] (Figure 1b). The Calabride Unit (sensu [79]), the uppermost of the tectonostratigraphic pile, consists of medium- to high-grade metamorphic rocks (Variscan metamorphism) [80,89,90,91]. It represents a continental crustal section including small volumes of the subcontinental mantle rocks that preserved the records of the late Variscan orogenic deformations [90,91].
Scattered outcrops of Carbonatoclastic and siliciclastic Miocene deposits [92,93] unconformably lie above the previous units of the tectonic prism. Finally, marine and continental Quaternary deposits fill the basins originating from the recent extensional tectonic activity and the present valleys of the main rivers [94,95,96,97,98,99].
An intensive weathering process affects all the crystalline rocks of the Calabride Unit [59,100], causing widespread slope instability phenomena [7,101,102]. Due to marine aerosols, the weathering processes also affected the sedimentary deposits, mainly in coastal areas, e.g., [102]. Moreover, the basaltic rocks, affected by primary hydrothermal alteration processes, are subsequently involved in weathering processes that produce volcanoclastic sediments [87]. The latter serves as a source of sediment production within the Quaternary basins, alluvial plains, and coastal marine areas.
The stratification of the Verbicaro Unit carbonates is poorly preserved due to various tectonic phases over geological time [103,104]. Indeed, in the study area, cataclastic fault zones of varying sizes isolate portions of disconnected stratigraphic beds, which do not continuously connect with adjacent layers. In Calabria, the neotectonic pattern is dominated by extensional fault systems-oriented NW-SE, NE-SW, and N-S, e.g., [94,103,104,105]. These tectonic lineaments gave a strong morphostructural imprint to the region, at least since the Late Pliocene, and are the local expression of the active extensional belt developed along the Apennine axial zone (Figure 1a) [106,107,108,109,110,111,112] controlling the distribution of significant seismic activity and the uplifting process at the regional scale, e.g., [70,94,95,113,114,115]. In the study area, the neotectonic framework is mainly characterised by an NW-SE fault system with a dip direction to SW (Figure 1b).
Figure 1. (a) Location map and major tectonic domains in the Italian peninsula; black rectangle indicates the panel b location; Blue strip indicates the active extensional domain (modified after [110]); Red strip indicates the active compressional domain (modified after [110]); in Orange, the Calabria region. (b) Geological-Structural map of the studied area (c) Orthophoto of the study area; the square shows the study area. (d) View of the Arcomagno locality.
Drones 08 00031 g001

2. Materials and Methods

The methodology employed in this study was designed to achieve high-resolution mapping of the geomechanical features characterising rock scarps in the Arcomagno locality. In this regard, a comprehensive approach was used, combining remote sensing techniques, aero-photogrammetric field surveys, and advanced software tools to analyse the collected data. Figure 2 presents the workflow, illustrating all the phases involved in the methods, from identifying the location from satellite images to generating DOMs to the geostatistical, geostructural, and kinematic rockfall analysis in the cliffs.
The initial phase consisted of a comprehensive review of satellite imagery, utilising sources such as ESRI world imagery to identify the study area better. ESRI World Imagery was a key resource, offering one-meter or superior satellite and aerial imagery in various global regions. The Maxar imagery was also incorporated with a worldwide 1 m resolution. The World Imagery map contains high-resolution satellite images for the GIS User Community. The collected images were used to identify the study area and its tectonic framework with high accuracy. Field surveys were carried out to ground-truth the information previously obtained from images. An Unmanned Aerial Vehicle (UAV) equipped with a high-resolution camera was subsequently deployed to capture detailed, high-quality images of the rock surfaces from various angles and altitudes. The collected images were processed using specialised photogrammetry software (Agisoft Metashape Pro v. 1.8.5) to create accurate Digital Outcrop Models (DOMs). The detailed aero-photogrammetric investigation was performed using the UAV technique, and the data were employed in advanced geospatial software and analytical methods to create accurate 3D models. For precise georeferencing of digital images, we employed the Post-Processing Kinematic (PPK) method using the Topodrone PPK Post-Processing version 1.0.10.0 software, accessible at [https://topodrone.com/ (accessed on 17 January 2024)] [116,117,118]. The work method was based on the following steps: (a) utilisation of a drone for capturing high-resolution images; (b) construction of a high-resolution DOM showing the detailed geomechanical characteristics; (c) identification of jointing features and fracturing frequency grade on rock scarp surfaces; (d) recognition of the possible kinematic failure modes on the rock scarps. CloudCompare version 2.13 software was hence employed for the semi-automatic extraction of geomechanical data from the DOMs. These data were processed in a stereographic analysis through Rocscience Dips 7.0 Software to assess the possible rockfall kinematic types that could trigger on rock slopes. Finally, a joint frequency analysis was conducted using the data obtained from CloudCompare v. 2.13 and processed by ESRI ArcMap 10.8/ArcGIS Pro software. The collected results gave valuable information about recognising the possible rockfall-prone areas that could trigger new possible fall events in the future.
The methodologies employed in the manuscript are carefully described below.

2.1. UAV Photogrammetric Survey Data

Several studies investigated the application of UAV photogrammetry with integrated GNSS RTK/PPK [116,117,118,119,120,121,122]. Incorporating GNSS RTK/PPK modules on UAVs enables the creation of highly detailed Digital Terrain Models (DTMs) without requiring an extensive deployment of Ground Control Points (GCPs) or checkpoints [118,123,124]. This research used the aero-photogrammetric survey methodology to create a georeferenced DOM. Post-Processing Kinematics (PPK), an alternative technique to the classical photogrammetric survey, was applied in this research. The PPK technique allows accurate positioning of the photos, permitting the DOM construction with a centimetric resolution and avoiding GCPs position [118]. The used instrumentations are a base station (Emlid Reach RS2 GNSS/RTK L1, L2, L5 system) positioned on the ground surface and an antenna rover (L1/L2 RTK/PPK) equipped on the drone (Figure 3a–e) that records raw GNSS logs. The latter are then processed to obtain an accurate positioning track of the pre-established flight path.
DJI Mavic 2 Pro UAV, equipped with a camera sensor of 1″ CMOS, 20 MegaPixel, lens FOV of 77° 28 mm (35 mm format equivalent), and image size of 5472 × 3648, was used to acquire the images.
Flight paths were carefully designed (Figure 4a,b) to cover the entire study area and capture overlapping aerial imagery from various angles and positions, as recommended by Lucieer et al. [125] and James and Robson [51] (Figure 4c–e). Two missions were carried out using the Pix4D application in automatic flight mode, maintaining an altitude of 100 m a.g.l. (Table 1). The length and the flight paths of the UAV for the two automatic missions varied. The “Double Grid” mission, which followed N-S and E-W flight paths, covered 5695 m. On the other hand, the “Single Grid” mission, which was oriented exclusively along the N-S flight path, spanned 6103 m. The distance between consecutive images was set at 45 m for the ‘Double grid’ mission and 40 m for the ‘Single grid’ mission, ensuring good data accuracy and effective image overlap (Figure 4c–e and Table 2). Keeping sufficient overlap and sidelap percentages among the collected images is a fundamental condition, e.g., [125]. So, in this research, for optimal image coverage, the ‘Double grid’ mission was configured with a 60% for both overlap and sidelap; instead, the ‘Single grid’ mission had a 70% for overlap and sidelap. The gimbal angle, which determines the camera’s orientation during the flight, was set at 70 degrees for the ‘Double grid’ mission and a steeper 90 degrees for the ‘Single grid’ mission.
Furthermore, the DJI_GS and Pix4D command applications were employed to realise a planimetric-altimetric model. These flights were performed to collect images to construct a high-resolution DOM of the studied area. Additionally, five missions in manual flight mode were executed (Figure 5 and Table 1) to survey carefully the vertical rock surfaces and to create an ultra-high resolution of each rock scarp. However, we utilised five manual flight modes to survey areas with counter-sloping cliff features that were not visible in the previous flights. The sole use of automatic flight with a camera oriented predominantly perpendicular to the ground proved inadequate for capturing information in concealed areas that were not directly visible. For this reason, different aerial strips at various heights were carried out on the vertical walls, keeping the camera gimbal perpendicular to the steep slopes. In alternative to the first software used for automatic flight, the DJI_GO4 software was used for manual flights, and the height was variable from 2–5 m to 30–50 m from the ground surface. The software and applications utilised for the flights were installed on the Apple iPad Air 2 device. Considering the UAV battery lifetime, seven takeoffs and landings were performed for the complete aerial photogrammetric acquisitions, resulting in 1372 images. The overall flight duration for all acquisitions was approximately 04:30 (hh:mm) (Table 1). Table 1 summarises the main characteristics of each UAV flight; Table 2 shows the main features of Automatic Flight Missions. The images captured during the five missions in manual flight mode, aided by the PPK process ensuring centimetric precision in image positioning, were integrated into the software along with the images acquired in planimetric flights using automatic flight mode. Subsequently, all images from both manual and automatic flights were analysed using the Agisoft Metashape Pro v. 1.8.5 software. By incorporating all images, the software automatically recognised and aligned all photos, resulting in a single DOM on which all subsequent analyses were conducted.

2.2. Photogrammetric Data Processing

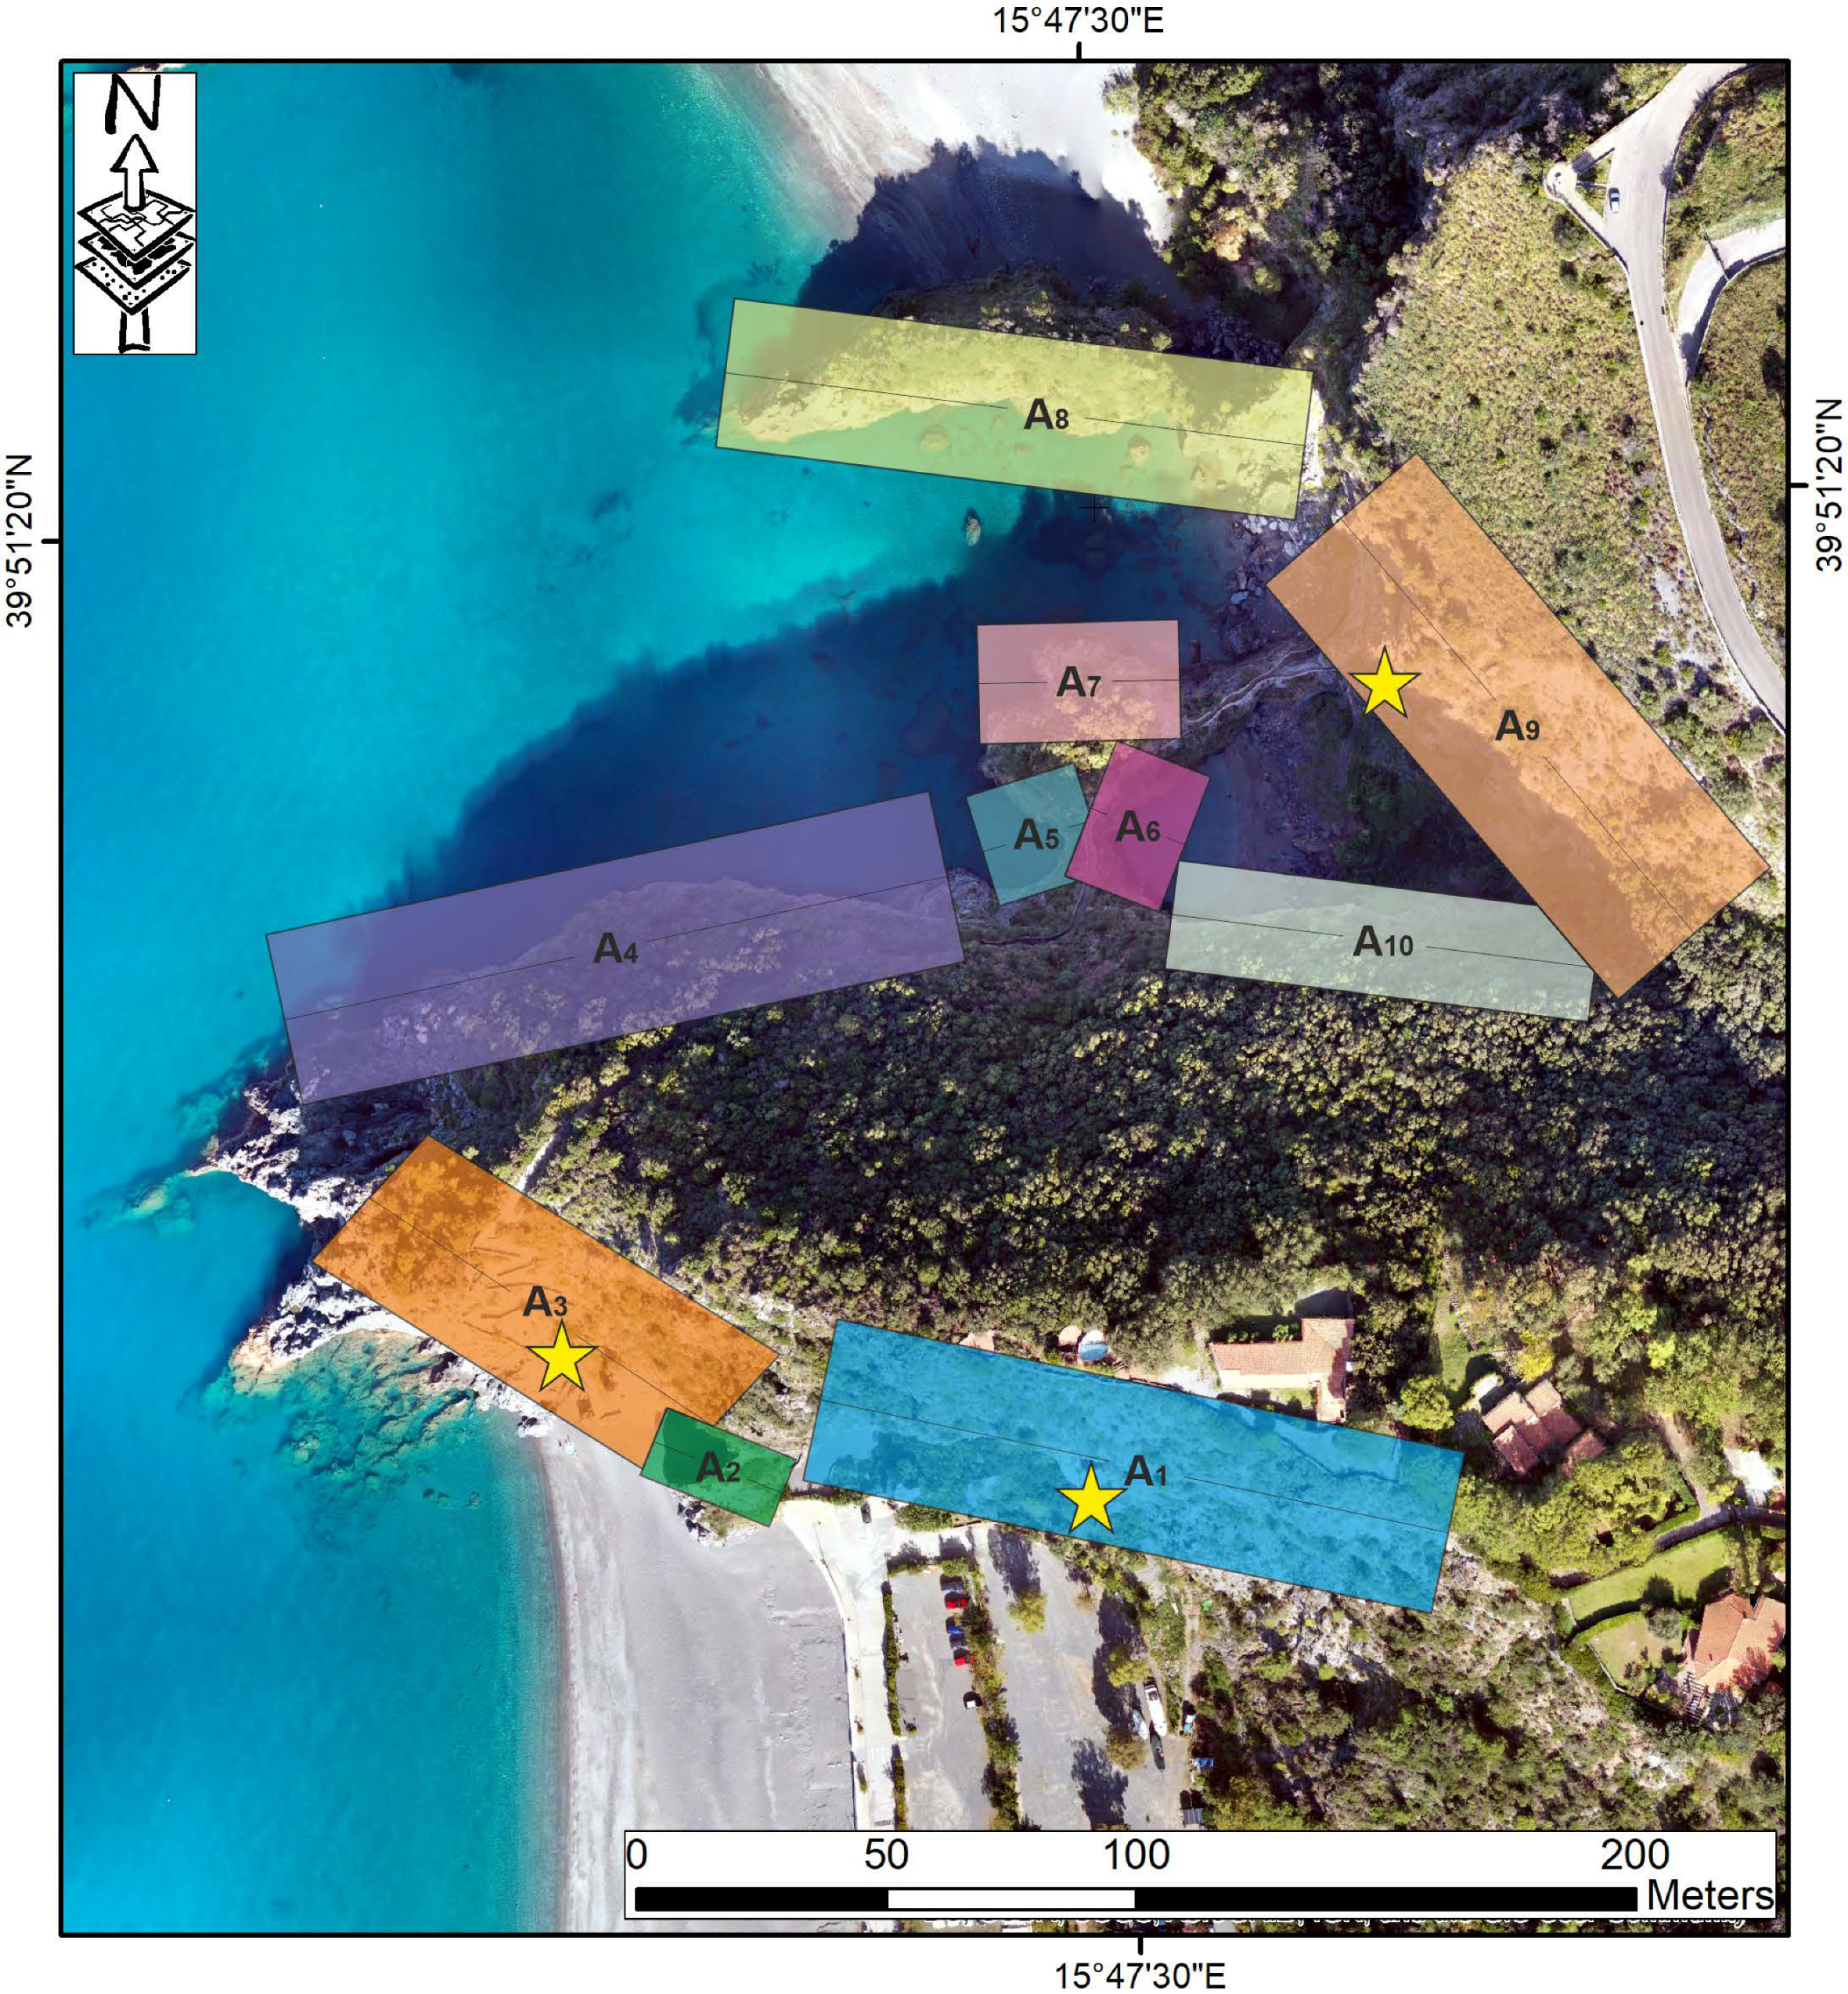
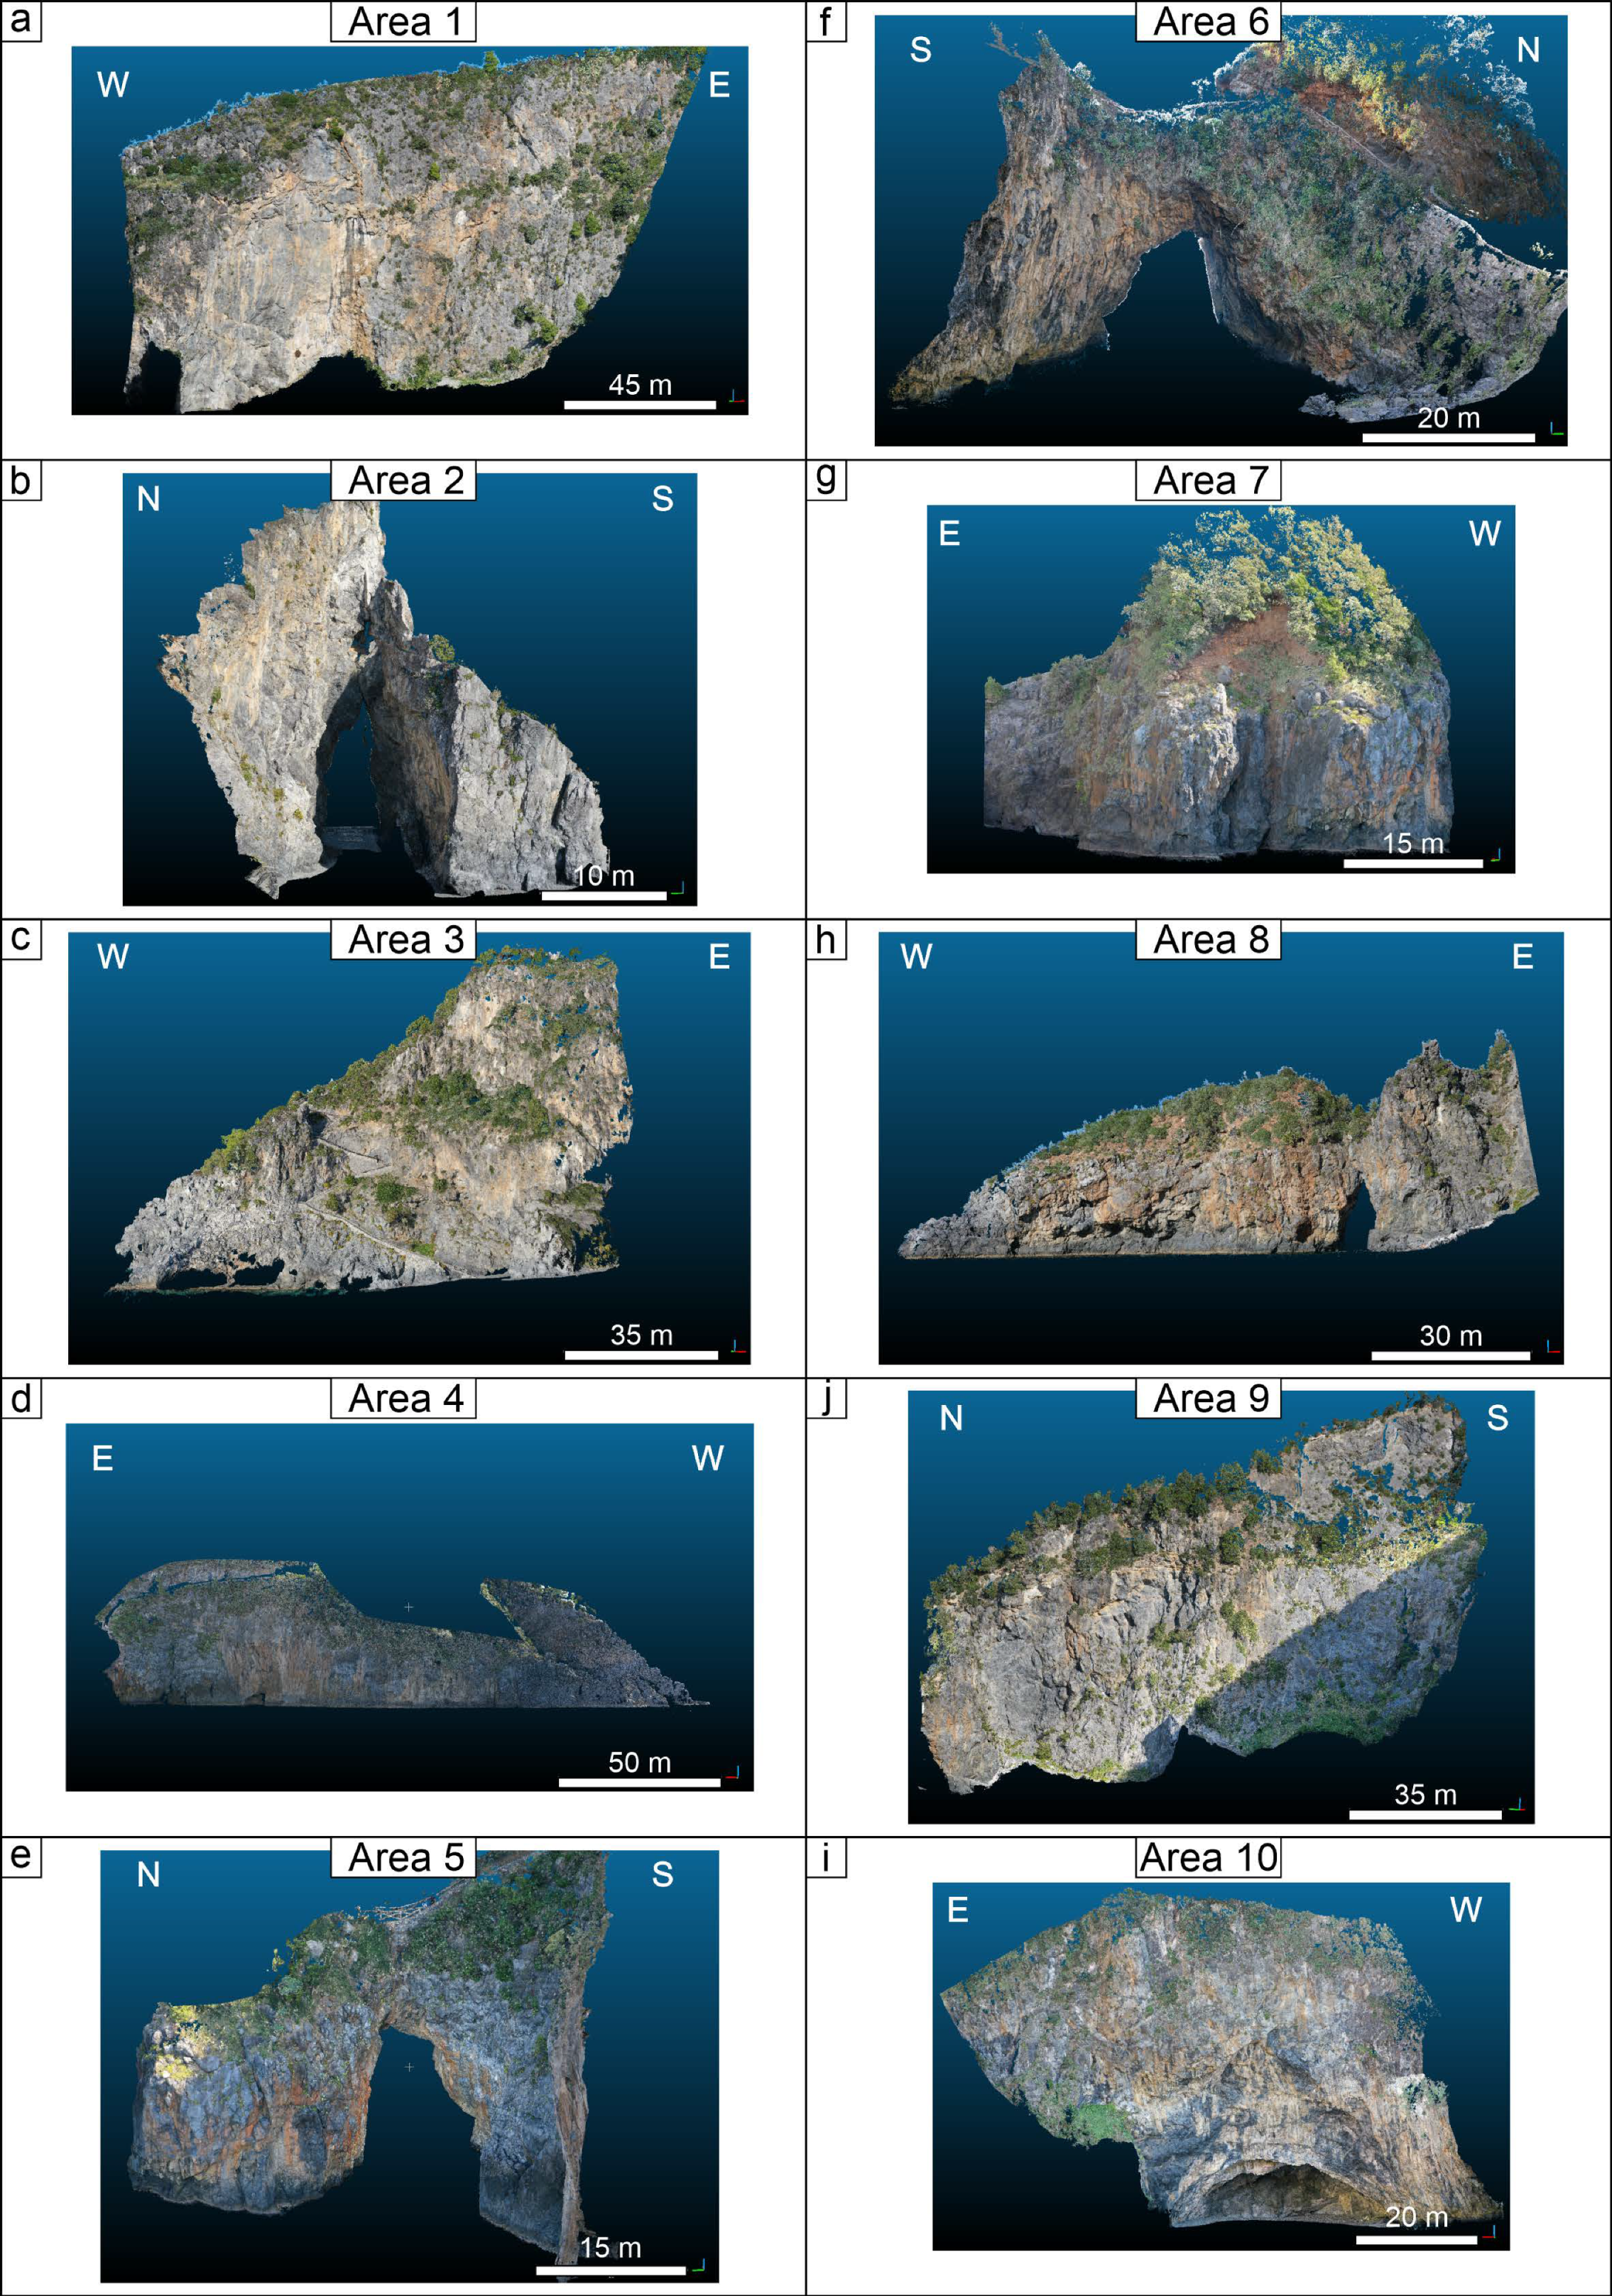
Photogrammetric processing was performed using a Desktop-PC at the University of Chieti Structural Geological, Cartography, and Geological Modeling Laboratory with the following characteristics: Intel Core i9-9940X CPU 3.3 GHz (Turbo Boost Max 4.50 GHz, 19.25 MB Intel Smart Cache, 14 cores, 28 threads), 128 GB RAM (8 × 16 GB DDR4-3000 MHz), GPU Zotac RTX 2080 super (8 GB GDDR6), and Samsung SSD 860 QVO 4 TB, running Agisoft Metashape Professional v. 1.8.5 Software. The processing with Agisoft Metashape v. 1.8.5 Professional software was necessary to obtain a high spatial resolution for the DOM. The latter was gained through ultra-high-quality processing of 348 aligned images obtained from the 1 and 2 paths of automatic flights (Table 1 and Table 2). So, the DOM consists of 230,528 sparse point clouds, 308,066,829 dense point clouds, meshes and textures, 89,207,972 faces of 3D models, and tiled models. Subsequently, several Digital Terrain Models (DTMs) showing elevation, slope degree, and slope exposure were constructed. The images acquired during missions 1 and 2 allowed the construction of an orthomosaic imagery model with a resolution of 3.71 cm/px (Figure 6) of the studied area, where 10 vertical rock scarps were identified for the geomechanical analysis. The scarps were chosen based on the following features: unvegetated areas, variable geographic orientations of the front scarps, areas potentially prone to or involved in previous rockfall events, and areas crowded by numerous tourists during the summer season. Finally, a Digital Outcrop Model (DOM) was generated for each rock scarp using Agisoft Metashape Professional v. 1.8.5 software, relying on UAV-PPK photogrammetry data (Figure 7).
In agreement with previous studies [120,121,126,127,128], for the construction of the DOM, only four GCPs/checkpoints were employed to reach centimetric accuracy. Based on standard deviations in X, Y, and Z coordinates, accuracy assessment aligns with the expected method of PPK measurement accuracies, falling within 3 to 6 cm for each measured GCP/checkpoint. Image positioning errors were 1.36 cm in X, 2.36 cm in Y, and 6.15 cm in Z, with a combined error of 2.73 cm in XY and a total error of 6.73 cm.

2.3. Fracturing Data Extraction

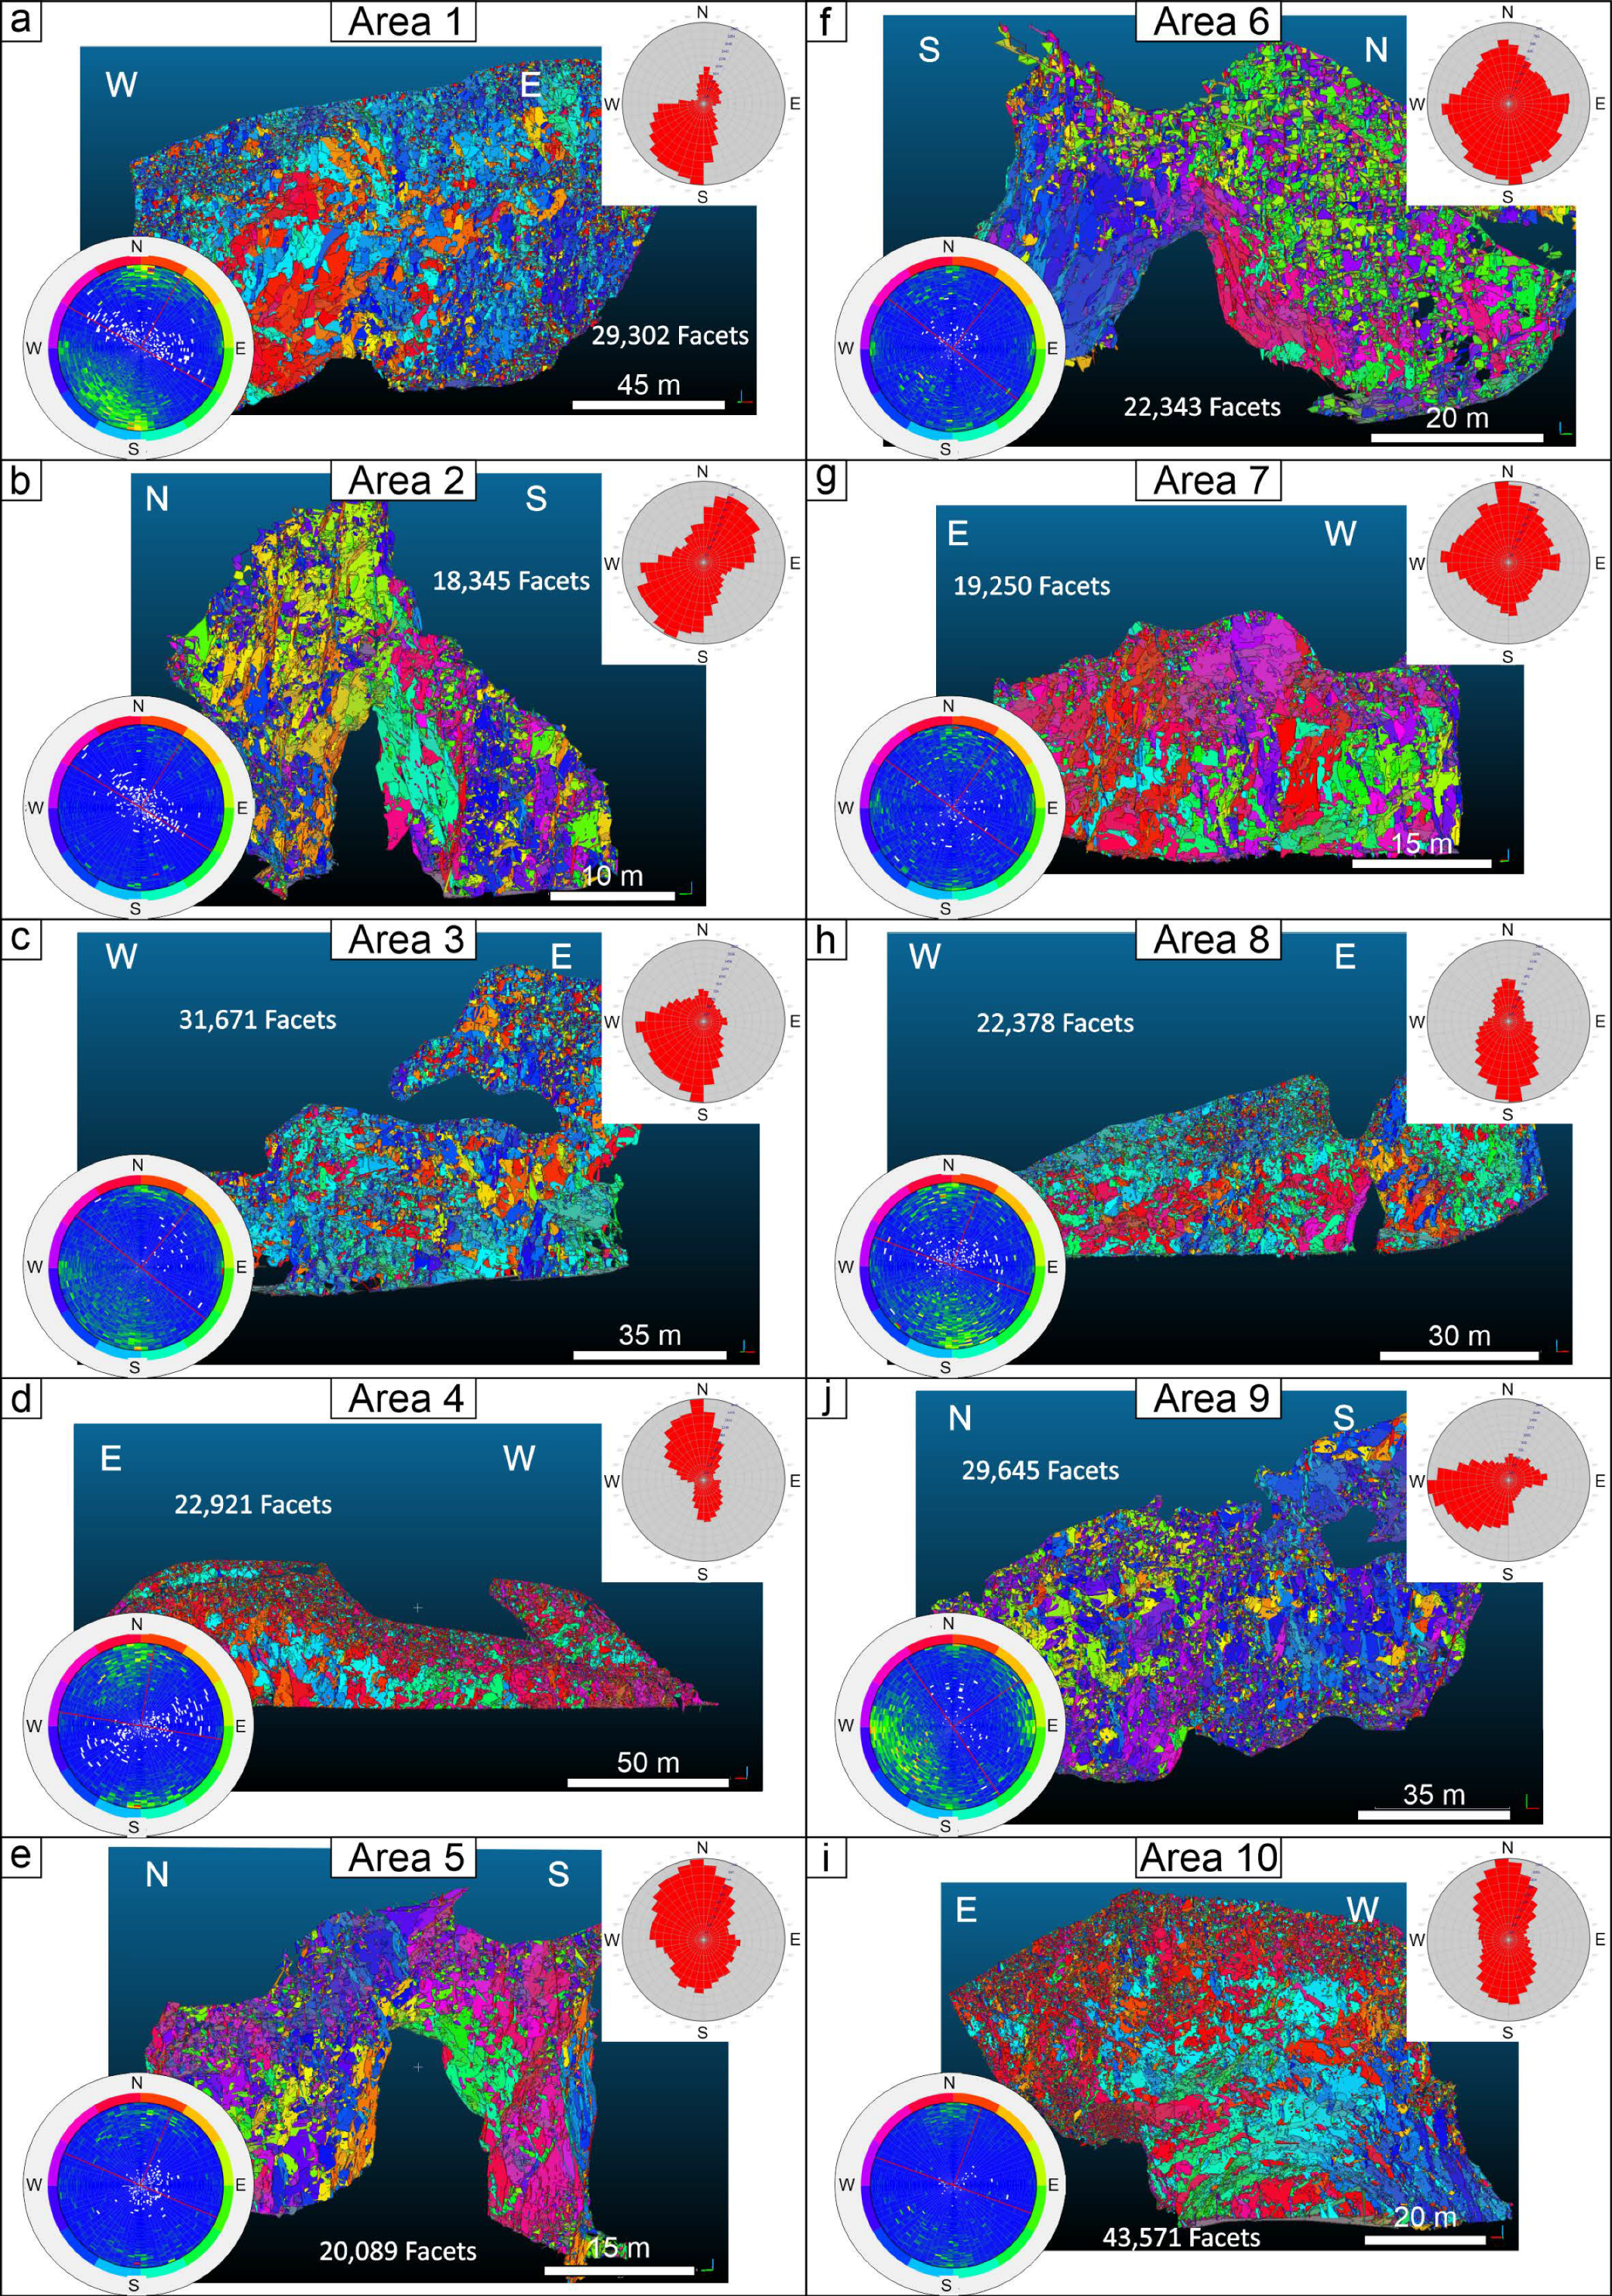
The dense point clouds, orthomosaics, and DTM were analysed through image interpretation techniques to identify the geomechanical features, such as joints, faults, and bedding planes. These features are crucial in determining the potential pathways for rockfall events. The open-access software CloudCompare v. 2.13 was utilised to identify geomechanical features from the DOM (Figure 8), employing the Facet/Fracture detection tool [129]. Several authors [9,21,129,130,131] asserted that CloudCompare v. 2.13 software is a reliable and valuable methodology for extracting jointing sets, avoiding in-field surveys in inaccessible human areas. Indeed, the confidence in the extraction data is notably high [9,38,118] due to the well-established georeferencing and spatial orientation of the DOMs. So, on the surface of each rock scarp, the discontinuities were recognised based on dip direction and dip angle. In particular, the dense cloud points generated from the photogrammetry process were the input files to the CloudCompare v. 2.13 software. The Facet/Fracture plugin was used to divide the point cloud into sub-cells and to identify elementary planar objects (e.g., fracture planes). The latter were aggregated progressively into polygons according to a planeity threshold. Details of the principles, functions, and capabilities of the Facet/Fracture plugin can be found in Dewez et al. [129]. Finally, the data obtained by digital methodology on vertical rock scarps were compared with data collected in situ through the scanline method performed in three measurement stations located in human-accessible areas (Figure 6). The in-situ data were collected through traditional survey methodologies using analogical compass-clinometers and modern digital survey methods by the Fieldmove geological survey app, already widely tested in previous research [38,118,132,133,134,135,136,137,138].

2.4. Kinematic Analysis

Discontinuity orientation data, extracted from the Digital Outcrop Models (DOMs), were utilised for kinematic analysis of rock scarps by a stereographic representation. This methodology shows clear and intuitive data visualization, facilitating the transmission of information on rock slope instability to competent authorities and stakeholders. The analysis was performed by the “Computes and Displays Stereograms” tool of CloudCompare v. 2.13 software, which assessed the kinematic analysis of rock slopes through a representation of the dip directions of the detected rock facets [129]. Hence, based on the intersection between the slope and discontinuity directions, the most probable failure mechanism among the rockfall types was identified on each rock scarp. The stereographic representation was also helpful in recognizing patterns of polymodality in the dip directions of the facets, where multiple failure directions can coexist.
The analysis of the kinematic failure mode was performed using a basic friction angle of 30°, estimated through a direct shear test according to I.S.R.M. suggested methods [139]. Other data inputs employed for the analysis were a Slope Dip of 85° and a Lateral Limit of 40°. Furthermore, the main plot characteristics were Contour data: Pole Vectors; Contour Distribution: Fisher; Counting Circle Size: 1.0%; Plot Mode: Pole Vectors; Hemisphere: Lower; Projection: Equal Angle. Instability mechanisms investigated by the used methodology are planar sliding [9], flexural, and direct toppling [140,141]. Finally, it is noteworthy that the used analysis only considers the discontinuities extracted from the dense Points Cloud through CloudCompare v. 2.13 software and the Facet/Fracture plugin, so it does not feel the possible presence of minor or irregular fractures not recognised by the software. In this aspect, this approach could underestimate the probability of instabilities in the studied areas.

2.5. Jointing Frequency Analysis

Jointing frequency assessment is critical for identifying the rockfall-prone areas on vertical rock scarps. In this study, we conducted a detailed analysis to recognise the jointing frequency starting from the number of planar facets gathered from CloudCompare v. 2.13 processing. The analysis allowed us to identify three different fracturation classes: moderate, high, and very high.
The methodological approach used in this study to recognise the fracturation state on rock scarp surfaces was based on the following steps: Firstly, vegetation was removed to obtain a clear view, allowing only the rock walls to be analysed. Subsequently, after obtaining the Facets, a central point from the mesh of each Facet georeferenced in space was extracted. Using these georeferenced points, a raster graphically representing the density of these points was constructed.
The kernel density points tool of ESRI ArcMap 10.8/ArcGIS Pro allowed the generation of a point density map reflecting the distribution of the extracted points. This approach allowed the identification of thirty classes within the density map using the “geometric interval method” [142]. The number of facets in each area determined the categorisation into three classes. Consequently, the “Very High” class includes an order of fractures exceeding 50 per square meter, the “High” class encompasses a number of fractures ranging from 5 to 50 per square meter, and the “Moderate” class pertains to areas with fewer than 5 fractures per square meter. This approach aims to identify areas with a variable number of facets, reflecting the discontinuity frequency. Therefore, areas with fewer facets or points indicate less fractured rock masses, while a higher facet or point density denotes a more significant presence of closely spaced discontinuities. The latter, consequently, represent the more prone areas to rockfall events.

3. Results

3.1. High-Resolution DTM Analysis

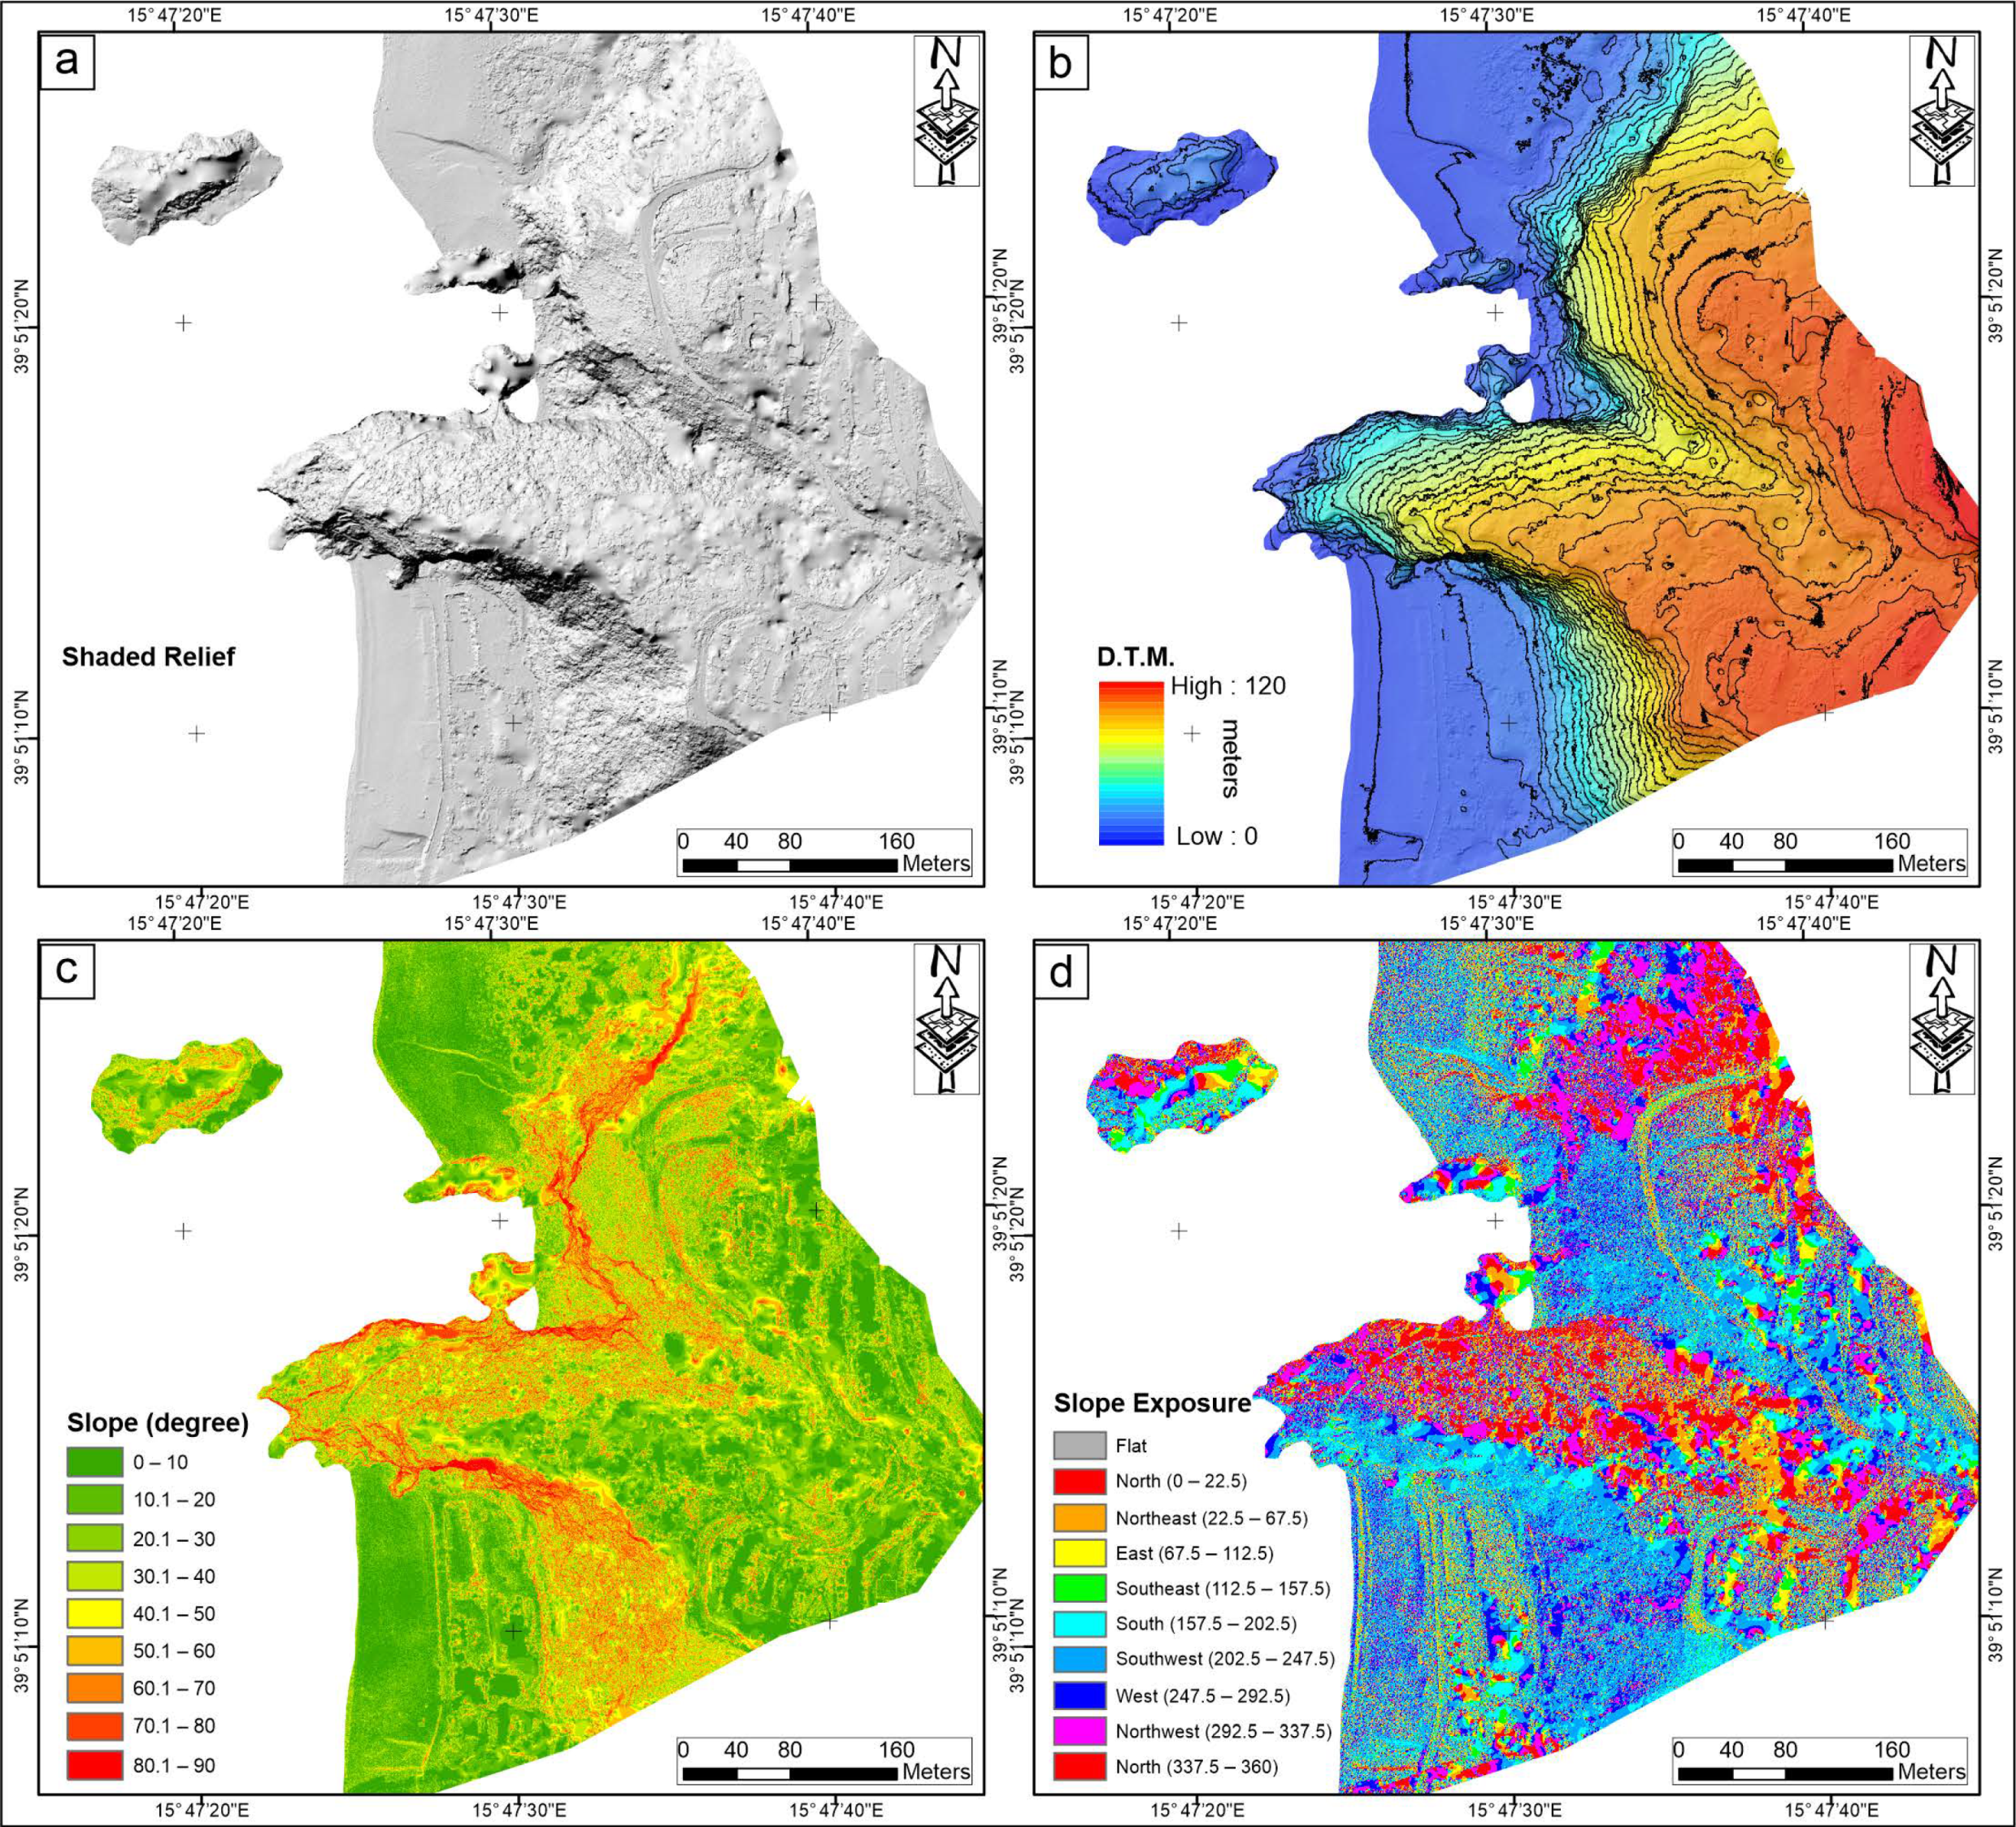
Through the aero-photogrammetric analysis, one of the significant outcomes of this research was the generation of a high-resolution Digital Terrain Model (DTM) with a detail of 3.71 centimetres per pixel. This DTM represented a valuable data source, enabling the acquisition of a wide range of topographic and geospatial information. Indeed, four detailed maps were extracted by using the DTM, as follows:
(i)
Shaded Relief (Figure 9a): This map was crucial in identifying several geomorphological elements essential for determining and delineating the 10 investigated areas. Indeed, the map shows the presence of various beach zones, variable in size, situated at the foot of some cliffs. The topographic differences are also evident in this DTM, and the pathways accessing different coves and pocket beaches are evident. Furthermore, on the map, a large parking area is observable at the base of the steeper cliff in Area 1 (Figure 6). Additionally, a clearly defined incised valley is noticeable in the central area, flowing directly into Arcomagno Beach, one of the most renowned beaches in the studied area.
(ii)
Digital Terrain Model (Figure 9b): This DTM analysis provided information on the elevation of each point of the studied area from sea level. Therefore, the maximum ground elevation within the study area was 120 m above sea level; instead, the analysed rock scarps reached elevations ranging between 20 and 120 m a.s.l. In particular, referring to Figure 6, Areas 1 and 3, with the cliff face strike oriented in the NW-SE direction, feature the highest rock faces, reaching heights exceeding 100 m. Areas 9 and 10, oriented NW-SE and E-W, respectively, have rock faces that reach heights of around 80 m. Conversely, areas 2, 4, 5, 6, 7, and 8 have shorter rock faces, with heights ranging from 20 to 60 m and slope orientations varying from N-S to E-W.
(iii)
Slope Degree (Figure 9c): This DTM allowed slope degree representation by measuring the angle between the ground surface and the horizontal plane. The highlights obtained by this DTM show that most of the analysed rock scarps fall in areas facing the sea and are characterised by slope degree values ranging between 70° and 90°. All studied areas were selected because they exhibit slopes with inclinations exceeding 40 degrees, and in most cases, these slopes surpass 70–80 degrees, forming vertical or overhanging rock faces (Figure 9c).
(iv)
Slope Exposure (Figure 9d): The analysis revealed the slope direction concerning the cardinal points (north, south, east, and west), showing that the examined surfaces predominantly orient towards the northern quadrants, followed by slopes facing the southern quadrants.

3.2. Analyses of Planar Facets

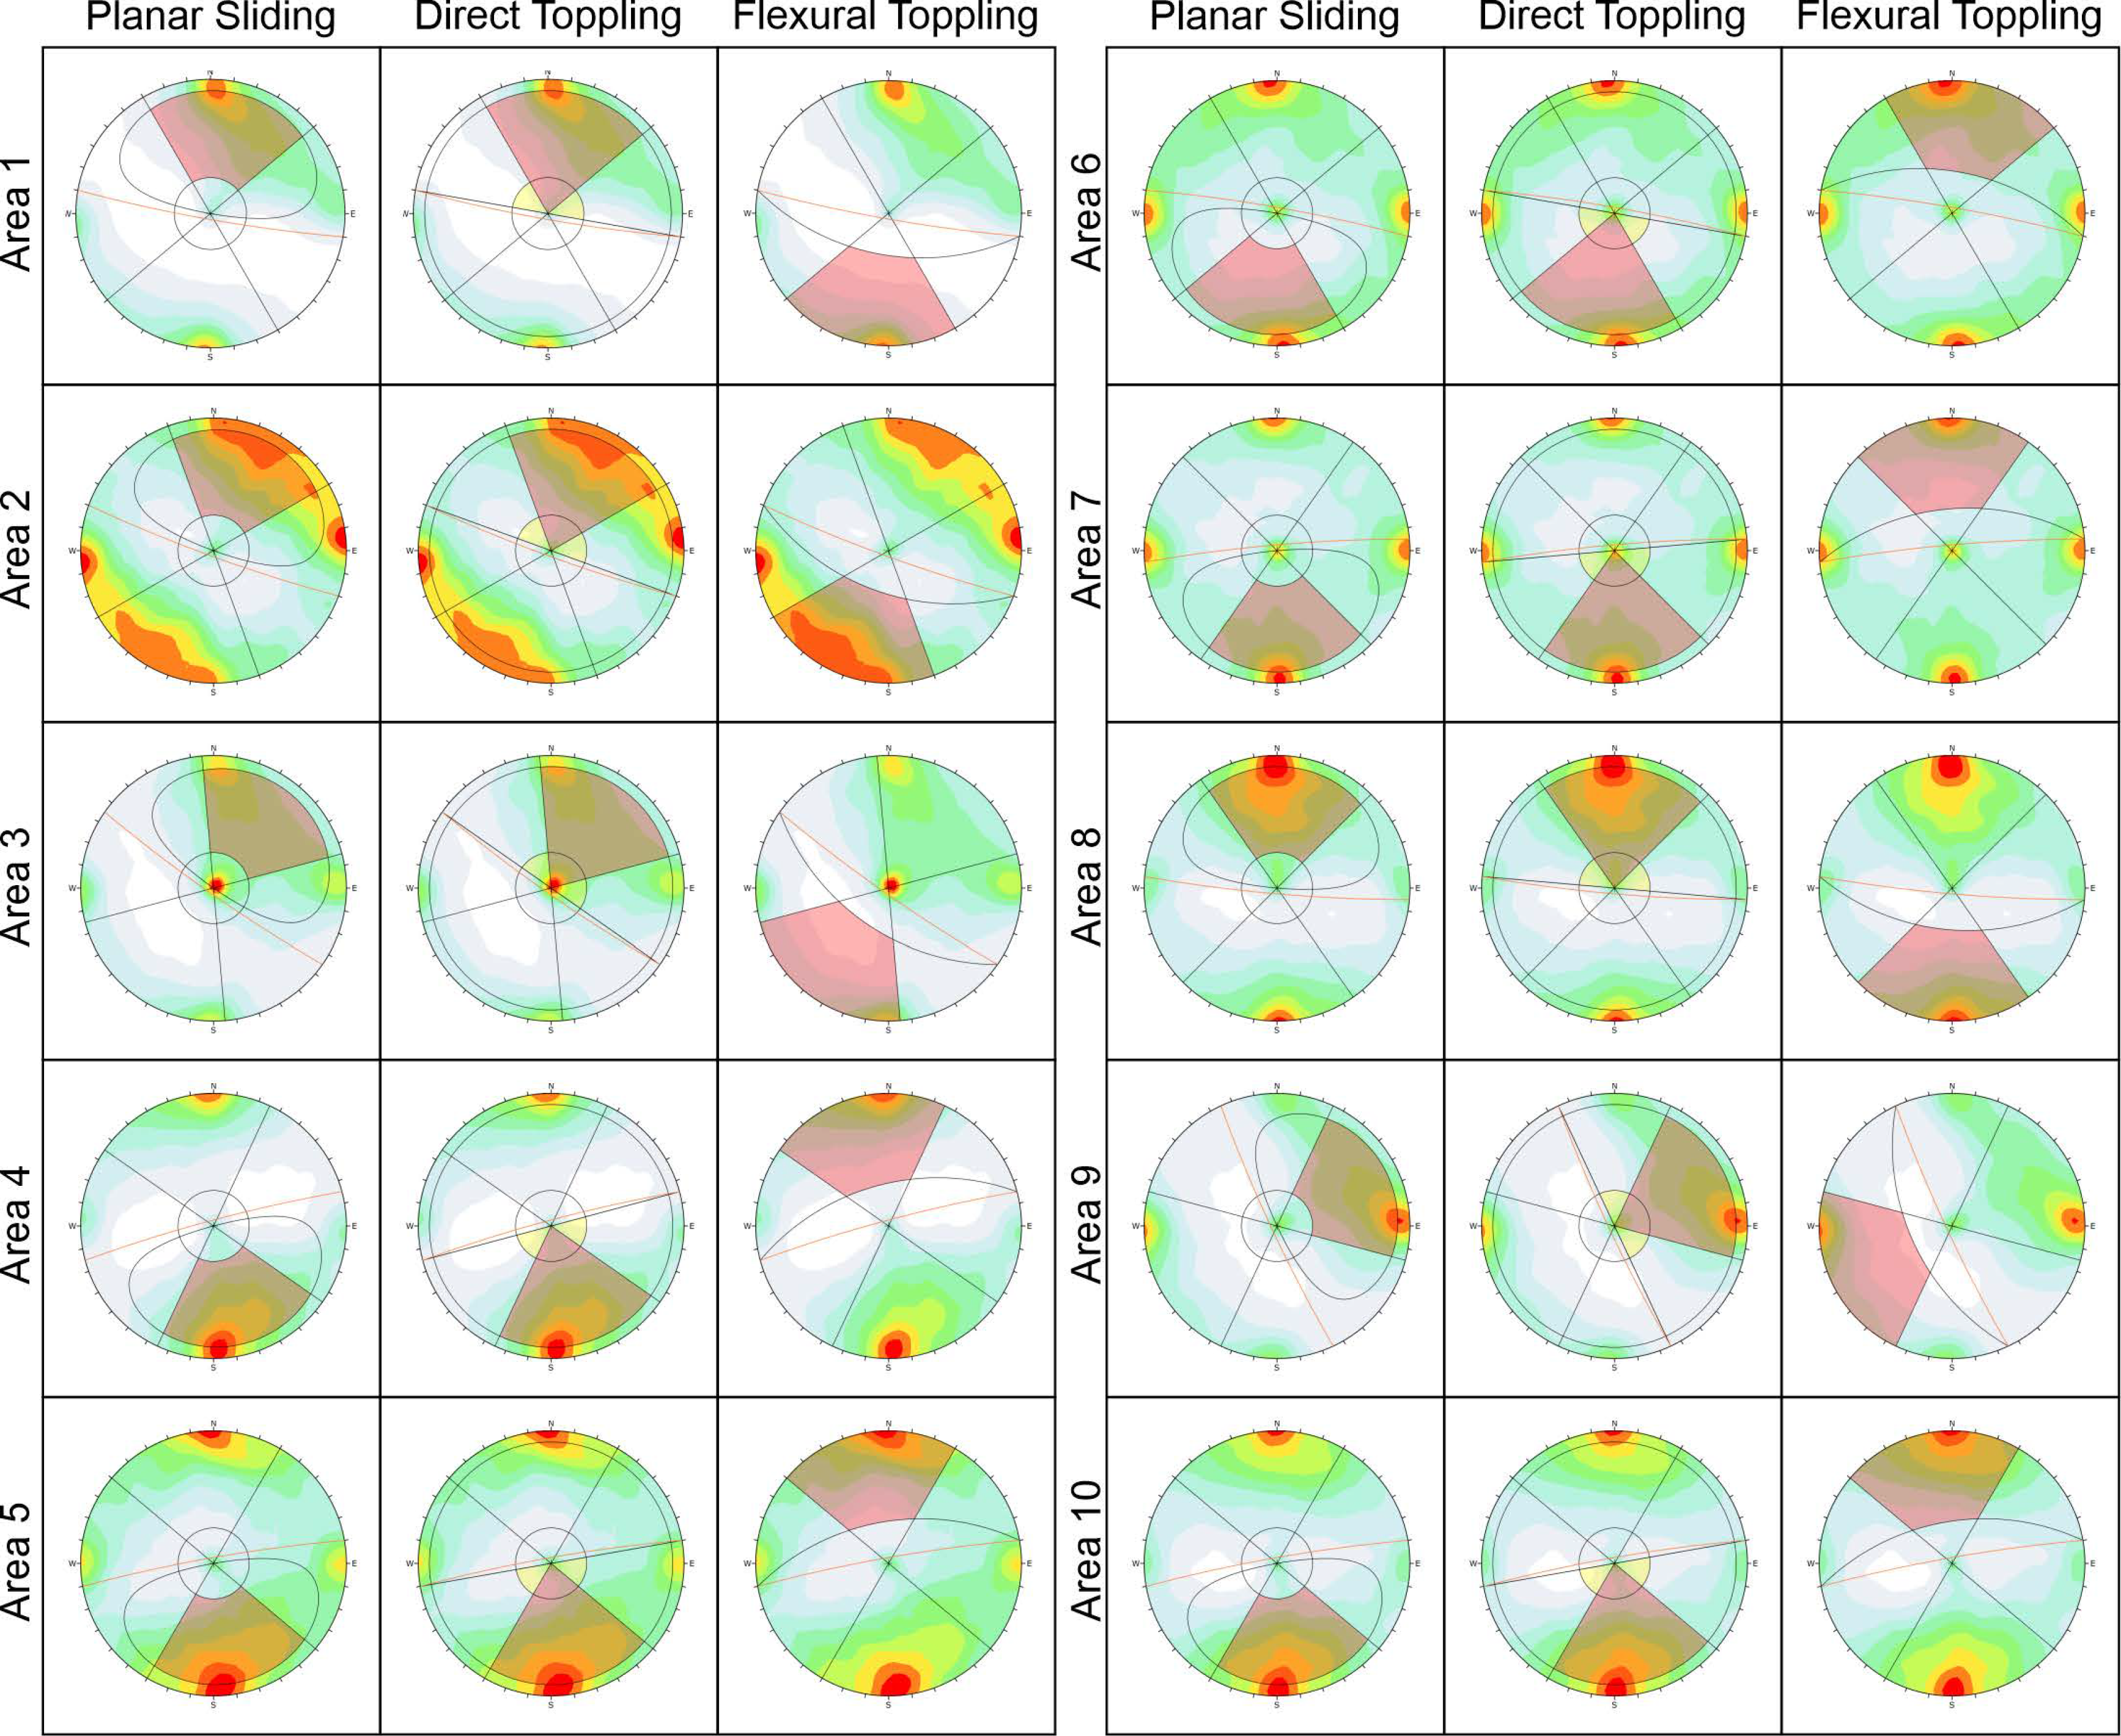
The geological discontinuities were recognised for each of the 10 areas in the Arcomagno locality (Figure 7 and Figure 8). Recognising 10 sectors within the studied area allowed for the identification of all discontinuities on each rock face and facilitated data elaborations. The number of facets in each of the 10 rock scarps (Figure 6, Figure 7 and Figure 8) shows a notable difference, mainly due to the diverse surface extension of the analysed areas. Indeed, the count of identified facets per area ranges from 18,000 within the smaller areas to a maximum of 43,000 within the larger areas. Different colours represent the facet orientations, according to their dip/dip direction, detected through CloudCompare v. 2.13 software and the Facet/Fracture plugin on each rock scarp surface (Figure 8). Rocscience Dip’s software was employed subsequently to analyse the possible kinematic failure modes (Figure 10) based on the discontinuity planes recognised in each of the 10 rock scarps. The results are summarised in Table 3 and graphically represented in Figure 8 and Figure 10.
Area 1, located in the southeastern part of the analysed area (Figure 6), shows a slope face oriented on average at N100°, with a dip slope up to 85°. The scarp has a length of 140 m, 90 m in height, and a total area of 1.32 Ha, where 29,302 facets were identified (Figure 8), mainly dipping between N190° ± 10° and N270° ± 10°, with a lesser presence of Facets dipping between N355° ± 10° and N030° ± 10° (see Rose Diagram in Figure 8a). The kinematic failure analysis (Figure 10) reveals that the dominant fall mechanism in this area is represented by “direct toppling”, involving 12,573 facets dipping towards N010° ± 10°, representing 42.92% of the total fractures (Table 3). The second mechanism, “planar sliding”, represented by 34.84%, involves 10,209 Facets. Finally, “flexural toppling”, with 16.27% and 4767 critical Facets dipping to N185° ± 10°, is the lesser mechanism (Table 3).
Area 2: the slope face, located in continuity with the previous one, shows a direction of N110°, with a slope of 85°. The morphology scarp is characterised by a length of 30 m, a height of 32 m, and an area of 0.07 Ha. The digital survey highlighted the presence of 18,345 facets (Figure 8), dipping both towards NE with a dispersion between N015° ± 10° and N075° ± 10° and towards SW with values between N190° ± 10° and N270° ± 10° (see Rose Diagram in Figure 8b). The failure analysis does not reveal evident predominant kinematics; indeed, “direct toppling” involves 5321 facets (equal to 29.01%) dipping between N005° ± 10° and N040° ± 10°. “Flexural toppling”, represented by 24.44%, involves 4483 facets dipping between N180° ± 10° and N230° ± 10°. Finally, “planar sliding”, with 23.75% corresponding to 4357 critical facets, is also well-represented.
Area 3 is represented by a slope face that is N125° oriented and a slope degree of 85°. The scarp shows a length of 110 m, a height of 70 m, and an area of 0.56 Ha. 31,671 facets (Figure 8), mostly dipping between N180° ± 10° and N270° ± 10° (see Rose Diagram in Figure 8c), were recognised. “Direct toppling” is the prevailing kinematic, affecting 13,378 planar facets (frequency percentage of 42.24%), mostly with dipping at N010°. “Planar sliding” shows a frequency percentage of 29.01% and involves 9187 facets. “Flexural toppling” is less represented, with 10.2% and 3231 facets.
Area 4 shows a rock scarp oriented on average at N075° and inclined at 85°. The scarp is 170 m long, has an average height of 35 m, and has a total area of 0.66 Ha. 22,921 facets, dipping at N350° ± 20° and towards N160° ± 10° (see Rose Diagram in Figure 8d), were identified. “Direct toppling” is the most abundant failure type, with a percentage of 41.97% represented by 9621 facets dipping at N175° ± 10°. “Planar sliding” is kinematically possible on 7989 facets, forming 34.85% of the total facets. Finally, “flexural toppling”, observed on 4785 facets (frequency percentage of 20.88%) dipping at N350°, is the least prevalent mechanism.
Area 5 is characterised by a rock scarp oriented at N080°, having a length of 45 m, a height of 30 m, and a total area of 0.08 Ha. 20,089 facets were identified, showing a considerable dispersion of dip slope data (see Rose Diagram in Figure 8e); however, a prevalence of facets dipping at N350° ± 10° is observable. In this area, “direct toppling” is the primary fall type represented by 6344 critical facets (equal to 31.58%) dipping at N175° ± 10°. “Planar sliding” is the second possible kinematics event identified on 5233 planar facets (frequency percentage of 26.05%), mostly with dipping at N170° ± 10°. Finally, “flexural toppling”, recognised on 3804 planar facets (frequency percentage of 18.94%) dipping at N355° ± 10°, is the least represented kinematic type.
Area 6 is dominated by a rock scarp with an N100° direction and a dip slope of 85°. The scarp is 70 m in length, 40 m in height, and has an area of 0.22 Ha. CloudCompare v. 2.13 software allowed the recognition of 22,343 planar facets (Figure 8f), which did not reveal a prevalent dipping direction, but a significant dispersion of data was observed (see Rose Diagram in Figure 8f). This dispersion is also reflected in the kinematics of rockfall (Figure 10), where none fall type prevails over the others, and their percentages are very similar (Table 3). Indeed, “flexural toppling” is possible on 5227 planar facets, representing 23.39% and showing a dip at N355° ± 10°. “Direct toppling” shows an occurrence percentage of 19.72%, observed on 4407 planar facets. “Planar sliding” can occur on 3218 planar facets (14.4%), having a preferential dip direction at N170° ± 10° (Table 3).
In area 7, the rock escarpment is oriented in an N085° direction and is characterised by a length of 42 m, a height of 25 m, and an area of 0.08 Ha. The number of planar facets collected was 19,250, which in the rose diagram in Figure 8g shows a considerable dispersion of dipping orientations with a slight prevalence of facets dipping at N355°. The kinematic analysis in Figure 10 highlighted that in this area, the dominant fall type is “direct toppling”, observed on 5734 facets dipping to N180°, representing 29.79% of the total facets (Table 3). The “planar sliding” is the second fall type, involving 4057 facets (21.08%) dipping to N180° with a lesser dip angle than the previous ones. Finally, “flexural toppling” is the least represented (15.92%) by 3065 planar facets having a dip orientation of N358°.
Area 8 shows a face slope oriented in the N085° direction and inclined at 85°, with some portions counter-sloping. The length of the rock scarp is 120 m, the height is 35 m, and the total surface is 0.29 Ha. 22,378 planar facets were recognised on the rock surface (Figure 8h), mostly dipping to N175° ± 20° and to a lesser extent towards N355° ± 10°. The prevailing fall kinematics (Figure 10) is “direct toppling”, with 9032 critical facets representing 40.36% of the total facets, mostly dipping towards N355° ± 10°. “Planar sliding” is the second fall type recognised on 9520 critical facets (frequency percentage of 31.78%), and finally, “flexural toppling” is the less representative fall type with 10,821 critical facets (frequency percentage of 24.84%) dipping towards N175° ± 10°.
Area 9 is characterised by a rock escarpment oriented at N335°, which has a length of 110 m, a height of 71 m, and an area of 0.64 Ha. This scarp is the only one arranged in a dip direction entirely different from the previous ones. 29,645 planar facets were recognised on the scarp surface, mostly dipping towards N270° ± 10° instead of N080° ± 10° is the less representative dip direction (Figure 8j). “Direct toppling” is the most recurrent fall kinematics (Table 3 and Figure 10), with 12,269 critical facets (41.39%), mostly dipping towards N085° ± 10°. “Planar sliding” was observed on 9520 critical facets (32.11%); instead, “flexural toppling”, with 4652 critical facets (15.69%) dipping towards N270° ± 10°, is the less representative fall type.
The rock escarpment in Area 10 is oriented at N080° in direction and approximately inclined at 85°. The analysed rock scarp is 90 m long and 55 m high, with a total area of 0.34 Ha. The digital analysis allowed us to recognise 43,571 facets dipping in two main directions, oriented at N350° ± 20° and N 170° ± 20° (see Rose Diagram in Figure 8i). The kinematic analysis (Figure 10) revealed that the “direct toppling” type could trigger 14,206 critical facets dipping at N180° ± 10° and is the prevalent fall kinematic with a frequency percentage of 32.6%. “Planar sliding” and “flexural toppling” are less frequent and were respectively recognised on 11,790 (frequency percentage of 27.06%) and 10,821 (frequency percentage of 24.84%) critical facets dipping towards N355° ± 10°.

3.3. Jointing Grade

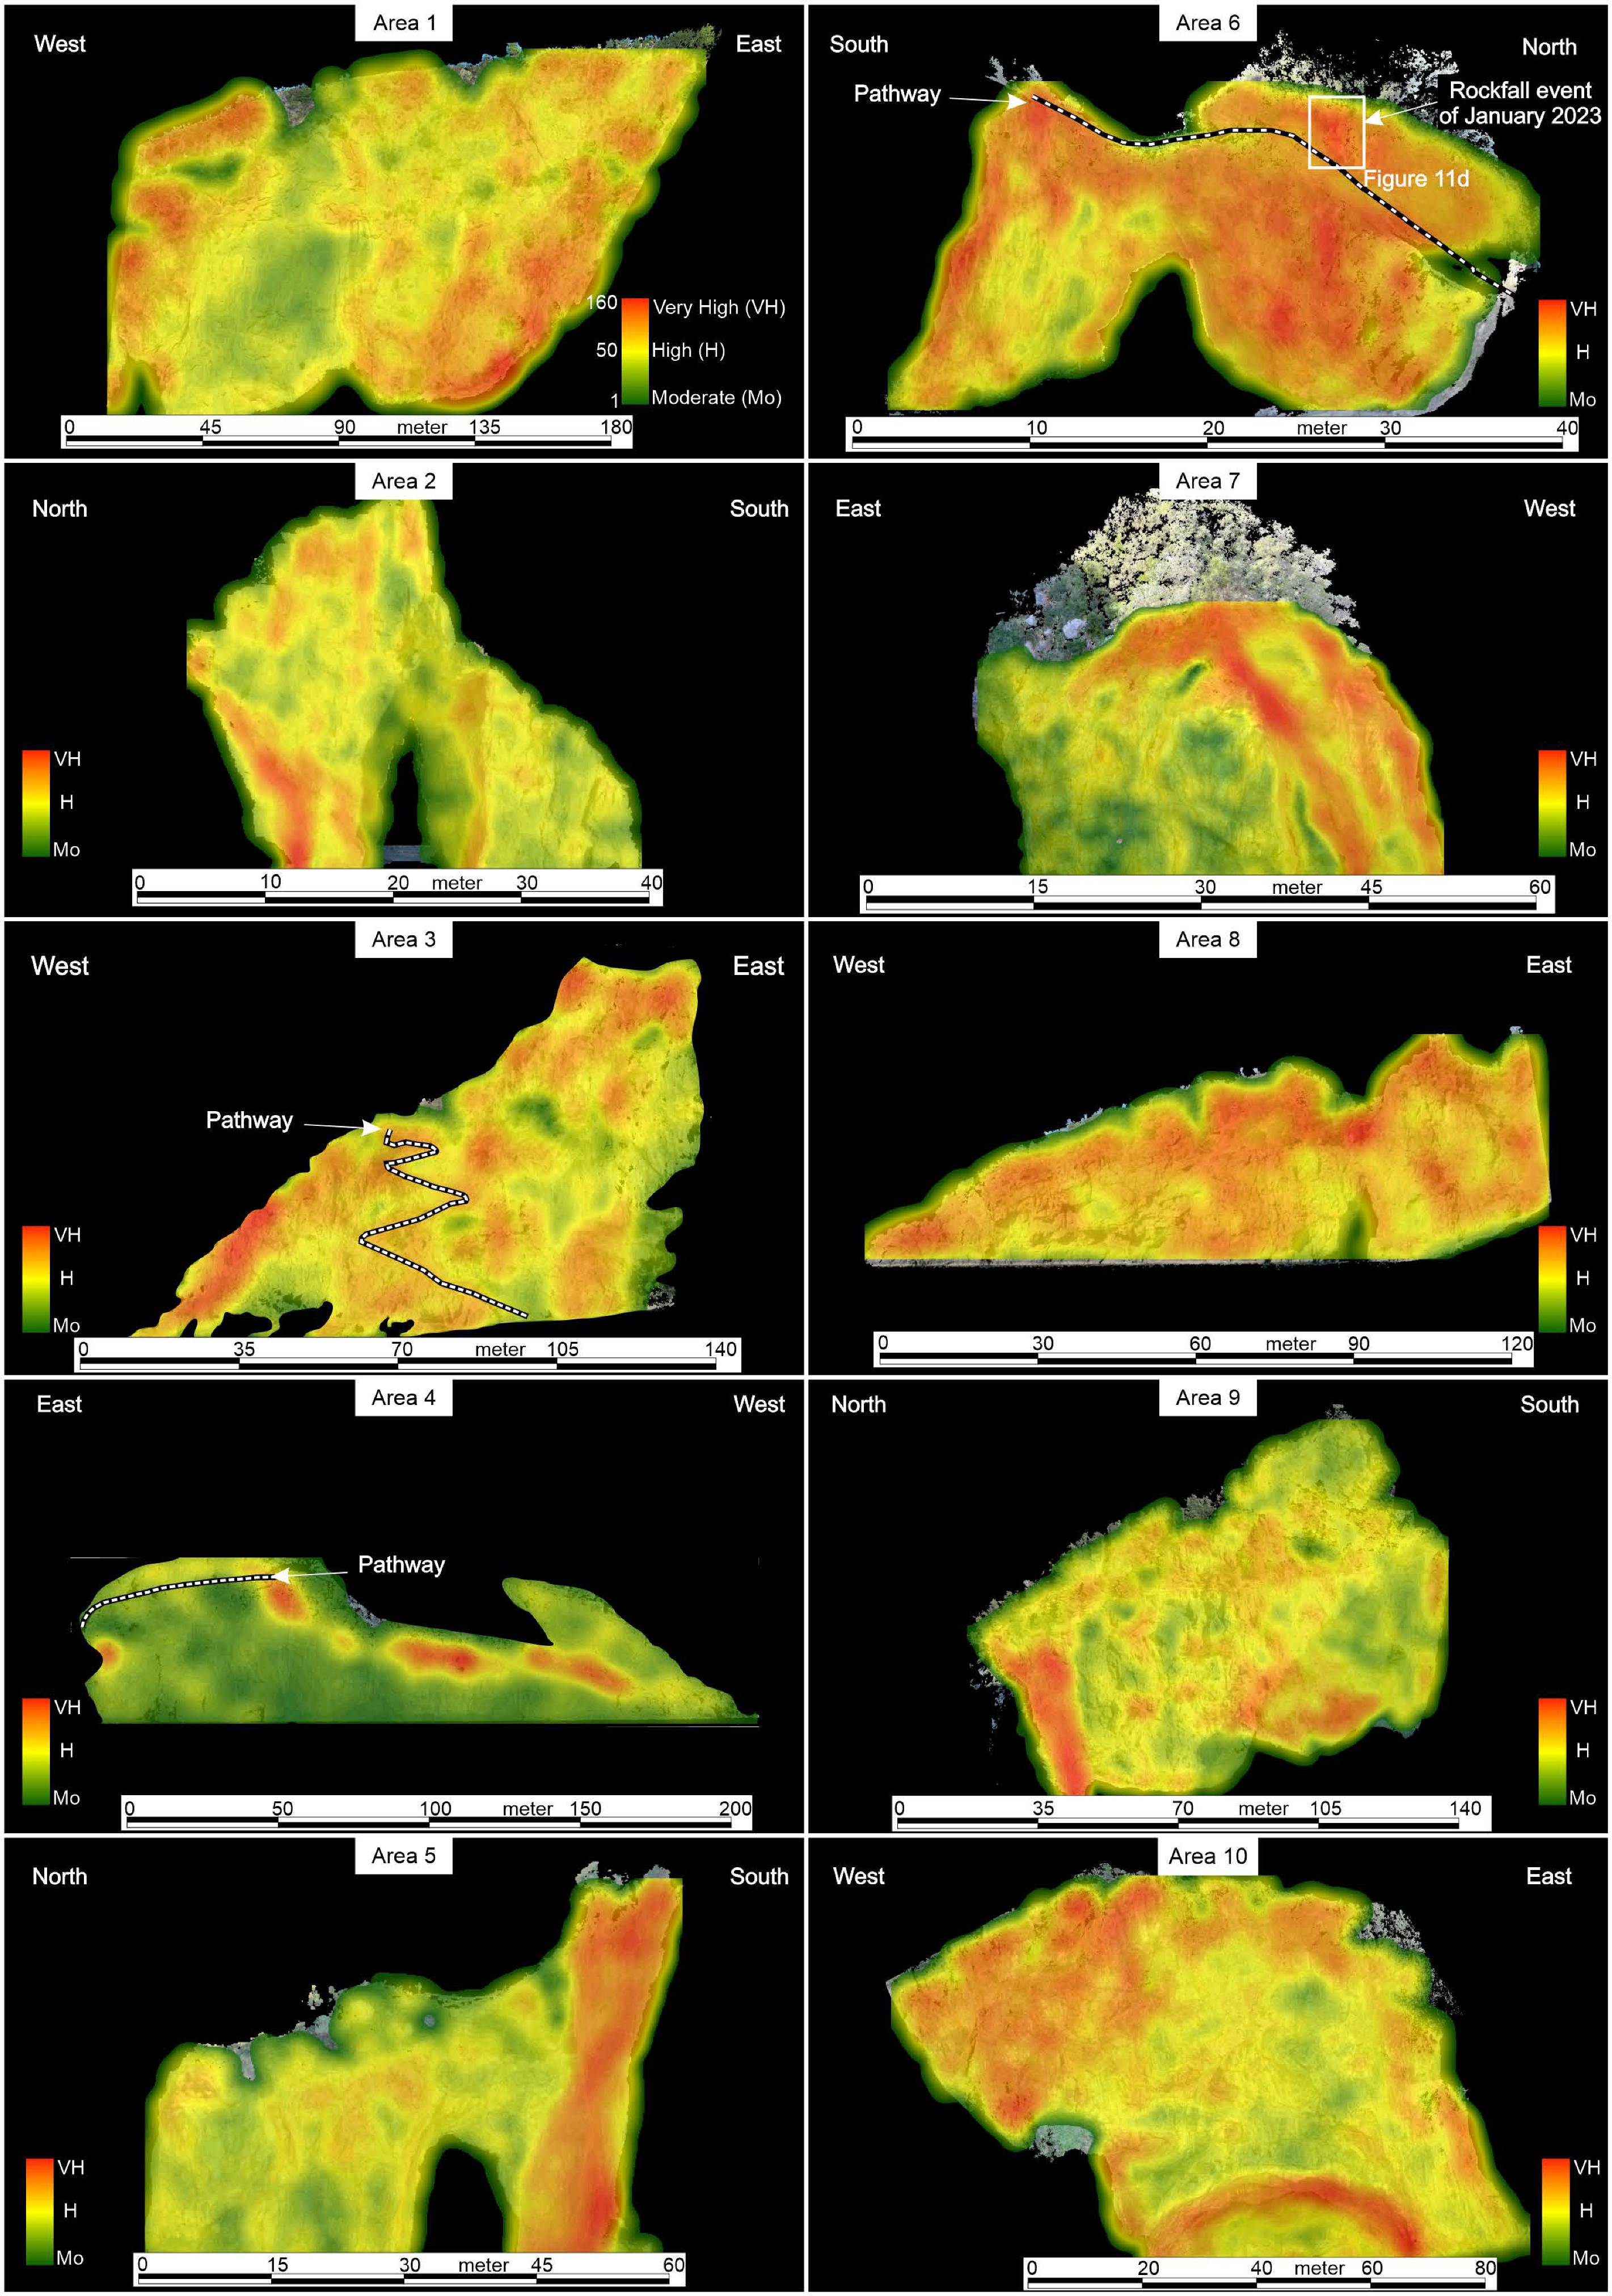
The categorisation of jointing grade for each escarpment was determined based on different fracturing degrees detected by digital techniques combined with CloudCompare v. 2.13 and ESRI ArcMap 10.8/ArcGIS Pro software. Three different fracturing grades were recognised in each analysed area (Figure 11), where the surface extension and relative percentage of each class are shown in Table 4.
In particular, Area 1 is characterised by a rock surface of approximately 13,226 sq. m., where several portions, forming 65.3% of the total area equivalent to 8643 sq. m., were classified as “high” fracturing, having from 5 to 50 joints per square meter. Subsequently, a “very high” jointing status was observed in various sectors of the rock escarpment (Figure 11), where over 50 joints per square meter were identified. This class covers a total area of 2546 sq. m., equivalent to 19.3% of the scarp surface. Furthermore, this class also encloses unstable rock masses completely disjointed by many fractures, as shown in the Digital Outcrop Model (DOM) in Figure 7a. The remaining part of the cliff falls into the “moderate” jointing class, where fewer than 5 fractures per square meter were observed. This class covers a total area of 2036 sq. m. corresponding to a percentage of 15.4% of the total area.
Area 2 holds significant importance from a tourist perspective because its wonderful landscape drives high tourist frequency worldwide. In particular, an arch traversing the carbonate rocks and the crystal sea creates a suggestive area, making it a sought-after location for tourists. The digital geomechanical survey has revealed that the area’s 69.9% (536 sq. m.) is characterised by intense fracturing, placing it in the “high” jointing class. The remaining part of the rock escarpment was classified as “moderate” and “very high” jointing grade, covering an area of 21.2% (162 sq. m.) and 8.9% (68 sq. m.) of the entire scarp, respectively.
Area 3 is dominated by a rock scarp spanning a surface of 5597 sq. m., where 3421.2 sq. m. were classified into the “very high” jointing class, representing 61.1% of the total area. High and moderate jointing classes are less extensive, covering 1144.4 (20.4% of the total area) and 1032.2 (18.4%) sq. m., respectively. In this area, a footpath crosses the entire slope (Figure 11), mainly along its steepest sections, thereby increasing the risk and endangering the safety of the tourists traversing it.
Area 4 is the second-largest area among the surveyed rock scarps. This area extends on 6595.1 sq. m., and its most extensive portion of 4577.4 sq. m. was classified into the “moderate” jointing class, representing 69.4% of the total area. The “High” jointing class instead enclosed 25.5% (1680.2 sq. m.) of the entire scarp surface, and only 5.1% (337.3 sq. m.) falls into the “very high” jointing class. In the foothill zone of the rock scarp, rock deposits from rockfall events are missing; anyway, it does not exclude the possibility of sudden collapses, especially in response to seismic activity or adverse climatic conditions.
Area 5 is located close to Arcomagno beach (Area 6) and is crowded with many tourists coming from the beach and by boat. The area shows an extension of 786.7 sq. m., where 64%, corresponding to 503.4 sq. m., was classified into the “very high” jointing class. The remaining portion of the rock scarp falls in the “high” and “moderate” classes for 33.9% (266.6 sq. m.) and 2.1% (16.7 sq. m.), respectively.
Area 6 is located on the opposite side of the previous one. This area, known as Arcomagno beach, is the most famous tourist destination, drawing significant people’s attention during the summer. The greatest attraction of the site is a vertical carbonate scarp facing directly to the sea and traversed by an arch, a beautiful pocket beach, and a crystal sea. The rock escarpment is longitudinally crossed by a footpath that descends from the top to sea level until the beach (Figure 11). In recent decades, frequent and widespread rockfall events along the steep walls have affected this tourist path. The analysed rock escarpment is characterised by a 2258.1 sq. m. surface, where several portions were classified into the “very high” jointing class. This fracturing condition affects a 1269.5 sq. m. surface, corresponding to 56.2% of the total area. Instead, 31.8% falls into the “high” jointing class, and 12% belongs to the “moderate” class, corresponding to 717.4 and 271.2 sq. m., respectively.
Area 7 shows a total area of 868.2 sq. m., where 471.3 sq. m., representing 54.3% of the scarp surface, was classified into the “high” jointing class. “Very high” fracturing class includes instead a surface area of 215.5 sq. m. (24.8% of the total area), mainly located in the westernmost sector (Figure 11), along two well-defined bands that cross from top to bottom of the scarp. These very high fractured zones are probably linked to a fault system with a dip direction to W. Finally, the remaining scarp portion was classified into a “moderate” class, accounting for 181.4 sq. m. (20.9% of the total area).
Area 8 is constituted by a rock scarp spanning 2978.3 sq. m., located in the northernmost part of the studied area. Here, at the base of the escarpment on its eastern side, a little pocket beach hosts numerous tourists in the summer season. The geomechanical analysis allowed us to classify a wide area equal to 1541.6 sq. m. (51.8% of the scarp surface) into the “very high” jointing class. The latter represents the second-highest percentage of very high class in all analysed escarpments. The very high fracturation state is visible in the upper portion of the escarpment (Figure 11). “High” and “moderate” jointing classes enclose 1237 (41.5% of the scarp surface) and 199.7 (6.7%) sq. m., respectively.
Area 9 is the third-largest extension area among the 10 analysed escarpments, with a surface area of 6421.1 sq. m. A deposit of rock blocks, ranging from meters to decameters, is on the underlying beach area. In this area, the “very high” class is represented by several rock portions expanding on a 920.7 sq. m. surface, constituting 14.3% of the total scarp. The “high” jointing class is well represented, covering 58.7% (3768.7 sq. m.) of the scarp surface, while the “moderate” class encloses 1731.7 sq. m., corresponding to 27% of the analysed scarp.
Finally, area 10 encloses a rock scarp extending on a site of 3453.9 sq. m., where the “very high” jointing class covers 1041.5 sq. m. (30.5% of the scarp area). “High” and “moderate” jointing classes, respectively, extend to areas of 1933.5 sq. m. (56%), and 478.9 sq. m. (13.9%).
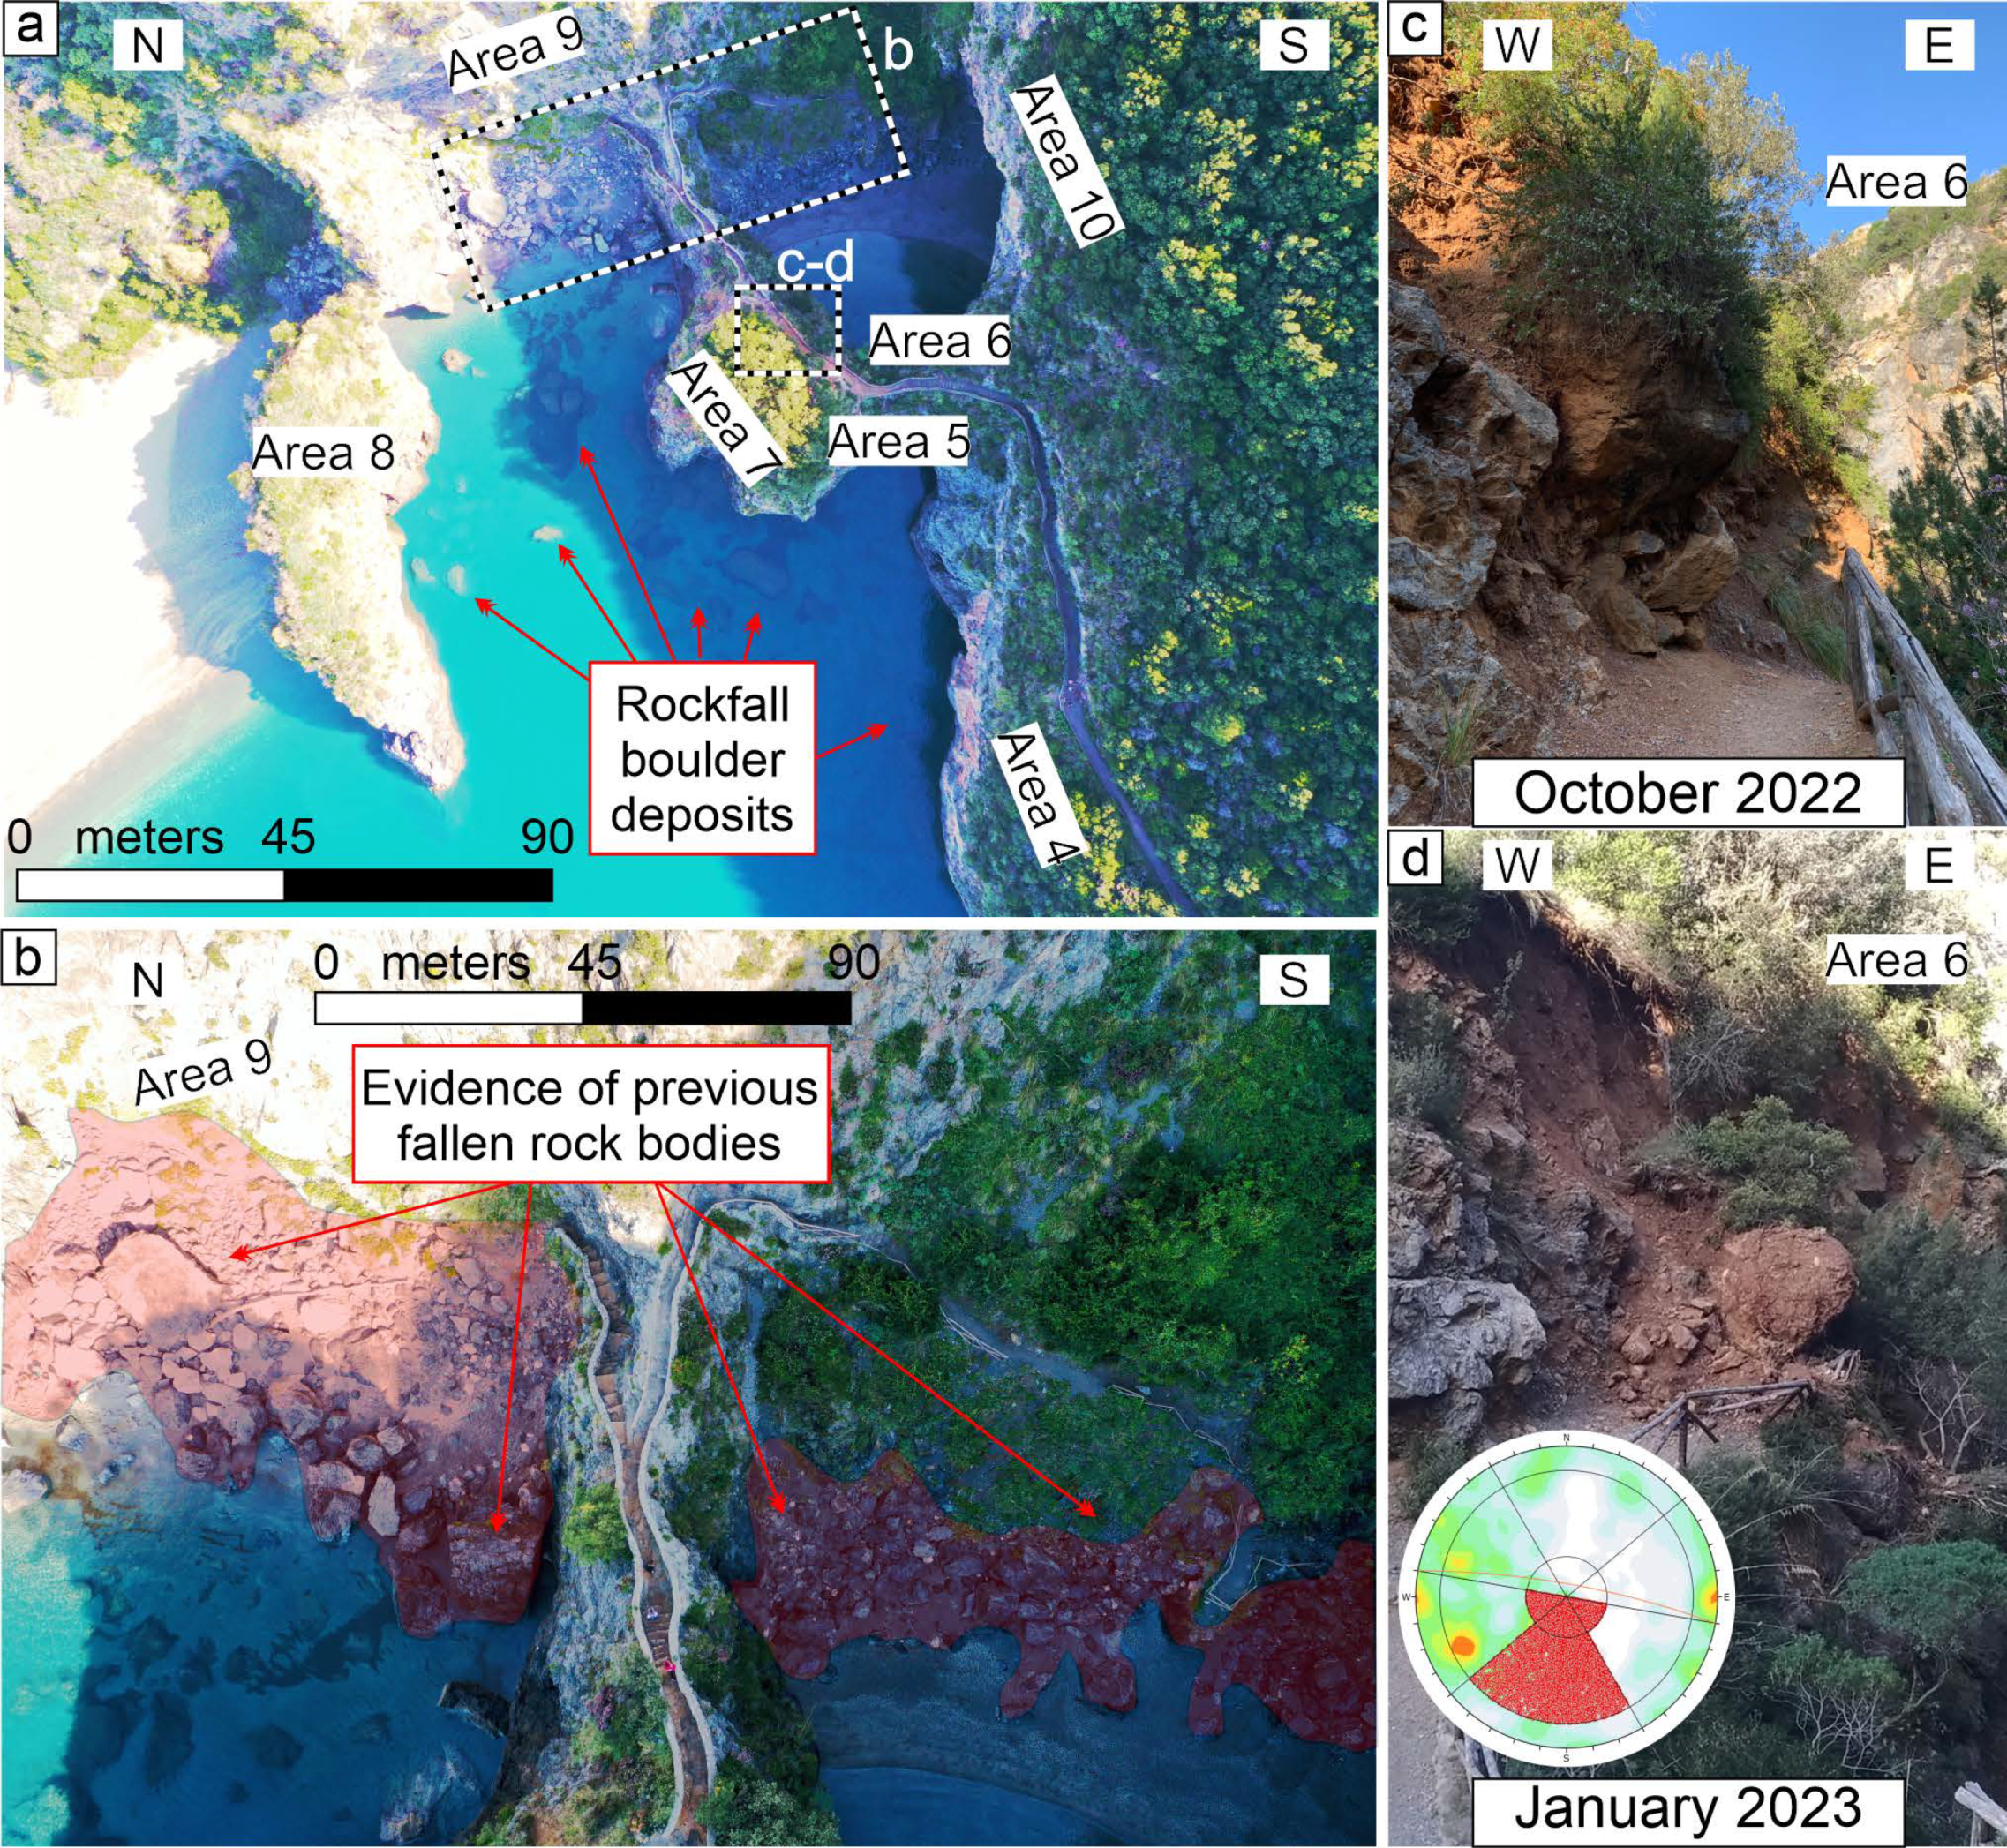
Several field controls were performed to check the soundness of the jointing frequency analysis based on digital data, considering that high rockfall occurrences happen in areas with a high fracturation state. Rock volumes varying in size up to several cubic meters, testifying to frequent rockfall events, were detected mainly at the bases of Areas 8 (Figure 12a) and 6 (Figure 12c,d), classified in the very high jointing class. A large rockfall deposit was also observed in the foot slope zone of Area 9 (Figure 12b), where wide areas classified as high jointing frequency occur. The correspondence between the fracturing grade, assessed by digital technique, and rockfall phenomena triggered in recent times confirms the approach’s effectiveness.

4. Discussion

Since the geomechanical features control the slope stability and geomorphic evolution of vertical rock scarps, understanding the cause-and-effect of the jointing state and accurately identifying the areas prone to rockfall events can provide valuable insights for establishing correct management strategies in a territory and safeguarding citizens’ safety [9,143,144].
Rockfall is among the most dangerous phenomena because of the unpredictability and fast kinematics of the event, e.g., [145]. Furthermore, studying these instability phenomena is frequently difficult due to the poor quantity and quality of available data regarding the geomechanical features of the rock masses forming the scarp surface, e.g., [31]. Generally, this lack of information is linked to the survey methodology, which is often based on in-situ traditional geomechanical investigations, such as the scanline method [146]. This method is a traditional geomechanical survey and is used in very limited portions of rock scarp, which must be accessible to human investigation and where not all fractures can be evident because of the scarp orientation [9,147,148]. For these reasons, the in-situ geomechanical survey needs to be improved by new and advanced technologies that provide more detailed and complete information. In the last decade, various new digital methodologies have been applied to accurately recognise and map the discontinuity features to identify rockfall-prone areas, e.g., [149,150,151,152]. 3D laser scanners and Unmanned Aerial Vehicles (UAV) are the leading technologies for acquiring high-resolution images used to construct DTM, which can furnish exhaustive information on geomechanical features [119,145,153,154]. In particular, the UAV is largely employed worldwide for geomechanical surveys because it shows the following advantages: it provides high-resolution and low-cost images, has simple and fast applicability, and has flexible survey planning, e.g., [9,148]. Following this study approach, the present research focuses on a detailed investigation of the geomechanical features in a wide area dominated by vertical rock escarpments. The studied area falls on the Calabria Tyrrhenian side (southern Italy) and covers a surface of 50 ha, where several rock scarps occur. Some rock scarps face directly to the sea or are characterised by narrow sand beaches at slope foot, crowded by thousands of tourists in the summer. For this reason, the rockfall hazard is very dangerous in the study area. For this reason, a geomechanical survey was performed by acquiring high-quality images using the UAV technique, which was helpful in the construction of DOMs. So, the jointing characteristics were extracted from DOM by CloudCompare v. 2.13 software and employed to assess the possible rockfall kinematics through a stereographic analysis. Subsequently, a fracturing frequency analysis on the entire surface of the 10 rock scarps was performed using ESRI ArcMap 10.8/ArcGIS Pro software.
A comprehensive understanding of the potential rockfall dynamics and evolutionary trend of the examined rock scarps in the Arcomagno locality emerged from the results obtained by planar facets and jointing frequency analysis. In particular, the analysis of planar facets’ direction highlighted that the joint orientation data are slightly different within the 10 examined areas, showing a prevalent dip direction to S-SW. This trend is probably influenced by the prevalent fault system of the area, which has a dip direction to SW (Figure 1b). A secondary fracturing dip direction to the northern quadrant was also observed in some areas, whereas only areas 6 and 7 showed a high dispersion of dip data in all directions. The subsequent kinematic analysis of failure mechanisms showed that the prevalent mechanism is “direct toppling” observed on most scarps (Areas 1, 3, 4, 5, 7, 8, and 9). “Planar sliding” and “flexural toppling” also shape the scarp surfaces, even if in lesser incidence with respect to the previous one and varying in prevalence percentages among the examined areas. Only Area 6 is characterised by “flexural toppling” as the primary kinematic mechanism of failure. Planar facets analysis also provided the categorisation of jointing frequency in three classes (very high, high, and moderate) through the application of ESRI ArcMap 10.8/ArcGIS Pro software. The results show a marked difference in the percentage of each class among the examined areas because the rock scarp area influences the percentage value of each class. So, the scarp with a greater area falling in the very high fracturing class was area 1, with 2546.7 sq. m. corresponding to 19.3% of the total area. This area is characterised by ample car parking space allocated at the foot area of the rock scarp, making the area exposed to high-hazard conditions. Instead, the higher percentage recorded in the very high jointing class was 64%, corresponding to 503.4 sq. m. within Area 5. Hence, the scarps showing wide areas falling into the very high jointing class were 5, 6, and 8, where infield surveys found wide rockfall deposits in the foot scarp areas. Instead, the scarp with lesser areas falling in the very high fracturing class was area 4, with a percentage of 5.1% (equal to 337.3 sq. m.).
A similar approach based on the UAV technique for geomechanical analysis of the rock scarp was widely employed in previous studies. These studies focused mainly on the detailed jointing characterisation of a single rock scarp or its limited portion, e.g., [9,129,130]. Instead, our study regards the geomechanical analysis of a wide area of 50 ha, including 10 vertical rock scarps. Furthermore, this research takes a step forward compared to the previous ones because it provides a new approach for obtaining a detailed jointing frequency analysis, as shown in each of the 10 analysed rock scarps (Figure 11).
The technologies and methodologies delineated and employed in our study facilitated the validation of the utilized applications. Specifically, based on the data acquired through the October 2023 aero-photogrammetric survey, as outlined in Figure 11 (white dashed rectangle in Area 6), the geostatistical analysis identified a “Very High” value situated immediately above the pathway guiding tourists to Arcomagno beach. It is crucial to note that this “Very High” value aligns with the sector where a Rockfall event transpired after intense rainfall in January 2023 (Figure 12d). To verify the rockfall’s kinematics during the climatic event, we focused on the area previously mapped region with a Very-High jointing class (Figure 11, Area 6). The kinematic analysis revealed that, as highlighted in Figure 12d, the rockfall occurred through direct toppling (see stereogram in Figure 12d). This is tangible evidence affirming the reliability of the applied method, implying its potential as a valid methodology for adoption in analogous contexts to alleviate and preempt Rockfall events.
Another aspect regards the use of the GNSS RTK/PPK technique, which enhanced the capacity to create precise Digital Outcrop Models (DOMs) even without numerous Ground Control Points (GCPs) or checkpoints. As a result, the method efficiently tackled the study’s primary objective of conducting a comprehensive rock slope kinematic analysis. Among the key advantages of this technique, speed in data acquisition and processing stands out, allowing for subsequent joint frequency mapping. However, it is important to acknowledge the limitations of surveying through the UAV technique, which may become apparent in situations where the walls are exceptionally high and satellite signal reception during data acquisition may be weak or absent, as is the case with natural caves situated beneath towering walls.

5. Concluding Comments

This research focuses on a detailed geomechanical survey based on digital technique by UAV-PPK of an area in the Tyrrhenian Calabria side (southern Italy). So, by integrating drone-based photogrammetry and advanced analytical techniques, an exhaustive geomechanical framework of a wide area of 50 ha has been achieved. In particular, acquiring high-quality images by UAV technique allowed the construction of a DOM, which provided valuable insights into the distribution, orientation, and frequency of discontinuities on rock scarp surfaces. In this regard, the Facets/Fractures detection tool in the CloudCompare v. 2.13 software enabled the systematic identification of the geomechanical features, providing valuable information for recognising the rockfall-prone areas. Subsequently, the ESRI ArcMap 10.8/ArcGIS Pro kernel density points tool allowed us to obtain a point density map reflecting the distribution of the planar facets. The number of points (or planar facets) allowed the categorisation of the jointing frequency areas into three classes. Hence, the collected digital data provided a comprehensive geomechanical characterisation, effectively overcoming the limitations associated with field investigations typically restricted to accessible regions. The approach used showed that the UAV technology delivers cost-effective, high-quality imagery through a swift, straightforward, and economical methodology that is also applicable to broad areas. The digital methodology was adopted for the following reasons: firstly, the UAV-based photogrammetry approach was highly advantageous for its ability to acquire detailed information from otherwise challenging terrains, which might be inaccessible to traditional fieldwork; furthermore, it offered a more cost-efficient alternative to traditional in-field surveying methods, however providing data of remarkable accuracy. The digital outcomes were confirmed by in-field surveys that recognised the presence of rockfall deposits at the foot areas of some scarps, with large areas falling in a very high jointing state. These findings showcase the efficacy of drone-based photogrammetry and analytical tools in studying rockfall phenomena in wide areas. Therefore, this geomechanical framework can serve as a foundation for informed decision-making in geological hazard management, offering valuable guidance for risk assessment and mitigation strategies. In conclusion, our study allowed us to create a comprehensive map (Figure 13) that delineates areas with the final remarks: the areas analysed in yellow; in red, the high-risk zone marked, indicating locations with recent rockfall deposits; and in orange, the potential danger zone, indicating areas without recent evidence of rockfall deposits but still identified as potential risk areas. This visual representation enhances our understanding of the spatial distribution of rockfall hazards and provides a valuable tool for informed decision-making in risk mitigation and management strategies. Finally, the methodologies employed in this research could be adapted and extended to similar geological contexts, aiding researchers, practitioners, and stakeholders in understanding and addressing similar case studies worldwide.

Author Contributions

Conceptualization, D.C. and M.Z.; methodology, D.C.; software, D.C.; validation, D.C., M.Z. and F.I.; formal analysis, D.C. and M.Z.; investigation, D.C. and M.Z.; resources, D.C.; data curation, D.C., A.C.T. and F.I.; writing—original draft preparation, D.C. and F.I.; writing—review and editing, D.C., F.B., A.C.T. and F.I.; visualization, D.C., M.Z., F.B., A.C.T. and F.I.; supervision, D.C. and F.I.; project administration, D.C. and M.Z. All authors have read and agreed to the published version of the manuscript.

Funding

This research received no external funding.

Data Availability Statement

Data are contained within the article.

Acknowledgments

The authors thank Topodrone Company for generously providing us with the Topodrone PPK Post Processing software and a perpetual license. The authors are indebted to the three anonymous reviewers for their suggestions.

Conflicts of Interest

The authors declare no conflict of interest.

References

  1. Guzzetti, F. Landslide fatalities and the evaluation of landslide risk in Italy. Eng. Geol. 2000, 58, 89–107. [Google Scholar] [CrossRef]
  2. Ietto, F.; Conforti, M.; Tolomei, C.; Cianflone, G. Village relocation as solution of the landslide risk, is it always the right choice? The case study of Cavallerizzo ghost village (Calabria, southern Italy). Int. J. Disaster Risk Reduct. 2022, 81, 103267. [Google Scholar] [CrossRef]
  3. Stead, D.; Wolter, A. A critical review of rock slope failure mechanisms: The importance of structural geology. J. Struct. Geol. 2015, 74, 1–23. [Google Scholar] [CrossRef]
  4. Sun, L.; Grasselli, G.; Liu, Q.; Tang, X.; Abdelaziz, A. The role of discontinuities in rock slope stability: Insights from a combined finite-discrete element simulation. Comput. Geotechnics 2022, 147, 104788. [Google Scholar] [CrossRef]
  5. Stead, D.; Eberhardt, E.; Coggan, J.S. Developments in the characterization of complex rock slope deformation and failure using numerical modelling techniques. Eng. Geol. 2006, 83, 217–235. [Google Scholar] [CrossRef]
  6. Eberhardt, E. Twenty-ninth Canadian Geotechnical Colloquium: The role of advanced numerical methods and geotechnical field measurements in understanding complex deep-seated rock slope failure mechanisms. Can. Geotech. J. 2008, 45, 484–510. [Google Scholar] [CrossRef]
  7. Calcaterra, D.; Parise, M. Weathering as a predisposing factor to slope movements: An introduction. Eng. Geol. Spec. Publ. 2010, 23, 1–4. [Google Scholar] [CrossRef]
  8. Ietto, F.; Parise, M.; Ponte, M.; Calcaterra, D. Geotechnical characterization and landslides in the weathered granitoids of Calabria (southern Italy). Ren. Online Soc. Geol. Ital. 2012, 2012, 551–552. [Google Scholar]
  9. Filice, F.; Pezzo, A.; Lollino, P.; Perrotti, M.; Ietto, F. Multi-approach for the assessment of rock slope stability using in-field and UAV investigations. Bull. Eng. Geol. Environ. 2022, 81, 502. [Google Scholar] [CrossRef]
  10. Varnes, D.J. Slope Movement Types and Processes. In Landslides, Analysis and Control; Schuster, R.L., Ed.; TRB, National Research Council: Washington, DC, USA, 1978; pp. 11–33. [Google Scholar]
  11. Cruden, D.M.; Varnes, D.J. Landslide types and processes. In Landslides: Investigation and Mitigation; Turner, A.K., Ed.; National Academy Press: Washington, DC, USA, 1996. [Google Scholar]
  12. Norman, N. Rock Slope Stability Analysis. In Landslides: Investigation and Mitigation; Transportation Research Board: Washington, DC, USA, 1996; Volume 247. [Google Scholar]
  13. Feng, L.; Pazzi, V.; Intrieri, E.; Gracchi, T.; Gigli, G. Rockfall seismic features analysis based on in situ tests: Frequency, amplitude, and duration. J. Mt. Sci. Engl. 2019, 16, 955–970. [Google Scholar] [CrossRef]
  14. Matas, G.; Lantada, N.; Corominas, J.; Gili, J.; Ruiz-Carulla, R.; Prades, A. Simulation of Full-Scale Rockfall Tests with a Fragmentation Model. Geosciences 2020, 10, 168. [Google Scholar] [CrossRef]
  15. Schultz, R.A.; Fossen, H. Terminology for structural discontinuities. AAPG Bull. 2008, 92, 853–867. [Google Scholar] [CrossRef]
  16. Fossen, H. Structural Geology; Cambridge University Press: Cambridge, UK, 2010; p. 463. [Google Scholar] [CrossRef]
  17. Turanboy, A.; Ulker, E. LIP-RM: An attempt at 3D visualization of in situ rock mass structures. Comput. Geosci. 2008, 12, 181–192. [Google Scholar] [CrossRef]
  18. Lee, B.Y.; Kim, Y.Y.; Yi, S.-T.; Kim, J.-K. Automated image processing technique for detecting and analysing concrete surface cracks. Struct. Infrastruct. Eng. 2013, 9, 567–577. [Google Scholar] [CrossRef]
  19. Assali, P.; Pollet, N. Contribution of Terrestrial Laser Scanning for monitoring and inspection of railway infrastructure. In Proceedings of World Congress on Railway Research, Sydney, Australia, 25–28 November 2013. [Google Scholar]
  20. Sen, Z.; Kazi, A. Discontinuity Spacing and RQD Estimates from Finite Length Scanlines. Int. J. Rock Mech. Min. Sci. Geomech. 1984, 21, 203–212. [Google Scholar] [CrossRef]
  21. Nagendran, S.K.; Mohamad Ismail, M.A.; Wen, Y.T. Photogrammetry approach on geological plane extraction using CloudCompare FACET plugin and scanline survey. Bull. Geol. Soc. Malays. 2019, 68, 151–158. [Google Scholar] [CrossRef]
  22. Mondini, A.; Santangelo, M.; Rocchetti, M.; Rossetto, E.; Manconi, A.; Monserrat, O. Sentinel-1 SAR Amplitude Imagery for Rapid Landslide Detection. Remote Sens. 2019, 11, 760. [Google Scholar] [CrossRef]
  23. Rott, H.; Nagler, T. The contribution of radar interferometry to the assessment of landslide hazards. Adv. Space Res. Ser. 2006, 37, 710–719. [Google Scholar] [CrossRef]
  24. Santangelo, M.; Cardinali, M.; Bucci, F.; Fiorucci, F.; Mondini, A.C. Exploring event landslide mapping using Sentinel-1 SAR backscatter products. Geomorphology 2022, 397, 108021. [Google Scholar] [CrossRef]
  25. Bianchini, S.; Herrera, G.; Mateos, R.M.; Notti, D.; Garcia, I.; Mora, O.; Moretti, S. Landslide Activity Maps Generation by Means of Persistent Scatterer Interferometry. Remote Sens. 2013, 5, 6198–6222. [Google Scholar] [CrossRef]
  26. Herrera, G.; Gutiérrez, F.; García-Davalillo, J.C.; Guerrero, J.; Notti, D.; Galve, J.P.; Fernández-Merodo, J.A.; Cooksley, G. Multi-sensor advanced DInSAR monitoring of very slow landslides: The Tena Valley case study (Central Spanish Pyrenees). Remote Sens. Environ. 2013, 128, 31–43. [Google Scholar] [CrossRef]
  27. Solari, L.; Del Soldato, M.; Raspini, F.; Barra, A.; Bianchini, S.; Confuorto, P.; Casagli, N.; Crosetto, M. Review of Satellite Interferometry for Landslide Detection in Italy. Remote Sens. 2020, 12, 1351. [Google Scholar] [CrossRef]
  28. Brideau, M.A.; Pedrazzini, A.; Stead, D.; Froese, C.; Jaboyedoff, M.; van Zeyl, D. Three-dimensional slope stability analysis of South Peak, Crowsnest Pass, Alberta, Canada. Landslides 2011, 8, 139–158. [Google Scholar] [CrossRef]
  29. Brideau, M.A.; Sturzenegger, M.; Stead, D.; Jaboyedoff, M.; Lawrence, M.; Roberts, N.; Ward, B.; Millard, T.; Clague, J. Stability analysis of the 2007 Chehalis lake landslide based on long-range terrestrial photogrammetry and airborne LiDAR data. Landslides 2012, 9, 75–91. [Google Scholar] [CrossRef]
  30. Guzzetti, F.; Reichenbach, P.; Wieczorek, G.F. Rockfall hazard and risk assessment in the Yosemite Valley, California, USA. Nat. Hazards Earth Syst. Sci. 2003, 3, 491–503. [Google Scholar] [CrossRef]
  31. Strunden, J.; Ehlers, T.A.; Brehm, D.; Nettesheim, M. Spatial and temporal variations in rockfall determined from TLS measurements in a deglaciated valley, Switzerland. J. Geophys. Res. Earth 2015, 120, 1251–1273. [Google Scholar] [CrossRef]
  32. Jaboyedoff, M.; Oppikofer, T.; Abellán, A.; Derron, M.H.; Loye, A.; Metzger, R.; Pedrazzini, A. Use of LIDAR in landslide investigations: A review. Nat. Hazards 2012, 61, 5–28. [Google Scholar] [CrossRef]
  33. Xu, Q.; Ye, Z.; Liu, Q.; Dong, X.J.; Li, W.L.; Fang, S.N.; Guo, C. 3D Rock Structure Digital Characterization Using Airborne LiDAR and Unmanned Aerial Vehicle Techniques for Stability Analysis of a Blocky Rock Mass Slope. Remote Sens. 2022, 14, 3044. [Google Scholar] [CrossRef]
  34. Bemis, S.P.; Micklethwaite, S.; Turner, D.; James, M.R.; Akciz, S.; Thiele, S.; Bangash, H.A. Ground-based and UAV-Based photogrammetry: A multi-scale, high-resolution mapping tool for structural geology and paleoseismology. J. Struct. Geol. 2014, 69, 163–178. [Google Scholar] [CrossRef]
  35. Berquist, S.; Spence-Morrow, G.; Gonzalez-Macqueen, F.; Rizzuto, B.; Álvarez, W.Y.; Bautista, S.; Jennings, J. A new aerial photogrammetric survey method for recording inaccessible rock art. Digit. Appl. Archaeol. Cult. Herit. 2018, 8, 46–56. [Google Scholar] [CrossRef]
  36. Bonali, F.L.; Tibaldi, A.; Marchese, F.; Fallati, L.; Russo, E.; Corselli, C.; Savini, A. UAV-based surveying in volcano-tectonics: An example from the Iceland rift. J. Struct. Geol. 2019, 121, 46–64. [Google Scholar] [CrossRef]
  37. Cawood, A.J.; Bond, C.E.; Howell, J.A.; Butler, R.W.H.; Totake, Y. LiDAR, UAV or compass-clinometer? Accuracy, coverage and the effects on structural models. J. Struct. Geol. 2017, 98, 67–82. [Google Scholar] [CrossRef]
  38. Cirillo, D. Digital Field Mapping and Drone-Aided Survey for Structural Geological Data Collection and Seismic Hazard Assessment: Case of the 2016 Central Italy Earthquakes. Appl. Sci. 2020, 10, 5233. [Google Scholar] [CrossRef]
  39. Menichetti, M.; Roccheggiani, M.; De Guidi, G.; Carnemolla, F.; Brighenti, F.; Barreca, G.; Monaco, C. Sentinel-1 Interferometry and UAV Aerial Survey for Mapping Coseismic Ruptures: Mts. Sibillini vs. Mt. Etna Volcano. Remote Sens. 2023, 15, 2514. [Google Scholar] [CrossRef]
  40. Tavani, S.; Corradetti, A.; Billi, A. High precision analysis of an embryonic extensional fault-related fold using 3D orthorectified virtual outcrops: The viewpoint importance in structural geology. J. Struct. Geol. 2016, 86, 200–210. [Google Scholar] [CrossRef]
  41. Vanneschi, C.; Rindinella, A.; Salvini, R. Hazard Assessment of Rocky Slopes: An Integrated Photogrammetry–GIS Approach Including Fracture Density and Probability of Failure Data. Remote Sens. 2022, 14, 1438. [Google Scholar] [CrossRef]
  42. Vanneschi, C.; Di Camillo, M.; Aiello, E.; Bonciani, F.; Salvini, R. SfM-MVS Photogrammetry for Rockfall Analysis and Hazard Assessment Along the Ancient Roman Via Flaminia Road at the Furlo Gorge (Italy). ISPRS Int. J. Geo-Inf. 2019, 8, 325. [Google Scholar] [CrossRef]
  43. De Donatis, M.; Alberti, M.; Cipicchia, M.; Guerrero, N.M.; Pappafico, G.F.; Susini, S. Workflow of Digital Field Mapping and Drone-Aided Survey for the Identification and Characterization of Capable Faults: The Case of a Normal Fault System in the Monte Nerone Area (Northern Apennines, Italy). ISPRS Int. J. Geo-Inf. 2020, 9, 616. [Google Scholar] [CrossRef]
  44. Bello, S.; Scott, C.P.; Ferrarini, F.; Brozzetti, F.; Scott, T.; Cirillo, D.; de Nardis, R.; Arrowsmith, J.R.; Lavecchia, G. High-resolution surface faulting from the 1983 Idaho Lost River Fault Mw 6.9 earthquake and previous events. Sci. Data 2021, 8, 68. [Google Scholar] [CrossRef]
  45. Johnson, K.; Nissen, E.; Saripalli, S.; Arrowsmith, J.R.; McGarey, P.; Scharer, K.; Williams, P.; Blisniuk, K. Rapid mapping of ultrafine fault zone topography with structure from motion. Geosphere 2014, 10, 969–986. [Google Scholar] [CrossRef]
  46. Westoby, M.J.; Brasington, J.; Glasser, N.F.; Hambrey, M.J.; Reynolds, J.M. ‘Structure-from-Motion’ photogrammetry: A low-cost, effective tool for geoscience applications. Geomorphology 2012, 179, 300–314. [Google Scholar] [CrossRef]
  47. Jacquemyn, C.; Huysmans, M.; Hunt, D.; Casini, G.; Swennen, R. Multi-scale three-dimensional distribution of fracture- and igneous intrusion- controlled hydrothermal dolomite from digital outcrop model, Latemar platform, Dolomites, northern Italy. AAPG Bull. 2015, 99, 957–984. [Google Scholar] [CrossRef]
  48. Loiotine, L.; Andriani, G.F.; Jaboyedoff, M.; Parise, M.; Derron, M.-H. Comparison of Remote Sensing Techniques for Geostructural Analysis and Cliff Monitoring in Coastal Areas of High Tourist Attraction: The Case Study of Polignano a Mare (Southern Italy). Remote Sens. 2021, 13, 5045. [Google Scholar] [CrossRef]
  49. Caliò, D.; Mineo, S.; Pappalardo, G. Digital Rock Mass Analysis for the Evaluation of Rockfall Magnitude at Poorly Accessible Cliffs. Remote Sens. 2023, 15, 1515. [Google Scholar] [CrossRef]
  50. Bistacchi, A.; Balsamo, F.; Storti, F.; Mozafari, M.; Swennen, R.; Solum, J.; Tueckmantel, C.; Taberner, C. Photogrammetric digital outcrop reconstruction, visualization with textured surfaces, and three-dimensional structural analysis and modeling: Innovative methodologies applied to fault-related dolomitization (Vajont Limestone, Southern Alps, Italy). Geosphere 2015, 11, 2031–2048. [Google Scholar] [CrossRef]
  51. James, M.R.; Robson, S. Straightforward reconstruction of 3D surfaces and topography with a camera: Accuracy and geoscience application. J. Geophys. Res. Earth Surf. 2012, 117, 1–17. [Google Scholar] [CrossRef]
  52. Thiele, S.T.; Grose, L.; Samsu, A.; Micklethwaite, S.; Vollgger, S.A.; Cruden, A.R. Rapid, semi-automatic fracture and contact mapping for point clouds, images and geophysical data. Solid Earth 2017, 8, 1241–1253. [Google Scholar] [CrossRef]
  53. Barlow, J.; Gilham, J.; Ibarra Cofrã, I. Kinematic analysis of sea cliff stability using UAV photogrammetry. Int. J. Remote Sens. 2017, 38, 2464–2479. [Google Scholar] [CrossRef]
  54. Vollgger, S.A.; Cruden, A.R. Mapping folds and fractures in basement and cover rocks using UAV photogrammetry, Cape Liptrap and Cape Paterson, Victoria, Australia. J. Struct. Geol. 2016, 85, 168–187. [Google Scholar] [CrossRef]
  55. Francioni, M.; Antonaci, F.; Sciarra, N.; Robiati, C.; Coggan, J.; Stead, D.; Calamita, F. Application of Unmanned Aerial Vehicle Data and Discrete Fracture Network Models for Improved Rockfall Simulations. Remote Sens. 2020, 12, 2053. [Google Scholar] [CrossRef]
  56. Gallo, I.G.; Martínez-Corbella, M.; Sarro, R.; Iovine, G.; López-Vinielles, J.; Hérnandez, M.; Robustelli, G.; Mateos, R.M.; García-Davalillo, J.C. An Integration of UAV-Based Photogrammetry and 3D Modelling for Rockfall Hazard Assessment: The Cárcavos Case in 2018 (Spain). Remote Sens. 2021, 13, 3450. [Google Scholar] [CrossRef]
  57. Wang, W.; Zhao, W.; Chai, B.; Du, J.; Tang, L.; Yi, X. Discontinuity interpretation and identification of potential rockfalls for high-steep slopes based on UAV nap-of-the-object photogrammetry. Comput. Geosci. 2022, 166, 105191. [Google Scholar] [CrossRef]
  58. Ferrari, E.; Coscarelli, R.; Buttafuoco, G.; Caloiero, T. Spatial and temporal characterization of climate at regional scale using homogeneous monthly precipitation and air temperature data: An application in Calabria (southern Italy). Hydrol. Res. 2015, 46, 629–646. [Google Scholar] [CrossRef]
  59. Tangari, A.C.; Le Pera, E.; Andò, S.; Garzanti, E.; Piluso, E.; Marinangeli, L.; Scarciglia, F. Soil-formation in the central Mediterranean: Insight from heavy minerals. Catena 2021, 197, 104998. [Google Scholar] [CrossRef]
  60. Petrucci, O.; Chiodo, G.; Caloiero, D. Eventi Alluvionali in Calabria nel Decennio 1971–1980; GNDCI, Rubbettino Arti Grafiche; Soveria Mannelli: Catanzaro, Italy, 1996; p. 142. (In Italian) [Google Scholar]
  61. Robustelli, G.; Muto, F.; Scarciglia, F.; Spina, V.; Critelli, S. Eustatic and tectonic control on Late Quaternary alluvial fans along the Tyrrhenian Sea coast of Calabria (South Italy). Quat. Sci. Rev. 2005, 24, 2101–2119. [Google Scholar] [CrossRef]
  62. Perri, F.; Ietto, F. Flash flood event (October 2010) in the Zinzolo catchment (Calabria, southern Italy). Rend. Online Della Soc. Geol. Ital. 2015, 35, 170–173. [Google Scholar] [CrossRef]
  63. Medina, S.; Bradley, F.S.; Robert, A.; Houze, J. Cross-Barrier Flow during Orographic Precipitation Events: Results from MAP and IMPROVE. J. Atmos. Sci. 2005, 62, 3580–3598. [Google Scholar] [CrossRef]
  64. Minzoni, N. The Geodynamic Evolution of the Sardinian-Corsican and Calabrian-Peloritan Hercynian Massifs. In Proceedings of the International Conferences on Basement Tectonics; Springer: Dordrecht, The Netherlands, 1995. [Google Scholar]
  65. Scandone, P. Origin of the Tyrrhenian Sea and Calabrian Arc. Boll. Della Soc. Geol. Ital. 1979, 98, 27–34. [Google Scholar]
  66. Ben Avraham, Z.; Boccaletti, M.; Cello, G.; Grasso, M.; Lentini, F.; Torelli, L.; Tortorici, L. Principali domini strutturali originatisi dalla collisione neogenico-quaternaria nel Mediterraneo centrale. Mem. Soc. Geol. It. 1990, 45, 453–462. [Google Scholar]
  67. Jolivet, L.; Faccenna, C. Mediterranean extension and the Africa-Eurasia collision. Tectonics 2000, 19, 1095–1106. [Google Scholar] [CrossRef]
  68. Catalano, S.; Cirrincione, R.; Mazzoleni, P.; Pavano, F.; Pezzino, A.; Romagnoli, G.; Tortorici, G. The effects of a Meso-Alpine collision event on the tectono-metamorphic evolution of the Peloritani mountain belt (eastern Sicily, southern Italy). Geol. Mag. 2018, 155, 422–437. [Google Scholar] [CrossRef]
  69. Ogniben, L. Schema geologico della Calabria in base ai dati odierni. Geol. Romana 1973, 12, 243–585. [Google Scholar]
  70. Monaco, C.; Tortorici, L. Active faulting in the Calabrian arc and eastern Sicily. J. Geodyn. 2000, 29, 407–424. [Google Scholar] [CrossRef]
  71. Brutto, F.; Muto, F.; Loreto, M.F.; Paola, N.D.; Tripodi, V.; Critelli, S.; Facchin, L. The Neogene-Quaternary geodynamic evolution of the central Calabrian Arc: A case study from the western Catanzaro Trough basin. J. Geodyn. 2016, 102, 95–114. [Google Scholar] [CrossRef]
  72. Pirrotta, C.; Barberi, G.; Barreca, G.; Brighenti, F.; Carnemolla, F.; De Guidi, G.; Monaco, C.; Pepe, F.; Scarfì, L. Recent Activity and Kinematics of the Bounding Faults of the Catanzaro Trough (Central Calabria, Italy): New Morphotectonic, Geodetic and Seismological Data. Geosciences 2021, 11, 405. [Google Scholar] [CrossRef]
  73. Iannace, A.; Bonardi, G.; D’Errico, M.; Mazzoli, S.; Perrone, V.; Vitale, S. Structural setting and tectonic evolution of the Apennine Units of northern Calabria. Comptes Rendus Geosci. 2005, 337, 1541–1550. [Google Scholar] [CrossRef]
  74. Iannace, A.; Vitale, S.; D’Errico, M.; Mazzoli, S.; Di Staso, A.; Macaione, E.; Messina, A.; Reddy, S.M.; Somma, R.; Zamparelli, V.; et al. The carbonate tectonic units of northern Calabria (Italy): A record of Apulian palaeomargin evolution and Miocene convergence, continental crust subduction, and exhumation of HP–LT rocks. J. Geol. Soc. 2007, 164, 1165–1186. [Google Scholar] [CrossRef]
  75. Rossetti, F.; Goffé, B.; Monié, P.; Faccenna, C.; Vignaroli, G. Alpine orogenic P-T-t-deformation history of the Catena Costiera area and surrounding regions (Calabrian Arc, southern Italy): The nappe edifice of north Calabria revised with insights on the Tyrrhenian-Apennine system formation: Alpine tectonics in north Calabria. Tectonics 2004, 23, 1–26. [Google Scholar] [CrossRef]
  76. Patacca, E.; Scandone, P. Geology of the Southern Apennines. Int. J. Geosci. 2007, 5, 75–119. [Google Scholar]
  77. Ghisetti, F.; Vezzani, L. Structural Map of Mt. Pollino (Southern Italy); 1:50,000; SELCA: Firenze, Italy, 1983. [Google Scholar]
  78. Ietto, A.; Ietto, F. Note Illustrative Della Carta Geologica D’Italia Alla Scala 1:50.000, Foglio 542, Verbicaro. Litografia Artistica Cartografica, Firenze.: Servizio Geologico d’Italia. 2011. Available online: http://www.isprambiente.gov.it/Media/carg/note_illustrative/542_Verbicaro.pdf (accessed on 17 January 2024).
  79. Ogniben, L. Schema introduttivo alla geologia del confine Calabro-Lucano. Mem. Soc. Geol. It. 1969, 8, 453–763. [Google Scholar]
  80. Amodio, M.L.; Bonardi, G.; Colonna, V.; Dietrich, D.; Giunta, G.; Ippolito, F.; Liguori, V.; Lorenzoni, F.; Paglionico, A.; Perrone, V.; et al. L’arco calabro-peloritano nell’orogene appenninico-maghrebide Translated Title: The Calabro-Peloritani Arc during the Apennine-Maghrebide Orogeny. Atti del 68esimo Congresso della Societa Geologica Italiana; l’Arco calabro-peloritano nell’orogene appenninico-maghrebide. Mem. Soc. Geol. It. 1976, 17, 1–60. [Google Scholar]
  81. Liberi, F.; Morten, L.; Piluso, E. Geodynamic significance of ophiolites within the Calabrian Arc. Isl. Arc 2006, 15, 26–43. [Google Scholar] [CrossRef]
  82. Filice, F.; Liberi, F.; Cirillo, D.; Pandolfi, L.; Marroni, M.; Piluso, E. Geology map of the central area of Catena Costiera: Insights into the tectono-metamorphic evolution of the Alpine belt in Northern Calabria. J. Maps 2015, 11, 114–125. [Google Scholar] [CrossRef]
  83. Climaco, A.; Boni, M.; Iannace, A.; Zamparelli, V. Platform margins, microbial/serpulids bioconstructions and slope-to-basin sediments in the Upper Triassic of the ‘Verbicaro Unit’ (Lucania and Calabria, southern Italy). Facies 1997, 36, 37–56. [Google Scholar] [CrossRef]
  84. Ghisetti, F.; Vezzani, L. Strutture tensionali e compressive indotte da meccanismi protondi lungo la linea del Pollino (Appennino meridionale). Boll. Della Soc. Geol. Ital. 1982, 101, 385–440. [Google Scholar]
  85. Iannace, A.; Vitale, S. The value of the old scientific literature: A lesson from the Calabria-Lucania border geology. Rend. Online Della Soc. Geol. Ital. 2013, 25, 68–77. [Google Scholar] [CrossRef]
  86. Vezzani, L.; Festa, A.; Ghisetti, F.C. Geology and Tectonic Evolution of the Central-Southern Apennines, Italy. In Geology and Tectonic Evolution of the Central-Southern Apennines, Italy; Geological Society of America: Washington, DC, USA, 2010. [Google Scholar]
  87. Tangari, A.C.; Scarciglia, F.; Piluso, E.; Marinangeli, L.; Pompilio, L. Role of weathering of pillow basalt, pyroclastic input and geomorphic processes on the genesis of the Monte Cerviero upland soils (Calabria, Italy). Catena 2018, 171, 299–315. [Google Scholar] [CrossRef]
  88. Liberi, F.; Piluso, E. Tectonometamorphic evolution of the ophiolitic sequencesfrom Northern Calabrian Arc. Ital. J. Geosci. 2009, 128, 483–493. [Google Scholar] [CrossRef]
  89. Graessner, T.; Schenk, V. Low-pressure metamorphism of Palaeozoic pelites in the Aspromonte, southern Calabria: Constraints for the thermal evolution in the Calabrian cross-section during the Hercynian orogeny. J. Metamorph. Geol. 1999, 17, 157–172. [Google Scholar] [CrossRef]
  90. Piluso, E.; Cirrincione, R.; Morten, L. Ophiolites of tha Calabrian Peloritan Arc and their relationiship with the crystalline basement (Catena Costiera and Sila Piccola, Calabria, Southern Italy) Glom 2000 Excursion Guide-Book. Ofioliti 2000, 25, 117–140. [Google Scholar]
  91. Piluso, E.; Morten, L. Hercynian high temperature granulites and migmatites from the Catena Costiera, northern Calabria, southern Italy. Per. Mineral. 2004, 73, 159–172. [Google Scholar]
  92. Cifelli, F.; Rossetti, F.; Mattei, M. The architecture of brittle postorogenic extension: Results from an integrated structural and paleomagnetic study in north Calabria (southern Italy). Geol. Soc. Am. Bull. 2007, 119, 221–239. [Google Scholar] [CrossRef]
  93. Mattei, M.; Cipollari, P.; Cosentino, D.; Argentieri, A.; Rossetti, F.; Speranza, F.; Di Bella, L. The Miocene tectono-sedimentary evolution of the southern Tyrrhenian Sea: Stratigraphy, structural and palaeomagnetic data from the on-shore Amantea basin (Calabrian Arc, Italy): Tectono-sedimentary evolution of the Amantea basin. Basin Res. 2002, 14, 147–168. [Google Scholar] [CrossRef]
  94. Brozzetti, F.; Cirillo, D.; Liberi, F.; Piluso, E.; Faraca, E.; De Nardis, R.; Lavecchia, G. Structural style of Quaternary extension in the Crati Valley (Calabrian Arc): Evidence in support of an east-dipping detachment fault. Ital. J. Geosci. 2017, 136, 434–453. [Google Scholar] [CrossRef]
  95. Cirillo, D.; Totaro, C.; Lavecchia, G.; Orecchio, B.; de Nardis, R.; Presti, D.; Ferrarini, F.; Bello, S.; Brozzetti, F. Structural complexities and tectonic barriers controlling recent seismic activity in the Pollino area (Calabria–Lucania, southern Italy)—constraints from stress inversion and 3D fault model building. Solid Earth 2022, 13, 205–228. [Google Scholar] [CrossRef]
  96. Ercoli, M.; Cirillo, D.; Pauselli, C.; Jol, H.M.; Brozzetti, F. Ground-penetrating radar signature of Quaternary faulting: A study from the Mt. Pollino region, southern Apennines, Italy. Solid Earth 2021, 12, 2573–2596. [Google Scholar] [CrossRef]
  97. Filice, F.; Seeber, L. The Culmination of an Oblique Time-Transgressive Arc Continent Collision: The Pollino Massif Between Calabria and the Southern Apennines, Italy. Tectonics 2019, 38, 3261–3280. [Google Scholar] [CrossRef]
  98. Robustelli, G.; Ermolli, E.R.; Petrosino, P.; Jicha, B.; Sardella, R.; Donato, P. Tectonic and climatic control on geomorphological and sedimentary evolution of the Mercure basin, southern Apennines, Italy. Geomorphology 2014, 214, 423–435. [Google Scholar] [CrossRef]
  99. Robustelli, G.; Muto, F. The Crati River Basin: Geomorphological and stratigraphical data for the Plio–Quaternary evolution of northern Calabria, South Apennines, Italy. Geol. Carpathica 2017, 68, 68–79. [Google Scholar] [CrossRef]
  100. Borrelli, L.; Perri, F.; Critelli, S.; Gullà, G. Minero-petrographical features of weathering profiles in Calabria, southern Italy. Catena 2012, 92, 196–207. [Google Scholar] [CrossRef]
  101. Borrelli, L.; Greco, R.; Gullà, G. Weathering grade of rock masses as a predisposing factor to slope instabilities: Reconnaissance and control procedures. Geomorphology 2007, 87, 158–175. [Google Scholar] [CrossRef]
  102. Ietto, F.; Perri, F.; Miriello, D.; Ruffolo, S.A.; Laganà, A.; Le Pera, E. Epoxy Resin for the Slope Consolidation Intervention on the Tropea Sandstone Cliff (Southern Calabria, Italy). Geoheritage 2018, 10, 287–300. [Google Scholar] [CrossRef]
  103. Ghisetti, F.; Vezzani, L. The geodynamic evolution of the crustal structures of Calabria and Sicily. Boll. Geod. Sci. Aff. 1979, 44, 411–437. [Google Scholar]
  104. Ghisetti, F.; Vezzani, L. Contribution of structural analysis to understanding the geodynamic evolution of the Calabrian arc (Southern Italy). J. Struct. Geol. 1981, 3, 371–381. [Google Scholar] [CrossRef]
  105. Brogan, G.E.; Cluff, L.S.; Taylor, C.L. Seismicity and uplift of southern Italy. Tectonophysics 1975, 29, 323–330. [Google Scholar] [CrossRef]
  106. Bello, S.; de Nardis, R.; Scarpa, R.; Brozzetti, F.; Cirillo, D.; Ferrarini, F.; di Lieto, B.; Arrowsmith, J.R.; Lavecchia, G. Fault Pattern and Seismotectonic Style of the Campania—Lucania 1980 Earthquake (Mw 6.9, Southern Italy): New Multidisciplinary Constraints. Front. Earth Sci. 2021, 8, 63. [Google Scholar] [CrossRef]
  107. Bello, S.; Lavecchia, G.; Andrenacci, C.; Ercoli, M.; Cirillo, D.; Carboni, F.; Barchi, M.R.; Brozzetti, F. Complex trans-ridge normal faults controlling large earthquakes. Sci. Rep. 2022, 12, 10676. [Google Scholar] [CrossRef]
  108. Brozzetti, F.; Mondini, A.C.; Pauselli, C.; Mancinelli, P.; Cirillo, D.; Guzzetti, F.; Lavecchia, G. Mainshock Anticipated by Intra-Sequence Ground Deformations: Insights from Multiscale Field and SAR Interferometric Measurements. Geosciences 2020, 10, 186. [Google Scholar] [CrossRef]
  109. Lavecchia, G.; Bello, S.; Andrenacci, C.; Cirillo, D.; Ferrarini, F.; Vicentini, N.; de Nardis, R.; Roberts, G.; Brozzetti, F. QUaternary fault strain INdicators database—QUIN 1.0—First release from the Apennines of central Italy. Sci. Data 2022, 9, 204. [Google Scholar] [CrossRef]
  110. Lavecchia, G.; de Nardis, R.; Ferrarini, F.; Cirillo, D.; Bello, S.; Brozzetti, F. Regional seismotectonic zonation of hydrocarbon fields in active thrust belts: A case study from Italy. In Building Knowledge for Geohazard Assessment and Management in the Caucasus and other Orogenic Regions; Bonali, F.L., Mariotto, F.P., Tsereteli, N., Eds.; Springer: Amsterdam, The Netherlands, 2021; pp. 89–128. [Google Scholar]
  111. Napolitano, F.; Amoroso, O.; La Rocca, M.; Gervasi, A.; Gabrielli, S.; Capuano, P. Crustal Structure of the Seismogenic Volume of the 2010–2014 Pollino (Italy) Seismic Sequence From 3D P- and S-Wave Tomographic Images. Front. Earth Sci. 2021, 9, 735340. [Google Scholar] [CrossRef]
  112. Boncio, P.; Auciello, E.; Amato, V.; Aucelli, P.; Petrosino, P.; Tangari, A.C.; Jicha, B.R. Late Quaternary faulting in the southern Matese (Italy): Implications for earthquake potential and slip rate variability in the southern Apennines. Solid Earth 2022, 13, 553–582. [Google Scholar] [CrossRef]
  113. Critelli, S.; Muto, F.; Tripodi, V.; Perri, F. Link between thrust tectonics and sedimentation processes of stratigraphic sequences from the southern Apennines foreland basin system, Italy. Rend. Online Della Soc. Geol. Ital. 2013, 25, 21–42. [Google Scholar] [CrossRef]
  114. Ietto, F.; Bernasconi, M.P. The cliff bordering the northwestern margin of the Mesima basin (southern Calabria) is of Pleistocene age. Geogr. Fis. Dinam. Quarter. 2005, 28, 205–210. [Google Scholar]
  115. Tortorici, L.; Monaco, C.; Tansi, C.; Cocina, O. Recent and active tectonics in the Calabrian arc (Southern Italy). Tectonophysics 1995, 243, 37–55. [Google Scholar] [CrossRef]
  116. Dinkov, D.; Kitev, A. Advantages, disadvantages and applicability of gnss Post-Processing Kinematic (PPK) method for direct georeferencing of UAV images. In Proceedings of 8th International Conference on Cartography and GIS, 2020, Nessebar, Bulgaria; Bulgarian Cartographic Association: Nessebar, Bulgaria, 2020. [Google Scholar]
  117. Dinkov, D. A Low Cost Method UAV-PPK—Accuracy and Application. In Proceedings of XXIX International Symposium on Modern Technologies, Education and Professional Practice in Geodesy and Related Fields, Istanbul, Turkey, 5–6 November 2019. [Google Scholar]
  118. Cirillo, D.; Cerritelli, F.; Agostini, S.; Bello, S.; Lavecchia, G.; Brozzetti, F. Integrating Post-Processing Kinematic (PPK)–Structure-from-Motion (SfM) with Unmanned Aerial Vehicle (UAV) Photogrammetry and Digital Field Mapping for Structural Geological Analysis. ISPRS Int. J. Geo-Inf. 2022, 11, 437. [Google Scholar] [CrossRef]
  119. Žabota, B.; Kobal, M. Accuracy Assessment of UAV-Photogrammetric-Derived Products Using PPK and GCPs in Challenging Terrains: In Search of Optimized Rockfall Mapping. Remote Sens. 2021, 13, 3812. [Google Scholar] [CrossRef]
  120. Iizuka, K.; Ogura, T.; Akiyama, Y.; Yamauchi, H.; Hashimoto, T.; Yamada, Y. Improving the 3D model accuracy with a post-processing kinematic (PPK) method for UAS surveys. Geocarto. Int. 2022, 37, 4234–4254. [Google Scholar] [CrossRef]
  121. Famiglietti, N.A.; Cecere, G.; Grasso, C.; Memmolo, A.; Vicari, A. A Test on the Potential of a Low Cost Unmanned Aerial Vehicle RTK/PPK Solution for Precision Positioning. Sensors 2021, 21, 3882. [Google Scholar] [CrossRef]
  122. Tomaštík, J.; Mokroš, M.; Surový, P.; Grznárová, A.; Merganič, J. UAV RTK/PPK Method—An Optimal Solution for Mapping Inaccessible Forested Areas? Remote Sens. 2019, 11, 721. [Google Scholar] [CrossRef]
  123. Kovanic, L.; Blistan, P.; Rozlozník, M.; Szabó, G. UAS RTK/PPK photogrammetry as a tool for mapping the urbanized landscape, creating thematic maps, situation plans and DEM. Acta Montan. Slovaca 2021, 26, 649–660. [Google Scholar] [CrossRef]
  124. Martínez-Carricondo, P.; Agüera-Vega, F.; Carvajal-Ramírez, F. Accuracy assessment of RTK/PPK UAV-photogrammetry projects using differential corrections from multiple GNSS fixed base stations. Geocarto Int. 2023, 38, 2197507. [Google Scholar] [CrossRef]
  125. Lucieer, A.; Jong, S.M.d.; Turner, D. Mapping landslide displacements using Structure from Motion (SfM) and image correlation of multi-temporal UAV photography. Prog. Phys. Geogr. Earth Environ. 2013, 38, 97–116. [Google Scholar] [CrossRef]
  126. Taddia, Y.; Stecchi, F.; Pellegrinelli, A. Coastal Mapping Using DJI Phantom 4 RTK in Post-Processing Kinematic Mode. Drones 2020, 4, 9. [Google Scholar] [CrossRef]
  127. Štroner, M.; Urban, R.; Seidl, J.; Reindl, T.; Brouček, J. Photogrammetry Using UAV-Mounted GNSS RTK: Georeferencing Strategies without GCPs. Remote Sens. 2021, 13, 1336. [Google Scholar] [CrossRef]
  128. Zhang, H.; Aldana-Jague, E.; Clapuyt, F.; Wilken, F.; Vanacker, V.; Van Oost, K. Evaluating the potential of post-processing kinematic (PPK) georeferencing for UAV-based structure- from-motion (SfM) photogrammetry and surface change detection. Earth Surf. Dyn. 2019, 7, 807–827. [Google Scholar] [CrossRef]
  129. Dewez, T.J.B.; Girardeau-Montaut, D.; Allanic, C.; Rohmer, J. FACETS: A CloudCompare plugin to extract geological planes from unstructured 3D point clouds. In Proceedings of the The International Archives of the Photogrammetry, Remote Sensing and Spatial Information Sciences, XXIII ISPRS Congress, Prague, Czech Republic, 12–19 July 2016. [Google Scholar] [CrossRef]
  130. Gupta, S.K.; Shukla, D.P. Application of drone for landslide mapping, dimension estimation and its 3D reconstruction. J. Indian Soc. Remote Sens. 2018, 46, 903–914. [Google Scholar] [CrossRef]
  131. Singh, S.K.; Raval, S.; Banerjee, B.P. Automated structural discontinuity mapping in a rock face occluded by vegetation using mobile laser scanning. Eng. Geol. 2021, 285, 106040. [Google Scholar] [CrossRef]
  132. Testa, A.; Boncio, P.; Di Donato, M.; Brozzetti, F.; Cirillo, D. Mapping the geology of the 2016 Central Italy earthquake fault (Mt. Vettore—Mt. Bove fault, Sibillini Mts.): Geological details on the Cupi—Ussita and Mt. Bove—Mt. Porche segments and overall pattern of coseismic surface faulting. Geol. Field Trips 2019, 11, 1–13. [Google Scholar] [CrossRef]
  133. Allmendinger, R.W.; Siron, C.R.; Scott, C.P. Structural data collection with mobile devices: Accuracy, redundancy, and best practices. J. Struct. Geol. 2017, 102, 98–112. [Google Scholar] [CrossRef]
  134. Novakova, L.; Pavlis, T.L. Assessment of the precision of smart phones and tablets for measurement of planar orientations: A case study. J. Struct. Geol. 2017, 97, 93–103. [Google Scholar] [CrossRef]
  135. Novakova, L.; Pavlis, T.L. Modern Methods in Structural Geology of Twenty-first Century: Digital Mapping and Digital Devices for the Field Geology. In Teaching Methodologies in Structural Geology and Tectonics; Mukherjee, S., Ed.; Springer: Singapore, 2019; pp. 43–54. [Google Scholar]
  136. Whitmeyer, S.J.; Pyle, E.J.; Pavlis, T.L.; Swanger, W.; Roberts, L. Modern approaches to field data collection and mapping: Digital methods, crowdsourcing, and the future of statistical analyses. J. Struct. Geol. 2019, 125, 29–40. [Google Scholar] [CrossRef]
  137. Petroleum Engineering Structural Geology; Software. Digital Field Mapping. Available online: https://www.petex.com/products/move-suite/digital-field-mapping/ (accessed on 17 January 2024).
  138. Lundmark, A.M.; Augland, L.E.; Jørgensen, S.V. Digital fieldwork with Fieldmove—How do digital tools influence geoscience students’ learning experience in the field? J. Geogr. High. Educ. 2020, 44, 427–440. [Google Scholar] [CrossRef]
  139. Culshaw, M.G.; Ulusay, R. The ISRM suggested methods for rock characterization, testing and monitoring: 2007–2014. Bull. Eng. Geol. Environ. 2015, 74, 1499–1500. [Google Scholar] [CrossRef]
  140. Goodman, R.E.; Bray, J.W. Toppling of rock slopes. In Proceedings of Special Conference on Rock Engineering for Foundations and Slopes, ASCE, Boulder, CO, USA, 15–18 August 1976; Volume 1, pp. 201–234. [Google Scholar]
  141. Hudson, J.A.; Harrison, J.P. Engineering Rock Mechanics: An Introduction to the Principles and Applications; Elsevier: Oxford, UK, 1997; Volume 1, pp. 1–458. [Google Scholar]
  142. ArcGIS, E. Data Classification Methods—Geometrical Interval. Available online: https://pro.arcgis.com/en/pro-app/latest/help/mapping/layer-properties/data-classification-methods.htm (accessed on 17 January 2024).
  143. Gumede, H.; Stacey, T.R. Measurement of typical joint characteristics in South African gold mines and the use of these characteristics in the prediction of rock falls. J. S. Afr. Inst. Min. Metall. 2007, 107, 335–344. [Google Scholar]
  144. Rosser, N.; Massey, C. Rockfall hazard and risk. In Hazards and Disasters Series, Landslide Hazards, Risks, and Disasters; Davies, T., Rosser, N., Shroder, J.F., Eds.; Elsevier: Amsterdam, The Netherlands, 2022; pp. 581–622. [Google Scholar]
  145. Li, H.B.; Li, X.W.; Li, W.Z.; Zhang, S.L.; Zhou, J.W. Quantitative assessment for the rockfall hazard in a post-earthquake high rock slope using terrestrial laser scanning. Eng. Geol. 2019, 248, 1–13. [Google Scholar] [CrossRef]
  146. Piteau, D.R. Characterizing and extrapolating rock joint properties in engineering practice. In Geomechanik—Fortschritte in der Theorie und Deren Auswirkungen auf Die Praxis/Geomechanics—Progress in Theory and Its Effects on Practice; Springer: Berlin/Heidelberg, Germany, 1973; pp. 5–31. [Google Scholar]
  147. Pérez-Rey, I.; Riquelme, A.; González-deSantos, L.M.; Estévez-Ventosa, X.; Tomás, R.; Alejano, L.R. A multi-approach rockfall hazard assessment on a weathered granite natural rock slope. Landslides 2019, 16, 2005–2015. [Google Scholar] [CrossRef]
  148. Mineo, S.; Calio, D.; Pappalardo, G. UAV-Based Photogrammetry and Infrared Thermography Applied to Rock Mass Survey for Geomechanical Purposes. Remote Sens. 2022, 14, 473. [Google Scholar] [CrossRef]
  149. Danzi, M.; Di Crescenzo, G.; Ramondini, M.; Santo, A. Use of unmanned aerial vehicles (UAVs) for photogrammetric surveys in rockfall instability studies. Rend. Online Soc. Geol. Ital. 2013, 24, 82–85. [Google Scholar]
  150. Gigli, G.; Frodella, W.; Garfagnoli, F.; Morelli, S.; Mugnai, F.; Menna, F.; Casagli, N. 3-D geomechanical rock mass characterization for the evaluation of rockslide susceptibility scenarios. Landslides 2014, 11, 131–140. [Google Scholar] [CrossRef]
  151. Kakavas, M.P.; Nikolakopoulos, K.G. Digital Elevation Models of Rockfalls and Landslides: A Review and Meta-Analysis. Geosciences 2021, 11, 256. [Google Scholar] [CrossRef]
  152. Schilirò, L.; Robiati, C.; Smeraglia, L.; Vinci, F.; Iannace, A.; Parente, M.; Tavani, S. An integrated approach for the reconstruction of rockfall scenarios from UAV and satellite-based data in the Sorrento Peninsula (southern Italy). Eng. Geol. 2022, 308, 106795. [Google Scholar] [CrossRef]
  153. Fanos, A.M.; Pradhan, B. A novel rockfall hazard assessment using laser scanning data and 3D modelling in GIS. Catena 2019, 172, 435–450. [Google Scholar] [CrossRef]
  154. Graber, A.; Santi, P. UAV-photogrammetry rockfall monitoring of natural slopes in Glenwood Canyon, CO, USA: Background activity and post-wildfire impacts. Landslides 2023, 20, 229–248. [Google Scholar] [CrossRef]
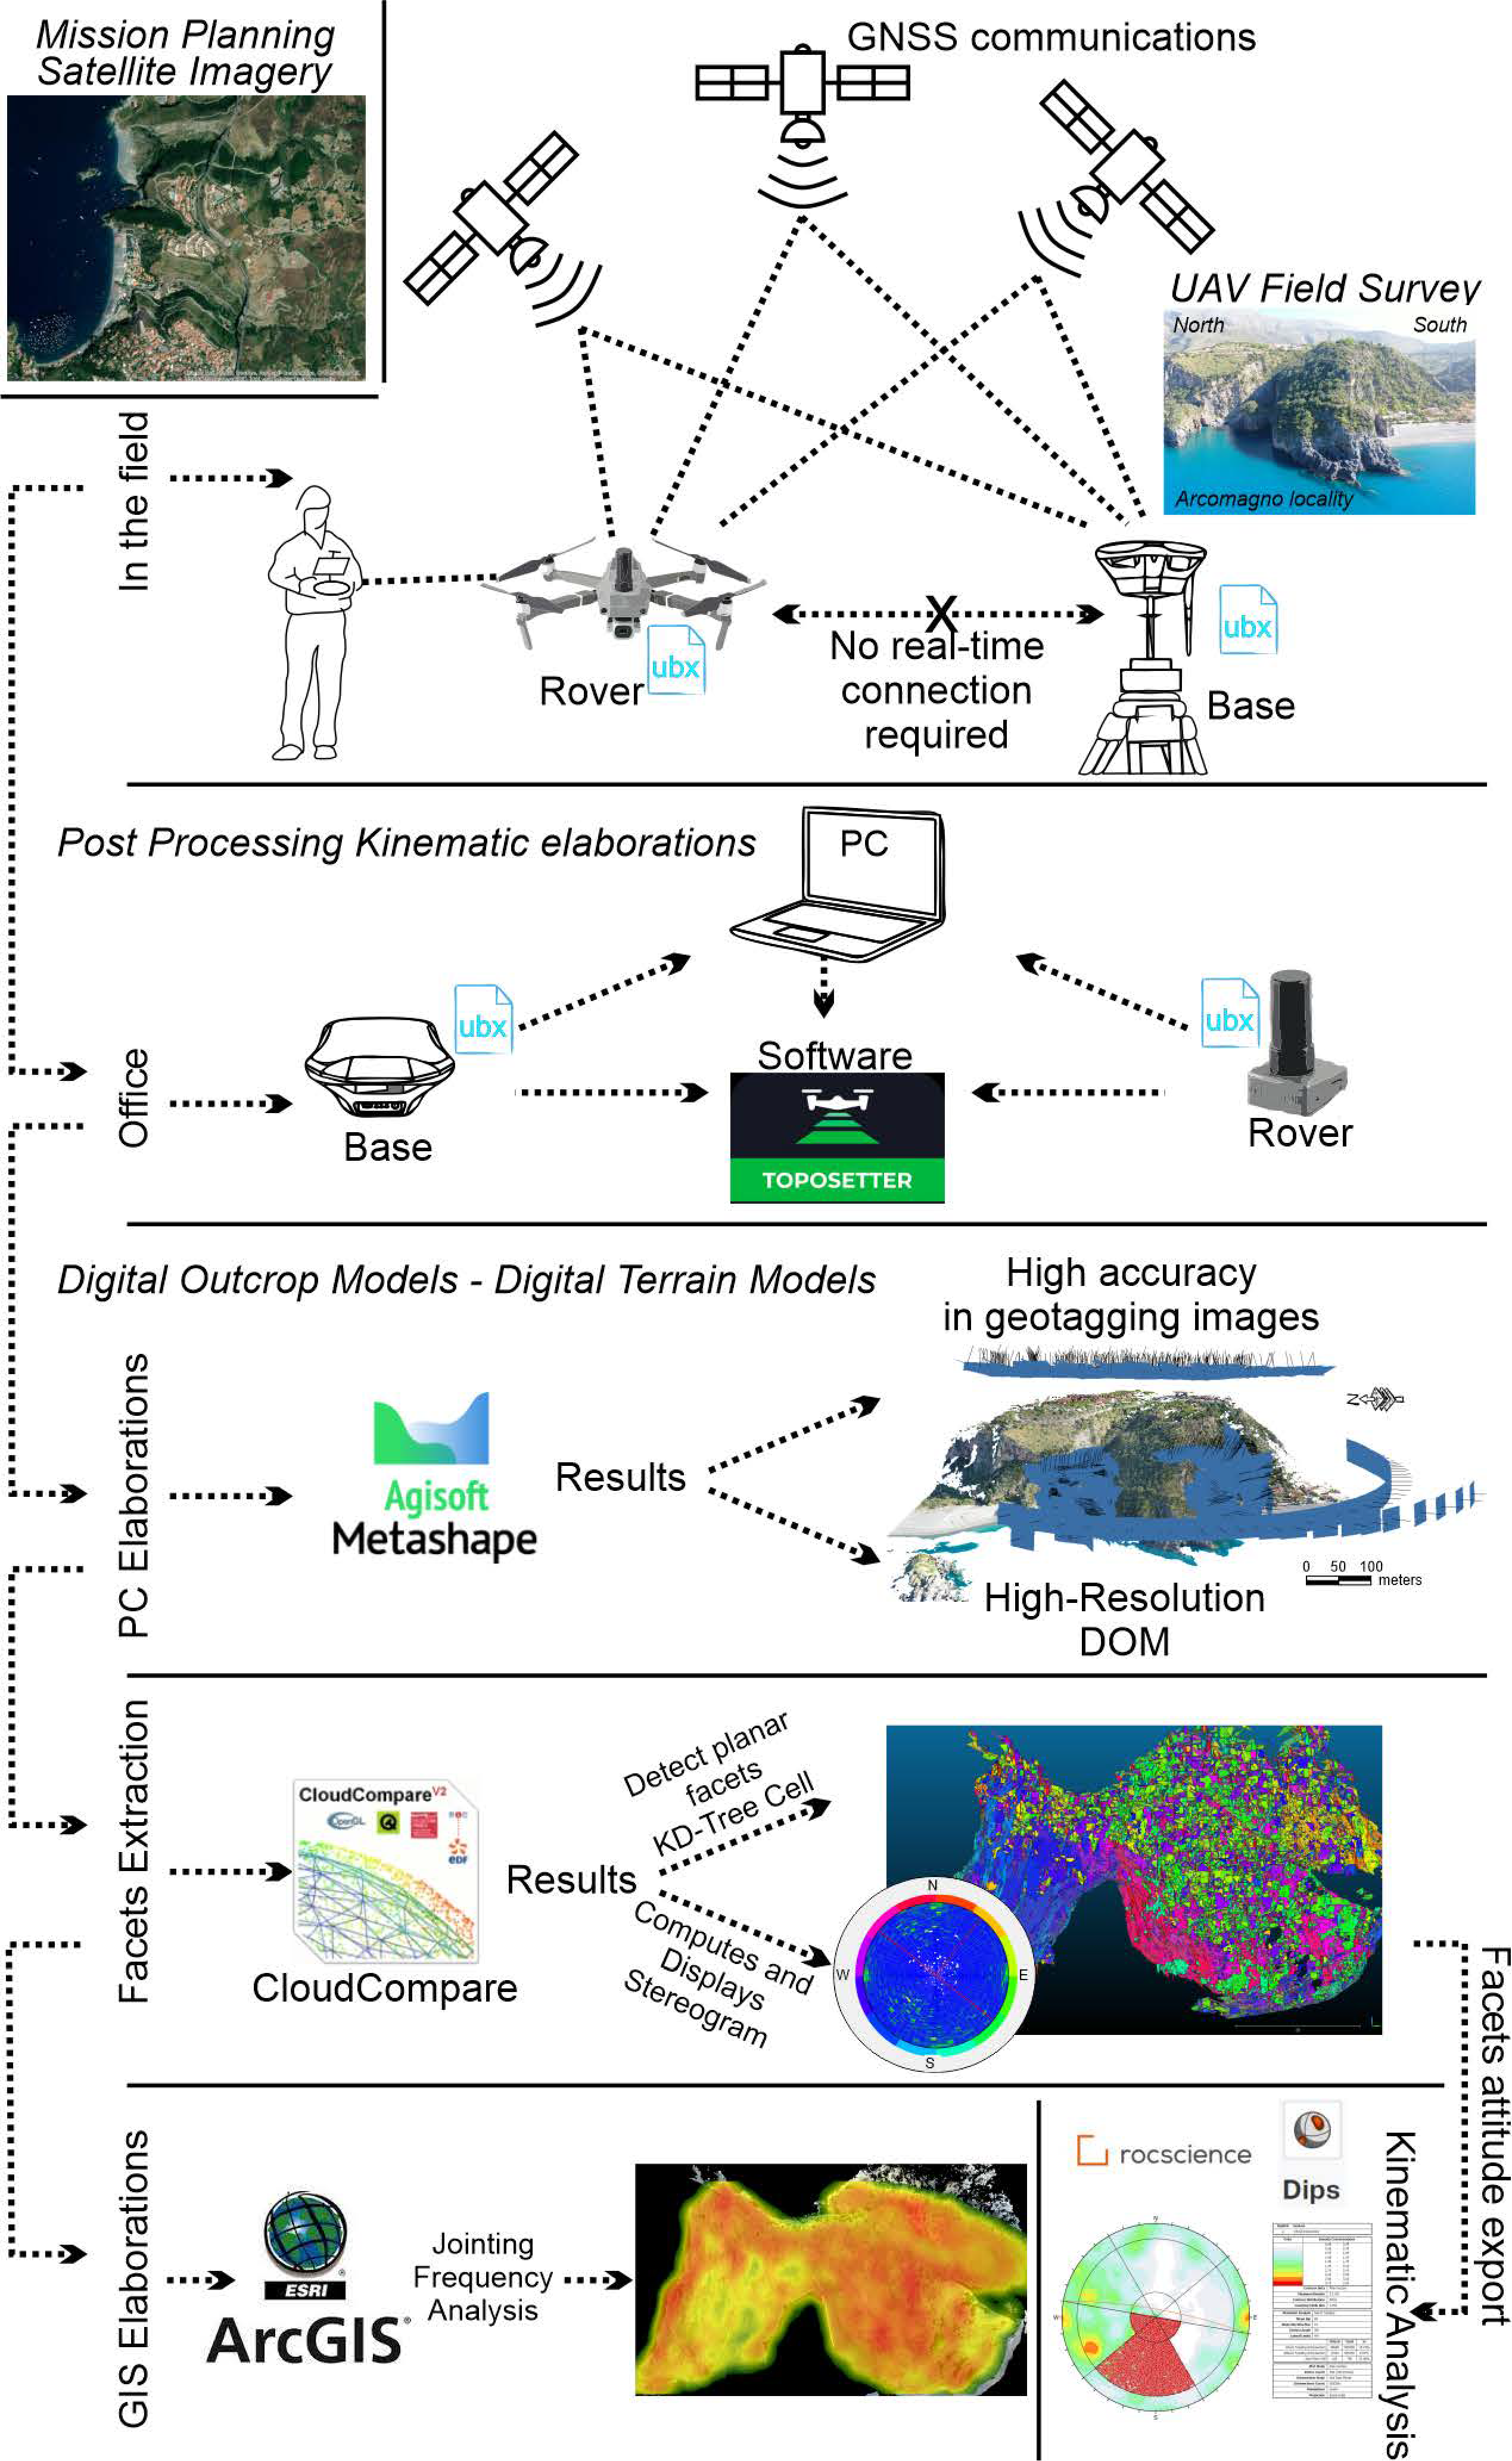
Figure 2. Workflow diagram illustrating the methods applied in this study.
Drones 08 00031 g002
Figure 3. Base station system utilised for satellite data acquisition in Rinex format, positioned at the following coordinate: (a) X: 15.79284401; Y: 39.85614727; Z: 97.884 m; (b) X: 15.7910236; Y: 39.85356206; Z: 5.454 m; (c) X: 15.79053023; Y: 39.85380427; Z: 1.25 m; (d) X: 15.79162917; Y: 39.85499262; Z: 22.61 m; (e) Location of GNSS Base station acquisition and positioning of GCPs/CheckPoints. The positions of the Base Station and Ground Control Points (GCPs)/Checkpoints in panels (ad) have been integrated into panel (e).
Drones 08 00031 g003
Figure 4. (a) Map of Image Capture Points Acquired During Mission 1 and (b) Mission 2. The yellow points indicate the capture points. The base images are derived from World Imagery ESRI ArcMap 10.8/ArcGIS Pro. (c,d) density map showing the number of overlapping photos acquired by drone investigation based on the scheme shown in (a,b), respectively; (e) overlapping of all images acquired during the two automatic flights. In white is the coastline area of the investigated cliffs. The image source for panels (ce) was extracted from the Agisoft Metashape Professional v. 1.8.5 report.
Drones 08 00031 g004
Figure 5. 3D Digital Outcrop Model generated from drone-captured images and subsequent dense point cloud creation (for the area’s location, see Figure 1c,d). The blue areas represent the image acquisition points taken during the flight missions in the Arcomagno area.
Drones 08 00031 g005
Figure 6. Orthomosaic of the Arcomagno locality, close to San Nicola Arcella village. The polygons with different colours show the areas analysed in this research. Yellow stars show the location of in-situ measurement stations for controlling of in-situ measurement stations for controlling of digital data. The ten analysed areas are denoted by the letter ‘A’, signifying “area”, followed by a numerical designation ranging from 1 to 10, indicating the respective position of each analysed area.
Drones 08 00031 g006
Figure 7. Digital Outcrop Models of the 10 surveyed areas. The 10 analysed areas are labeled from (ai). For the specific location of each area, refer to Figure 6.
Drones 08 00031 g007
Figure 8. Facets/Fracture detection within the 10 identified rock scarps. The 10 analysed areas are labeled from (ai). For the specific location of each area, refer to Figure 6.
Drones 08 00031 g008
Figure 9. Maps obtained by Agisoft Metashape Professional v. 1.8.5 software and ESRI ArcMap 10.8/ArcGIS Pro analyses: (a) Shaded Relief; (b) DTM and contour lines; (c) Slope degree; (d) Slope exposure map of the studied area.
Drones 08 00031 g009
Figure 10. Rock stability analyses of the 10 areas.
Drones 08 00031 g010
Figure 11. Jointing frequency analysis of the 10 rock scarps (frontal view). The colour legend in the pictures refers to the jointing state: Red: Very High (VH); Yellow: High (H); Green: Moderate (M) (see Figure 6 for the location of the 10 areas).
Drones 08 00031 g011
Figure 12. Examples of rockfall phenomena triggered in the study area. (a) rockfall deposit at the foot of scarps of areas 4, 7 and 8; the red arrows indicate the blocks of rock fell from the adjacent slope; the white dashed rectangle shows the (b) panel location in Area 9, and the white dashed square indicates the location of the panel (c); in (c) photo shooted in October 2022 pre rockfall event; (d) photo shooted after the rockfall events in Area 6 that occurred in January 2023. Stereonet in (d) confirms the kinematic analyses of rockfall event of January 2023.
Drones 08 00031 g012
Figure 13. Final map of danger areas. In yellow, the rockfall source area is highlighted. Additionally, two buffer zones requiring attention are depicted: the orange polygon outlines areas where rockfall deposits may potentially accumulate in the event of landslides, although no recent block deposits have been observed. In the red polygon, recent rockfall deposits are visibly present. The 10 areas are represented with the white A1–A10 acronyms.
Drones 08 00031 g013
Table 1. Summary data of the seven flight missions.
MissionUBX GNSS Emlid Reach RS2
YYYY-MM-DD-hh:mm:ss
GNSS Emlid Reach RS2
Coordinate Long
GNSS Emlid Reach RS2
Coordinate Lat
GNSS Emlid Reach RS2
Elevation Z
UBX GNSS Drone
(UTC-Time)
Time StartTime EndN° of
Image
Type
Flyght
12022-10-28-09:28:0015.7928440139.8561472797.88409-38-4011:4211:53175Aut.
2//15.7928440139.8561472797.88410-03-4312:0512:16173Aut.
32022-10-28-10:54:0515.791023639.853562065.45410-55-3012:5813:17253Man.
42022-10-28-12:06:5415.7916291739.8549926222.61112-09-5314:1114:29199Man.
5//15.7916291739.8549926222.61112-33-2314:3414:55333Man.
6//15.7916291739.8549926222.61112-57-1414:5815:0579Man.
72022-10-28-13:41:2515.7905302339.853804271.2513-42-2515:4415:56160Man.
Table 2. Features of Automatic Flight Missions.
MissionTypeLength (m)Height (m)GSD (cm/px)Gimbal (°)Overlap (%)Sidelap (%)Distance Image (m)
1Double grid56951002.370606045
2Single grid61031002.390707040
Table 3. Resumptive numeric data of Rock stability analyses of the 10 areas (see Stereographic Analyses of Figure 10).
AreaMax Density
%
Kinematic
Analyses
Slope
Dip Direction/Dip
Number of
Critical Facets
Number of
Total Facets
%
Planar sliding 10,209 34.84
14.4Direct topplingN190°/85°12,57329,30242.91
Flexural toppling 4767 16.27
Planar sliding 4357 23.75
22.42Direct topplingN200°/85°532118,34529.01
Flexural toppling 4483 24.44
Planar sliding 9187 29.01
33.44Direct topplingN215°/85°13,37831,67142.24
Flexural toppling 3231 10.2
Planar sliding 7989 34.85
43.8Direct topplingN345°/85°962122,92141.97
Flexural toppling 4785 20.88
Planar sliding 5233 26.05
52.52Direct topplingN350°/85°634420,08931.58
Flexural toppling 3804 18.94
Planar sliding 3218 14.4
62.77Direct topplingN010°/85°440722,34319.72
Flexural toppling 5227 23.39
Planar sliding 4057 21.08
72.78Direct topplingN355°/85°573419,25029.79
Flexural toppling 3065 15.92
Planar sliding 7111 31.78
83.06Direct topplingN185°/85°903222,37840.36
Flexural toppling 4154 18.56
Planar sliding 9520 32.11
93.65Direct topplingN245°/85°12,26929,64541.39
Flexural toppling 4652 15.69
Planar sliding 11,790 27.06
102.88Direct topplingN350°/85°14,20643,57132.6
Flexural toppling 10,821 24.84
Table 4. Summarised data of the geomechanical analysis for the 10 rock escarpments. The data within the three columns (red = very high, yellow = high, and green = moderate) show each jointing class’s surface extension (in square meters “sq. m.”) and the respective percentage calculated on each escarpment.
Very High
sq. m.
%High
sq. m.
%Moderate
sq. m.
%Total Area
sq. m.
Area 12546.719.38643.065.32036.415.413,226.1
Area 268.48.9536.369.9162.321.2767.0
Area 31144.420.43421.261.11032.218.45597.8
Area 4337.35.11680.225.54577.569.46595.1
Area 5503.464.0266.633.916.72.1786.7
Area 61269.556.2717.431.8271.212.02258.1
Area 7215.524.8471.354.3181.420.9868.2
Area 81541.651.81237.041.5199.76.72978.3
Area 9920.714.33768.758.71731.727.06421.1
Area 101041.530.21933.556.0478.913.93453.9
Disclaimer/Publisher’s Note: The statements, opinions and data contained in all publications are solely those of the individual author(s) and contributor(s) and not of MDPI and/or the editor(s). MDPI and/or the editor(s) disclaim responsibility for any injury to people or property resulting from any ideas, methods, instructions or products referred to in the content.