Article

A Novel Scouring Method to Monitor Nocturnal Mammals Using Uncrewed Aerial Vehicles and Thermal Cameras—A Comparison to Line Transect Spotlight Counts

1
Department of Chemistry and Bioscience, Aalborg University, 9220 Aalborg, Denmark
2
Aalborg Zoo, 9000 Aalborg, Denmark
*
Author to whom correspondence should be addressed.
Drones 2023, 7(11), 661; https://doi.org/10.3390/drones7110661
Submission received: 15 October 2023 / Revised: 2 November 2023 / Accepted: 3 November 2023 / Published: 6 November 2023

Abstract

:
Wildlife abundance surveys are important tools for making decisions regarding nature conservation and management. Cryptic and nocturnal mammals can be difficult to monitor, and methods to obtain more accurate data on density and population trends of these species are needed. We propose a novel monitoring method using an aerial drone with a laser rangefinder and high zoom capabilities for thermal imagery. By manually operating the drone, the survey area can be initially scanned in a radius of several kilometers, and when a point of interest is observed, animals could be identified from up to one kilometer away by zooming in while the drone maintains an altitude of 120 m. With the laser rangefinder, a precise coordinate of the detected animal could be recorded instantly. Over ten surveys, the scouring drone method recorded significantly more hares than traditional transect spotlight count surveys, conducted by trained volunteers scanning the same farmland area within the same timeframe (p = 0.002, Wilcoxon paired rank test). The difference between the drone method and the transect spotlight method was hare density-dependent (R = 0.45, p = 0.19, Pearson’s product–moment correlation); the larger the density of hares, the larger the difference between the two methods to the benefit of the drone method. There was a linear relation between the records of deer by the drone and by spotlight (R = 0.69, p = 0.027), while no relation was found between the records of carnivores by drone and spotlight counts. This may be due to carnivores’ speed and vigilance or lack of data. Furthermore, the drone method could cover up to three times the area within the same timeframe as the transect spotlight counts.

1. Introduction

Cryptic or nocturnal animals, like the European brown hare (Lepus europaeus), can be difficult to monitor due to camouflage, human avoidance, choice in habitat, or simply because they are mostly active in the cover of the night [1,2,3]. In Denmark, using hunting bag statistics have been the primary method applied to monitor wildlife game [4,5,6,7], but studies suggest that this method alone is not sufficiently accurate, since hunting traditions and legislations can change over time and vary due to local game densities [4,5,6,7,8,9,10]. In addition to hunting bag statistics, point counts [5,11] and especially spotlight counts [4,7,12] have for decades provided valuable information about the population trends of wildlife game mammals in Denmark, including the hare [4,7].

1.1. Spotlight Counts

One of the main advantages of spotlight counts is that they can be carried out by volunteers and produce low-expense, high-quantity data with little training and a minimum of equipment [1,4,5,7,10,13,14,15,16,17,18,19]. Spotlight count data may be prone to underestimation, as the method relies on animal eye reflection and may miss animals that look away from the observer, and, therefore, distance sampling techniques are usually applied, assuming the density of the species in question is evenly distributed in the area surveyed [15,17,18,20]. Rahman et al. [21] suggested that spotlighting methods may not produce sufficiently high detection rates to be reliable when monitoring cryptic animals. Sliwinski et al. [10] concluded that linear spotlighting methods using citizen science produce reliable data for estimating European brown hare densities when surveying open, flat agricultural land but has limitations when the survey area is dominated by vegetation, such as hedgerows or forest.

1.2. Drones in Wildlife Monitoring

Recent technological advances, such as better battery capacity, improved sensors, and lower cost, have accelerated the applications of aerial drones, also known as uncrewed or unmanned aerial vehicles (UAV), unmanned aerial systems (UAS) and remotely piloted aircraft systems (RPAS), in the field of ecology and wildlife monitoring [22,23,24,25,26,27,28,29,30]. Especially multirotor drones, as opposed to fixed-winged drones, equipped with thermal infrared (TIR) cameras have proven to be a useful tool for monitoring cryptic and nocturnal species, on par with spotlight methods [3,25,26,30,31,32,33,34,35,36,37,38]. In a review, Linchant et al. [30] pointed out that several studies have examined the rising potential of the use of drones for wildlife monitoring, but these have primarily been conducted in classic line transects with the sensors pointed directly downwards, so there exists a need to explore and develop new methods. Whitworth et al. [35] showed that by changing two factors, flight speed and the time of day that a survey was conducted, the detection and identification of rainforest canopy wildlife could have a variation of up to six times from the lowest to the highest result. Their study also suggested that angles other than 90° of the drone-mounted sensors during surveys should be examined [35,39]. Povlsen et al. [24] conducted a drone survey concurrently with a spotlight count. This was performed by flying at a 60 m altitude, with the camera recording directly downwards, while the drone was flying autonomously in a predetermined flight path, covering the same transects surveyed with spotlights. By analyzing the video footage for animal observations afterwards and retrieving spatial information from the metadata of the video files, it was possible to plot the animal distribution on a map. This method proved useful; however, as it required the drone to be directly above the animals observed, the situational awareness and the area covered were limited, and the following video analysis was time consuming.
The aim of this study was to propose an improved method for monitoring cryptic and nocturnal animals, with the focus on hare, deer, and predators in Danish nature, using an aerial drone with a laser rangefinder and zoom capabilities for thermal imagery. This was accomplished by comparing transect spotlight count surveys conducted by volunteers from the Danish hunter´s association (DJ) to a scouring approach with the drone scanning the same farmland area within the same timeframe. The improved method was expected to reveal at least the same number of animals as the spotlight counts and cover the same area within the same time frame.

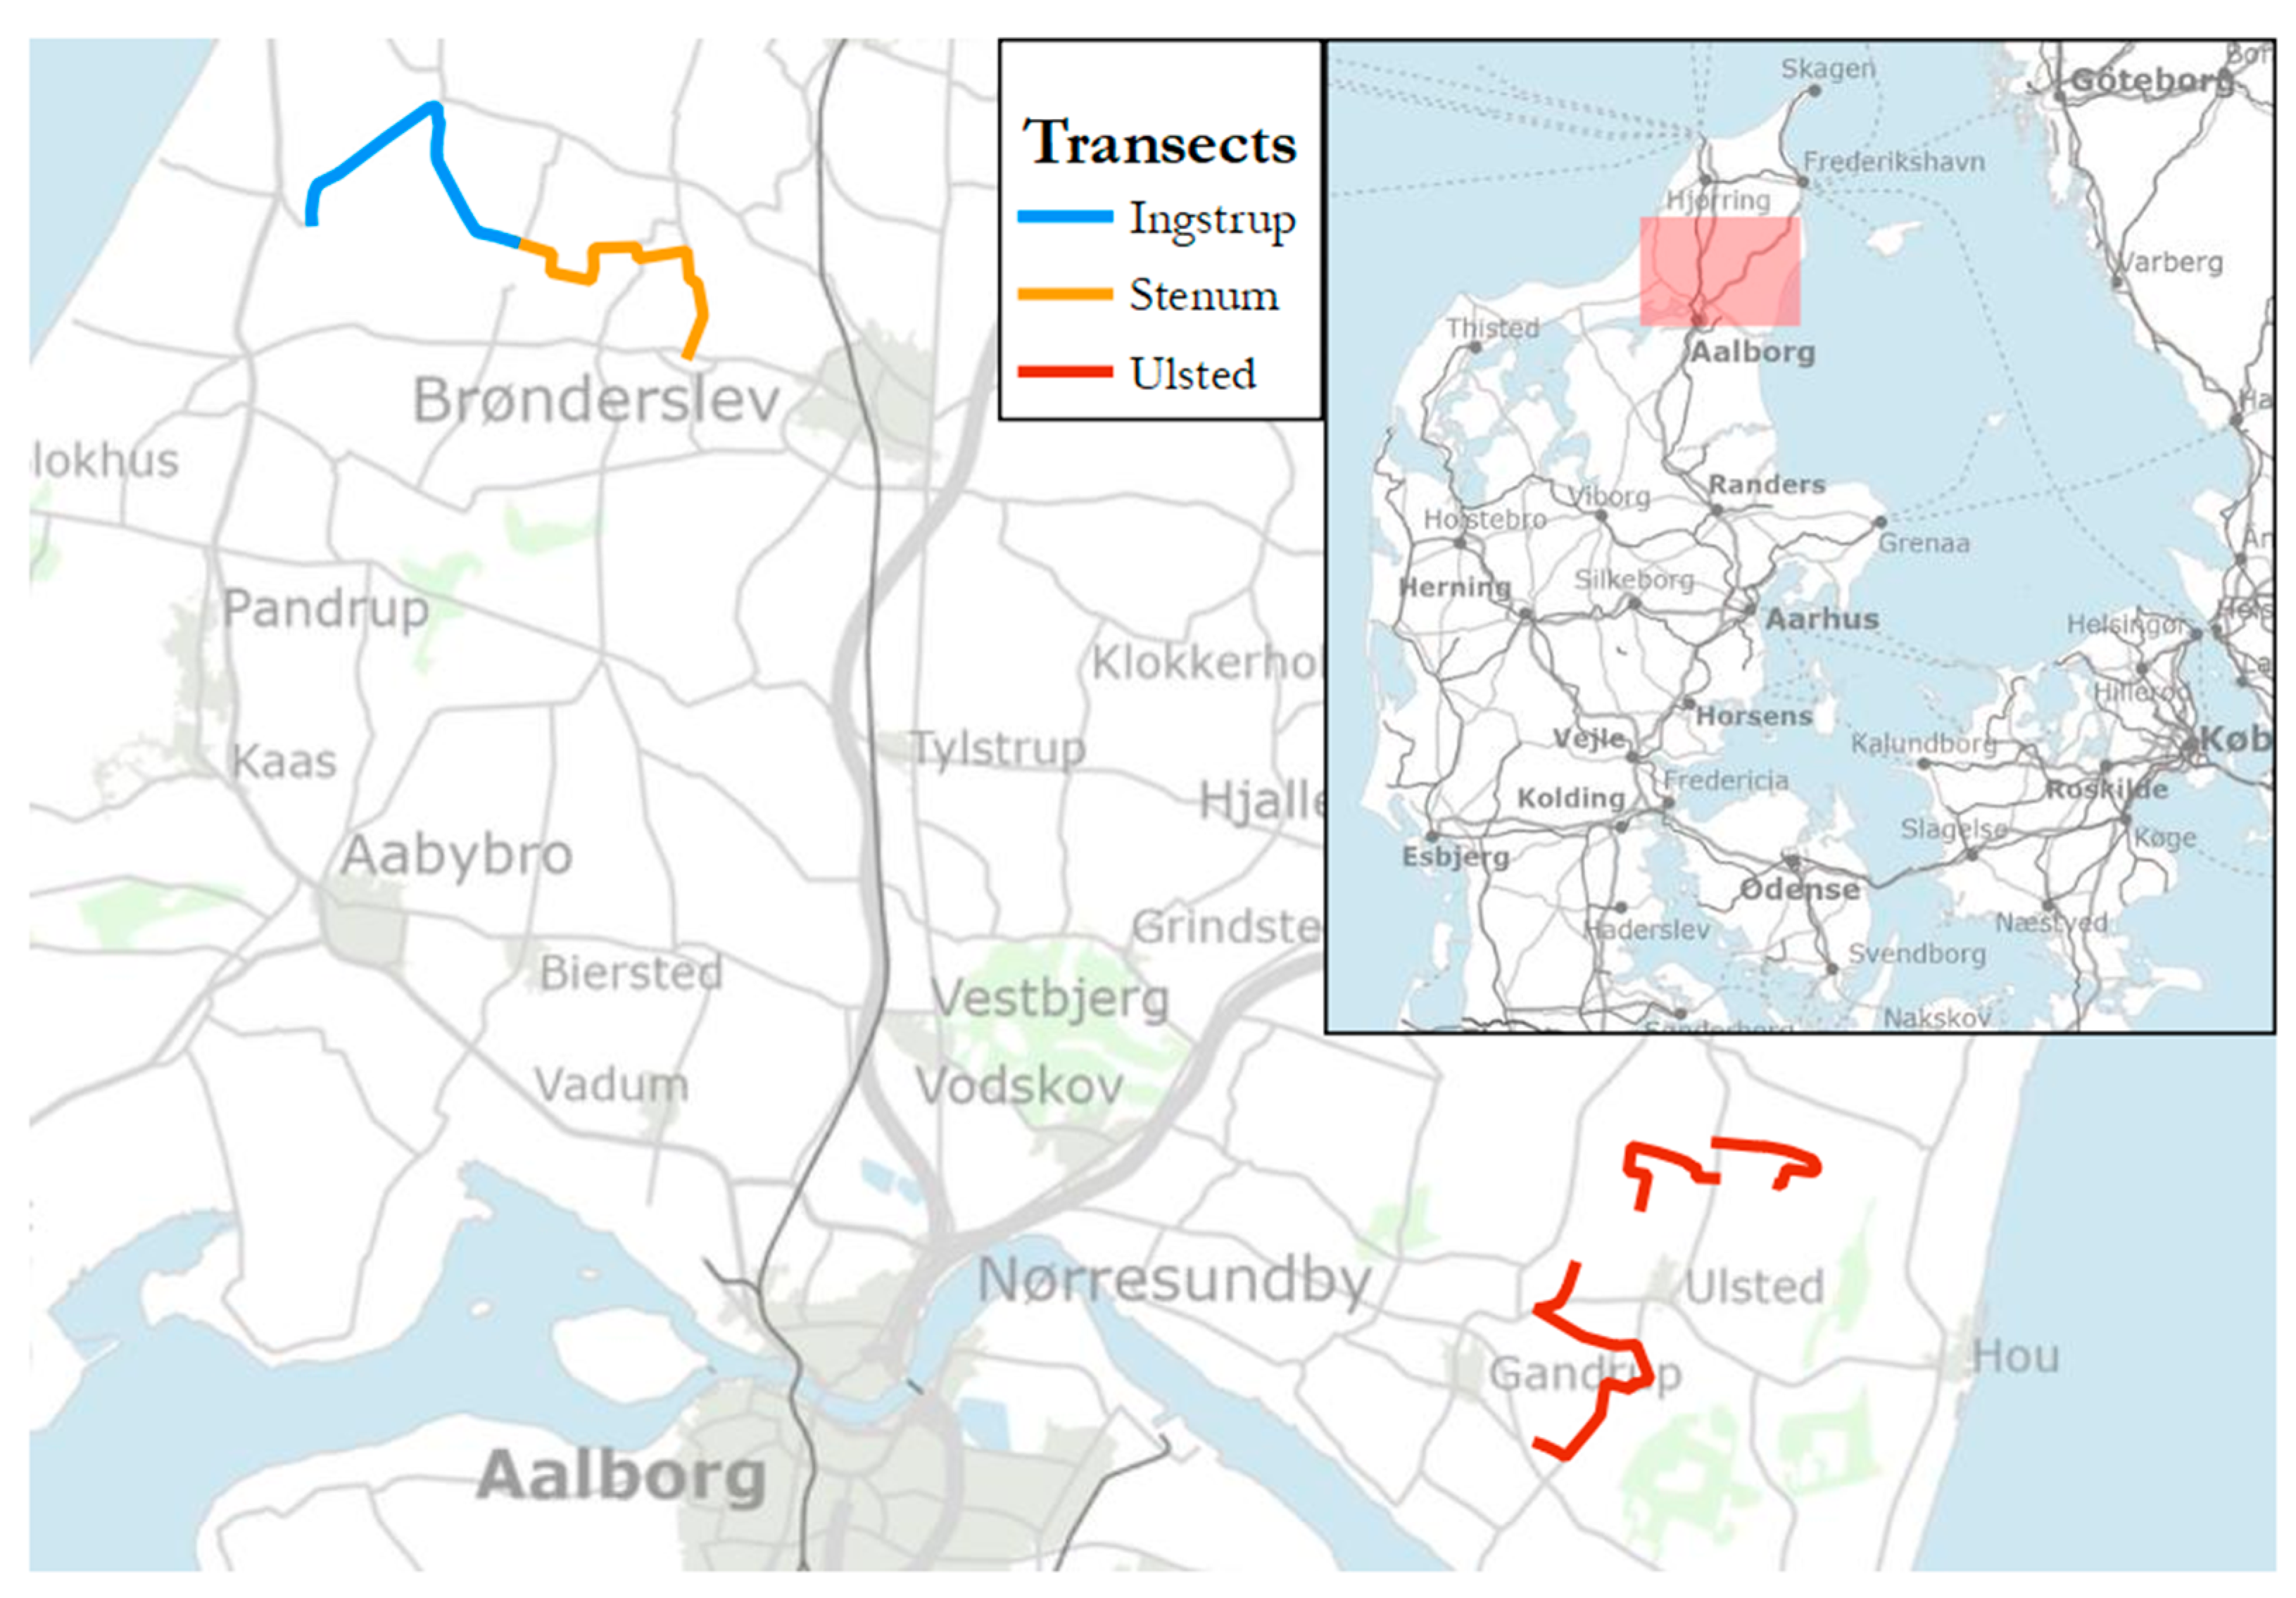
2. Materials and Methods

To improve on the method used in spring 2022, where a drone was preprogrammed to scan a defined area with the camera pointed straight down, covering 2.4 km2 in three hours [24], a new approach was employed by manually flying the drone and manipulating the thermal camera with high-powered zoom, scouring the area and identifying animals on-site. With the use of the laser rangefinder, virtual pinpoints were manually placed on the controller map, which could be saved via the integrated DJI FlightHub application, marking observations with a GPS coordinate while flying. The video footage could later be analyzed to confirm and annotate the species of each pinpoint and to check for missed observations. The drone surveys were conducted simultaneously with line transect spotlight counts, to compare the drone method to a well-established method for assessing mammal populations [1,5,7,10,13,14,40]. The new drone method covered 5.1 km2 in approximately three hours, and animals were observed and identified both inside and outside the transect area, up to 500 m from the transect line.

2.1. Transect Spotlight Counts—Citizen Science

The transect spotlight counts were conducted in Northern Jutland, Denmark, in spring 2023, by volunteer hunters from three census guilds: Ulsted, comprised of a northern and a southern area, (57.07575 N, 10.25559 E), Ingstrup, and Stenum (57.30722 N, 9.80053 E) (Figure 1). The observers had previous experience in spotlight counting and were supervised by the Danish hunter´s association, as part of their annual surveys [7].
The counts were performed in predetermined transect lines traversed by car, by shining a spotlight in all directions from the vehicle, counting the mammals spotted up to 150 m out, mainly identified by eye reflection [7,12]. Movement patterns were an important part of species identification, but animals smaller than ferrets (Mustela putorius) and house cats (Felis catus), approximately 50 cm including tail, were rarely spotted, and were not included in the count. A PrimusDanmark spotlight was used (Cree 10-watt LED, 810 Lumen, SHG, Huizhou, China), and binoculars were brought as an aid for species determination. Each census would start 1.5 h after sunset [7,12]; however, Ingstrup–Stenum and Ulsted North–South were conducted consecutively the same night, meaning that the counts at Stenum and Ulsted South started 2–3 h after sunset. The speed of the car varied to be sufficiently slow to be able to cover the area, usually around 5–10 km/h depending on the terrain, vegetation, and obstacles, and with full stops at terrain difficult to cover [7,12]. The observations were recorded on paper maps, with an estimated distance to the transect line.
Two surveys were conducted at Ingstrup and Stenum: 15 March and 9 April 2023. Three surveys were conducted at Ulsted: 22 March, 29 March, and 5 April 2023. The weather conditions on those nights are listed in Table 1.
The transect lines covered the following distance and area: Ingstrup 8.6 km, covering 2.58 km2; Stenum 8.3 km, covering 2.49 km2; Ulsted North 8.0 km, covering 2.40 km2; Ulsted South 9.1 km, covering 2.73 km2. The mean speed of the car conducting the spotlight counts in Ingstrup and Stenum was 11 km/h, while in Ulsted, the mean speed was 6 km/h.

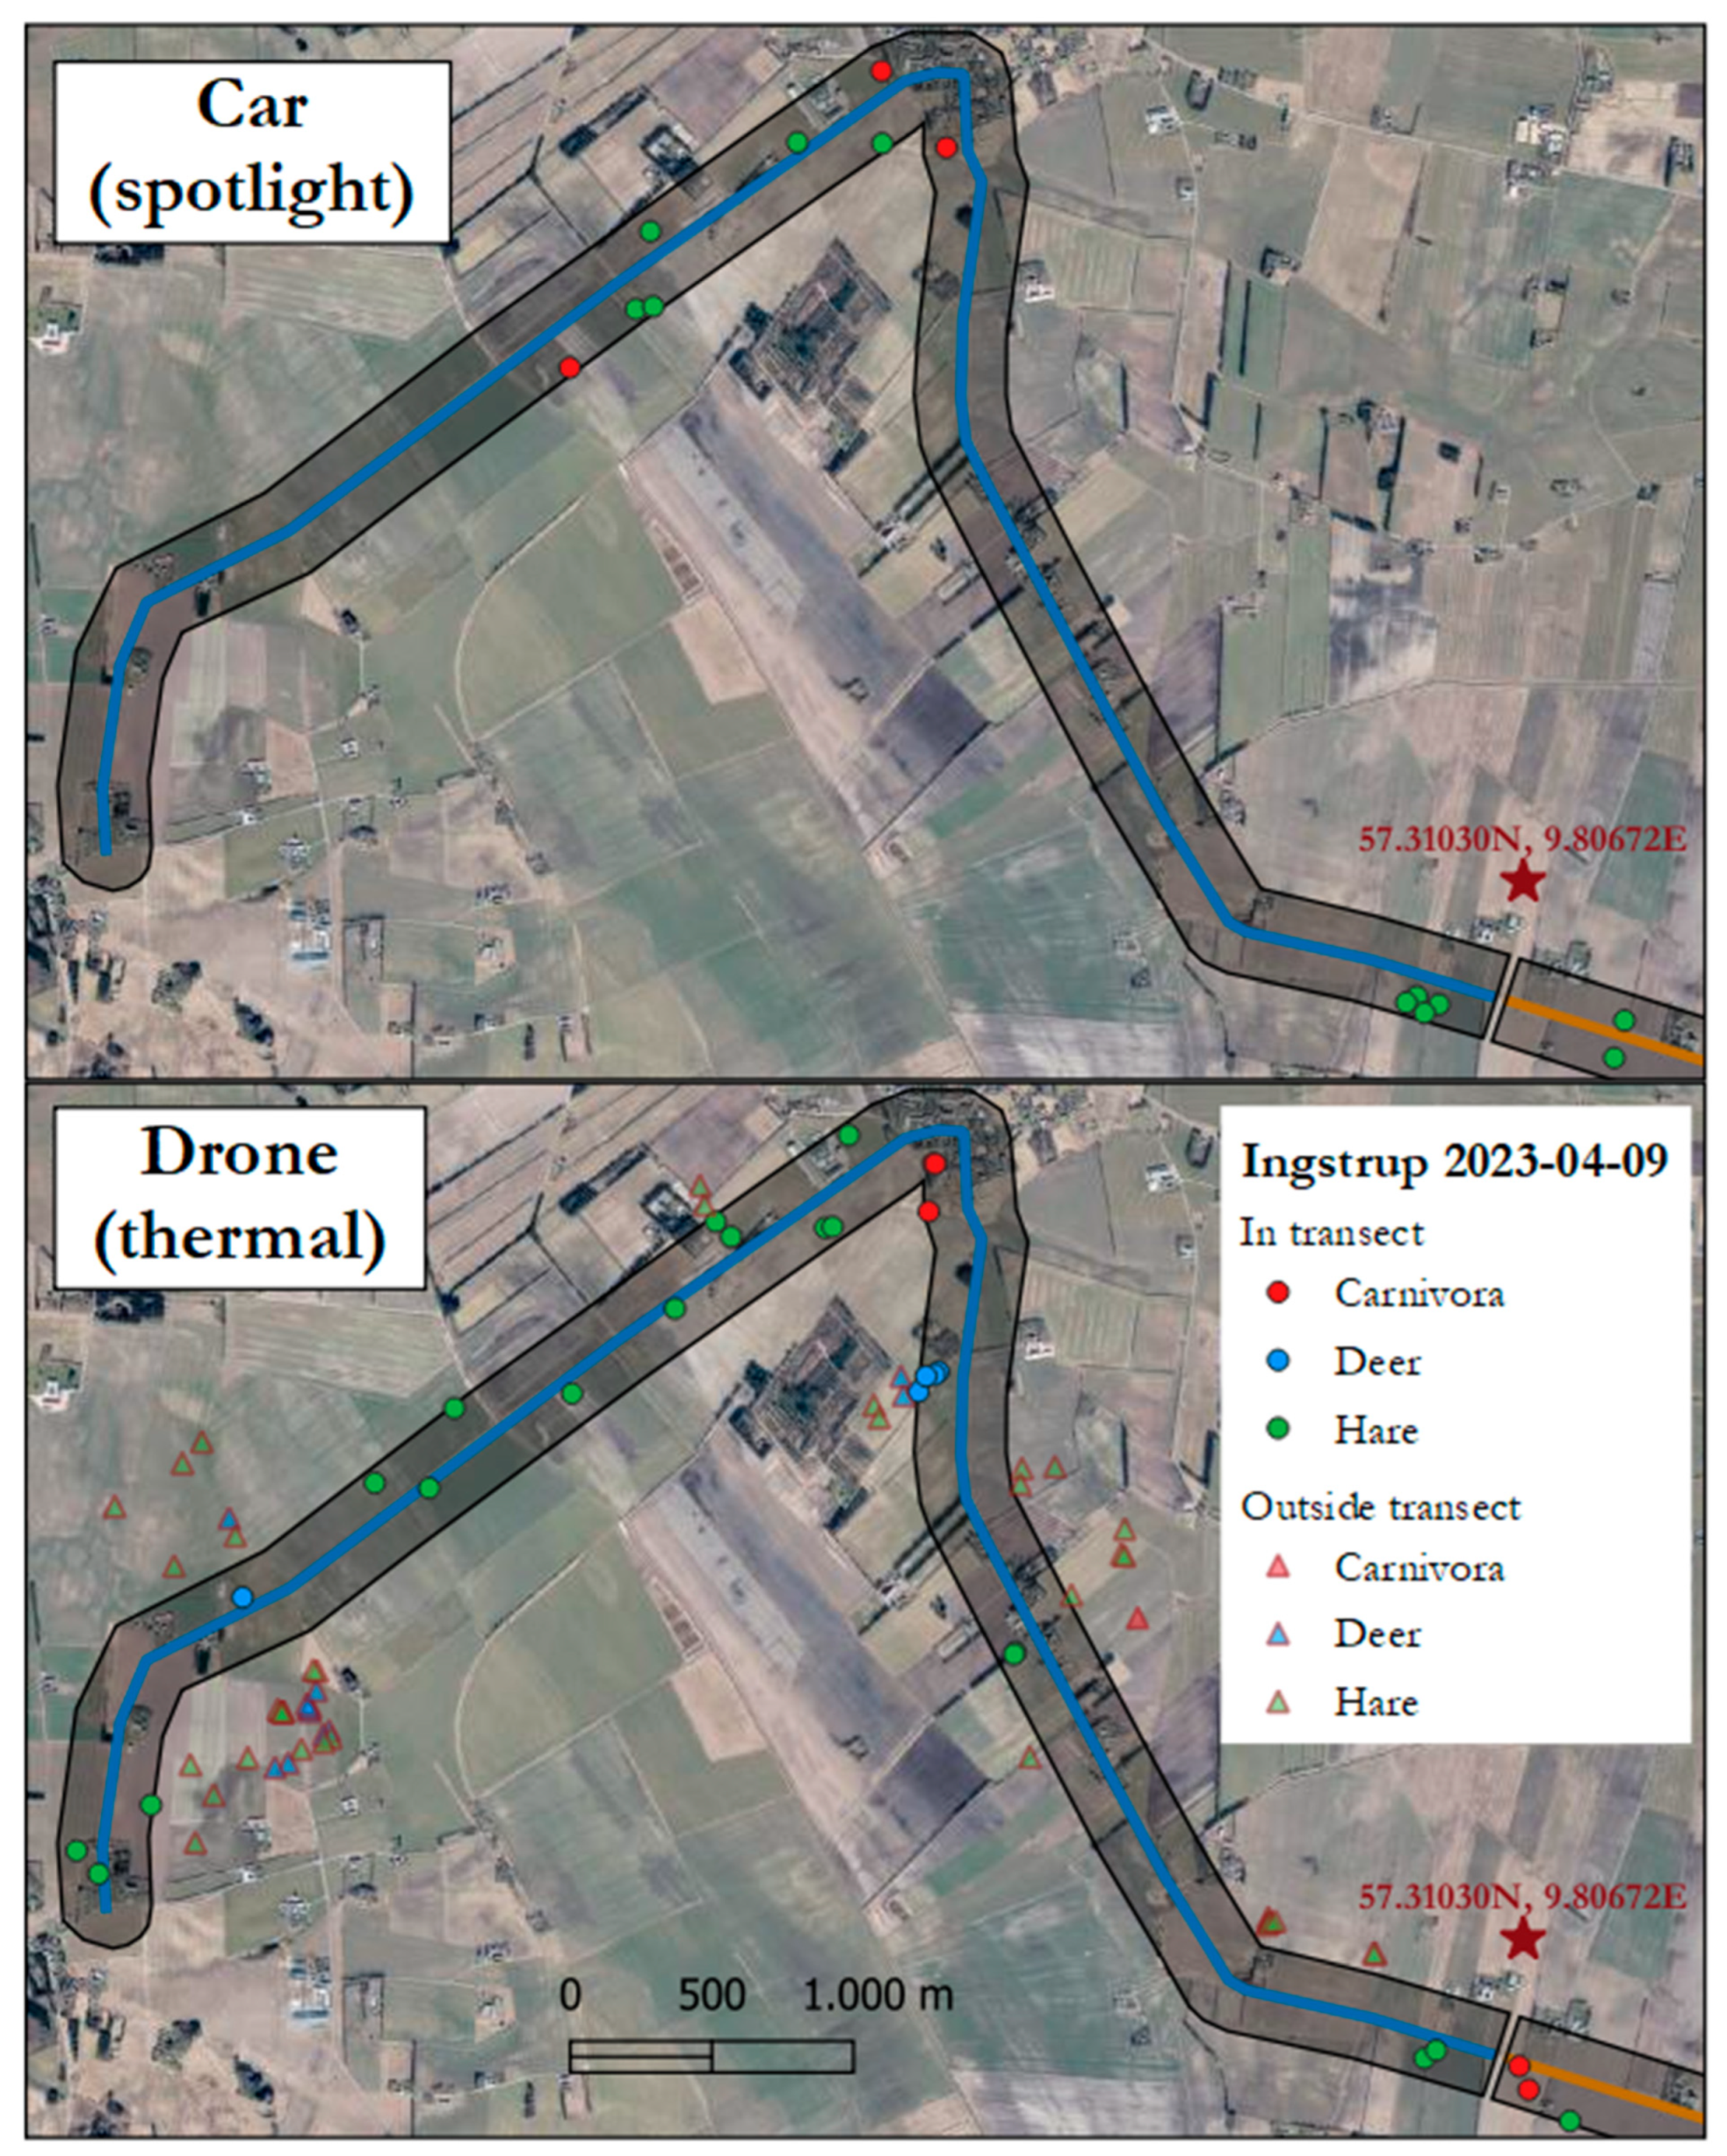
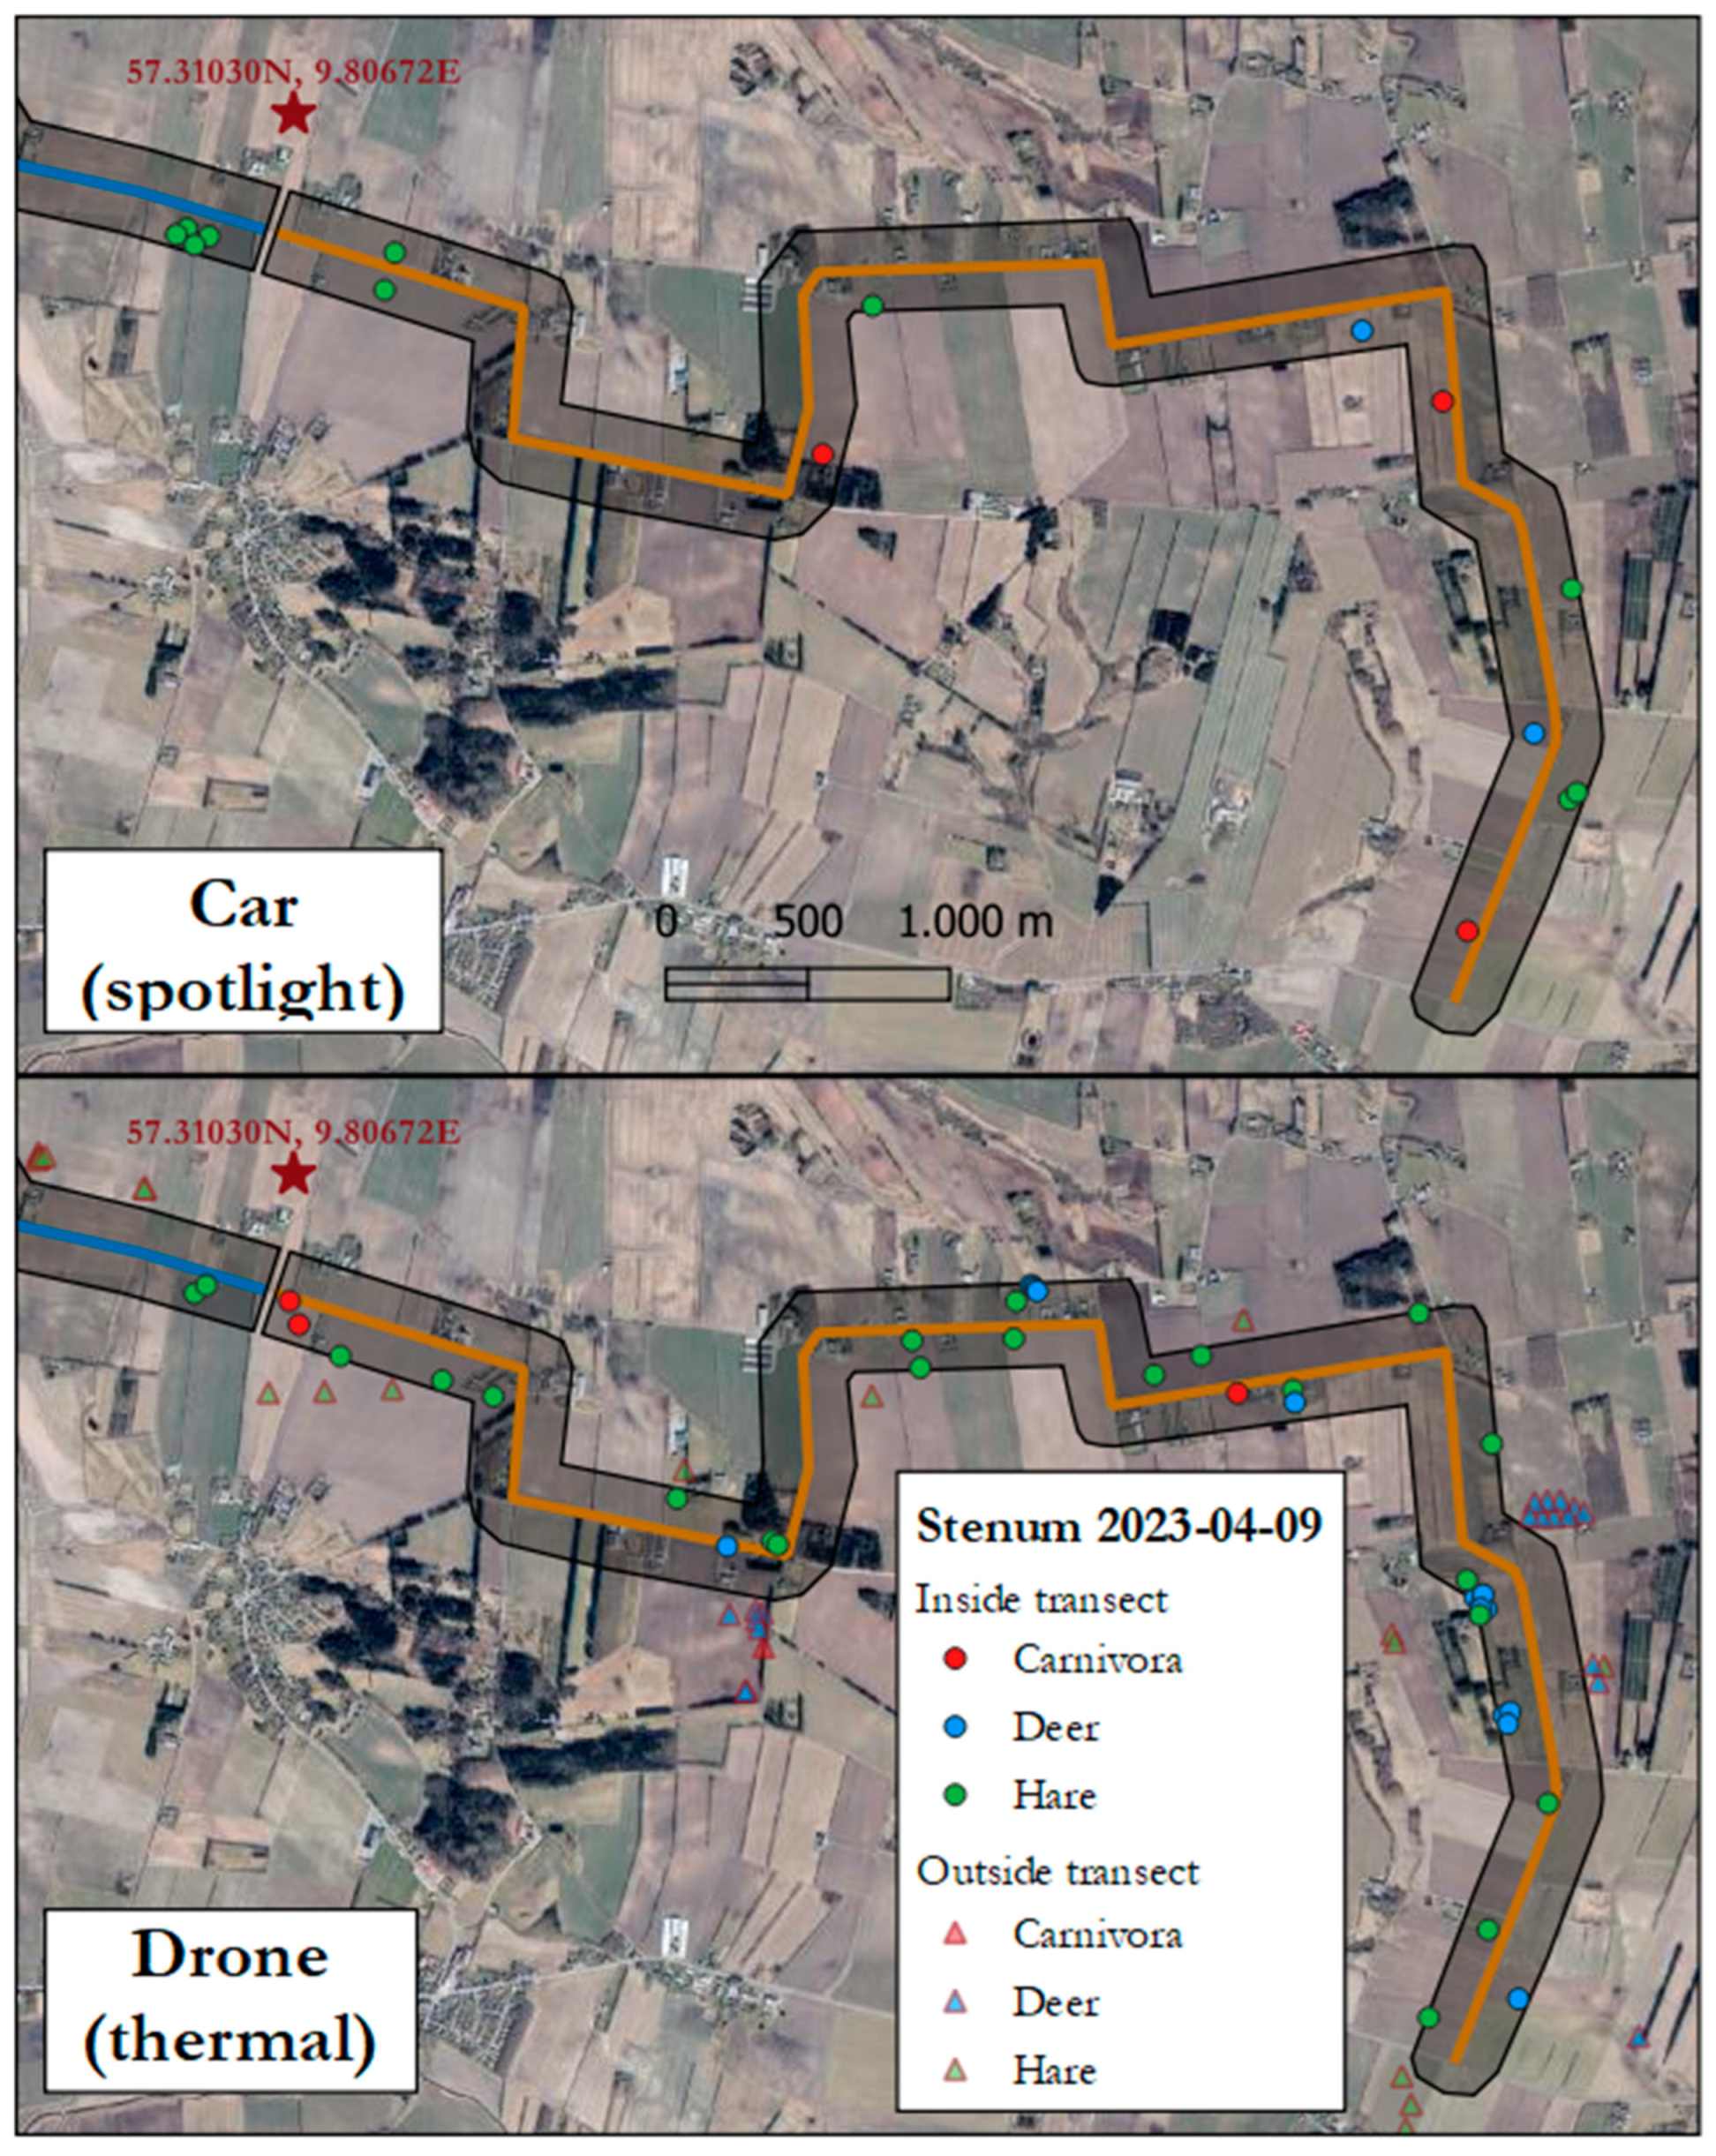
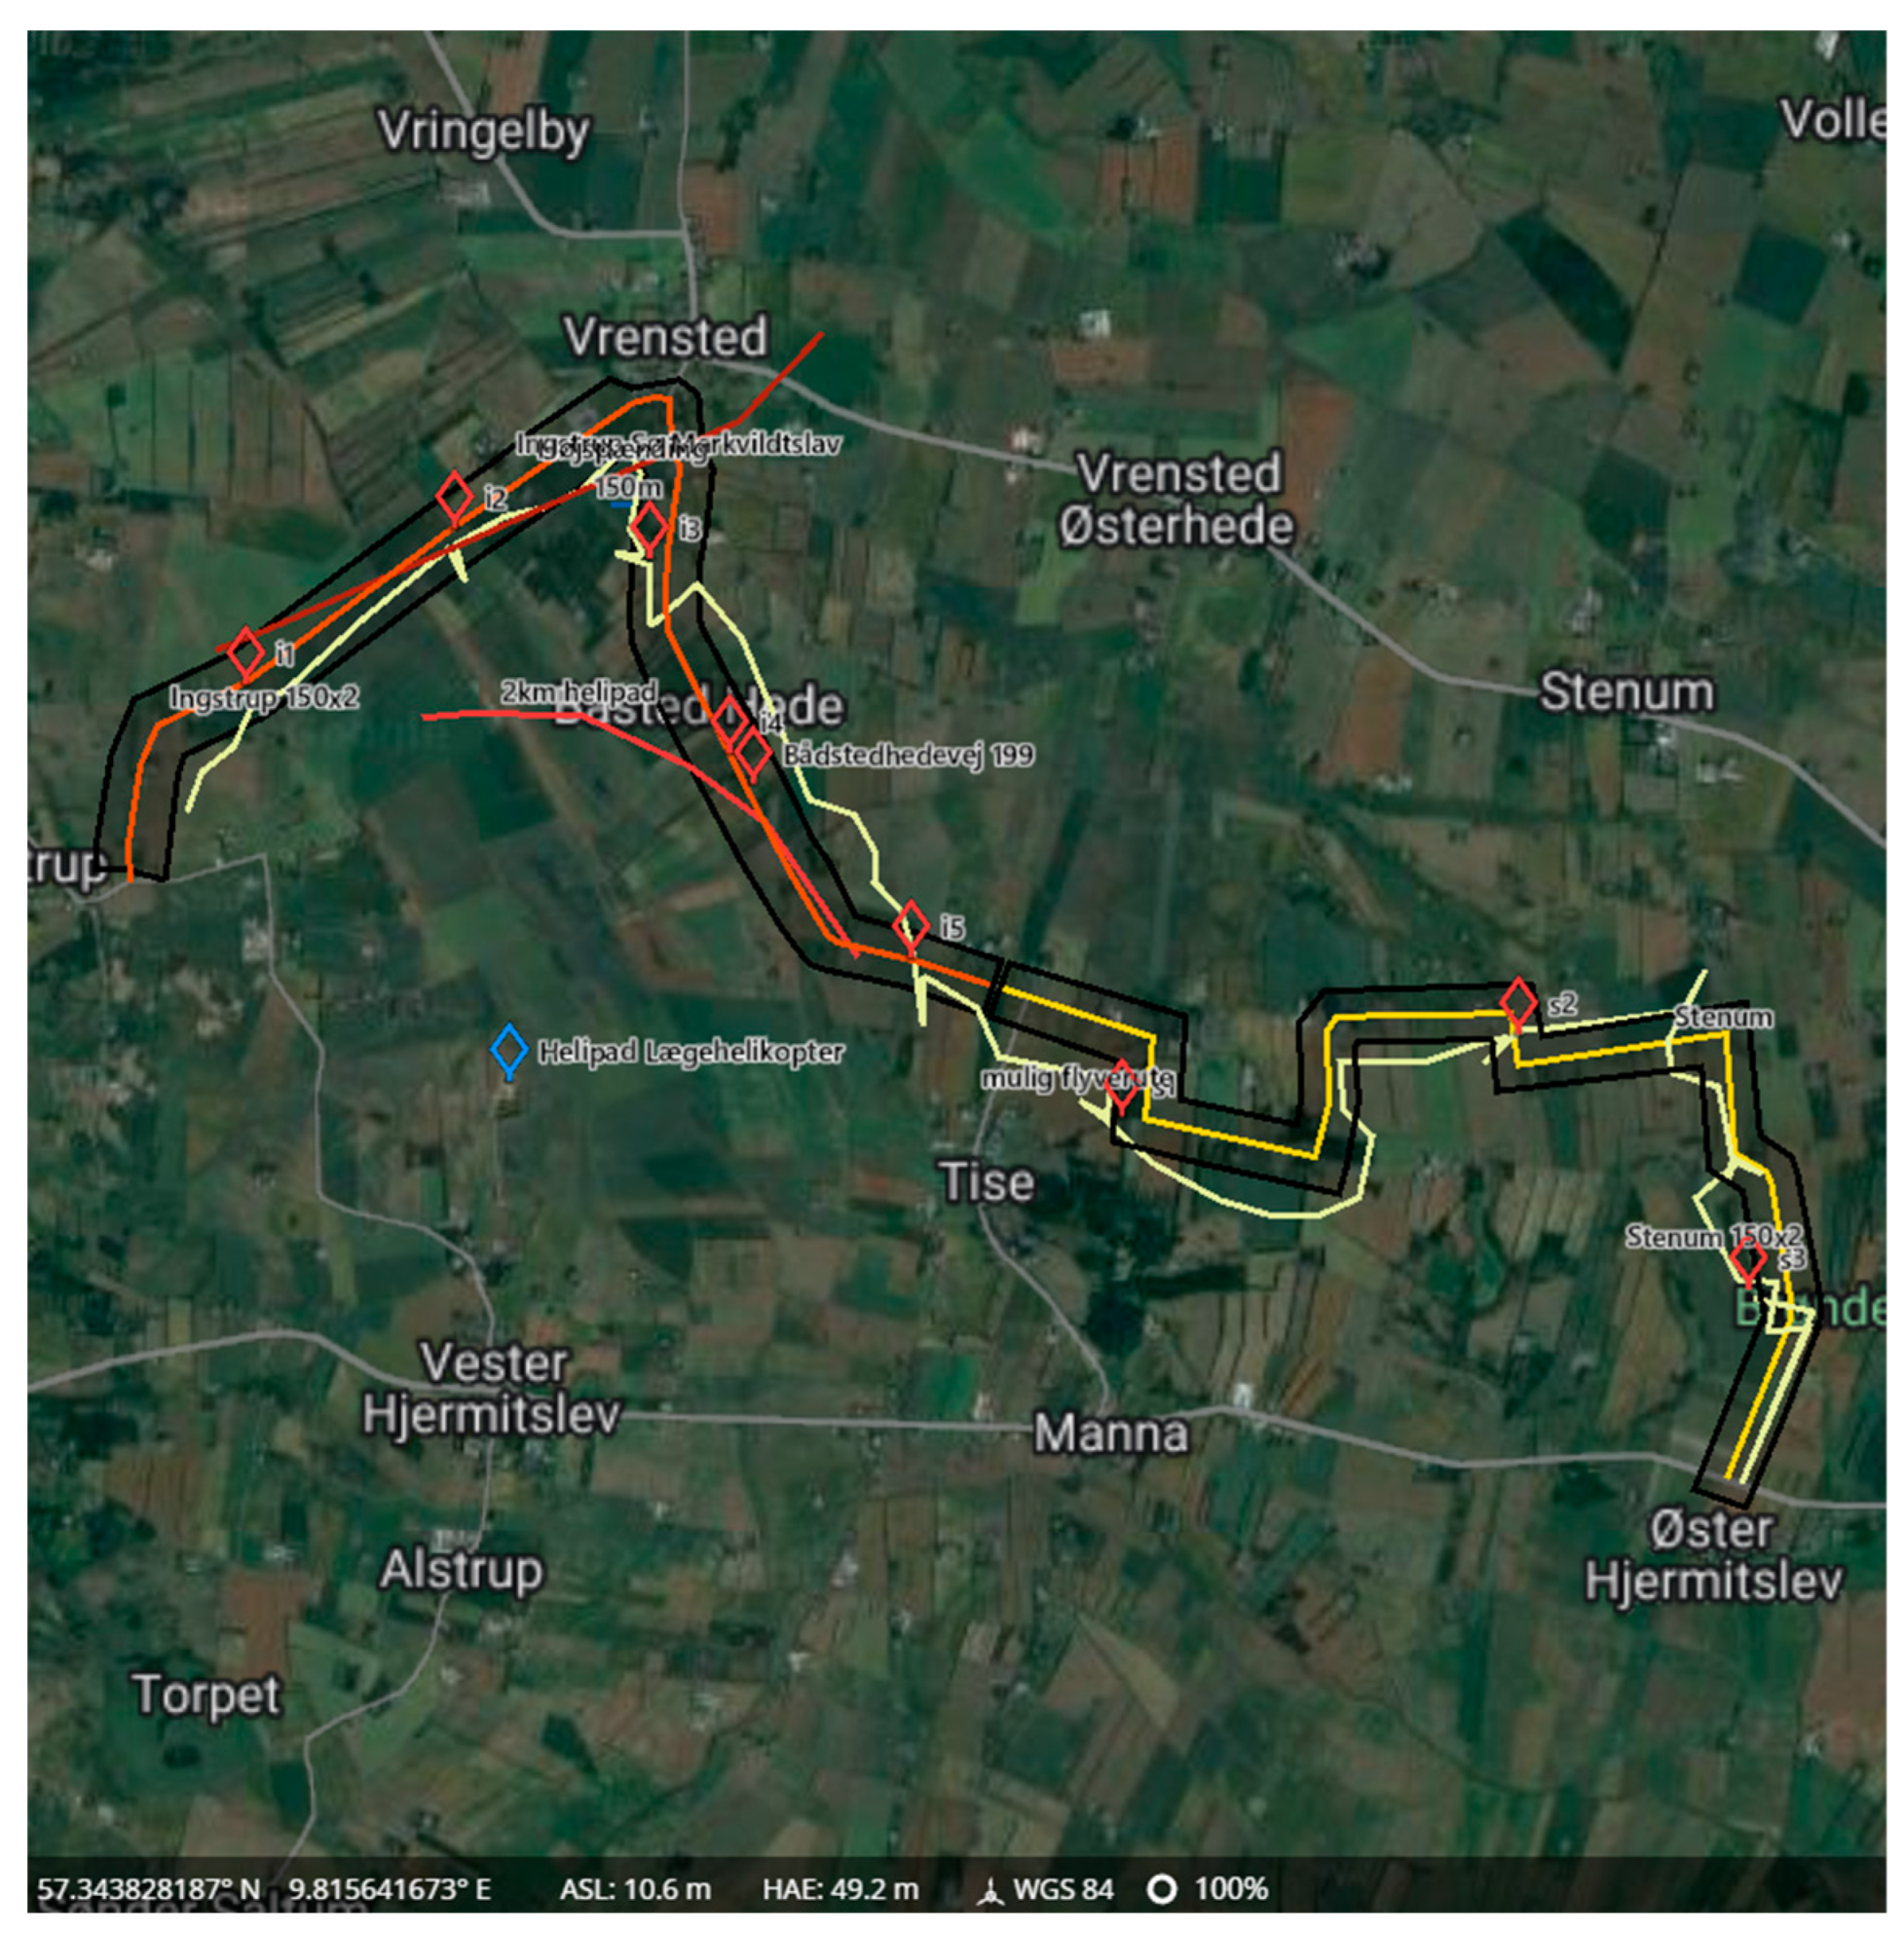
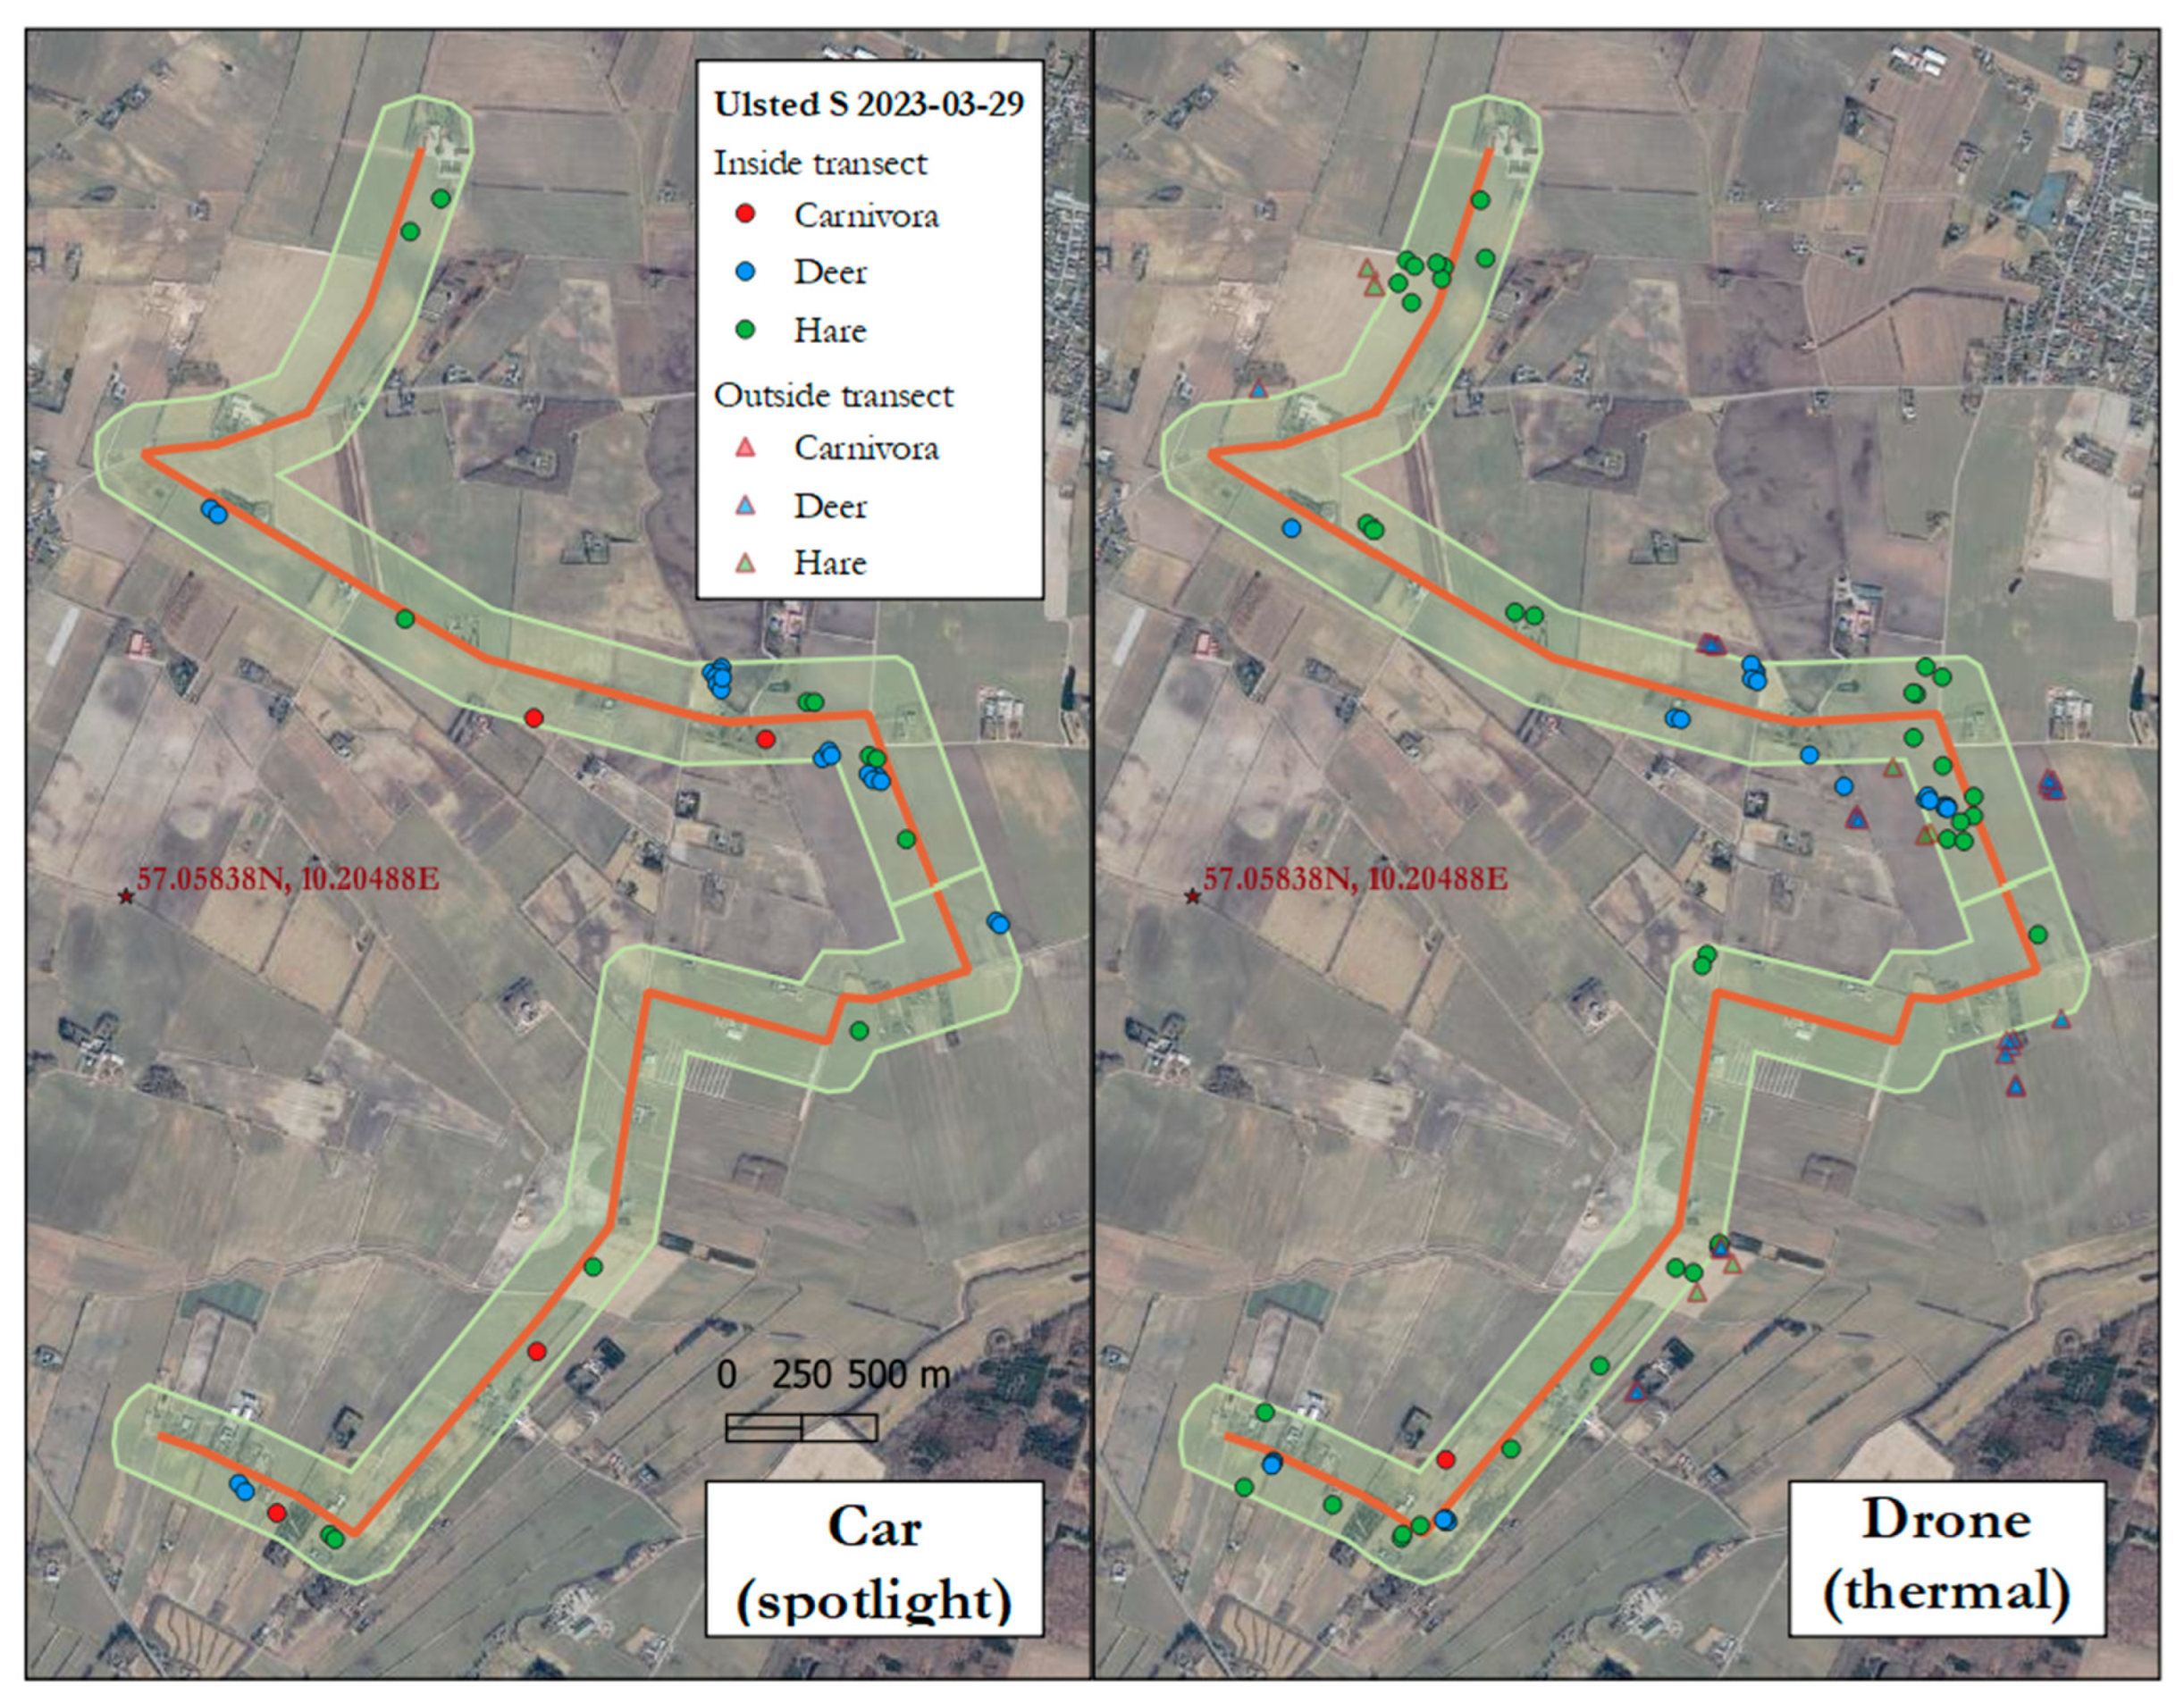
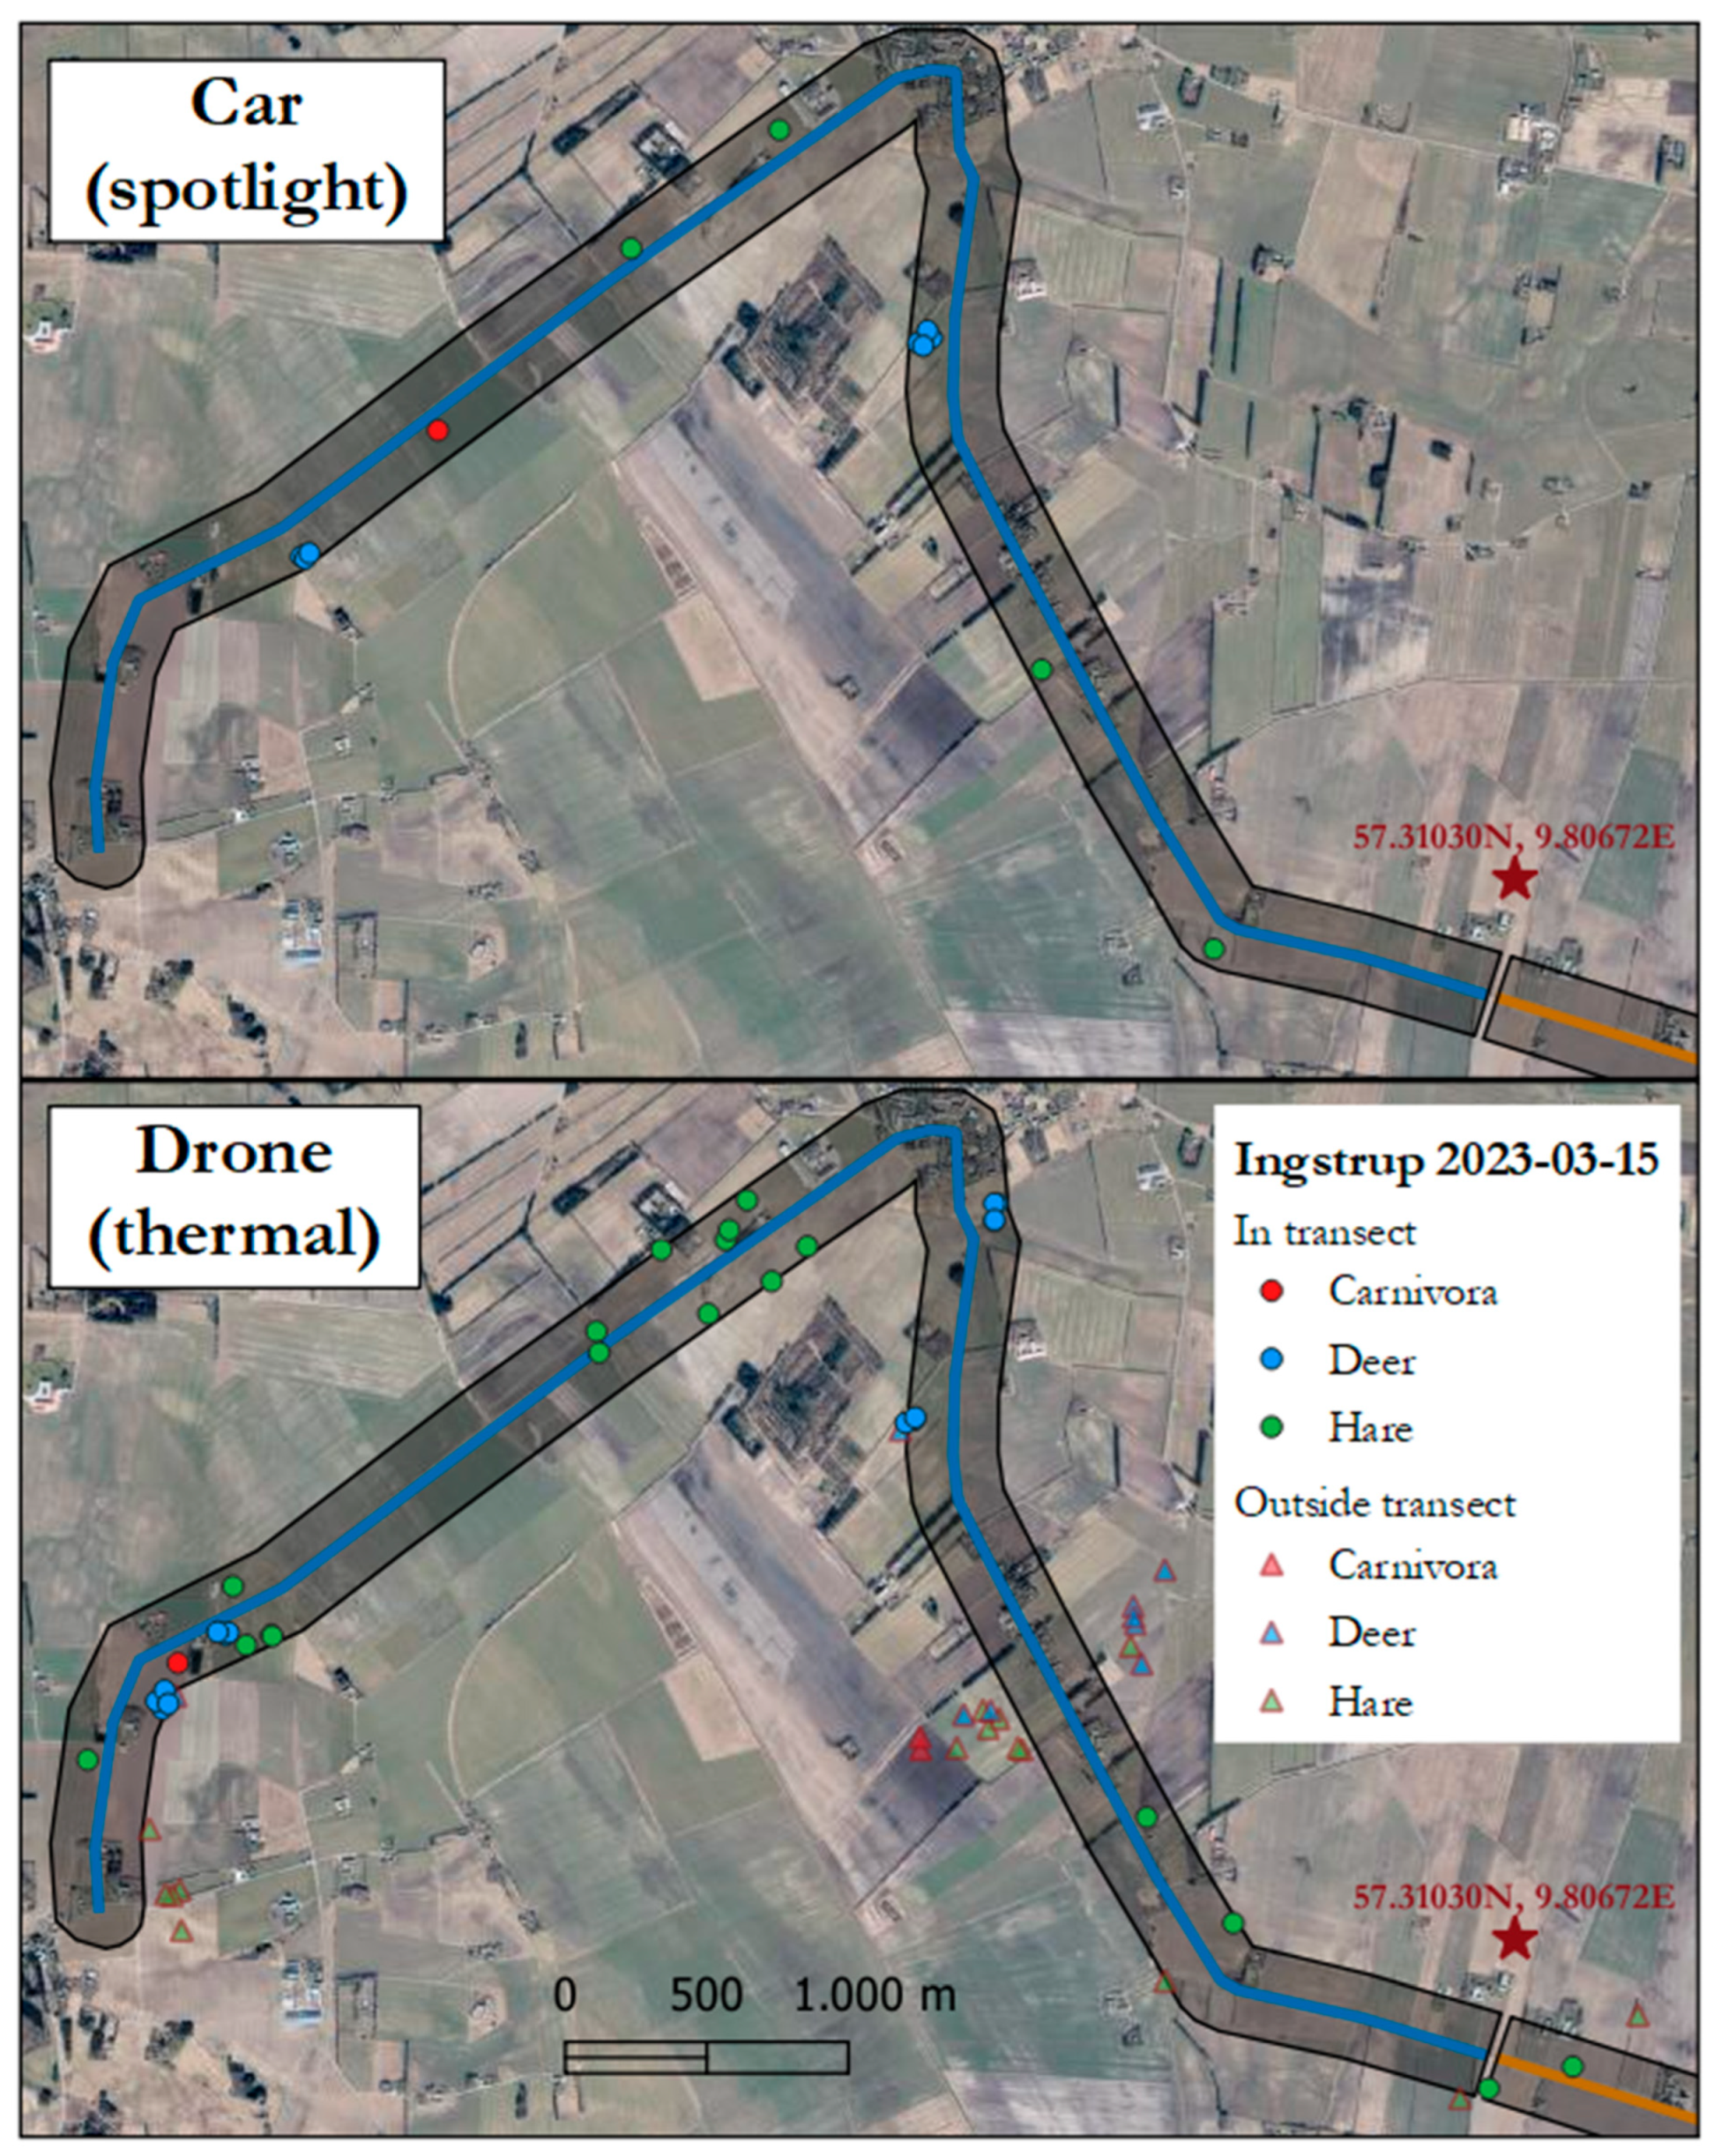
2.2. Scouring Transect Counts by Drone with Thermal Camera

Subsequently, with the spotlight counts, the transect area was scoured with the drone, a DJI Matrice 300RTK (M300) with a Zenmuse H20N payload (H20N) (SZ DJI Technology Co., Ltd., Shenzhen, China). The two thermal cameras in the H20N both had a resolution of 640 × 512 pixels and a field of view (FOV) of 45.5° and 12.5°, with 4× and 32× zoom, respectively. The chosen thermal color palette was white-hot consistently for all footage. The drone operator followed the car conducting the spotlight counts, in a separate car with a designated driver. This meant that the drone could be kept within visual line of sight (VLOS) at all times while moving along the transect line. The mean speed of transect coverage was 6 km/h, meaning it took roughly three hours to cover 18 km transect, which corresponded with the flight time provided by 4 × 2 batteries for the M300. In Ulsted, the distance to the spotlight counting car was between 300 and 50 m; in Ingstrup, it was between 50 m and three kilometers; and in Stenum, the drone survey started when the spotlight count had finished, since the survey was conducted in continuation of the count in Ingstrup.
The flight altitude of 120 m above ground level (AGL) was maintained throughout the survey, except for the three times when battery change was needed. This altitude could be kept due to the high-powered TIR zoom capabilities of the H20N. With the use of DJI FlightHub, integrated in the M300 flight system and developed for search and rescue (SAR) missions [41], the manual flight could be preplanned and drawn on the map shown on the controllers, as well as online in a browser. This made it possible to highlight restricted areas and obstacles like power lines and wind turbines (red line, Figure 2) and possible take-off and landing sites (red diamond, Figure 2) and to see the annotations live on the controller. Lines for the safest path when flying manually (light yellow line, Figure 2) were drawn in advance, as a guide to maintain proper distance to residential areas, where the minimum distance was 150 m with a C3-drone like DJI Matrice 300 (>4 kg total weight) [42].
The drone was manually flown in a souring zig-zag pattern covering the 300 m wide transect while the operator adjusted the camera angle to the terrain, vegetation cover, and other obstructions to maintaining situational awareness, e.g., keeping track of moving animals, what parts of the transect area that had already been covered, obstacles and hazards, and where to position the drone next. The camera was mostly kept at a 45° angle but continuously adjusted to sufficiently cover the survey area. When a point of interest was observed, e.g., an object emitting noticeably more radiance than the surroundings [39], the drone was stopped mid-flight, and the camera was zoomed in until species identification could be made. If it was not possible to make an identification, the drone was flown closer to the object. Using the remote controller and the laser range finder, each observation was registered with a pinpoint on the map. By analyzing the recorded video footage afterwards, species were assigned to the registered observations, as well as new observations that were missed when flying the drone. The KML data from DJI FlightHub were imported to QGIS Desktop 3.22.8, and base maps (from Dataforsyningen) were used to create the resulting maps.
To be able to compare the drone observations with the spotlight observations, distance sampling techniques, employing the increased probability of missed observations at further distances, were not applied [17,18]. Sightings were split up into observations of brown hare (Lepus europaeus), deer, and Carnivora, where Carnivora covers all carnivores the size of ferret and up, and deer covers members of the Cervidae family, (Table 2, Table 3 and Table 4). Deer observations were primarily roe deer (Capreolus capreolus), but since species recognition could not be exact in the dark and from a distance, red deer (Cervus elaphus) and fallow deer (Dama dama) may be included in the observations.

2.3. Statistical Analysis
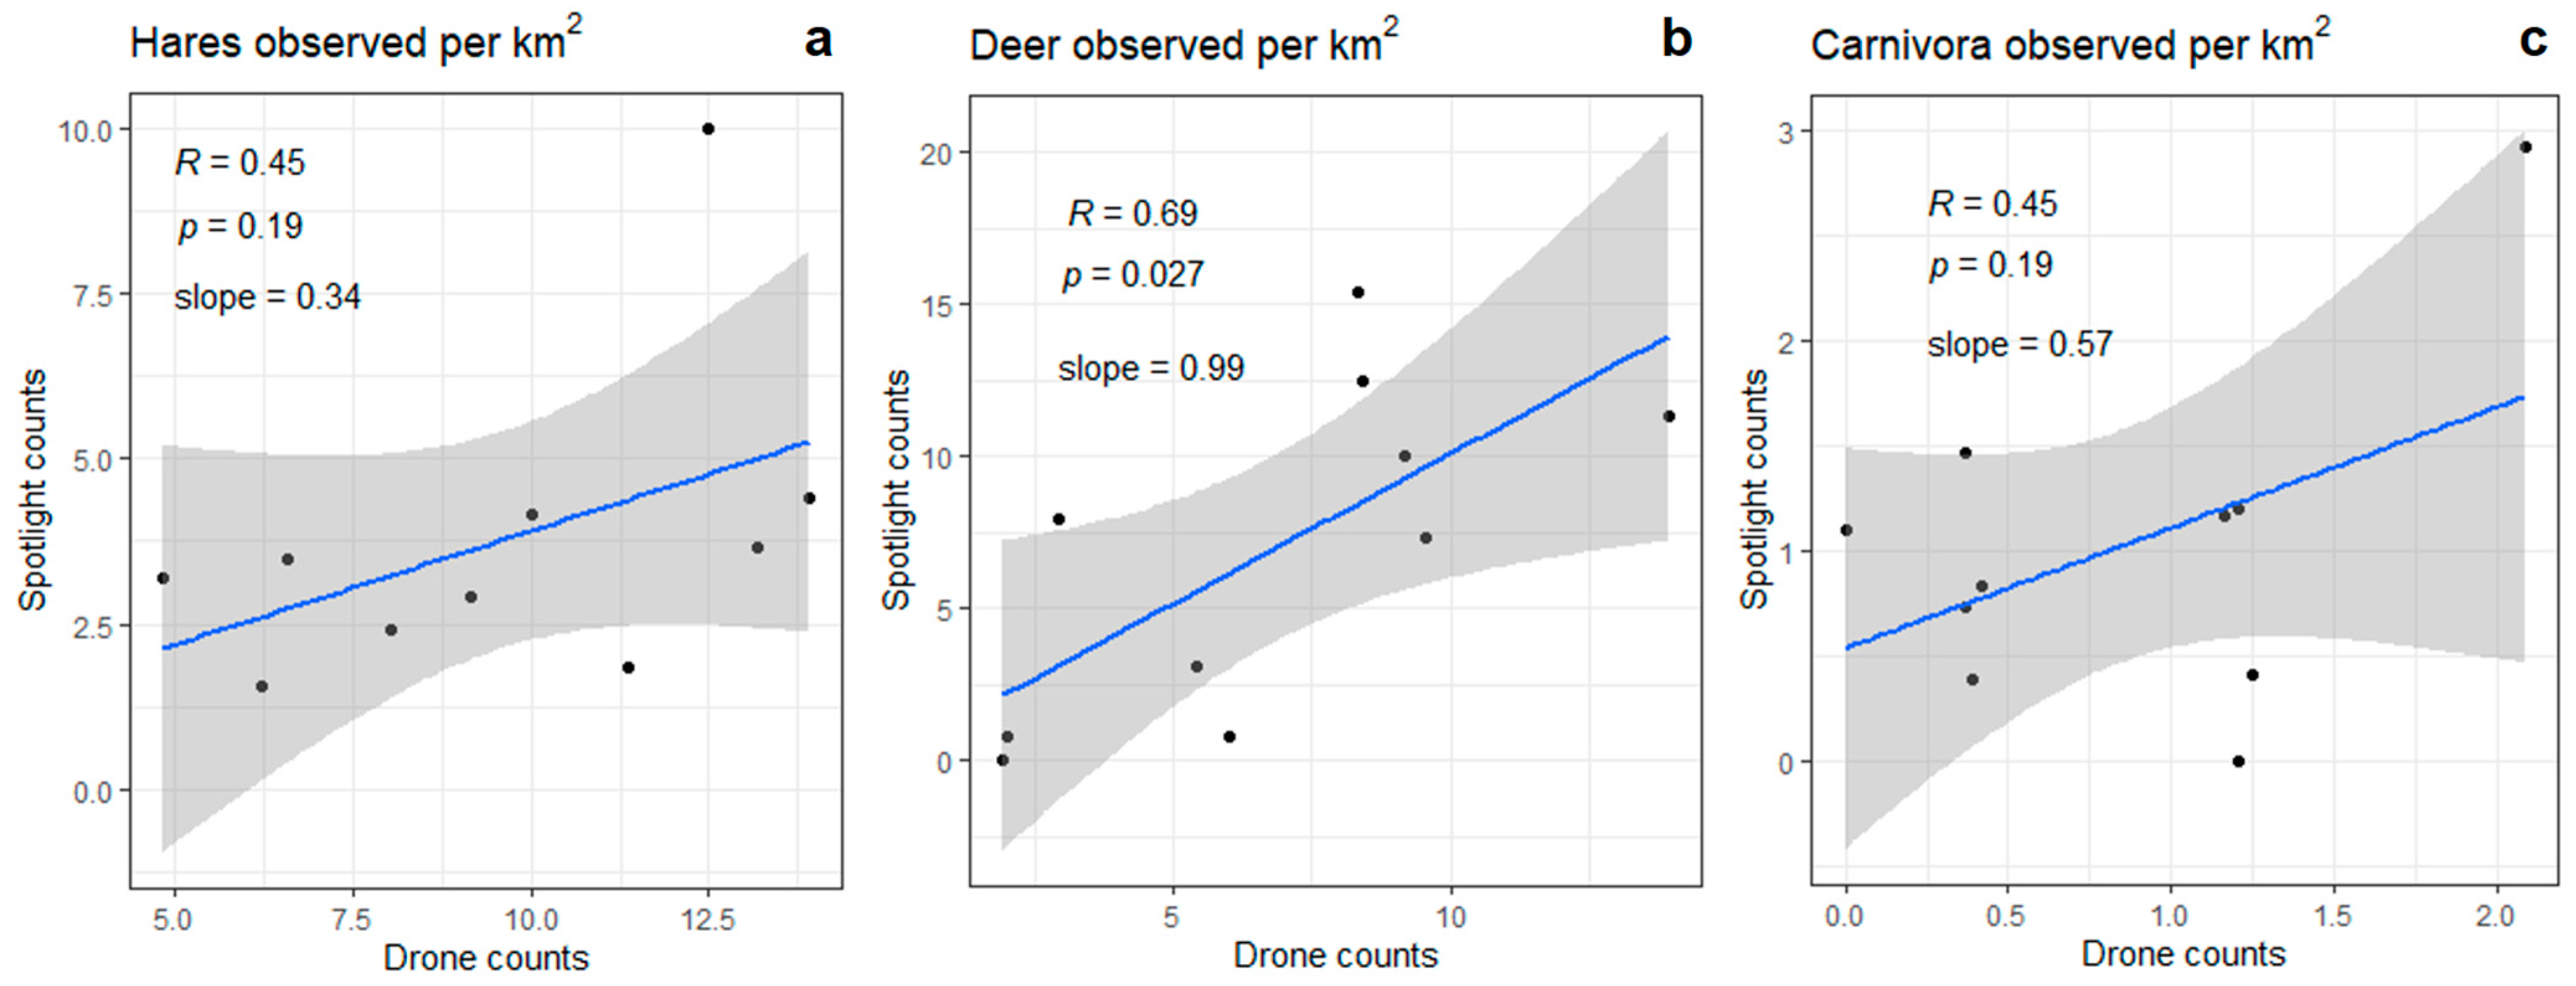
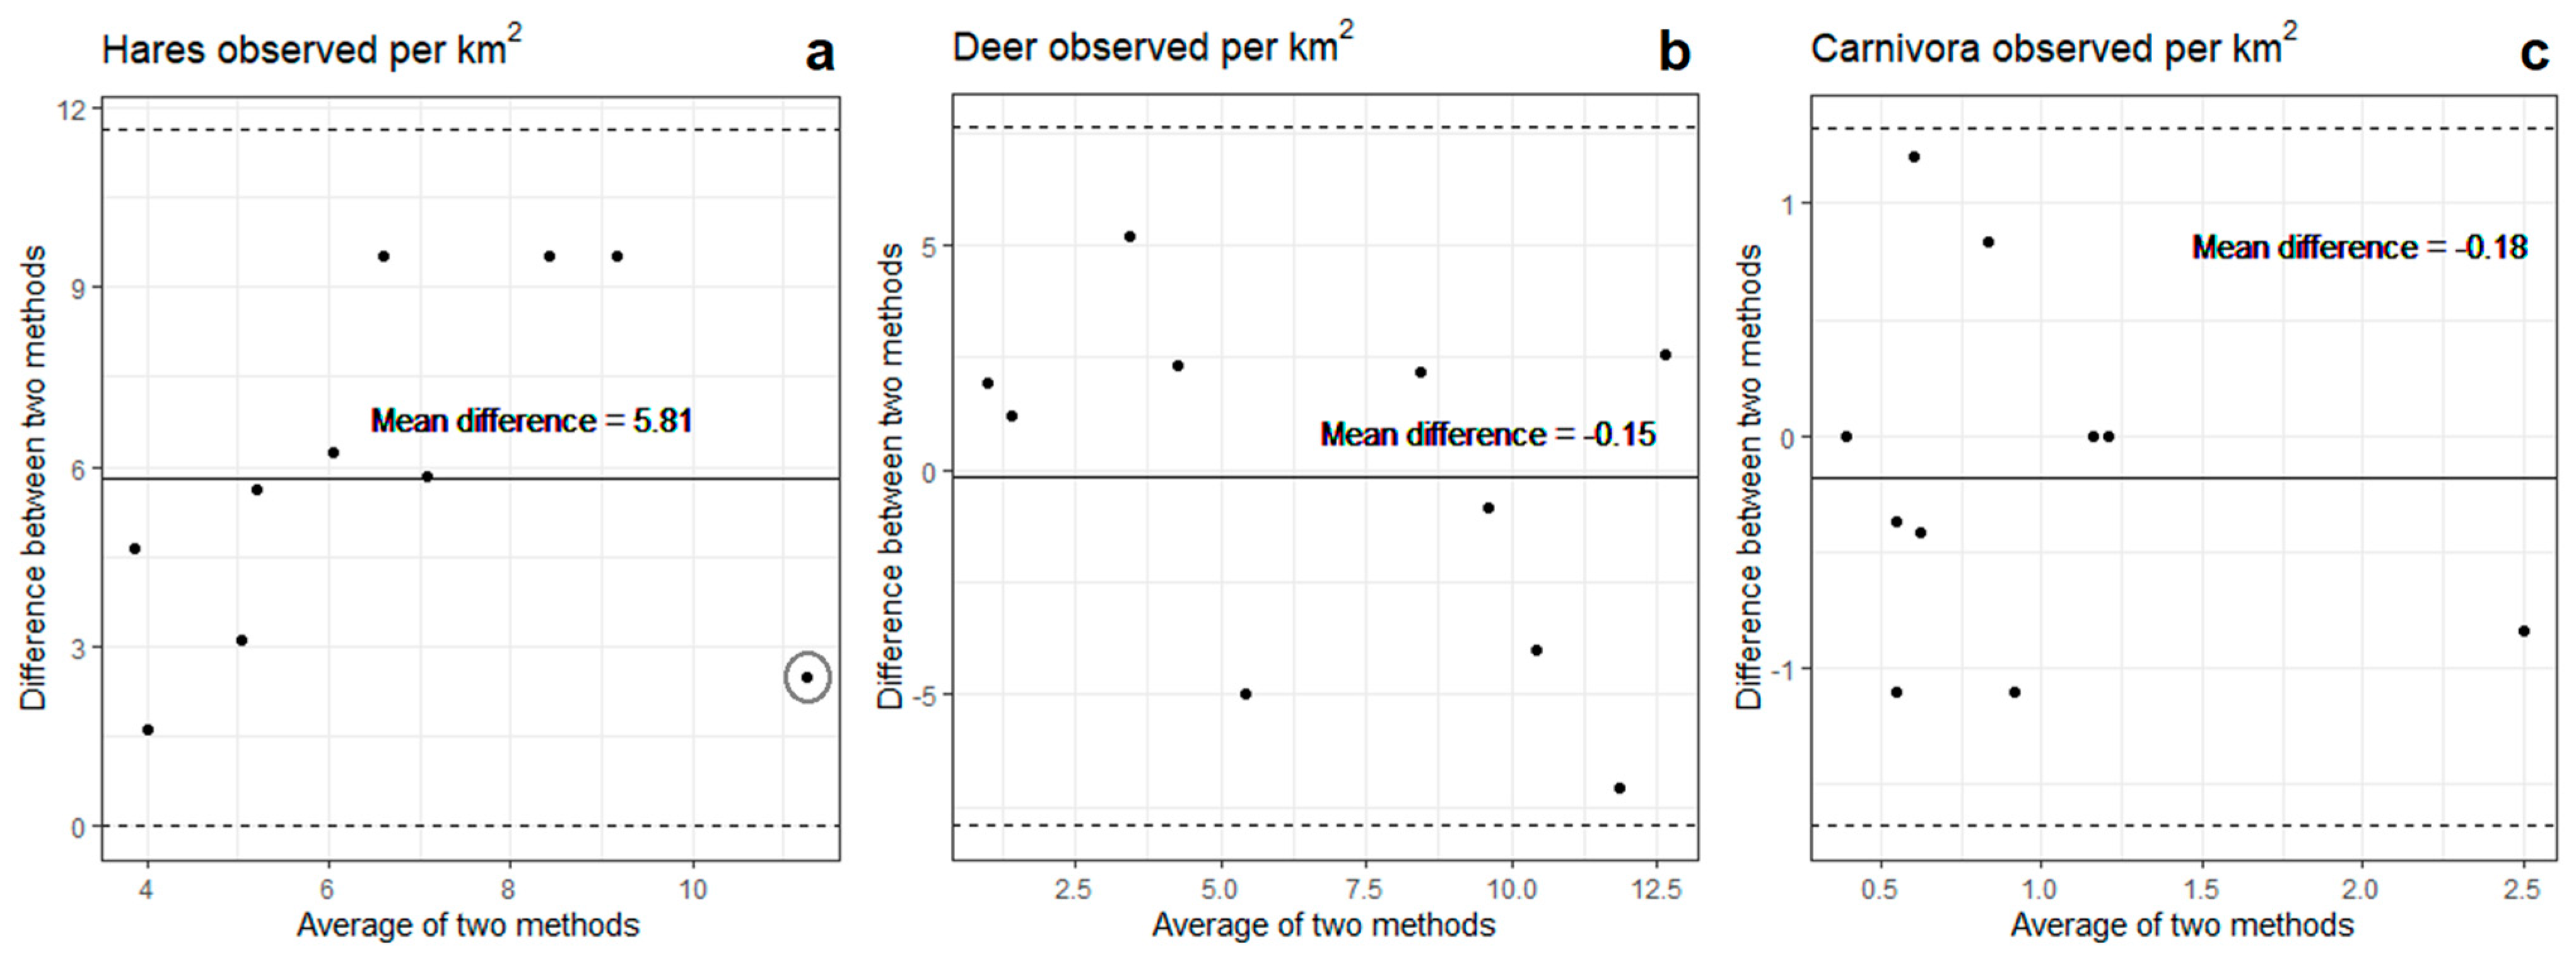
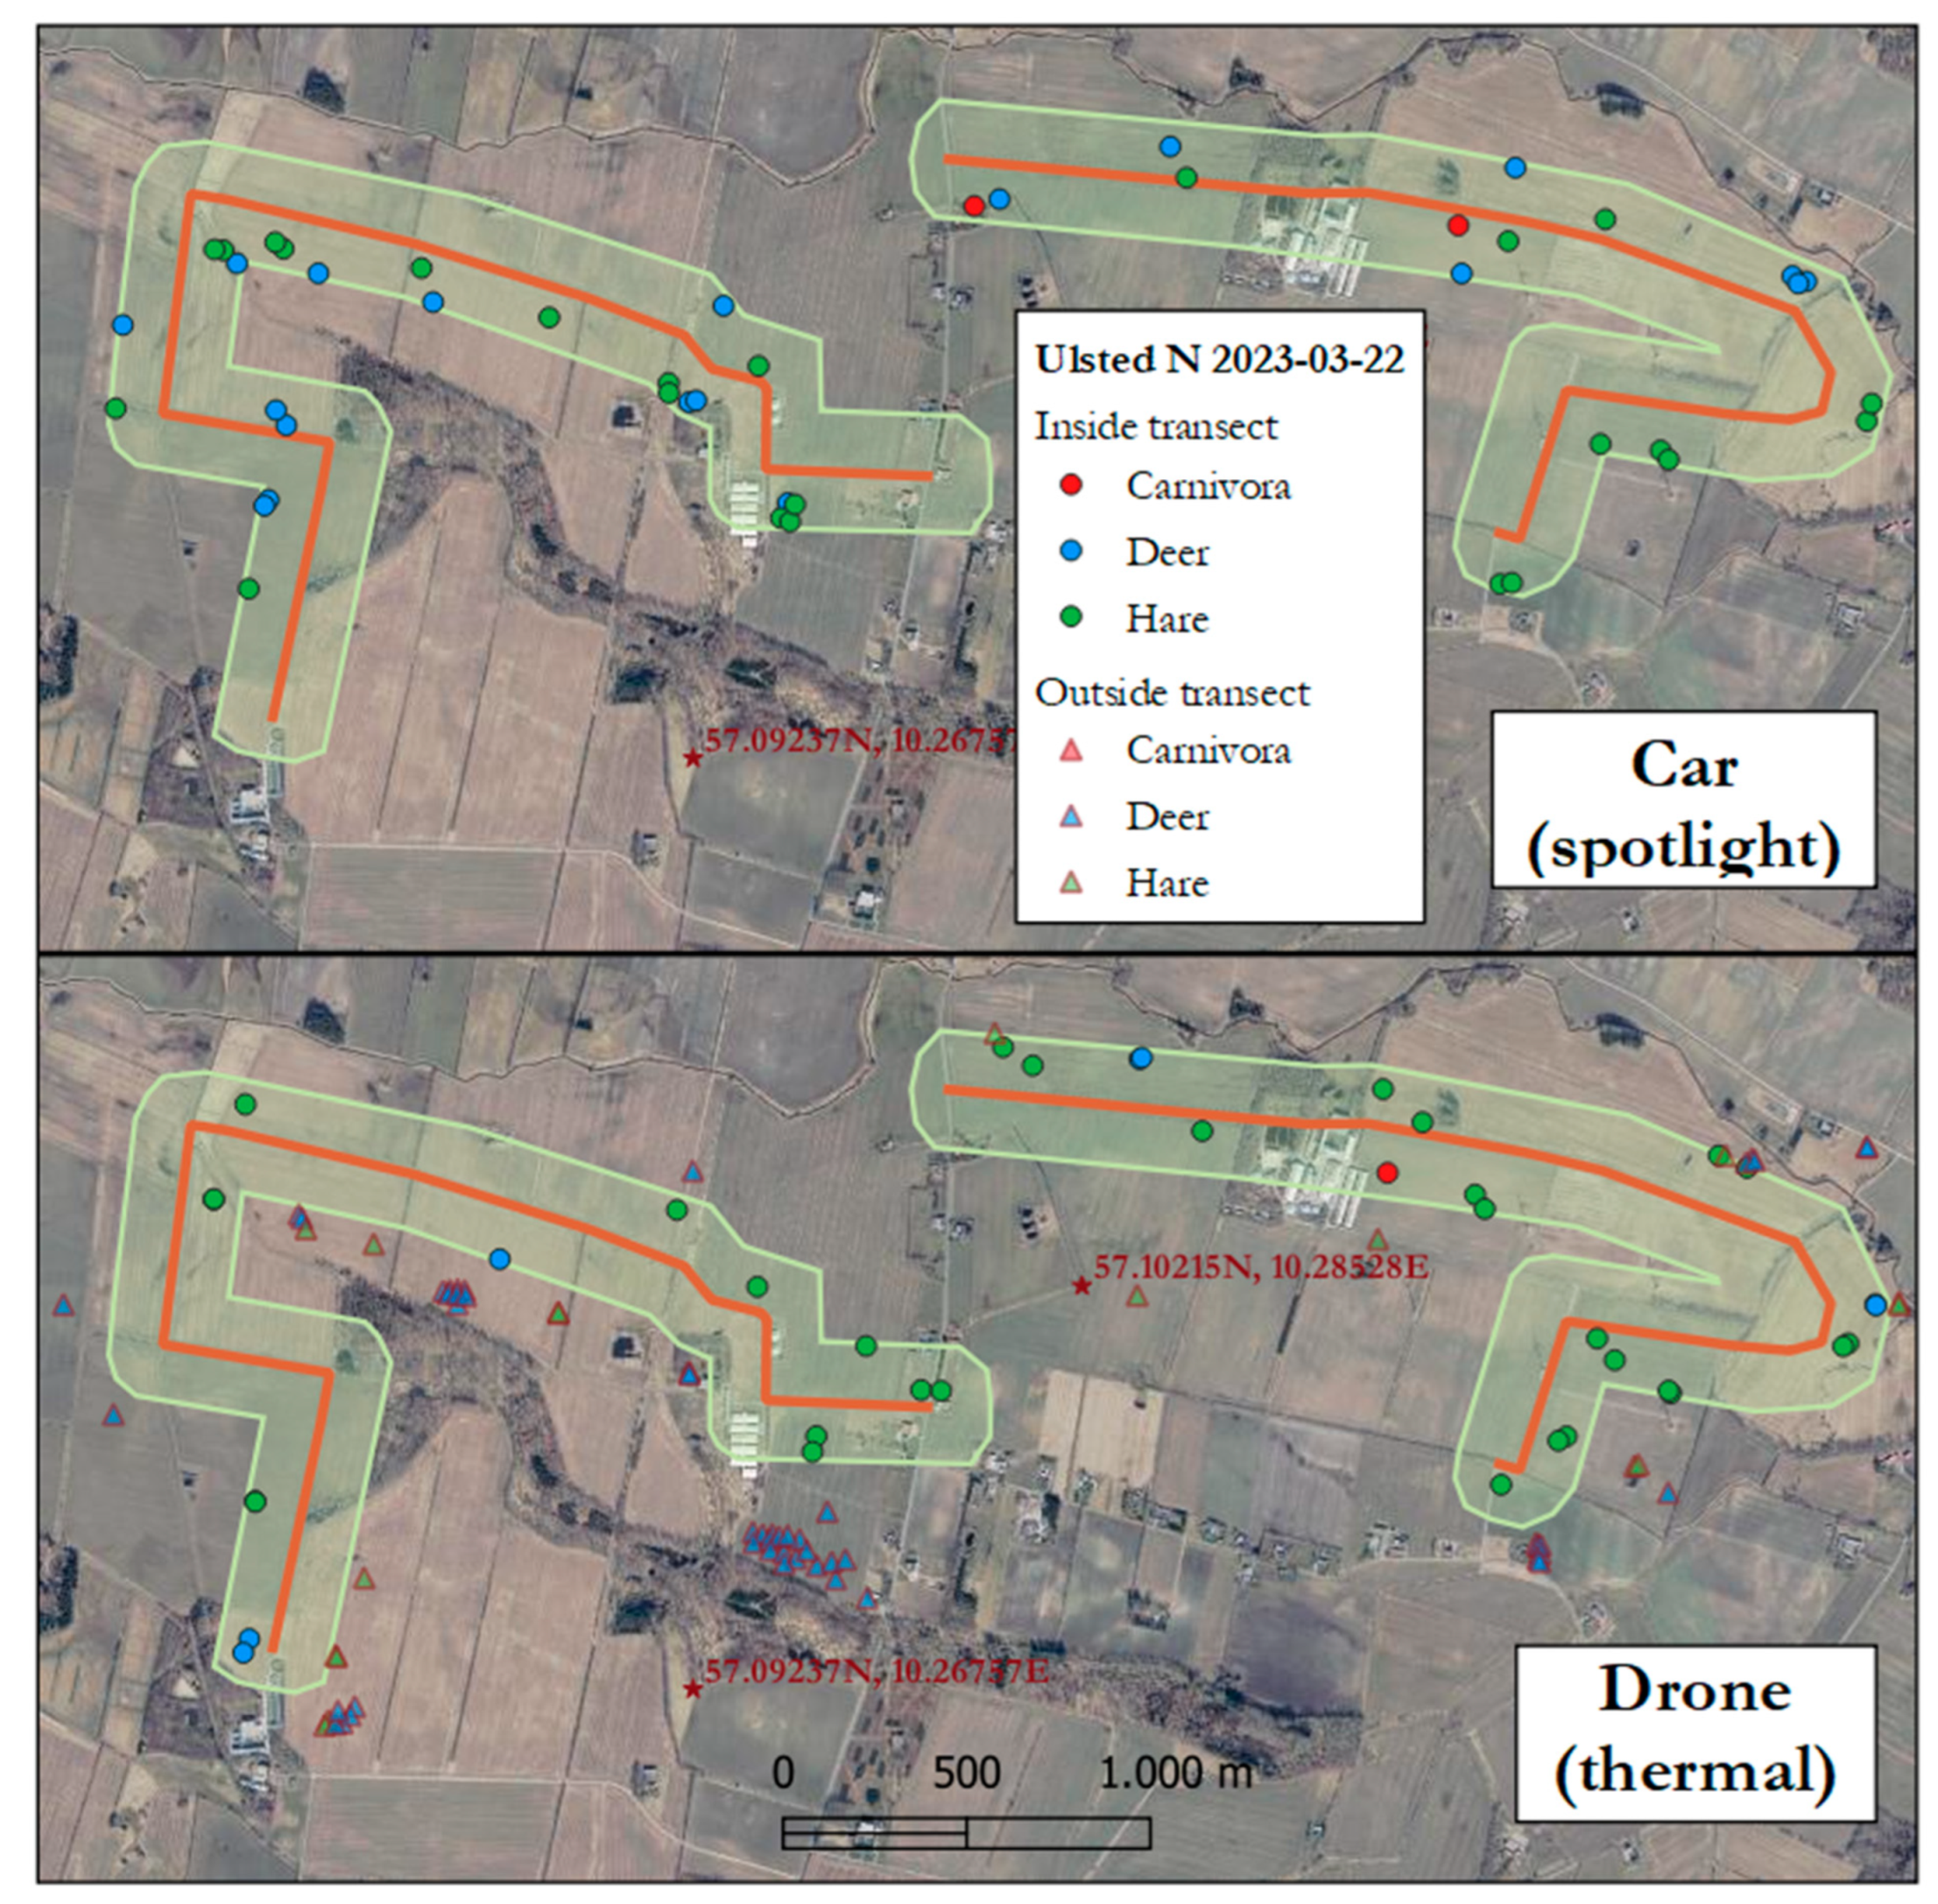
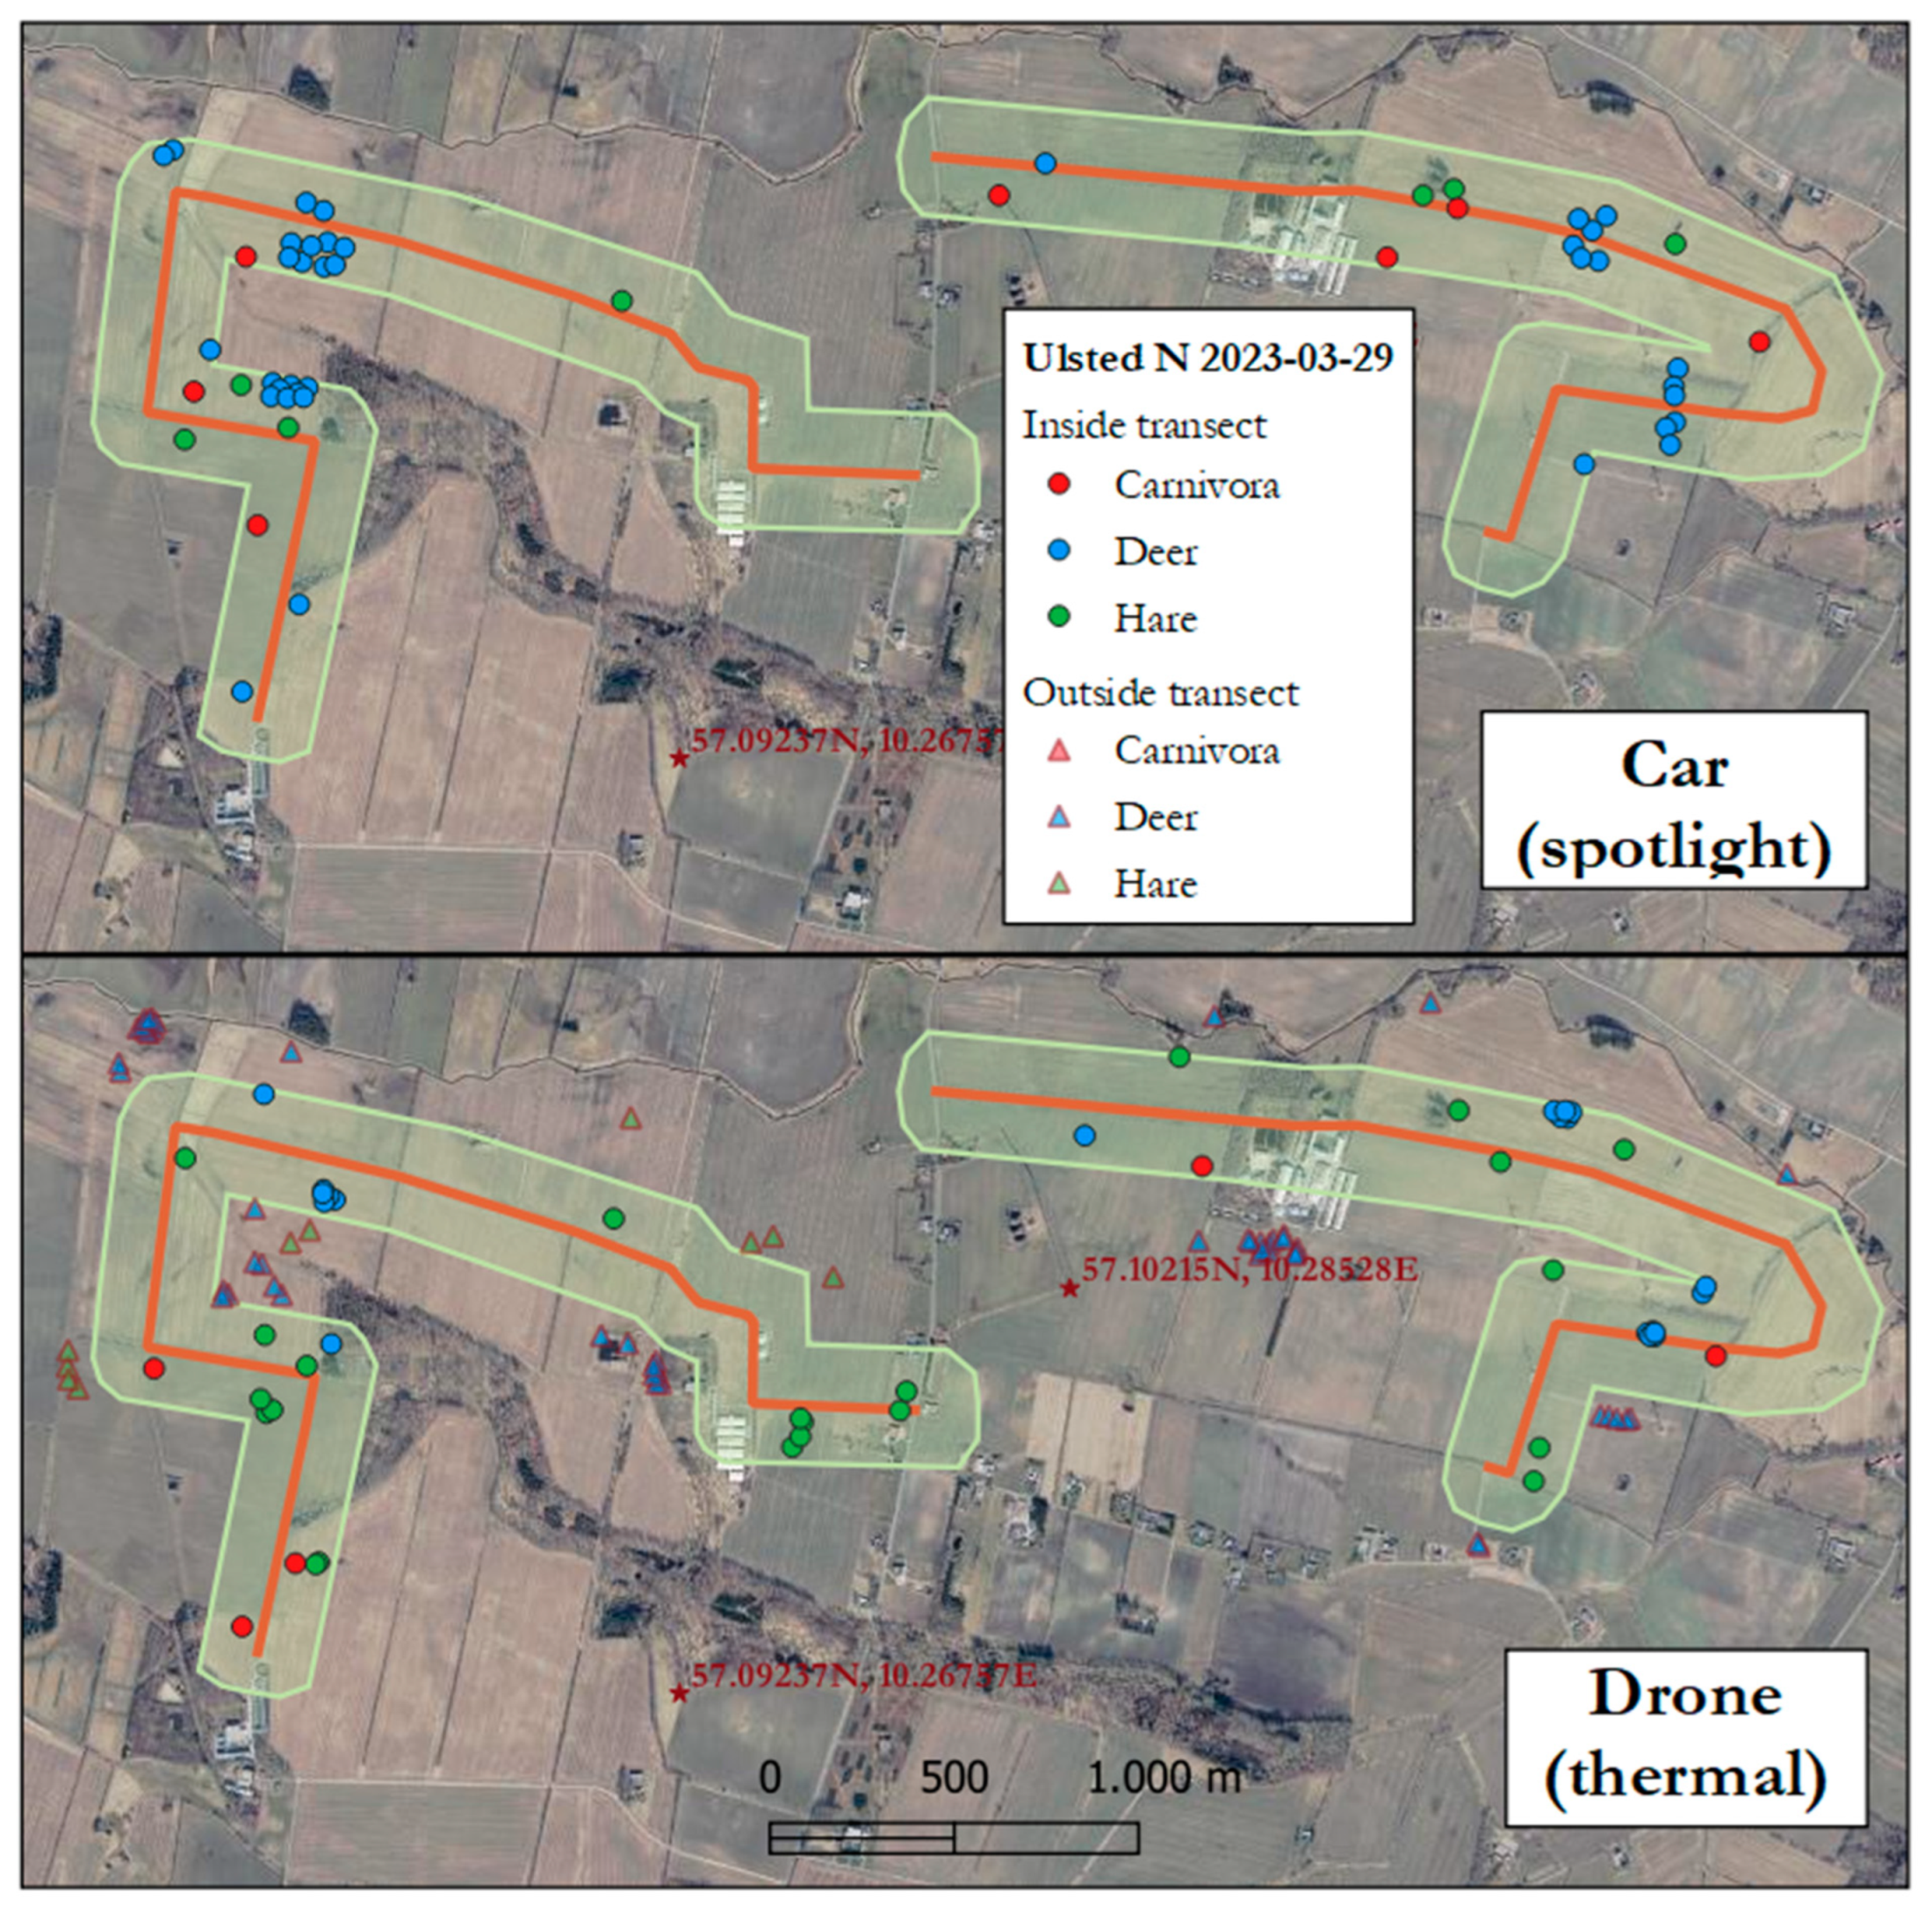
The density per km2 of hares, deer, and carnivores was calculated dividing the number of observations by the area covered. Using R (Version 4.2.1), Wilcoxon paired rank test was used to compare the density of hares, deer, and carnivores found with the thermal drone and the spotlight transect method. Pearson’s product–moment correlation was used to test if there was a simple linear relationship between the density of the animals using the two methods. Bland–Altman plots were used to analyze the difference between the two methods. A product–moment correlation was used to test if there was a linear relationship between the difference between the two methods and the mean density of the species in concern, i.e., if there was a density-dependent relation between the methods, to reveal density dependence.

3. Results

In ten surveys (Appendix A, Figure A1, Figure A2, Figure A3, Figure A4, Figure A5, Figure A6, Figure A7, Figure A8, Figure A9 and Figure A10, and Table 2, Table 3 and Table 4), hares were found in significant higher densities with the drone (mean 9.6 ± 3.1 SD) than with spotlight counts (mean 3.8 ± 2.3 SD) (p = 0.002). No linear relationship was found between the density of hares of the two methods (R = 0.45, p = 0.19) (Figure 3a).
There were no significant differences between the densities found by the drone and the spotlight counts of deer (p = 0.92) nor the carnivores (p = 0.53) (Table 3 and Table 4). A linear relation was found between the densities of deer recorded by the drone and the spotlight counts (R = 0.69, p = 0.027, Figure 3b), while no relation was found between the counts of carnivores by the drone and the spotlight counts (R = 0.45, p = 0.19) (Figure 3c).
The Bland–Altman plots likewise showed a higher detection of hares by drone than by spotlight counts (Figure 4). On average (solid line), the drone spotted 5.2 more hares per km2 than the spotlight counts (Figure 4a–c). However, as interpreted from the Bland–Altman plot for hares (Figure 4a), except from one outlier, the difference in this average will depend on the density of hares; the difference between the two methods increased with the increased density of hares (the average of the two methods). On average, no difference was found between the drone and spotlight counts for deer or carnivores; the plots were evenly distributed around zero with means of −0.15 and −0.18, respectively, (Figure 4b,c). For deer, the difference between the two methods was ±7 individuals per km2 (Figure 3b), and for carnivores −1.6 to 1.2 individuals per km2 (Figure 4c). No density-dependent difference was found between the two methods for deer or carnivores.

4. Discussion

The drone method measured up to the traditional spotlighting method and showed potential to surpass it in terms of time spent, accuracy, and applicability, when considering the additional area covered outside the transect area, as well as the likelihood that near all animals in open areas were observed by the drone inside the transect area. The time spent subsequently plotting the observations and analyzing footage was not directly compared between the two methods, but the spotlighting data were less time consuming to process. However, with more experience with the drone method and the implementation of machine learning techniques, the difference could become negligible. The difference between the drone method and the spotlight transect counts varied between the species. The drone spotted more hares per km2 than spotlight counts (Table 2, Table 3 and Table 4), but the difference between the methods depended on the density of hares in the area (Figure 4a). This means that when comparing historical data or data from other areas with hare counts, the density of hares in the area needs to be taken into account. However, a conversion factor between the thermal drone counts of hares and spotlight counts needs further investigation, and the range of the sightings suggests that the amount of data is insufficient to present a normal distribution of animal densities, and more surveys are needed to infer reliable population size estimations. It was expected that more sightings would be made with the drone, since it was assumed that near all subject animals would be spotted in the open by the thermal camera, whereas it was assumed that more animals would be missed by the spotlight counts the further away from the transect line they would be, and, therefore, distance sampling calculations could later be applied to account for this [17,18]. For deer and carnivores, no average difference was found between the drone and spotlight count methods; however, there was especially a relatively large range and no density-dependent range between the animals spotted by the two methods (Figure 4). Deer may move around in small herds, and, therefore, a herd moving outside the survey transect may result in a difference between the methods in the number of individuals. The positive slopes of the linear regressions (Figure 3) for hare and carnivores were below 1, which suggests that the drone method in general has more observations than the spotlight method for these two groups. However, the p-values are relatively high for these two groups. For deer, the slope is close to 1, which suggest little to no difference. The direct linear relation between drone and spotlight counts of deer may be due to the larger size of deer and, therefore, relative ease of spotting them from the ground. Spotlight counts may disturb especially deer and carnivores, pushing them out of the transect areas, and thereby affect the drone counts. This could be supported by the distribution of the animals (Appendix A, Figure A1, Figure A2, Figure A3, Figure A4, Figure A5, Figure A6, Figure A7, Figure A8, Figure A9 and Figure A10), where especially deer and carnivores seemingly moved to the outside of the transect before the drone count. There was not a clear trend observed as to when the animals would react to the human disturbance or not. Sometimes, they would remain still when caught in the spotlight and continue foraging immediately after, and sometimes they would scatter and move out of the transect quickly. Deer and the carnivores tended to be more vigilant and run further away, when disturbed by the spotlight or the sound of the drone. Road bias, the possible effects that busy roads can have on wildlife behavior and presence [43], and variations in how accustomed to human activities the animals were in specific areas could be an explanation of this, as well as the weather conditions or simply random migration, but further studies are needed to uncover the effects of drone count and spotlight count disturbance [25,44]. Since this study was based on the premise of the Hunters Association’s planned surveys, it was a priority not to risk disturbing their surveys. Therefore, the drone surveys had to be conducted after the spotlight surveys. Ideally, the drone survey would have been conducted first, as the data suggest that spotlighting disturbs animal distribution. It would have been even better to conduct the surveys on separate nights. However, this approach would require many more surveys to achieve a normal distribution of data for both methods, providing a foundation for future studies.
The drone could potentially cover a larger area, up to three times the area of the transect when including the observations outside the transects (Appendix A, Figure A1, Figure A2, Figure A3, Figure A4, Figure A5, Figure A6, Figure A7, Figure A8, Figure A9 and Figure A10), in roughly the same timeframe as the spotlight counts in Ulsted and roughly twice the timeframe in Ingstrup and Stenum. The spotlight survey car in Ingstrup and Stenum drove faster than in Ulsted but still within the guideline limit [12], which could explain why the drone counts here had more sightings for all animal groups, but slightly more obstructions of line of sight from the road along the transect line in Ingstrup and Stenum, such as vegetation and residential housing, could also be an explanation, when comparing to Ulsted.

4.1. Similar Studies

Monitoring mammals using drones has been extensively studied [22,23,24,25,26,27,28,29,30,31,32,45,46,47,48,49,50,51]. Witt et al. [32] compared spotlight counts and point counts to counts using a drone equipped with thermal cameras for direct detection of koalas (Phascolarctos cinereus) while flying the drone in predetermined transects. A detection probability of 83.3 ± 11.39% for the drone method was seen, compared to 38.9 ± 20.03% for spotlight counts and 4.2 ± 4.17% for point counts. Psiroukis et al. [50] monitored free-range rabbits at night, by flying at an altitude of 25 m in a predetermined flightpath. Using a thermal camera, images was gathered and later analyzed using deep learning (YOLOv5), demonstrating the prospects of combining UAS-gathered imagery with machine learning. Howell et al. [31] analyzed the cost-effectiveness of UAS thermal imaging for koala detection, comparing it with spotlight and point counts, and showed that the drone method was a cost-effective tool, despite the hardware, training, and licensing costs.

4.2. Limitations of this Study

Fog and bright moonlight had an effect on the quality of the drone survey. Fog decreased the detection distance to the animals considerably, so the drone had to fly closer to the subject for species recognition. Bright moonlight made drainage well covers, powerline foundations, water puddles, larger rocks, et cetera, very visible due to the emissivity and reflection of the materials, which at a distance would look like animals, so every object had to be inspected. Therefore, fog and moonlight did make the drone surveys slightly more time-consuming and challenging. Legislation could pose a challenge when upscaling the method for larger survey areas with limited accessibility, since the drones must be kept within visual line of sight (VLOS) at all times. However, the M300 makes it possible to assign several remote controllers to the same drone, making it possible to pass on the control of the drone from one operator to another mid-flight. Thereby, two or more drone operators could cover a much larger area while keeping the drone within VLOS. This would make the method man-hour heavy, and adding the expenses of the drone equipment would make the survey much more expensive than volunteer-based surveys. There was some degree of uncertainty when determining species, especially because fox (Vulpes vulpes), raccoon dog (Nyctereutes procyonoides), badger (Meles meles), and cat (Felis catus) can have similar postures and gaits when observed from a distance, which is why all carnivores were grouped in this study. The silhouette of deer and hare could also be difficult to distinguish from each other when comprised of very few pixels, but the patterns of movement made it possible to identify the species from a distance. In general, the animals were not evenly distributed in the open and were often seen in pairs or herds. Patches of several km2 could be desolate at one point in the night, but within less than an hour, the ground could be teeming with hare and roe deer, due to seemingly random movement of the animals.

4.3. Perspectives and Future Studies

The presented method showed promise with higher detection rates for hare, and potentially covering a much larger area per survey, but it is still time-consuming and more expensive in terms of equipment compared to utilizing volunteers, so it is unlikely to replace spotlight counts. The drone method would be superior in areas difficult or dangerous to travers by car or on foot, and potentially when monitoring cryptic animals, where traditional methods fall short. Additionally, it might be possible to use it to infer a correction factor to apply in the spotlight count method, for each specific habitat and species, as an alternative or a supplement to distance sampling calculations [17], by assuming that all animals in the survey area are detected with the drone. This might be accomplished by, after obtaining a sufficiently large amount of data to attain normal distribution per habitat, applying correlation statistics in the drone counts versus the spotlight counts, for example, Pearson’s correlation (Figure 3). Ideally, this would be performed per survey area, since it should be assumed that there are differences in the habitats and local populations. To obtain reliable data, measures should be taken to eliminate the risk of the spotlight counts having an effect on the drone counts, by doing the drone and spotlight surveys on separate nights. Hare leverets are notoriously difficult to monitor [3], and throughout the drone surveys and pilot studies, not a single leveret was positively detected. On especially clear nights, several animals smaller than adult hares were detected, mostly assumed to be mice due to their patterns of movement, but it could be speculated that a portion of them were leverets, since they were often seen in the open field near adult hares. This could have been confirmed with a light-enhanced infrared camera (IR), mounted on the drone, or handheld by approaching on foot [3]. With the development of better camera technology, it might be possible to expand the method to include leverets and other small mammals and even study their behavior and movements from above.

5. Conclusions

The scouring drone count method did observe significantly more hares than the traditional spotlight method, while for deer and carnivores, there was no significant difference in the average number of observations. Even though the drone method was as man-hour heavy as the spotlight method, it has potential to cover a larger area within the same timeframe. The drone and camera needed are expensive, so the inexpensive and citizen science-driven spotlight counts are still an invaluable tool for estimating mammal wildlife populations but can be supplemented and enhanced by the drone method. Further automation of the drone flight missions and animal detection could reduce the need for expensive drone operators. The drone method offers a basis for studying animal behavior, simultaneously with a monitoring mission, and is not as limited by vegetation along the transect lines as the spotlighting method. Further studies into the disturbances caused by the monitoring methods are needed, and more data should be obtained with drone counts and spotlight counts, possibly independently of each other, until a normal distribution is reached. This could give insights into the differences in the habitats and possibly make a foundation for a correction factor that could be used in spotlight counts, as a supplement to or even a replacement of distance sampling techniques in the unique habitats surveyed.

Author Contributions

Conceptualization, P.P., D.B., C.P. and S.P.; methodology, P.P.; formal analysis, P.P., S.P. and C.P.; investigation, P.P.; resources, S.P. and C.P.; data curation, P.P. and S.P.; writing—original draft preparation, P.P.; writing—review and editing, P.P., D.B., C.P. and S.P.; visualization, P.P.; supervision, D.B., C.P. and S.P.; funding acquisition, S.P., C.P. and D.B. All authors have read and agreed to the published version of the manuscript.

Funding

This research was funded by The Danish Ministry of Environment (grant number 2021-69701), the Institute Infrastructure (Aalborg University), and the Aalborg Zoo Conservation Foundation (AZCF: grant number 07-2022). Thank you for the support and making this study possible.

Data Availability Statement

The data presented in this study are available on request from the corresponding author.

Acknowledgments

We would like to thank Zacharias Jacobsen, Kurt Thomsen, and Frederik de Claville Christiansen from the Danish Hunters Association (Danmarks Jægerforbund) for providing data from spotlight counts and letting us fly over their preserves and Jens Christian Rasmusen for moral support and invaluable help with the night-time drone surveys.

Conflicts of Interest

The authors declare no conflict of interest. The funders had no role in the design of this study; in the collection, analyses, or interpretation of data; in the writing of the manuscript or in the decision to publish the results.

Appendix A

Figure A1. Observations in the area of Ulsted North, 22 March 2023, from spotlight counts and drone counts. The orange line shows the transect lines, and the green area represents the survey area.
Drones 07 00661 g0a1
Figure A2. Observations in the area of Ulsted North, 29 March 2023, from spotlight counts and drone counts. The orange line shows the transect lines, and the green area represents the survey area.
Drones 07 00661 g0a2
Figure A3. Observations in the area of Ulsted North, 5 April 2023, from spotlight counts and drone counts. The orange line shows the transect lines, and the green area represents the survey area.
Drones 07 00661 g0a3
Figure A4. Observations in the area of Ulsted South, 22 March 2023, from spotlight counts and drone counts. The orange line shows the transect lines, and the green area represents the survey area.
Drones 07 00661 g0a4
Figure A5. Observations in the area of Ulsted South, 29 March 2023, from spotlight counts and drone counts. The orange line shows the transect lines, and the green area represents the survey area.
Drones 07 00661 g0a5
Figure A6. Observations in the area of Ulsted South, 5 April 2023, from spotlight counts and drone counts. The orange line shows the transect lines, and the green area represents the survey area.
Drones 07 00661 g0a6
Figure A7. Observations in the area of Ingstrup, 15 March 2023, from spotlight counts and drone counts. The blue line shows the transect lines, and the grey area represents the survey area.
Drones 07 00661 g0a7
Figure A8. Observations in the area of Stenum, 15 March 2023, from spotlight counts and drone counts. The orange line shows the transect lines, and the grey area represents the survey area.
Drones 07 00661 g0a8
Figure A9. Observations in the area of Ingstrup, 9 April 2023, from spotlight counts and drone counts. The blue line shows the transect lines, and the grey area represents the survey area.
Drones 07 00661 g0a9
Figure A10. Observations in the area of Stenum, 9 April 2023, from spotlight counts and drone counts. The orange line shows the transect lines, and the grey area represents the survey area.
Drones 07 00661 g0a10

References

  1. Allison, N.L.; Destefano, S. Equipment and Techniques for Nocturnal Wildlife Studies. Wildl. Soc. Bull. 2006, 34, 1036–1044. [Google Scholar] [CrossRef]
  2. Ruxton, G.D. Non-visual crypsis: A review of the empirical evidence for camouflage to senses other than vision. Philos. Trans. R. Soc. B Biol. Sci. 2009, 364, 549–557. [Google Scholar] [CrossRef] [PubMed]
  3. Karp, D. Detecting small and cryptic animals by combining thermography and a wildlife detection dog. Sci. Rep. 2020, 10, 5220. [Google Scholar] [CrossRef] [PubMed]
  4. Jensen, T.W. Identifying Causes for Population Decline of the Brown Hare (Lepus Europaeus) in Agricultural Landscapes in Denmark. Ph.D. Thesis, Department of Wildlife Ecology and Biodiversity, NERI—National Environmental Research Institute, Aarhus University, Copenhagen, Denmark, Department of Population Biology, University of Copenhagen, KU, Copenhagen, Denmark, 2009. [Google Scholar]
  5. Sunde, P.; Asferg, T. Faglig Baggrund for Udarbejdelse af Forvaltningsplan, Fagligt Notat Fra DMU/AU, 65 s; Aarhus University: Aarhus, Denmark, 2011. [Google Scholar]
  6. Asferg, T.; Clausen, P.; Christensen, T.K.; Bregnballe, R.; Clausen, K.K.; Elmeros, M.; Fox, A.D.; Haugaard, L.; Holm, T.E.; Laursen, K.; et al. Vildtbestand og Jagttider i Danmark: Det Biologiske Grundlag for Jagttidsrevisionen 2018; DCE, Aarhus University: Aarhus, Denmark, 2016. [Google Scholar]
  7. Sørensen, I.H.; Midtgaard, L. Notat Vedr. Markvildtindsatsens Resultater 2013–2020. 2021. Available online: https://www.jaegerforbundet.dk/media/16606/210108-ihs-lmi-notat-markvildt.pdf (accessed on 27 April 2023).
  8. Ranta, E.; Lindström, J.; Lindén, H.; Helle, P. How reliable are harvesting data for analyses of spatio-temporal population dynamics. Oikos 2008, 117, 1461–1468. [Google Scholar] [CrossRef]
  9. Kahlert, J.; Fox, A.D.; Heldbjerg, H.; Asferg, T.; Sunde, P. Functional Responses of Human Hunters to Their Prey—Why Harvest Statistics may not Always Reflect Changes in Prey Population Abundance. Wildl. Biol. 2015, 21, 294–302. [Google Scholar] [CrossRef]
  10. Sliwinski, K.; Strauß, E.; Jung, K.; Siebert, U. Comparison of Spotlighting Monitoring Data of European Brown Hare (Lepus europaeus) Relative Population Densities with Infrared Thermography in Agricultural Landscapes in Northern Germany. PLoS ONE 2021, 16, e0254084. [Google Scholar] [CrossRef]
  11. Vikstrøm, T.; Eskildsen, D.P.; Jørgensen, M.F.; Ali, N.Y. Overvågning af de Almindelige Fuglearter i Danmark 1975–2021. In Årsrapport for Punkttællings-Programmet; Dansk Ornitologisk Forening: København, Danmark, 2022. [Google Scholar]
  12. Vejledning: Pattedyrstællinger. Available online: https://www.jaegerforbundet.dk/media/19412/t%C3%A6llevejledning_pattedyr_rev_2022.pdf (accessed on 27 April 2023).
  13. Langbein, J.; Hutchings, M.R.; Harris, S.; Stoate, C.; Tapper, S.C.; Wray, S. Techniques for assessing the abundance of Brown Hares Lepus europaeus. Mammal Rev. 1999, 29, 93–116. [Google Scholar] [CrossRef]
  14. Zellweger-Fischer, J.; Kéry, M.; Pasinelli, G. Population trends of brown hares in Switzerland: The role of land-use and ecological compensation areas. Biol. Conserv. 2011, 144, 1364–1373. [Google Scholar] [CrossRef]
  15. Bedson, C.P.E.; Thomas, L.; Wheeler, P.M.; Reid, N.; Harris, W.E.; Lloyd, H.; Mallon, D.; Preziosi, R. Estimating Density of Mountain Hares Using Distance Sampling: A Comparison of Daylight Visual Surveys, Night-Time Thermal Imaging and Camera Traps. Wildl. Biol. 2021, 2021, wlb-00802. [Google Scholar] [CrossRef]
  16. Forsyth, D.M.; Comte, S.; Davis, N.E.; Bengsen, A.J.; Côté, S.D.; Hewitt, D.G.; Morellet, N.; Mysterud, A. Methodology Matters When Estimating Deer Abundance: A Global Systematic Review and Recommendations for Improvements. J. Wildl. Manag. 2022, 86, e22207. [Google Scholar] [CrossRef]
  17. Buckland, S.T.; Rexstad, E.A.; Marques, T.A.; Oedekoven, C.S. Distance Sampling: Methods and Applications; Springer International Publishing: Cham, Switzerland, 2015; pp. 3–12. [Google Scholar]
  18. Buckland, S.T.; Plumptre, A.J.; Thomas, L.; Rexstad, E.A. Line Transect Sampling of Primates: Can Animal-to-Observer Distance Methods Work. Int. J. Primatol. 2010, 31, 485–499. [Google Scholar] [CrossRef]
  19. Knights, K.; McCarthy, M.A.; Camac, J.; Guillera-Arroita, G. Efficient effort allocation in line-transect distance sampling of high-density species: When to walk further, measure less-often and gain precision. Methods Ecol. Evol. 2021, 12, 962–970. [Google Scholar] [CrossRef]
  20. Focardi, S.; De Marinis, A.M.; Rizzotto, M.; Pucci, A. Comparative Evaluation of Thermal Infrared Imaging and Spotlighting to Survey Wildlife. Wildl. Soc. B 2001, 29, 133–139. [Google Scholar]
  21. Rahman, D.A.; Rahman, A.A.A.F. Performance of unmanned aerial vehicle with thermal imaging, camera trap, and transect survey for monitoring of wildlife. IOP Conf. Ser. Earth Environ. Sci. 2021, 771, 12011. [Google Scholar] [CrossRef]
  22. Tomljanovic, K.; Kolar, A.; Duka, A.; Franjevic, M.; Jurjevic, L.; Matak, I.; Ugarkovic, D.; Balenovic, I. Application of UAS for Monitoring of Forest Ecosystems—A Review of Experience and Knowledge. Croat. J. For. Eng. 2022, 43, 487–504. [Google Scholar] [CrossRef]
  23. Dronova, I.; Kislik, C.; Dinh, Z.; Kelly, M. A Review of Unoccupied Aerial Vehicle Use in Wetland Applications: Emerging Opportunities in Approach, Technology, and Data. Drones 2021, 5, 45. [Google Scholar] [CrossRef]
  24. Povlsen, P.; Linder, A.C.; Larsen, H.L.; Durdevic, P.; Arroyo, D.O.; Bruhn, D.; Pertoldi, C.; Pagh, S. Using Drones with Thermal Imaging to Estimate Population Counts of European Hare (Lepus europaeus) in Denmark. Drones 2023, 7, 5. [Google Scholar] [CrossRef]
  25. Christie, K.S.; Sophie, L.G.; Casey, L.B.; Hatfield, M.; Hanson, L. Unmanned aircraft systems in wildlife research: Current and future applications of a transformative technology. Front. Ecol. Environ. 2016, 14, 241–251. [Google Scholar] [CrossRef]
  26. Hyun, C.; Park, M.; Lee, W.Y. Remotely Piloted Aircraft System (RPAS)-Based Wildlife Detection: A Review and Case Studies in Maritime Antarctica. Animals 2020, 10, 2387. [Google Scholar] [CrossRef]
  27. Linchant, J.; Lejeune, P.; Quevauvillers, S.; Vermeulen, C.; Brostaux, Y.; Lhoest, S.; Michez, A. Evaluation of an Innovative Rosette Flight Plan Design for Wildlife Aerial Surveys with UAS. Drones 2023, 7, 208. [Google Scholar] [CrossRef]
  28. Lyu, X.; Li, X.; Dang, D.; Dou, H.; Wang, K.; Lou, A. Unmanned Aerial Vehicle (UAV) Remote Sensing in Grassland Ecosystem Monitoring: A Systematic Review. Remote Sens. 2022, 14, 1096. [Google Scholar] [CrossRef]
  29. Robinson, J.M.; Harrison, P.A.; Mavoa, S.; Breed, M.F. Existing and emerging uses of drones in restoration ecology. Methods Ecol. Evol. 2022, 13, 1899–1911. [Google Scholar] [CrossRef]
  30. Linchant, J.; Lisein, J.; Semeki, J.; Lejeune, P.; Vermeulen, C. Are unmanned aircraft systems (UASs) the future of wildlife monitoring? A review of accomplishments and challenges. Mammal Rev. 2015, 45, 239–252. [Google Scholar] [CrossRef]
  31. Howell, L.G.; Clulow, J.; Jordan, N.R.; Beranek, C.T.; Ryan, S.A.; Roff, A.; Witt, R.R. Drone Thermal Imaging Technology Provides a Cost-Effective Tool for Landscape-Scale Monitoring of a Cryptic Forest-Dwelling Species across All Population Densities. Wildl. Res. 2021, 49, 66–78. [Google Scholar] [CrossRef]
  32. Witt, R.R.; Beranek, C.T.; Howell, L.G.; Ryan, S.A.; Clulow, J.; Jordan, N.R.; Denholm, B.; Roff, A. Real-time drone derived thermal imagery outperforms traditional survey methods for an arboreal forest mammal. PLoS ONE 2020, 15, e0242204. [Google Scholar] [CrossRef]
  33. Corcoran, E.; Winsen, M.; Sudholz, A.; Hamilton, G. Automated Detection of Wildlife Using Drones: Synthesis, Opportunities and Constraints. Methods Ecol. Evol. 2021, 12, 1103–1114. [Google Scholar] [CrossRef]
  34. Winsen, M.; Denman, S.; Corcoran, E.; Hamilton, G. Automated Detection of Koalas with Deep Learning Ensembles. Remote Sens. 2022, 14, 2432. [Google Scholar] [CrossRef]
  35. Whitworth, A.; Pinto, C.; Ortiz, J.; Flatt, E.; Silman, M. Flight speed and time of day heavily influence rainforest canopy wildlife counts from drone-mounted thermal camera surveys. Biodivers. Conserv. 2022, 31, 3179–3195. [Google Scholar] [CrossRef]
  36. Shewring, M.P.; Vafidis, J.O. Using UAV-mounted Thermal Cameras to Detect the Presence of Nesting Nightjar in Upland Clear-fell: A Case Study in South Wales, UK. Ecol. Solut. Evid. 2021, 2, e12052. [Google Scholar] [CrossRef]
  37. Seymour, A.C.; Dale, J.; Hammill, M.; Halpin, P.N.; Johnston, D.W. Automated Detection and Enumeration of Marine Wildlife Using Unmanned Aircraft Systems (UAS) and Thermal Imagery. Sci. Rep. 2017, 7, 45127. [Google Scholar] [CrossRef]
  38. Zhang, H.; Wang, C.; Turvey, S.T.; Sun, Z.; Tan, Z.; Yang, Q.; Long, W.; Wu, X.; Yang, D. Thermal infrared imaging from drones can detect individuals and nocturnal behavior of the world’s rarest primate. Glob. Ecol. Conserv. 2020, 23, e01101. [Google Scholar] [CrossRef]
  39. Burke, C.; Rashman, M.; Wich, S.; Symons, A.; Theron, C.; Longmore, S. Optimizing Observing Strategies for Monitoring Animals Using Drone-Mounted Thermal Infrared Cameras. Int. J. Remote Sens. 2019, 40, 439–467. [Google Scholar] [CrossRef]
  40. Sunde, P.; Jessen, L. It Counts Who Counts: An Experimental Evaluation of the Importance of Observer Effects on Spotlight Count Estimates. Eur. J. Wildl. Res. 2013, 59, 645–653. [Google Scholar] [CrossRef]
  41. DJI Matrice 300RTK. Available online: https://www.dji.com/dk/matrice-300 (accessed on 27 April 2023).
  42. Droneregler.dk. Available online: Droneregler.dk (accessed on 27 April 2023).
  43. McShea, W.J.; Stewart, C.M.; Kearns, L.; Bates, S. Road bias for deer density estimates at 2 national parks in Maryland. Wildl. Soc. Bull. 2011, 35, 177–184. [Google Scholar] [CrossRef]
  44. Schad, L.; Fischer, J. Opportunities and risks in the use of drones for studying animal behaviour. Methods Ecol. Evol. 2022, 14, 1864–1872. [Google Scholar] [CrossRef]
  45. Corcoran, E.; Denman, S.; Hamilton, G. Evaluating New Technology for Biodiversity Monitoring: Are Drone Surveys Biased? Ecol. Evol. 2021, 11, 6649–6656. [Google Scholar] [CrossRef] [PubMed]
  46. Corcoran, E.; Denman, S.; Hanger, J.; Wilson, B.; Hamilton, G. Automated detection of koalas using low-level aerial surveillance and machine learning. Sci. Rep. 2019, 9, 3208. [Google Scholar] [CrossRef]
  47. Beaver, J.T.; Baldwin, R.W.; Messinger, M.; Newbolt, C.H.; Ditchkoff, S.S.; Silman, M.R. Evaluating the Use of Drones Equipped with Thermal Sensors as an Effective Method for Estimating Wildlife. Wildl. Soc. Bull. 2020, 44, 434–443. [Google Scholar] [CrossRef]
  48. Edwards, H.H.; Hostetler, J.A.; Stith, B.M.; Martin, J. Monitoring abundance of aggregated animals (Florida manatees) using an unmanned aerial system (UAS). Sci. Rep. 2021, 11, 12920. [Google Scholar] [CrossRef]
  49. Piel, A.K.; Crunchant, A.; Knot, I.E.; Chalmers, C.; Fergus, P.; Mulero-Pázmány, M.; Wich, S.A. Noninvasive Technologies for Primate Conservation in the 21st Century. Int. J. Primatol. 2022, 43, 133–167. [Google Scholar] [CrossRef]
  50. Psiroukis, V.; Malounas, I.; Mylonas, N.; Grivakis, K.; Fountas, S.; Hadjigeorgiou, I. Monitoring of free-range rabbits using aerial thermal imaging. Smart Agric. Technol. 2021, 1, 100002. [Google Scholar] [CrossRef]
  51. Cline, E.E.; Gehring, T.M.; Etter, D.R. Evaluating unoccupied aerial vehicles for estimating relative abundance of muskrats. Wildl. Soc. B 2022, 46, e1306. [Google Scholar] [CrossRef]
Figure 1. Map shoving the placement of the three census guilds in Northern Jutland, Denmark: Ulsted (57.07575 N, 10.25559 E), Ingstrup, and Stenum (57.30722 N, 9.80053 E).
Drones 07 00661 g001
Figure 2. Screenshot of the DJI FlightHub browser application when flying at Ingstrup–Stenum, showing manually annotated restricted areas such as a helipad, dangers and obstacles like power lines and wind turbines (red lines) and possible take-off and landing sites (red diamonds). Guidelines for the optimal path when flying manually (light yellow line) were drawn in advance. Annotations made mid-flight would instantly be updated on the controller and in the browser and stored for later data extraction online.
Drones 07 00661 g002
Figure 3. (ac) Pearson’s correlation coefficient (R), the corresponding p-value (p), and the slope of the linear regression of the number of observations per km2 grouped into hare, deer, and carnivores at the ten surveys.
Drones 07 00661 g003
Figure 4. (ac) Bland–Altman plots showing the mean difference (solid line) between drone counts and spotlight counts of hares, deer, and carnivores compared to density of individuals (average of the methods). Dashed lines show the upper and lower limits of agreement (LOAs). Except for one outlier (circle), there is a linear relationship between the density of hares and the difference between the methods.
Drones 07 00661 g004
Table 1. The dates of the surveys and the weather conditions of those nights.
DatePlaceTemperatureWeather Conditions
15 March 2023Ingstrup–Stenum0 °CClear to cloudy sky
22 March 2023Ulsted5 °CCloudy
29 March 2023Ulsted2 °CLight rain, fog, poor
visibility
5 April 2023Ulsted3 °CClear sky, moonlight; rain and sleet later in the night
9 April 2023Ingstrup–Stenum7 °CClear sky
Table 2. Summary of counts and densities for European hare revealed by thermal drone and spotlight counts for the ten survey transects with date of area covered.
LocationDateArea km2Drone
Hare Obs.
Spotlight
Hare Obs.
DifferenceDrone
Hares per km2
Spotlight
Hares per km2
Ulsted_N22 March 20232.43024612.510.0
Ulsted_S22 March 20232.736102613.33.7
Ulsted_N29 March 20232.4227159.22.9
Ulsted_S29 March 20232.738122614.14.4
Ulsted_N5 April 20232.424101410.04.2
Ulsted_S5 April 20232.73152611.51.9
Ingstrup15 March 20232.6164126.21.5
Stenum15 March 20232.512844.83.2
Ingstrup9 April 20232.617986.53.5
Stenum9 April 20232.5206148.02.4
Table 3. Summary of counts and densities for deer revealed by thermal drone and spotlight counts for the ten survey transects with date of area covered.
LocationDateArea km2Drone
Deer Obs.
Spotlight
Deer Obs.
DifferenceDrone
Deer per km2
Spotlight
Deer per km2
Ulsted_N22 March 20232.4719−122.97.9
Ulsted_S22 March 20232.73831714.111.5
Ulsted_N29 March 20232.42037−178.315.4
Ulsted_S29 March 20232.7262069.67.4
Ulsted_N5 April 20232.42224−29.210.0
Ulsted_S5 April 20232.72334−118.512.6
Ingstrup15 March 20232.614865.43.1
Stenum15 March 20232.55232.00.8
Ingstrup9 April 20232.65051.90.0
Stenum9 April 20232.5152136.00.8
Table 4. Summary of counts and densities for carnivores revealed by thermal drone and spotlight counts for the ten survey transects with date of area covered.
LocationDateArea km2Drone
Carn. Obs.
Spotlight
Carn. Obs.
DifferenceDrone
Carn. per km2
Spotlight
Carn. per km2
Ulsted_N22 March 20232.412−10.40.8
Ulsted_S22 March 20232.712−10.40.7
Ulsted_N29 March 20232.457−22.12.9
Ulsted_S29 March 20232.714−30.41.5
Ulsted_N5 April 20232.43121.30.4
Ulsted_S5 April 20232.703−30.01.1
Ingstrup15 March 20232.61100.40.4
Stenum15 March 20232.53031.20.0
Ingstrup9 April 20232.63301.21.2
Stenum9 April 20232.53301.21.2
Disclaimer/Publisher’s Note: The statements, opinions and data contained in all publications are solely those of the individual author(s) and contributor(s) and not of MDPI and/or the editor(s). MDPI and/or the editor(s) disclaim responsibility for any injury to people or property resulting from any ideas, methods, instructions or products referred to in the content.

