1. Introduction
In recent years, aerial vehicles have become increasingly popular for gas detection tasks, owing to their versatility and ability to cover larger areas than ground vehicles. The indoor air quality (IAQ) index and total volatile organic compounds (TVOCs) are two essential parameters for measuring air pollution. Both parameters are widely used in gas detection applications [
1].
As per the definitions presented in [
2], odor source localization entails the method of ascertaining the precise location of a chemical source of interest in the environment by monitoring a plume generated by the source and affected by wind dynamics. Since the early 1990s, many researchers have been dedicated to building a robot (or a group of robots) capable of locating a chemical release source.
The challenge of detecting odor sources can be addressed in two distinct ways: a fixed sensor network and mobile robotics. The first approach relates to techniques in which the sensory units remain stationary. Essentially, a fixed sensor network involves deploying multiple sensors in predetermined positions throughout the environment. These sensors are responsible for gathering data on gas concentration and, through reference nodes, estimating the location of the odor source. On the other hand, using a gas sensor mounted on a UAV offers several advantages over traditional systems that utilize fixed sensors distributed throughout the environment, depending on the context and specific objectives. Some notable benefits include:
(1) Mobility and Efficient Scanning: In expansive and intricate environments like warehouses, factories, or industrial facilities, a drone can swiftly traverse the entire space, collecting data from various areas in a single mission. This enables data collection in specific or challenging-to-access locations, a capability not feasible with fixed sensors, which are confined to their installation locations.
(2) Flexibility: The drone can be easily reconfigured with different sensors to detect a diverse range of gases, rendering it versatile for various applications.
(3) Resource Conservation: Gas sensors on drones contribute to energy and resource savings by precisely targeting relevant areas. This prevents continuous data collection in unnecessary locations, optimizing efficiency.
(4) Rapid Emergency Response: In emergency scenarios such as gas leaks, deploying a drone allows for swift assessment of the situation, identification of the leak’s source, and guidance for response teams.
(5) Deployment Flexibility: Drones offer the advantage of choosing the height and proximity of sensors to the gas source, a critical factor for achieving depth accuracy.
(6) Temporary Coverage: For events or locations requiring temporary monitoring, such as construction sites, drones provide a flexible and temporary solution without the need for the installation of fixed sensors.
Rotary-wing unmanned aerial vehicles (UAVs), equipped with gas detection sensors, offer a promising solution for air quality measurements. In comparison to fixed-wing aircraft, quadcopters have the ability to perform vertical take-offs and landings, hover, and fly in both outdoor and indoor spaces with obstacles [
3].
Despite UAVs’ excellent maneuverability, the turbulence generated by the propellers, known as “wake”, can hinder gas detection as the vehicle’s movement interacts with gas dispersion in the environment. An interesting alternative to mitigate this problem is the nano quadcopter, also known as NAVs (nano aerial vehicles), which have sizes of up to 15 cm [
4]. With smaller propellers, they cause less interference with the gas plume, have the ability for rapid movement, and can fly safely above pedestrians, making them suitable for indoor environments. However, NAVs have disadvantages, such as limited flight time and reduced payload capacity.
Applications of an odor source detection system using metal oxide sensors encompass various situations. In the study presented in [
5], the authors used a swarm of quadcopters to monitor indoor air quality in industrial plants. Concerns about the workers’ health justify this approach due to potential risks associated with airborne products.
In the research outlined in [
1], the authors investigated the performance of gas sensors in detecting 12 different compounds in two environments: the first within a chemical preparation hood and the second in an open automated laboratory. The presented experiments aim to provide essential parameters for implementing an autonomous gas detection and alarm system in chemical laboratories for future projects.
The authors in [
6] conducted a comprehensive study on the use of Internet of Things (IoT) sensor nodes for early and continuous detection of hazardous gas situations, with a focus on TVOC. Through experimental tests, the authors concluded that metal oxide sensors are suitable for the early detection of solvent vapors in biological science laboratories, despite the challenges. Artificial intelligence solutions were incorporated to enhance the obtained results.
The study outlined in [
7] presents innovative methods for mapping gas sources utilizing nano aerial vehicles. Two strategies were proposed, both based on signal feature extraction: instantaneous measurement and detection bout frequency. Although the initial strategy of plume tracking based on gas gradient and bout frequency showed inefficiency, the authors suggested a post-trial mapping algorithm constructed from information collected by the robot. This could lead to more accurate and refined gas source mapping. However, this approach might require initial adjustments and involve complex data processing, demanding computational resources and data analysis expertise to achieve meaningful outcomes.
The study conducted in [
8] presents a biomimetic search strategy inspired by the behavior of adult male silkworm moths. They address the challenge of slow sensor response time by selecting the MiCS5524 model and applying output filtering using a developed ARX model. The sensors exhibited behavior when exposed to ethanol that enabled estimation of odor source position relative to flight direction, fueling the proposed search algorithm. The authors achieved success rates of up to 80% in a three-dimensional search, contingent upon the gas source’s height. While benefiting from biomimetic inspiration and compensating for response time, the method’s effectiveness is dependent on source height and still offers room for improvement in overall success rates.
In the study discussed in [
9], the authors conducted a comprehensive comparative analysis of gas distribution mapping algorithms, assessing the performance of two infotaxis-based methods against a random walk algorithm. The study provides insights into the relative efficiency of these approaches. Notably, traditional infotaxis methods demonstrated a capacity to excel in areas with high gas variability, effectively targeting specific regions of interest. However, these methods were found to be less efficient in broader gas plume modeling and distribution mapping scenarios, potentially limiting their ability to provide a comprehensive overview. The influence of the vehicle’s propeller aerodynamics emerged as a factor affecting the performance of classical exploration methods, adding complexity to their practical application. Furthermore, the authors observed that segmenting the environment to favor infotaxis methods enhanced exploration by increasing the number of explored cells and maintaining mapping quality in proximity to the source. It is important to consider that while infotaxis approaches offer advantages in specific contexts, their limitations in broader and complex scenarios, along with sensitivity to external factors, underscore the need for careful adaptation and consideration of alternative strategies.
In the study presented in [
10], a mini quadrotor equipped with a micro needle trap sampler (NTS) collected volatile organic compounds (VOCs) from industrial sites. The NTS used a 7 cm stainless steel needle filled with powdered divinylbenzene adsorbents. A telescoping shaft on the drone helped overcome air turbulence. The entire sampling device weighed less than 200 g. VOCs from steel and semiconductor plants were captured by the NTS on the drone and identified using gas chromatography–mass spectrometry. This method successfully identified stationary pollution sources.
Based on our literature review, we have identified several significant research gaps. Firstly, previous studies utilizing gas gradient-based plume tracking have not yielded effective results. Furthermore, the research found in the literature requires initial adjustments and complex data processing, demanding significant computational resources and a high level of expertise in data analysis to achieve practical relevance. Most of these works do not provide the ability to quickly and accurately assess the location of odor sources, which represents a considerable gap in the field. Additionally, studies offering real gas reading data from experiments with drones and commercially available sensors are scarce. Furthermore, a promising area for exploration lies in the in-depth investigation of the feasibility of using nano quadcopters in enclosed environments for gas leak detection, ensuring that the rotor’s motion does not interfere with data collection by the onboard gas sensor.
To address the mounting demands related to the subject, it becomes essential to investigate the conditions in which the combination of factors related to the odor source, gas sensor sensitivity, and propeller movements are conducive to generating useful information to be subsequently applied in gas distribution mapping (GDM) and gas source localization (GSL) algorithms.
The central objective of this article is to enhance the detection of volatile gas leaks in indoor environments using navigation autonomous vehicles (NAVs). In addition to the primary goal, we also have the following specific objectives:
(1) Analysis and evaluation of the hardware to be used in the project, including the model of the aerial vehicle, the local positioning system, and the chemical gas detection sensor.
(2) Integration of the sensor into the aircraft and the development of a communication interface between the two.
(3) Conducting tests to characterize the gas sensor’s response.
(4) Assessment of the data to be extracted from the gas sensor readings to improve odor source localization efficiency.
(5) Development of the computational algorithm that will guide the aircraft in mapping the environment and declaring the gas source’s location.
(6) Planning of experimental tests and the evaluation of the obtained results.
To achieve these objectives, a series of comprehensive experiments were conducted, encompassing real-time monitoring and addressing challenges related to path selection. This was achieved using microquadcopters and readily available gas sensors. The success of the study hinged on the specific configuration of the aircraft, the thoughtfully chosen sensors, and the strategy employed for gas dispersion in the environment. The integrated sensor within the unmanned aerial vehicle (UAV) collected environmental data, which was subsequently processed to generate reports. This approach facilitated both real-time and offline air quality analysis in the monitored environment. The technology presented in this research showcases its particular utility in challenging and difficult-to-access areas, such as tunnels or confined spaces housing gas pipelines or storage tanks.
The subsequent sections of this article are structured as follows: In
Section 2, an elaboration of primary materials is provided, encompassing the aircraft type, details of the internal positioning system, characteristics of the onboard sensor, and specifications of the UAV-to-gas sensor communication interface. Additionally, this section covers the presentation of the experimental design, sensor response characterization, and the criteria employed for UAV trajectory definition. Moving forward,
Section 3 showcases the experimental test results, while
Section 4 engages in an analytical discourse of these results. Finally,
Section 5 encapsulates the key conclusions drawn from the study, along with potential future work.
2. Materials and Methods
2.1. Crazyflie 2.1
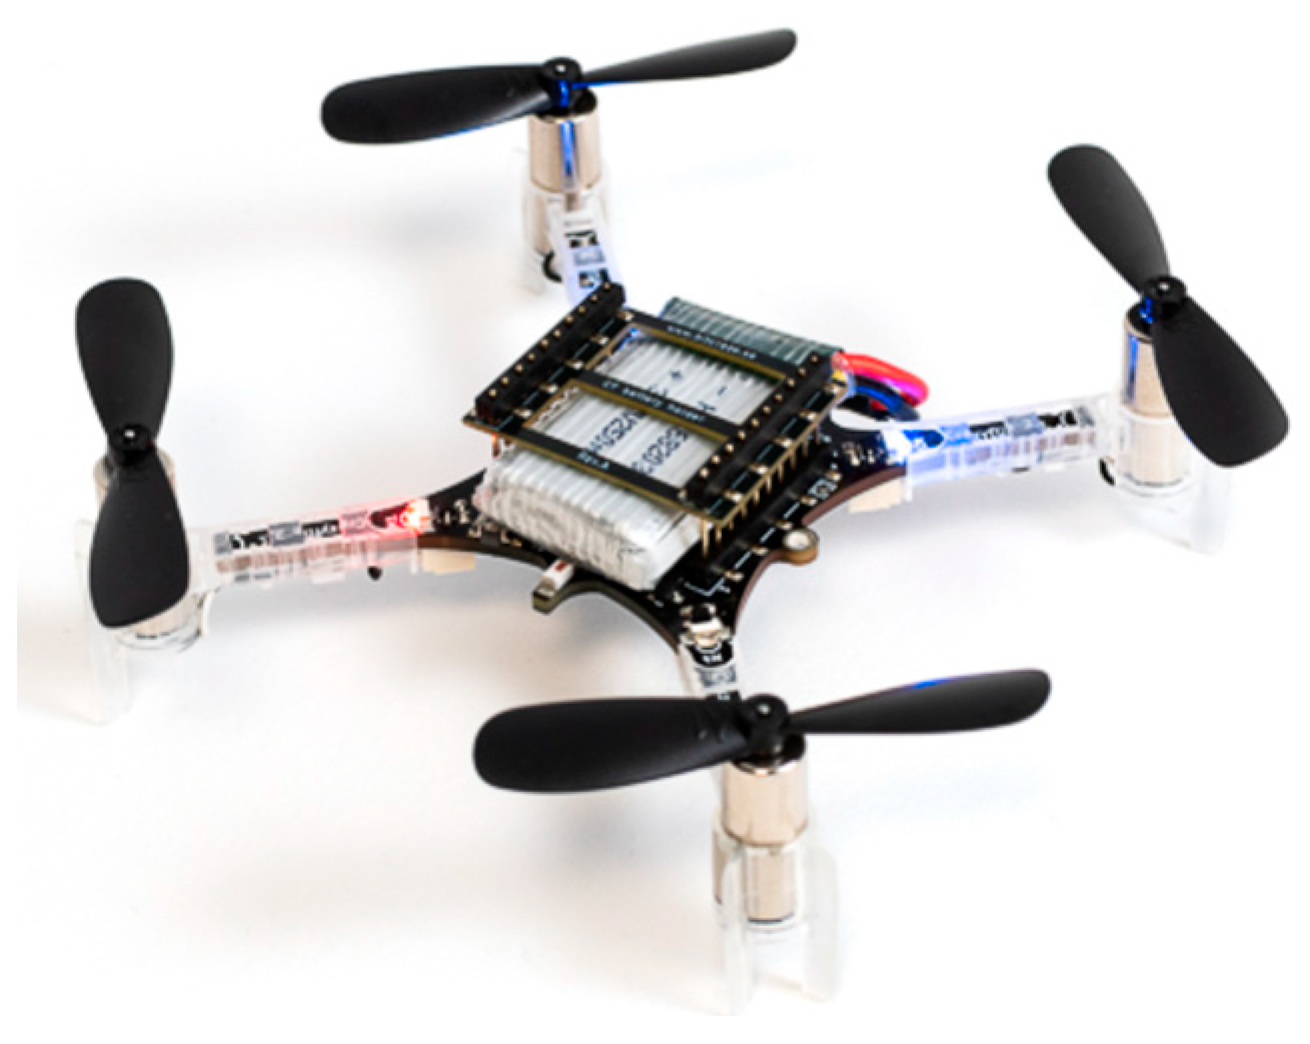
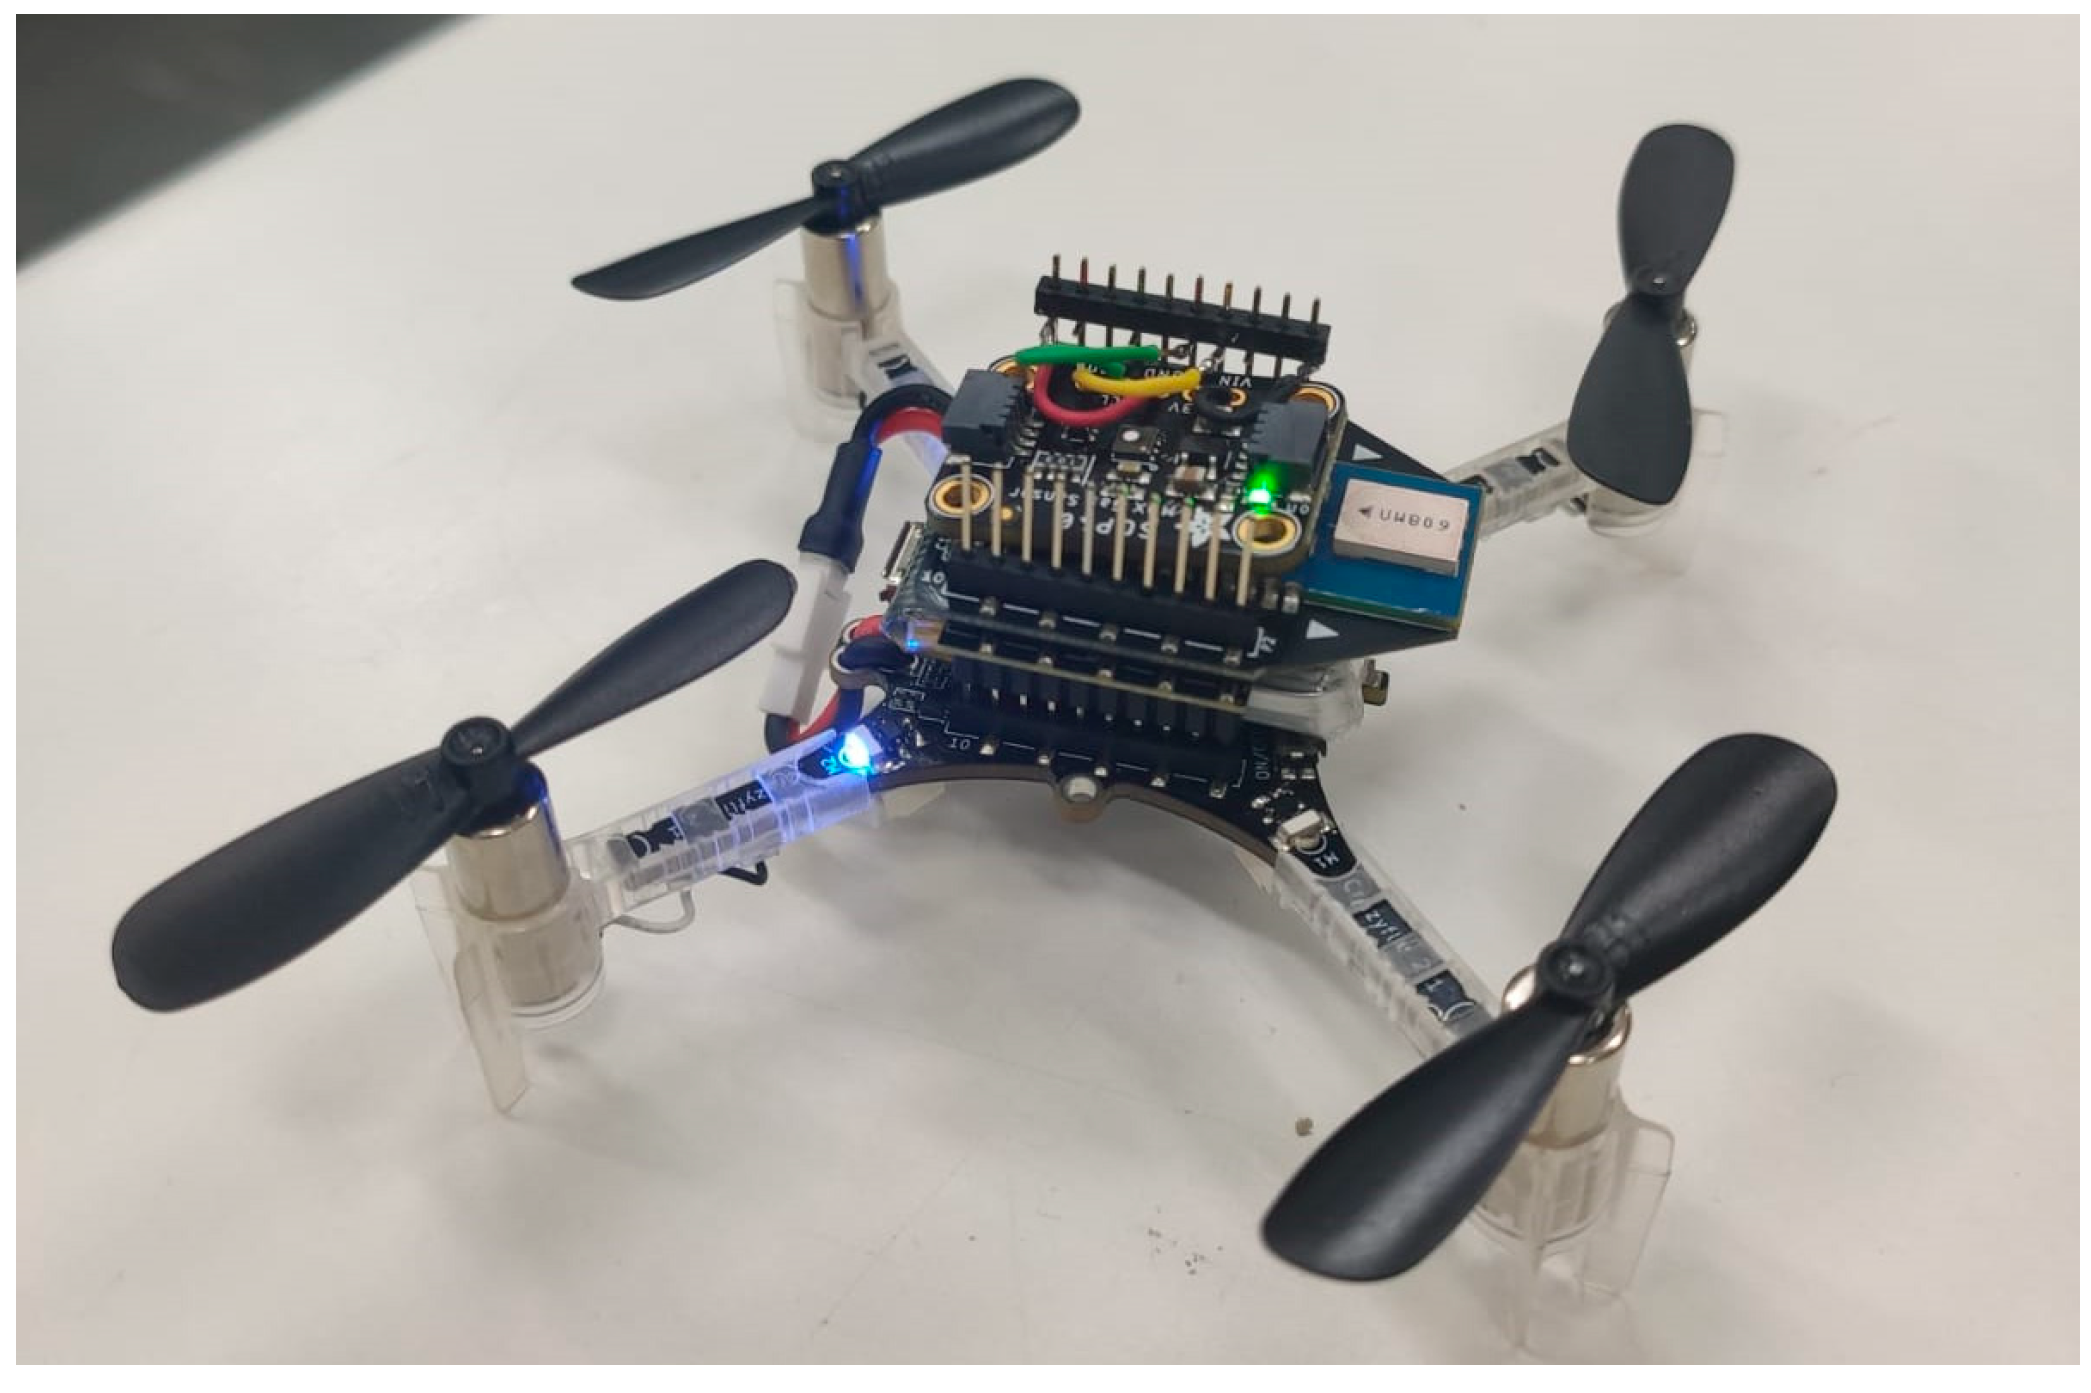
Crazyflie 2.1 (CF2), shown in
Figure 1, is a versatile open-source flying development platform that weighs only 27 g. Produced by Bitcraze AB (Malmö, Sweden), it was chosen for the proposed task in this study due to several unique advantages, continuous manufacturer support, compact dimensions, and low cost. Due to the affordable cost, it is feasible to use UAV swarms to streamline tasks. Additionally, the manufacturer provides a local positioning system that represents a remarkable solution for one of the main challenges faced in research in this area: the accurate estimation of the aircraft’s position in indoor space.
Crazyflie 2.1 is equipped with advanced technology and has two microcontrollers. The first one is the ARM Cortex-M4 model (STM32F405) with 192 kB of RAM, 1 Mb of flash memory, and a clock speed of 138 MHz. This microcontroller is responsible for interacting with the sensors, motors, and EEPROM memory, and executing the main application. The second microcontroller, an ARM Cortex-M0 (nRF51822) with 16 kB of RAM, 128 kB of flash memory, and a clock speed of 32 MHz, is responsible for power management and radio communication [
11].
The quadcopter is equipped with four actuator sets, each consisting of a motor coupled with a propeller. In the case of the CF2, the motors are brushed coreless direct current (DC) motors that reach a maximum rotation speed of 25,000 rpm. The propellers, made of plastic, have a diameter of 45 mm. Since the vehicle’s motors rotate in opposite directions, the propellers come in two models and must be correctly positioned on motors that spin clockwise (CW) and counterclockwise (CCW). The vehicle is powered by a 3.7 V LiPo battery (250 mAh), providing approximately 7 min of continuous flight time [
11].
Communication between the vehicles and the desktop computer is established through a radio interface. The CF2 is equipped with a 20 dBm radio amplifier, tested for distances up to 1 km with tolerable signal loss. To interact with the desktop computer, it connects via USB to a radio dongle provided by the manufacturer. This dongle is based on the nRF24LU1+ SoC semiconductor and operates at a frequency of 2.4 GHz. The data transmission rate between the devices can be selected between 250 Kbps, 1 Mbps, or 2 Mbps, providing flexibility for different needs. Furthermore, the range of this system has been tested and verified, reaching up to 80 m when operating at 250 Kbps [
11].
2.2. Positioning System
For autonomous flights, precise positioning support is indispensable. However, mounting the sensing equipment on the top of the UAV creates limitations on the possibilities for position estimation. As a result, some practices, such as using onboard cameras proposed by [
12] and infrared light plane-rotating base stations investigated by [
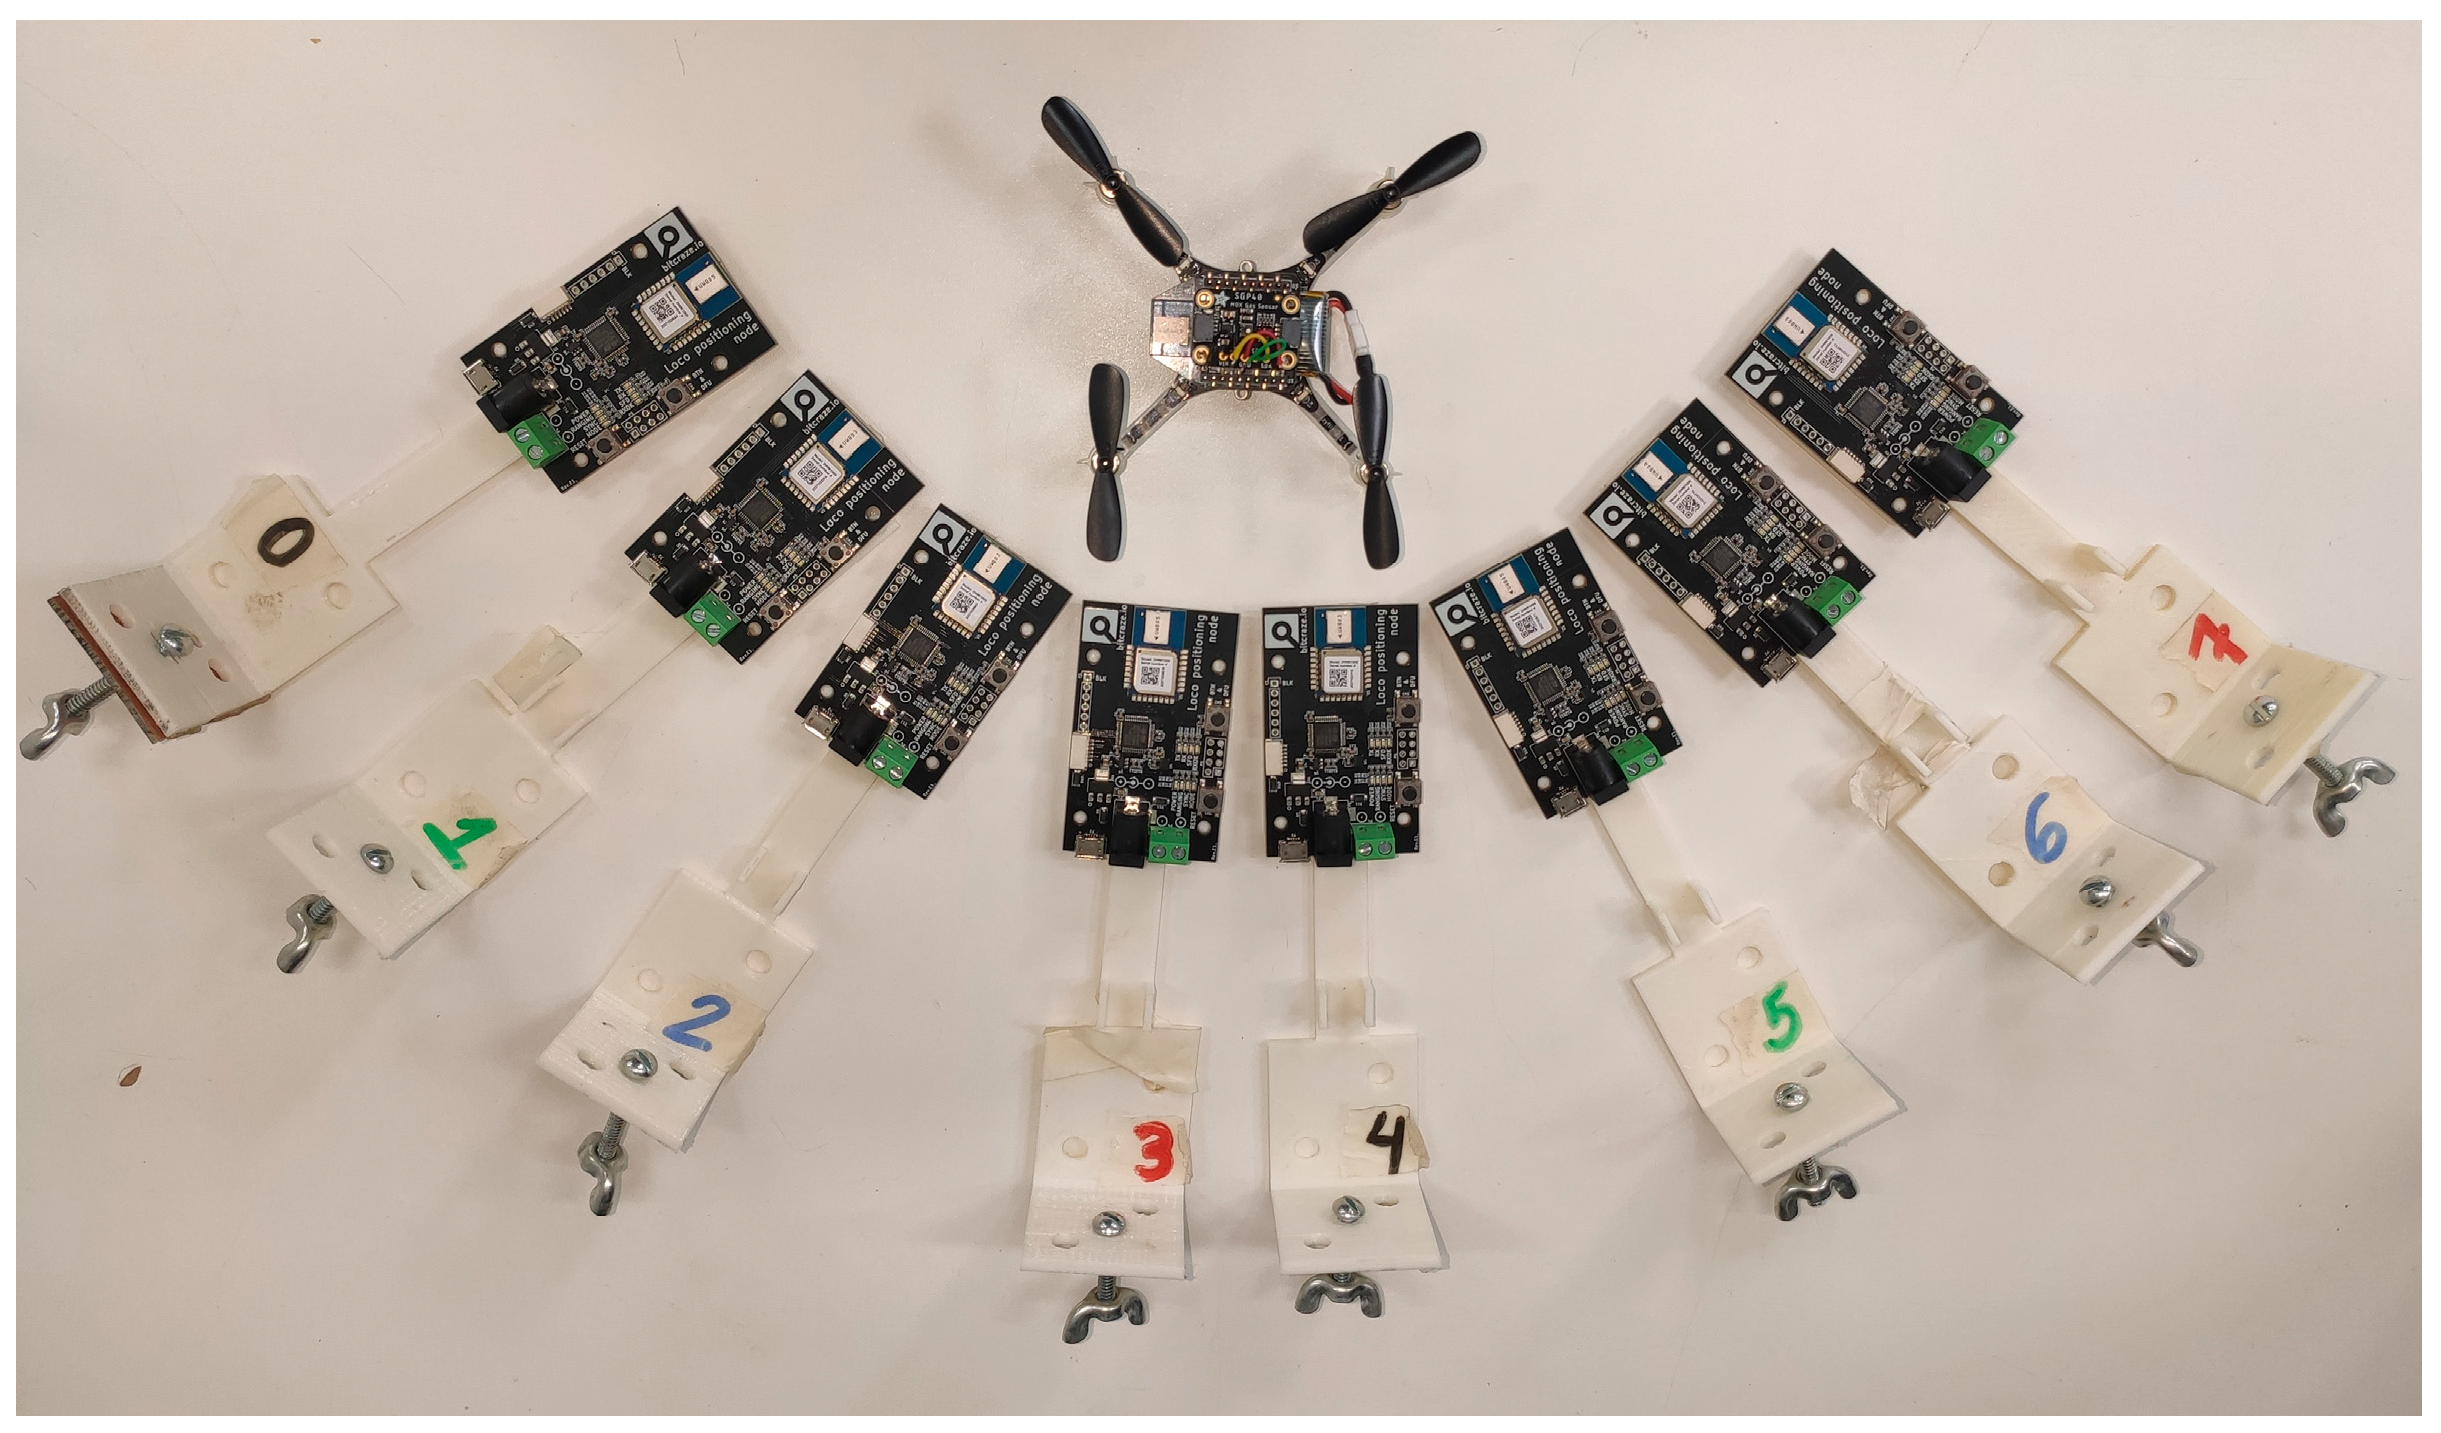
13], become unfeasible. In this research, the local positioning system (LOCO), presented in
Figure 2, was opted for. The system applies ultra-wideband (UWB) radio technology to determine the three-dimensional location of one or more CF2 in space.
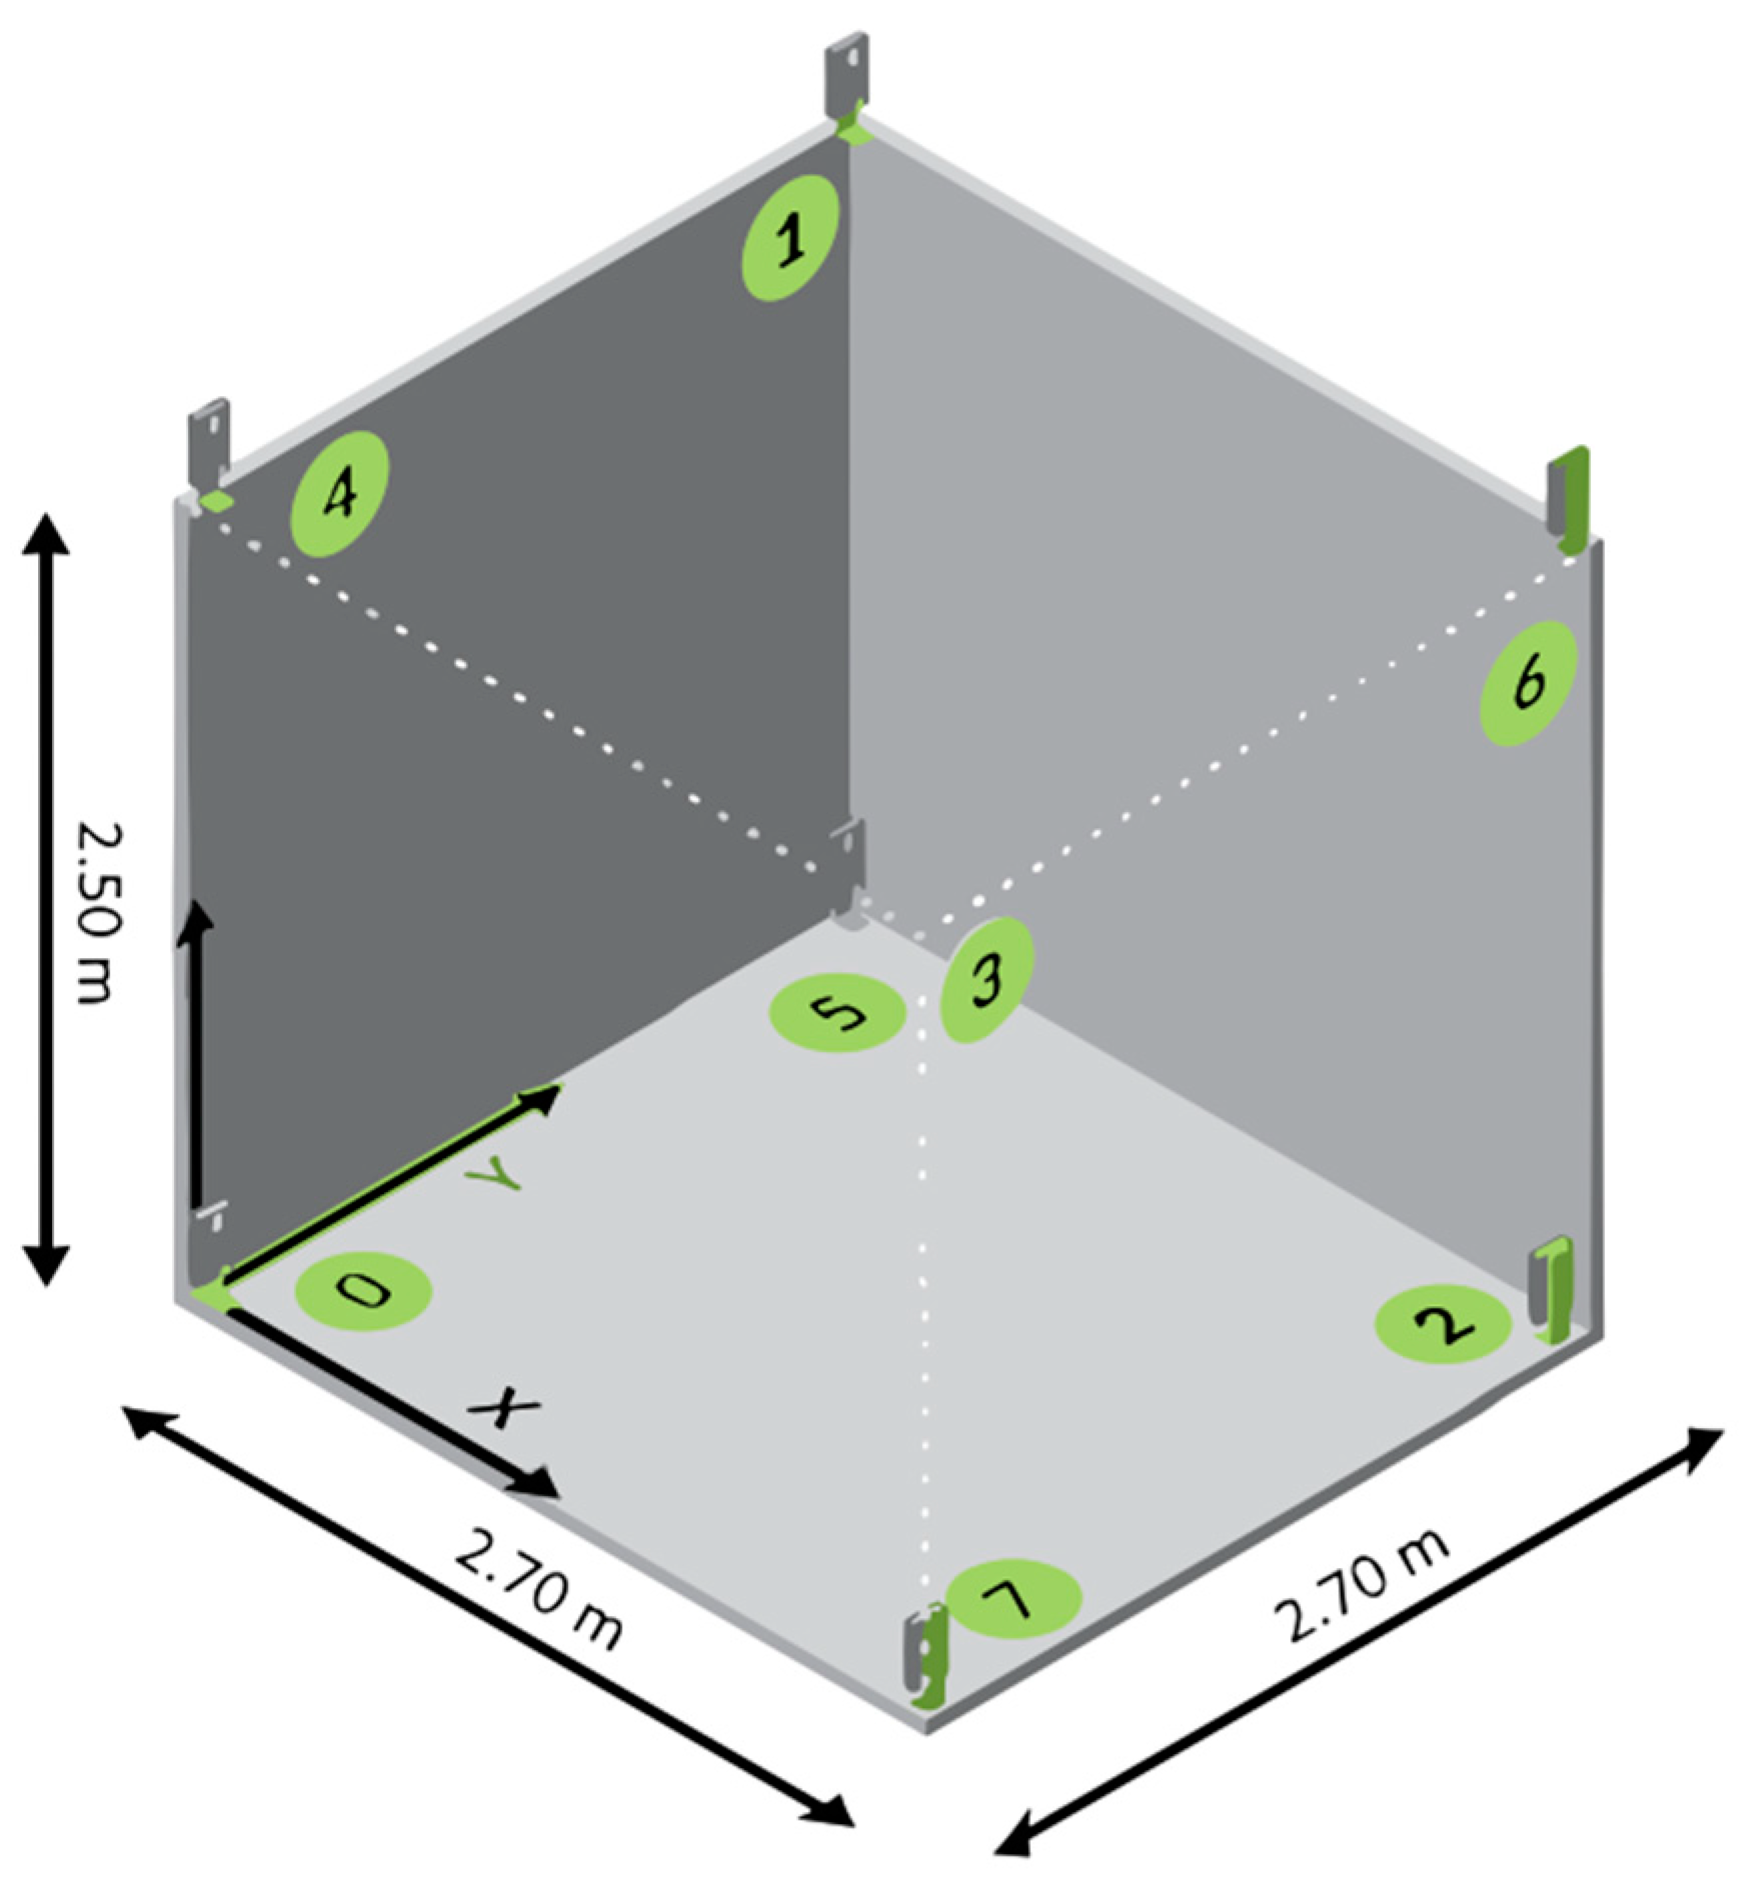
In
Figure 2, the numbers from 0 to 7 correspond to the specific anchor installation positions, directly correlated with the numerical markings located along the edges of
Figure 3. The LOCO system is based on the Decawave DWM1000 chip and offers a positioning accuracy in the range of 10 cm, which can vary depending on the adopted configuration. It consists of a tag, directly connected to the CF2 through its expansion ports, and a set of eight nodes, or anchors, positioned in the test environment, as shown in
Figure 3, using supports created with a 3D printer using designs provided by the manufacturer [
11].
LOCO allows tracking a large volume of space without the need for a direct line of sight and is not affected by the presence of intense sunlight [
11]. It is important to note that the performance of 3D positioning varies according to the system configuration and the operating environment. The positioning system implements three different positioning modes: two-way ranging (TWR), time difference of arrival 2 (TDoA 2), and time difference of arrival 3 (TDoA 3). In the TWR mode, the tag sequentially sends messages to the anchors. Based on the response time delay from each anchor, the distance to each one is calculated, enabling the estimation of the vehicle’s three-dimensional position. This mode allows operation with six anchors but can only estimate the position of a single tag in each trial, making it unsuitable for swarm operations [
11]. The TDoA 2 and TDoA 3 modes operate similarly, where the anchors continuously send synchronization packets to the tags. The difference between the two modes lies in the fact that in TDoA 2, the packets are sent at fixed intervals, while in TDoA 3, the packet sending is randomized, making it slightly noisier than the other two modes [
11]. For this project, the TDoA 2 mode was chosen due to its ability to support swarm flights and its better performance compared to TDoA 3. A distinctive aspect of LOCO is that all the necessary information to calculate the location is contained in the tag, allowing the position to be estimated onboard the CF2 itself.
2.3. Gas Sensor
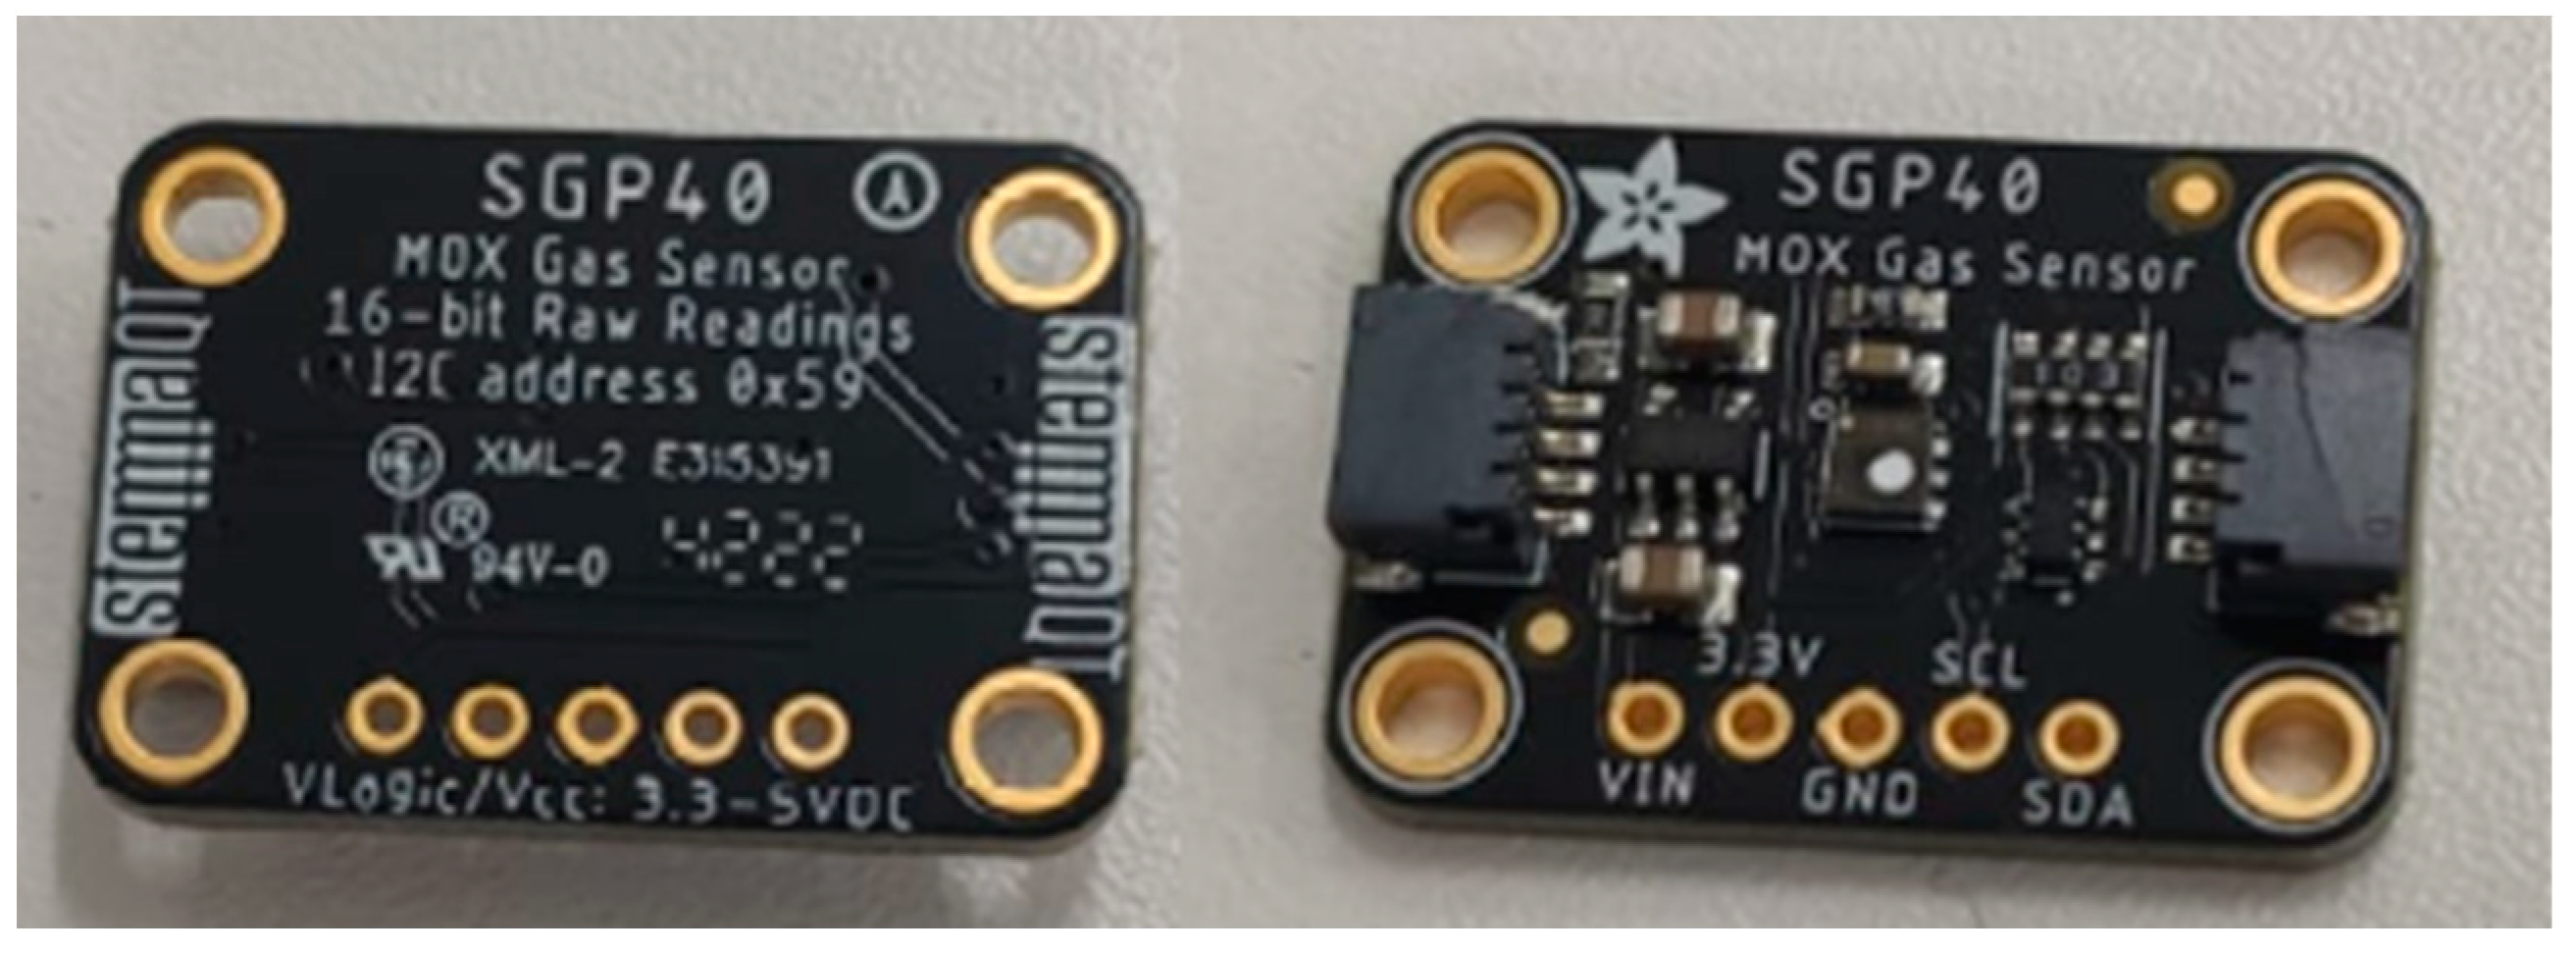
Due to the physical limitations of payload capacity and autonomy of the CF2, the choice of the gas sensor used in the project was restricted to those that meet three criteria: low energy consumption, low weight, and short response and recovery time. For this project, the MultiPixel SGP40 gas sensor, manufactured by Sensirion, was selected. The SGP40 is a semiconductor metal oxide (MOX) gas sensor used for indoor air quality (IAQ) measurements. The SGP40 gas sensor can be hosted by any processor or microcontroller with an I2C communication bus. It is very small with package dimensions of (2.44 × 2.44 × 0.85 mm
3) and consumes a low power rate of ≈8.58 mW [
15]. Therefore, the choice of the SGP40 gas sensor is due to its ability to identify TVOC components present in the environment and meet all the necessary criteria to be embedded in the CF2, besides being the most updated version provided by the manufacturer.
2.4. CF2 Communication Interface with the Gas Sensor
To streamline the implementation and enhance communication with the CF2, a dedicated communication board was acquired. Equipped with pre-integrated circuits designed to facilitate interaction between the sensor component and the microprocessor of the CF2, the I2C communication board, as depicted in
Figure 4, integrates with the SGP40 gas sensor and boasts dimensions of 27 × 20 mm.
Noteworthy are the additional advantages this board offers for harmonious CF2 integration. These encompass the availability of pins and connectors, the incorporation of a voltage regulator, and signal leveling mechanisms that accommodate both 3.3 V and 5 V systems. This design feature ensures compatibility with the power supply provided by the CF2. Communication with the sensor occurs through an I2C interface and operates in parallel with the tag of the local positioning system, eliminating the need for pull-up resistors. The gas sensor, integrated into the aircraft along with the positioning system tag, can be seen in
Figure 5.
An essential consideration during the integration of the communication interface into CF2 revolves around its mounting position. For this study, the decision was made to affix the sensor to the upper section of the vehicle’s body, positioned directly above its center of gravity. This choice stems from the advantageous influence of the propeller-induced air currents, facilitating the optimal conveyance of VOC molecules present in the atmosphere to the sensor’s surface. Beyond this aspect, the selection of the upper placement provides benefits concerning assembly and disassembly, owing to the enhanced simplicity in establishing connections with the vehicle. It is noteworthy that within this same upper region of the vehicle, a local positioning system tag is also installed. Consequently, this strategic arrangement of both the sensor and the local positioning system tag significantly enhances VOC detection efficacy, while concurrently streamlining maintenance procedures and integration with the vehicle.
To establish communication between the sensor and the CF2, changes were made to the vehicle’s firmware. The manufacturer’s provided framework was used, and the script was designed following the communication instructions outlined in the sensor’s data sheet. The SGP40 chip provides a raw digital signal (SRAW_VOC) that is sensitive to most VOC gases commonly present in indoor environments and is proportional to the logarithm of the sensor material’s resistance. The code was developed to retrieve this measurement at a frequency of 1 Hz.
About integrate the gas sensor communication, a C program was developed and embedded into the Crazyflie 2.1 firmware microcontroller through the inclusion of a deck driver. This program is responsible for initializing the SGP40 sensor, periodically reading sensor data, verifying the integrity of these data using the CRC8 checksum, and recording the results. This integration is an integral part of the Crazyflie 2.1 firmware, which aims to monitor air quality and record data for future analysis.
Another application developed was the Flight Path Computer Application. To achieve autonomous flight and data collection, a Python script was meticulously crafted. This script communicates with a Crazyflie drone using the “cflib” library, allowing precise control of the drone along a flight path. The application encompasses several critical components. First, it defines the URI, a specific string indicating the Crazyflie with which the program establishes a connection. The script includes functions for comprehensive Crazyflie control, encompassing essential features such as the position estimator and a dedicated function for resetting the drone’s position estimator. Moreover, the program incorporates high-level Crazyflie commands, streamlining control through directives like takeoff, landing, and precise position adjustments. Central to its operation is the primary function responsible for executing the flight sequence. This function strategically sets destination points and orchestrates the drone’s movement between them, effectively utilizing the high-level commander interface. Crucially, the program’s main execution thread ensures seamless functionality as the primary application. It meticulously initializes Crazyflie drivers, establishes a Crazyflie instance, and executes essential functions for drone control. In essence, this designed program serves as an efficient supervisor for Crazyflie 2.1. It adeptly executes flight sequences, capturing valuable position and gas sensor data with precision and accuracy during each flight.
2.5. Experimental Design
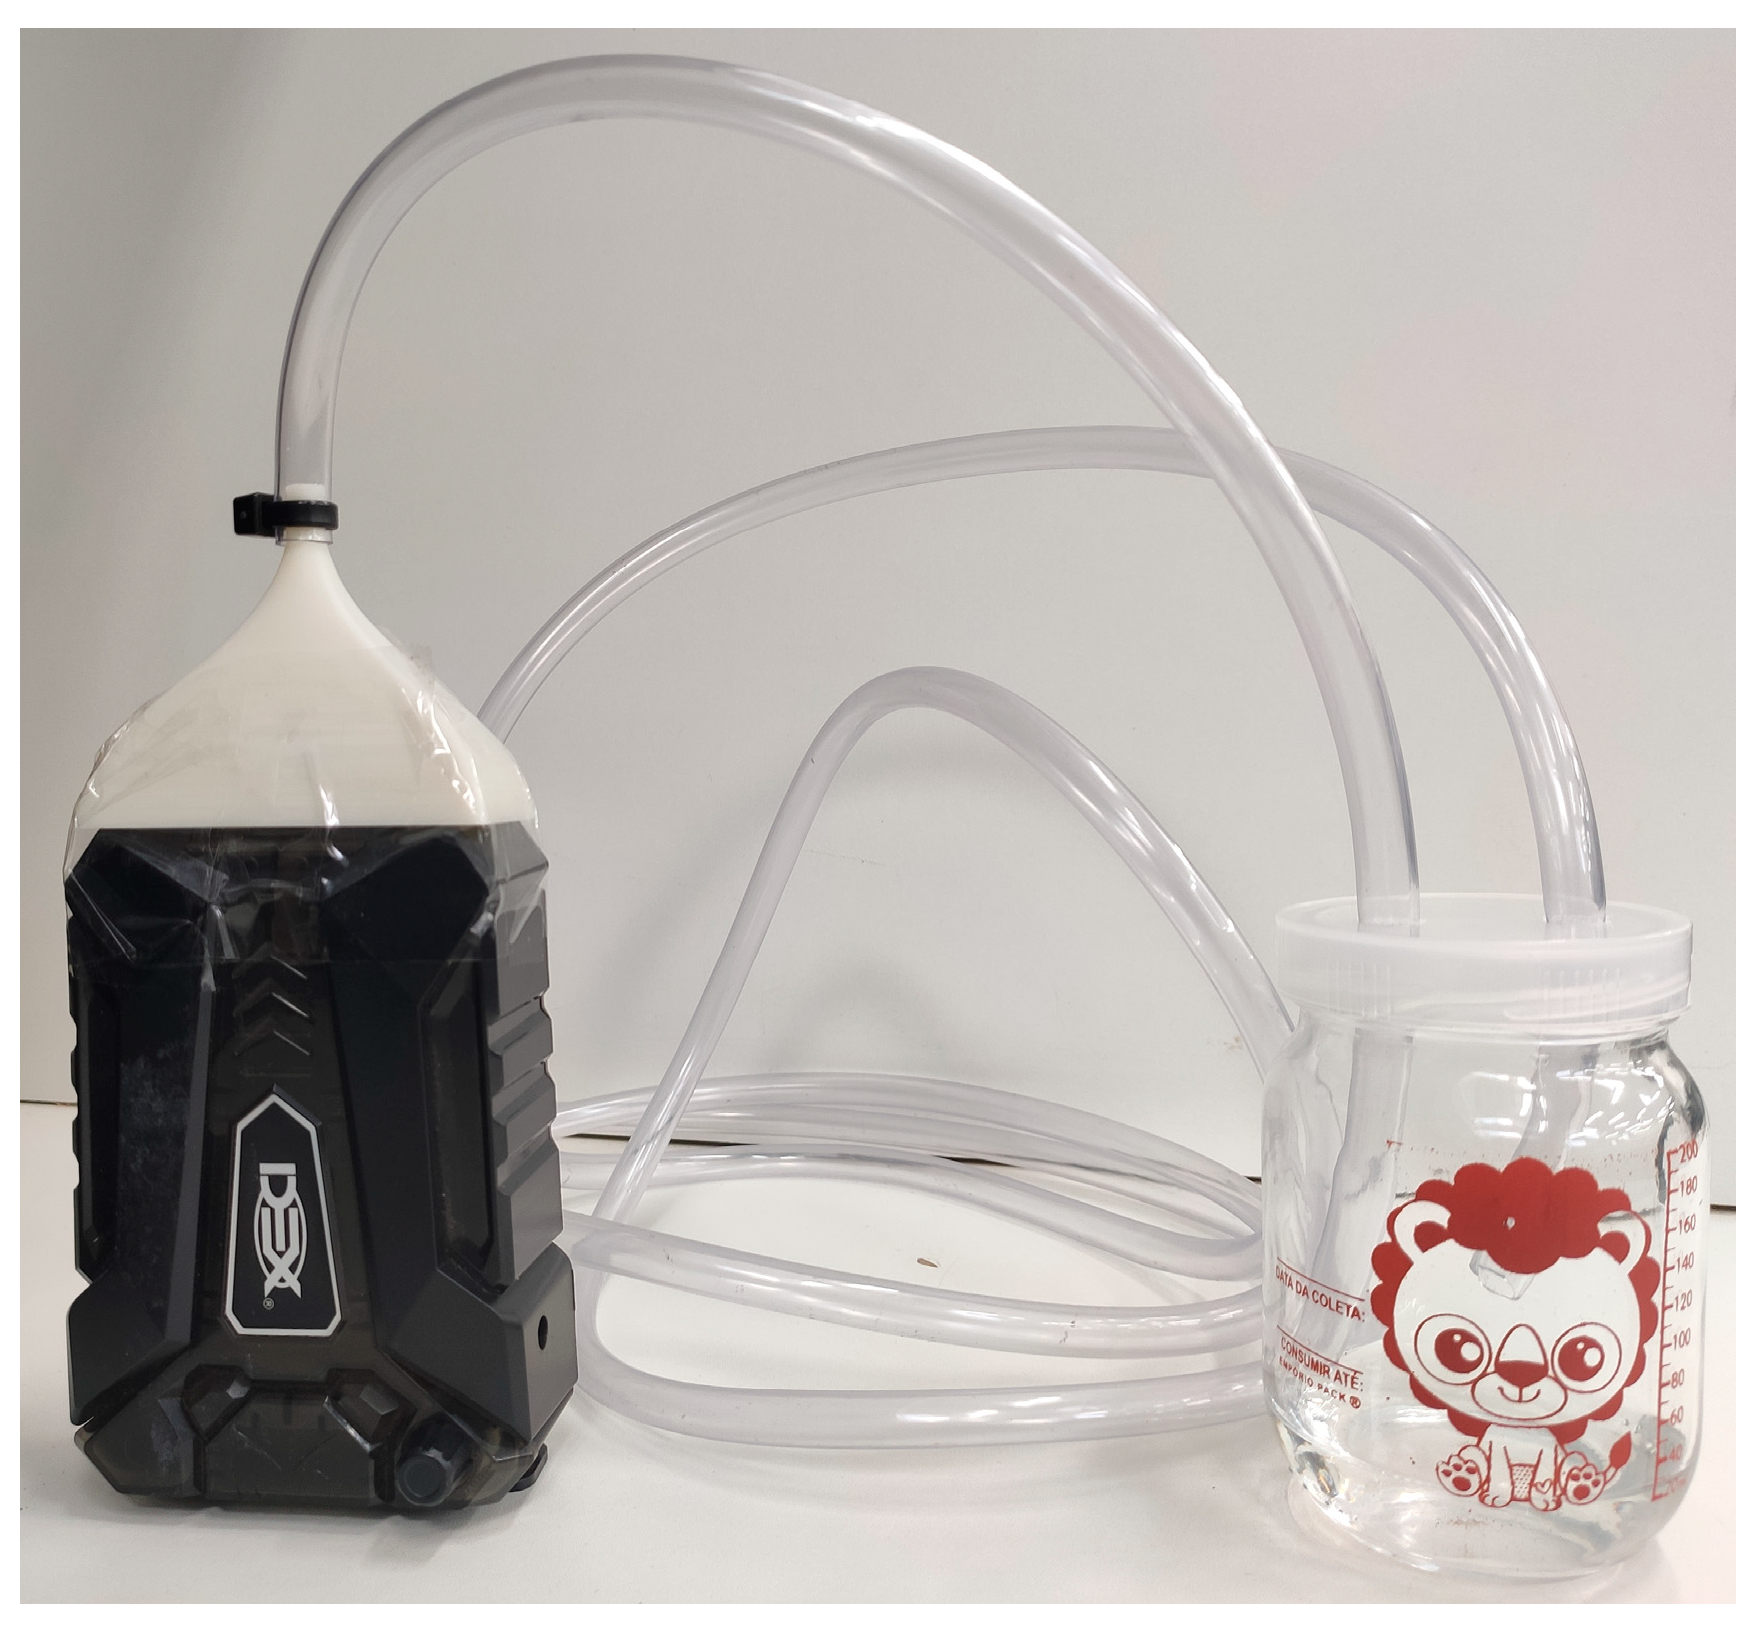
The gas to be detected during the experiments originates from the evaporation of absolute ethanol stimulated by air bubbling. Ethanol was chosen due to its easy availability, relative safety, good evaporation properties under ambient conditions, and easy detectability by the SGP40 sensor. Liquid ethanol was stored in a glass container with a volume of approximately 200 mL. The bubbling system was designed to increase the evaporation of ethanol. The complete setup to generate the odor source consists of a fan, an external cell phone battery for powering the fan, a 3D-printed adapter to direct the fan’s airflow into the ethanol, and a transparent hose to direct the ethyl alcohol vapor flow.
Figure 6 illustrates the fully assembled odor source system.
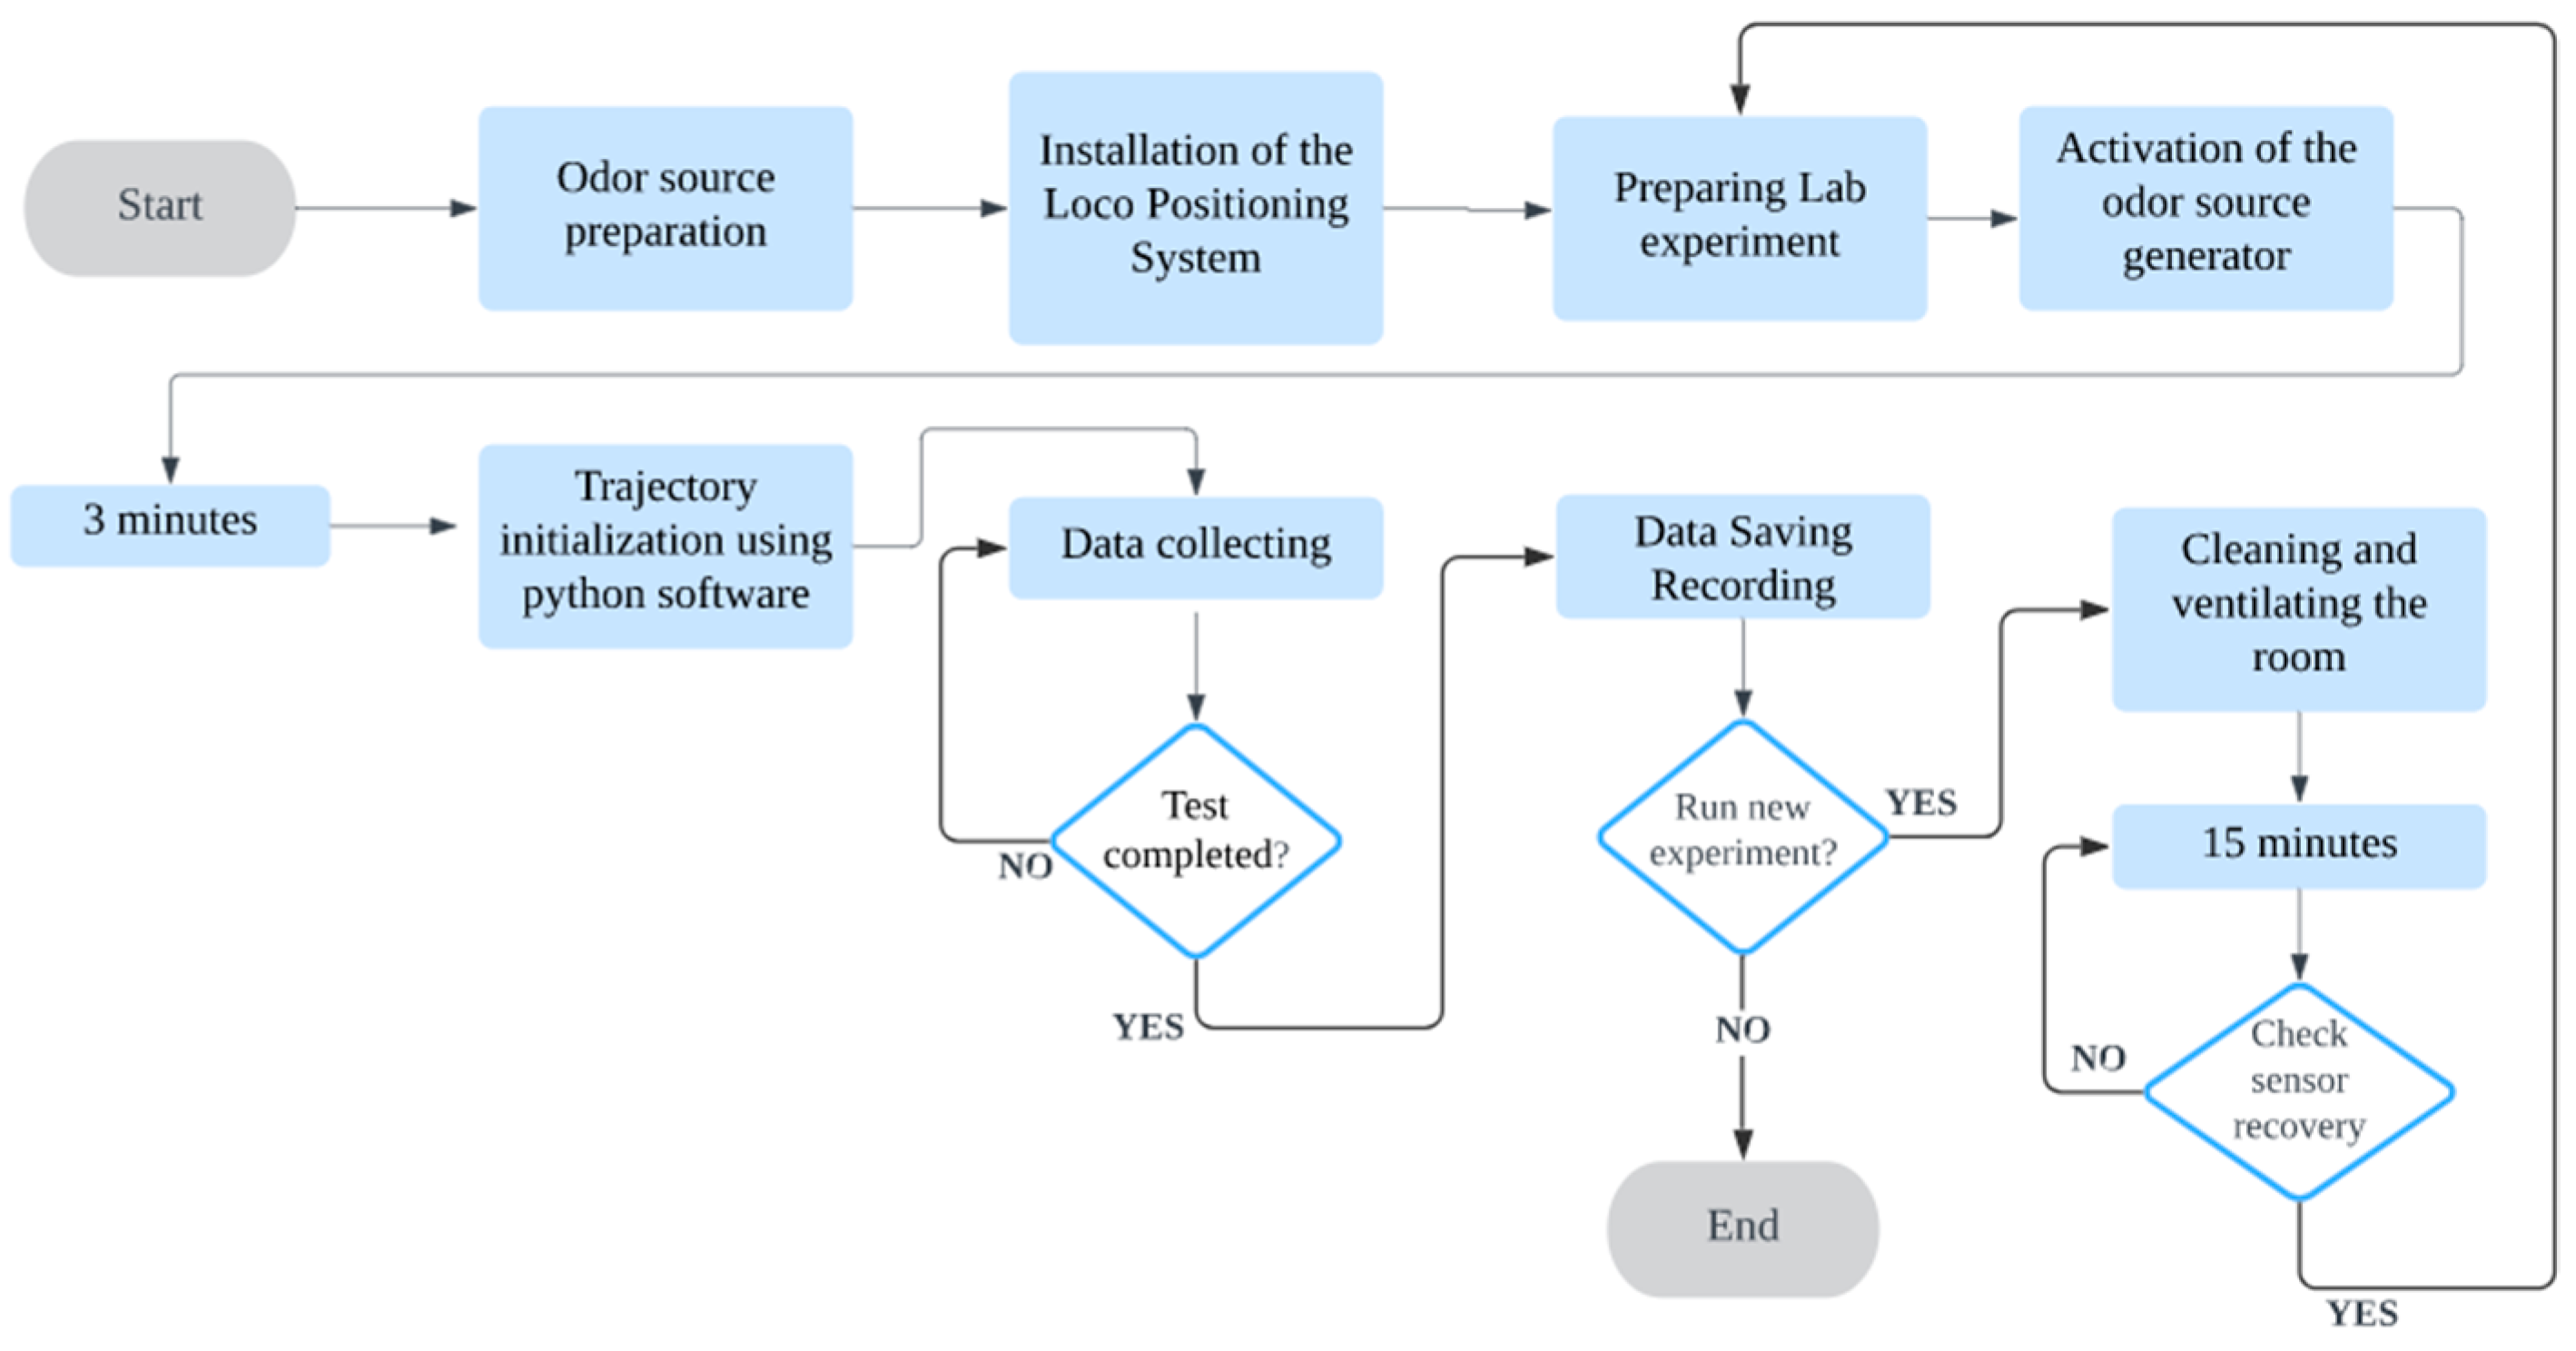
The concentration of ethyl alcohol in the air-alcohol mixture generated by the odor source is unknown. The localization system was installed within a limited test area of 2.7 m in X, 2.7 m in Y, and 2.5 m in height. Before starting the flight experiment, the fan of the odor source was activated for 3 min to allow the ethyl alcohol vapor to travel through the 3 m long hose, forming a plume of ethyl alcohol vapor around the air outlet, making it more easily detectable by the sensor. This mechanism is responsible for causing bubbling in the liquid ethyl alcohol and facilitating its evaporation. During the data collection process, windows and doors remained closed, and the room’s ventilation system was deactivated. Between each experiment, a minimum time of 15 min was considered for cleaning and ventilation. During this period, the door was opened, and the air conditioning was set to ventilation mode, releasing a significant portion of the contaminant gas from the environment in preparation for the next experiment. To ensure proper recovery of the gas sensors, before each experiment, it was tested whether the sensor signal returned to a level close to the baseline. The methodology described is delineated within the workflow diagram presented in
Figure 7.
Control and trajectory planning were seamlessly managed via the cfclient interface. This Python-based interface, commonly referred to as the Python client, serves as the central hub for commanding the CF2 drone, facilitating tasks such as firmware updates, parameter configuration, and data logging.
2.6. Sensor Response Characterization
The use of metal oxide semiconductor (MOX) sensors has become popular in quadcopters due to their small size, high sensitivity, low cost, and capability to detect a wide variety of gases. However, these sensors face a critical challenge, as defined by [
7]: the long recovery time (10 to 30 s) compared to the rapid temporal resolution of the chemical stimulus (in the order of milliseconds). Additionally, MOX sensors exhibit signal drift, which manifests as a permanent error, limiting their lifespan in long-duration applications. In other words, when the sensor operates continuously for more than 12 h, it experiences a gradual and unpredictable variation in signal response even under constant exposure to the same conditions [
16].
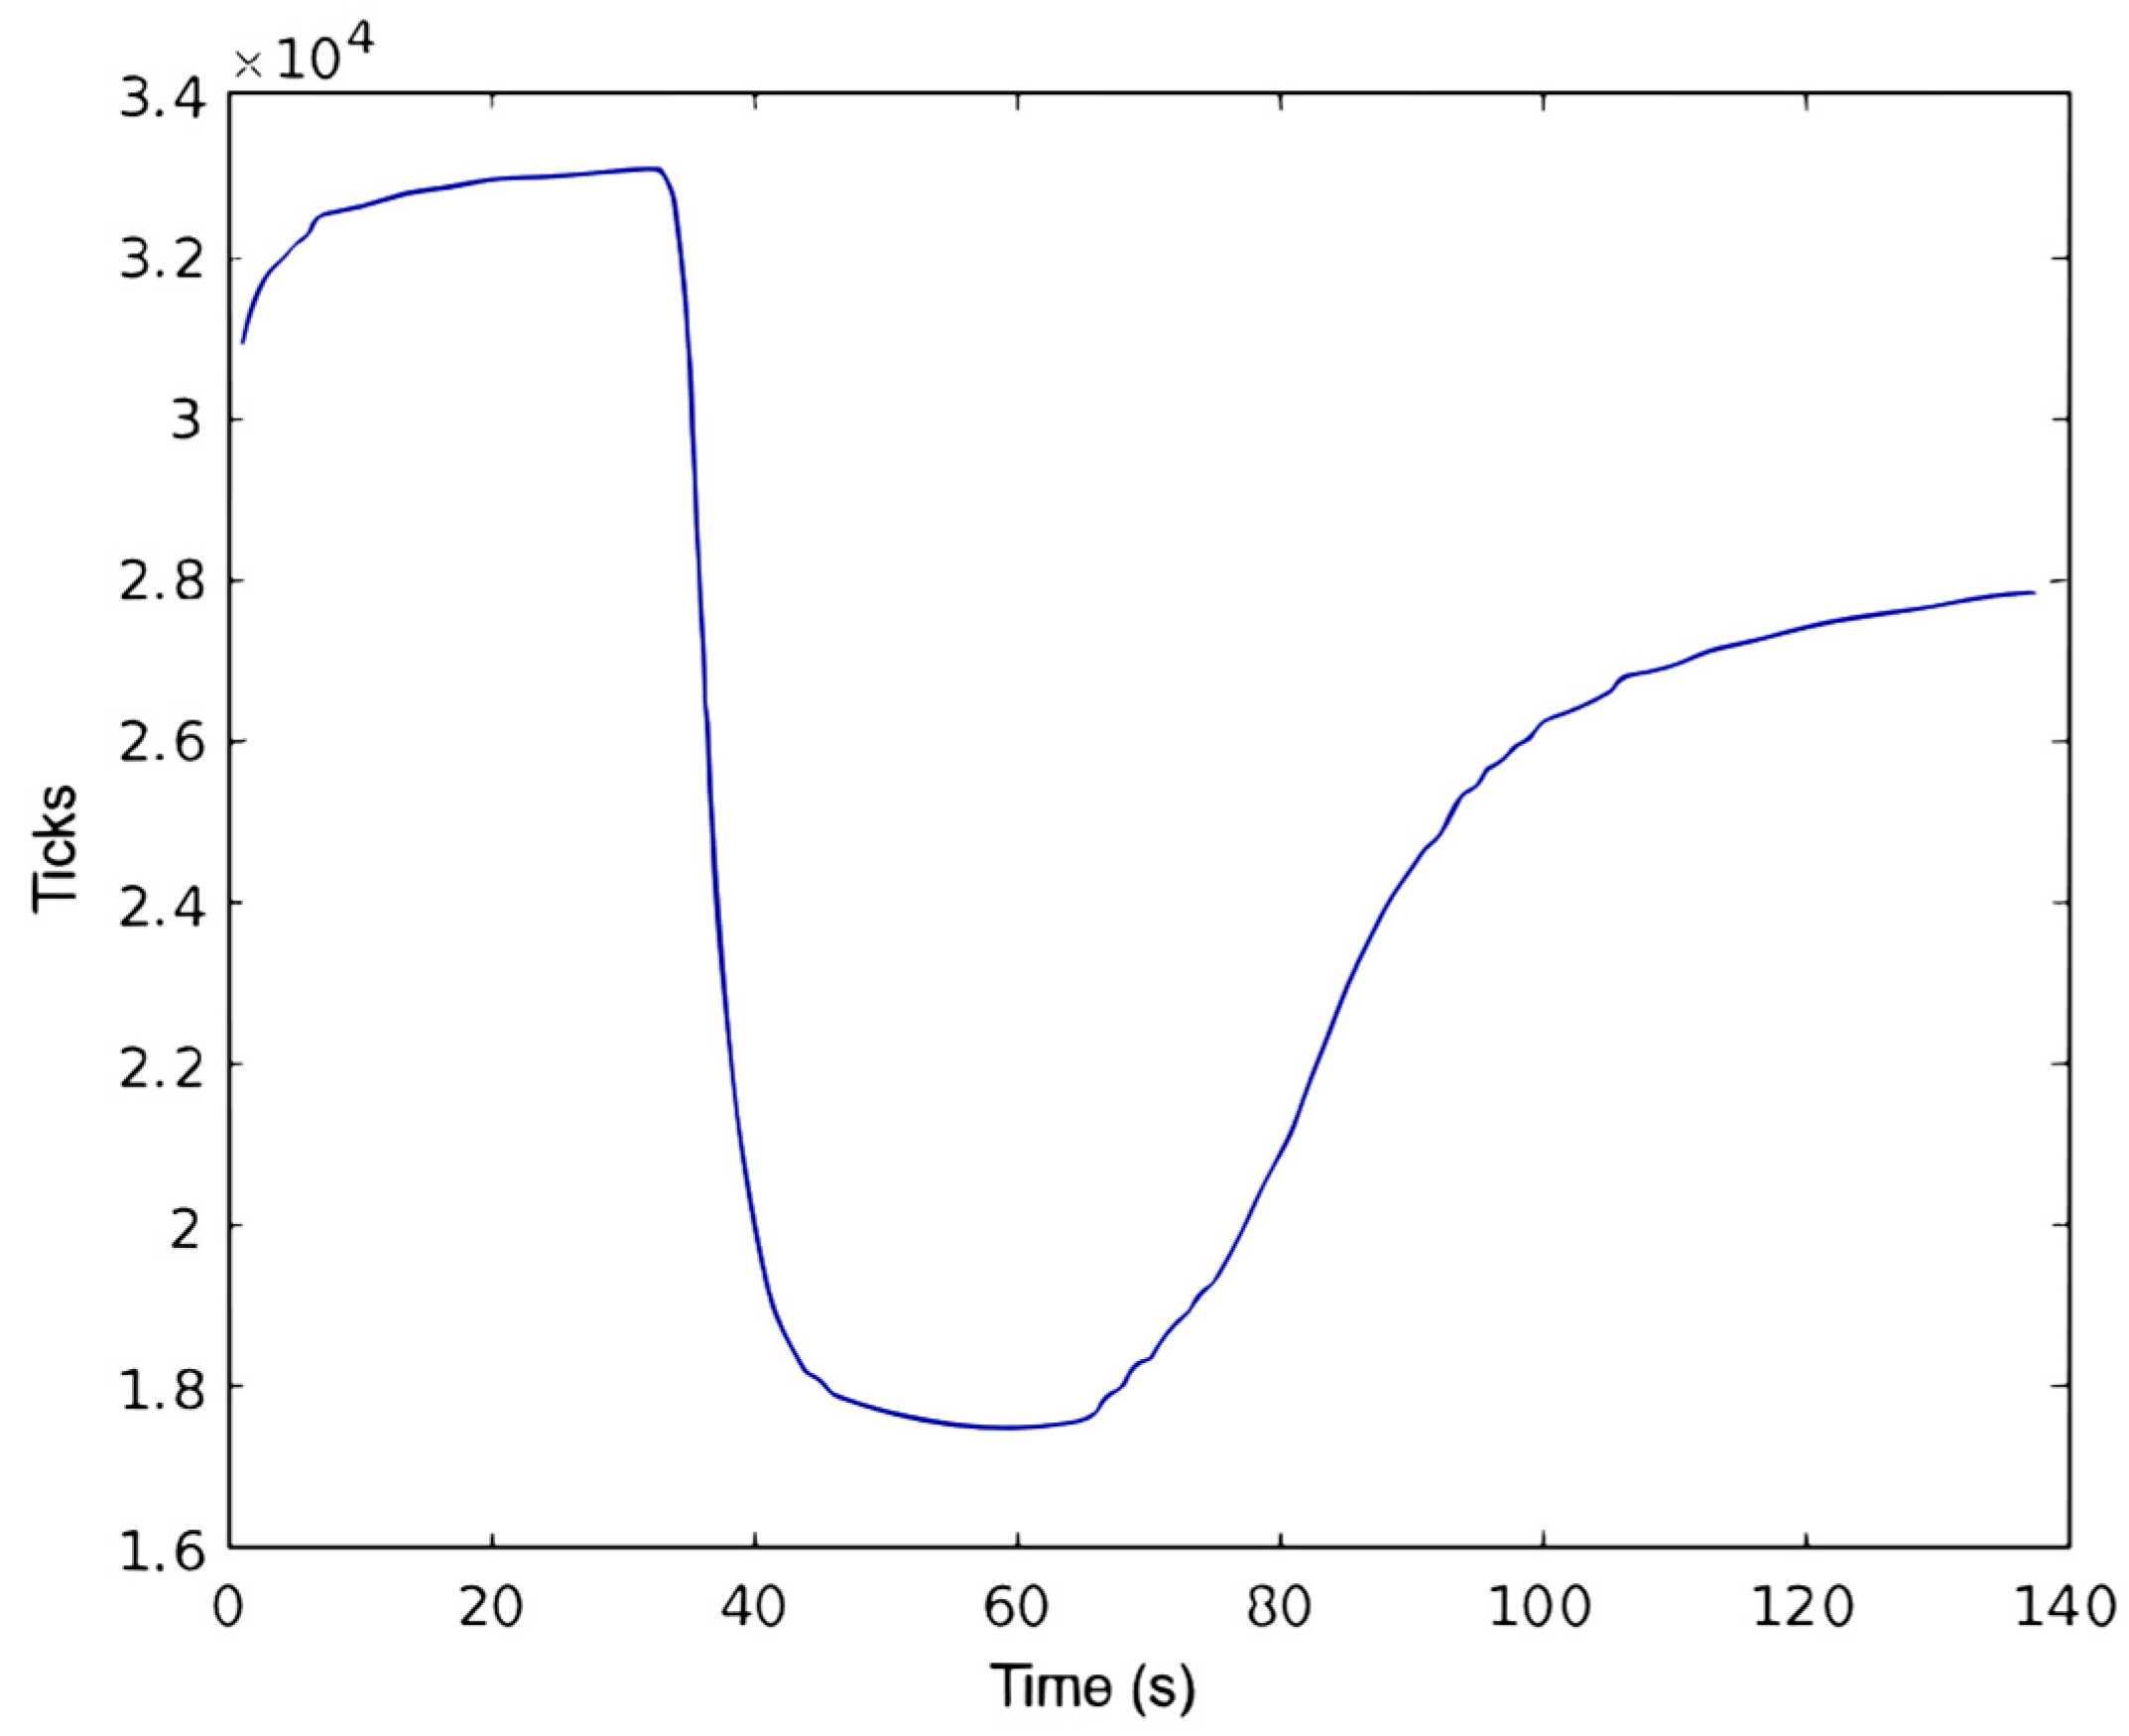
Therefore, a preliminary analysis was conducted to observe how the sensor response is affected by exposure to ethyl alcohol vapor before conducting the drone and gas sensor experiments in flight. The sensor was brought close to the mouth of a glass container containing 50 mL of absolute ethanol for approximately 20 s. The data observed during this procedure can be seen in
Figure 8.
During the initial sensor reading, a notable decrease from 32.892 to 17.748 (the lowest achieved in this experiment) is observed in response to exposure to ethyl alcohol vapor. This sharp decline in sensor output clearly indicates the sensor’s sensitivity to ethyl alcohol, demonstrating its ability to detect and respond to this specific substance. Furthermore, it is important to note that the signal read by the sensor decreases when exposed, meaning it is inversely proportional to the concentration of ethyl alcohol present in the environment. The SGP40’s digital output signal, presented as a 16-bit value, is denoted as “ticks”. This signal, proportional to the logarithm of the sensing layer’s resistance, reflects the sensor’s estimation of ambient VOC concentrations within a range of 0 to 65,535 units [
15]. A quantitative correlation between ticks and actual VOC concentrations can be established through a calibration procedure using reference gases with known concentrations. About time response, the sensor demonstrates almost instant detection of the vapor’s presence, taking only 5 s to reach the minimum reading. After moving the sensor away from the proximity of ethyl alcohol vapor, there was a noticeable recovery in about 30 s, reaching a level slightly lower than the initial value before exposure to the gas. Subsequently, it was found that this recovery time can vary considerably depending on the TVOC concentration to which the sensor was exposed, requiring less time to recover from lower concentrations. This characterization test was essential to understand the values obtained by the signal read during exposure to the odor source.
2.7. Trajectory Planning
Mobile olfactory robotics involves two main tasks: locating the gas source and mapping its distribution. Algorithms for gas source localization are categorized into reactive plume tracking, plume modeling, or map-based approaches, typically considering a single source. On the other hand, gas distribution mapping strategies require complete exploration of the environment, and some studies consider multiple gas sources [
17].
Based on the flight characteristics and limitations of the CF2, as well as the variations observed in the SGP40 sensor’s sensitivity during tests conducted with both in conjunction, the following premises were established for trajectory planning:
(1) Detecting sources of ethyl alcohol at altitudes very close to the ground becomes quite challenging due to the tendency of ethyl alcohol to accumulate at the bottom of the environment. This characteristic is attributed to the relative density of absolute ethyl alcohol vapor, which is 1.6. Relative vapor density is defined as the ratio of the weight of the vapor to the weight of an equal volume of dry air under the same temperature and pressure conditions, explaining its higher concentration in the lower layers of the atmosphere [
18].
(2) The odor source generated by bubbling with air and directed with a hose helps to form a denser plume, concentrated near the gas exit point and less dispersed throughout the environment. This, in turn, facilitates the localization of this source.
(3) Under the conditions presented in this work, ethyl alcohol vapor is not released in sufficient quantity to disperse throughout the entire environment.
(4) The CF2 should preferably fly below the altitude of the odor source to take advantage of the downward airflow generated by the movement of the propellers and increase the likelihood of successful volatile compound detection.
(5) Being a nano quadcopter, it is important to be aware of the limitations of speed and the distance between programmed flight positions.
Based on these premises, the proposed trajectory consisted of following a sequence of pre-established points to cover the entire perimeter of the flight area smoothly, with gradual changes in elevation. This strategy aims to map gas concentration levels at different positions in the environment and then establish a relationship between sensor detection levels and the position of the odor source. The CF2 took 54 s to complete the trajectory under the mentioned conditions.
3. Results
Locating the odor source (OS) involves finding the position of a chemical source in an environment through a trail, also known as a plume, influenced by the wind. The challenge lies in the non-uniform dispersion of the odor, where the scent breaks into odor filaments, making it difficult to track it through the concentration gradient. The use of autonomous navigators (NAVs) for this task is complex due to these characteristics of dispersed odor [
2].
The focus lies in investigating the connection between the data acquired by the gas sensor during the flight and the source of the gas leak. To achieve this goal, a series of tests were performed, which involved mapping the dispersion of absolute ethyl alcohol vapor in the environment, as detailed in the Materials and Methods section.
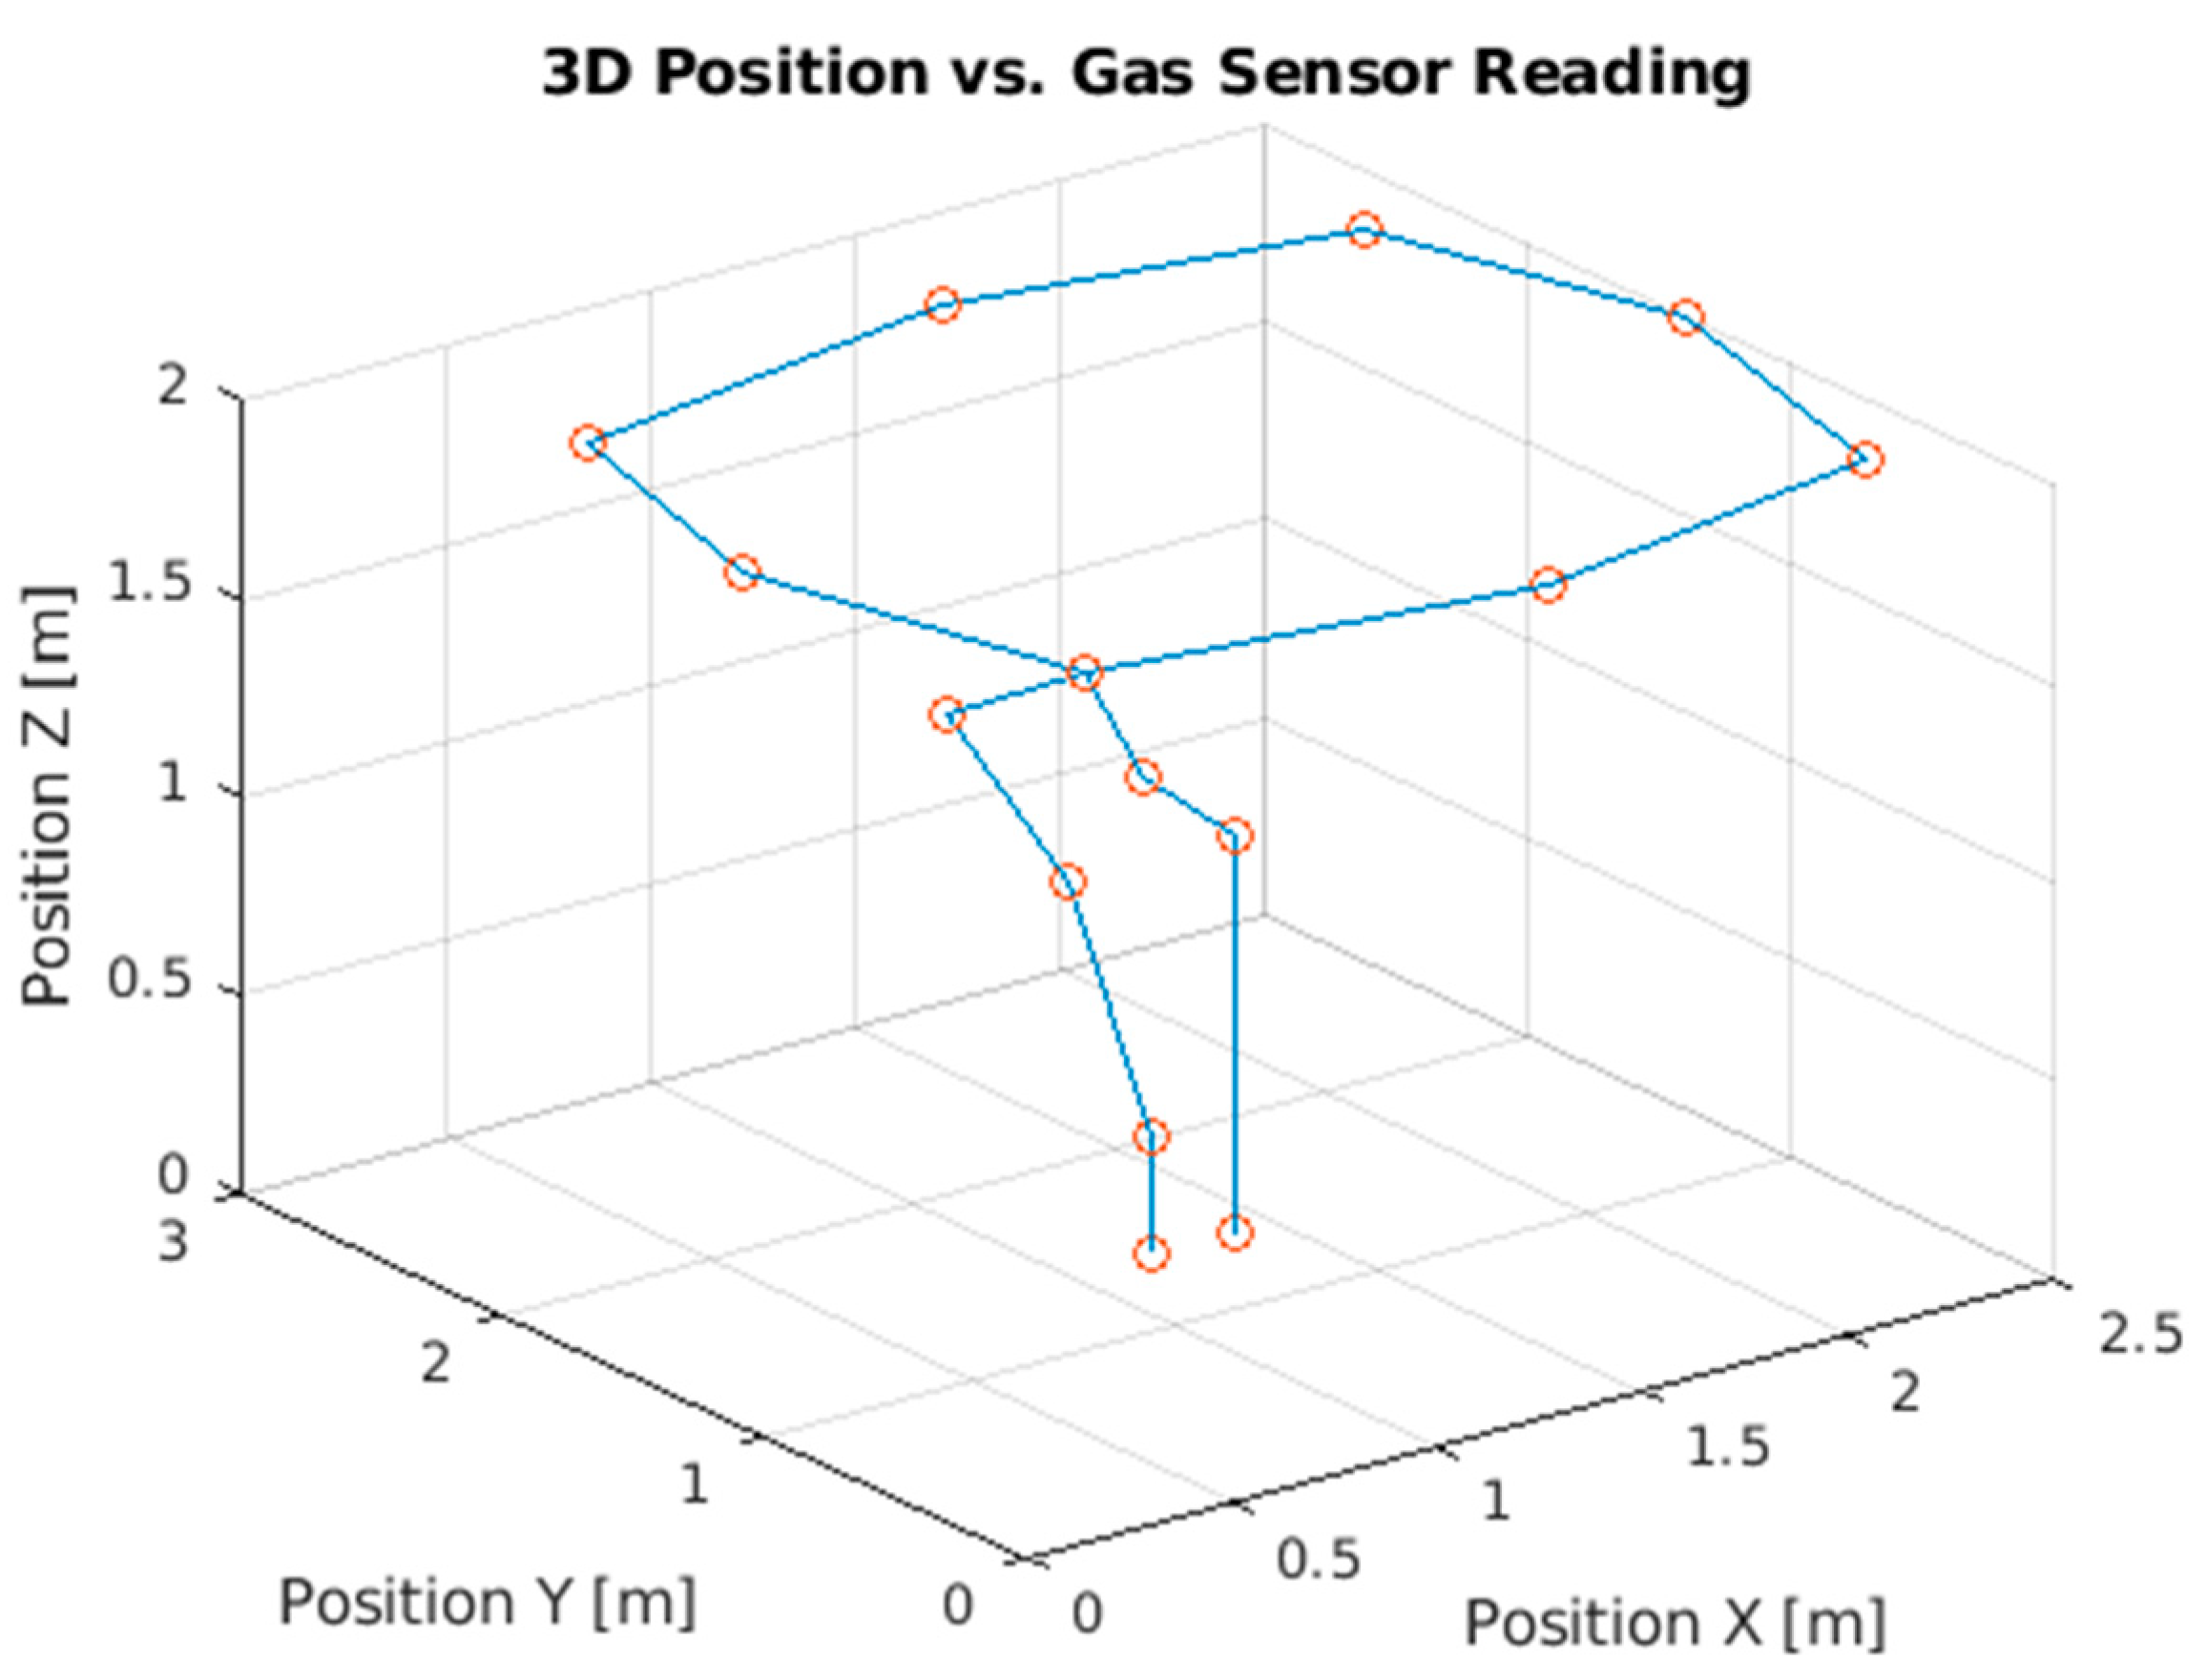
In theory, the ideal reconstruction of the gas distribution map (GDM) would be achieved through a UAV trajectory that covers the entire environment at low speed. However, the power constraints of nano quadcopters and practical considerations make flight time a limiting factor in selecting the optimal trajectory. Hence, in this experiment, a predefined route that covers all vertices of the test area was chosen. The planned route is depicted in
Figure 9. The red circles mark the positions that were sent as commands to the CF2 drone, and the planned route is marked in blue.
The CF2 was programmed to follow the trajectory with an average speed of 0.25 m/s, taking approximately 4 s to complete each position change.
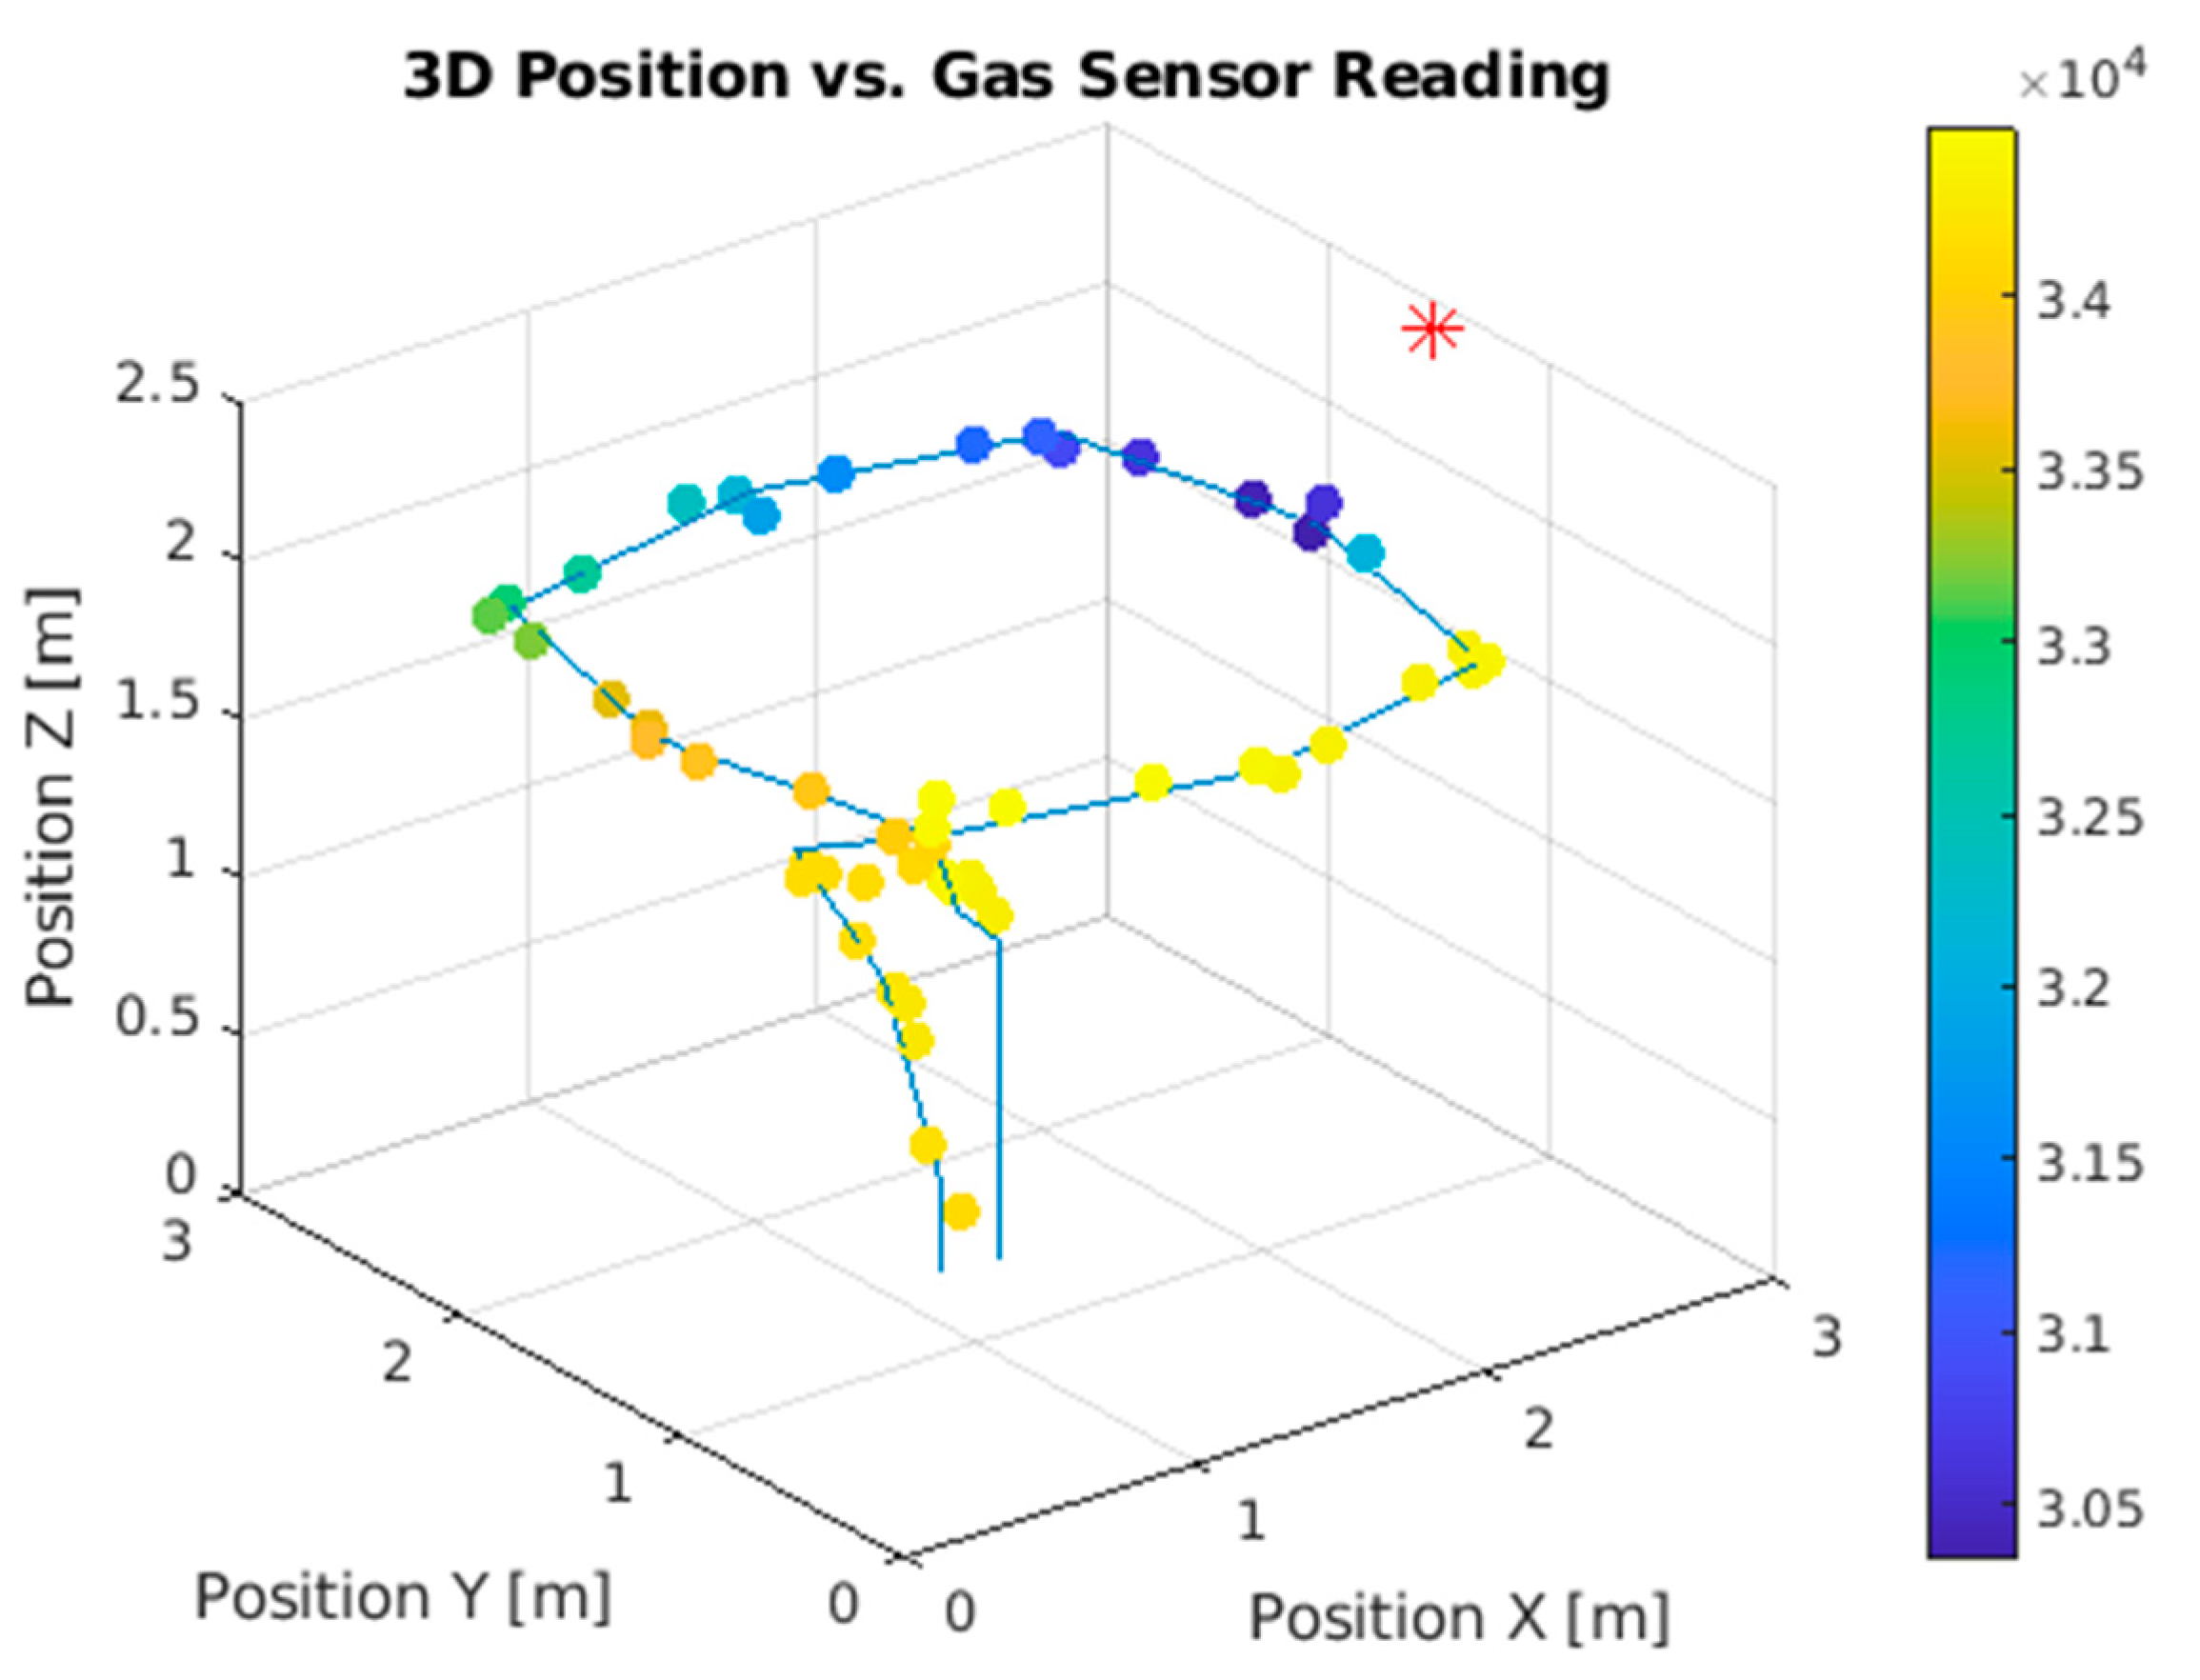
Figure 10 displays the results of Test 1 with the odor source positioned at (2.90, 1.40, 2.50) [x, y, z], and
Figure 11 exhibits the results of Test 1 with the odor source located at (1.35, 2.1, 2.50) [x, y, z]. The symbol “*”represents the location of the odor source in
Figure 10 and
Figure 11.
It is crucial to emphasize that the sensor’s performance exhibits an inverse relationship; hence, lower “ticks” values (16-bit value) are indicative of higher concentrations of ethanol.
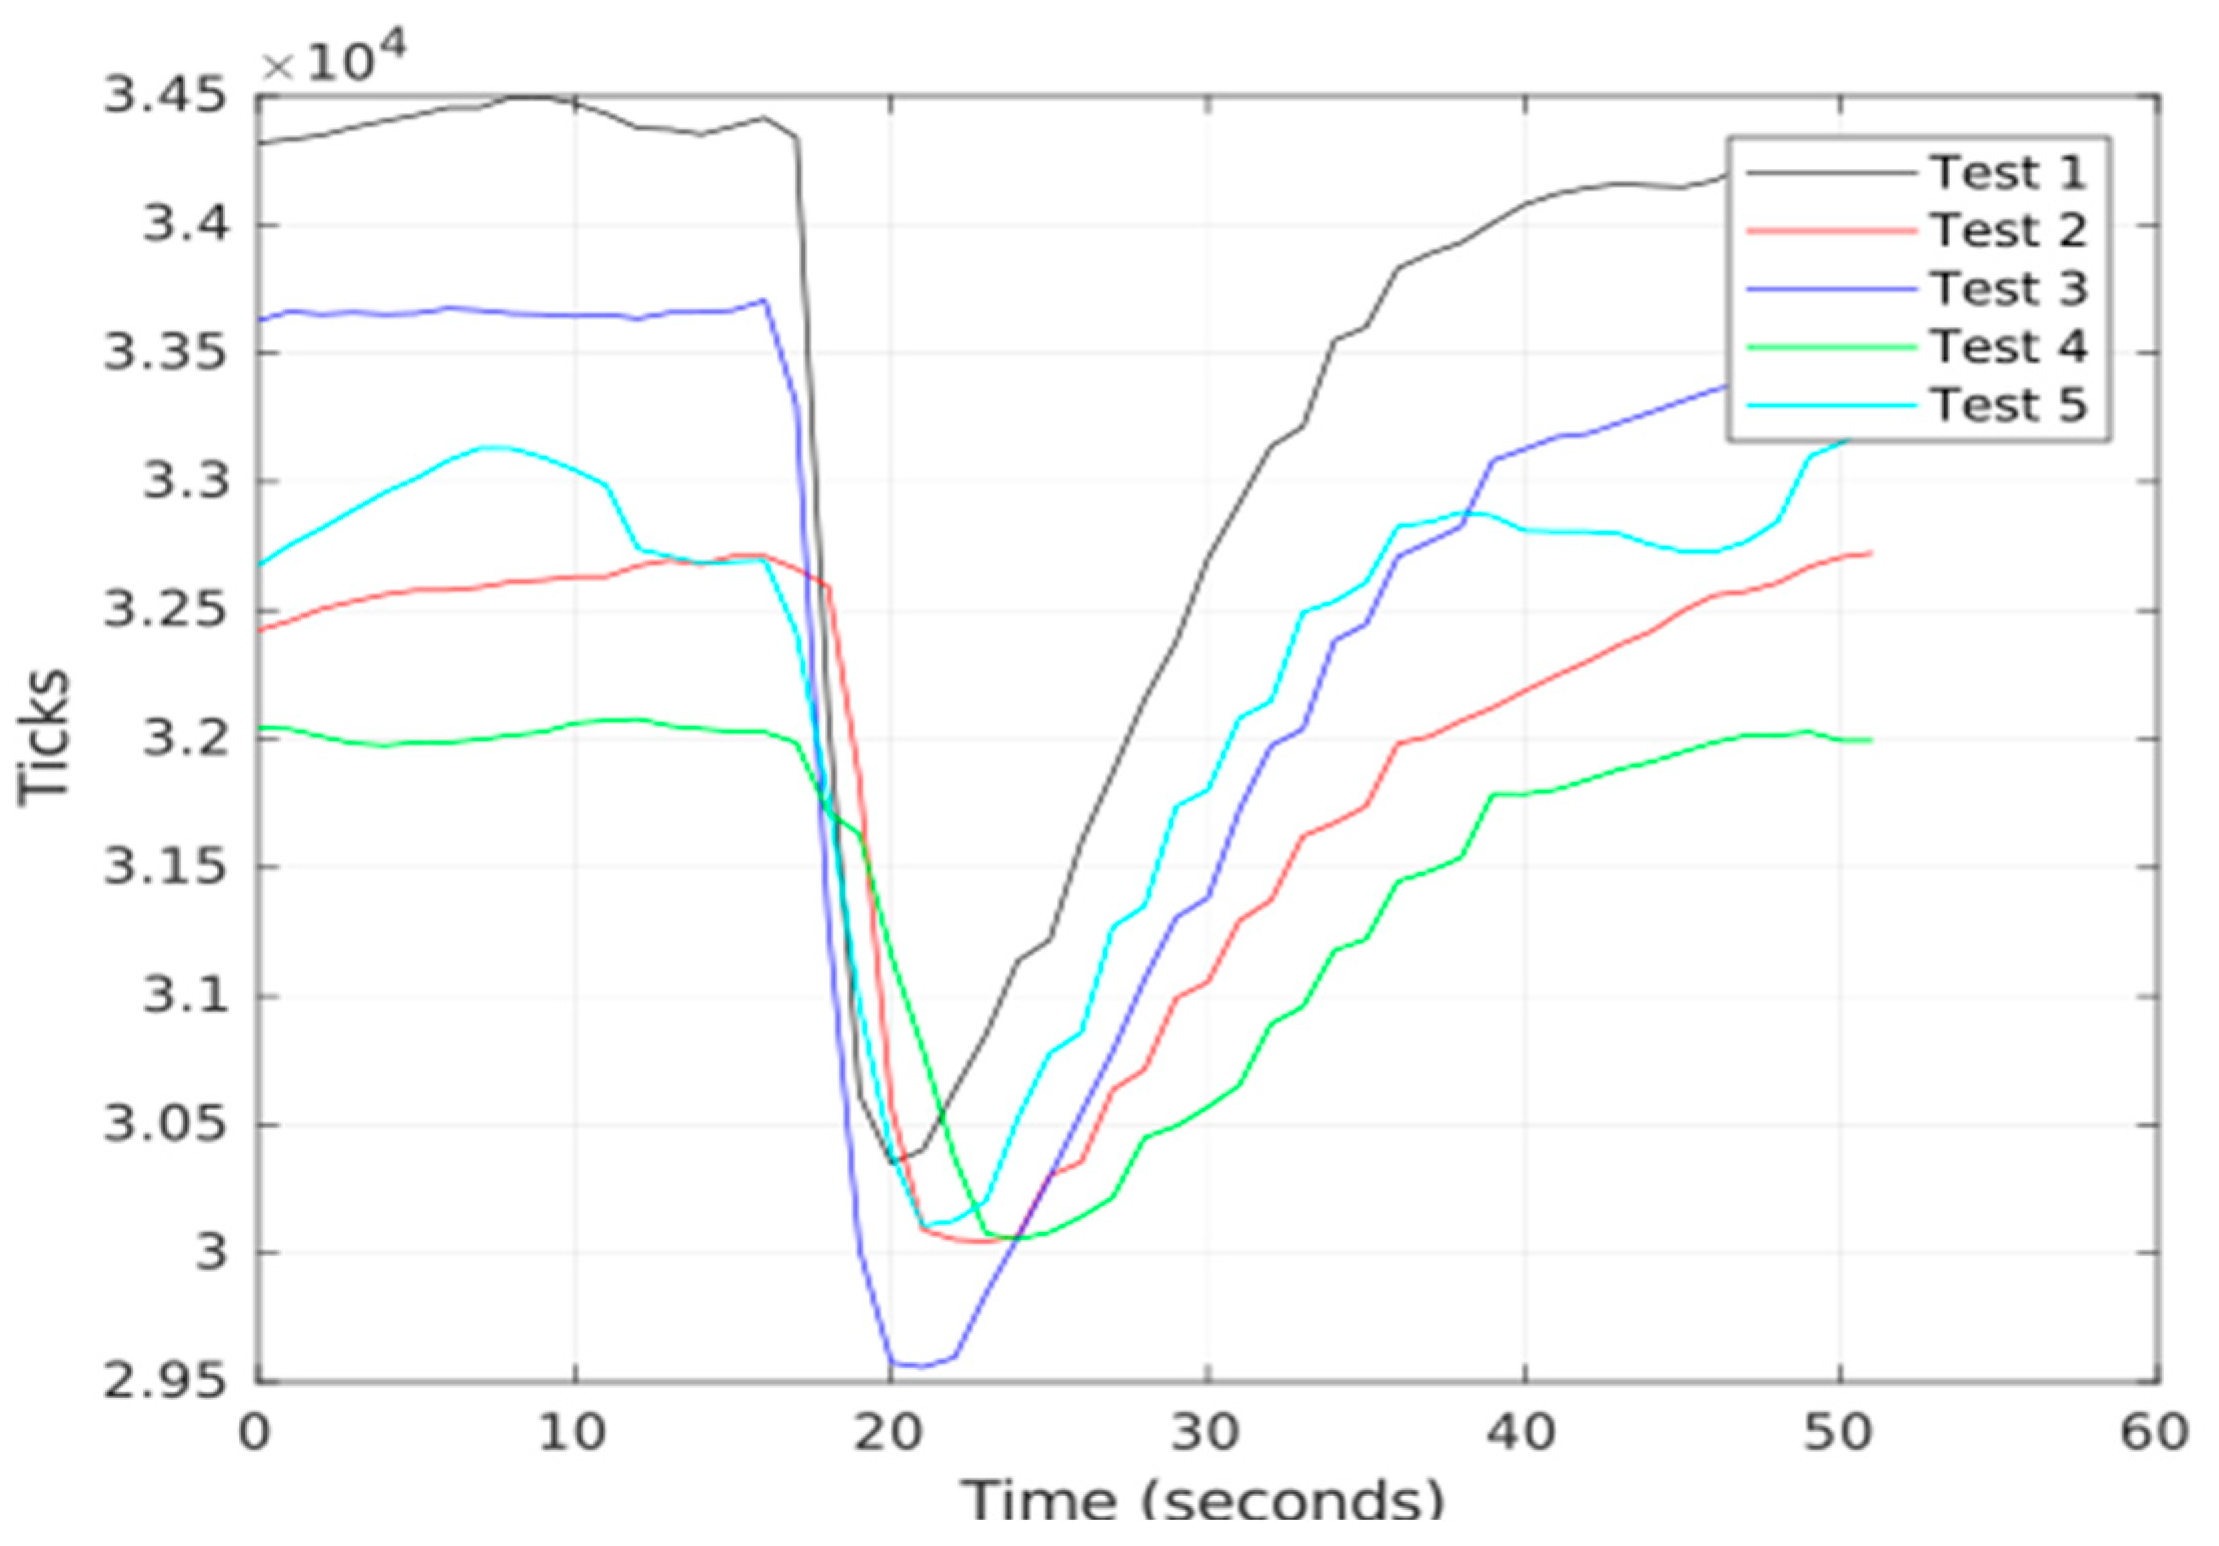
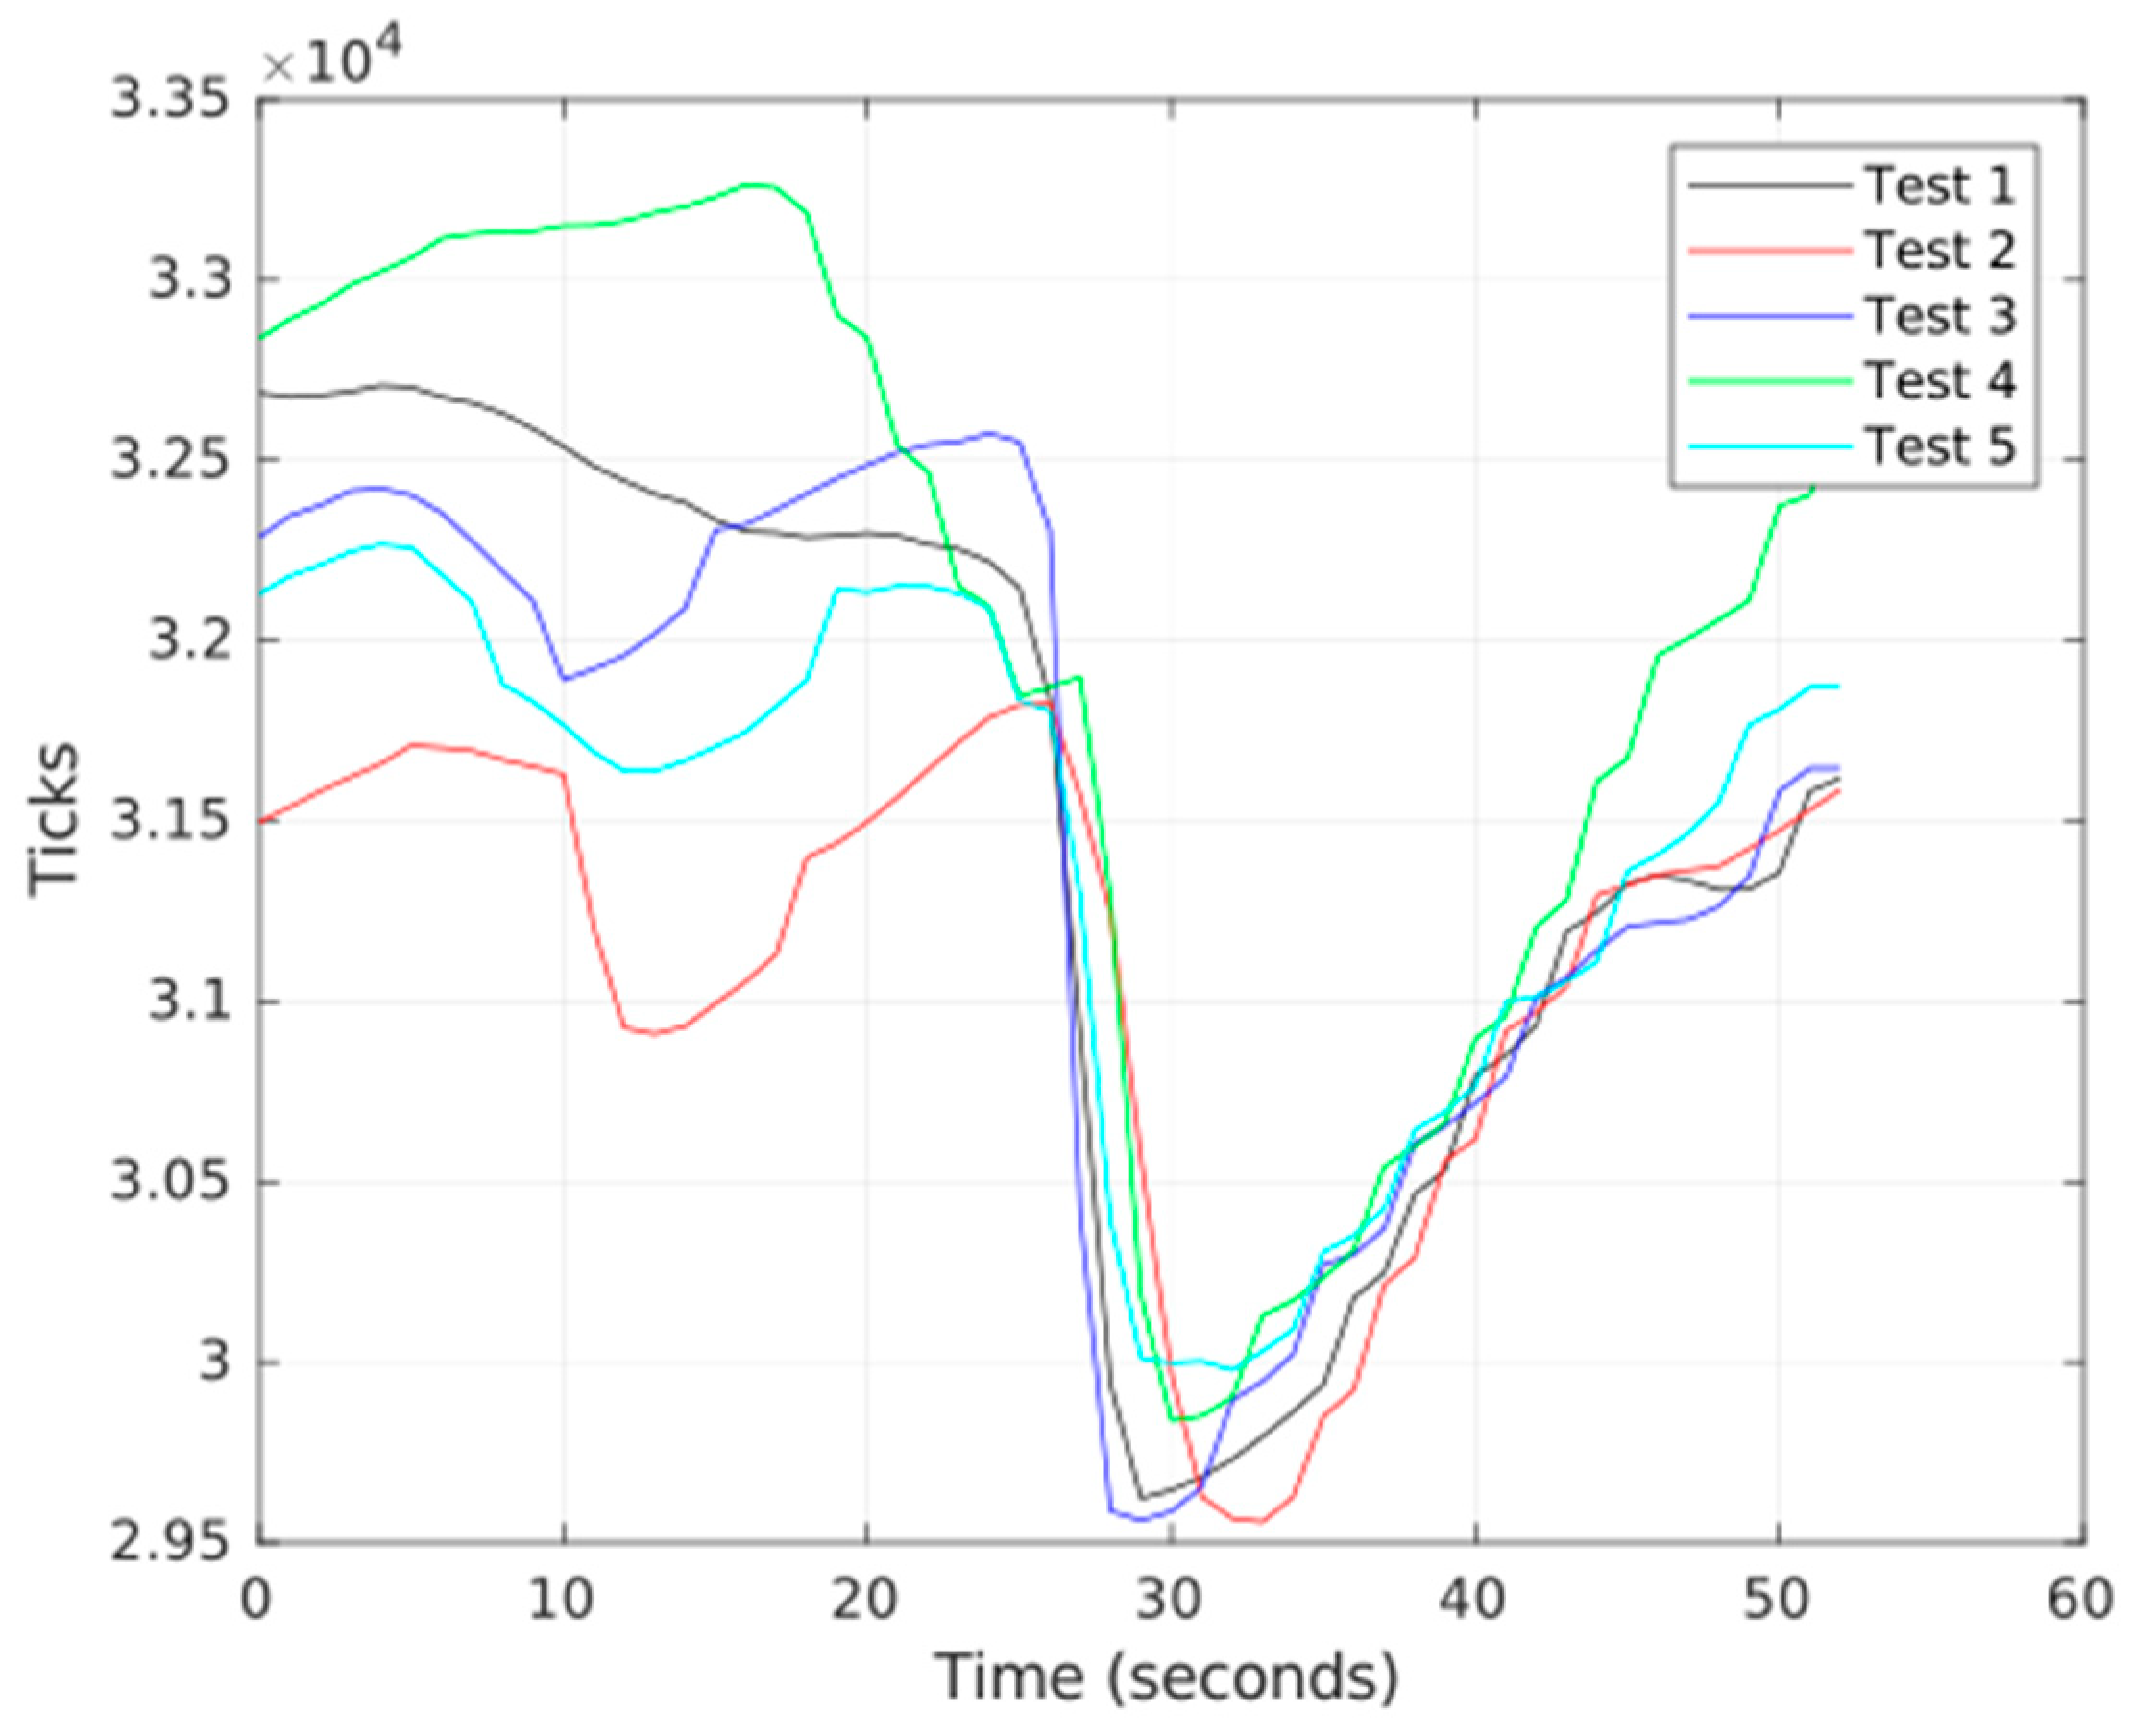
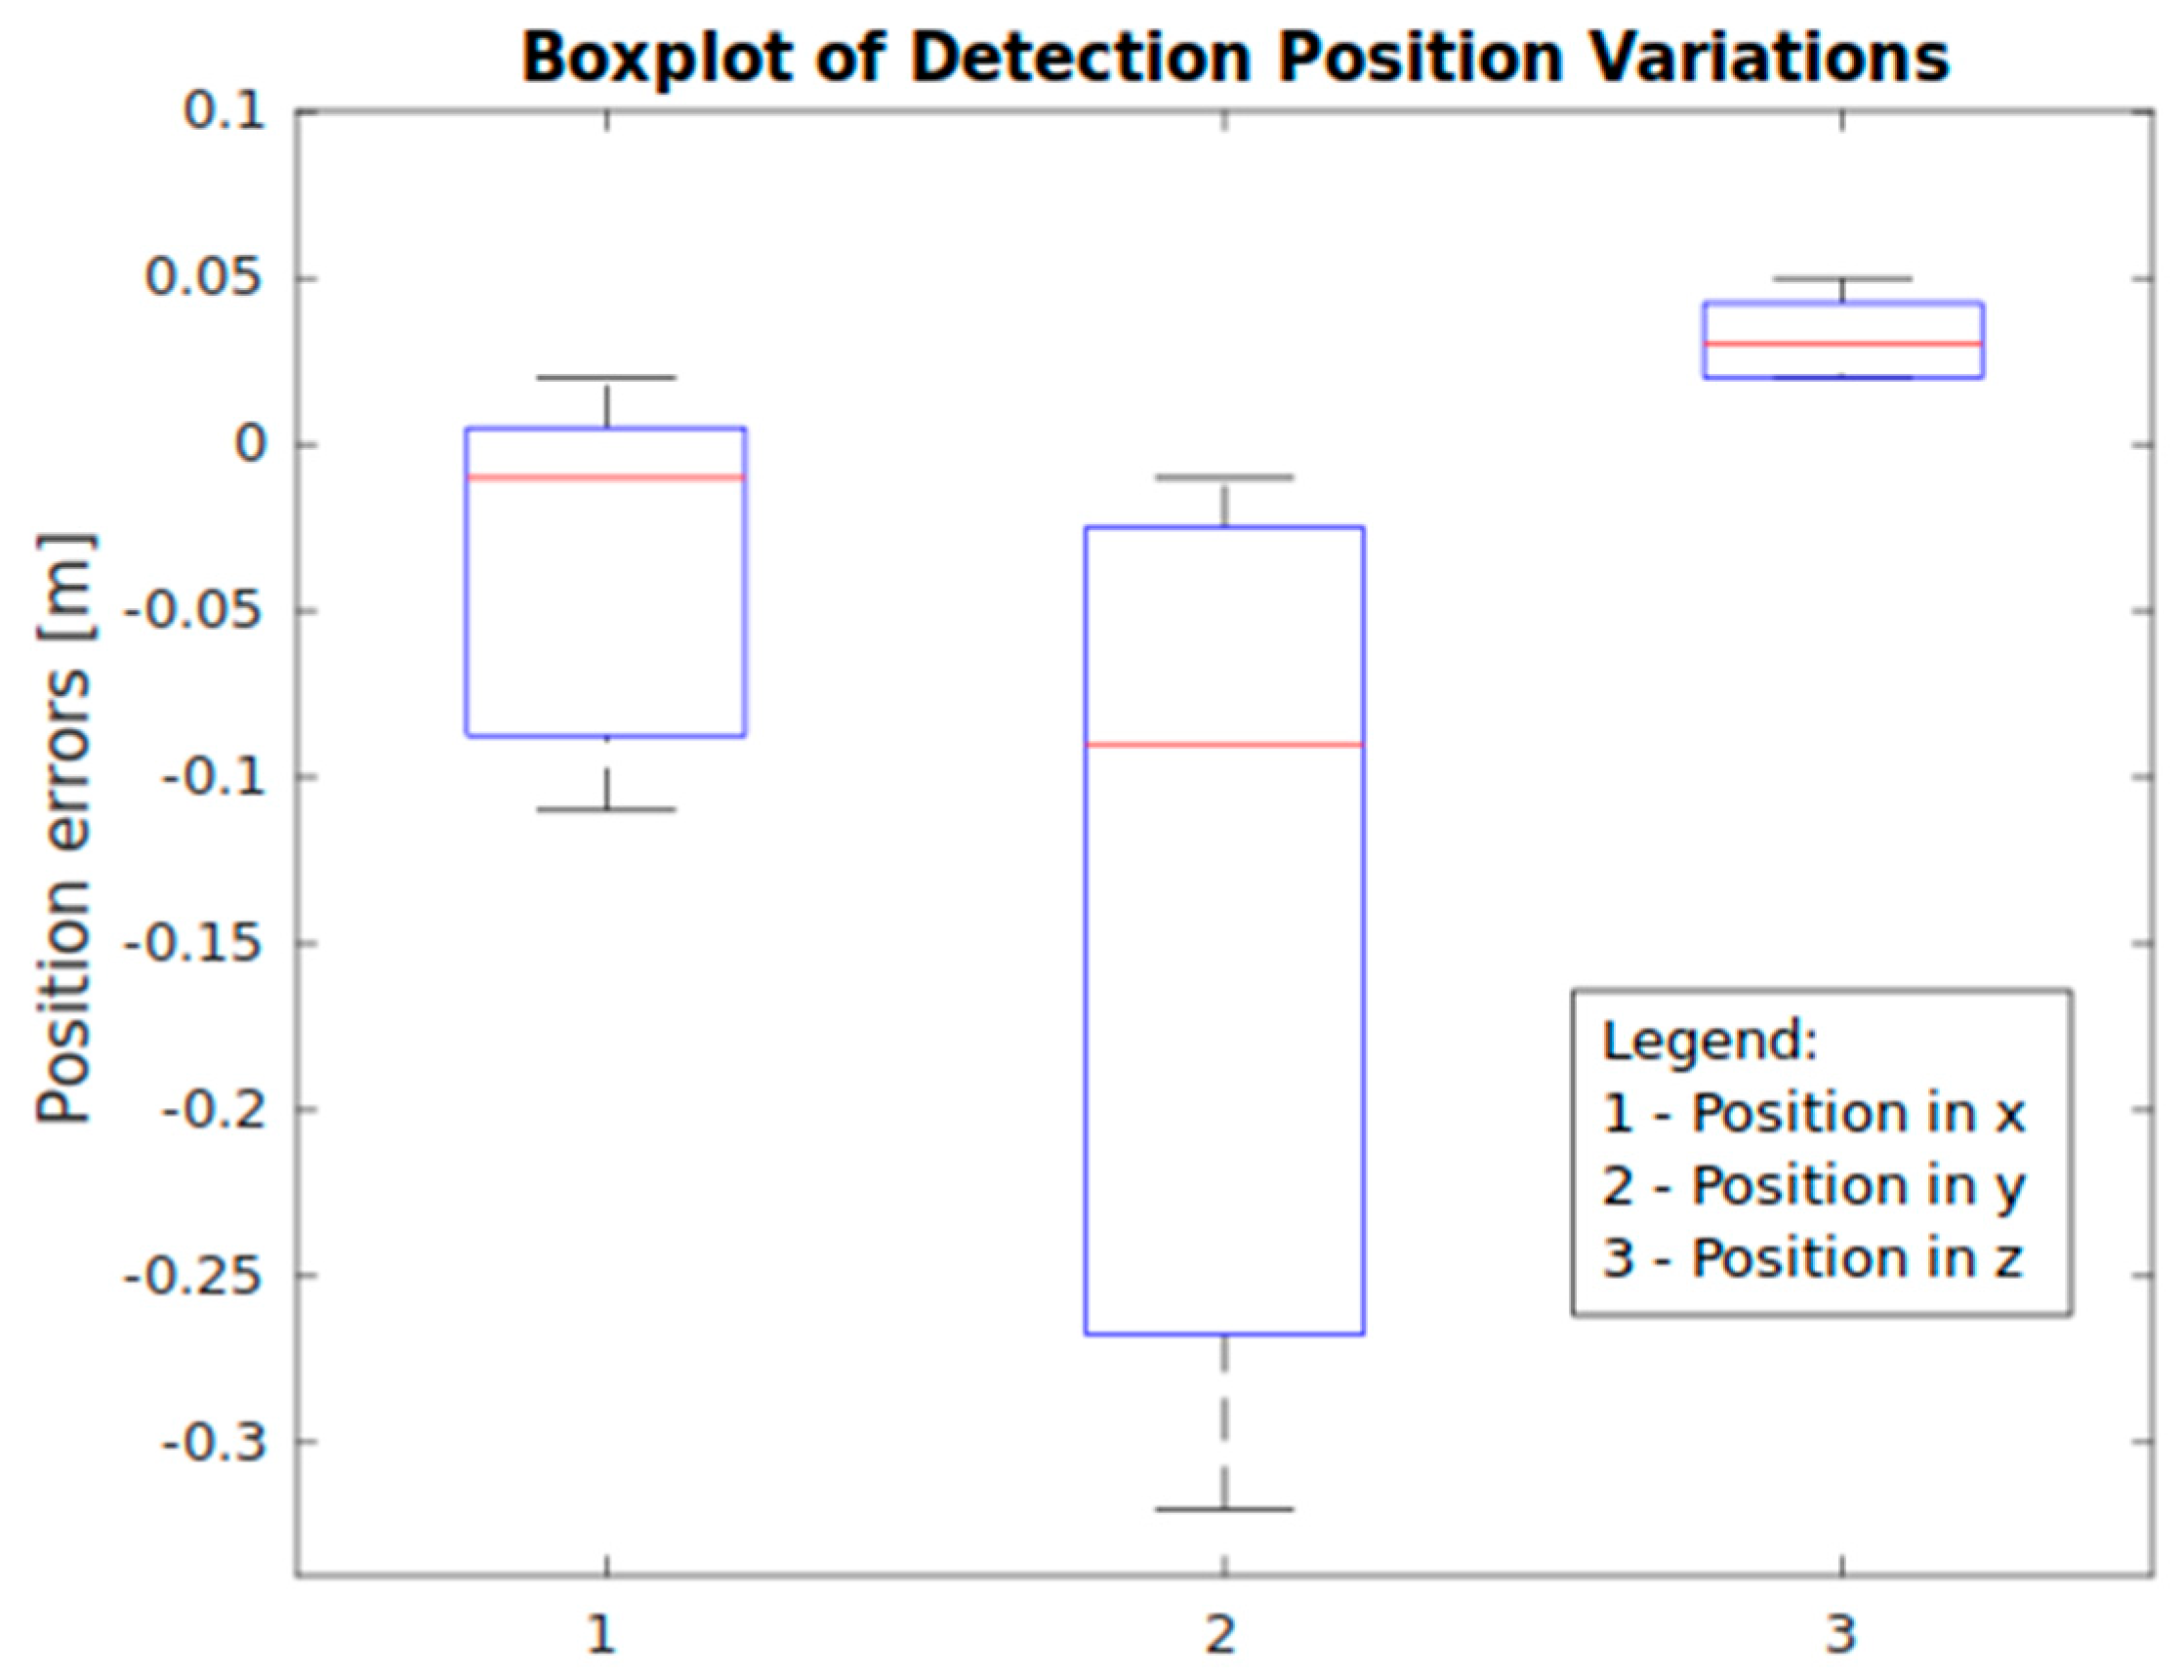
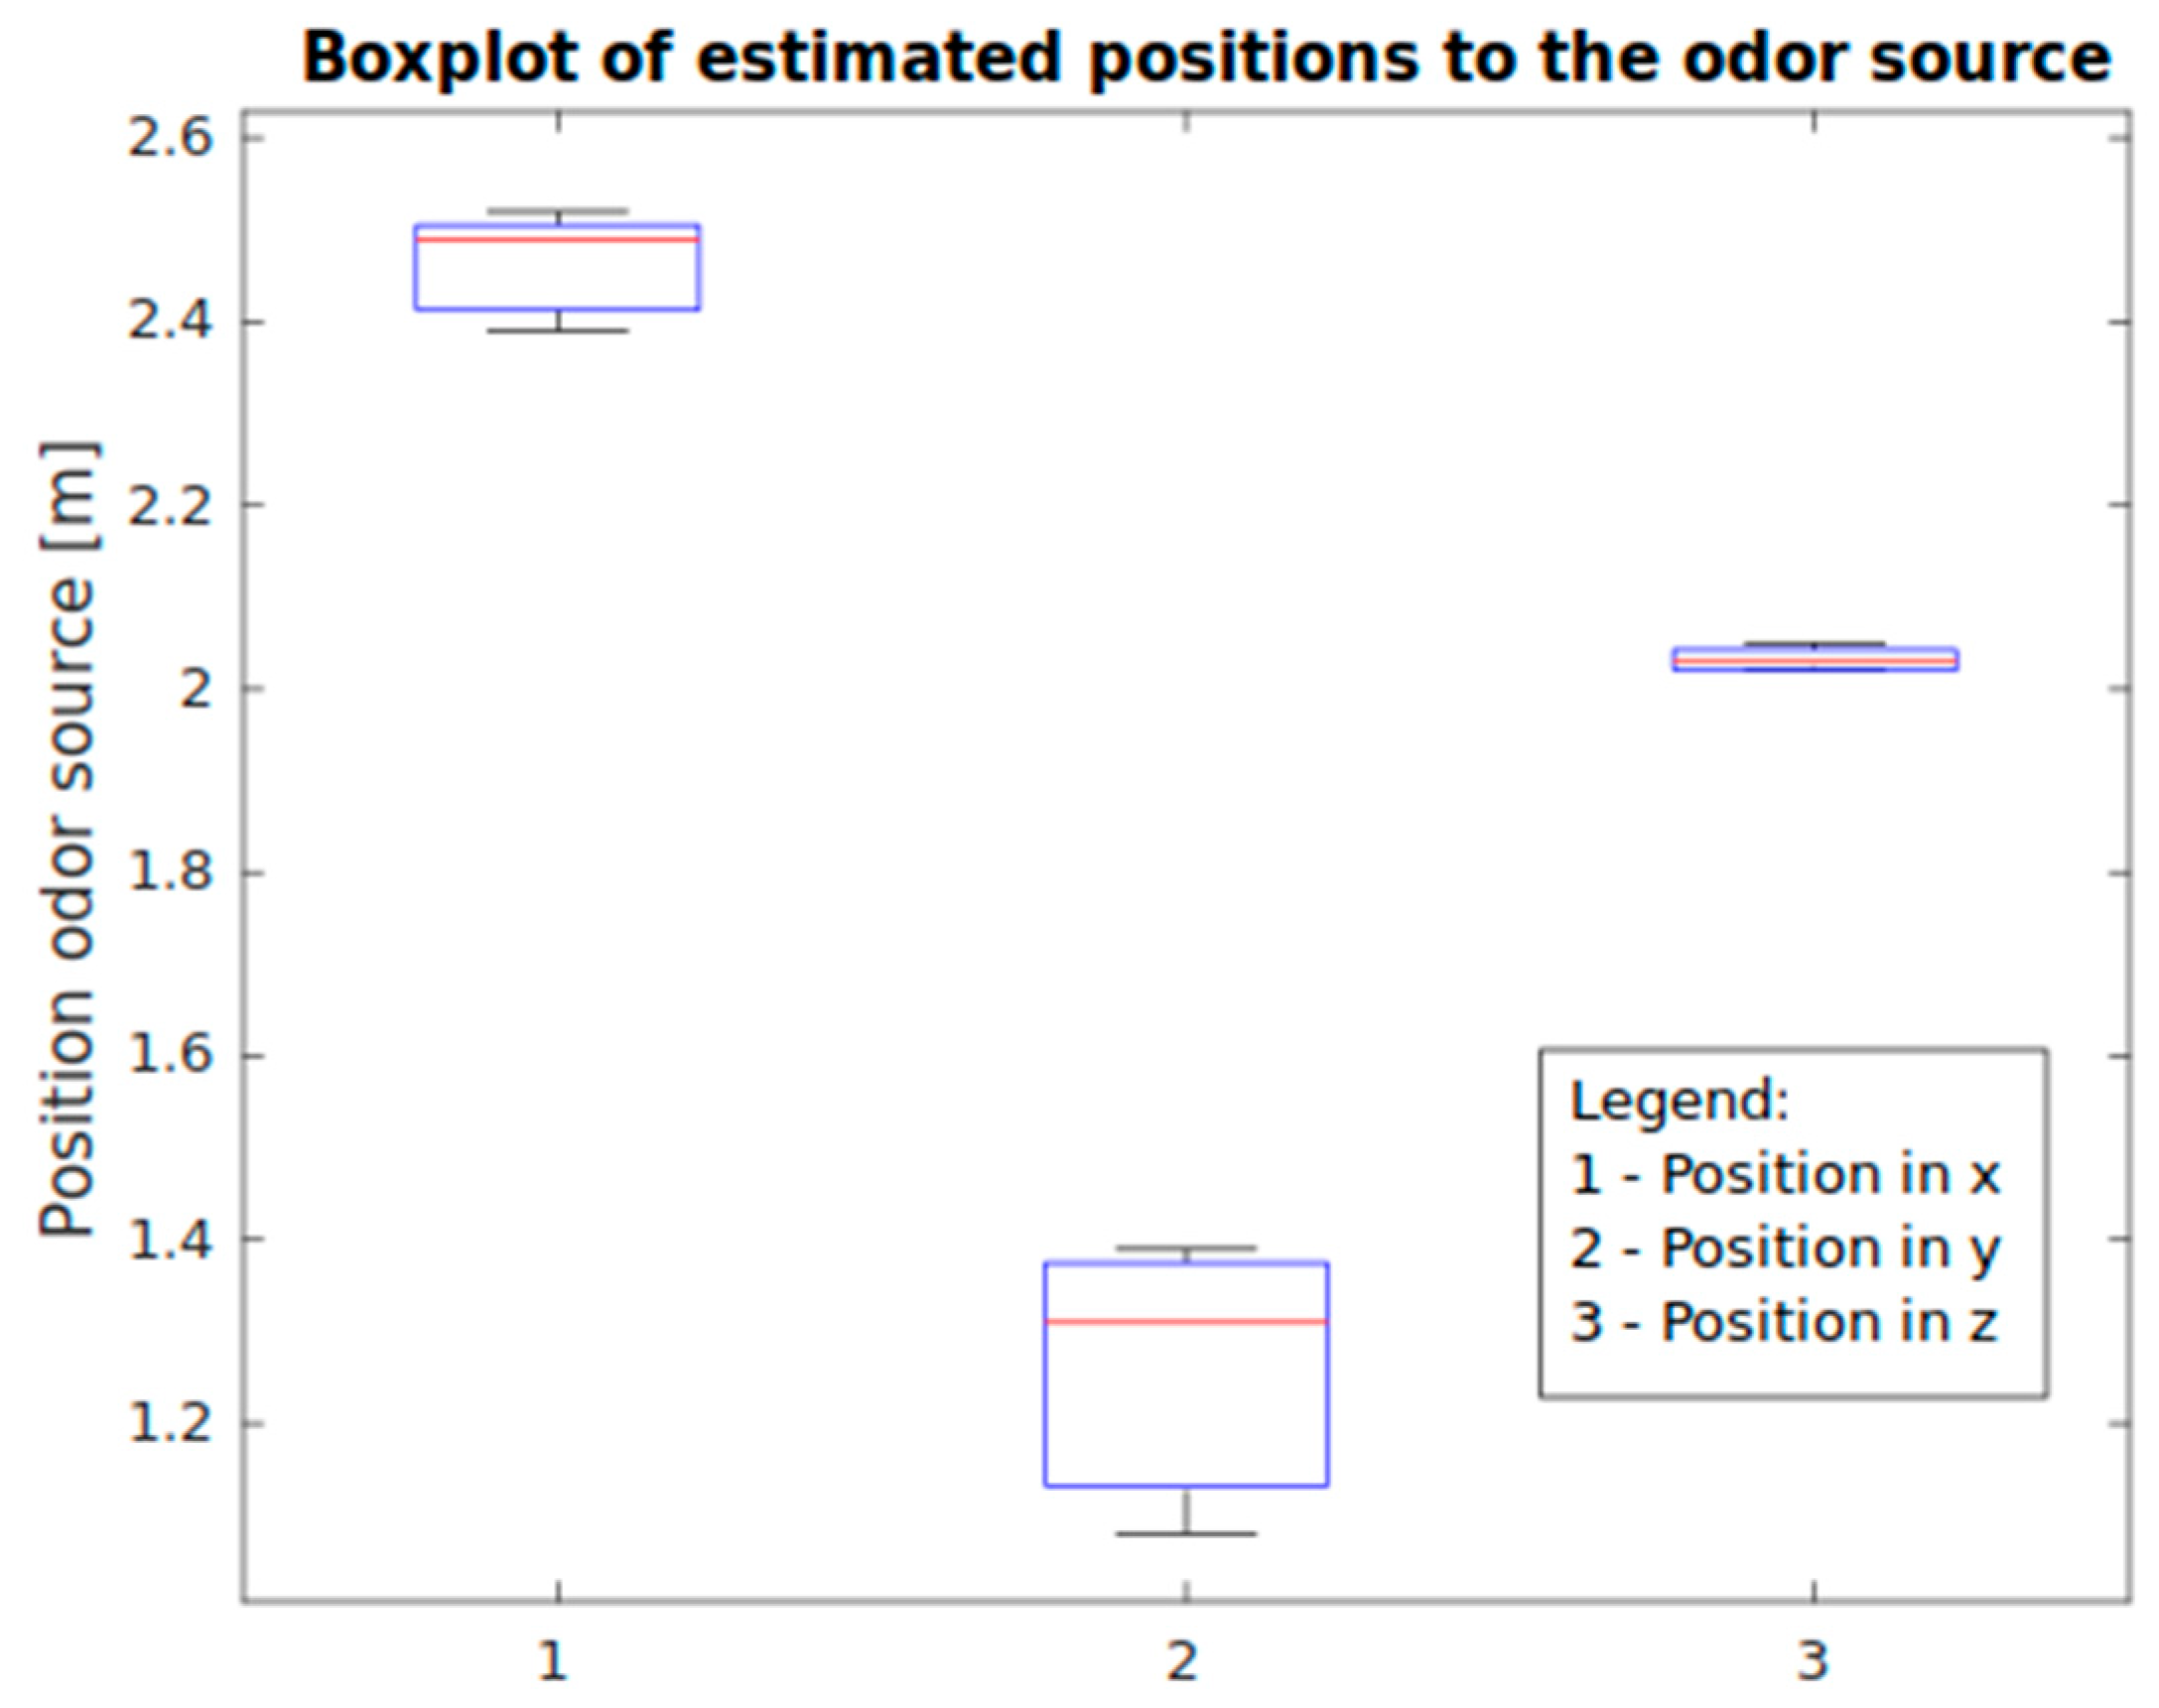
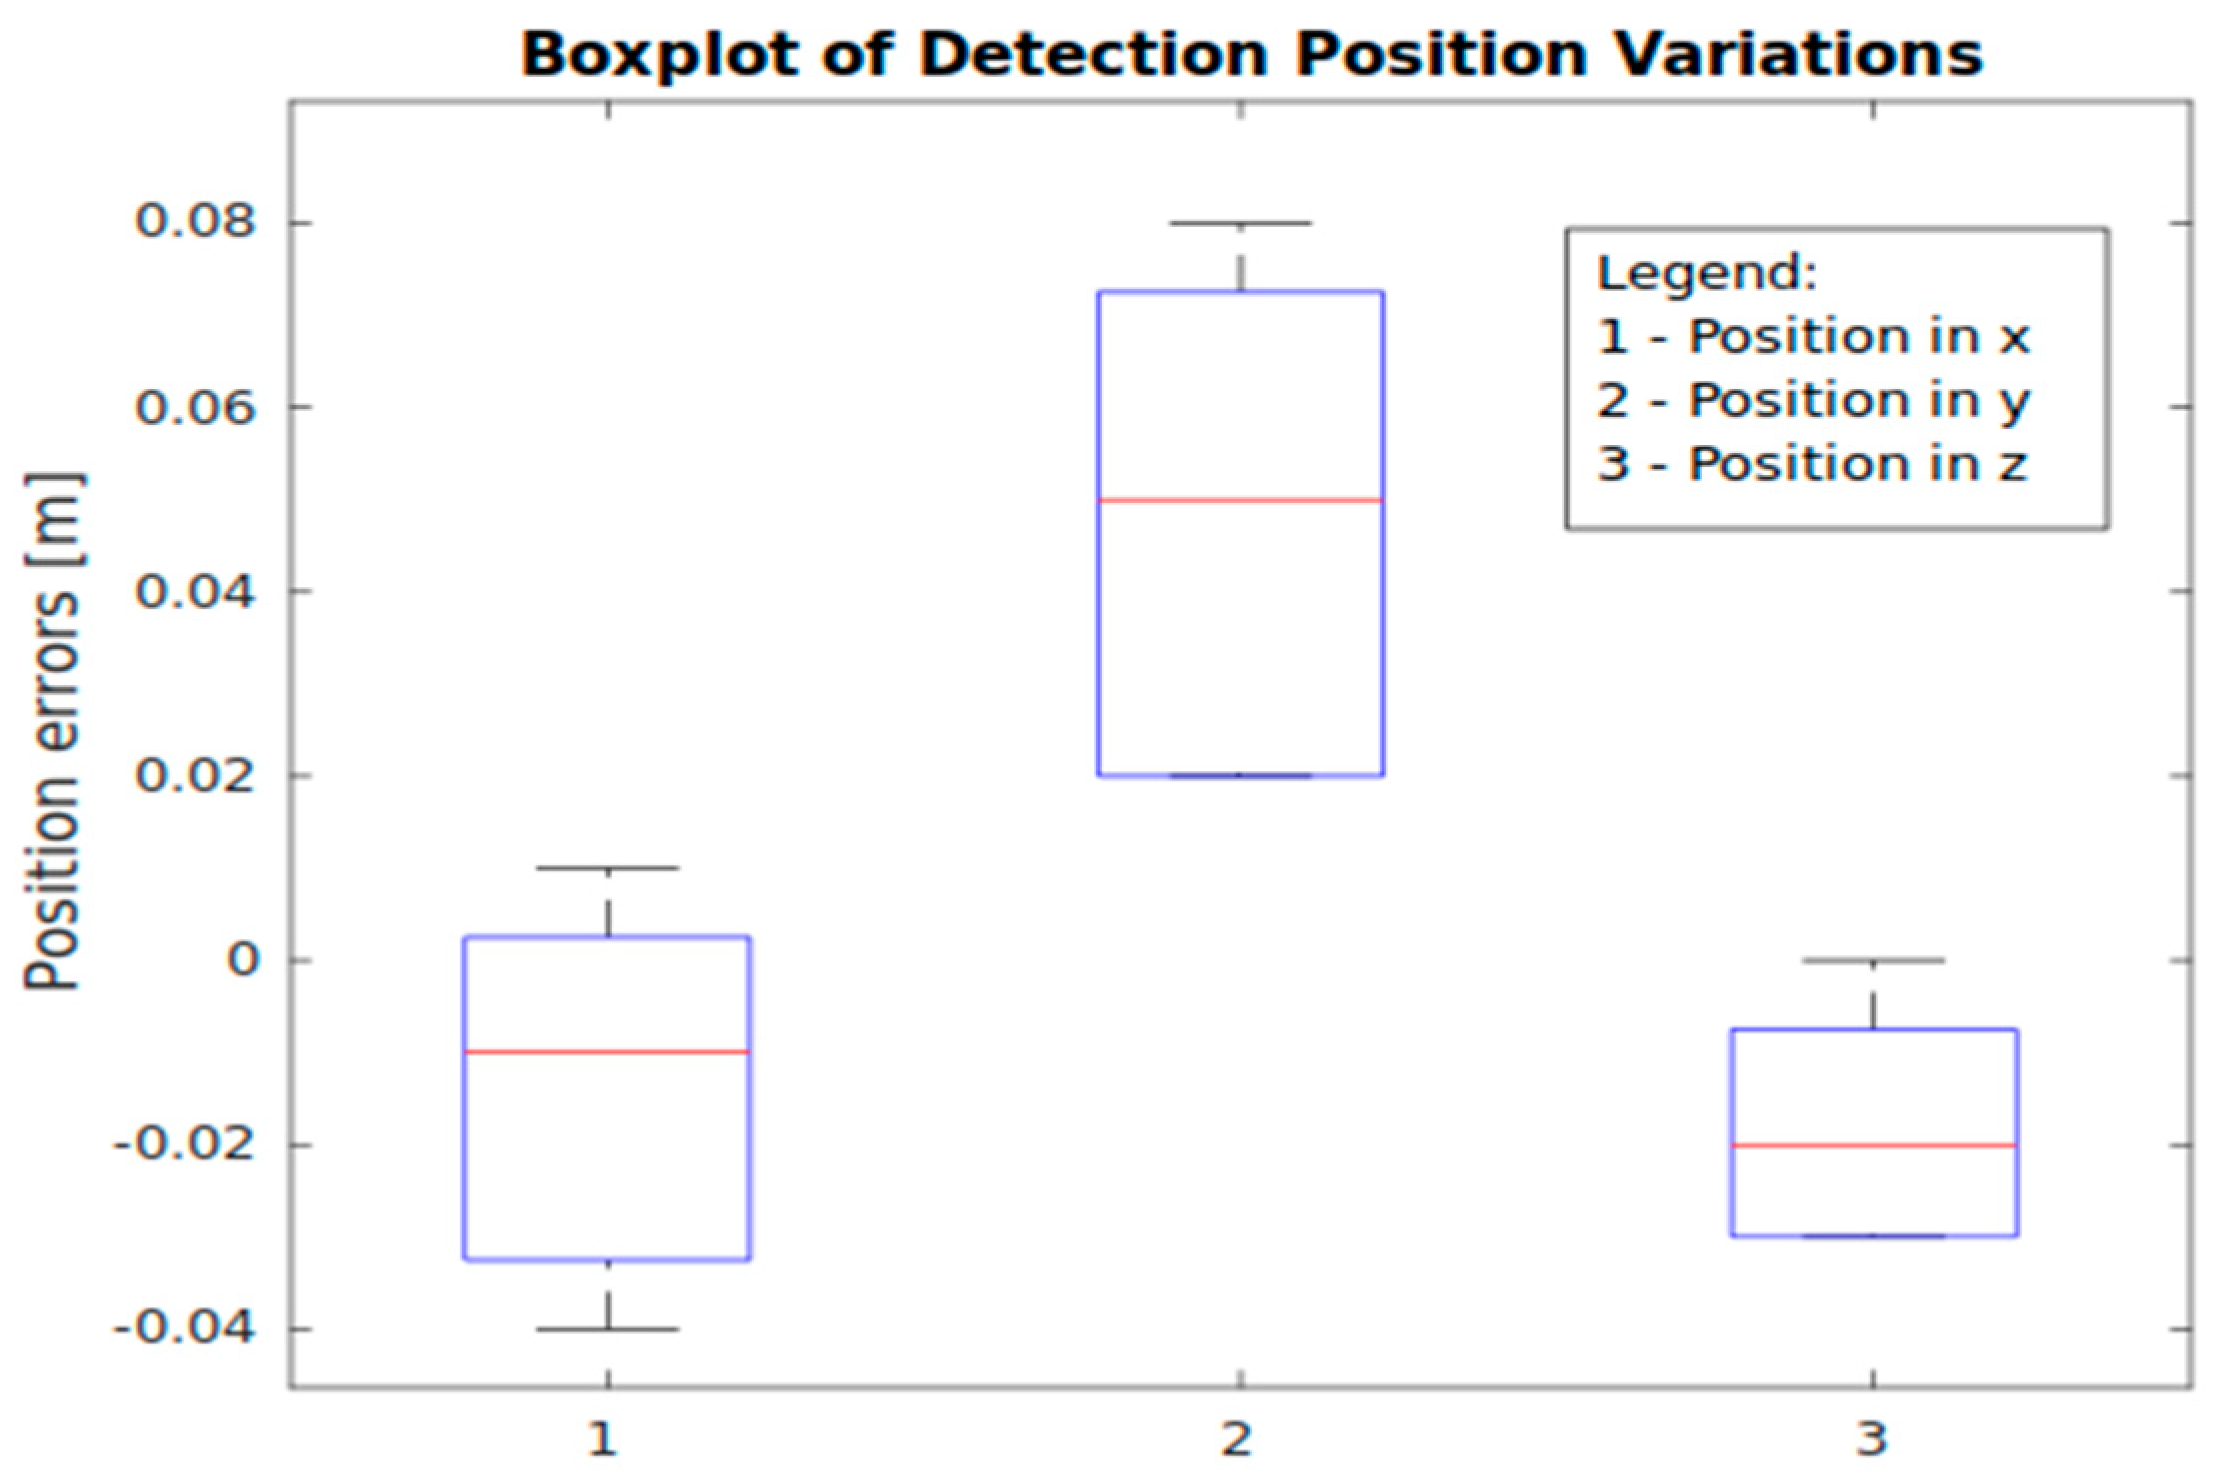
After the completion of the experiments, the data acquired from the gas sensor and the location coordinates of CF2 were recorded in text files. For illustrative purposes, the results for each odor source location are presented in
Figure 12 and
Figure 13. It is important to note that five experiments were conducted for each position.
Figure 12 and
Figure 13 illustrate that the drone equipped with the onboard gas sensor is highly capable of capturing the gas plume, even in the presence of non-uniform distribution and non-linearity of sensor readings concerning the distance to the odor source. Despite the turbulence generated by the rotors significantly impacting the sensor signal, indications of detection positions very near the odor source were successfully obtained in less than 1 min of flight, with measurements conducted during motion.


 ,
, 


