Abstract
Drone images contain a large number of small, dense targets. And they are vital for agriculture, security, monitoring, and more. However, detecting small objects remains an unsolved challenge, as they occupy a small proportion of the image and have less distinct features. Conventional object detection algorithms fail to produce satisfactory results for small objects. To address this issue, an improved algorithm for small object detection is proposed by modifying the YOLOv7 network structure. Firstly, redundant detection head for large objects is removed, and the feature extraction for small object detection advances. Secondly, the number of anchor boxes is increased to improve the recall rate for small objects. And, considering the limitations of the CIoU loss function in optimization, the EIoU loss function is employed as the bounding box loss function, to achieve more stable and effective regression. Lastly, an attention-based feature fusion module is introduced to replace the Concat module in FPN. This module considers both global and local information, effectively addressing the challenges in multiscale and small object fusion. Experimental results on the VisDrone2019 dataset demonstrate that the proposed algorithm achieves an of 54.03% and an of 32.06%, outperforming the latest similar research papers and significantly enhancing the model’s capability for small object detection in dense scenes.
1. Introduction
Small object detection finds ubiquitous applications in the real world across various domains. In the realm of intelligent transportation, accurate detection of small objects or distant entities such as traffic signs, vehicles, and pedestrians is imperative for ensuring safe autonomous driving [1]. In the field of aerial remote sensing, precise localization and classification of objects of interest are paramount for critical response and urban monitoring [2,3,4]. In the medical domain, small object detection contributes to the identification of imperceptible early-stage pathological tissue [5]. As the demand for small object detection continues to grow across diverse domains, it presents concurrent challenges. Therefore, investigating methods to enhance small object detection performance and extend its practical applications holds vital significance and value.
The rapid advancement of deep learning has propelled the widespread adoption of Convolutional Neural Networks (CNN) as efficient object detectors. These detectors can be categorized into two-stage and one-stage methods based on their distinct detection paradigms. Two-stage detectors, such as Fast R-CNN [6], Faster R-CNN [7], Cascade R-CNN [8], and VFNet [9], involve region proposal generation followed by subsequent classification and localization. Conversely, one-stage detectors like SSD [10], You Only Look Once (YOLO) [11], and RetinaNet [12] directly predict object class and position without the need for candidate boxes. One-stage algorithms exhibit faster detection speeds at the expense of sacrificing a marginal degree of accuracy compared to their two-stage counterparts. More recently, anchor-free detectors, including CenterNet [13], YOLOX [14], and RepPoints [15], have gained popularity by eliminating the design and matching of anchor boxes. Evaluation of these detectors is predominantly performed on well-known datasets such as MSCOCO [16] and PascalVOC [17], which primarily comprise low-resolution images containing relatively large objects. Consequently, existing detection algorithms have achieved commendable results in detecting large objects.
Most detection algorithms are designed for natural scenes, but there are significant differences between drone aerial images and images of natural scenes. First, drones are generally far from the ground, resulting in a large number of small targets in the images. Limited pixel information leads to less distinct features and inadequate shape and texture cues for effective discrimination from the surrounding background. Moreover, during the convolution and downsampling processes, vital features are prone to loss, while the IoU metric exhibits heightened sensitivity to position deviations, thereby exacerbating the difficulty in accurate localization of small objects compared to their larger counterparts. Second, aerial images have a large number of targets, and the density of the targets results in severe occlusions. Finally, drone aerial images have high resolution and complex background factors. These challenges prevent standard object detectors from producing satisfactory results [18,19], thereby impeding their suitability for real-world applications. Furthermore, most research in the field tends to overlook the more challenging task of dense small object detection, consequently hindering overall performance enhancement of object detection algorithms.
In order to adapt the algorithm to the characteristics of drone aerial images, this study introduces the SODCNN network based on YOLOv7 [20]. The network’s detection heads are redesigned to accommodate the characteristics of small objects. Furthermore, the anchor box parameters and bounding box loss function are optimized to enhance object localization. Lastly, the inherent feature fusion is modified.
This paper’s primary contributions are as follows:
- Considering the progressive decline in small object information across the feature extraction network, we eliminate redundant detection head for large objects and prioritize feature extraction for small object detection, enabling the acquisition of a more comprehensive set of small object information;
- To strike a balance between computational complexity and small object recall rate, we judiciously increase the number of anchor boxes, thereby reducing the network’s tendency to miss densely distributed small objects. Then, addressing the limitations of the CIoU loss, which solely accounts for aspect ratio differences while disregarding length value disparities, we employ the EIoU loss as the model’s bounding box loss, thereby improving target localization accuracy;
- In the context of feature map fusion, the fixed allocation of fusion weights in the original network may not be conducive to small object detection. Thus, we propose the attention-based fusion module ECF, which reinforces the network’s focus on small objects through attention mechanisms and dynamically generates fusion weights, facilitating comprehensive feature fusion.
2. Related Work
Along with the proposal of excellent algorithms for deep learning such as CNN, more and more research has introduced CNN into target recognition and extraction in high-resolution images. Akyon et al. [21] present a versatile framework for fine-tuning, employing sliced inputs wherein the input image is partitioned into overlapping regions for detection. This method demonstrates favorable outcomes on high-resolution aerial image datasets. Cira et al. [22] propose a road classifier in high-resolution aerial images by integrating different CNN models to construct a new model, which makes full use of the advantages and minimizes the disadvantages of the basic models by combining a low-error classifier. The performance of object detection in aerial images is improved compared to the basic model. Manso-Callejo et al. [23] use semantic segmentation for the recognition and extraction of wind turbines in high-resolution images. Target extraction at image boundaries suffers due to lack of contextual information; to address this problem, this paper discards pixels far from the center in the original tile by using four auxiliary tiles of the same size. This strategy largely solves the problem of inaccurate target extraction at the edges.
Given the subpar performance of general object detection models in small object detection scenarios, several algorithms specifically designed for this purpose have been proposed. For instance, Zhang et al. [24] introduce a precise and expeditious approach for small object detection in remote sensing images. The proposed method integrates multimodal data and leverages auxiliary super-resolution learning to facilitate discriminative modeling of small objects amidst complex and expansive backgrounds. However, the incorporation of an auxiliary super-resolution branch in the model substantially increases the parameter count during training, thereby adversely affecting real-time detection capabilities. Chen et al. [25] amplify the target region to capture richer feature information, albeit at the expense of increased computational complexity. Furthermore, Zhu et al. [26] tackle the challenges associated with multiscale and motion blur issues in drone aerial images by incorporating Transformer [27] and CBAM [28] into YOLOv5 [29]. Nevertheless, the proposed model overlooks the high cost of training while pursuing enhanced detection performance. Xianbao et al. [30] propose an improved algorithm based on YOLOv3. Three improvements are proposed: image segmentation and upsampling, bilateral scaling, and increasing the residual network element to reduce the feature loss and avoid gradient fading. The improved algorithm improves the performance of small target detection, but increases the network depth, which affects the detection speed. Additionally, Sunkara et al. [31] introduce a novel CNN architecture called SPD-Conv, which downsamples feature maps without sacrificing information. This approach replaces stride convolutions and pooling layers, thereby circumventing the loss of fine-grained information for small objects. However, its applicability is limited to specific CNN networks.
For multiscale fusion techniques, there are several studies on Graph Convolution Neural networks (GCN) and CNN. Ding et al. [32] propose a graph convolution with adaptive filters and aggregator fusion mechanism. They combine different filters by introducing linear functions and training different weight matrices, and propose a degree-scalars to fuse multiple aggregators. The method effectively extracts the features of the graph. Zhang et al. [33] propose an adaptive receptive path aggregation mechanism in order to prevent the influence of noisy nodes for classification and to find the most suitable receptive field to represent the target node. Aggregation of neighbor nodes is achieved by learning the importance level of 1-hop neighbors, and LSTM is used to update the nodes and preserve the local features of the nodes. Ding et al. [34] propose a multi-feature fusion network by combining multiscale GCN with multiscale CNN, i.e., GCN is used to extract spectral spatial features of the graph and CNN, with convolutional kernels of 3 × 3 and 5 × 5 used to extract spectral spatial features. Finally, these features are concatenated. This network efficiently extracts multiscale superpixel-based graph features and local pixel features. Ding et al. [35] design multiscale receptive fields to extract local and global neighboring node features and edge features, and then use an attention strategy to fuse these features. Similarly, when clustering features of different levels, inspired by graph attention networks, Ding et al. [36] first retain the multiscale locality layerwise information contained in each level through a kind of concatenation approach, and then use attention coefficients to fuse the features. Within CNN, Liu et al. [37] propose a fusion module based on channel attention, adaptively merging features from multiple scales using attention weights. Nevertheless, this approach solely considers global information in the feature maps, disregarding local details.
In the field of target detection, most of the feature fusion methods use a fixed fusion pattern, ignoring the importance of the features. In addition, when analyzing the features, more attention is paid to the global information and local details are ignored, which are unfavorable for small target detection. For this, this paper proposes an adaptive feature fusion module.
3. Proposed Methods
3.1. Theoretical Background
3.1.1. YOLOv7
The YOLO model, a classic one-stage detection network, has been widely applied in the field of object detection due to its superior performance. YOLOv7, an advancement over its previous iterations, exhibits improved speed and accuracy. It adheres to the core principles of the YOLO series, which involve dividing the output feature map into grids and assigning each grid the responsibility of predicting objects whose centers fall within it [38].
YOLOv7 consists of four main components: the input stage, backbone network, neck, and output stage. The input stage primarily preprocesses the data to enhance diversity, reduce redundant information, and accelerate training. The backbone network is responsible for feature extraction, during which fine-grained details such as texture gradually diminish while semantic information progressively strengthens. The neck, comprising the Feature Pyramid Network (FPN) and the Path Aggregation Network (PAN), conducts feature fusion through both top-down and bottom-up approaches, enabling the acquisition of rich feature information. The output stage utilizes the processed features from the neck to classify and locate objects, yielding precise detection results. Each grid outputs the final predictions, including coordinate positions, confidence scores, and class labels. For instance, when considering input images of size 640 × 640, the dimensions of the three output feature maps are 20 × 20 × 45, 40 × 40 × 45, and 80 × 80 × 45, respectively. The receptive field gradually decreases from large to small, thereby facilitating the detection of large, medium, and small objects.
3.1.2. CIoU Loss Function
YOLOv7 utilizes the CIoU loss function [39] for bounding box regression, which considers three factors: overlap area, center point distance, and aspect ratio. The formula for computing the CIoU loss is as follows:
Here, represents the Euclidean distance between the predicted box and the ground truth box’s center points, while denotes the length of the diagonal of the minimum bounding rectangle for the two boxes.
The parameter is employed to measure the similarity of aspect ratios, and its calculation formula is as follows:
and represent the width and height of the ground truth box, while w and h represent the width and height of the predicted box.
The parameter represents a weight parameter, and its calculation formula is as follows:
The gradient calculation formula for with respect to w and h is as follows:
Compared to the GIoU and DIoU loss functions, the CIoU loss exhibits significant improvements in both model convergence speed and detection accuracy. However, only reflects the difference in aspect ratios, which to some extent slows down the convergence speed of CIoU [40].
3.2. Framework Overview
Figure 1 illustrates the holistic structure of SODCNN, which is introduced in this study. The CBS, MP, and Efficient layer aggregation network (ELAN) basic components from YOLOv7 are retained, while the network’s output end, loss function, anchor boxes, and fusion module are systematically redesigned for enhanced performance.
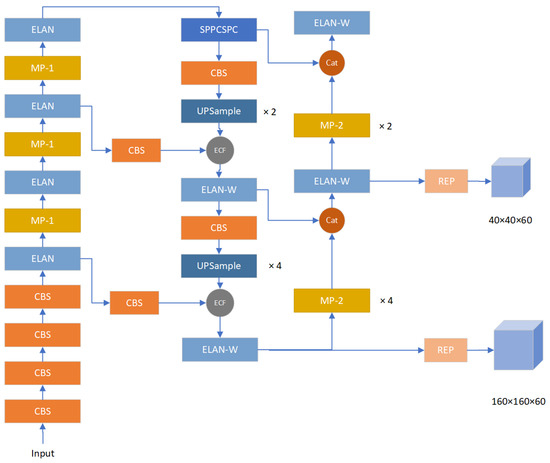
Figure 1.
SODCNN network architecture.
3.3. The Optimization of Multiscale Detection Heads
To enhance the detection performance of models, it is often necessary to leverage deeper-level features to expand the receptive field. A larger receptive field allows for a more comprehensive understanding of the attended information. However, as the network depth increases, the intricate details and positional information of small objects gradually diminish. Consequently, the notion of improving small object detection accuracy by enlarging the receptive field becomes unfeasible.
In the context of YOLOv7, the model employs three feature maps of varying scales to predict objects of different sizes. These feature maps correspond to downsampling factors of 8, 16, and 32. Notably, the feature map derived from an 8-fold downsampling possesses the smallest receptive field, wherein each grid represents an 8 × 8 region in the original input image. Consequently, objects with dimensions smaller than 8 × 8 are susceptible to being overlooked by the network. It is crucial to recognize that the overall loss in the network is determined collectively by the output layers at the three distinct scales. Consequently, suboptimal training outcomes from any of the output layers can lead to an escalated model loss, adversely affecting the training efficacy of the network.
To adapt the network for small object detection tasks, we introduce a modification that involves advancing the feature extraction process associated with the output layer possessing the smallest receptive field. This advancement results in a downsampling factor reduction from 8 to 4. Furthermore, we eliminate the redundant detection head with a downsampling factor of 32, thereby retaining only two detection heads. A graphical representation of the revised network structure can be found in Figure 2.
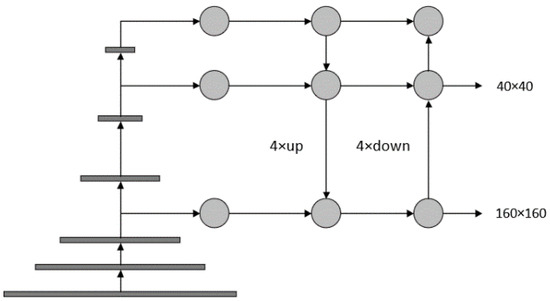
Figure 2.
The optimized detection heads.
In the original YOLOv7 architecture, feature extraction occurs at the second ELAN layer in the backbone and is subsequently horizontally fused into the neck. Compared to the feature maps at the first ELAN, the feature map size of the second ELAN is halved. However, the downsampling operation applied to the feature map derived from the first ELAN can lead to the loss of crucial features pertaining to small objects. To address this limitation, we advance the feature extraction process to the first ELAN layer. In the YOLOv7 framework, upsampling is performed using the nearest-neighbor interpolation method with an upsampling factor of 2. The advancement of the feature extraction process results in a corresponding feature scale that is twice the original, expanding from 80 × 80 to 160 × 160. To facilitate feature fusion with the same scale as the neck layer without compromising the receptive field of other object detection layers, the upsampling factor of the second UPSample in FPN is increased from 2 to 4. Similarly, the downsampling factor of the first MP-2 in PAN is also increased from 2 to 4. The revised structure of the improved MP-2 module is depicted in Figure 3.
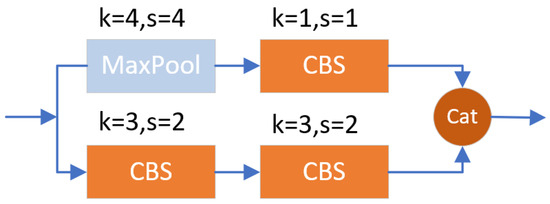
Figure 3.
The optimized MP-2.
A careful analysis reveals a considerable disparity between the receptive field of the detection head, with a downsampling factor of 32 and the target object scales observed in the dataset. This discrepancy has resulted in a certain degree of redundancy in the detection head. With the aim of expediting model training and reducing the complexity of the model, we opt to eliminate this detection head. Remarkably, this adjustment simultaneously reduces the computational complexity of the model while maintaining the accuracy of object detection.
3.4. Anchor Box Parameters
In YOLOv7, each grid of the output layers is equipped with three anchor boxes of varying aspect ratios, and the sizes of these anchors differ across the output layers. The VisDrone [41] dateset used in this study contains a substantial number of small objects, with an average of 53 objects per image. Moreover, these small objects often appear in clusters. For instance, as shown in Figure 4a, the crowd of people occupies a small portion of the image, making it challenging even for human observers to identify them. The same applies to the densely packed vehicles and pedestrians depicted in Figure 4b. The original anchor box parameters of the network were tailored for the COCO dataset, which has an average of only 7 objects per image. The choice of anchor settings significantly influences the speed and accuracy of object detection, necessitating the establishment of reasonable anchor box parameters specific to different dataset types to enhance network detection performance.
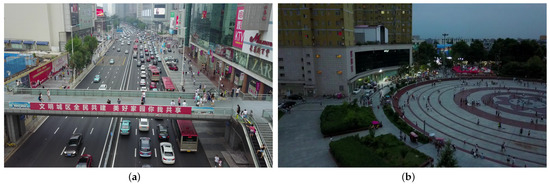
Figure 4.
VisDrone dataset. (a) Example image on the street. (b) Example image on the square.
Given the relatively large number of objects per image in the VisDrone dataset, there exist substantial differences in scale among the target boxes. By appropriately increasing the number of anchor boxes, it becomes possible to generate a greater number of prior bounding boxs (predefined boxes of different sizes and different aspect ratios, i.e., anchor boxes) to match objects of different scales and improve the recall rate for small objects. However, this approach also introduces a considerable computational burden. In our study, we set the number of anchors per grid to 4. It is important to note that the number of anchors is not as large as possible. During the matching process, only the anchors closely related to the ground truth boxes are retained. Setting a specific number of anchors allows for effective matching of objects, so increasing the number of anchors will not only cause redundancy of anchor frames, but also increase the computation. Through subsequent experimental analysis, we determined that setting the anchor box count to 4 achieves a good balance between recall rate and computational complexity.
To obtain the prior boxes that match the characteristics of the dataset, we employed the K-means clustering algorithm. Specifically, for the detection head at a scale of 160 × 160, the assigned anchor sizes are 3 × 4, 4 × 9, 8 × 7, and 8 × 15. For the detection head at a scale of 40 × 40, the assigned anchor sizes are 17 × 10, 16 × 23, 32 × 17, and 43 × 40. The increase in the number of anchor boxes enhances the network’s ability to perceive densely packed small objects.
3.5. Loss Function of Bounding Box
The formulation of the bounding box loss function is a crucial determinant of object localization accuracy. While the CIoU loss function addresses a wider range of influencing factors compared to its predecessors, it still exhibits certain limitations. The CIoU loss incorporates penalties based on the distance between the center points of predicted and ground truth boxes, as well as their aspect ratios. However, a critical issue arises when the aspect ratios satisfy the condition and , indicating a linear proportionality between the predicted and ground truth box aspect ratios, while their actual lengths may significantly differ. As illustrated in Figure 5, where the black box represents the predicted box and the red box represents the ground truth box, both boxes possess identical aspect ratios, yet the predicted box is substantially smaller than the ground truth box, which means and the penalty term associated with the aspect ratio becomes ineffective, diverging from the desired regression objective. Furthermore, based on Equations (4) and (5), the gradients of w and h exhibit opposite signs, implying that, during the regression process, the predicted box’s width and height cannot increase or decrease simultaneously. Whenever one value increases, the other value must decrease. These issues give rise to potential challenges in model optimization, particularly when the initialization of anchor boxes yields larger width and height values than those of the ground truth boxes. In such scenarios, throughout the iterative optimization process, one of the values will invariably be magnified, resulting in a larger discrepancy from the ground truth box’s length. This optimization strategy primarily emphasizes aspect ratio similarity while neglecting the actual differences between and , as well as and .
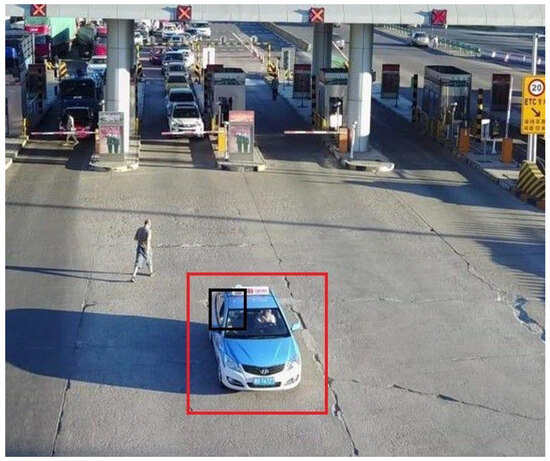
Figure 5.
The situation of .
To enhance the accuracy of object box localization, we replace the CIoU loss with the EIoU loss [40]. The EIoU loss is defined as
where and represent the width and height of the minimum enclosing rectangle of the predicted box and the ground truth box, respectively.
The EIoU loss considers three factors: overlap area, center point distance, and edge length differences. It is a modification of the CIoU loss that no longer considers the similarity of aspect ratios between the two boxes. Instead, it minimizes the differences in width and height. During the optimization process, the width and height of the predicted box can increase or decrease simultaneously, accelerating the convergence speed of the model and further improving the accuracy of object box localization.
3.6. Attention Adaptive Fusion Mechanism
The FPN employs a simple cascaded fusion method to integrate deep-level and shallow-level features, aiming to capture both strong detailed information and semantic knowledge. However, this fusion strategy assigns fixed weights to the features and only performs linear fusion, which may not be optimal for handling small objects. To address this limitation and achieve effective fusion of features with varying scales and semantics, we propose an Attention Adaptive Fusion module termed ECF, which replaces the conventional feature fusion in FPN. ECF leverages attention mechanisms to generate adaptive fusion weights, facilitating non-linear aggregation of features. Notably, our ECF module takes into account the characteristics of small objects and multiscale contexts. It not only encompasses global contextual information, but also captures local contextual cues, enabling robust representation of both extensively distributed large objects and compactly distributed small objects.
Figure 6 illustrates the architecture of our proposed ECF module. Given two feature maps, X and Y, wherein X represents low-level semantic information and Y represents high-level semantic information, the fusion process commences with an element-wise addition operation between the two feature maps. The fused feature map is subsequently fed into the multiscale attention module A, which leverages a sigmoid function to produce attention weight W. Additionally, the dashed arrow signifies , and the two sets of weights are element-wise multiplied with the corresponding elements of the X and Y feature maps. Eventually, the fused feature map is obtained through a cascaded operation. This fusion procedure can be mathematically expressed using the following formula:
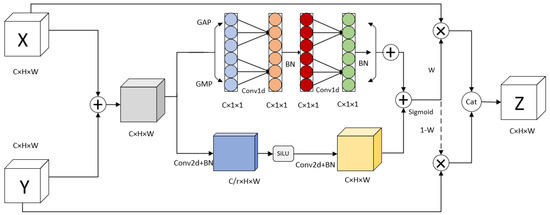
Figure 6.
ECF module.
Furthermore, the upper and lower branches of the attention module are dedicated to extracting global and local contextual information, respectively. The global information extraction branch draws inspiration from the Efficient Channel Attention (ECA) mechanism [42]. By employing parallel global max pooling and global average pooling, spatial dimensions are effectively compressed to extract crucial information from the feature map. This approach mitigates information loss compared to relying solely on max pooling. The mathematical formulas for the two pooling operations are presented as follows:
Subsequently, the feature map undergoes shared one-dimensional convolutions and normalization operations to avoid dimensional reduction while capturing cross-channel interaction information. Finally, the global information feature map M1 is generated through element-wise summation. This can be formally denoted using the following equation:
where represents the first one-dimensional convolution operation, while represents the second one-dimensional convolution operation. The acronym BN denotes batch normalization, a technique widely used for normalizing activations in deep neural networks.
The sizes of the two one-dimensional convolution kernels are denoted as k, which play a crucial role in determining the extent of channel interactions. These sizes are determined adaptively, maintaining a direct proportionality to the number of channels present in the feature map. More precisely, when denoting the number of channels as C, the calculation formula for k is expressed as follows:
where represents the closest odd integer to t. Specifically, when t is an even number, , while, for odd values of t, . The constants and b are assigned specific values of 2 and 1, respectively.
In order to address the limitations of global context in overlooking intricate details and to mitigate the challenges posed by multiscale variations and small target objects, we integrated local context information within the attention module. This was achieved by employing two two-dimensional convolutional kernels of size 1 to extract the local context information, denoted as M2. Notably, the channel dimension underwent a reduction from C to , where C represents the original number of channels and r denotes the channel reduction factor, empirically set to 4. Following this, the second convolutional kernel restored the channel dimension back to its original value of C. The holistic procedure can be succinctly outlined as follows:
where refers to the first two-dimensional convolutional operation, while corresponds to the second two-dimensional convolutional operation. Furthermore, the term “SL” denotes the SiLU activation function, which is applied within the network architecture.
After obtaining the global context information M1 and local context information M2, the attention weight W is computed using Equation (13). The dimension of M1 is C × 1 × 1 and the dimension of M2 is C × H × W. The summing operation of these two feature maps utilizes the broadcast mechanism, i.e., the values on the dimension of the M1 channel are copied in the width and height dimensions, and expanded into feature map with the size of C × H × W to be summed with M2. This weight assignment mechanism allows the model to allocate larger weights to crucial information, thereby focusing more attention on these informative regions.
The ECF module is employed to replace the Concat module in FPN, as illustrated in Figure 7. During the downsampling process, the scale of the feature maps gradually decreases, while during the upsampling process, the feature maps are scaled up to match the size of the backbone feature maps. By horizontally integrating deep-level high-semantic features with shallow-level high-resolution features, the model’s classification and localization capabilities are simultaneously enhanced. The adaptive fusion using attention mechanisms addresses the limitations of fixed weight allocation in the original network. By dynamically assigning weights, the fused features can capture more information about small targets, thereby improving the network’s feature extraction capacity in densely packed small target scenarios.
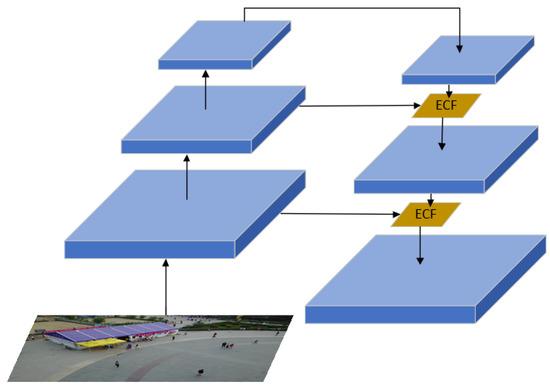
Figure 7.
The optimized FPN structure which replaces ECF.
4. Experiments and Results
4.1. Datasets
In this study, we utilized the VisDrone2019 dataset as our small object dataset. VisDrone2019 is a large-scale dataset comprising aerial images captured by unmanned aerial vehicles. The dataset contains 10,209 static images from 14 different cities, including 6471 training images, 548 validation images, 1610 test images, and 1580 unlabeled test images for the VisDrone challenge. Except for the images used for the challenge, the other 8629 images are used as the dataset for our experiments. The images have a maximum resolution of 2000 × 1500 and encompass various weather and lighting conditions, representing diverse real-life scenarios. The dataset defines 10 object categories, including humans and various types of vehicles, as depicted in Figure 8a, along with their corresponding object counts. Notably, the car category has several hundred thousand instances, while the awning–tricycle category only has a few thousand instances, indicating a severe class imbalance issue. Furthermore, due to variations in shooting heights and angles, the objects exhibit significant scale changes. Figure 8b illustrates the size distribution of object bounding boxes in the dataset, where the horizontal and vertical coordinates indicate the aspect ratio of the target to the image, respectively. It is predominant that the target size distribution is mainly concentrated in the lower-left corner, indicating that the majority of objects in the dataset are small. About 60% of the targets in the dataset have an area of no more than 1000 pixels, and about 75% of the targets have an area of no more than 2000 pixels. In addition to the absolute scale being relatively small, the vast majority of the targets are also very small in relative scale, with about 97% of the targets accounting for less than 1% of the image area, so it can be seen that the core task of the VisDrone dataset lies in the detection of small targets. The dataset exhibits a high density of objects, with individual images containing even hundreds of objects, leading to significant object occlusion and presenting a highly challenging detection task.
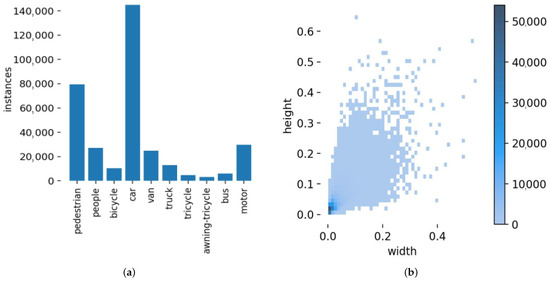
Figure 8.
Dataset situation. (a) Object categories and numbers. (b) Aspect ratio distribution of the target bounding box to the image.
4.2. Experimental Setup
The experimental setup and training parameter configurations are presented in Table 1 and Table 2, respectively. The experiments were conducted on a computational environment based on the Ubuntu 20.04 operating system, utilizing the powerful NVIDIA GeForce RTX 3090 graphics card. The Python programming language version 3.8 was employed, along with the PyTorch deep learning framework. To expedite the training process, GPU acceleration was utilized. It is important to note that all experiments were conducted under identical environmental conditions to ensure consistency and reproducibility. For the setting of hyperparameters, in order to save the computational resources and adapt the video memory size, we set the bach size to 4. Other hyperparameters are not specifically set. The image size is scaled to the default 640 × 640 as the network input. We chose the default settings of YOLOv7 to facilitate the comparison with the original network and to reflect the effectiveness of the proposed method.

Table 1.
Experimental environment.

Table 2.
Training parameters.
4.3. Results and Discussion
4.3.1. Comparative Experiments on Anchor Box Parameter Settings
To validate the effectiveness of increasing the number of anchor boxes for small object detection, we conducted comparative experiments using a network with only two prediction layers. The anchor box numbers were set to 3, 4, 5, 6, and 7, respectively. The experiments were performed on the VisDrone training dataset, with subsequent evaluation on the validation set. The experimental results are shown in Table 3.

Table 3.
Impact of the number of anchor box settings on model performance.
In the table, we record the corresponding recall and GFLOPs values for different numbers of anchor boxes. GFLOPs is the number of floating-point operations, which can be interpreted as the computational cost, and is used to measure the complexity of an algorithm. It can be observed that, when the number of anchor boxes was set to 4, the network achieved a noticeable improvement in recall rate. However, when the number of anchor boxes was increased to 5 and 6, the recalls did not increase and did not differ much compared to 4 anchor boxes, indicating a certain degree of redundancy in the anchor boxes. Furthermore, when the number of anchor boxes was increased to 7, the recall rate decreased dramatically, suggesting that an excessive number of anchor boxes could negatively impact the network’s performance. Thus, the most reasonable number of anchor boxes was determined to be 4. At this setting, the network’s GFLOPs increased from 128.9 to 129.1, with no significant increase in computational complexity. Additionally, the matching success rate between the dataset’s targets and the prior boxes improved. Further increasing the number of anchor boxes not only failed to significantly improve the network’s performance but also increased the computational workload. The experimental results indicate that, when the number of anchor boxes is set to 4, the model’s computational complexity remains within a reasonable range while improving the detection of small objects to some extent. Thus, more small objects can be correctly detected.
4.3.2. The Effect of Convolutional Kernel Size k in ECF
According to Equation (11), the size of the ECF convolution kernel is adaptively determined, and, in order to verify the validity of adaptively changing the kernel size k, we set k to a fixed value ranging from 3 to 9 for the comparison experiments. The experimental results are shown in Figure 9.
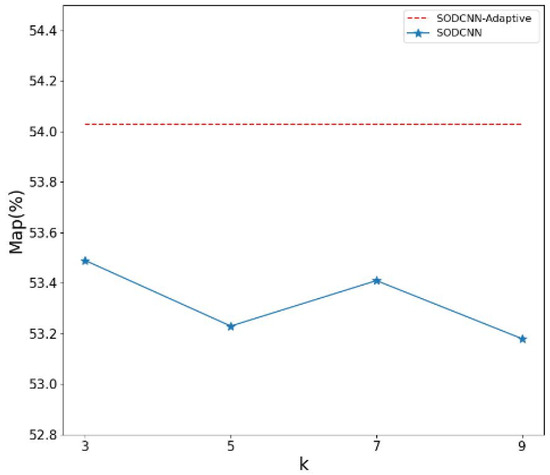
Figure 9.
Comparison of adaptive k and fixed k.
In the figure, the red dashed line shows the detection accuracy of the SODCNN when k is determined adaptively, with an value of 54.03%. The blue line shows the experimental results when k is set to a fixed value. The detection accuracy is best when k = 3, but is only 53.49%. It is clear that adaptively determining k is effective in improving the performance of the network.
4.3.3. Ablation Experiment
In this study, we conducted a series of ablation experiments to assess the individual contributions of the proposed enhancements towards improving the performance of the model. These enhancements included early feature extraction and the removal of the large object detection head (referred to as YOLOv7-T), the incorporation of an additional anchor box (YOLOv7-TA), the replacement of the CIoU loss function with EIoU (YOLOv7-TAE), and the substitution of the feature fusion module in FPN with the attention-based self-adaptive fusion module introduced in this paper (known as SODCNN).
Experiments are evaluated on a validation set. Evaluation metrics such as parameters, , , AP on small, medium and large targets, GFLOPs, FPS, and training time are employed to compare the performance of each model. The experimental results are presented in Figure 10 and Table 4.

Figure 10.
and using different optimized algorithms. (a) . (b) .

Table 4.
Ablation experiment.
The results clearly demonstrate the efficacy of each enhancement. Notably, the large increase in GFLOPs for YOLOv7-T compared to the YOLOv7 indicates a boost in model computation. But its significantly improved from 49.57% to 52.57%. And AP values on small, medium, and large targets and the speed of network detection during the test were also substantially improved. For the training time, advancing the feature extraction improved the training time from 13.89 h to 15.84 for 250 epochs. Then, removing the large target detection head reduced the training time of the network to 14.71 without affecting the large target detection. Compared to the original YOLOv7, no great improvement in training time on the YOLOv7-T. The increase in overall network performance suggests that this improvement highlights the importance of early feature extraction, as it effectively mitigated the loss of valuable information related to small objects in the deep layers.
Moreover, the addition of an extra anchor box in YOLOv7-TA resulted in a modest but noticeable 0.43% improvement in mAP compared to YOLOv7-T, and the AP values on the three size targets were also further improved. Meanwhile, the GFLOPs and training time were not significantly improved, indicating the positive impact of increasing the number of anchor boxes on the detection performance, particularly for densely populated small objects. Furthermore, the analysis of convergence speed revealed that setting the anchor box number to 4 expedited the model’s convergence process to a certain extent.
Additionally, YOLOv7-TAE demonstrated an enhanced detection accuracy while maintaining parameter number and computational complexity comparable to YOLOv7-TA. The replacement of CIoU loss with EIoU loss led the model to optimize its parameters in a more reasonable direction, contributing to the improved performance.
Lastly, SODCNN exhibited further optimization compared to YOLOv7-TAE, and the introduction of the ECF structure brought optimization to the network while introducing a small number of parameters and computational complexity, emphasizing the superiority of the proposed dynamic allocation of fusion weights over simple linear fusion. This adaptive fusion mechanism enables the model to flexibly and comprehensively leverage the information captured in the fused feature maps, leading to enhanced detection capabilities.
Overall, these ablation experiments provide valuable insights into the effectiveness and significance of each improvement point, highlighting the potential of the proposed enhancements for enhancing small object detection performance.
In order to validate the effectiveness of the proposed algorithm in practical applications, we conducted visual analysis on the test set. We show the visualization results of YOLOv7 and SODCNN in three different scenes: daytime, nighttime, and motion blur, shown in Figure 11, Figure 12 and Figure 13, respectively. We also compared the number of targets detected by the two models in these detection scenarios in Table 5. Figure 11 shows the visualization results in a daytime scene, Figure 11a is the original input image, and Figure 11b is the real labeled image with the number of labeled targets counted in Table 5. Figure 11c,d show the detection results of YOLOv7 and SODCNN, respectively. According to the visualization results and Table 5, SODCNN can correctly detect 16 targets, which has higher detection accuracy compared to YOLOv7. Figure 12 shows the results of the visualization of the night scene. Comparing Figure 12c,d, our proposed algorithm demonstrates the ability to detect more small objects in the nighttime scene and accurately identify partially overlapping and occluded targets, improving the number of detected targets from 83 to 107. Figure 13 shows the algorithm detection performance in a motion blur scenario, where the texture details of small objects are lost and the features are distorted, resulting in a significant number of missed detections. However, as observed in Figure 13d, the improved model can still accurately identify pedestrians in the motion blur scene. Number of targets correctly detected increased from 4 to 10, indicating enhanced robustness. By performing feature extraction in the shallow layers and adaptively fusing them into the neck module, our model retains and effectively utilizes the features of small objects, allowing it to learn comprehensive information about small objects in complex scenes. Furthermore, the incorporation of additional anchor boxes addresses the issue of missed detections in crowded and overlapping scenarios. Overall, our proposed model exhibits superior adaptability for small object detection in complex scenes.
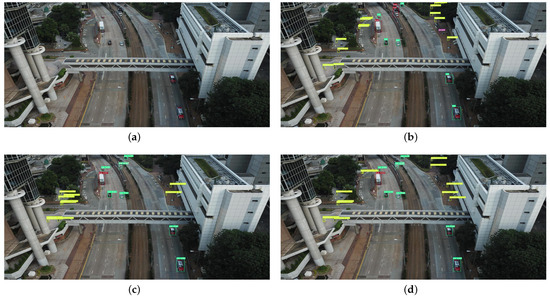
Figure 11.
Detection results of YOLOv7 and SODCNN in daytime scene. (a) Original input image. (b) Ground truth image. (c) Detection performance of the original YOLOv7. (d) Detection performance of SODCNN.
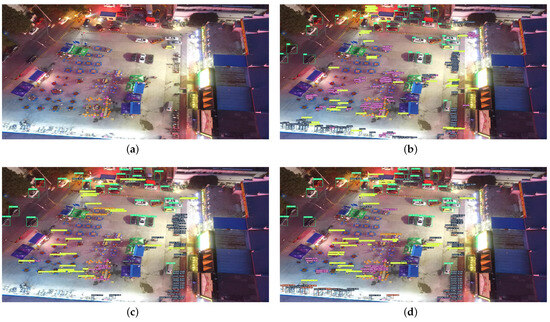
Figure 12.
Detection results of YOLOv7 and SODCNN in night scene. (a) Original input image. (b) Ground truth image. (c) Detection performance of the original YOLOv7. (d) Detection performance of SODCNN.
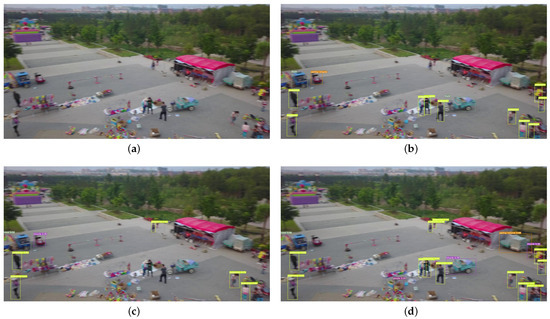
Figure 13.
Detection results of YOLOv7 and SODCNN in motion blur scene. (a) Original input image. (b) Ground truth image. (c) Detection performance of the original YOLOv7. (d) Detection performance of SODCNN.

Table 5.
Comparison of the number of detected targets between YOLOv7 and SODCNN.
To verify the applicability of our algorithm to other detection tasks, we applied the algorithm to the CARPK dataset. This dataset, proposed by Hsieh et al. [43] in 2017, is a collection of nearly 90,000 cars from 4 different parking lots collected by drones, containing 989 images for the training set and 459 images for the validation set. The original YOLOv7 and the SODCNN proposed in this paper are compared under the same experimental conditions. The experimental results are shown in Table 6, where our proposed algorithm improves from 98.41% to 99.18% and from 71.63% to 74.26% with respect to the original YOLOv7. The experimental results show that our model is able to show its superiority in different detection tasks and can be applied in different detection scenarios.

Table 6.
Experimental results on the CARPK dataset.
4.3.4. Comparison with Other Methods
According to Figure 8a, the number of labels varies greatly from class to class, where bus, tricycle, and truck have a relatively small number of labels, with 251, 532, and 750 labels, respectively. Car and pedestrian have a larger number, with 14,064 and 8844 labels, respectively. In order to verify the effectiveness of our algorithm on classes with different numbers of training labels, we compared the of YOLOv7, TPH-YOLOv5, and our proposed algorithm on different classes of targets. The experimental results are shown in Table 7, for different classes, our proposed algorithm achieves the best performance, and it is still effective in improving its detection accuracy for classes with few training labels. Compared to YOLOv7, our algorithm improves by 6.8%, 5.6%, and 7.7% for the small targets of pedestrian, people, and bicycle, respectively, and 2.4%, 1.3%, and 3.3% for the relatively large targets of car, van, and truck, respectively. It can be seen that the performance of our algorithm improves more significantly on small targets.

Table 7.
of the algorithms on classes with different numbers of targets.
We conducted comparative experiments involving prominent object detection algorithms on the VisDrone dataset, including YOLOv3 [44], YOLOv4 [45], YOLOv5l, YOLOv6s [46], YOLOv8s [47], Cascade R-CNN, RetinaNet, TPH-YOLOv5, PicoDet [48], PP-YOLOE [49], and EL-YOLOv5s [50]. By referring to the data presented in Table 8, it is evident that our proposed algorithm surpasses these models in terms of performance. Specifically, our model achieves a remarkable improvement in , surpassing the YOLOv8s by 11.9%. And the is boosted by 6.65%. YOLOv8 is the latest study of the YOLO series of target detection algorithms. In addition to this, our proposed algorithm outperforms the of the two-stage algorithm Cascade R-CNN by 31.92%, and outperforms the anchor-free detectors PicoDet and PP-YOLOE by 19.92% and 14.43%, respectively. The TPH-YOLOv5 and EL-YOLOv5s algorithms are proposed on the VisDrone dataset, and the detection accuracy of our algorithm outperforms both models. These findings unequivocally establish the superior capabilities of our model in effectively detecting small objects in complex scenes.

Table 8.
Comparison experiments.
Our network has been designed with efficiency in mind, making it well-suited for edge computing environments. On our laboratory equipment, we conducted recognition tests on images with a resolution of 640 × 640, achieving a recognition rate of 105 frames per second. However, we acknowledge that, in resource-constrained environments such as drones, performance can pose a challenge.
We have undertaken extensive optimization efforts to maximize performance in drones; we still suggest that the available computational resources on the drones should be upgraded to ensure the loading and computation of our network models. We aim to achieve a minimum performance level of 3–5 frames per second, which we believe will effectively meet real-world application demands in the resource-constrained devices.
5. Conclusions
There are a large number of small targets in large resolution aerial images, and general target detection algorithms are unable to accurately extract the information of the small targets. To address this issue, this paper focuses on the research of small object detection techniques based on YOLOv7. We redesigned the detection head, the number of anchor frames, the loss function, and the feature fusion module of the model. In detail, we address the issue of feature loss that occurs as network depth increases by removing the redundant large object detection head and advancing the feature extraction corresponding to small object detection. Moreover, we enhance the recall rate of small objects by increasing the number of anchor boxes and improve the localization accuracy of the model by utilizing the EIoU loss function as the bounding box loss. Additionally, we introduce an adaptive fusion module based on attention mechanisms to fully leverage the high-level semantic information and low-level texture, color, and shape information. We performed ablation experiments to analyze the contribution of each improvement strategy to the model, and we also compared the model with other state-of-the-art target detection algorithms. Experimental results on the VisDrone2019 dataset demonstrate that the proposed optimization strategies effectively improve the detection accuracy of YOLOv7 for small objects. Our model has superior performance compared to other algorithms. In addition, visualization analysis shows that our model still improves the accuracy of small target detection in complex scenarios such as motion blur, darkness, and dense and overlapping targets.
The algorithm proposed in this paper has some limitations—the large target detection head only produces some redundancy for the VisDrone dataset, so removing it does not affect the detection accuracy of the network, but, when the network detects data with a slightly larger target, it may lead to a degradation of the detection performance. To address this issue, multiple datasets will be used in the future to investigate how to improve the network’s relocatability so that it can be applied to a variety of target detection scenarios.
Author Contributions
Conceptualization, L.M. and L.Z.; methodology, L.Z.; software, L.Z.; validation, L.M. and L.Z.; formal analysis, L.M.; investigation, L.M. and L.Z.; resources, L.M.; data curation, L.M. and Y.L.; writing—original draft preparation, L.Z.; writing—review and editing, L.M.; visualization, L.M.; supervision, L.M.; project administration, L.M.; funding acquisition, L.M. All authors have read and agreed to the published version of the manuscript.
Funding
This study was supported by National Natural Science Foundation of China (62073061), the Fundamental Research Funds for the Central Universities (N2204009), the Non-profit Central Research Institute Fund of Chinese Academy of Medical Sciences (2022-JKCS-21), Chongqing Science and Health Joint Medical Research Project (2023MSXM137), and Liaoning Provincial Natural Science Foundation Joint Fund for Medical-Industrial Crossover (2022-YGJC-31).
Data Availability Statement
Publicly available datasets were analyzed in this study. These data can be found here: https://github.com/VisDrone/VisDrone-Dataset (accessed on 27 September 2023).
Acknowledgments
The authors would like to thank the editors and the anonymous reviewers for their helpful suggestions.
Conflicts of Interest
The authors declare no conflict of interest.
Abbreviations
The following abbreviations are used in this manuscript:
| CNN | Convolutional Neural Networks |
| GCN | Graph Convolution Neural networks |
| YOLO | You Only Look Once |
| FPN | Feature Pyramid Network |
| PAN | Path Aggregation Network |
| ELAN | Efficient Layer Aggregation Networks |
| ECA | Efficient Channel Attention |
References
- Kisantal, M.; Wojna, Z.; Murawski, J.; Naruniec, J.; Cho, K. Augmentation for small object detection. arXiv 2019, arXiv:1902.07296. [Google Scholar]
- Han, J.; Ding, J.; Xue, N.; Xia, G.S. Redet: A rotation-equivariant detector for aerial object detection. In Proceedings of the IEEE/CVF Conference on Computer Vision and Pattern Recognition, Nashville, TN, USA, 20–25 June 2021; pp. 2786–2795. [Google Scholar]
- Lacoste, A.; Sherwin, E.D.; Kerner, H.; Alemohammad, H.; Lütjens, B.; Irvin, J.; Dao, D.; Chang, A.; Gunturkun, M.; Drouin, A.; et al. Toward foundation models for earth monitoring: Proposal for a climate change benchmark. arXiv 2021, arXiv:2112.00570. [Google Scholar]
- Xie, W.; Zhang, X.; Li, Y.; Lei, J.; Li, J.; Du, Q. Weakly supervised low-rank representation for hyperspectral anomaly detection. IEEE Trans. Cybern. 2021, 51, 3889–3900. [Google Scholar] [CrossRef]
- Nagarajan, M.B.; Huber, M.B.; Schlossbauer, T.; Leinsinger, G.; Krol, A.; Wismüller, A. Classification of small lesions in dynamic breast MRI: Eliminating the need for precise lesion segmentation through spatio-temporal analysis of contrast enhancement. Mach. Vis. Appl. 2013, 24, 1371–1381. [Google Scholar] [CrossRef]
- Girshick, R. Fast r-cnn. In Proceedings of the IEEE International Conference on Computer Vision, Santiago, Chile, 7–13 December 2015; pp. 1440–1448. [Google Scholar]
- Ren, S.; He, K.; Girshick, R.B.; Sun, J. Faster R-CNN: Towards Real-Time Object Detection with Region Proposal Networks. IEEE Trans. Pattern Anal. Mach. Intell. 2016, 39, 1137–1149. [Google Scholar] [CrossRef]
- Cai, Z.; Vasconcelos, N. Cascade r-cnn: Delving into high quality object detection. In Proceedings of the IEEE Conference on Computer Vision and Pattern Recognition, Salt Lake City, UT, USA, 18–23 June 2018; pp. 6154–6162. [Google Scholar]
- Zhang, H.; Wang, Y.; Dayoub, F.; Sunderhauf, N. Varifocalnet: An iou-aware dense object detector. In Proceedings of the IEEE/CVF Conference on Computer Vision and Pattern Recognition, Nashville, TN, USA, 20–25 June 2021; pp. 8514–8523. [Google Scholar]
- Liu, W.; Anguelov, D.; Erhan, D.; Szegedy, C.; Reed, S.E.; Fu, C.; Berg, A.C. SSD: Single Shot MultiBox Detector. In Proceedings of the Computer Vision–ECCV 2016: 14th European Conference, Amsterdam, The Netherlands, 11–14 October 2016; pp. 21–37. [Google Scholar]
- Redmon, J.; Divvala, S.; Girshick, R.; Farhadi, A. You only look once: Unified, real-time object detection. In Proceedings of the IEEE Conference on Computer Vision and Pattern Recognition, Las Vegas, NV, USA, 27–30 June 2016; pp. 779–788. [Google Scholar]
- Lin, T.Y.; Goyal, P.; Girshick, R.; He, K.; Dollár, P. Focal loss for dense object detection. In Proceedings of the IEEE International Conference on Computer Vision, Virtual Event, 22–29 October 2017; pp. 2980–2988. [Google Scholar]
- Zhou, X.; Wang, D.; Krähenbühl, P. Objects as points. arXiv 2019, arXiv:1904.07850. [Google Scholar]
- Ge, Z.; Liu, S.; Wang, F.; Li, Z.; Sun, J. Yolox: Exceeding yolo series in 2021. arXiv 2021, arXiv:2107.08430. [Google Scholar]
- Yang, Z.; Liu, S.; Hu, H.; Wang, L.; Lin, S. RepPoints: Point Set Representation for Object Detection. In Proceedings of the 2019 IEEE/CVF International Conference on Computer Vision (ICCV), Seoul, Republic of Korea, 27 October–2 November 2019; pp. 9656–9665. [Google Scholar]
- Lin, T.; Maire, M.; Belongie, S.J.; Hays, J.; Perona, P.; Ramanan, D.; Dollár, P.; Zitnick, C.L. Microsoft COCO: Common Objects in Context. In Proceedings of the Computer Vision–ECCV 2014: 13th European Conference, Zurich, Switzerland, 6–12 September 2014; pp. 740–755. [Google Scholar]
- Everingham, M.; Van Gool, L.; Williams, C.K.; Winn, J.; Zissermanm, A. The pascal visual object classes (voc) challenge. Int. J. Comput. Vis. 2010, 88, 303–338. [Google Scholar] [CrossRef]
- Wang, J.; Yang, W.; Guo, H.; Zhang, R.; Xia, G.S. Tiny object detection in aerial images. In Proceedings of the 2020 25th International Conference on Pattern Recognition (ICPR), Milan, Italy, 10–15 January 2021; pp. 3791–3798. [Google Scholar]
- Yu., X.; Gong, Y.; Jiang, N.; Ye, Q.; Han, Z. Scale match for tiny person detection. In Proceedings of the IEEE/CVF Winter Conference on Applications of Computer Vision, Snowmass, CO, USA, 1–5 March 2020; pp. 1257–1265. [Google Scholar]
- Wang, C.Y.; Bochkovskiy, A.; Liao, H.Y.M. YOLOv7: Trainable bag-of-freebies sets new state-of-the-art for real-time object detectors. In Proceedings of the IEEE/CVF Conference on Computer Vision and Pattern Recognition, Vancouver Canada, 18–22 June 2023; pp. 7464–7475. [Google Scholar]
- Akyon, F.C.; Altinuc, S.O.; Temizel, A. Scale match for tiny person detection—Slicing aided hyper inference and fine-tuning for small object detection. In Proceedings of the 2022 IEEE International Conference on Image Processing (ICIP), Bordeaux, France, 16–19 October 2022; pp. 966–970. [Google Scholar]
- Cira, C.I.; Alcarria, R.; Manso-Callejo, M.Á.; Serradilla, F. A framework based on nesting of convolutional neural networks to classify secondary roads in high resolution aerial orthoimages. Remote Sens. 2020, 12, 765. [Google Scholar] [CrossRef]
- Manso-Callejo, M.Á.; Cira, C.I.; Alcarria, R.; Arranz-Justel, J.J. Optimizing the recognition and feature extraction of wind turbines through hybrid semantic segmentation architectures. Remote Sens. 2020, 12, 3743. [Google Scholar] [CrossRef]
- Zhang, J.; Lei, J.; Xie, W.; Fang, Z.; Li, Y.; Du, Q. SuperYOLO: Super Resolution Assisted Object Detection in Multimodal Remote Sensing Imagery. IEEE Trans. Geosci. Remote Sens. 2022, 61, 5605415. [Google Scholar] [CrossRef]
- Chen, Z.; Wu, K.; Li, Y.; Wang, M.; Li, W. SSD-MSN: An improved multi-scale object detection network based on SSD. IEEE Access 2008, 7, 80622–80632. [Google Scholar] [CrossRef]
- Zhu, X.; Lyu, S.; Wang, X.; Zhao, Q. TPH-YOLOv5: Improved YOLOv5 Based on Transformer Prediction Head for Object Detection on Drone-captured Scenarios. In Proceedings of the 2021 IEEE/CVF International Conference on Computer Vision Workshops (ICCVW), Montreal, BC, Canada, 11–17 October 2021; pp. 2778–2788. [Google Scholar]
- Dosovitskiy, A.; Beyer, L.; Kolesnikov, A.; Weissenborn, D.; Zhai, X.; Unterthiner, T. Transformers for image recognition at scale. arXiv 2020, arXiv:2010.11929. [Google Scholar]
- Woo, S.; Park, J.; Lee, J.Y.; Kweon, I.S. Cbam: Convolutional block attention module. In Proceedings of the European Conference on Computer Vision (ECCV), Munich, Germany, 8–14 September 2018; pp. 3–19. [Google Scholar]
- yolov5. Available online: https://github.com/ultralytics/yolov5 (accessed on 6 June 2023).
- Xianbao, C.; Guihua, Q.; Yu, J.; Zhaomin, Z. An improved small object detection method based on Yolo V3. Pattern Anal. Appl. 2021, 24, 1347–1355. [Google Scholar] [CrossRef]
- Sunkara, R.; Luo, T. No More Strided Convolutions or Pooling: A New CNN Building Block for Low-Resolution Images and Small Objects. arXiv 2022, arXiv:2208.03641. [Google Scholar]
- Ding, Y.; Zhang, Z.; Zhao, X.; Hong, D.; Cai, W.; Yang, N.; Wang, B. Multi-scale receptive fields: Graph attention neural network for hyperspectral image classification. Expert Syst. Appl. 2023, 223, 119858. [Google Scholar] [CrossRef]
- Zhang, Z.; Ding, Y.; Zhao, X.; Siye, L.; Yang, N.; Cai, Y.; Zhan, Y. Multireceptive field: An adaptive path aggregation graph neural framework for hyperspectral image classification. Expert Syst. Appl. 2023, 217, 119508. [Google Scholar] [CrossRef]
- Ding, Y.; Zhang, Z.; Zhao, X.; Hong, D.; Cai, W.; Yu, C.; Yang, N.; Cai, W. Multi-feature fusion: Graph neural network and CNN combining for hyperspectral image classification. Neurocomputing 2022, 501, 246–257. [Google Scholar] [CrossRef]
- Ding, Y.; Zhang, Z.; Zhao, X.; Cai, W.; Yang, N.; Hu, H.; Cao, Y.; Cai, W. Unsupervised self-correlated learning smoothy enhanced locality preserving graph convolution embedding clustering for hyperspectral images. IEEE Trans. Geosci. Remote Sens. 2022, 60, 5536716. [Google Scholar] [CrossRef]
- Ding, Y.; Zhang, Z.; Zhao, X.; Hong, D.; Li, W.; Cai, W.; Zhan, Y. AF2GNN: Graph convolution with adaptive filters and aggregator fusion for hyperspectral image classification. Inf. Sci. 2022, 602, 201–219. [Google Scholar] [CrossRef]
- Liu, Y.; Li, Q.; Yuan, Y.; Du, Q.; Wang, Q. ABNet: Adaptive balanced network for multiscale object detection in remote sensing imagery. IEEE Trans. Geosci. Remote Sens. 2021, 60, 5614914. [Google Scholar] [CrossRef]
- Hu, L.L. Erforschung von Algorithmen zur Mobilen Gesichtserkennung. Master’s Thesis, Zhejiang Sci-Tech University, Hangzhou, China, 2019. [Google Scholar]
- Zheng, Z.; Wang, P.; Liu, W.; Li, J.; Ye, R.; Ren, D. Distance-IoU loss: Faster and better learning for bounding box regression. In Proceedings of the AAAI Conference on Artificial Intelligence, New York, NY, USA, 7–12 February 2020; pp. 12993–13000. [Google Scholar]
- Zhang, Y.; Ren, W.; Zhang, Z.; Jia, Z.; Wang, L.; Tan, T. Focal and Efficient IOU Loss for Accurate Bounding Box Regression. Neurocomputing 2021, 506, 146–157. [Google Scholar] [CrossRef]
- Zhu, P.; Wen, L.; Du, D.; Bian, X.; Hu, Q.; Ling, H. Vision meets drones: Past, present and future. arXiv 2020, arXiv:2001.06303. [Google Scholar]
- Wang, Q.; Wu, B.; Zhu, P.; Li, P.; Zuo, W.; Hu, Q. ECA-Net: Efficient channel attention for deep convolutional neural networks. In Proceedings of the IEEE/CVF Conference on Computer Vision and Pattern Recognition, Seattle, WA, USA, 13–19 June 2020; pp. 11534–11542. [Google Scholar]
- Hsieh, M.R.; Lin, Y.L.; Hsu, W.H. Drone-based object counting by spatially regularized regional proposal network. In Proceedings of the IEEE International Conference on Computer Vision, Venice, Italy, 24–27 October 2017; pp. 4145–4153. [Google Scholar]
- Redmon, J.; Farhadi, A. Yolov3: An incremental improvement. arXiv 2018, arXiv:1804.02767. [Google Scholar]
- Bochkovskiy, A.; Wang, C.; Liao, H.M. YOLOv4: Optimal Speed and Accuracy of Object Detection. arXiv 2018, arXiv:2004.10934. [Google Scholar]
- Li, C.; Li, L.; Jiang, H.; Weng, K.; Geng, Y.; Li, L.; Ke, Z.; Li, Q.; Cheng, M.; Nie, W.; et al. YOLOv6: A Single-Stage Object Detection Framework for Industrial Applications. arXiv 2022, arXiv:2209.02976. [Google Scholar]
- yolov8. Available online: https://github.com/ultralytics/yolov8 (accessed on 10 January 2023).
- Yu, G.; Chang, Q.; Lv, W.; Xum, C.; Cui, C.; Ji, W.; Dang, Q.; Deng, K.; Wang, G.; Du, Y.; et al. PP-PicoDet: A Better Real-Time Object Detector on Mobile Devices. arXiv 2021, arXiv:2111.00902. [Google Scholar]
- Xu, S.; Wang, X.; Lv, W.; Chang, Q.; Cui, C.; Deng, K.; Wang, G.; Dang, Q.; Wei, S.; Du, Y.; et al. PP-YOLOE: An evolved version of YOLO. arXiv 2022, arXiv:2203.16250. [Google Scholar]
- Hu, M.; Li, Z.; Yu, J.; Wan, X.; Tan, H.; Lin, Z. Efficient-Lightweight YOLO: Improving Small Object Detection in YOLO for Aerial Images. Sensors 2023, 23, 6423. [Google Scholar] [CrossRef]
Disclaimer/Publisher’s Note: The statements, opinions and data contained in all publications are solely those of the individual author(s) and contributor(s) and not of MDPI and/or the editor(s). MDPI and/or the editor(s) disclaim responsibility for any injury to people or property resulting from any ideas, methods, instructions or products referred to in the content. |
© 2023 by the authors. Licensee MDPI, Basel, Switzerland. This article is an open access article distributed under the terms and conditions of the Creative Commons Attribution (CC BY) license (https://creativecommons.org/licenses/by/4.0/).