1. Introduction
The participation of Unmanned Aerial Vehicles (UAVs) or drones in civil activities has increased due to their versatility in any environment. Most commercial UAVs are classified as Micro Aerial Vehicles (MAVs), restricted to up to 5 kg, a communication range of about 10 km, and a maximum altitude of 250 m [
1]; they can be wing-based or multirotor, and their cost is often less than other civil UAVs.
MAVs frequently are deployed to search, surveil, patrol, and perform other activities which generate information to make decisions in agriculture, disaster management, and other processes that require monitoring in space and time. These tasks are framed in the CPP (Coverage Path Planning) problem [
2] which usually has three stages; path planning, allocation, and deployment [
3]. The key to an efficient coverage plan is to visit all waypoints of a workspace, avoiding obstacles or Zones of Low Interest (ZLIs). However, this type of mission can fail in restricted (and large) workspaces since the MAVs have a limited operational flight, around 15 to 30 min, which decreases by payload, angular acceleration changes, maneuvers against the wind, and continuous deployments.
This limitation has been studied in research projects and some commercial initiatives using energy management through optimal paths and a global positioning [
4], with recharge stations in the middle of the course of the MAVs [
5] and using a fleet of MAVs [
6]. Even though the latter approach has significant challenges, the current proposal is centered on it, since optimizing the mission with a single MAV may not be enough to cover restricted workspaces. The recharge stations require electric infrastructure in the workspace, which is not available for most workspaces such as crops, forests, and other hostile areas.
A fleet of MAVs can be modeled based on the theory of multiple robotic agents that can cooperate to accomplish a coverage mission [
7]. The coordination model can be centralized, hierarchical, decentralized, or hybrid. However, the last ones have a significant preference because they are robust to faults and can combine local and high-level control to solve complex tasks [
8]. The no-centralized management has two paradigms: the swarm-type and the heterogeneous systems. The coordination of a swarm involves multiple homogeneous agents with behavior inspired by biological societies. For the second paradigm, heterogeneity can be defined in behavior, morphology, performance, size, or cognition. A heterogeneous system exploits the swarming coordination’s parallelism, redundancy, and distributed solutions. Moreover, it can include mission specifications because the agents have different skills and payloads [
9].
From the previous context, this paper works with a decentralized model to deploy multiple MAV agents for coverage missions in restricted workspaces. However, the multi-drone technology is still not a part of the daily activities of users, possibly because most alternatives work for environments and users in ideal conditions. A typical user does not have the technical knowledge and is unprepared for a dynamic workspace’s cost and possible risks. In answer, the first premise of the current solution is to consider simple MAVs, easily acquired and adaptable, for example, Ardupilot, Parrot, and DJI. These commercial MAVs facilitate use and maintenance and mitigate the risk of investment on possible missed missions. From this approach, the question to solve is how to efficiently deploy multiple MAVs for coverage missions conditioned to environments with restricted access.
The present research works on the off-line multi-CPP problem since online planning would require continuous communication and processing resources that simple MAVs and restricted environments cannot support [
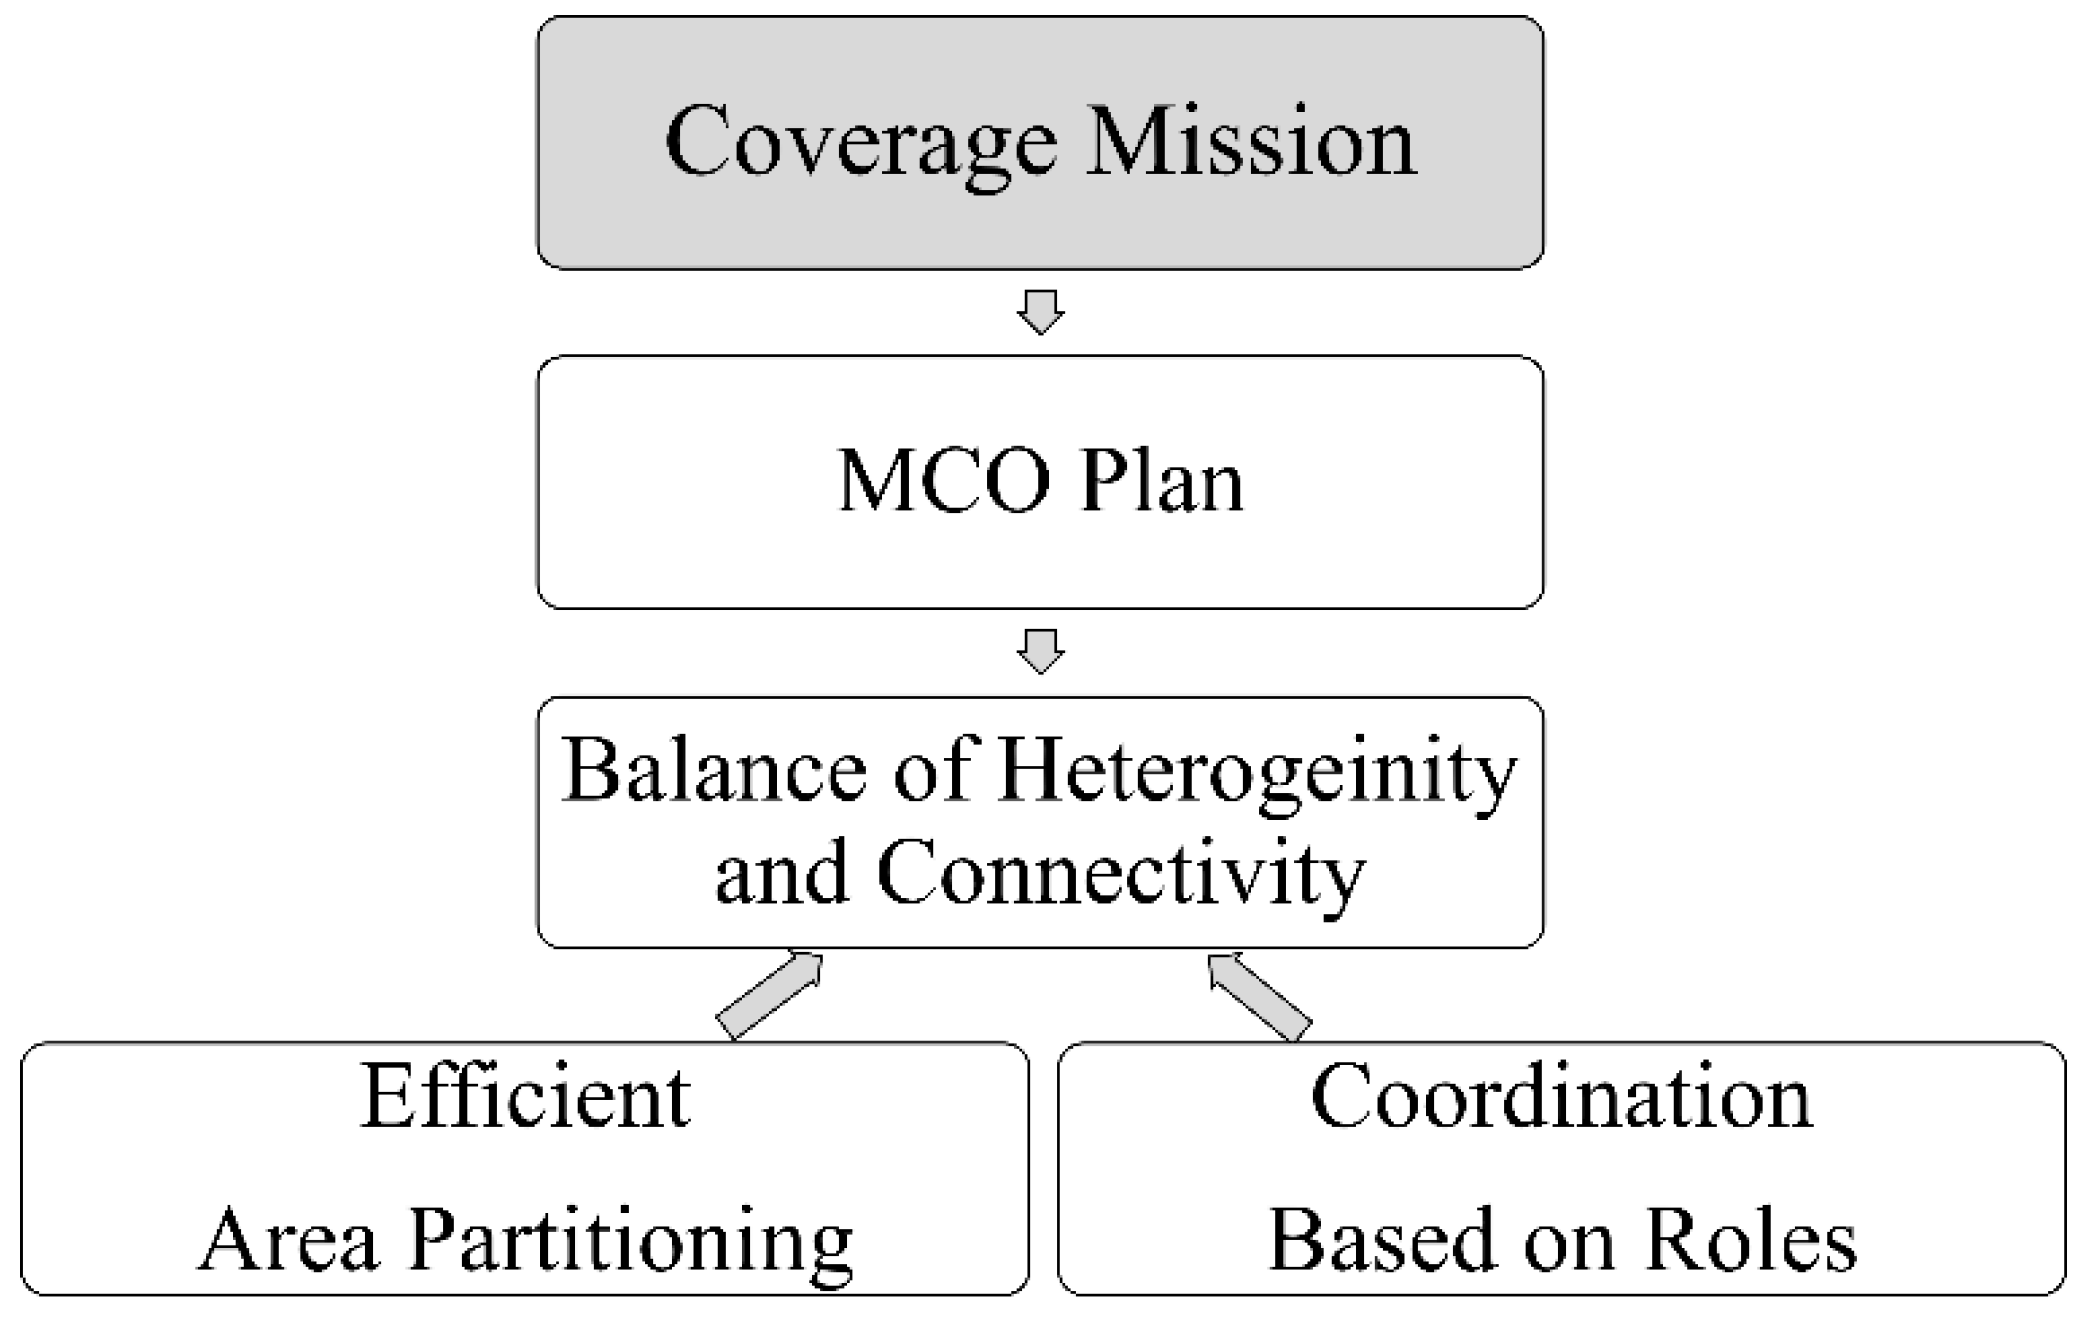
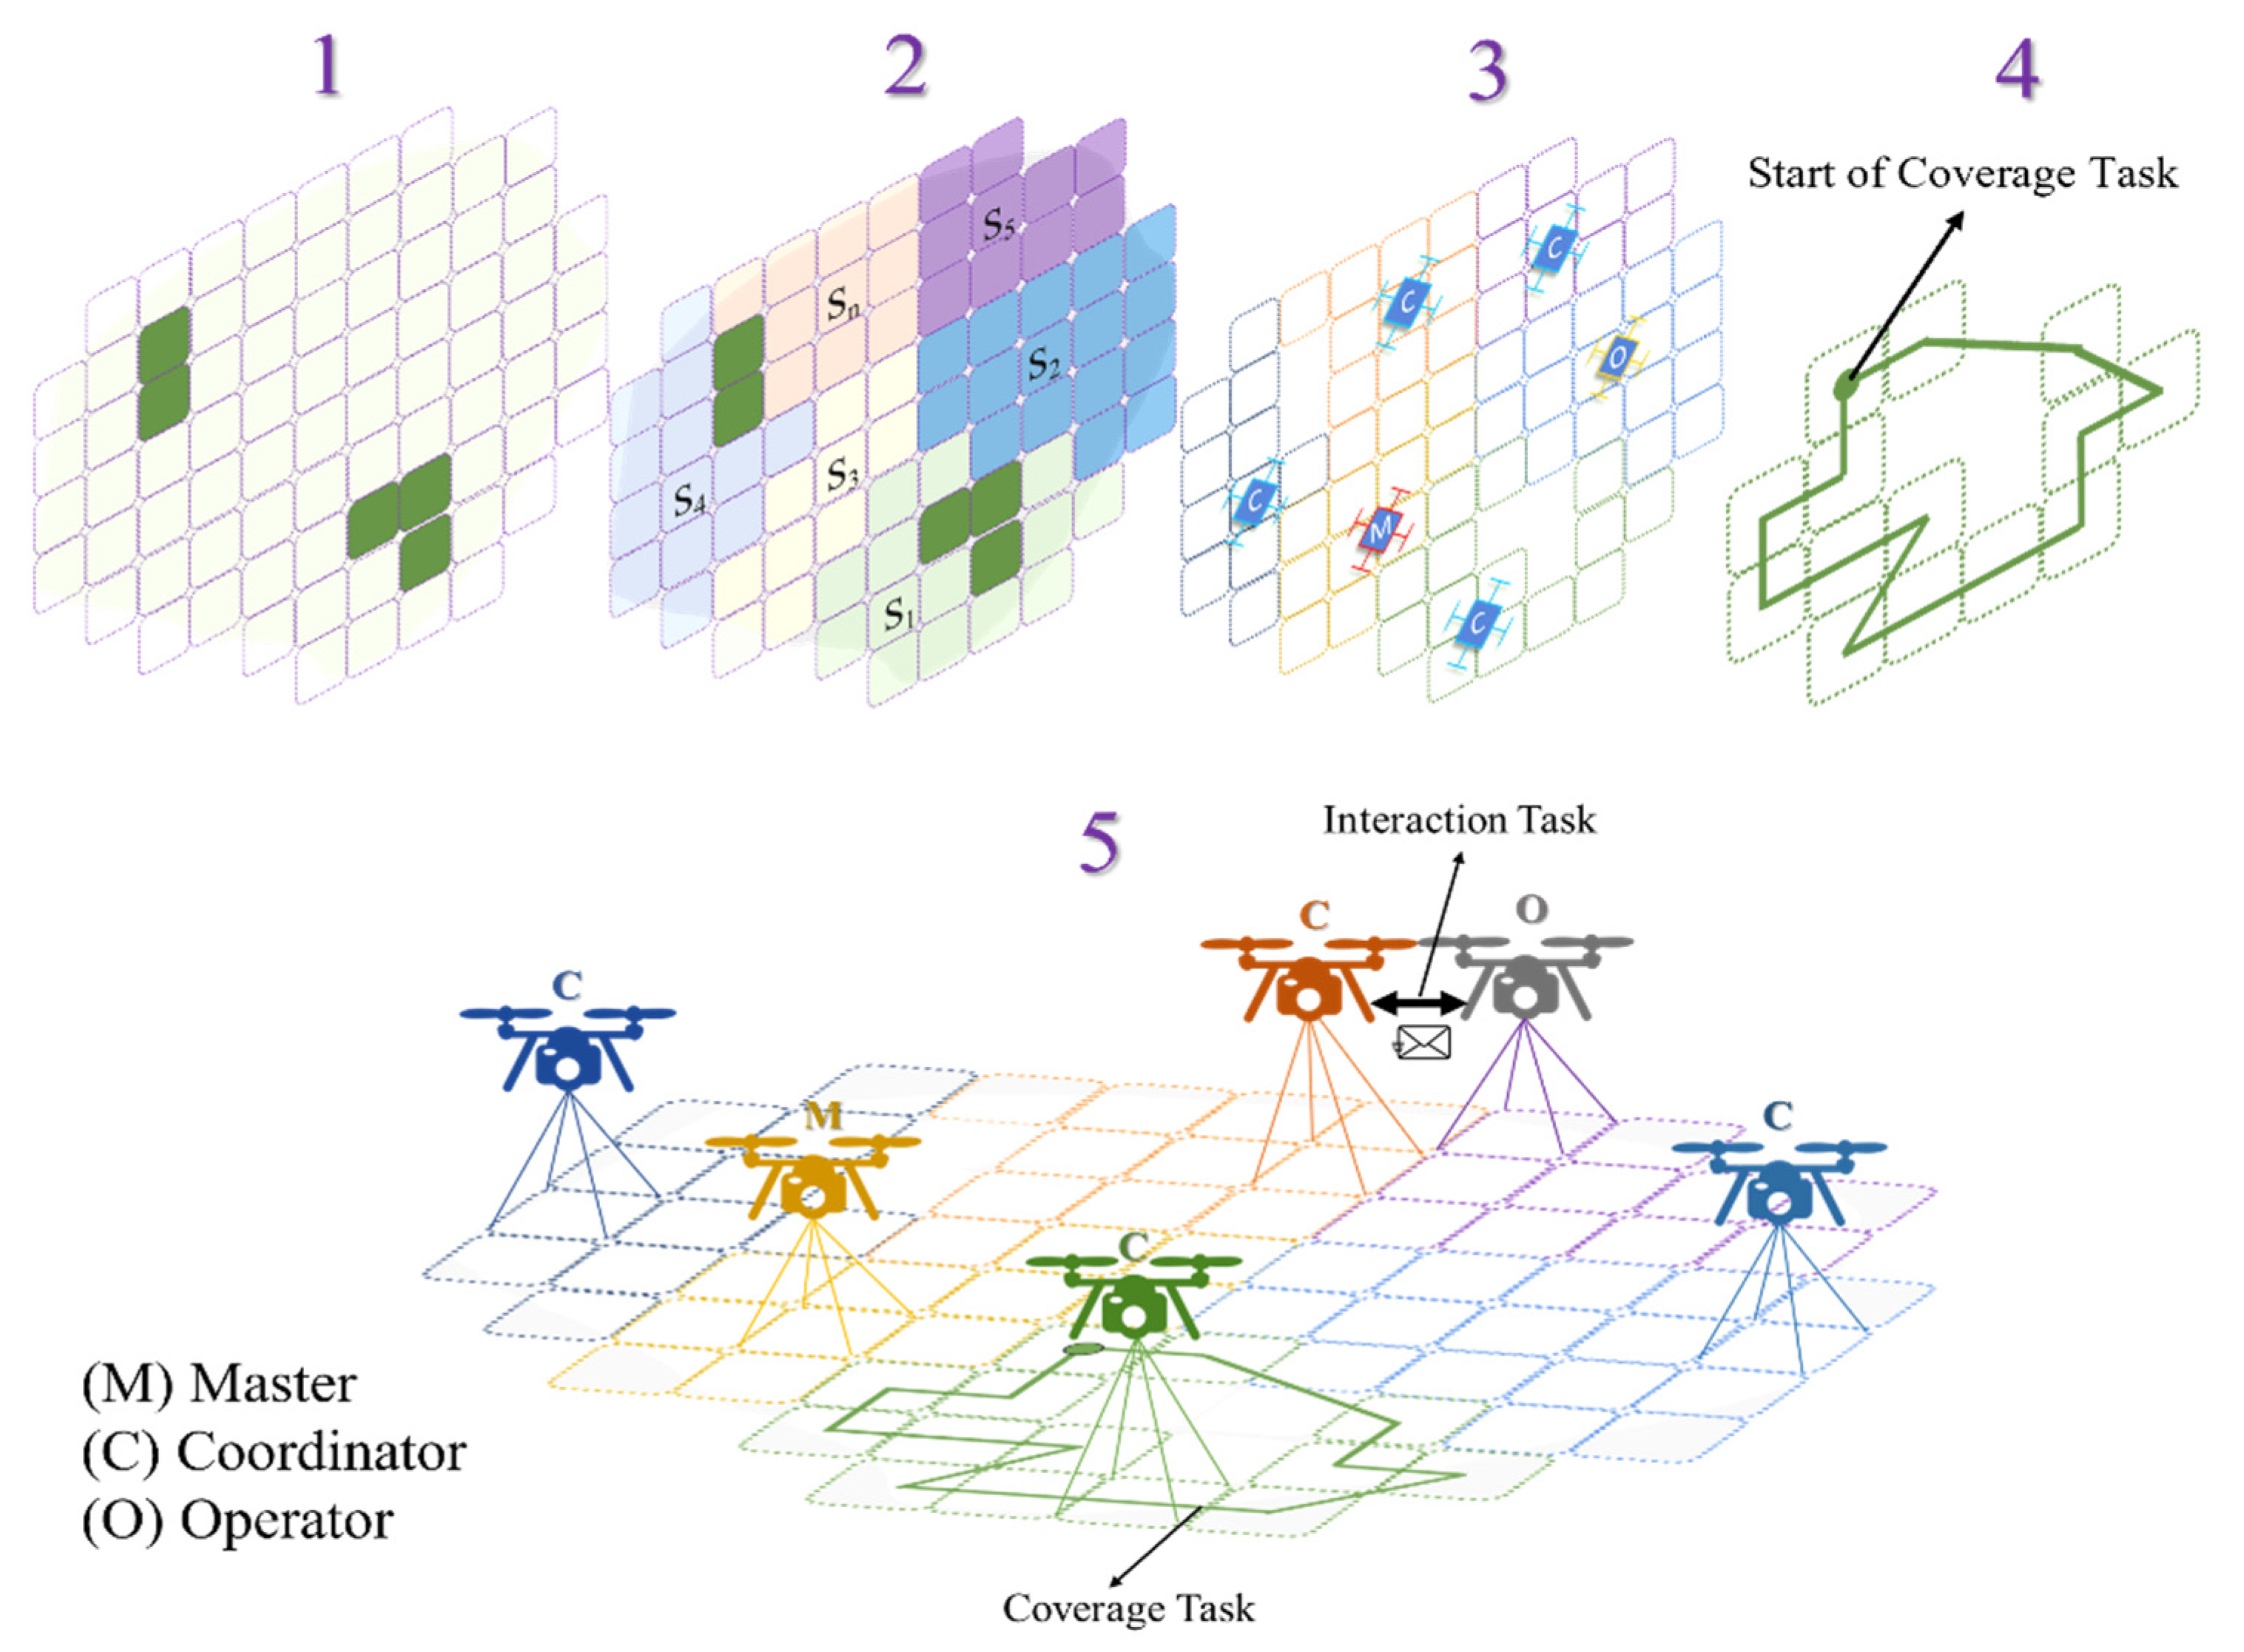
10]. The solution is a plan for area coverage missions based on the balance of the heterogeneity of MAVs and the connectivity of the fleet (
Figure 1). Both are engaged with area partitioning inspired by the Voronoi-tessellation but extended to heterogeneous polygonal sub-areas. The resulting tasks are profiled for agents of type Master, Coordinator, and Operator (MCO). Then, tasks are allocated to the MAVs using an auction mechanism. The main job of an agent is to follow a coverage path, which is calculated with the Firefly algorithm, given as a near-optimal solution to the Traveling Salesman Problem (TSP) for each area partition. The second task is to interact with near neighbors, which is restricted by the role and the communication range.
The GAMA platform [
11] was selected to validate the hypothesis described in
Figure 1 due to its extensive features to model physical agents and geographic environments. The results show better resource management of the MCO Plan after comparing it with other alternatives such as Boustrophedon-based and clustering-based planning. The experiments state the performance of the MCO plan in three different workspaces throughout the analysis of scores such as the task standard deviation, remaining energy in the end mission, and the likely number of links. The mean values, 8% for standard deviation, 60% for saved power, and five links per MAV, prove a balanced heterogeneity and connectivity skill.
The remaining paper is organized as follows:
Section 2 describes related work on the coverage mission for multiple heterogeneous MAVs. The subsequent problem statement is defined in
Section 3.
Section 4 states the materials and proposed methods to plan a coverage mission.
Section 5 presents and analyzes the simulated results using the GAMA platform. Finally, the conclusion and future research are described in
Section 6.
2. Related Work
Some outstanding papers sorted by coverage planning mechanisms for multiple MAVs were selected for this section. The following classification describes a timeline with specified methods of world abstraction, area partitioning, and coordination.
2.1. Polygon-Based Coverage Plans
One of the pioneering works on this topic was found in [
12]. The problem they tried to solve was a cooperative search in areas while considering the computational complexity required to implement in near real-time applications. Maza and Ollero defined a polygonal decomposition of the region; every drone was assigned to one of the resulting polygons by a ground coordinator based on deterministic scores. Next, they proposed optimizing the UAV coverage path by minimizing the number of turns during a zigzag pattern, using the optimal sweep direction (flight lines) of fixed-wing MAV for surveillance.
The work in [
13] was representative of the 2D coverage solutions. Valente divided the workspace into grid-like cells and planned the sub-areas with the best approximation to the minimum line segment. The off-line planning considered the inherent limitations of a raster and other constraints to be optimized. A heuristic wavefront was extended on a graph generated by the neighborhood adjacency to calculate the coverage paths. Further, the authors proposed task negotiations based on an auction mechanism only at the coverage mission start. Following the line of optimal coverage with MAVs, the authors in [
14] decomposed the observed area into that of a regular grid, partitioning the area by equal vertical segments. The area was rotated to find the optimal sweep direction and paths with few flight lines. They compared the spiral, Zamboni, and lawnmower patterns to calculate the coverage paths. The paths were complemented with the Dubbin curves to optimize the agent energy. The work presented did not include a coordination mechanism for the coverage mission; however, [
15] proposed a one-to-one coordination algorithm for area partition in patrolling missions that considered limitations of communication. This decentralized strategy was aimed at minimizing the refresh time of the mission; every MAV only exchanged information with nearby neighbors. They proposed a rectangular decomposition and techniques of re-allocation using close links iteratively.
Balampanis et al. in [
16] described a novel algorithm for heterogeneous coverage missions in non-convex coastal regions with ZLIs. The Constrained Delaunay Triangulation (CDT) was used to represent the workspace, and the paths were spirals centered in the first cell labeled for an improved wave-front algorithm. The sub-regions were calculated according to the MAV capabilities and a defined start position; then, the paths were adjusted to solve deadlock situations. Ardupilot SITL instances validated the results in the ROS framework. In recent proposals, area partitioning has token relevance for maritime applications [
17]. The work uses a polygon decomposition algorithm to carry out complete search coverage. The strategy fixed the start positions on the edge to divide the workspace through line segments that considered the areas and optimized with a ‘maximizing-minimum angle’ mechanism. The numerical results showed the performance and computational complexity of the proposed algorithm. The coverage path was a parallel sweep search pattern that was improved by decreasing the turns and the traveled distance. A critical approach was found in [
18] to surveilling missions. They split the area of interest given the number of MAVs, the requirements for the site to be covered, and the initial position of each MAV. The coverage path was a back-and-forth pattern with a given cross-track separation. The novel partitioning method was based on the directed graph of the triangular sub-regions by a constrained Delaunay triangulation. Each sub-region was adjusted with a pseudo-site to start the mission. The path assignment was centralized and considered few turns. Finally, a generalized proposal of the polygon decomposition for any robotic agent was presented in [
19]. The basis of the proposal was to divide a polygon into two parts for given area requirements in terms of the perimeter of the corresponding part. The algorithm continued until it split the workspaces in the given number of vertices in the polygon’s border. The authors only worked on the mathematical solution to divide a polygon for any range of applications.
2.2. Clustering-Based Coverage Plans
The coverage mission based on polygons is frequently oriented in the area geometry and ZLIs. Still, clustering is focused on dividing the workspace into homogeneous sub-areas that could be heterogeneous with ZLIs-included. For instance, [
20] decomposed the total area using the K-means algorithm. A genetic algorithm calculated the coverage paths for each cluster, and a single MAV was assigned for each group. They proposed two variants of a method for offline and online coverage paths, and the analysis was done for small, medium, and large areas.
Similarly, in [
21], an area reconnaissance mission was deployed with offline planning to start the task and a partial online re-planning. The pre-planning was based on the Spanning Tree Coverage algorithm; then, a fuzzy C-means clustering algorithm was executed to calculate the multiple paths and corresponding sub-areas. The online re-planning was designed to distribute tasks in case of MAV failures.
Leng et al. in [
22] presented a new proposal to optimize the paths and maximize the ground visibility considering the natural occlusions in forests. The authors changed the traditional grid abstraction by the Voronoi cells to represent the waypoints to be visited. Each MAV was assigned to a cluster of Voronoi cells to carry out surveillance. The coverage path for each MAV was calculated with a custom clustered spiral-alternating algorithm. Following the balance between areas, paths, and number of MAVs, in [
23], the coverage mission was defined by solving the Multiple Traveling Salesman Problem (m-TSP). First, collision-free sub-areas were generated by the αβ swap algorithm. The second part updated the sub-areas to find the partitioning that minimizes the longest MAV path. They allocated paths to MAVs which had nearly equivalent lengths.
The authors in [
24] proposed a solution to solve the problem of multi-MAV coverage path planning that divided the region based on Reinforcement Learning with a grid world. The initial cell is random, and each agent has a camera to acquire information. The global control of the fleet is defined by a mechanism of Deep reinforcement learning with Double Q-learning Networks (DDQN). The coverage showed that different start positions are independent of the capacity to cover all spaces. The results proved autonomous collaboration in dynamic environments with energy constraints.
Inspired by the algorithm called Clustering by the Fast Search and Find of Density Peaks (CFSFDP) [
25], the regions were classified into clusters and obtained approximate optimal point-to-point paths for UAVs. The simulated UAVs are heterogeneous in their flying speed, energy supply, and scanning width of onboard sensors. The coverage path was calculated under MILP formulation, although the waypoints were efficiently visited with complementary optimization strategies. The Nearest-to-any policy to classify unallocated regions into clusters and an Order optimization strategy to adjust the visiting order of the areas classified into the same group resulted in a reduced task time of MAVs.
Comparable to the previous works considering communication requirements, in [
26], a fleet of AI-driven MAVs was modeled to survey urban zones. The proposal mixed Artificial Neural Networks and a modified version of the famous A* pathfinder to solve the coverage path planning. The workspace was clustered by combining K-means and the Voronoi Diagrams for a homogeneous distribution. The results with different complex areas were computed on the Gazebo simulator using the ROS framework.
2.3. Heuristics-Based Coverage Plans
The mentioned works may be classified as medium to low computational requirements for MAVs. In contrast, heuristics-based mechanisms require high computational capacity.
In [
27], the overall goal was to quickly build overview mosaics from unknown areas for emergency and disaster response cases. They focused on wireless communication networks for the transmission and control of acquired images. The online path planning was based on the parallel Clarke and Wright savings algorithm and clustering combined with the Christofides algorithm. Specifically, the mission was for area coverage, but they designed an architecture to acquire images with onboard processing, annotating with other sensor data, and transferring by a prioritized scheme. In [
28], the coverage planning for multiple UAVs was assumed for a known region and divided into square cells. The spiral algorithm was applied to the search for uncovering cells, and the A* algorithm was used to find the shortest path. The main contribution was a contingency strategy when a UAV failed; it skipped all next path planning for that UAV. The remaining un-surveyed region was automatically assigned to the other UAVs from the base station. In [
29], explicit communication was also considered to become a fault-tolerant system. A multi-agent system decentralized for field coverage and weed mapping was introduced with a re-broadcast protocol to account for limited communication ranges. A stochastic exploration strategy based on a reinforced random walk was used, and a mechanism to avoid re-visited areas was defined. Each agent had a local map to store the information acquired from onboard processing or received from other agents through communication. In this work, the results showed that the decentralized, self-organizing nature of the solution led to robustness against faults.
The most recent studies continue to improve the energy consumption of MAVs. In [
30], an imagery mission was described using a column generation framework. The authors defined a flight profile to estimate the energy consumption in the mission. The shape was calculated for each coverage path based on an algorithm called RBECOM that calculated an optimal solution by minimizing both the length of a returning path and the number of turns. The sub-regions were calculated by adding a constant to the same model to define a combination of routes that required the least amount of total energy. Another case that considered energy consumption was found in [
31] for data collection missions. The paper conserved energy by optimization of the trajectory plan of a cooperative fleet of MAVs. The planning was based on an algorithm called Deep Learning Trained by Genetic Algorithm (DL-GA). The GA received inputs from various scenarios and then the deep neural network was trained while facing familiar scenarios; it could rapidly provide the optimized path which satisfied continuous operations. The solution reached a speed to process a solution better compared with the GA algorithm.
2.4. Conclusion of Coverage Plans
The review of multi-MAV systems for coverage missions denoted that offline planning based on computational geometry had been more often implemented. This result could be because practical work frequently requires campaign workers and infrastructure in the field; therefore, simulated scenarios and/or experiments with few agents could accelerate and cheapen the tests. The scope of the polygonal-based methods was to optimize the division of areas with ZLIs, but it did not consider cooperation. The clustering strategy resulted in an approach to plan optimal coverage with possible collaboration between agents; however, little of the energy consumption heterogeneity was deepened. Finally, the alternative based on heuristics was closer to the goal of autonomous and robust multi-agent systems, but they used high computational resources to compute sub-areas and paths. In addition, continuous communication between all MAVs was delimited. In brief, few works reached the resource balance between task allocation and communication challenges in coverage planning. Further, none of the found results included user restrictions on planning a mission with a MAV fleet.
3. Problem Statement and Principles
The research problem is centered on the coordination of a fleet of MAVs for coverage missions in restricted workspaces. The challenge is to become effective in practical scenarios where it is necessary to think about the investment, the technological usability, and the usefulness of the information to make decisions. The current paper aims to reach a solution considering the user context and the restrictions of workspaces. A user can be a farmer, a security company, a forest manager, a search and rescue squad, an archaeologist, and other persons who make decisions based on remote information. The typical user is not interested in technological knowledge but in making decisions without loss. Therefore, a restriction would be to deploy coverage missions with commercial and adaptable MAVs to facilitate the use, maintenance, and data acquisition, and mitigate the risk in the investment concerning the restricted workspace, including lack of electricity supply, rugged relief, and changing weather.
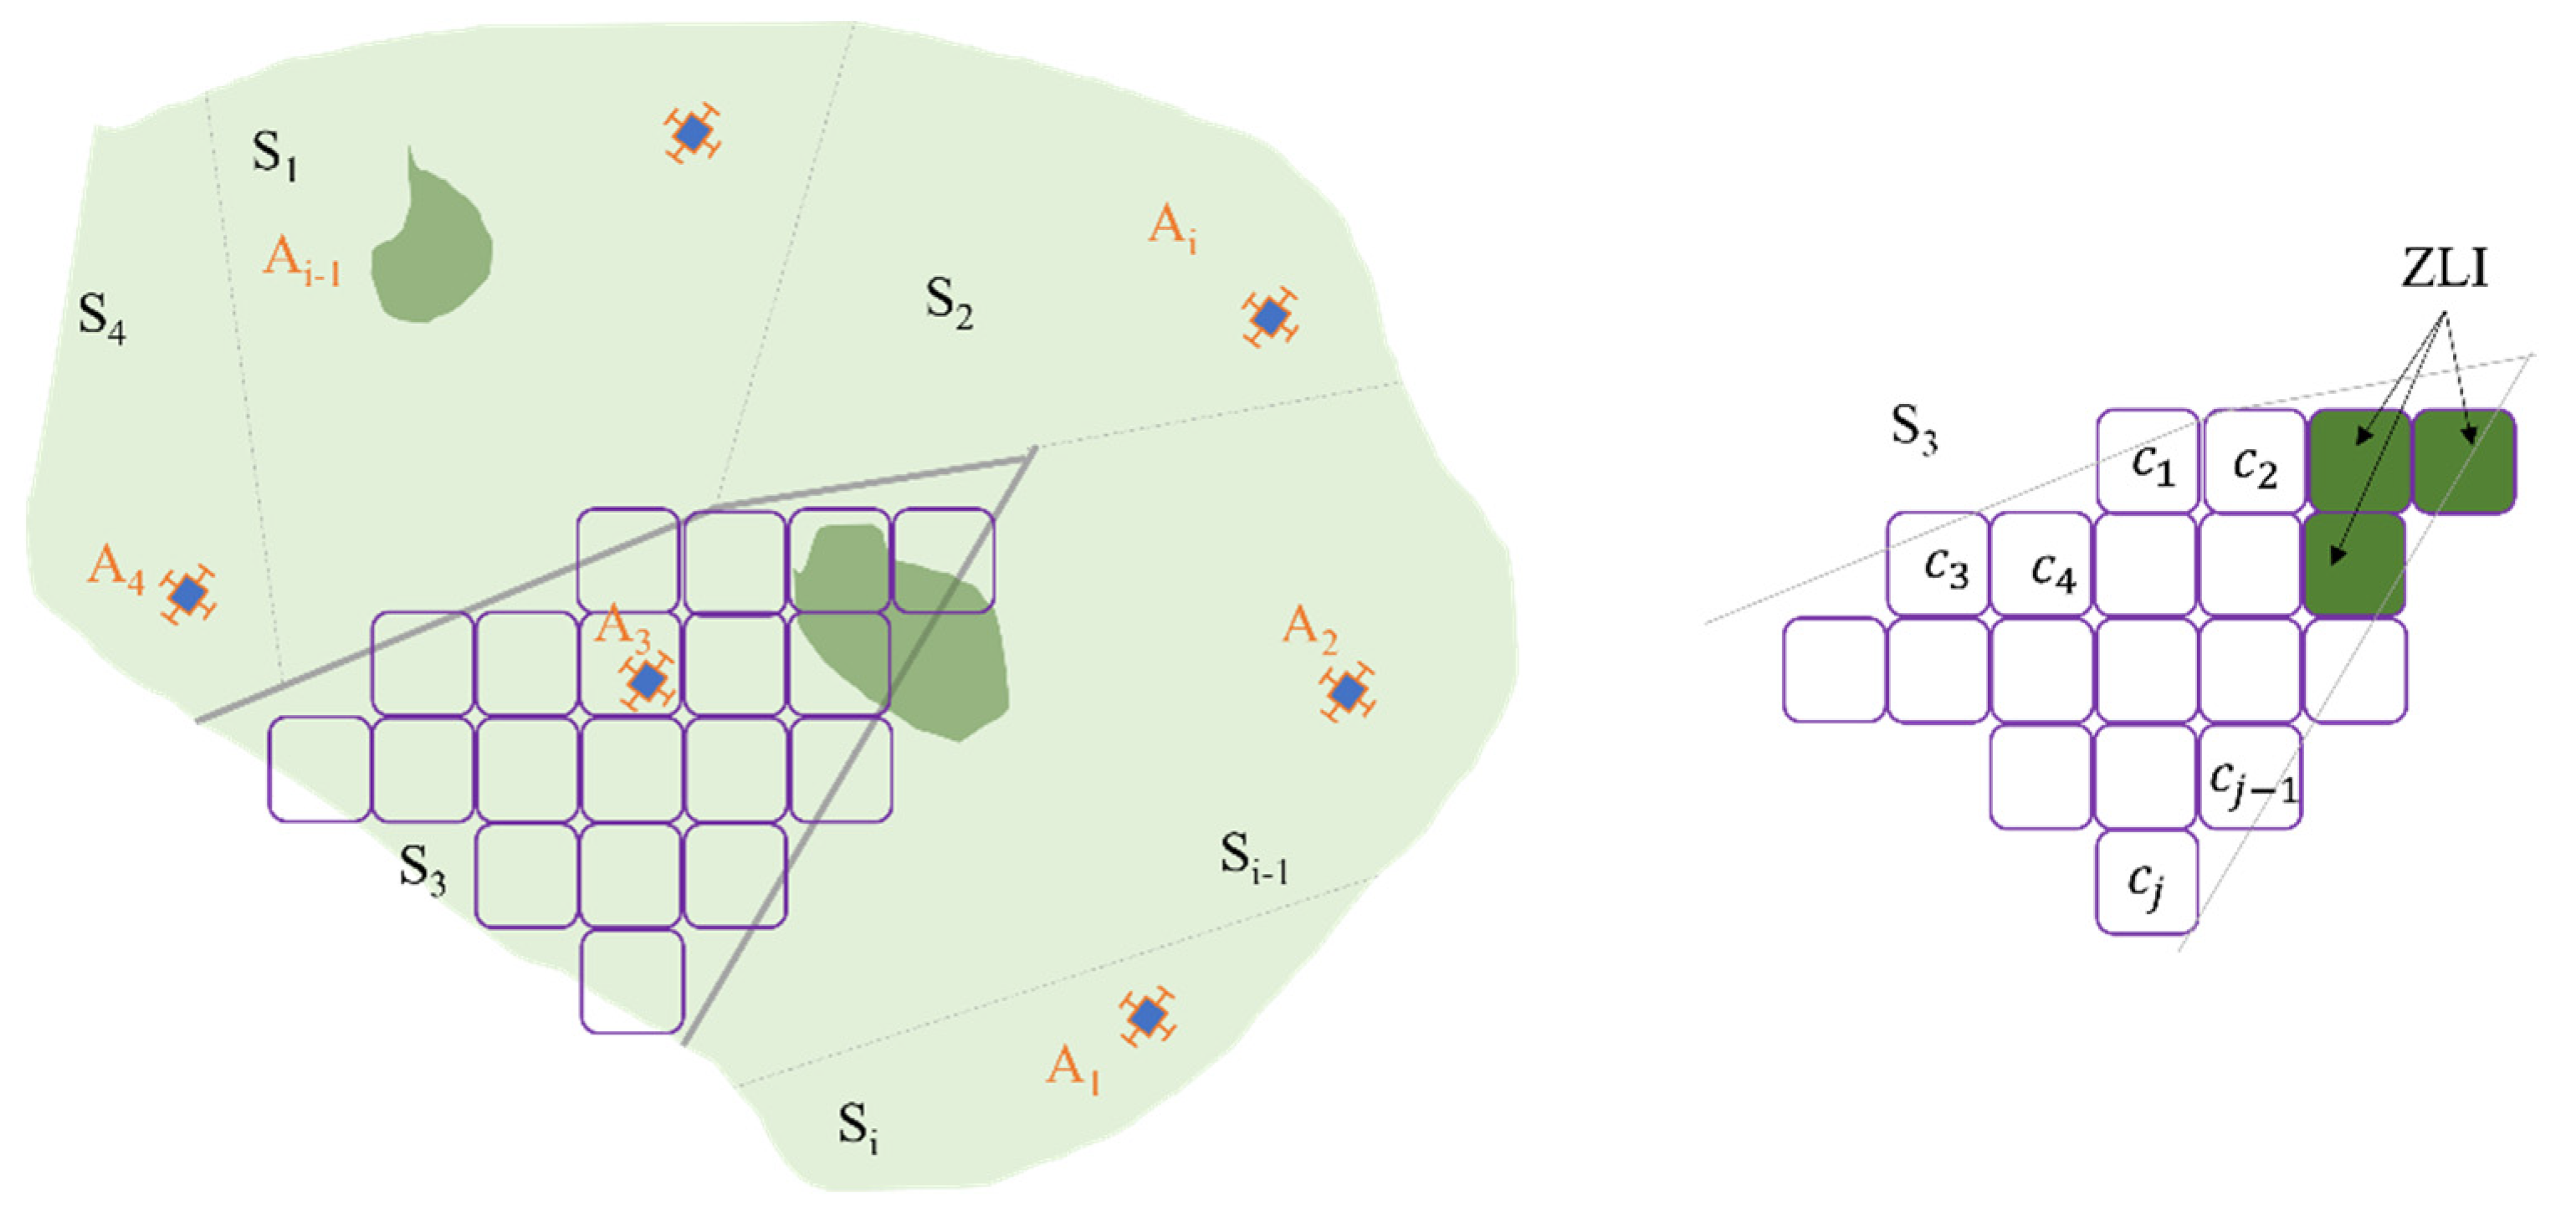
In order to solve this problem, the research must obtain complete information on using multiple MAVs. Complete information means the acquired data corresponds to the area of interest; it tries the CPP problem in multiple regions with communication-enabled MAVs to support future cooperation. Then, the statement to deploy a coverage mission starts with a group of heterogeneous MAVs and a known polygonal area representing a restricted workspace. The workspace is partitioned into sub-areas with corresponding sub-tasks allocated to the MAVs.
Let A
1, A
2, …, An be a fleet of n MAV agents performing the coverage mission. Let S be the total coverage area, and consider each sub-area as a set of S cells. Then, S
1, S
2, …, Si are sub-areas of S, where Si is assigned to one MAV agent An. In
Figure 2, each sub-area Si is decomposed into cells as close as possible to the footprint size of the MAV remote sensor, which is called world abstraction.
Each MAV is modeled as an agent with skills to move, perceive its state and the environment, follow a plan, reach a goal, interact, and adapt to a behavior. The MAV agent is modeled with the Belief-Desire-Intention (BDI) control [
32], and the interaction is based on FIPA (Foundation for Intelligent Physical Agents) protocols.
According to previous studies, the research starts from the following principles:
P1. The total coverage area S is known, and it should have an extension at least three times greater than the traveled nominal distance of a single MAV agent.
P2. The ZLIs can be identified in S. If a sub-area has ZLIs, the corresponding cells should not be considered on the task. Then, each An should be allocated only with the free cells
of each Si (
Figure 2).
P3. Each An should have basic communication capabilities to support the interaction. The connectivity skill is required for possible cooperative tasks.
P4. All MAV agents on the mission have the same flight height and speed. In practice, it will not happen, but the current interest is for bi-dimensional coverage and slow cruising speeds.
P5. A Si sub-area corresponding to each MAV agent cannot be disjointed or intersected with another sub-area; this principle is to avoid collisions during the mission.
P6. The number of MAV agents, n, is fixed by the user. The coverage planning should be done with available MAVs without forcing the user to make a more significant investment.
P7. There should be a ground station to monitor agents. Frequently, the station will be close to buildings or an electric supply.
P8. The heterogeneity of MAV agents is given by the adequate flight time, decision capacity, and communication skills.
P9. The MAV agents have the same remote sensor as the payload. The payload is a user’s decision to obtain data related to the corresponding business.
4. Coverage Mission Planning
The proposed solution to deploy multiple heterogeneous MAVs is classified as a polygon-based coverage mission plan. The decision is a result of contrasting the works in
Section 2. The techniques based on heuristics are discarded because they require high computational capacity and persistent connectivity of the fleet, which could imply an energy excess and additional time to complete the mission. The clustering-based category was rejected because the resulting sub-areas become homogeneous, and the computational complexity could restrict possible practical deployments of coverage missions. However, the strengths of the focuses in the related works are integrated into a novel method of coverage mission planning according to the principles in the problem statement (
Section 3).
Consequently, the following content describes the technology to model MAVs as agents and the proposed plan to solve the research problem, called MCO, by the agents’ roles (Master, Coordinator, and Operator). The method is stated step-by-step through five components: world abstraction, area partitioning, role allocation, task generation, and task allocation. The MCO Plan is assumed to run at the mission start.
4.1. Agent-Based Simulation
Different alternatives were found to model robotic agents, some more cited such as NetLogo [
33] and Repast Simphony [
34], and others such as MAS-Planes [
35] focused only on UAVs. However, a physical engine and communication skills are required to model MAVs. Both factors are found in the GAMA Platform [
11]. The platform has a friendly programming language (GAML), communication protocols for physical agents, complete documentation, and a development community. In addition, the GAMA models are spatially explicit and extended by including GIS (Geographic Information Systems).
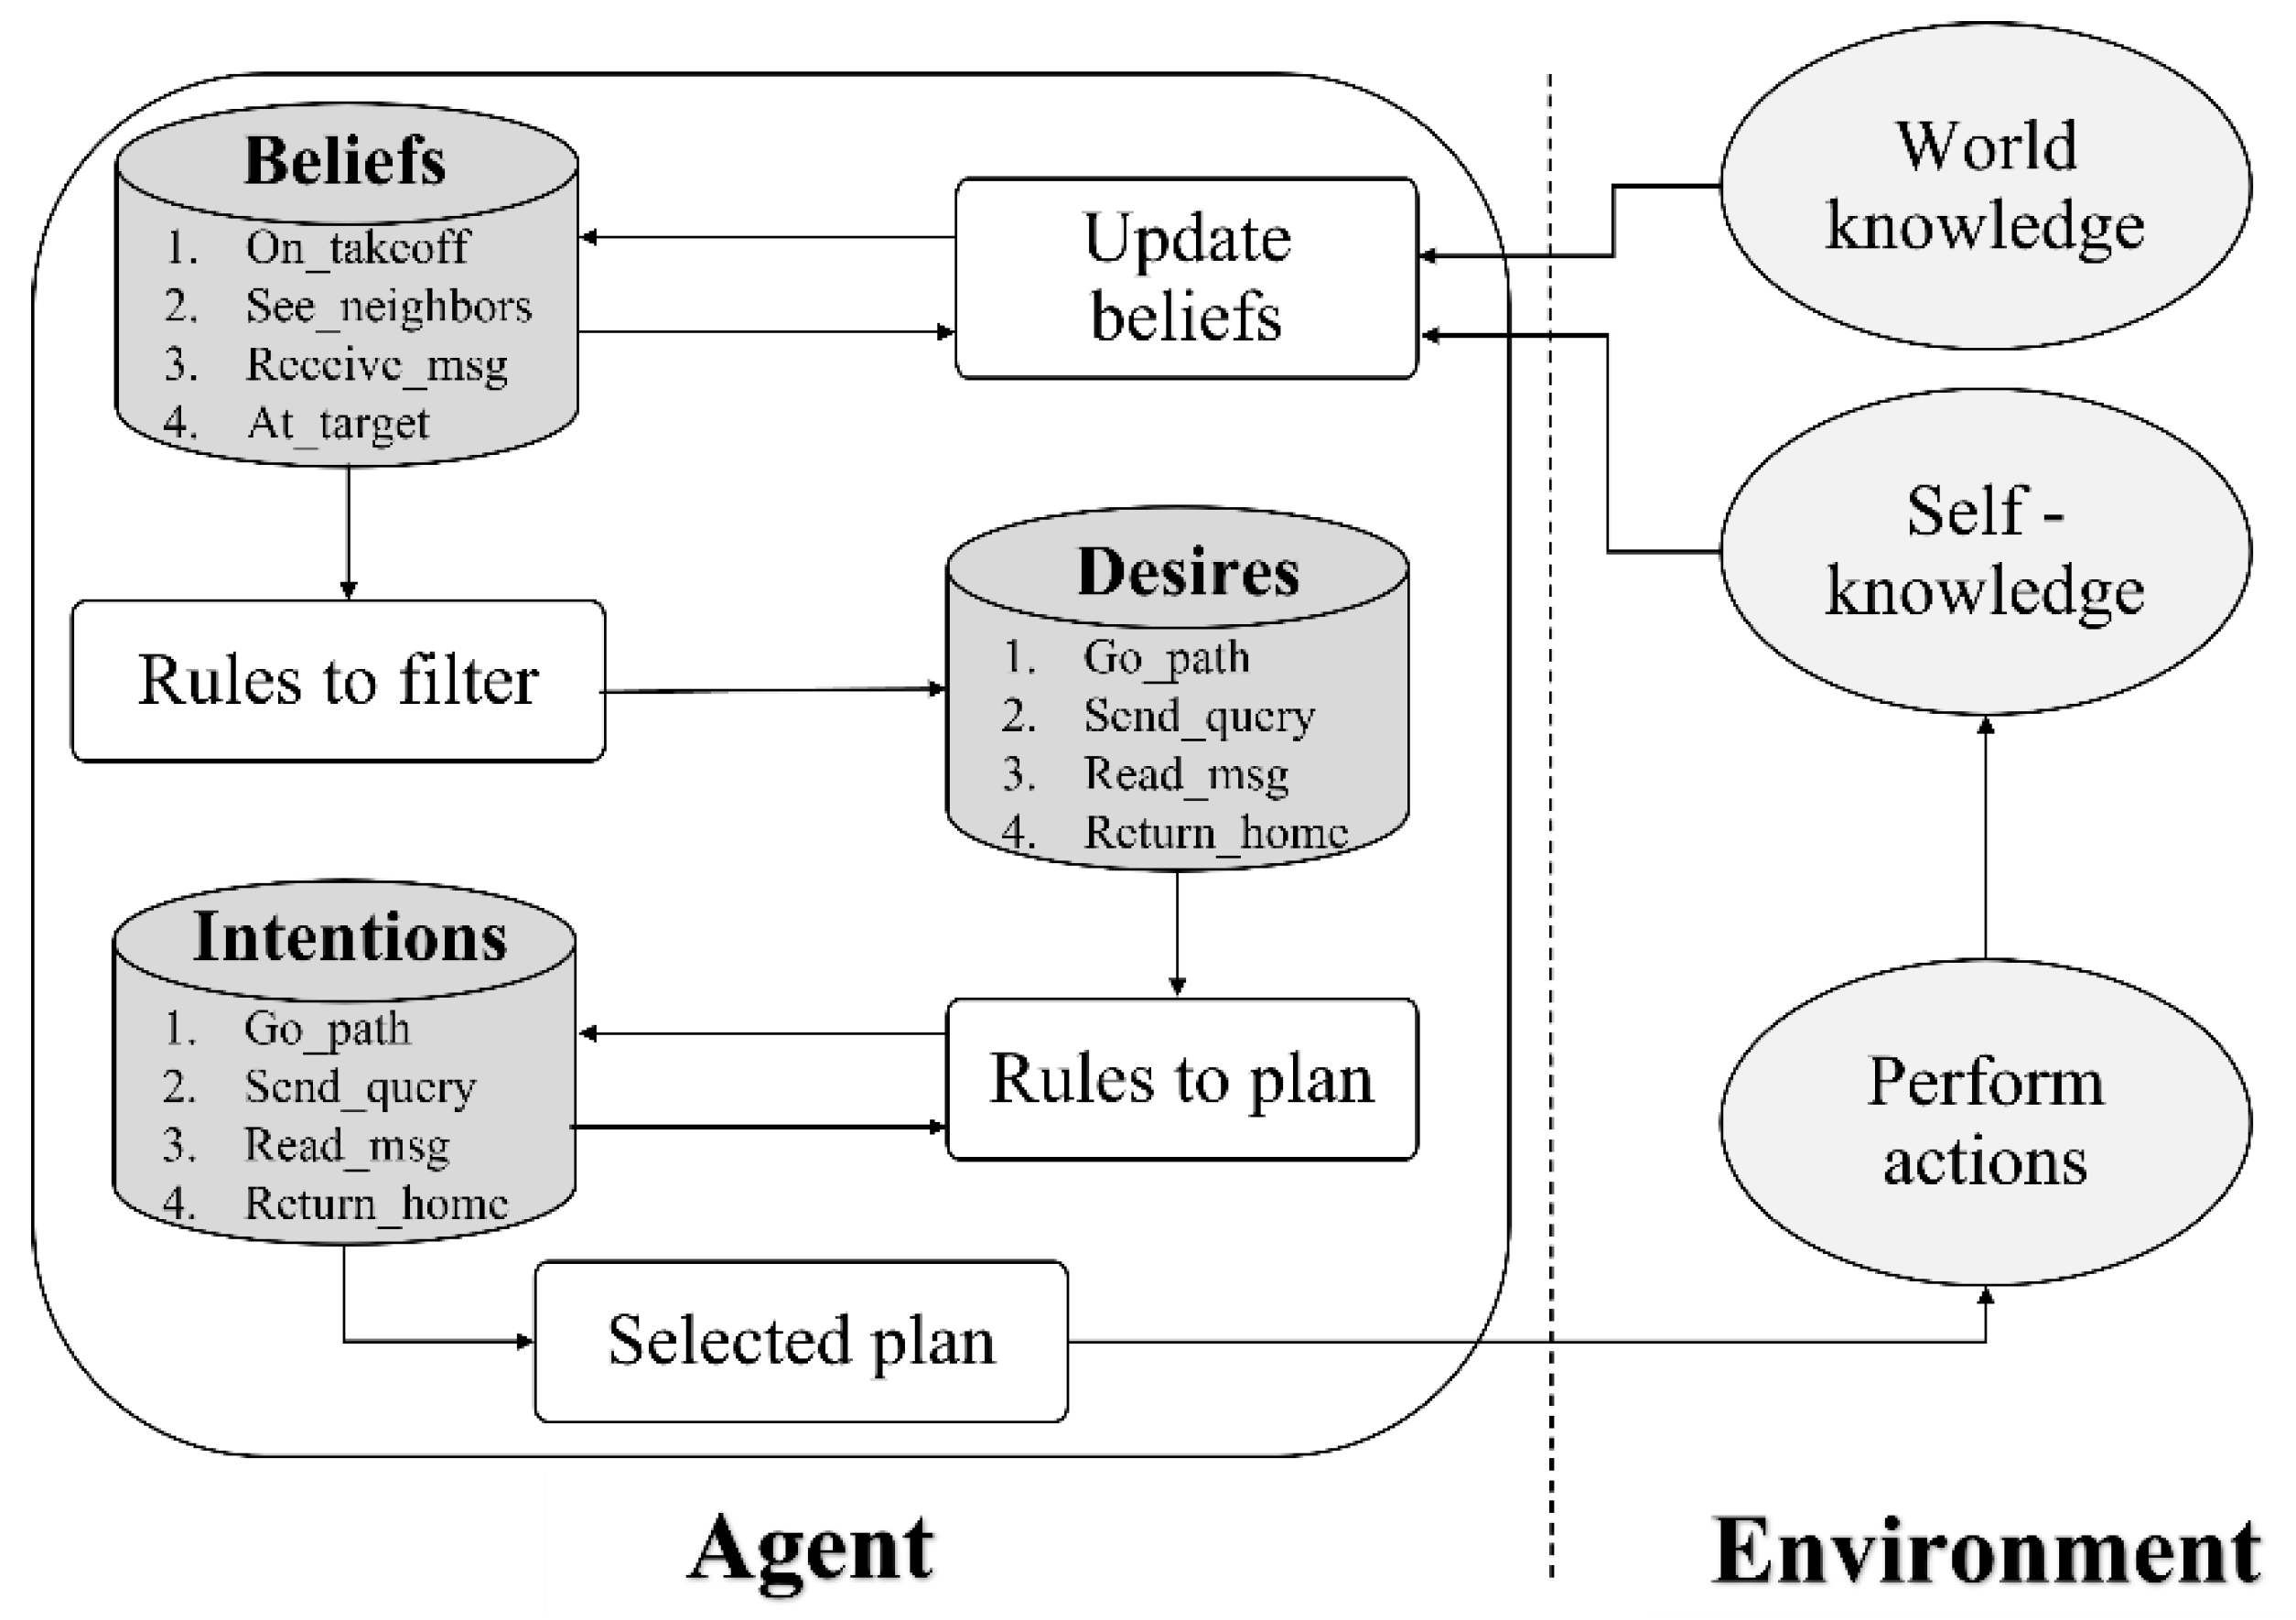
Each MAV agent is implemented to move, perceive, follow a plan, interact, and adapt behavior. The control of the skills is designed with BDI architecture as shown in
Figure 3. The beliefs are related to predispositions during the execution of a task. They can be updated according to world knowledge and self-knowledge; as an example, the MAV agent can be believed to be at task target (4.At_target). The MAV agent should verify each belief under logical rules from self-knowledge and the allocated task.
Consequently, the MAV agent is motivated to reach some single goal; for the previous example, the desire can be a return to home (4.Return_home). However, a MAV agent cannot reach a goal without a plan. The library of plans considers the intentions and desires to define the actions, which is going to affect the environment. From the example, when the desire becomes an intention to 4.Return_home, a cruise flight is a possible plan to execute such action.
Table 1 describes how the beliefs become actions of the MAV agents using steps 1 to 5 after any belief (On_takeoff, See_neighbors, Receive_msg, or At_target) is set. In brief, a belief motivates a desire; then, the desire sets a goal to adopt an intention. The intention is to run a plan that reflects actions.
Concerning interaction skills, the current proposal only monitors the fleet state and then tests the connectivity between agents. Each MAV agent uses a FIPA Query Interaction protocol with a communicative act called query-if. This type of communication waits by informing the neighboring state [
36].
4.2. MCO Plan
MCO Plan is the solution to the problem described in
Section 3. The known coverage area (georeferenced raster) with ZLIs, the number of available MAVs, the return of MAVs, and remote sensor parameters are inputs for planning. The outcome of the MCO Plan is allocated roles and coverage tasks to follow. The approach should become scalable and near-optimal, looking for a balance between heterogeneity and connectivity. To reach that goal, five components for coverage mission planning are represented in
Figure 4 and are described below.
4.2.1. World Abstraction
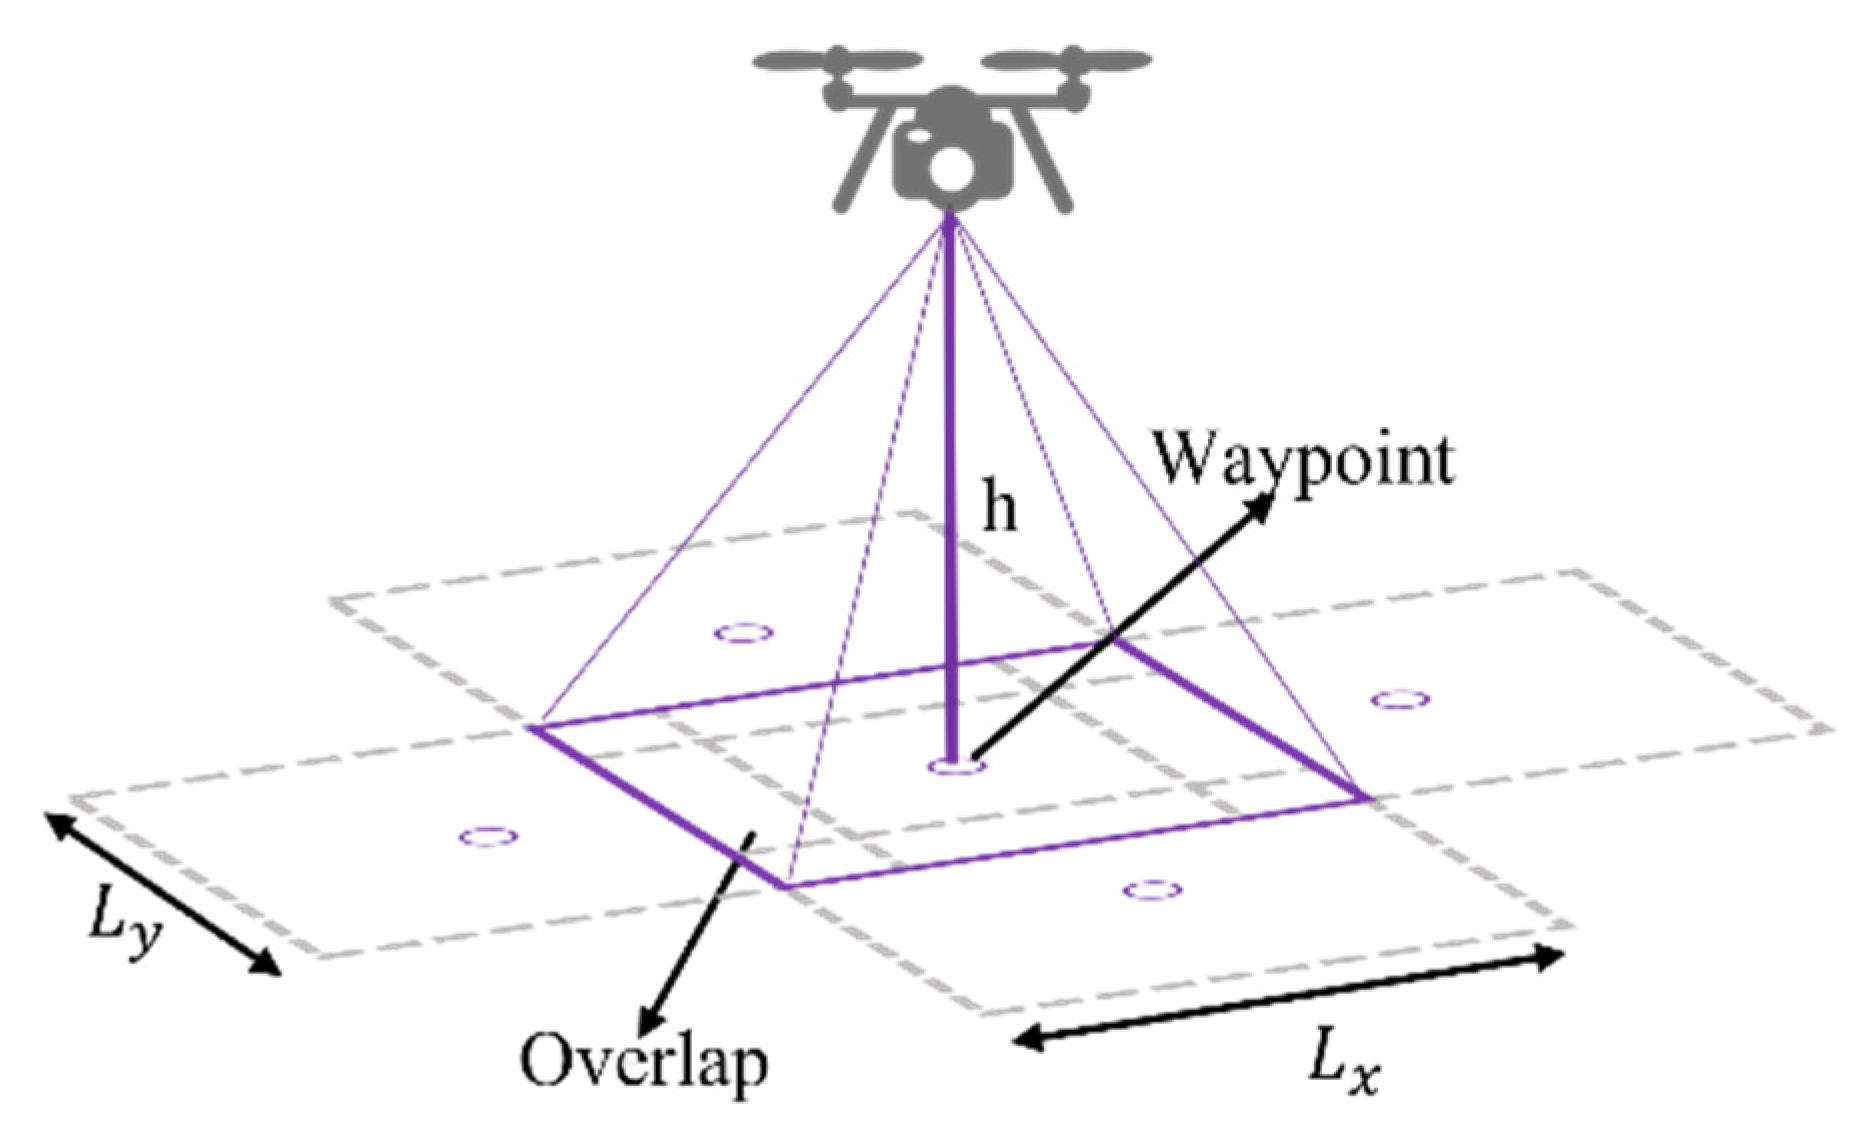
The first step in coverage mission planning is to define how the MAV agent observes the world. The world abstraction considers a MAV agent acquiring remote information (through cameras, scanners, etc.). This payload type projects a footprint on the observed workspace defining the cell shape to split the area. In the current case, a rectangular shape represents the sensor’s approximate range.
Each cell center is the step or waypoint visited by a MAV agent (
Figure 5). According to the specification of the coverage mission, the centers should be so close as to overlap more than 60%, according to photogrammetric fundamentals. The cell size is calculated with
and
from Equation (1), where
h is flight height, α is the angle of view from the sensor, and the image size is defined by
and
. Then, the cell is interpreted into pixels and split by
on height and
in width, ZLIs included. The final footprint is given by
and
, where
p and
q are respective percentages (0 to 1) of longitudinal and cross overlap.
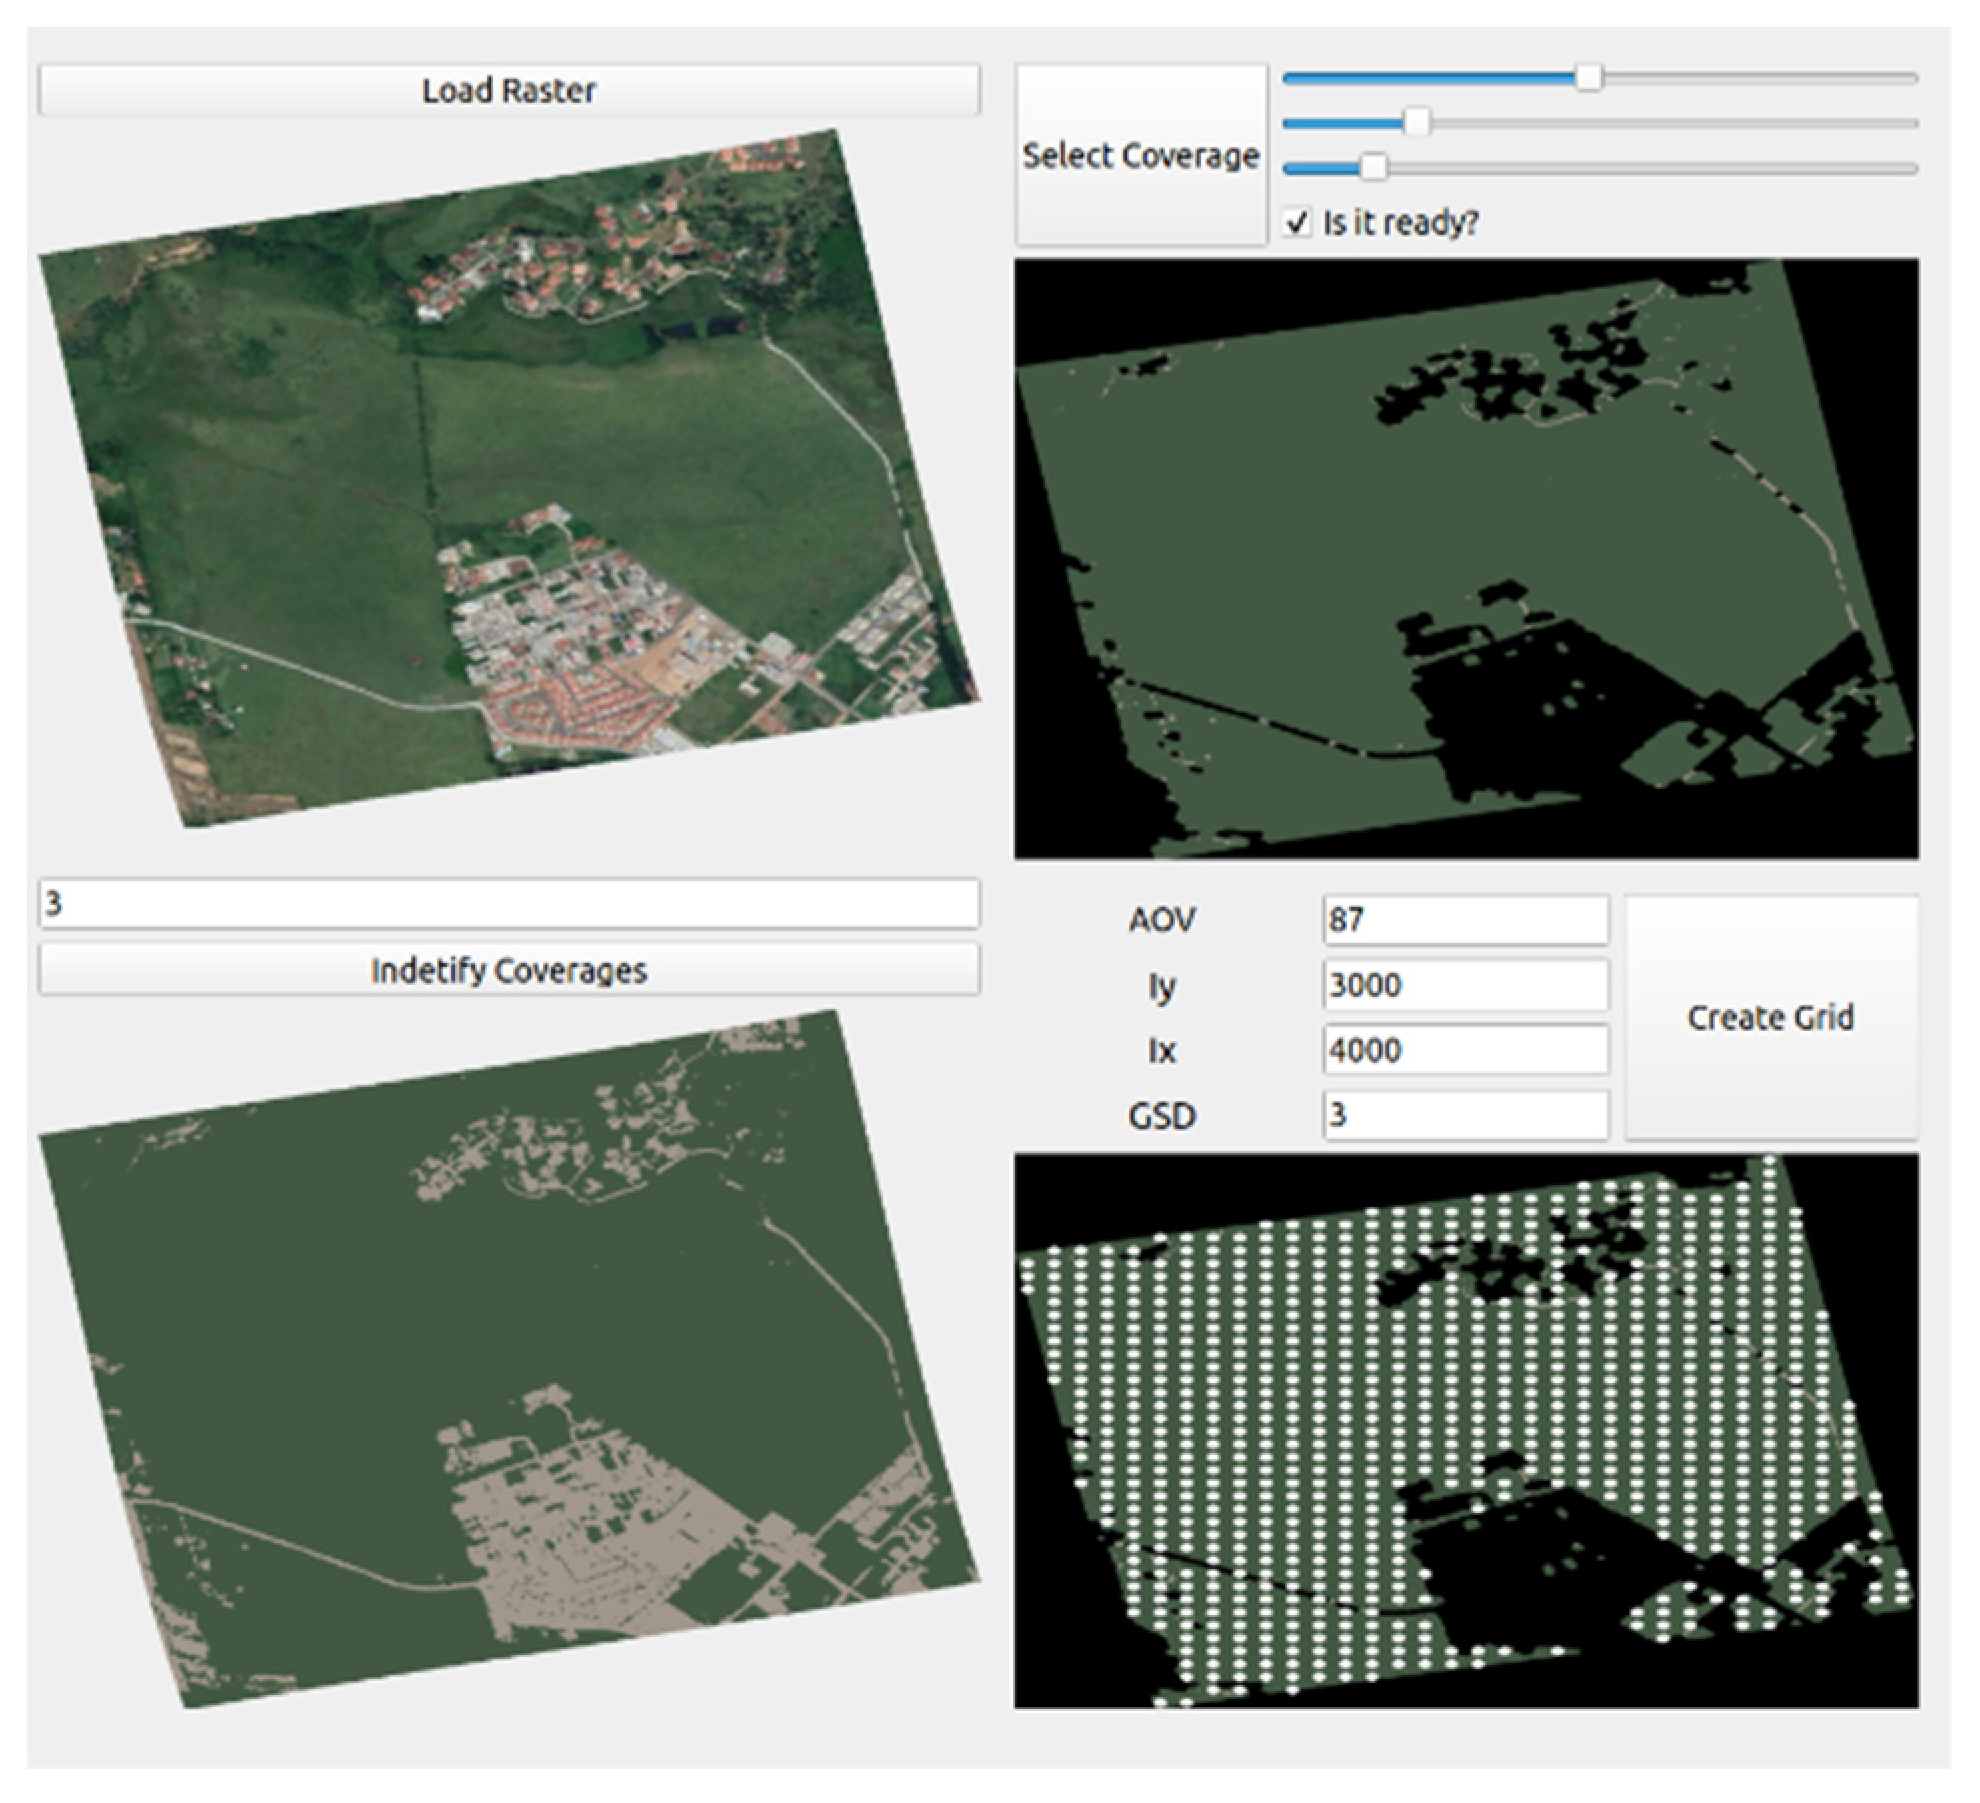
Some areas from the original workspace could not be included in the rectangular grid, but if this is the case, the cell should be reduced as much as the application allows. The world abstraction is implemented in four steps as seen in
Figure 6: a georeferenced raster is loaded, then the user identifies the coverage areas (coverages), and a raster with recognized territories is segmented. Image processing extracts the ZLIs from the raster as in [
4]. Finally, the cells and waypoints based on the camera parameters are obtained. A screenshot of the GUI for world abstraction is shown in
Figure 6.
4.2.2. Area Partitioning
The focus of offline coverage planning is how to split the total waypoints corresponding with the number of MAVs. The waypoints are the free cells to visit calculated from the world abstraction method.
In
Section 2, the planning can be classified as polygonal from related works. The polygonal mechanism uses segments on the area’s geometry, which results in heterogeneous sub-areas, while the clustering-based distribution trends to homogeneity. Representants of the polygonal-based partitioning can be the Boustrophedon approach and Voronoi-tessellation, and clustering-based partitioning can be the K-means algorithm.
Figure 7 shows partitioning by segments, clustering, and Voronoi-tessellation as an instance for four MAV agents.
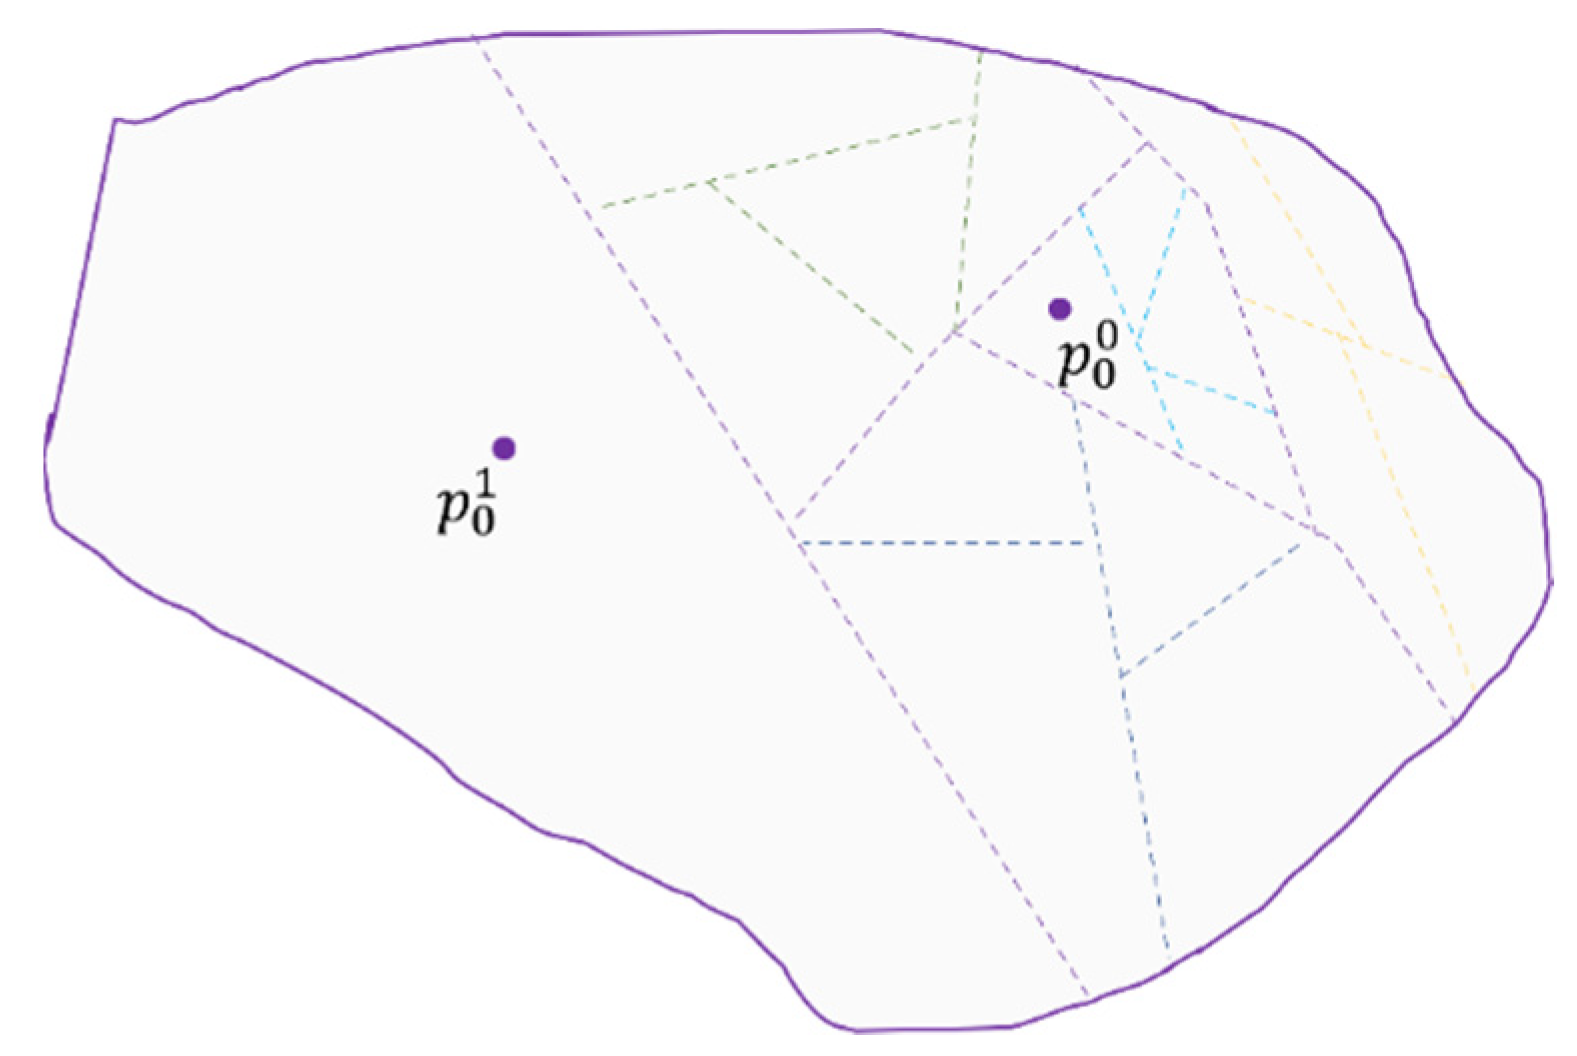
Figure 7c shows Voronoi-tessellation as the initial candidate for this research because the computational complexity can become less than clustering; the areas to connect with neighbors are more than others in some related work. Frequently, the Voronoi-based partitioning results in heterogeneous divisions. However, it is heterogeneous for small numbers; the obtained result can become homogeneous if the number increases. An extension is then proposed in the current research to conserve heterogeneity and solve the Voronoi-tessellation generalization. The phases of the attachment are described below:
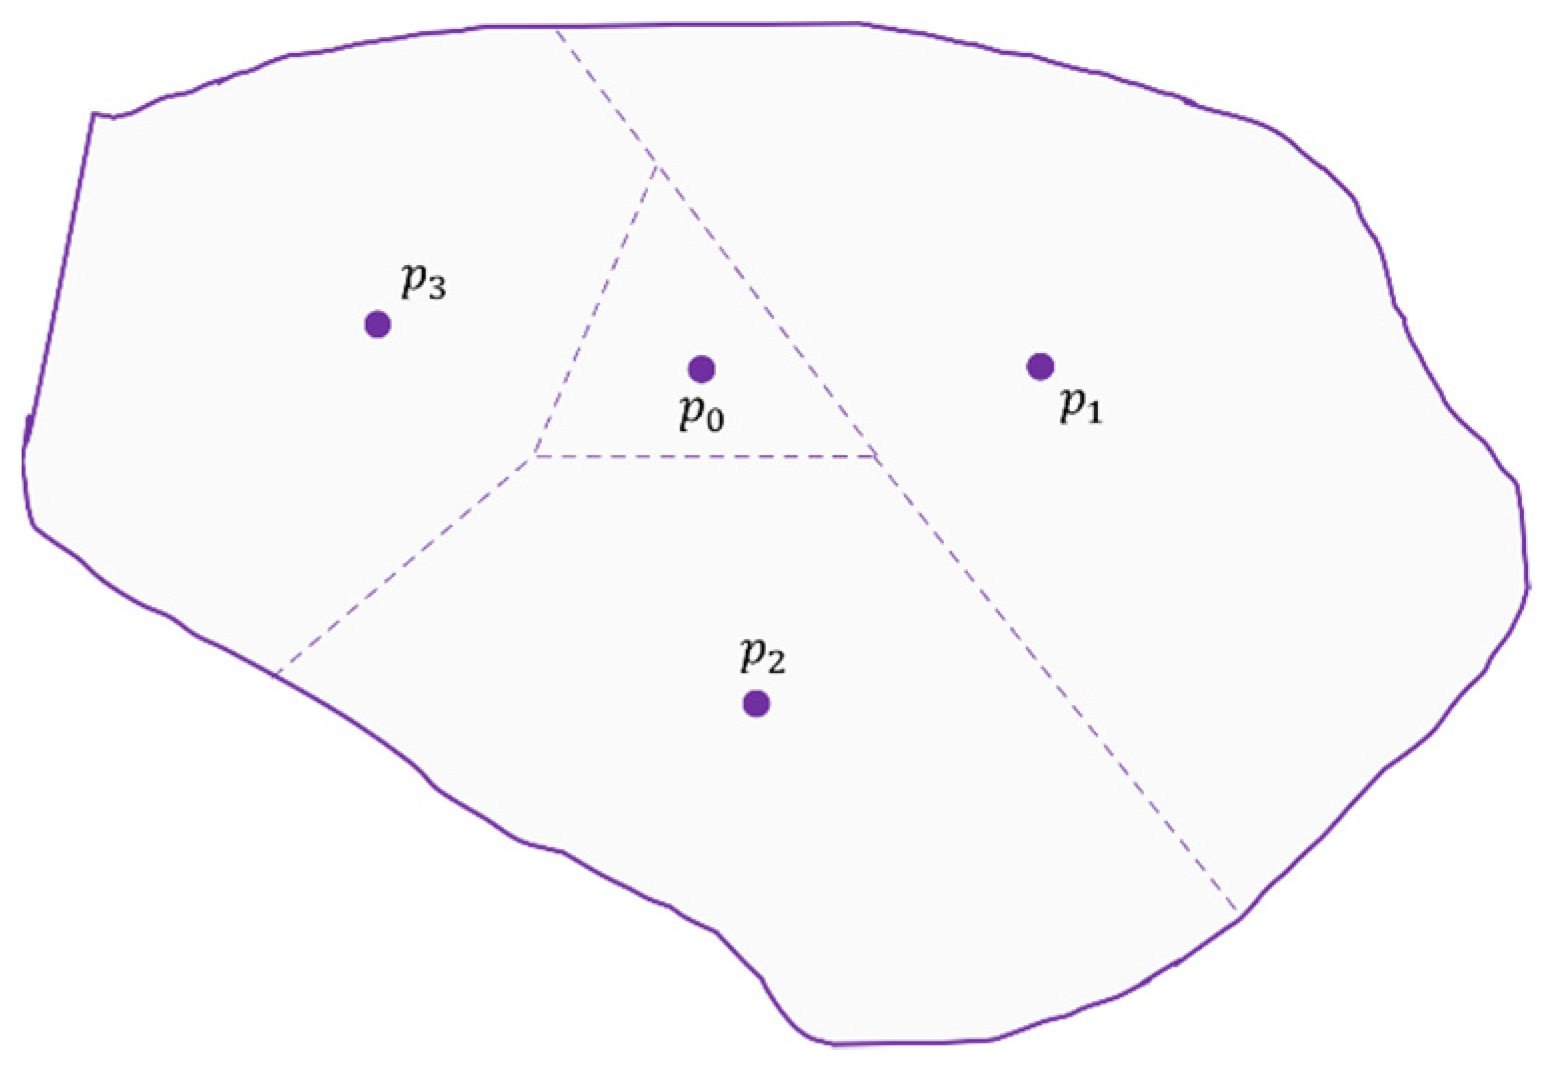
Phase I: a takeoff location, called
, should be selected to generate the centroids of the Voronoi-tessellation (it could be the center of the coverage area). Other centroids to generate tessellations are centered in
and follow a circumference as in
Figure 8. The circumference radius is calculated by dividing the measured width of the workspace between the number of MAV agents, n. The distribution of the initial centroids
,
, …,
inside the circumference is random.
However, after calculating the first Voronoi-tessellation, some partitioning tests for more MAV agents can become a homogeneous distribution. To solve it, a deterministic mechanism is designed on the Base Partition that satisfies the following postulate.
Postulate 1: a Base Partition can have between two and four divisions. Therefore, a single sub-area can have three connected sub-areas.
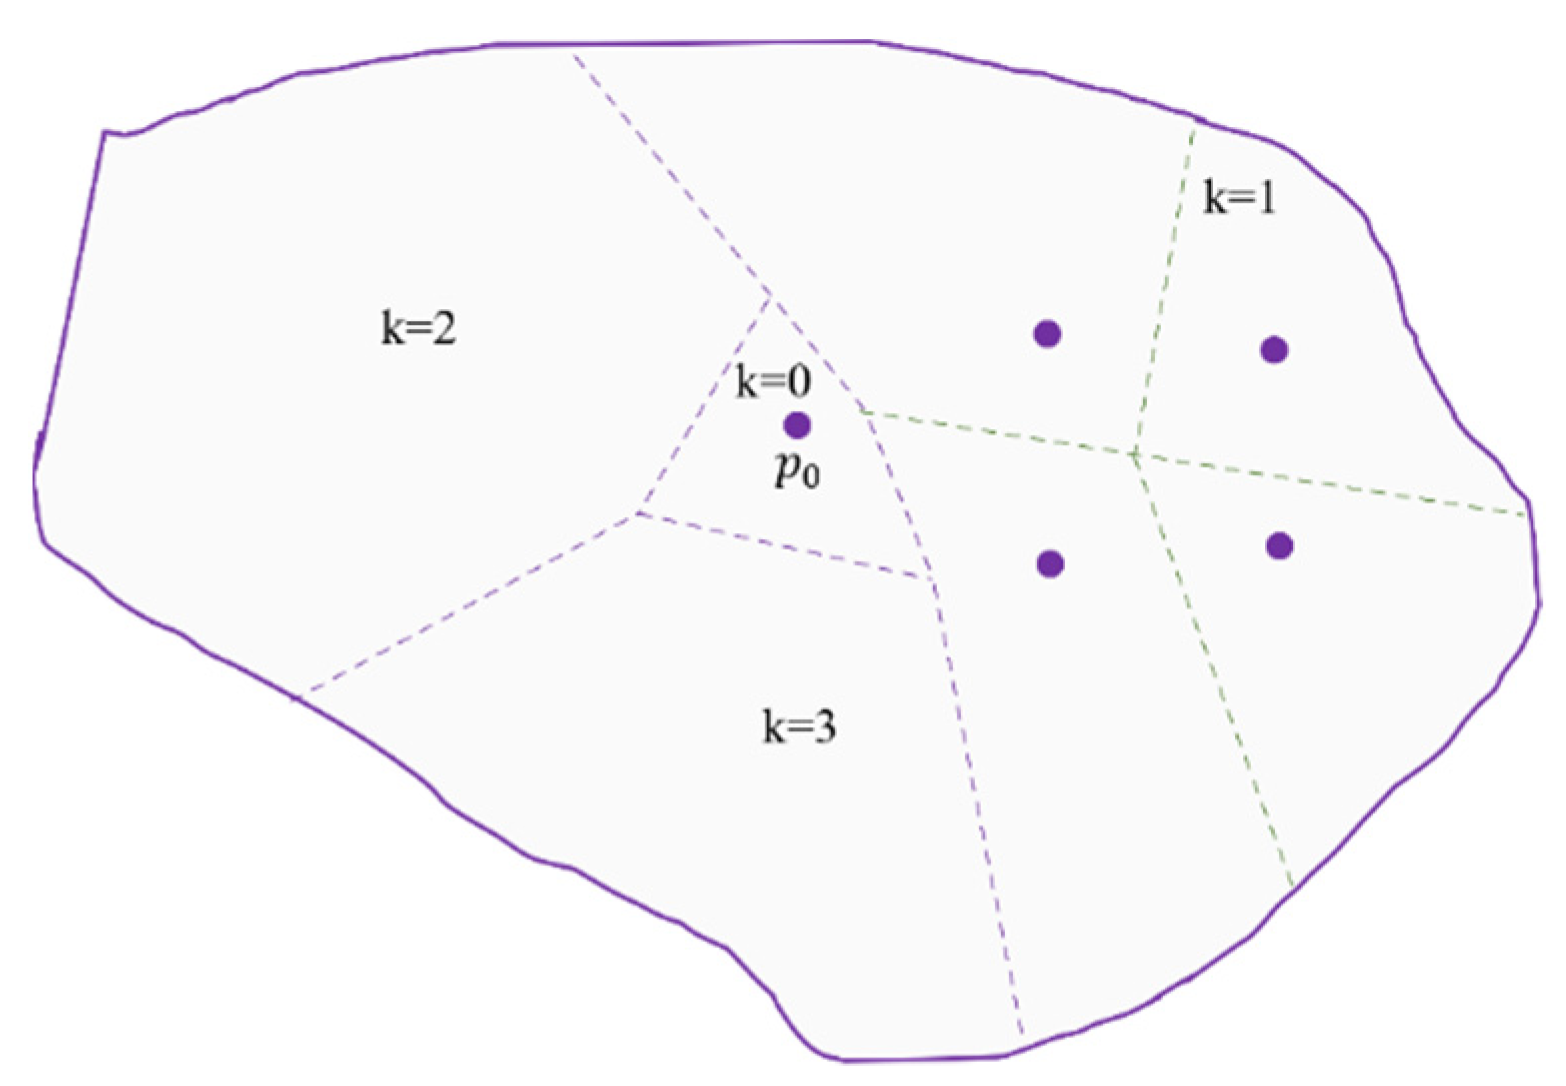
Phase II: If the MAV agents to deploy are more than four (
n > 4), the centroids of Base Partition are re-distributed based on the centroid
of the detected largest sub-area (
is the greatest sub-area in
Figure 8). The centroid is moved one-third of the radius closer. Consequently, the selected sub-area becomes larger after rerunning the Voronoi-tessellation.
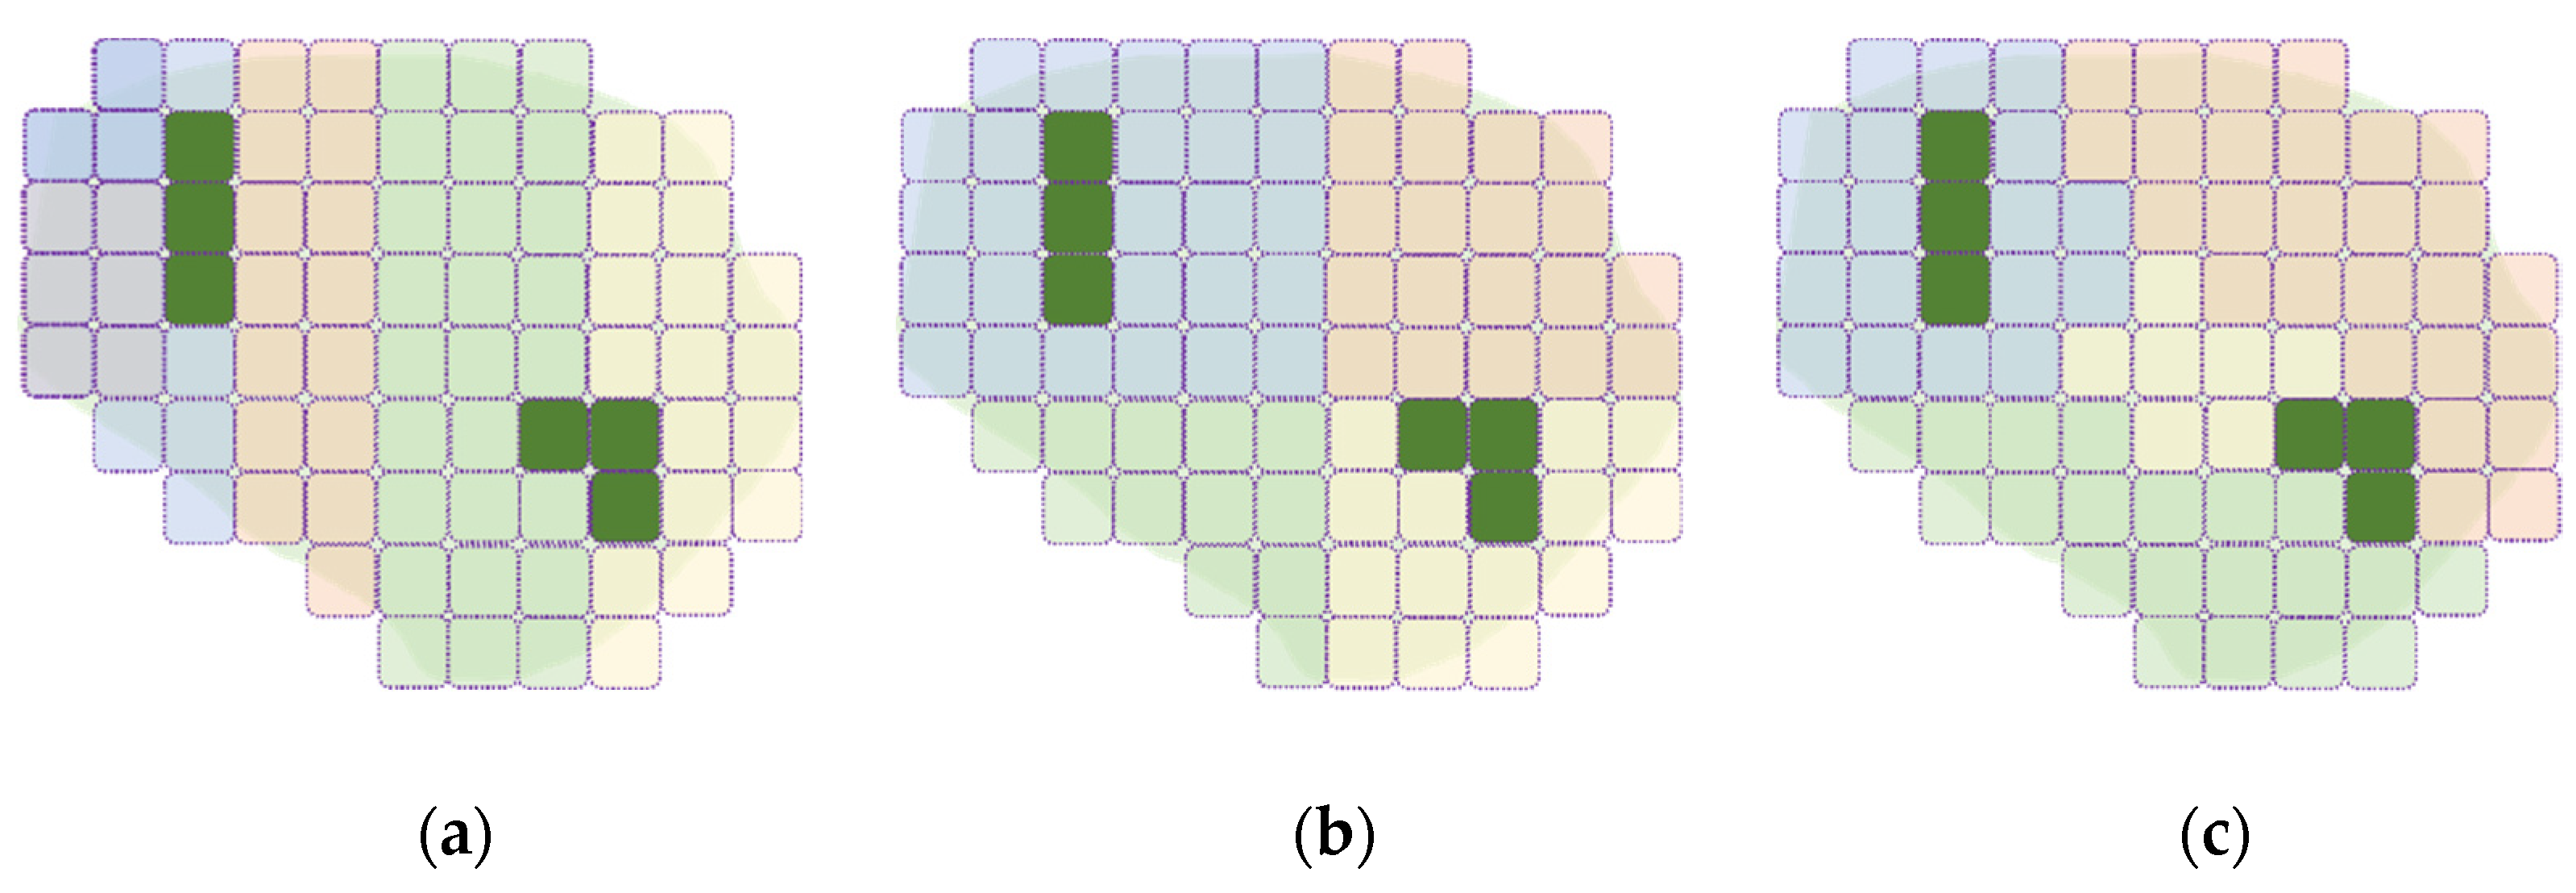
The next sub-areas result from dividing the largest one using the Phase I method. The new random circumference of centroids is calculated at the center of the largest sub-area. The number of secondary centroids is updated to obtain the required sub-areas (
Figure 9). The result of Phase II is named Sub-partition k, which satisfies the following postulate.
Postulate 2: a Sub-partition can have between two and four sub-areas. Then, if n > 4, the number of divisions for a Sub-partition is (n − 3).
Phase III: an iterative process is run to determine Sub-partitions following postulate 2. The movement of the secondary centroid of the largest sub-area concerns the closer p centroid, and the cycle continues to complete the area partitioning until there are 16 sub-areas. According to the problem statement for coverage missions, 16 is defined as enough MAV agents. The deployment of 16 simple MAVs can be a great investment for the user, and further, it can become complex to maintain. However, scalability is essential for the research; hence the last phase is proposed below.
Phase IV: if the MAV agents to deploy are more than 16 (
n > 16), the number of divisions for the complete area, S, is calculated by multiples of 16. It means the number of
to locate is the quotient between n and 16 plus 1 (
), called
. For each new
Phases I, II, and III are applied to complete the Partition Levels. Each Partition Level is centered in a new
(takeoff locations) as shown in
Figure 10, satisfying the following postulate.
Postulate 3: a Partition Level can have up to 16 sub-areas. Then, a new Partition Level is generated when v ≥ 1.
4.2.3. Role Allocation
Most work on coverage mission planning describes the method to allocate sub-areas. Nevertheless, the present proposal is projected for MAV agents with some interaction during missions. Consequently, the proposed plan creates roles to define the behavior of the agent model (
Section 4.1), creating hierarchical coordination. The model is not designed for continuous connectivity since it would exceed energy consumption. The strategy then becomes managing the fleet’s energy during the mission with partial connectivity with few neighbors (at a restricted time). Each MAV agent can only interact when neighbors are in the defined range. The next steps, when MAV agents interact to make decisions to complete a mission, are not tried in the current paper, but they are in development.
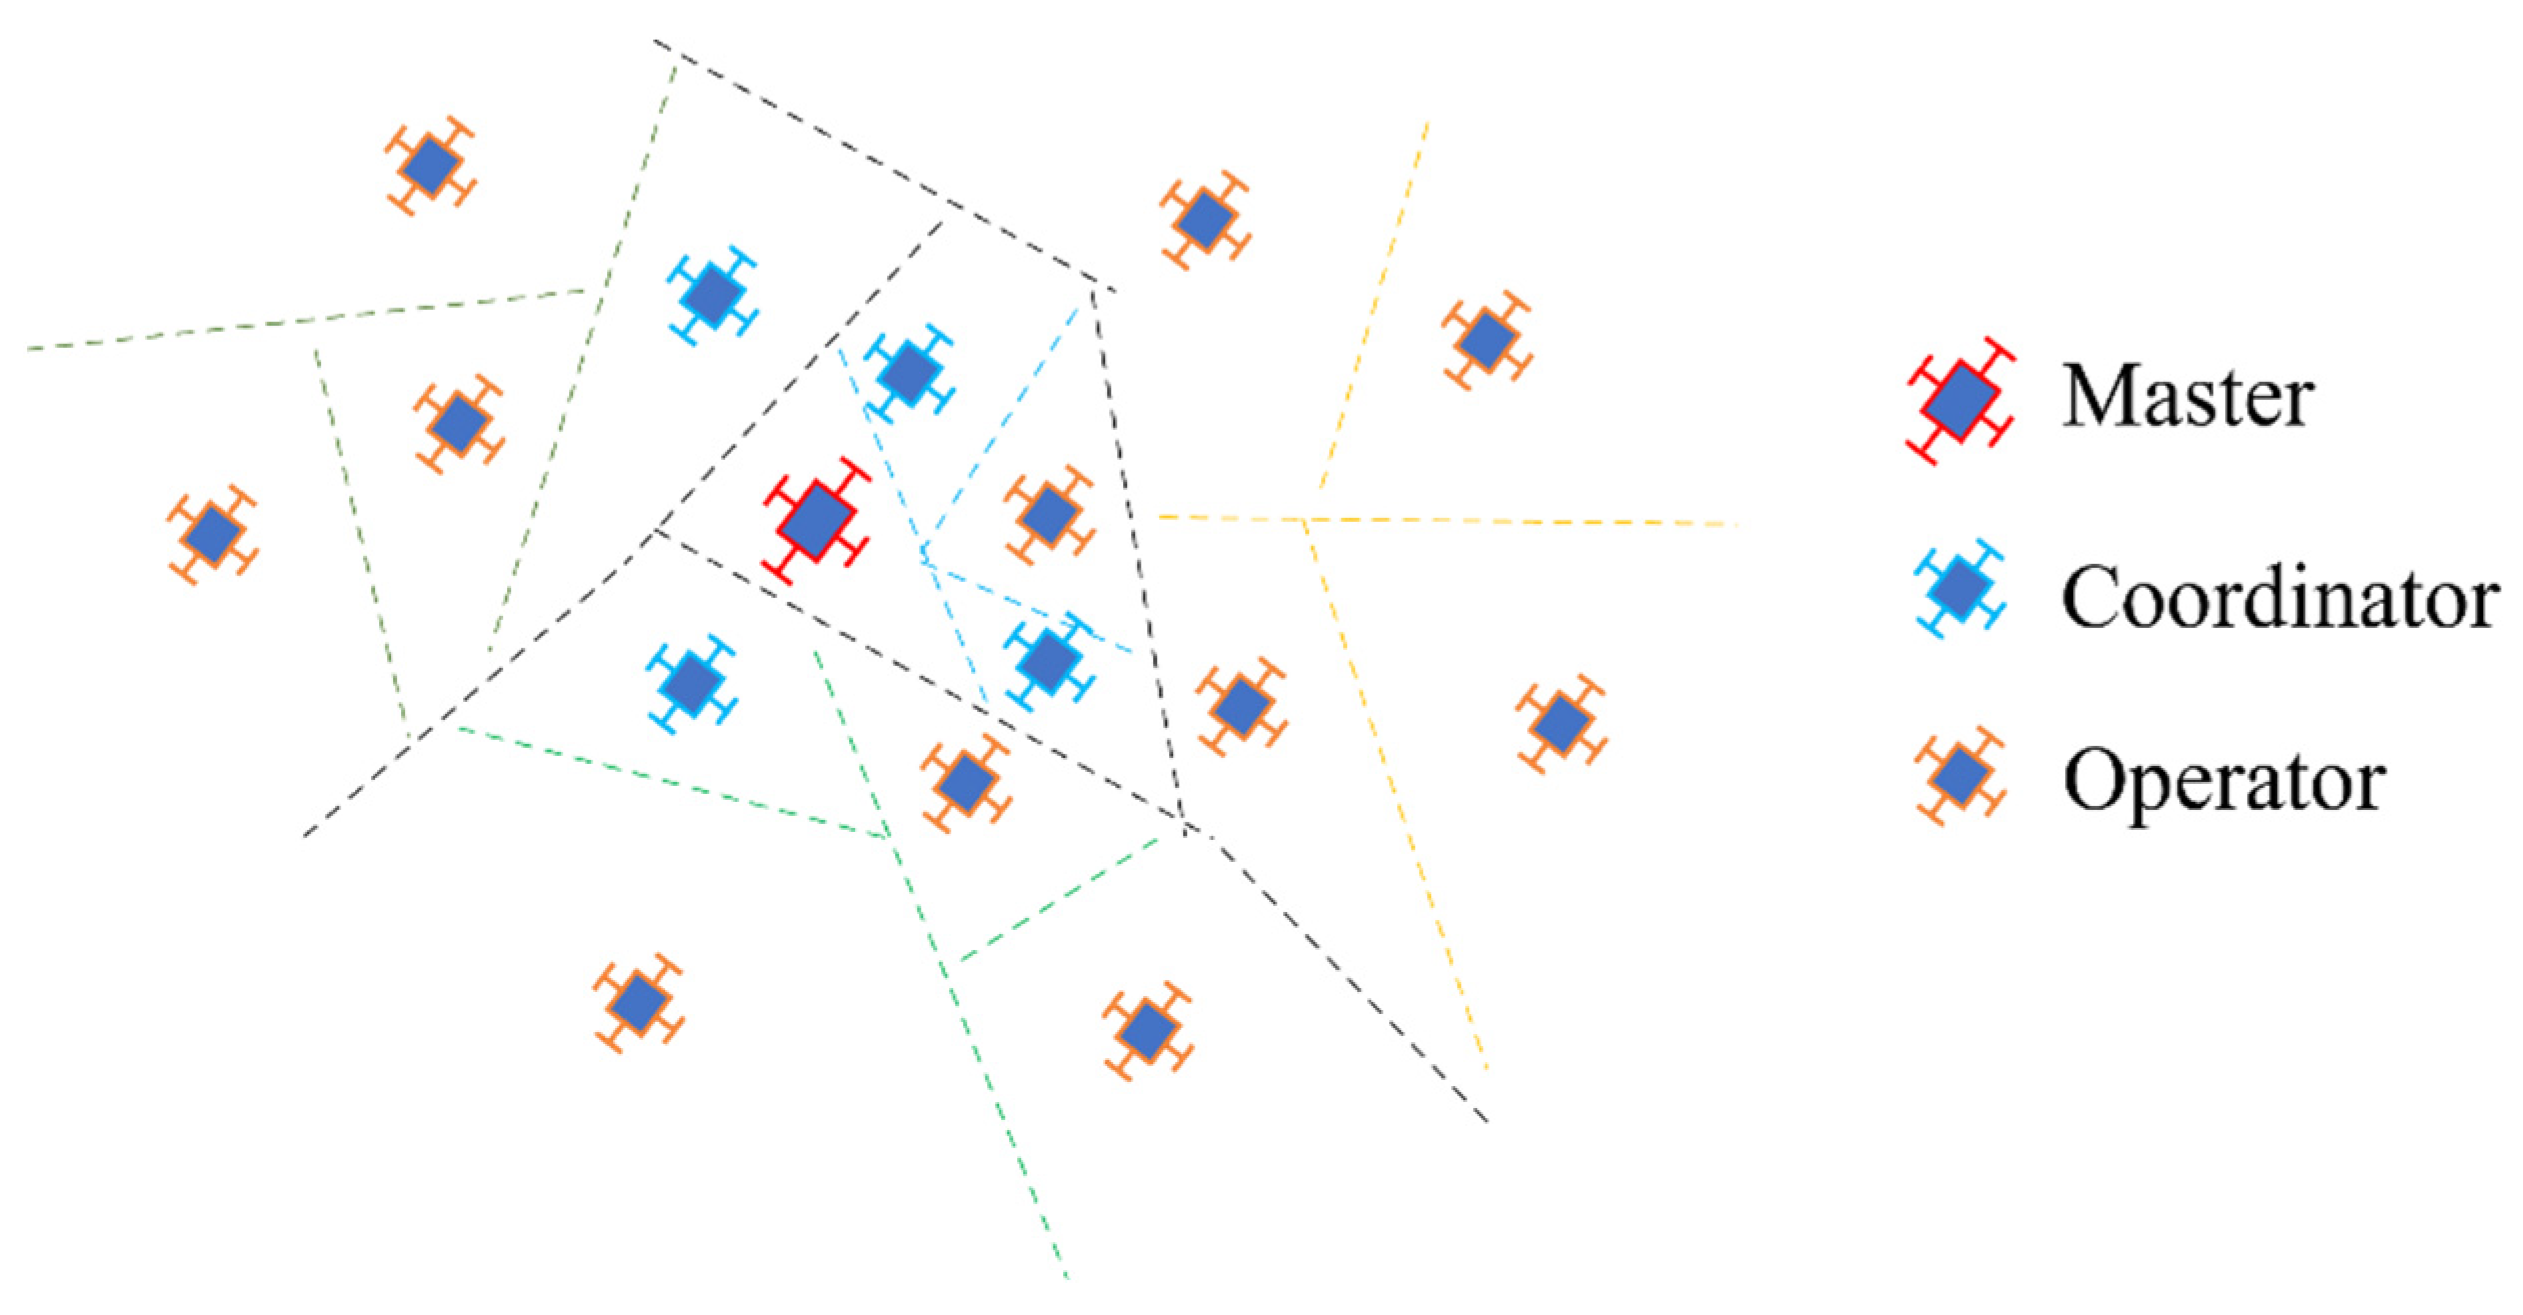
The hierarchical model has three roles to manage heterogeneity and connectivity of the fleet, according to the skill scores of flight time, communication, and decision. The Master should have a high score in decision and communication, and an intermediate flight time score. The Coordinators should have a middle score for decision and flight time, and a high score for communication. In case a Master fails, coordinators must support decisions. The Operators should have a low score for decision and communication, and a high score for flight time.
The Master’s role is single for one Partition Level. The role is to take principal decisions to complete the mission, and it should be the closest to a ground station (relative to the takeoff location). A Master agent should have a short coverage path to save energy for transmitting and receiving messages from Coordinators. The Coordinator role is for a MAV agent that works as a router of communication between Agents and the Master. A Coordinator can make secondary decisions, and its coverage path should be intermediate. The Coordinators are the four agents closest to the Master. Finally, the Operator role has the hard work of the coverage of the greater peripheral sub-areas.
Table 2 summarizes the specifications of roles requested to cover each sub-area and the possible interactions. The roles determine the heterogeneity and connectivity that should be requested from MAV agents for a coverage mission and are the result of the area partitioning method in
Section 4.2.2; as an example,
Figure 11 shows each role in a partitioned area. To avoid a possible overload of transactions on the network, it is proposed that the number of neighbors for each role is four (as a consequence of the partition phases).
4.2.4. Task Generation
After the requirements for coverage in each sub-area are defined, the next step is to calculate the coverage task. Then, each MAV agent should be allocated with a path, and its completeness should be guaranteed. The path generation component assumes that the MAV agent will acquire data while visiting each waypoint.
According to the review in
Section 2, the coverage paths for MAVs are frequently zigzag or lawnmower movements with improvements in the flight line orientation and smooth turns to optimize the task. However, the zigzag movements are indifferent to ZLIs, and they could be inefficient because they do not consider the return home as part of the path. It means more flight time and high redundancy to achieve coverage planning with included ZLIs. To overcome it, some restrictions such as ZLIs, irregular shapes in workspaces, and only a practical runtime to compute missions should be considered. A suitable runtime for the computation of coverage paths is in the range of hours since practical assignments can require continuous deployments.
The literature describes alternatives to compute the coverage paths based on heuristics and metaheuristics that solve the TSP. Some solutions were previously evaluated to decide which accomplishes the previous requirements. The heuristics such as wavefront and spanning tree are suitable for a few waypoints; if the scope increases, the optimization decreases. The found metaheuristics can be classified as trajectory-based or population-based. The first ones are near-optimal, but the runtime was more significant than population-based metaheuristics. Tests of those based on population versus the zigzag movement are in
Table 3.
The scores used to compare are the runtime of the algorithm and the visited waypoints to reach the start waypoint (target) again. The tests are for an area of 100 free cells homogeneously distributed, an initial population of 500 individuals, and 5000 iterations.
Table 3 shows the results of the paths calculated using the general genetic algorithm (GA), Particle Swarm Optimization (PSO), Ant Colony Optimization (ACO), Bee Colony Optimization (BCO), Cuckoo Search (CS), and Firefly Algorithm (FA). The FA [
37] was then selected based on the smallest values.
4.2.5. Task Allocation
Task allocation is the last component of the MCO Plan, and looks for each MAV agent to have a role and a coverage path. To develop the method, the current paper considers the taxonomy for task allocation from the reference in [
38]. The taxonomy solves multi-robot problems by relating the number of robots with the number and period of the tasks. The current issue is of type single-task (ST); each task can be realized by a single MAV-agent (SR) and an instantaneous allocation is programmed (IA). However, this setup will change because future research wants to support task re-planning based on partial connectivity.
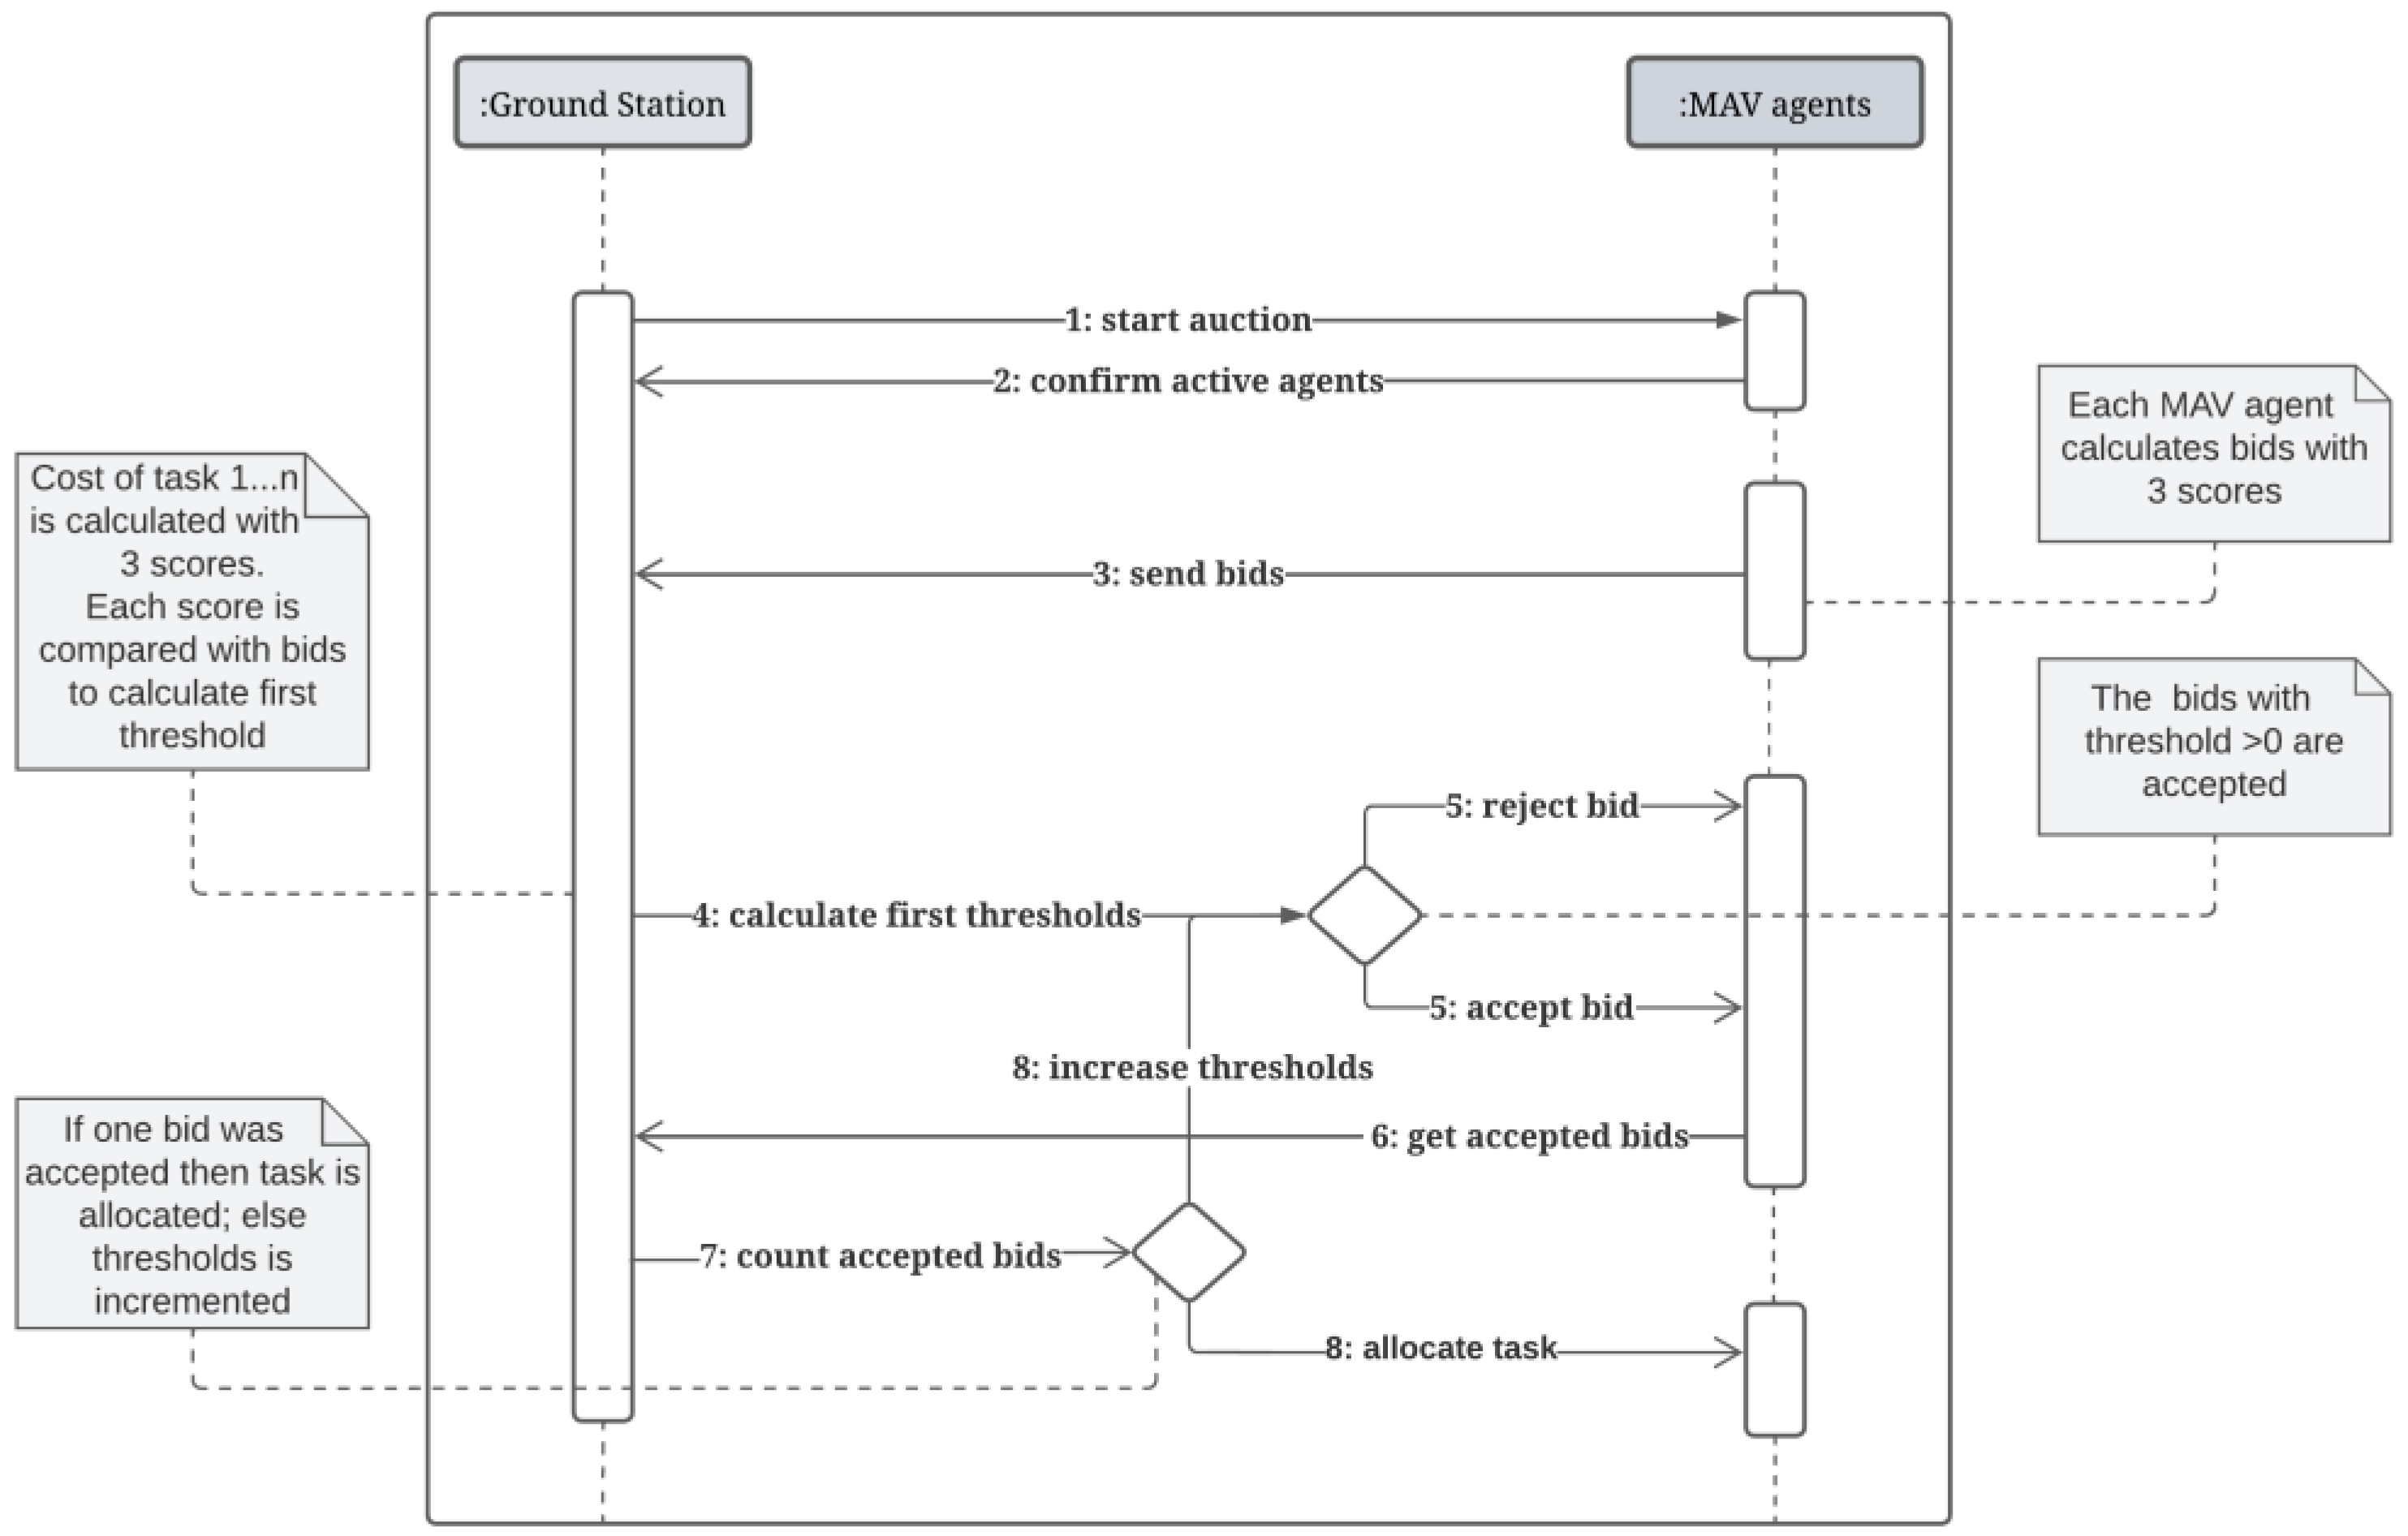
Task allocation adapts the FIPA English Auction Interaction Protocol Specification [
39] as in
Figure 12. The initiator is a ground station, and the MAV agents are participants. The initiator informs the auction and requires the confirmation of MAV agents to know its bidders. The bid for each MAV agent is calculated with three scores by knowing its resume concerning use history, battery and communication module specifications, type of autopilot, and capacity to process on a small computer board. The initiator takes the information from the role and the flight time to calculate the same three scores. Both calculate three features: flight time, decision capacity, and communication skills, and the initiator gives a value for the first thresholds (subtraction of scores).
Table 4 presents the score sources used in Equation (2) for each score.
The scores range from zero (0) to three (3), where three means the maximum number of resources. The initiator rejects the participants with Bids more minor than the calculated Task cost and accepts the requests above. The initiator can increase the first thresholds and re-auctions in case of multiple MAV agents with accepted bids. The task is allocated to the agent with the better bid. When one task is assigned, the selected MAV agent saves it in its memory and waits for the call to start the deployment. Then, the process in
Figure 12 starts over for another task allocation.
5. Simulations and Discussion
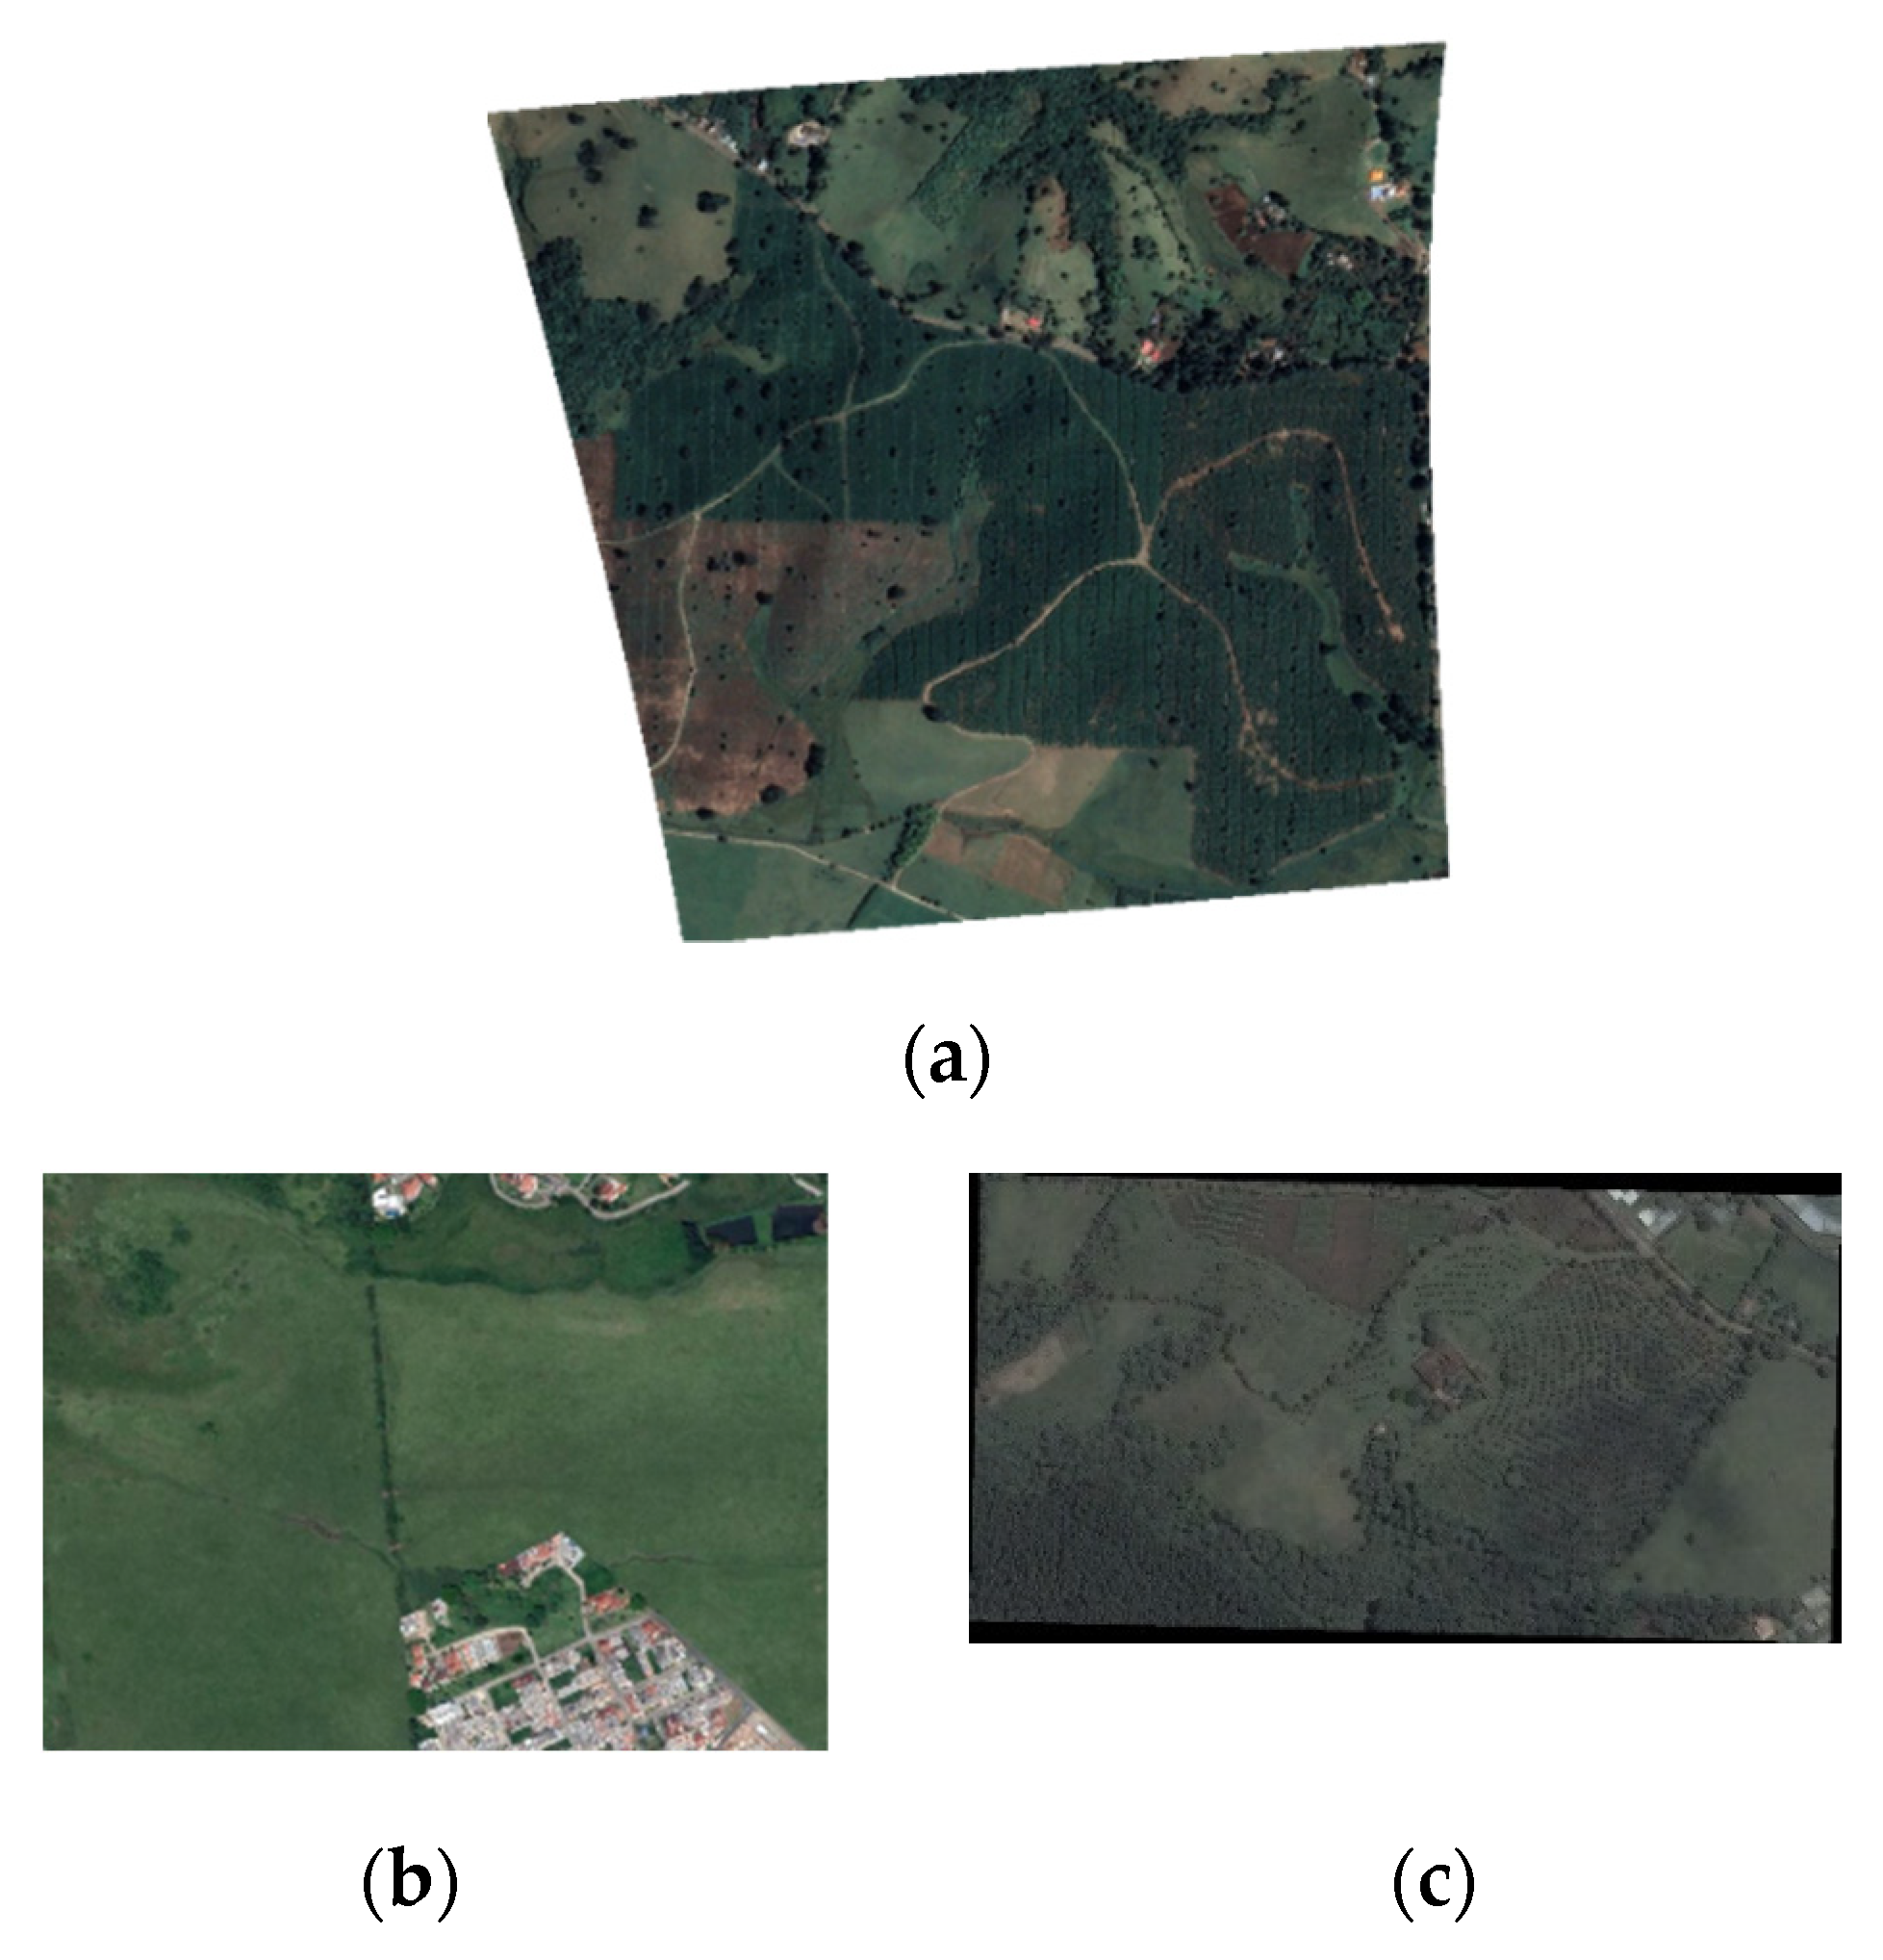
The validation of the proposal was done using three different ZLIs-included workspaces in Cauca, Colombia. They were selected as areas for possible uses with multiple drones (crops and building Zones). The cases of the study were selected to prove the efficiency of three coverage mission plans in areas with different shapes of ZLIs and the number of waypoints in free spaces. Such variations would impact the task heterogeneity and the connectivity skill of the fleet.
Figure 13a is the Rejoya Farm with 70 Hectares, has free space in the center and some separate areas, and it is the largest workspace. Naranjos Farm in
Figure 13b is 27 Hectares, has a small free area, few ZLIs on edge, and is the smallest area. Finally, the Urban Zone in
Figure 13c is approximately 54 Hectares, has the broadest free space, and has one large ZLI on the edge.
Table 5 shows the number of ZLIs and the selected coverage area by image processing as in
Section 4.2.1. The number of waypoints was calculated according to camera parameters such as angle of view (87°), resolution (4000 × 3000 pixels), GSD (2 cm), and overlap (75%). The number of minimum and maximum calculated sub-areas was limited from Boustrophedon decomposition because the method does not deliberately allow selecting the number of areas (ZLIs dependence).
The following results present the performance tests regarding proposed stages of the MCO Plan, specifically, area partitioning, the role and task allocation with a zigzag pattern, and paths generated by the Firefly algorithm. Every approach is analyzed for the resulting coverage missions of the plan based on MCO, Boustrophedon, and K-means. For each plan, the scope to manage heterogeneity and connectivity is tested. Metrics such as standard deviation, heterogeneity trend, active MAVs, task time, battery per agent, and the likely links between neighbors were used for evaluation.
Heterogeneity management is considered the main factor for efficient resource management in working with MAV fleets [
40]. The MCO Plan defines the MAVs with three features to manipulate heterogeneity, adequate flight time, decision capacity, and communication skill. Each one represents the primary source of waste energy for a MAV. The proper flight time depends on the battery and the use history; the decision capacity depends on the payload to process data on-board; and finally, the communication skill can change based on the telemetry module and data flow support. Hence, the key is to manage the heterogeneity in the tasks to satisfy the balance of resources for the agents, understanding it as an intermediate effect between the three features in a coverage mission.
The considered heterogeneity in this research is a transparent property for the user since it is natural in practical deployments with MAVs. The users can decide on the investment in at least one equipped MAV and some basic ones, adapt capacities for some basic MAVs, or, as an ideal, have all MAVs equipped with high processing and communication resources. The user should not be limited to homogeneous MAVs for the coverage mission, although they should be adaptable and have a similar remote sensor.
On the other hand, the MCO Plan involves the connectivity from the mission planning. This issue is important since coordination could require interaction mechanisms to solve failures diagnosed during deployment. The estimation of communication resources in the coverage mission efficiently supports detecting any unexpected events and decisions during the mission. The developed MCO Plan involves explicit communication between agents to monitor the allocated tasks and the agent status. The connectivity is partial during a short time while closer neighbors are inside a minimum range. Therefore, the key to achieving possible decisions is that agents continually find neighbors, but interact with limited resource expenditure.
5.1. Area Partitioning
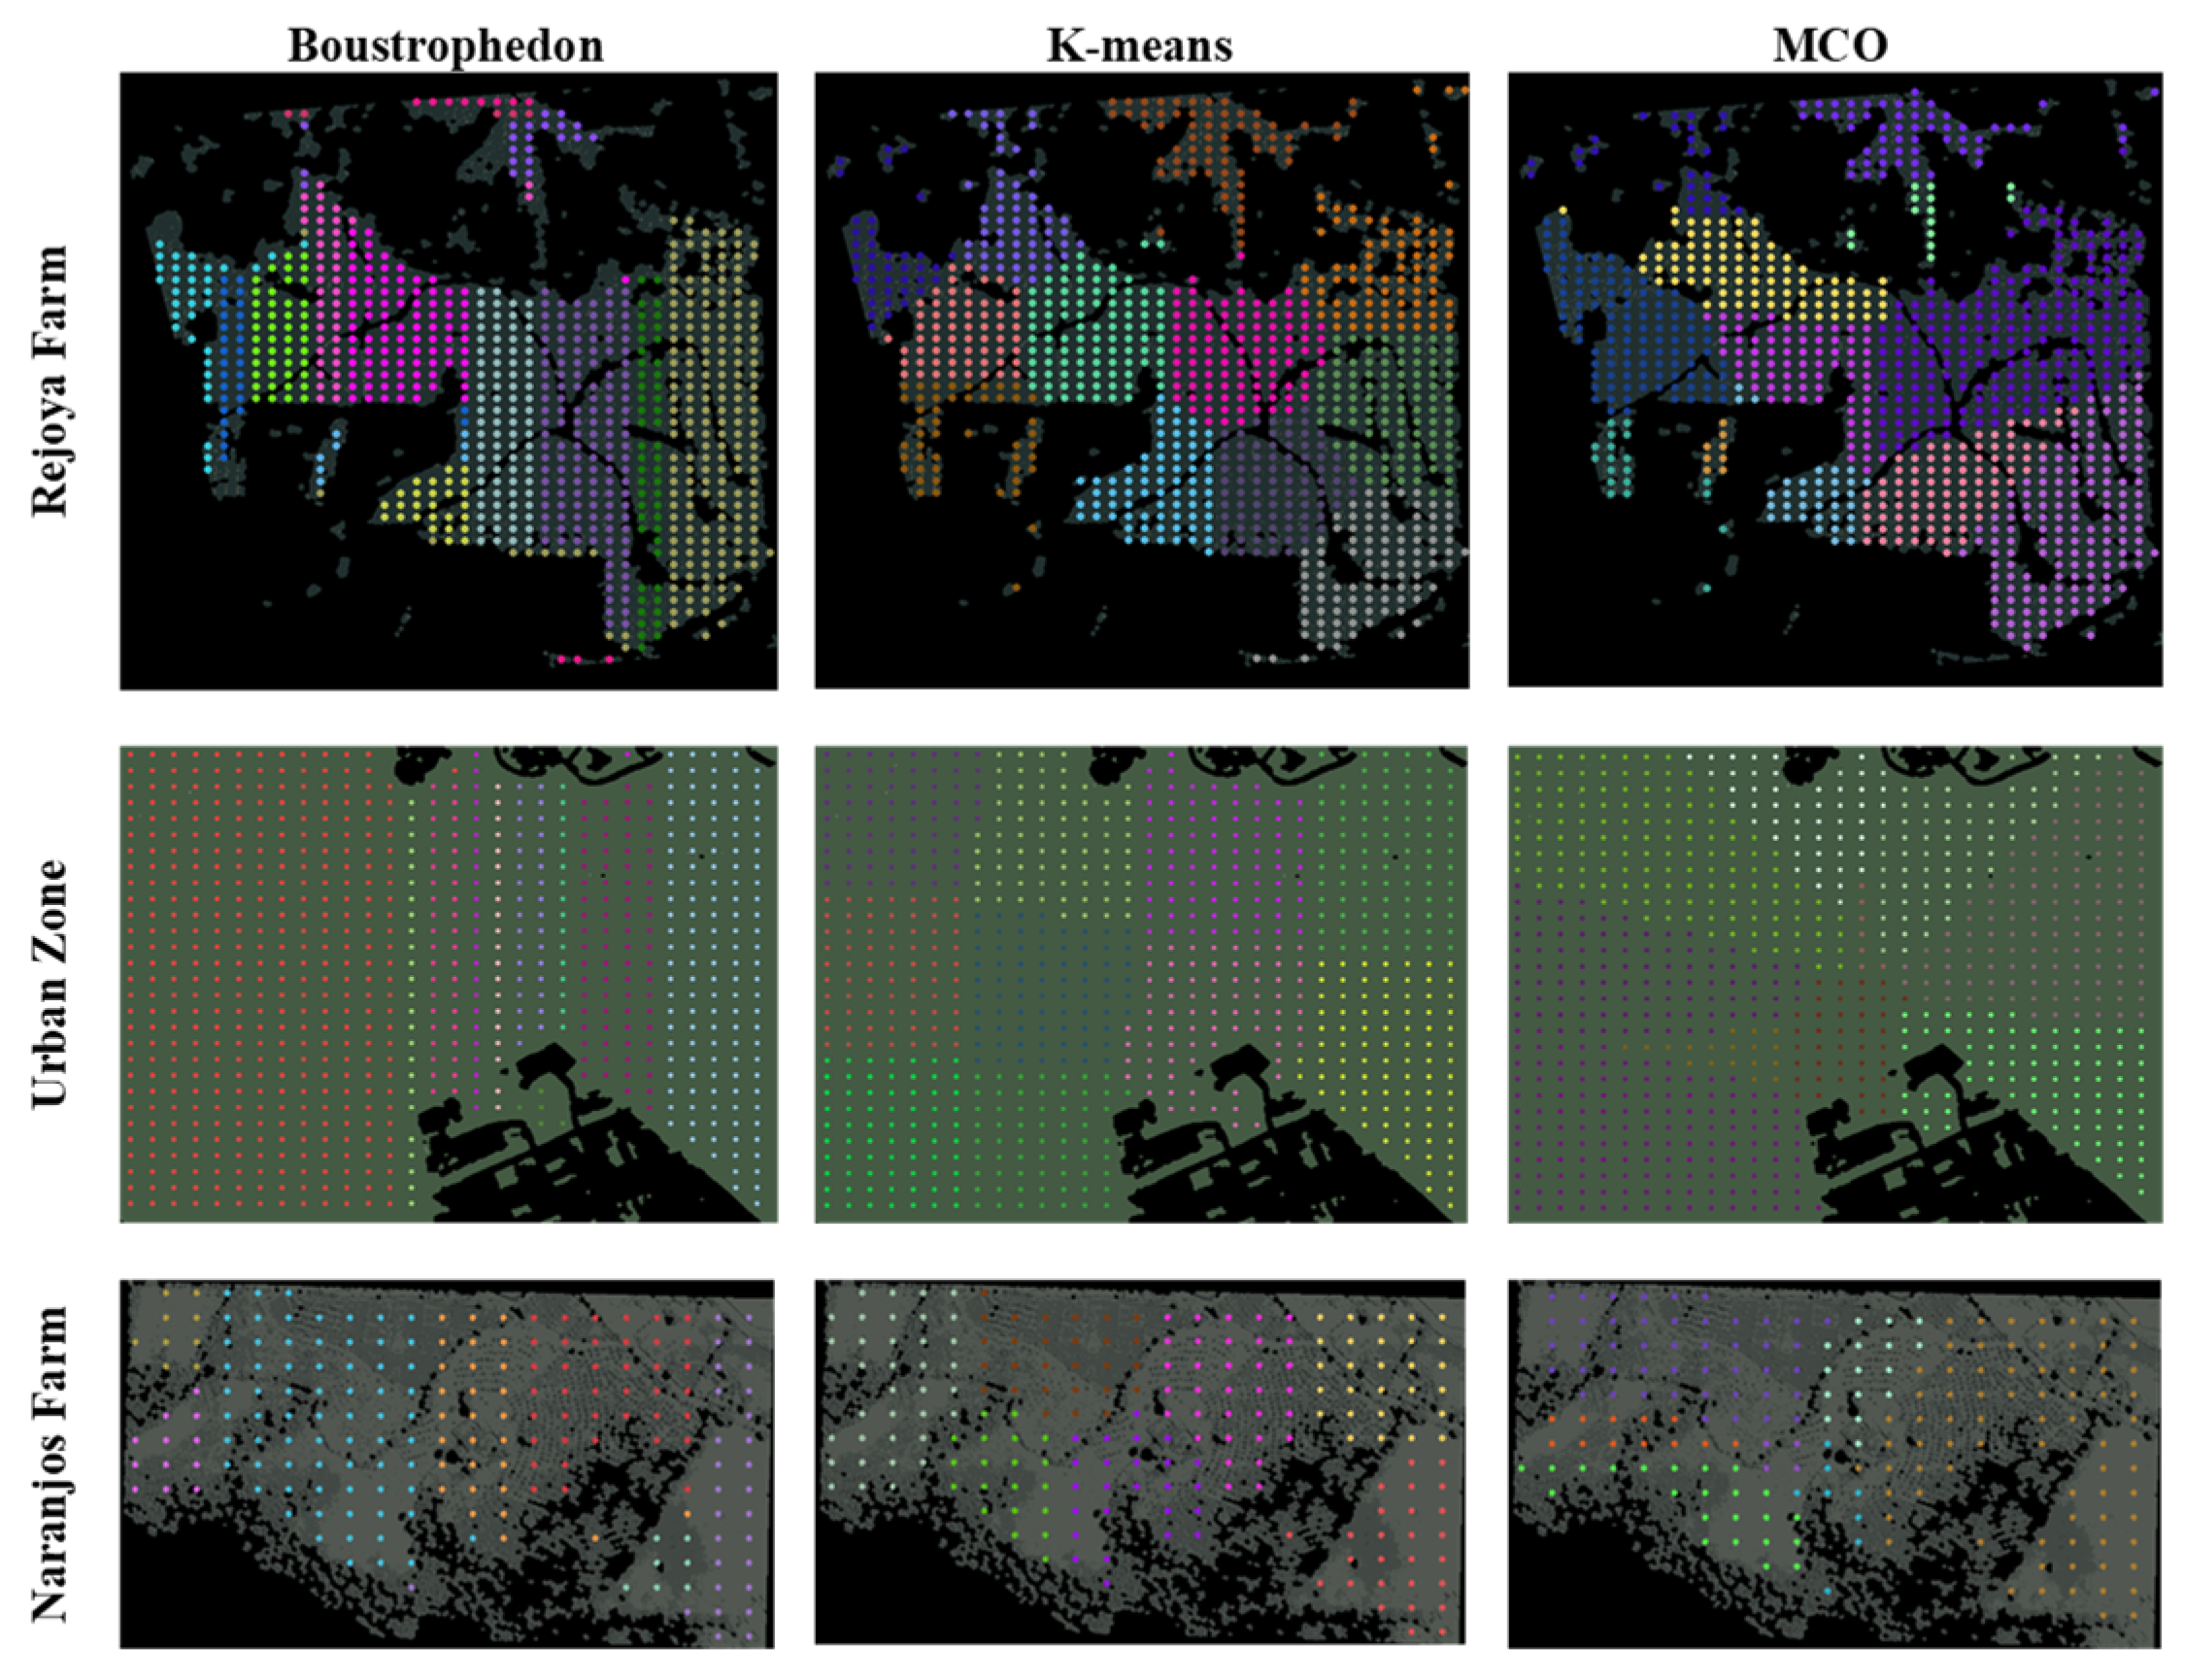
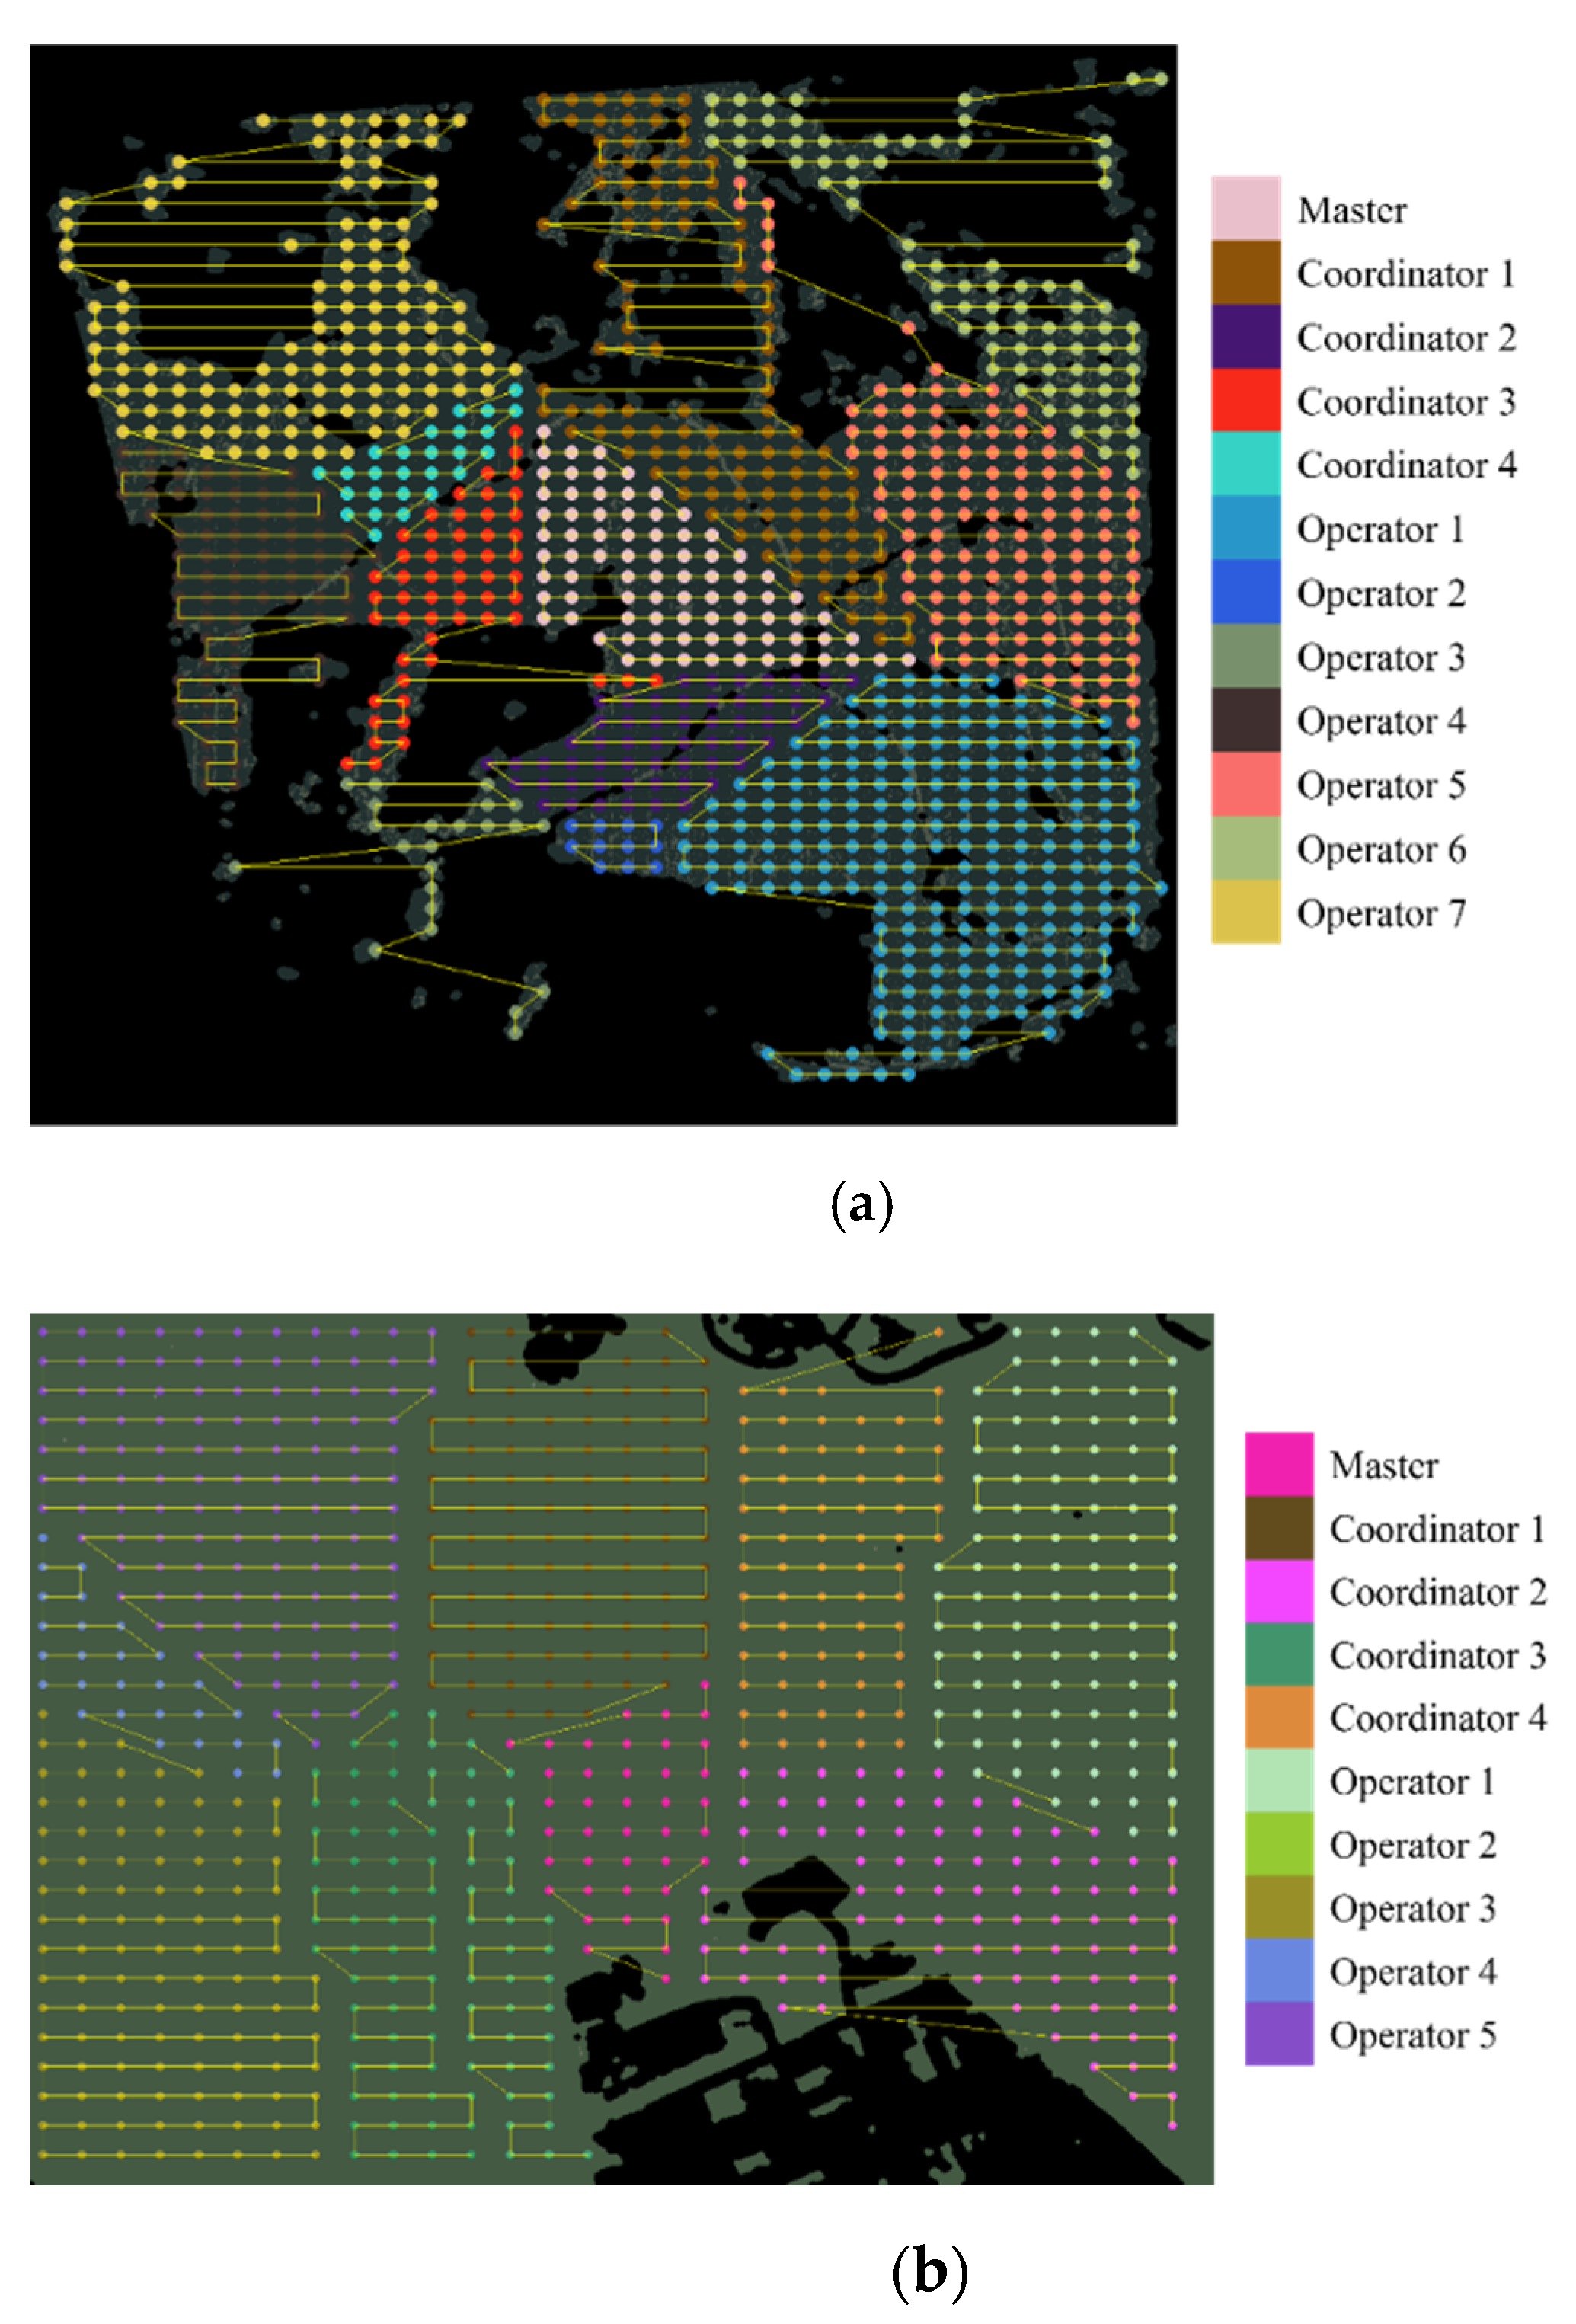
This section shows how the area partitioning proposed in the MCO Plan reaches a balanced heterogeneity of coverage sub-areas. The metrics to compare the MCO plan with the Boustrophedon and the K-means-based plan are the magnitude and trend; both were analyzed in the selected workspaces in Cauca.
Figure 14 shows the resulting sub-areas of each plan, which are the basis for a qualitative analysis of the maximum distribution of waypoints (last column on the right in
Table 5), and are grouped by color to differentiate the sub-areas in each coverage. On the left column of the figure, Boustrophedon decomposition projected vertical rectangular shapes in all ranges since ZLI corners are used to segment the geometry of the area. The clustering by K-means on the center column launched pentagonal shapes since the minimal distance between centroids is determined on world abstraction (grid). Non-regular forms are obtained with the MCO Plan on the right column of the figure since it is based on the Voronoi Tessellation that uses the geometric intersection of midwives. In brief, all projections can change geometrically when ZLIs are included in the workspace, resolving in heterogeneous sub-areas.
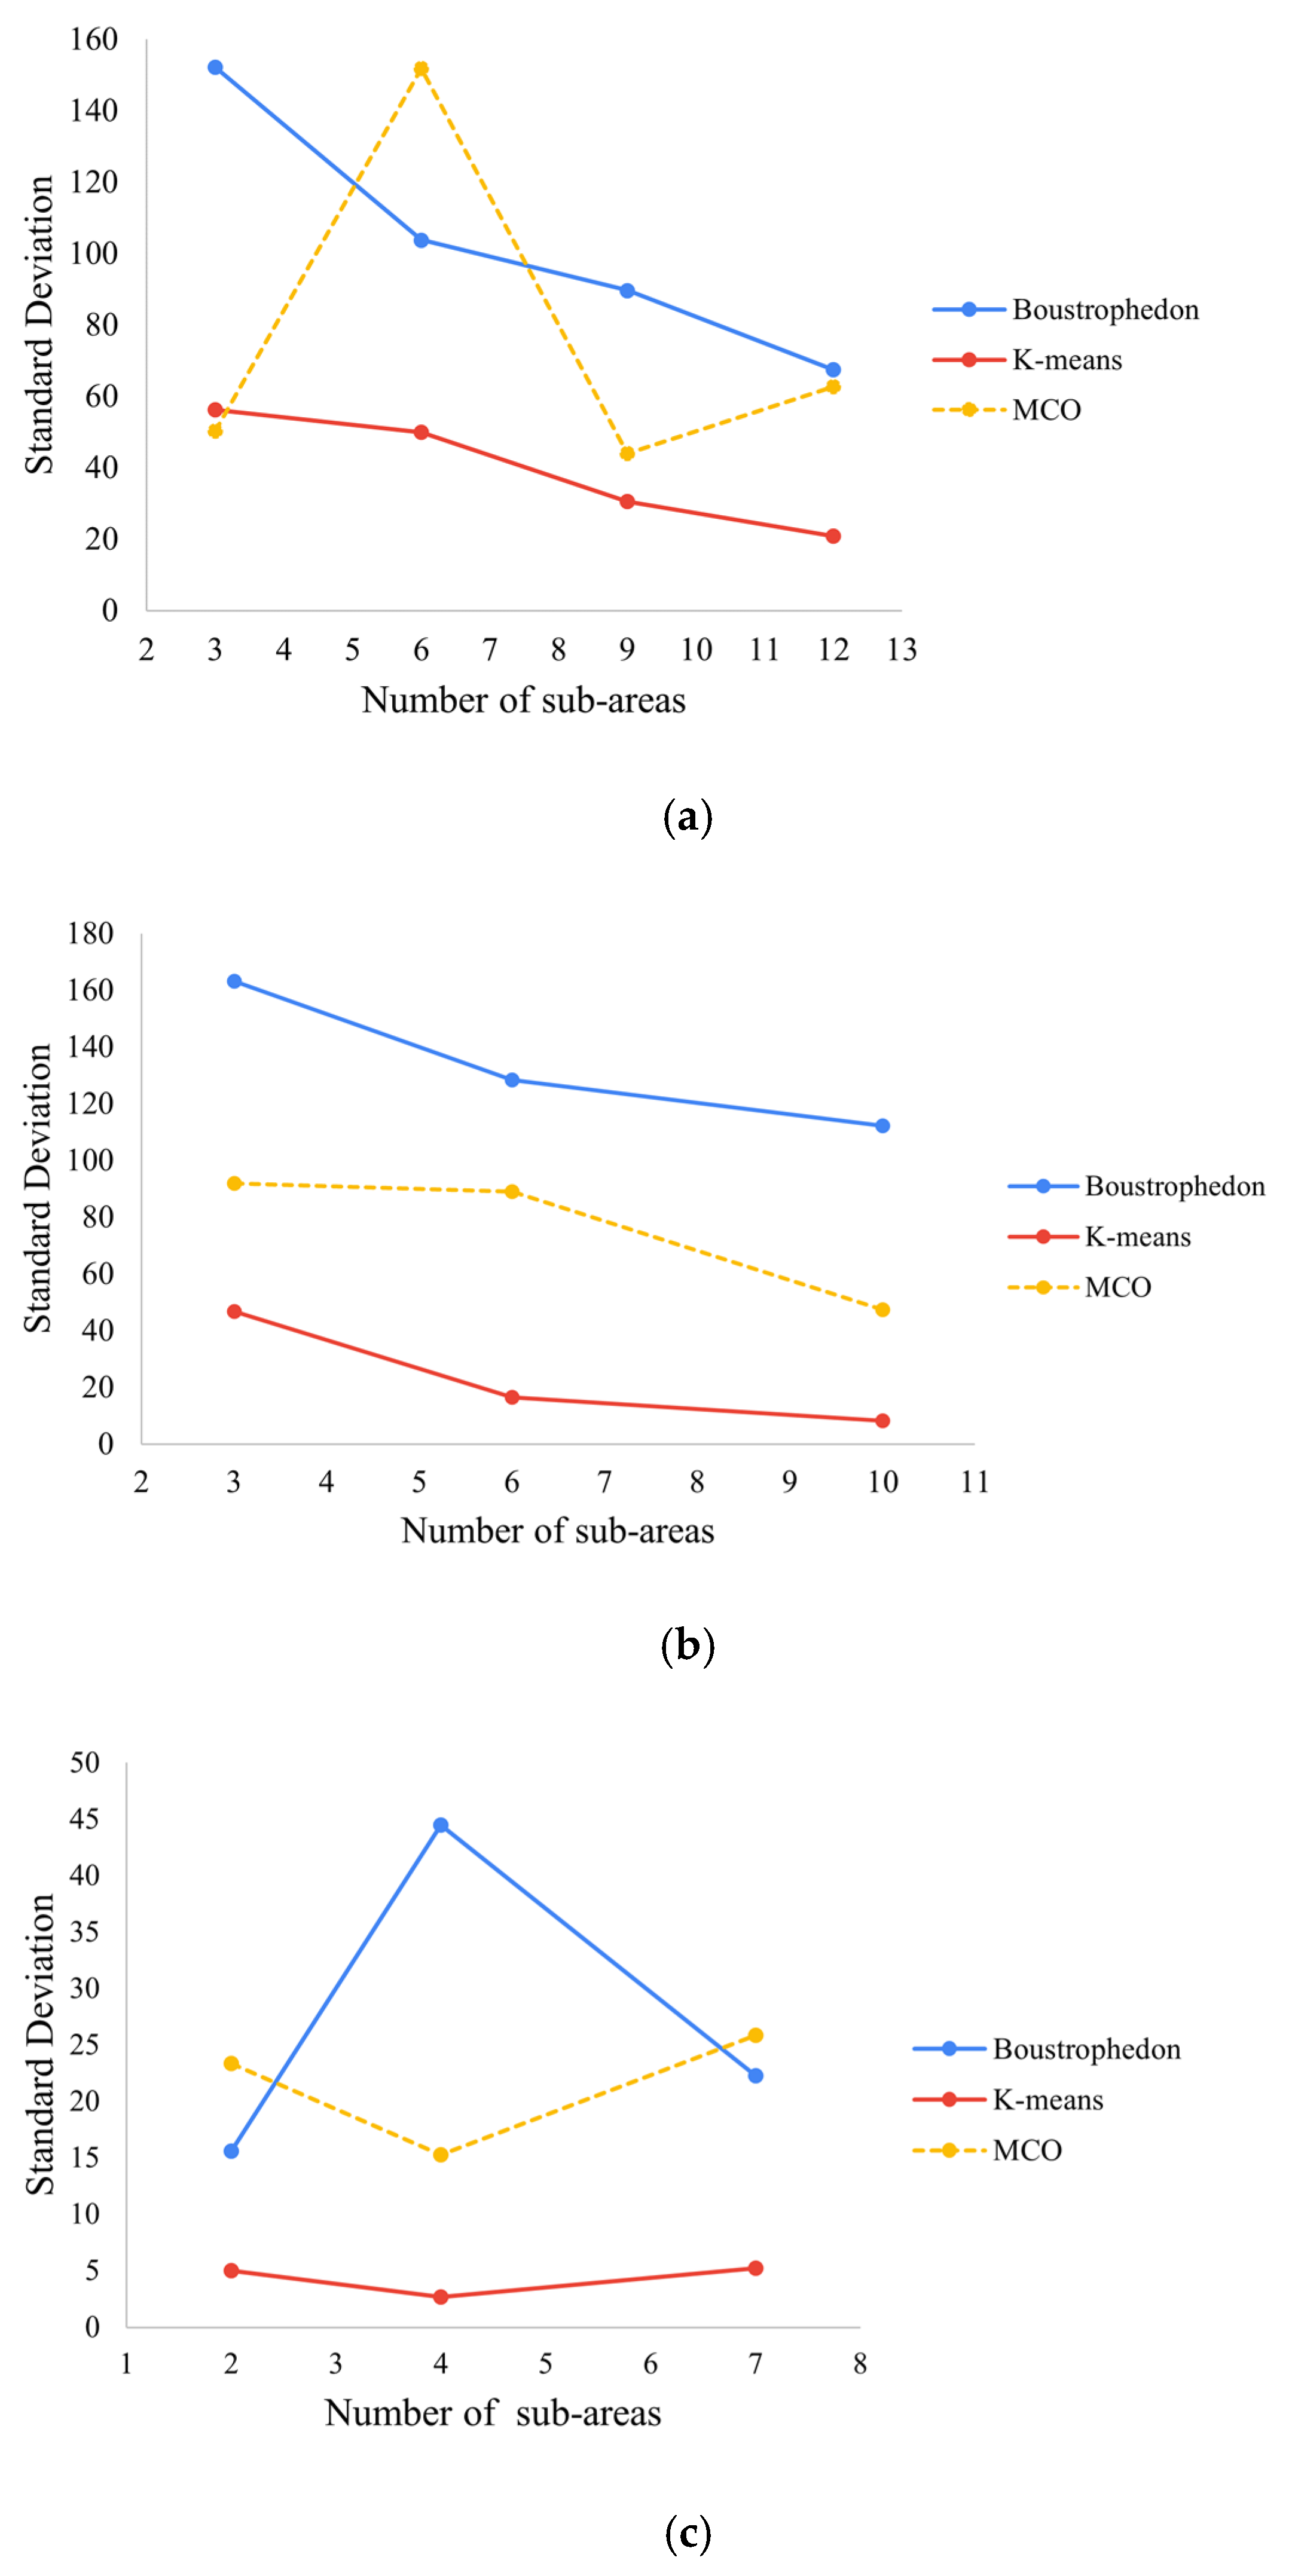
The next step is the quantitative analysis of the heterogeneity magnitude corresponding to the standard deviation. Then, if the resulting divergence is compared for each workspace as in
Figure 15, it is evident that the clustering-based partition (red line) has fewer minor deviations than other methods. Therefore, homogeneous sub-areas increase as the number of MAV agents increases. In contrast, Boustrophedon decomposition shows the highest divergence for the three study cases, as is expected from the literature, achieving a better heterogeneity skill than the MCO plan (yellow line).
In the results from
Figure 15, the MCO plan states a maximum standard deviation of 7.9% for Naranjos Farm, 9.2% for Urban Zone, and 7.5% for Rejoya Farm. As it is observed, the MCO plan reaches mean values between Boustrophedon decomposition and K-means clustering, although the trend was not coherent between them. The Pearson correlation coefficient was used between the traditional method and the MCO Plan (
Table 6,
Table 7 and
Table 8) to detail the trend.
In brief, the correlations are higher while the number of MAV agents is slight, such as 2 or 3; it is consistent because, with fewer sub-areas, heterogeneity is not tangible. Meanwhile, the correlations show that the partitioning of the MCO plan is closer to the K-means pattern in most study cases (
Figure 15). In addition, in the Naranjos Farm (
Table 8), the correlations are higher than in other workspaces, even with the perfect association. The result is given by the expansive workspace that forces the plans’ similitude. Another factor could be the non-centered convex ZLIs, which restrict the ability to propagate sub-areas towards the edges as MCO Plan proposes.
According to the observations above, the Boustrophedon decomposition reaches the higher heterogeneity skill in the three evaluated workspaces, with more than 100 waypoints of standard deviation. However, the resulting sub-areas could become small or large, as the ZLIs limited them, which is considered an unbalanced heterogeneity. For instance, the Boustrophedon-based plan for Rejoya Farm (upper left corner of
Figure 14) had sub-areas with just three waypoints and others twenty times greater. Consequently, resources are not efficiently managed because, firstly, few MAV agents have greater responsibilities and may make a non-completed mission. On the other hand, the requirement for shorter or longer flight times restricts the user from investing in extra skilled MAVs. Different improvements can be made to achieve a balanced heterogeneity with the Boustrophedon partitioning as the heuristics. However, the effort has a limit due to heterogeneity caused by obstacles, which will consume more computational resources to reach proper partitioning.
The plans’ divergences based on K-means show the lowest values between 2 and 50 waypoints (red lines in
Figure 15). Despite the low magnitude, the clustering method looks similar to the pattern of Boustrophedon decomposition, which notices a trend to decrease the deviation for both strategies. The Boustrophedon pattern changed notoriously for a smaller number of agents as
Figure 15c, which could be a result of partitions dependent on ZLIs. However, after eight divisions, K-means will linearly decrease the heterogeneity, and the Boustrophedon decomposition will stabilize by the fixed ZLIs in the workspace. Hence, it is denoted that the MCO Plan engages the heterogeneity skill as Boustrophedon decomposition without using ZLIs as a reference. It is compensated with the linear decrease without reaching the homogeneity as partitioning based on K-means.
Further, in
Figure 14, it is possible to see that the clustering by K-means and Boustrophedon decomposition resulted in disconnected sub-areas with complex ZLIs, such as Rejoya Farm. Independent sub-areas do not support cooperative control. The MCO Plan faces that weakness with sub-areas expanding from a take-off position to the edges. Therefore, the sub-areas would converge, increasing the likelihood of a connection between them.
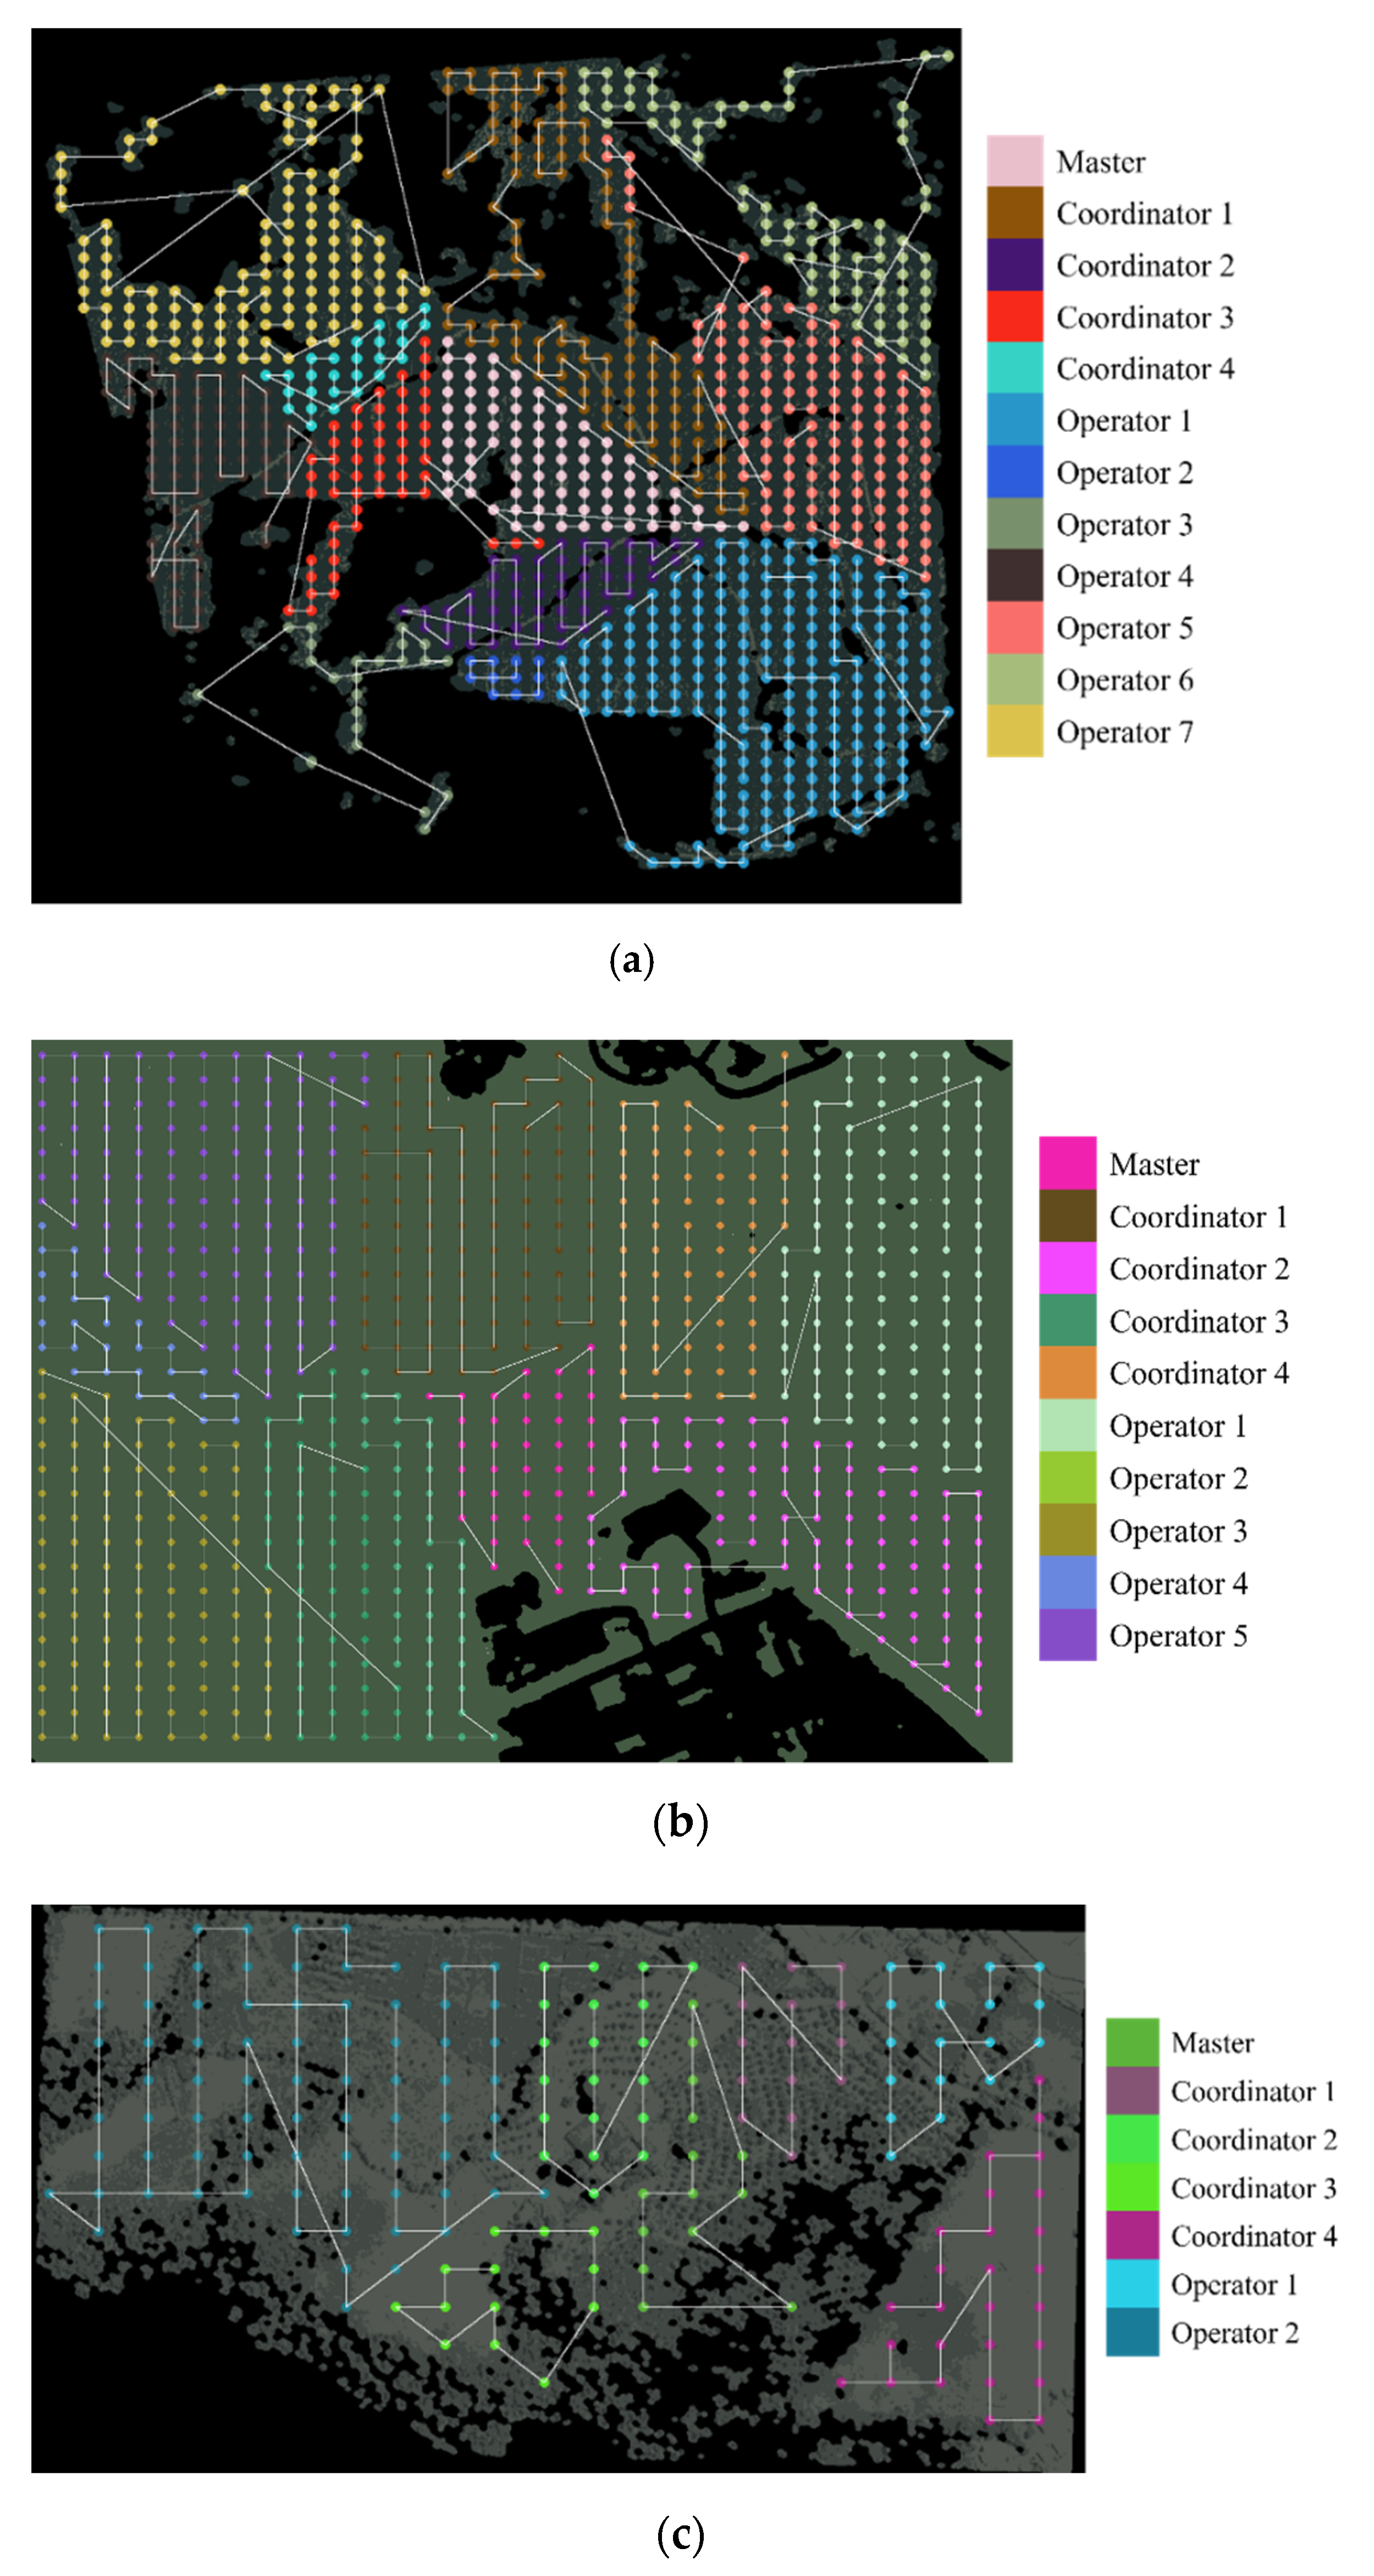
5.2. Role and Task Allocation with Zigzag Path
The previous description tried to describe heterogeneity according to the workspace and its distribution of waypoints as just “divide and conquer”, however, it is necessary to contrast the area partitioning with the MAV agent behavior when a coverage task is allocated. The following results were obtained using the simulation environment (GAMA Platform) and according to the role and task allocation mechanisms. In this experiment, each MAV agent had an allocated role and a coverage path based on back-and-forth movements (a zigzag path) using the method in
Section 4.2.5, resulting in a maximum partitioning distribution of each workspace as in
Figure 16 (as an example to avoid extra figures).
The objective was to show how the MCO Plan can achieve better energy management during a coverage mission using a balanced heterogeneity (magnitude and trend) and connectivity.
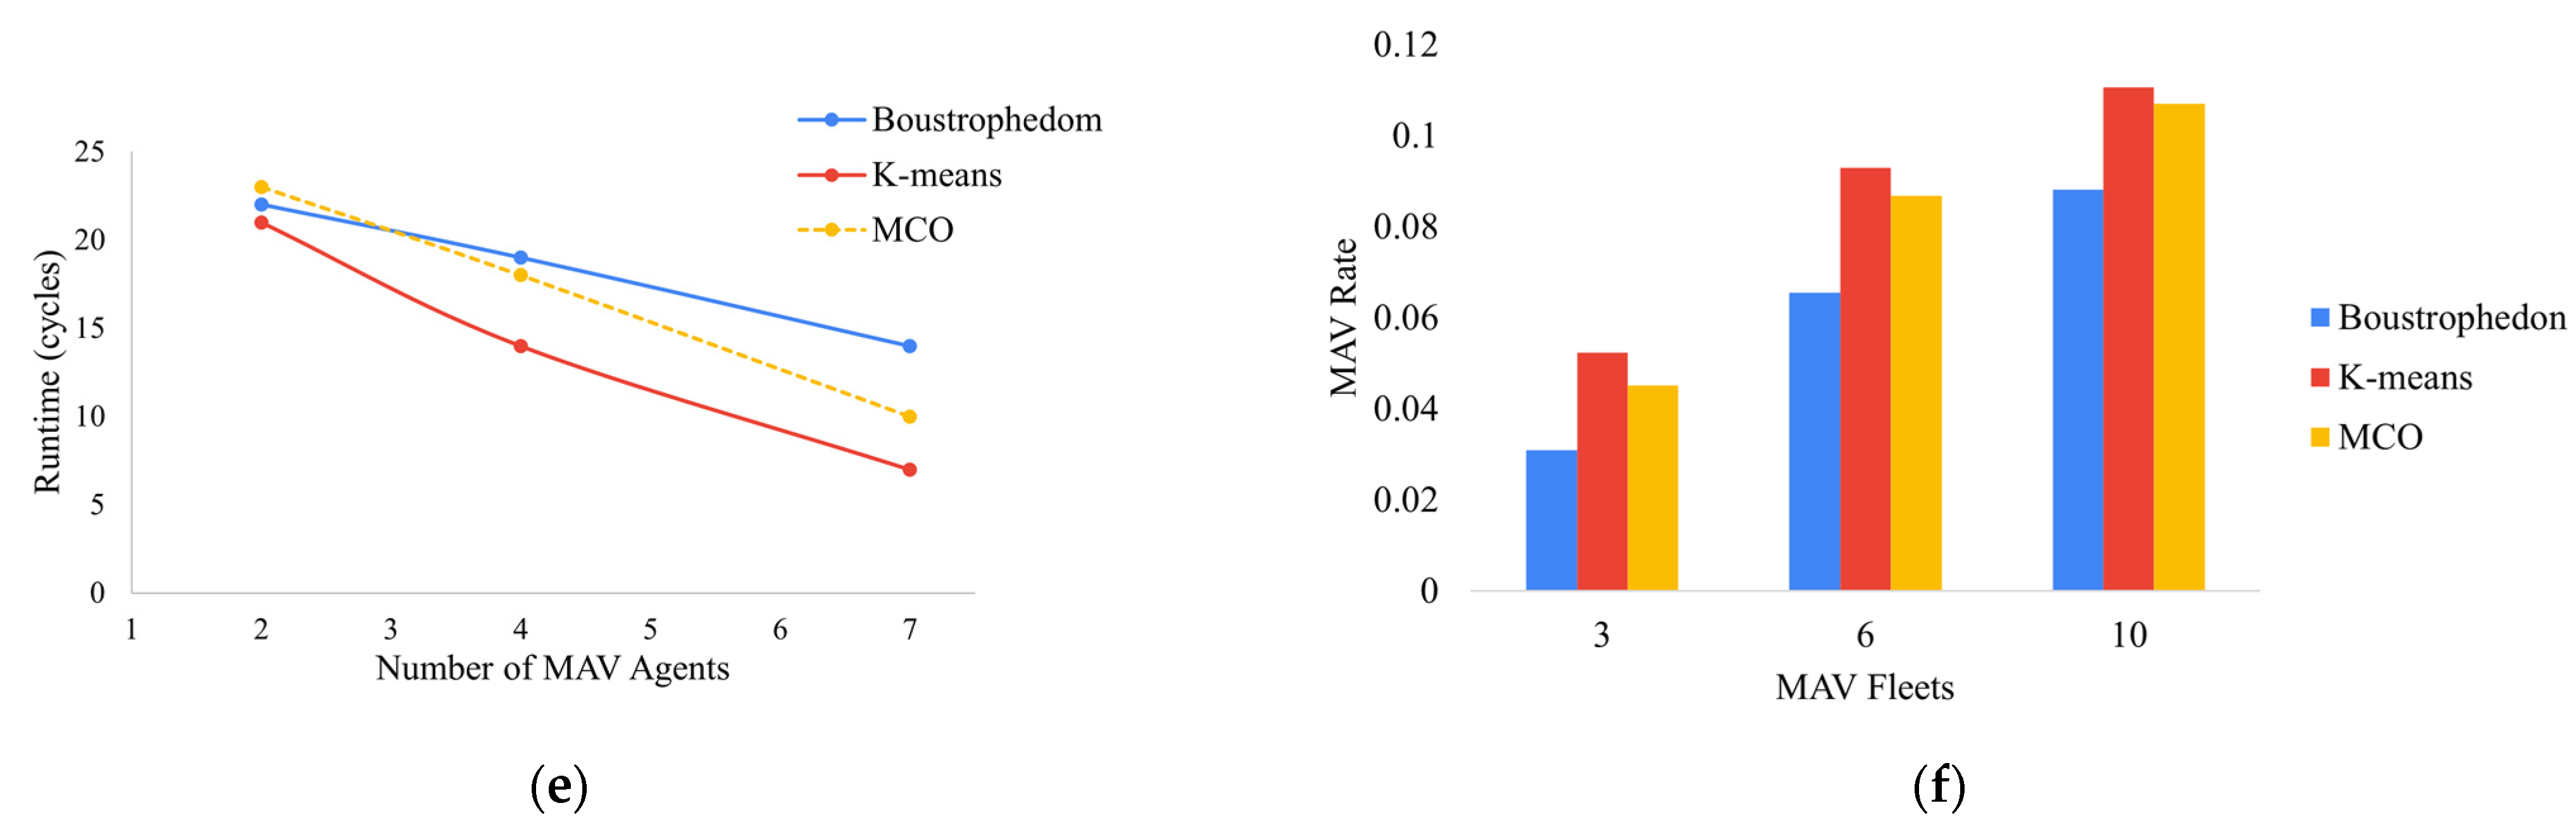
Some metrics were calculated to measure the impact of heterogeneity in each workspace and for the three plans mentioned above. The metrics are the time that each MAV fleet requires to complete the mission (mission time), the number of active MAV agents per time (MAV rate), and the percentage of remaining battery after the task (% remaining battery).
Figure 17 states coherence with the partitioning of each plan. Considering the mission times, the allocation based on K-means had the lowest mission times. Still, complex areas like Rejoya Farm expanded the mission times because the sub-areas were broad and homogeneous, as shown in
Figure 17a.
Conversely, to have the best mission times, the K-means allocation was based on must-have agents active during longer times, as
Figure 17b,d,f show in the red columns. The result is that most MAVs would drain energy faster, risking the completeness of the coverage mission (
Table 9,
Table 10 and
Table 11). If some event required cooperation, few MAV agents could support it.
The allocation based on Boustrophedon denotes a trend to stabilize mission times in each case of study in
Figure 16, due to the resulting tasks around the ZLIs. They varied little and resolved in lighter tasks if the MAV agents increased. As an advantage, the Boustrophedon allocation has the least number of MAVs per time unit, which is a consequence of calculating many small tasks and only three or four long ones (with longer task times). The Boustrophedon allocation transmits a message that most MAVs could have significant excess energy at the mission end. At the same time, few MAV agents would reach their limit of energy before the mission ended.
Concerning the MAV rates in
Figure 17b,d,f, the allocation using the MCO plan has a trend of managing active agents during less time than K-means allocation, despite the high correlation demonstrated in the previous section. This triumph is reached because the sub-area sizes increase exponentially for the MCO plan, while in the K-means allocation, the growth is linear (compare the yellow columns in
Figure 17b,d,f). The interpretation of the result is that the MCO plan can balance managing missions using MAV agents with minimal to intermediate resources, especially in those with few tasks, as shown in
Figure 17f.
Table 9,
Table 10 and
Table 11 show the remaining battery after the completed mission. This indicator is essential for the current research because it allows MAVs with intermediate skills to cooperate with their energy savings. The averages of saved energy obtained from all agents for the Rejoya farm were 90.77%, 87.76%, and 89.93% with the Boustrophedon, K-means, and MCO allocation, respectively. In the Urban Zone, the mean percentages were 75.55%, 79.65%, and 83.96%, corresponding with the mentioned last order of methods. In the same order, the percentages for Naranjos Farm were 75.33%, 86.83%, and 86.96%. Therefore, the MCO plan reached higher values than other allocations, distributing the resources efficiently regardless of workspace restrictions such as obstacles in the middle of the free space. Moreover, the comparison of the methods shows a battery decrease without exceeding 40% for the MCO plan, while Boustrophedon finished with an upper reduction of 60%. It demonstrates that the heterogeneity pattern identified in the area partitioning section effectively influences the removal of the energy consumption of the fleet of MAV agents.
As a final inference, a result of the MCO Plan is that most MAV agents would have sufficient remaining energy to be used in case of cooperation for non-completed tasks. Although, area partitioning proved above that the chance of faults would be minimal unless environmental causes exist. In contrast, the Boustrophedon allocation obtains a higher case of defects in the deployment of missions by overloading a few agents. Finally, the energy decrease for MAV agents with K-means allocation was up to 22.63%, with the chance of faults lower than the Boustrophedon method and MCO. However, the result would be subject to homogeneous agents with intermediate to high resource levels to complete the mission.
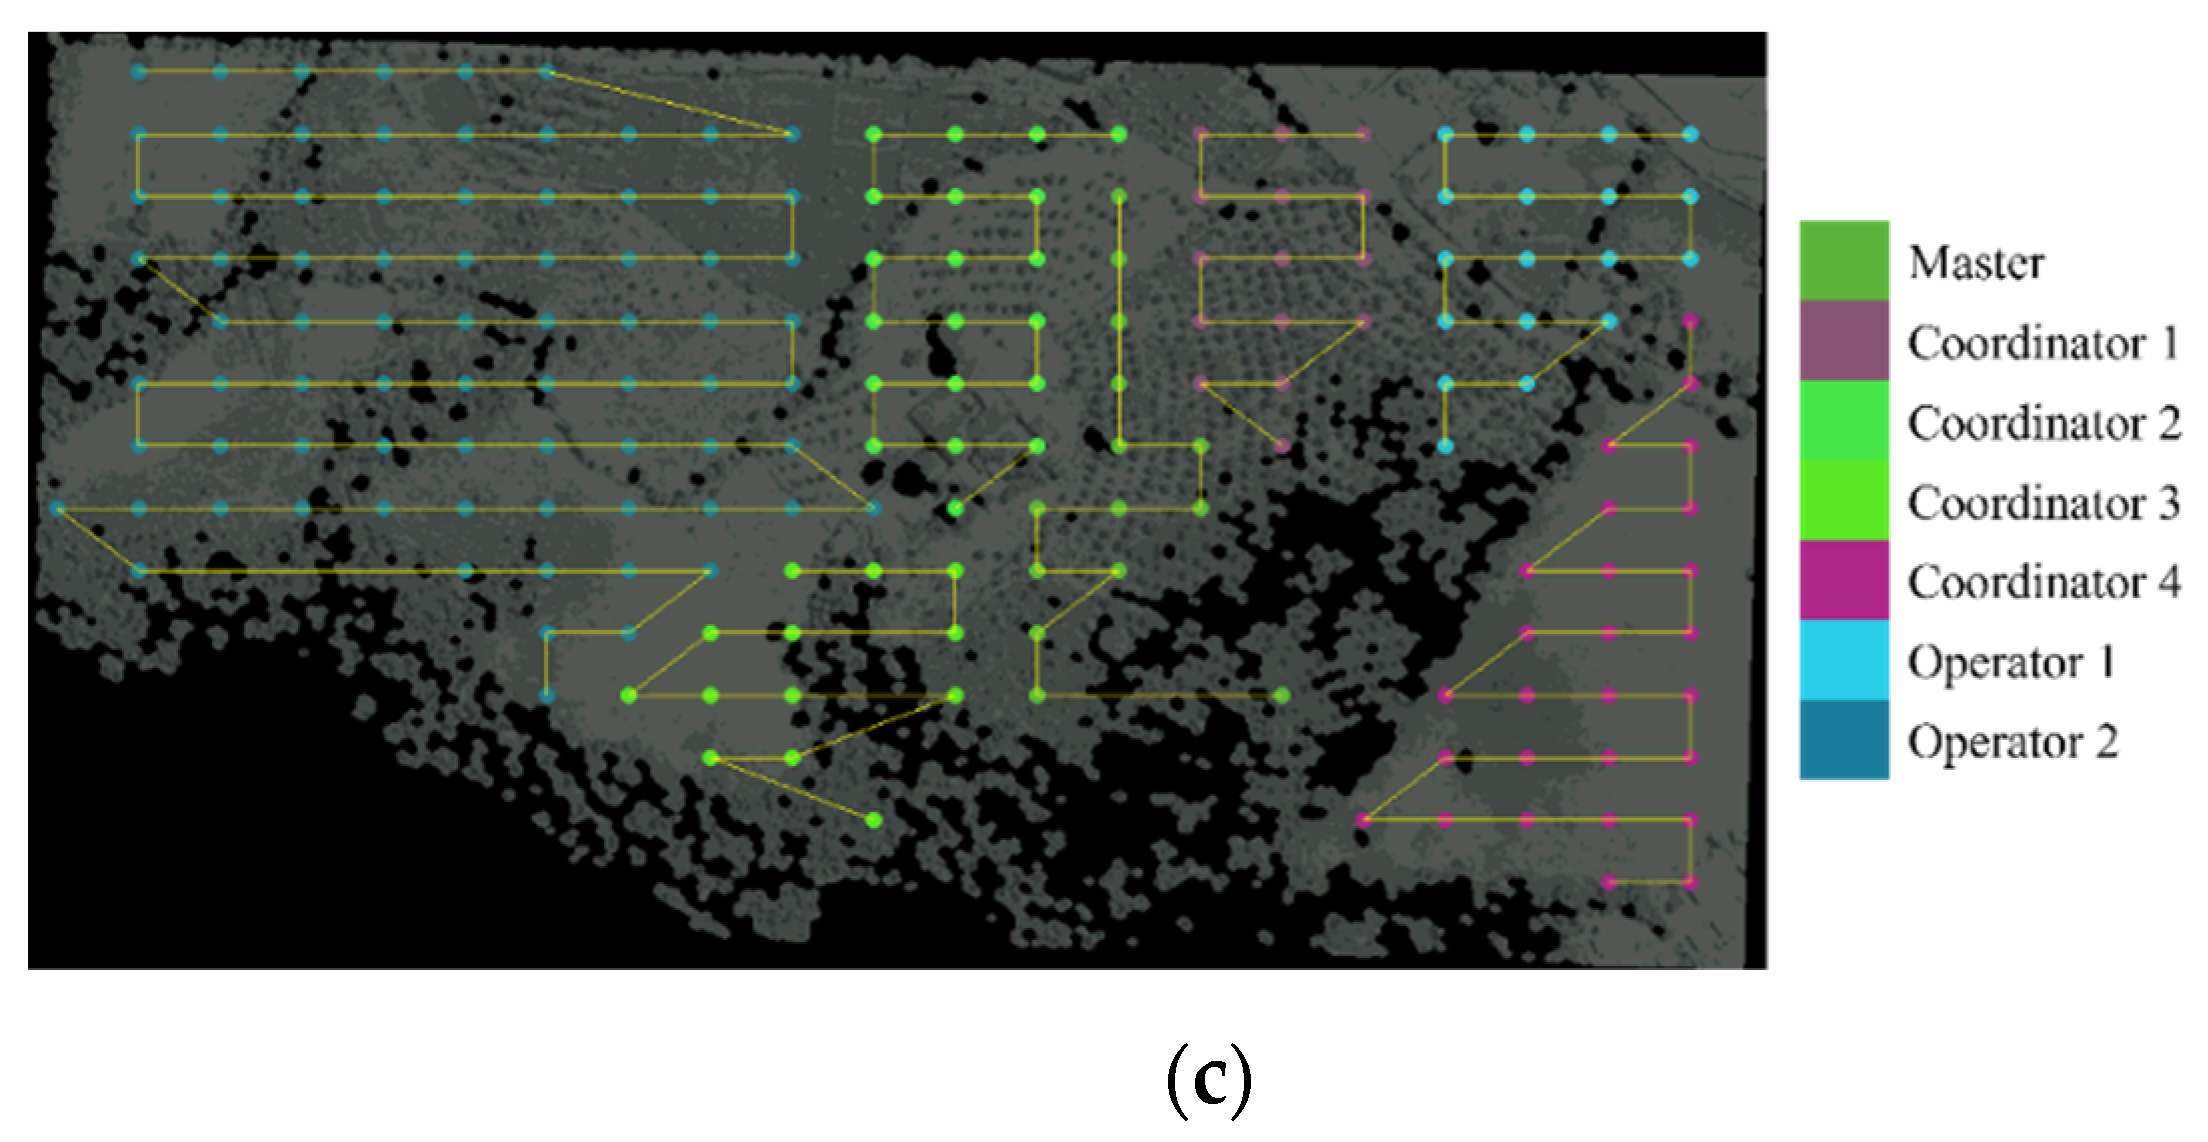
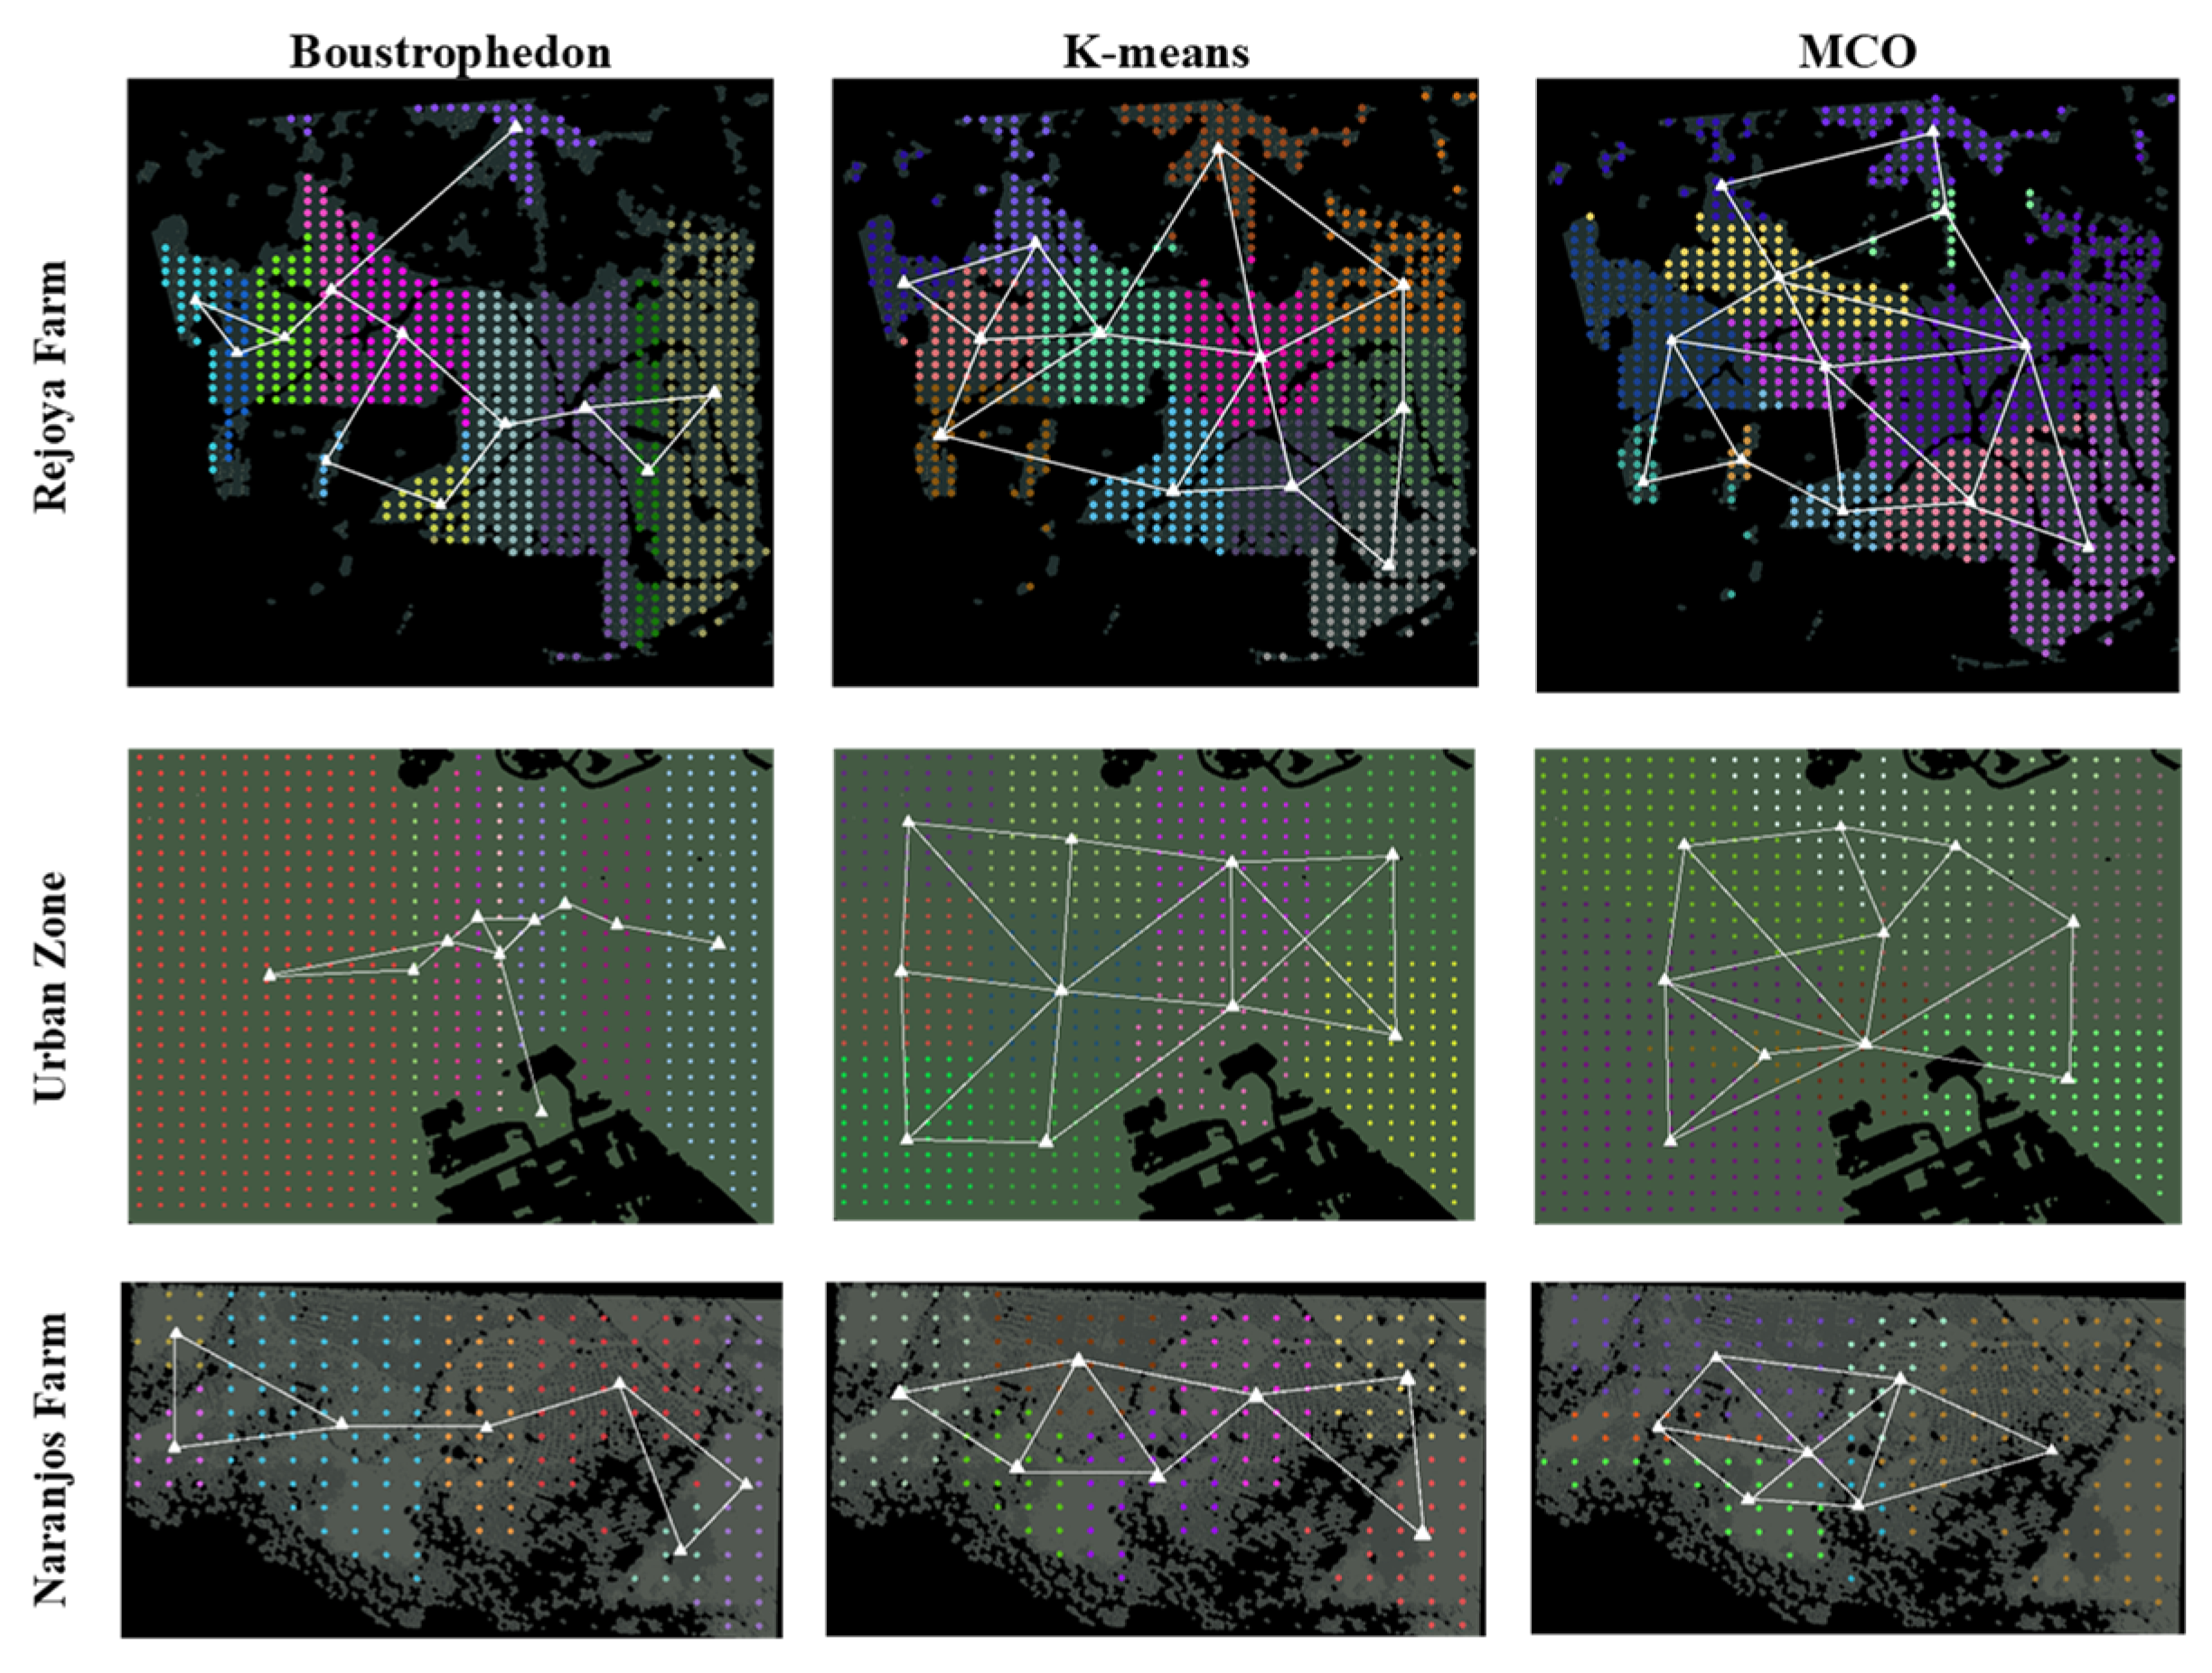
After evaluating the effect of heterogeneity on task allocation, the following analysis shows how the MCO Plan involves connectivity by studying the possible network topology and the number of links when the MAV agents find neighbors in a defined range. For the simulation experiment, the range was calculated with the fourth part of the diagonal segment over space.
Figure 18 shows a likely network topology on the resultant sub-areas for each mission planning and workspace with the maximum MAV agents to deploy. Previously, the Boustrophedon-based plan resulted in adjacent rectangular shapes (left column), and consequently, the possible topology resembles a Bus. This means that an agent would probably connect with side neighbors. The resultant topology for the K-means planning resembles a mesh (center column), as an evident outcome from the homogeneous waypoint distributions. The topology for the MCO plan has a hybrid focus based on multiple star topologies centered on the centroids of the area partitioning method.
Figure 18 is only an estimation of the likely links between MAV agents. Still, this trace allows for detecting the skill to reduce faults during the mission and resolve them without affecting the overall goal. The connectivity is low for the allocation based on Boustrophedon, although it can have more connection time when it flies the waypoints at the intersections. The K-means plan is better at managing cooperation, however, dynamic deployments in restricted workspaces can have high data redundancy if a persistent connection is held.
The MCO wants to overcome these issues. The observed topology in the right column of
Figure 18 has characteristics that at least one MAV agent can have an overload of links as a star, and the allocated agents on the edge can connect as a tree. In this order, that MAV agent with an excess of communication has taken the role of Master, and the peripheral MAVs have a role as Operators in the hierarchical society proposed in
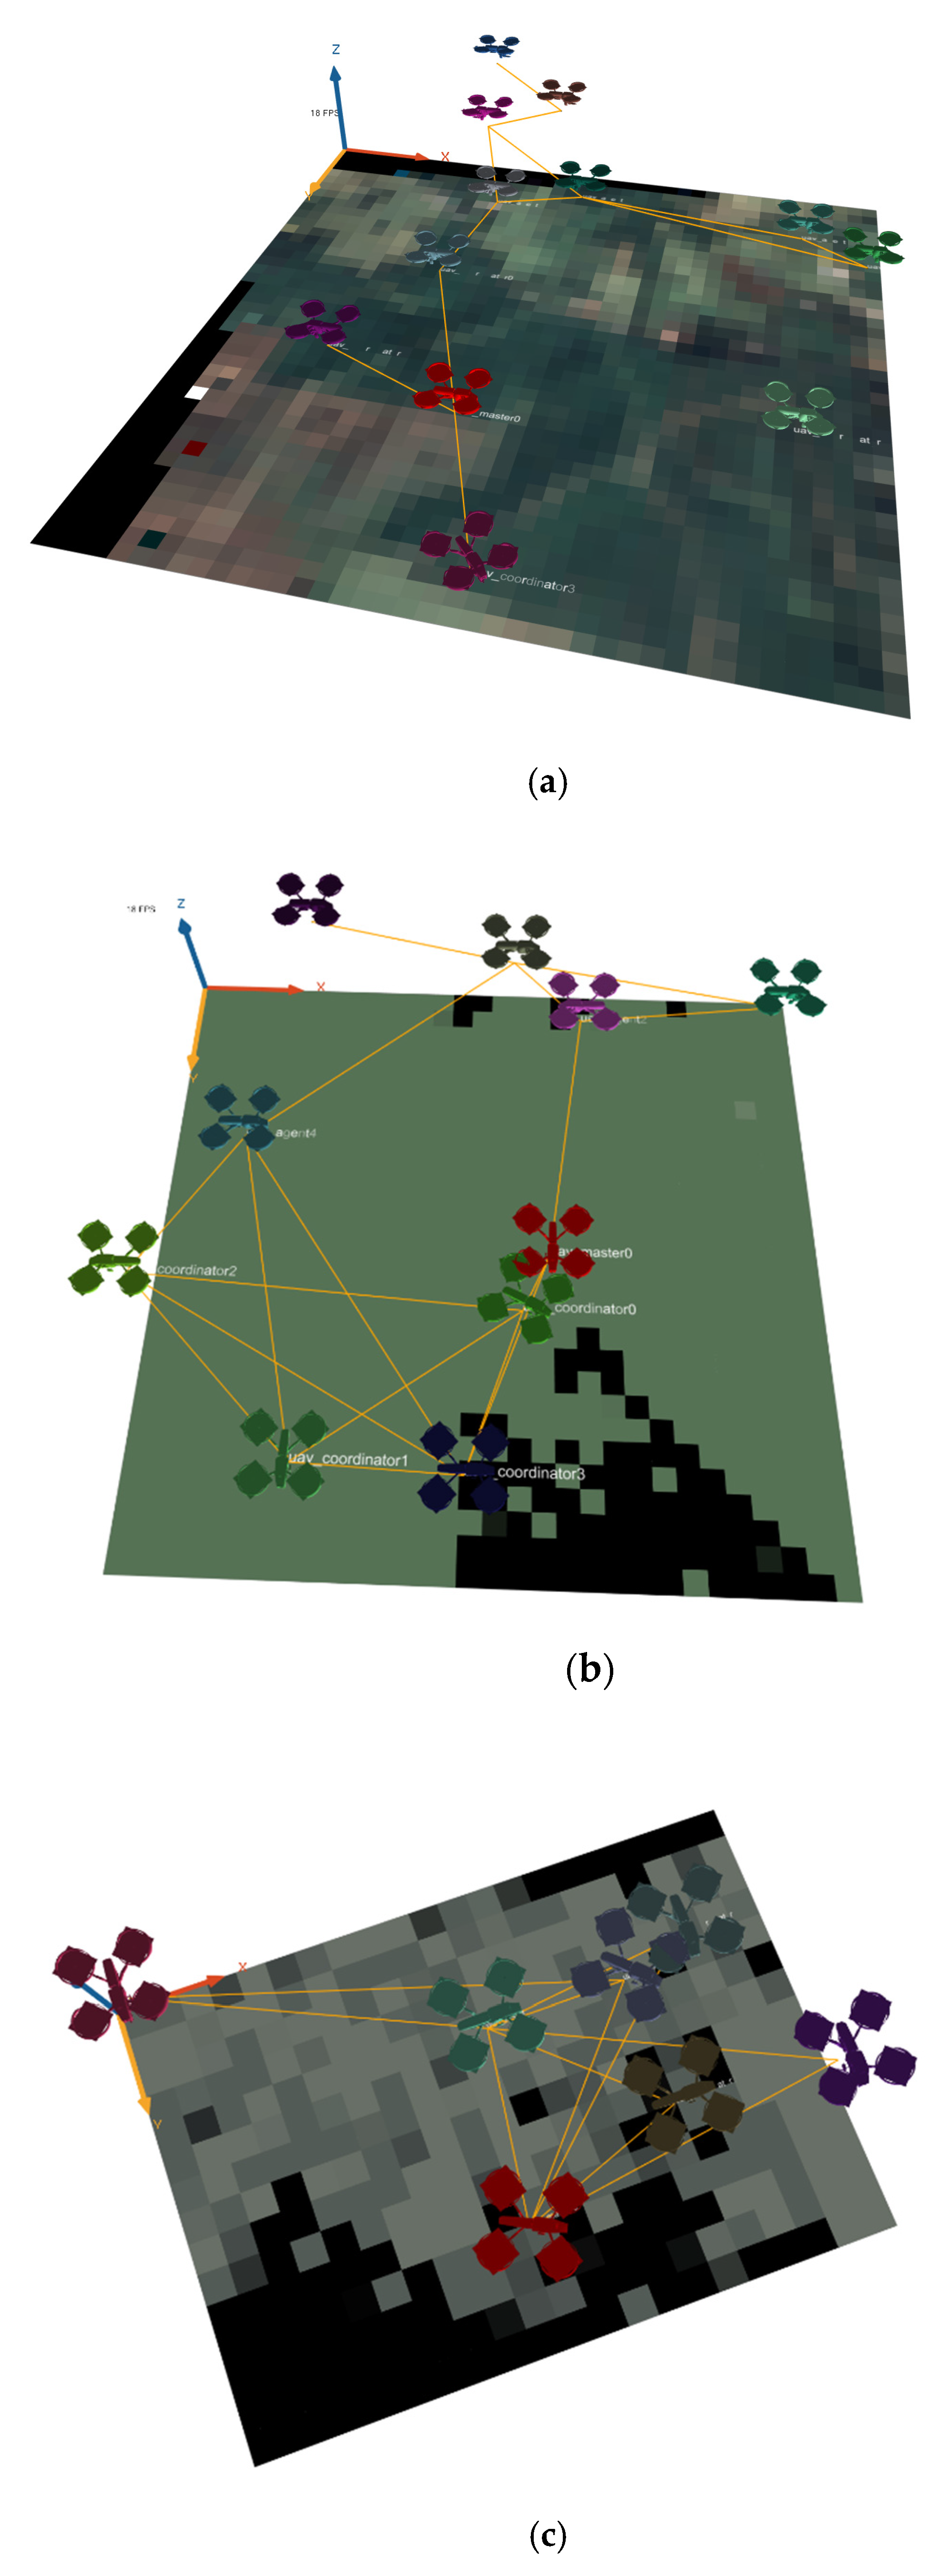
Section 4.2.3. As a complement,
Figure 19 shows the network topology at one instant of the simulation on the GAMA Platform for each coverage area with the MCO Plan The numerical results of total links between all fleets are in
Table 12,
Table 13 and
Table 14, with the Master highlighted in each allocation option to manage high data flow and shorter coverage paths. These tests confirm that the efficient consumption of the fleet can be supported by data routing based on the heterogeneity of the fleet.
The inferences above are confirmed by the number of links for each agent and the average connectivity time during the mission. The Boustrophedon-based allocation for Rejoya Farm, Urban Zone, and Naranjos Farm has the lowest link averages with 70.7, 47.9, and 20.3 (blue areas in
Figure 20) fronting to 130.2, 70.1, and 30.7 from the MCO plan, respectively (yellow areas in
Figure 20). On the other hand, the clustering method holds link averages similar to the MCO Plan but with shorter mission time as it waits. The K-means trend is to have a similar number of links for each MAV agent as
Table 12,
Table 13 and
Table 14 show. At the same time, the MCO plan proposes a centralized data flow with a few agents, resulting in a substantial difference in interactions between the collaborators. As
Table 9,
Table 10 and
Table 11 show, those MAVs with the overload have enough energy to resolve it since the MCO Plan manages to have fewer waypoints to visit with roles as Master or Coordinator. These are near the take-off location, facilitating the monitoring with data flows around the ground station and giving more control to the user.
In brief, the MCO Plan has the highest link averages in
Figure 18 for each workspace, with values between 4 and 5 per time unit because of its connected sub-areas on a hybrid topology. The power of a fleet with coordinated roles can be seen in the Rejoya Farm case in
Figure 20a, with ZLIs in the middle. The MCO plan can handle less mission time while the connectivity of the fleet is held. The MCO plan converges to a connectivity skill intermediate with larger free spaces such as the Urban Zone and Naranjos Farm.
5.3. Role and Task Allocation with the Firefly Path
Resource management of the proposed plan in previous sections illustrated the roadmap to efficiently deploying MAVs fleet in outdoor workspaces, considering some user requirements and the fieldwork. However, current research is working further to manage the energy of the coverage path. Based on
Section 4.2.4, it is possible to optimize the coverage paths of the mission through the Firefly algorithm [
37]. The motivation to advance the study is because the zigzag movement used above and in most reviewed literature and mapping tools frequently includes the ZLIs in the cruise flight, acquiring possible useless or redundant data to make decisions, in addition to increasing the data processing costs.
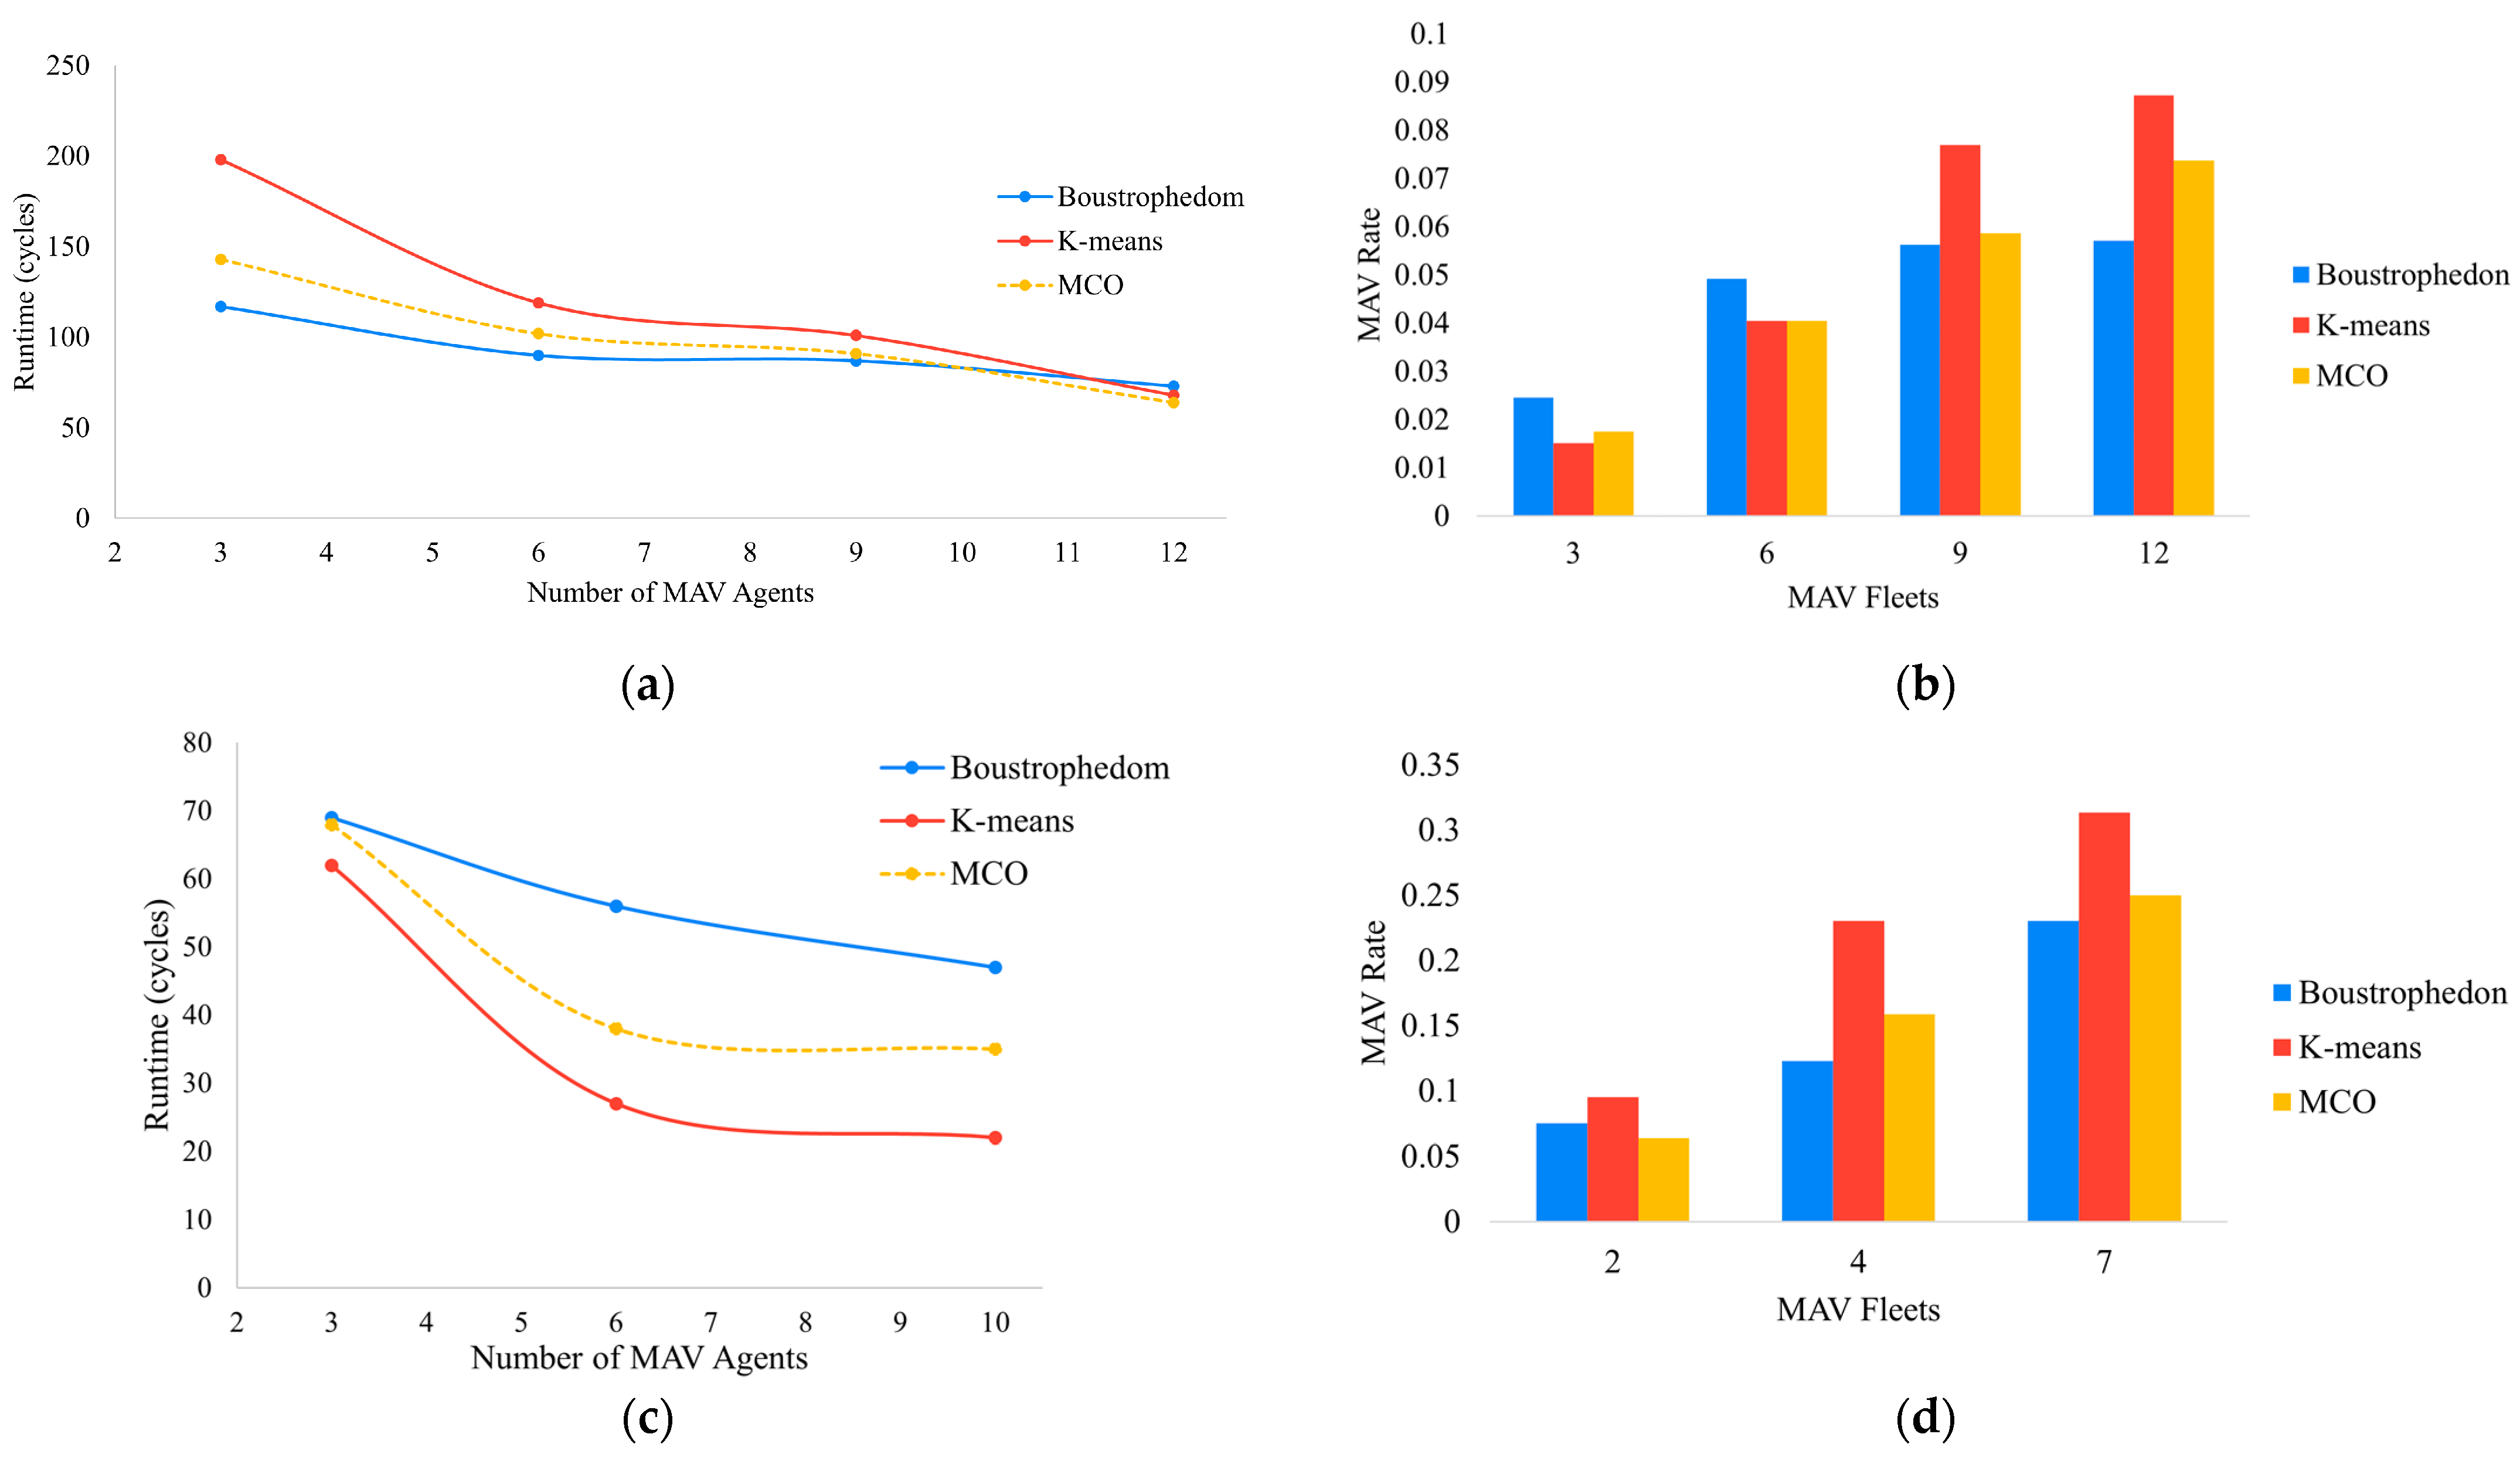
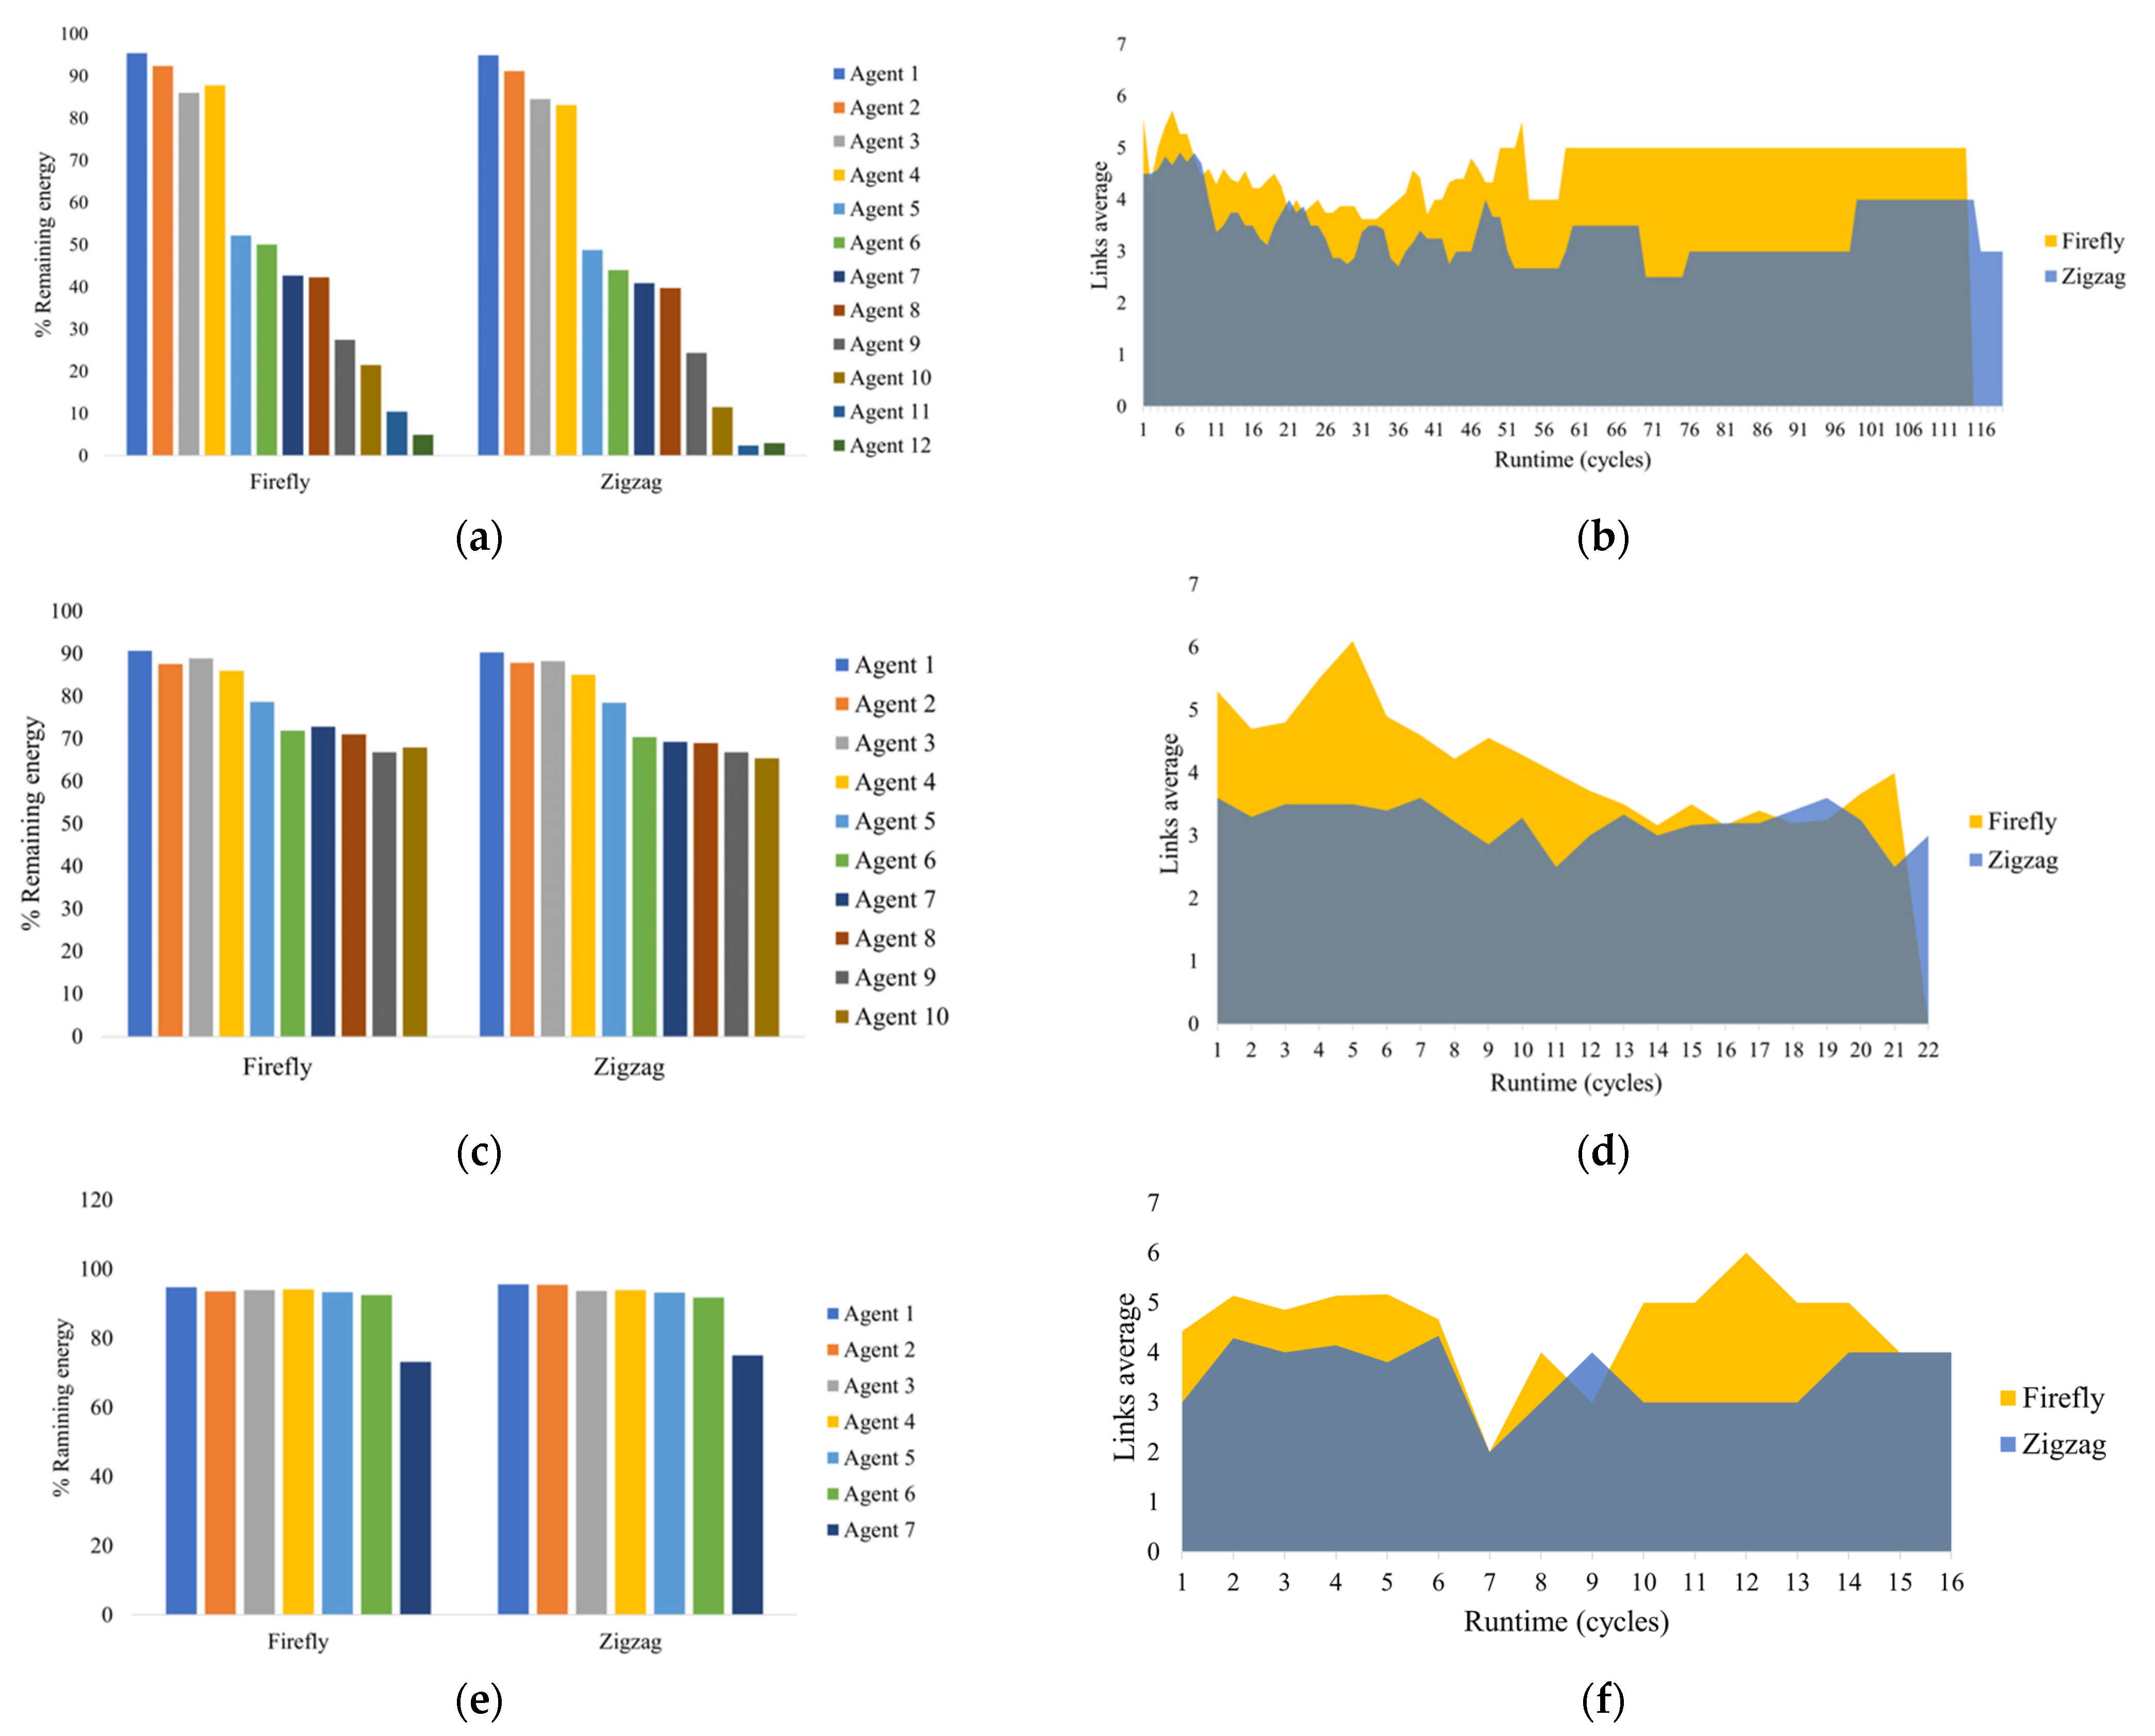
Figure 21 shows the task allocation with Firefly paths for the experiment with maximum partitioning for each case of study with 12, 10, and 7 tasks, respectively (as an example to avoid extra figures).
Figure 22 shows that energy consumption can improve with the coverage paths calculated with the Firefly algorithm. In Rejoya Farm, the gained energy reached up to 10% (
Figure 22a); in Urban Zone, it gained up to 2.5% (
Figure 22c); and in Naranjos Farm, it gained up to 1.9% (
Figure 22e). Such performance seen in the bars of the figures is consistent with the heterogeneity of the role allocation shown above. However, just the Firefly algorithm can resolve tasks with small sub-areas more efficiently than the zigzag pattern, gaining some cycles of time to complete the mission. As a complementary analysis,
Figure 22b,d,f displays graphs to show the link averages at mission time. The MCO Plan has a higher number of alleged links per time unit, which can be explained because the Firefly paths start to visit the peripheral waypoints of the sub-area and continue until they are as close as they can to the starting location again, therefore increasing the chance of connectivity.
The gained mission time is also argued in
Table 15,
Table 16 and
Table 17 which show the active MAV agents during the mission. The path based on the Firefly algorithm completed the missions saving 2%, 9%, and 25% of released MAV agents in Naranjos Farm, Urban Zone, and Rejoya Farm, respectively. This observation is highlighted in
Table 15,
Table 16 and
Table 17 to contrast that runtime changes the action of the MCO Plan.
6. Conclusions and Future Work
The MCO Plan is focused on resolving an efficient deployment of the MAV fleet, considering user expectations and restrictions of the workspaces. An efficient deployment means that the coverage mission should be completed with balanced resources. A novel area partitioning method was designed to include heterogeneous MAVs, data flow close to the take-off location, and partial communication between neighbors to satisfy these purposes.
The proposed plan created a hierarchical society with roles defined by adequate flight time, communication skills, and decision capability. Master, Coordinator, and Operator roles were allocated together with the coverage path through an auction mechanism. The integrated strategy was tested in three different coverage areas to show the scope of practical deployments.
The plan’s advantages were evident compared with traditional coverage plans such as Boustrophedon decomposition and clustering by K-means. MCO achieved a magnitude and trend of heterogeneity balanced between both methods, directly related to the intermediate mission times reached during the deployment tests in the GAMA Platform. Further, the plan managed fleet energy by decreasing the rate of active MAV agents during missions and increasing the chance to connect with neighbors. Such likelihood was even higher because the resultant coverage paths calculated with the Firefly algorithm followed movement patterns that started on the peripherical waypoints until the start position was found again. Therefore, the connectivity skill was incremented, beyond the clues, indicating reduced energy consumption compared to the zigzag movements.
Consequently, the presented coverage mission planning can improve resource management even more if wind, MAV turns, and energy consumption from communications are considered. Future research should incorporate new alternatives to generate coverage paths beyond managing fault resolution. These facts contribute to the future design of fault-tolerant cooperative MAVs for large and restricted workspaces.


