1. A Zoning Approach: A Systemic Solution for Successful Airspace Control
Unmanned aerial vehicles (UAVs), or drones, are a game changer in many business and public sectors because of their ability to exploit aerial dimensions and inexpensive operating cost. However, the applications of UAVs are often made with a single or a few UAVs in a relatively safe operation area. One of the reasons for such limited UAV applications is the difficulty in air traffic control and collision avoidance for UAVs [
1] for large-scale deployments. Although there have been dramatic advances in technologies for collision avoidance (e.g., artificial intelligence for path finding [
2]) and UAV flight system automation, the technologies are not at the desired level to resolve safety issues completely.
This difficulty becomes more significant when multiple UAVs are deployed in a relatively small area at the same time in a dynamic environment. When no cyclical stability on UAV tasks can be identified, this difficulty becomes even worse [
3]. This situation can be found in UAV application scenarios with a delivery function, such as UAV-based logistics [
4,
5], humanitarian/emergency aid operations [
6,
7], or in cooperation with other unmanned systems [
8,
9]. These applications are where the demands for services are expected to exceed the supply levels that can be fulfilled with traditional means of transportation, and the task can be performed better with exploitation of the aerial dimension. Therefore, a large-scale UAV fleet deployment is desired to handle the increasing service demands and to maximize the service quality.
A key solution to realize large-scale UAV operations is an unmanned aircraft traffic management (UTM) system, which manages airspace for multiple UAV operations through real-time control. Following the increasing volume of UAV operations and the need for UTM systems, federal regulatory agencies such as the European Aviation Safety Agency (EASA) and the Federal Aviation Administration (FAA) in the United States have conducted several projects and discussed the concepts of UTM and regulations of UAVs [
10,
11].
While airspace for UAVs is increasingly regulated, the feasibility and performance of UTM is still far behind the desired level, especially considering the envisioned future air traffic densities. Unlike the well-established and -functioning air traffic management (ATM) systems for manned aircraft, the following aspects of UAVs challenge the development of UTM [
12]:
Different types of UAVs with different performances;
Limited capability to carry heavy or power-intensive equipment;
Limited capability to automatically detect and avoid collisions;
Increasing needs for UAV operations beyond visual line of sight (BVLOS) for greater economic values;
High density of operations, likely flying very close to other units;
High degree of vulnerability to operational environments (e.g., wind).
These key differences between manned aircraft and UAVs underline the complexity of the development and implementation of a UTM system. UTM implementation involves novel challenges, including decentralization of governing authority over large-scale UAV operations and interactions with pilots to share crucial flight and safety data [
13]. When narrowing down the UTM for the safety aspects of UAVs, safety separation standards, collision risk prediction, and collision avoidance can be listed as the critical research topics, and there needs to be significant advances for full- and large-scale UAV operations [
14].
Considering the complexity of the involved design and decision-making problems in the UTM, it is clear that a centralized air traffic control (ATC) with a full synchronization of large-scale UAV operations is extremely difficult to achieve. In the context of ATM, the ATC-related decision-making authority is distributed among flight crews, the air traffic service providers, and aeronautical operational control organizations in order to reduce reliance on the centralized ATC [
15]. In the context of UTM, however, it is difficult to give UAVs the freedom for their path and speed selection in real time, because full automation of path finding and conflict resolution for large-scale UAV operations in a decentralized manner is highly complex [
14,
16,
17].
As a systemic solution to the difficulties of UTM implementation, a zoning approach, where an operational area for UAVs is decomposed into a set of sub-areas and a maximum of one UAV can be deployed within a sub-area at a given time, can be considered [
18]. By this approach, the flight paths of UAVs in different zones do not overlap, and it is likely that UAVs remain well clear with or without minimum control efforts. The flight planning and control problems involved in a UTM can also be made simple, as the interaction level between UAVs are minimized by the zoning approach.
As such, the workload for airspace control and collision avoidance can be dramatically reduced by the zoning approach. Importantly, this reduced workload can be further distributed to the sub-UTMs for each zone in favor of the zoning approach. Given that most of UAV control systems are still operated by humans, this zoning approach also brings advantages to UAV service providers, that is, to reduce the manpower for UAV deployment and corresponding operating costs. The expected benefits of the zoning approach are summarized as follows:
Reduced burden to control/monitor UAVs;
Reduced risk to safety;
Minimum communication between UAVs;
Increased chance of UAV flight automation;
Scalability for a large-scale UAV deployment;
Reduced complexity of relevant planning and control problems in a UTM.
On the other hand, one can question the negative impacts of the zoning approach on the service-to-customers level, as the means to serve demands is restricted by the approach. Indeed, the set of demands or the area a UAV can cover is limited by a zoning solution in terms of volume, size, and location of the demands. Therefore, considering the zoning approach as a demand-server allocation problem, it is important to derive a zoning solution so that the resulting service level to customers is kept at an acceptable level, while fully exploiting the advantages of the zoning approach.
The aim of this study is to demonstrate the advantages of the zoning approach from the UAV safety and service quality perspectives. Specifically, we answer the following questions:
How much separation between UAVs is expected to be achieved by the zoning approach?
Will the zoning approach result in service quality degradation?
What would be the determining factors for the zoning approach performance?
To answer these questions, we analyze the performance of the zoning approach from a systemic perspective. We first generate package-delivery-like scenarios, where multiple demand nodes in an area are served by multiple UAVs. We group the demand nodes using clustering techniques and derive a zoning solution accordingly. The performance of the proposed zoning approach is examined under multiple demand configurations using a simulation model, compared to other benchmark service strategies.
2. Related Work: Zoning in Literature
UAV application areas are numerous and include those domains where automation, low operation costs, and aerial dimension exploitation can bring values. Otto et al. [
19] present a comprehensive review on UAV applications, classifying the UAV-involved tasks in the applications and relevant planning problems. Mukhamediev et al. [
20] also present detailed UAV use cases in various industry applications, highlighting relevant data management and processing tasks.
The UAV applications where the concept of zoning is relevant can be further classified into two classes: area coverage and package delivery. The area coverage class addresses tasks for searching and monitoring an area, whereas the package delivery class addresses transportation-related activities.
By the nature of the zoning approach, one can easily find its link to the area coverage class, where efficient use of units by properly assigning responsible areas to the units is critical to achieve a service/mission goal (e.g., to minimize the time it takes to search an area). Fu et al. [
21] propose a local Voronoi decomposition algorithm for exploration task allocation to multi-agents. In this approach, Voronoi regions of each agent are calculated based on the agents’ positions, and the agents move only within their regions to avoid overlapping tasks. Miao et al. [
22] apply a map decomposition approach to assign sub-maps to cleaning robots so that large-scale cleaning areas are effectively distributed and assigned to the robots. Xiao et al. [
23] apply area segmentation for UAV coverage planning in a grid map. Once a take-off location is determined, an area of interest is specified as a set of grids and further divided into sub-areas so that the energy required to cover the sub-areas are balanced and collisions between UAVs can be avoided. For three-dimensional coverage path planning, where different coverage paths depending on altitudes of a region of interest are generated [
24], multiple UAVs can be assigned to different altitudes for coverage operations.
The zoning approach is also found in the package delivery application class, the focus of the zoning approach in this study. UAV-based package delivery is a UAV application with increasing demands and demonstrated profits. To realize this service concept with minimum barriers to its implementation, various practical issues, such as preserving privacy, have been addressed [
25].
The main focus of the zoning approach in this class is collision avoidance and ease of UAV traffic management, the critical challenges for package delivery by UAVs [
26]. Amazon, who first introduced the concept of package delivery by UAVs, proposes an airspace model where civil airspace is segregated by altitudes based on vehicle capability [
27]. In this model, a low-speed localized traffic area is used for the UAVs without sophisticated sense-and-avoid technology, whereas a high-speed transit area is used for well-equipped vehicles. The model also includes a no fly zone to buffer the UAV operations from current aviation operations. Feng and Yuan [
28] apply space zoning to a low-altitude airspace that divides the space into upper, buffer, safe, and bottom zones according to space height restrictions in order to construct flight corridors for UAVs. Sung and Nielsen [
18] propose a zoning approach that divides a service area with a single UAV station into zones. They allow at most a single UAV to fly within a zone and investigate the expected service level with these zoning practice using a simulation.
Note that the clustering approaches applied to UAV routing problems for package delivery services can also be seen as a special case of the zoning approach for tactical decision-making. In particular, clustering has been actively applied to truck-assisted UAV package delivery services, where a truck visits multiple spots following a path to support UAVs’ operations (e.g., recharging and (un)loading payloads). Under this service delivery scheme, delivery points are grouped into a set of clusters, and a route for a truck to visit the clusters and routes for UAVs within the clusters are derived to maximize the service delivery performance [
29,
30,
31].
As reviewed, the concept of zoning has been addressed from different perspectives in the literature. In general, the zoning approach is designed to optimize the UAV performance for a single service instance (tactical/operational) under the area coverage class, whereas the zoning approach is applied to design a UAV traffic management system for multiple service instances (strategic) under the package delivery class. The zoning approach for the package delivery class is further separated by the restriction level on a zone. Sung and Nielsen [
18] apply the most restricted practice, which allows only a single UAV to fly within a zone at a given time, whereas the other studies separate airspace by altitudes and allow multiple UAV operations in a zone.
Our study is aligned with the work of Sung and Nielsen [
18]. It is difficult to assume a full connectivity between UAVs during their operations and 100% reliable UAV control logic mainly due to the dynamics in the airspace and the absence of a decent UTM. Considering this fact, operating UAVs with zoning, as proposed by Sung and Nielsen [
18], seems more appropriate for safety and service reliability reasons and can increase the feasibility of large-scale UAV deployment.
Based on the review, the contributions of our study can be noted as follows. We first describe a systemic and strategic solution for application of UAVs to package delivery scenarios, which allows UAV deployment at a large scale and reduces reliance on dramatic advances in UAV navigation and control technology. Next, in contrast to the work of Sung and Nielsen [
18], we apply clustering techniques for zoning to address multiple UAV stations in a service area, which can naturally be seen in a large-scale service scenario. Last, we test the performance of the zoning approach under different demand distribution configurations to clearly illuminate the expected benefits of the proposed zoning approach.
4. Experimental Results
Following the aim of this study (i.e., to demonstrate the performance of the zoning approach), we simulate UAV trajectories for package delivery scenarios and measure how close to each other UAVs are supposed to fly based on the trajectories. We also evaluate the service quality level for customers based on the simulated trajectories to evaluate the service quality degradation by zoning approach.
4.1. Experimental Setting
We generate four problem classes, varying the settings of the following two design factors: a geographical distribution of demands and a representative package delivery scenario.
For the geographical distribution of demands, we first create demand set
U, where 100 demand nodes are uniformly distributed over a square-shaped 2D area. To see the impact of densely located demand nodes on the performance of the zoning approach, we also create demand set
C, where demands are primarily located in the center of a service area. This demand set is created by sampling 100 demand nodes from the
york dataset available from the r-package
maxcovr.
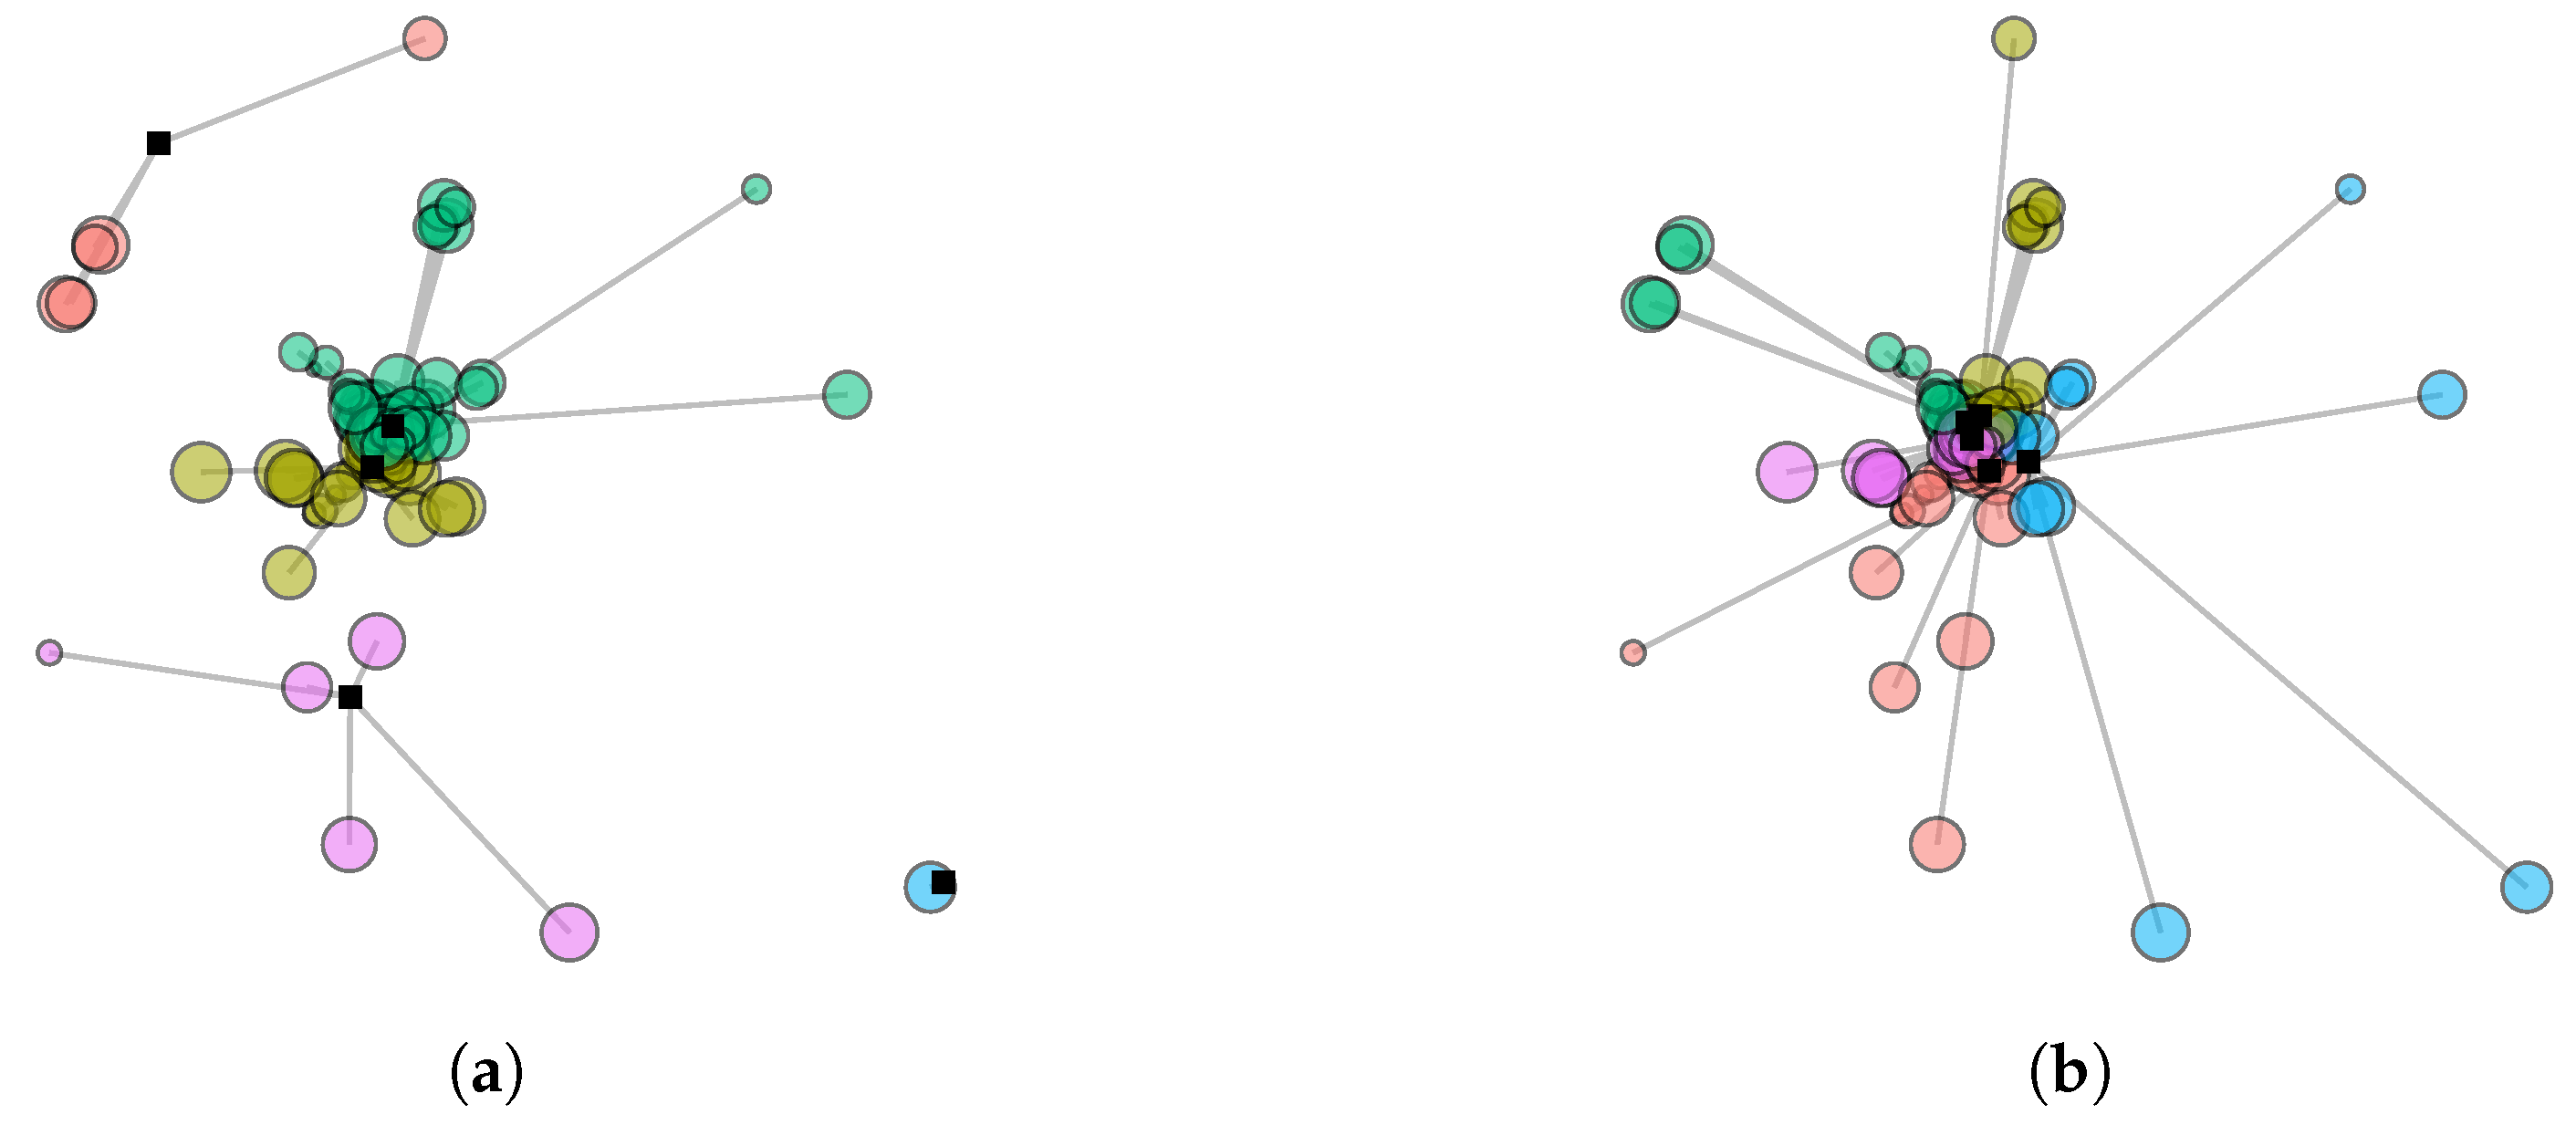
Figure 2 shows the two different demand node distributions.
Next, we apply two different service modes to test the zoning approach under different service scenarios. For scenario NQ (no queue), we assume a situation where a service request, which cannot be served immediately by a responsible UAV, will leave the system without receiving service. This scenario represents an emergency situation, where a timely response to a demand is critical (e.g., visual surveillance of a traffic accident). For scenario FCFS, we assume a situation where demands wait until they receive service by UAVs. In this scenario, demands in a queue are handled by the first come first serve (FCFS) policy. This scenario is implemented to represent a commercial package delivery scenario.
Following the setting, we generate the four different problem classes () and test the performance of the zoning approach in a simulation environment. Note that the objective function of the zoning problem, that is, to minimize the within-zone variances, is a proxy for the actual UAV safety level. Therefore, a simulation model is implemented to investigate the performance of the proposed zoning approach close to its actual performance. In principle, the zoning approach can be applied to a UAV-based service system with any type of UAV. Since we examine the systemic performance of the zoning approach, the detailed dynamics of UAVs (e.g., the minimum turning radius of a unit, energy consumption as a function of weather conditions, and collision avoidance logic during operation) are simplified in the simulation. The simulation model generates demands following the demand rates of demand nodes and assigns available UAVs by the applied UAV deployment strategy, updating the operational status (busy/idle) of the UAVs.
For each problem class, we replicate a simulation run 20 times. The length of the simulation is four hours, and the status of UAVs and demands are updated every second in a simulation run. In the simulation, the demand rate of a demand node (the number of demand requests per minute) is drawn from a uniform distribution with the bounds . The number of UAVs is set by ten to provide a sufficient service capacity for the demands.
The output of a simulation run is the UAV flight trajectories for all time steps (every second), including the positions of UAVs and their status, and the records regarding how demands are served. Based on the output, the separation level between UAVs is analyzed to see how much the safety can be improved by the zoning approach, which is the main topic of this study (
Section 4.2). The service quality with regard to the demands is also analyzed to evaluate the performance of the zoning approach from the customers’ perspective (
Section 4.3).
4.2. UAV Safety Improvement by the Zoning Approach
Given the UAV flight trajectories obtained from simulation runs, we compute the distances between two operating UAVs at each time stamp to measure the proximity between UAVs. Given that a key performance measurement from the safety perspective would be the separation level between UAV flights, we compute the 5th percentile of the proximity between UAVs (i.e., the distance between two flying UAVs) to identify the minimum distance gap guaranteed for the majority of the UAV flights.
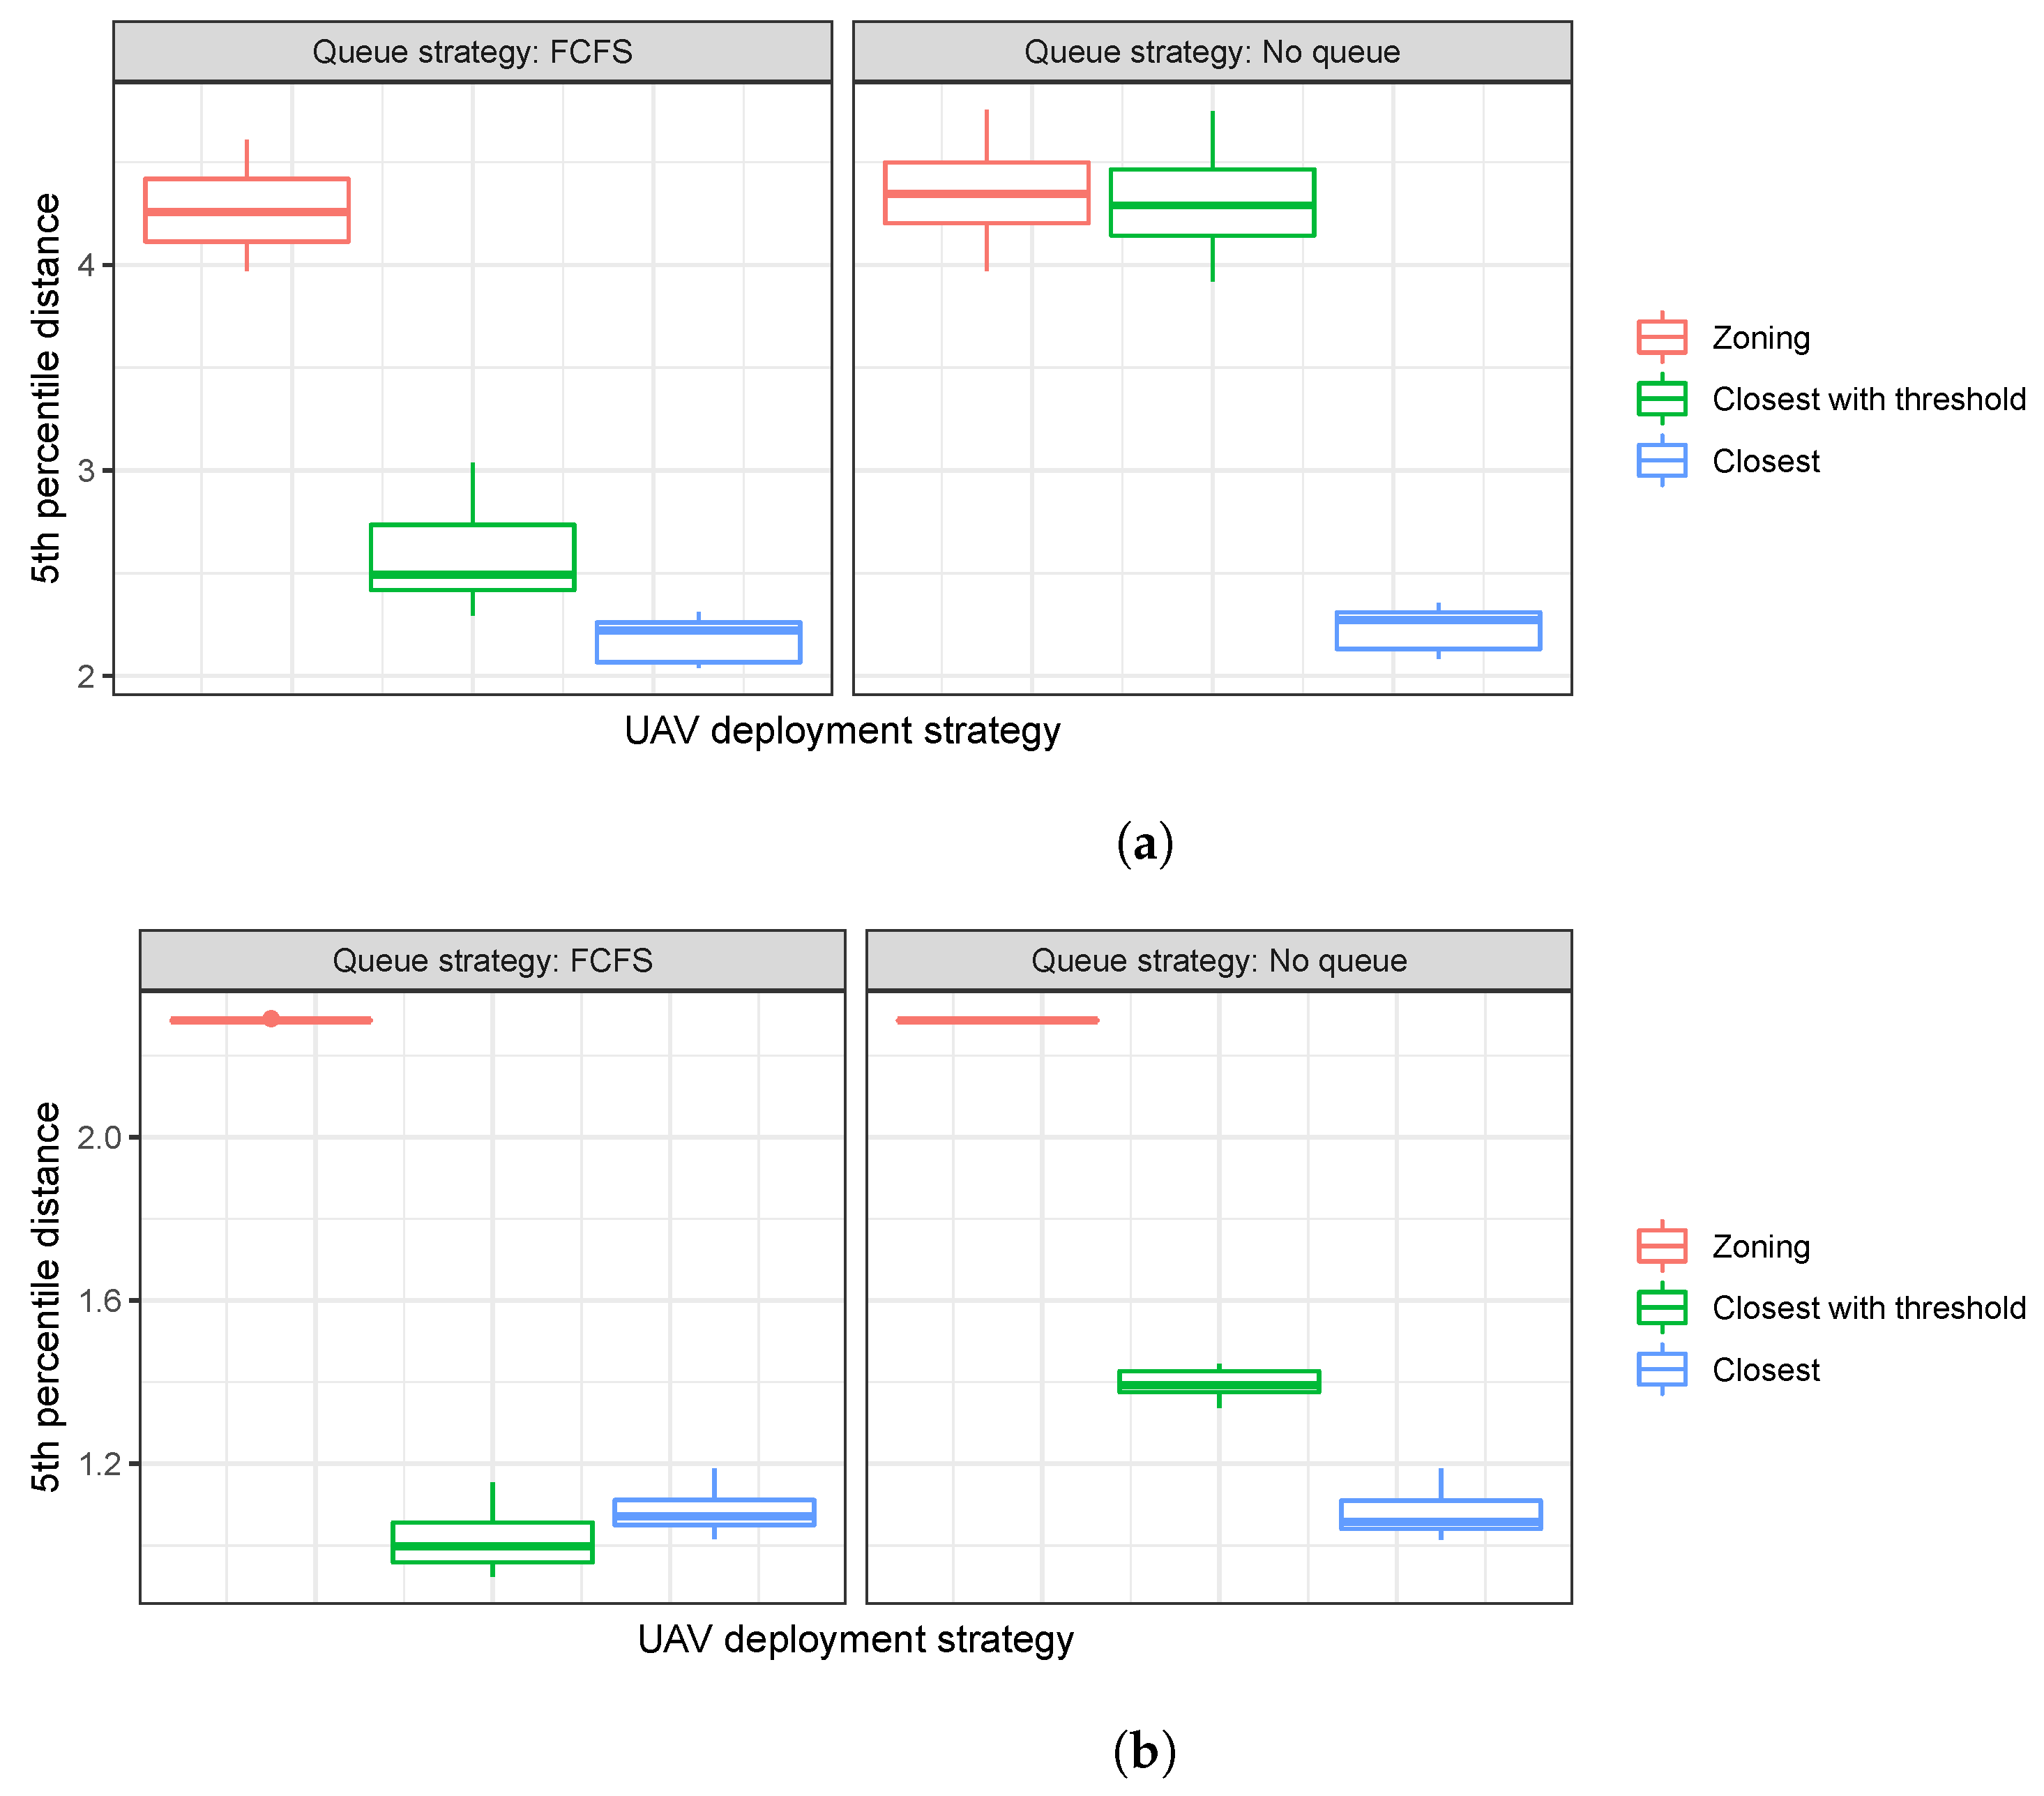
Figure 3 shows the distribution of the 5th percentile proximity values for 20 simulation runs under the four different problem classes and the three different UAV deployment strategies (zoning vs. closest vs. closest with thresholds).
From the figure, it is observed that for all the problem classes, the zoning approach shows greater distance gaps than the other considered strategies. While the distance gap increases when the demand distribution
C is applied (which seems inevitable due to the density of the demand nodes in the dataset), the zoning approach can still provide greater distance gaps between UAVs than the other strategies. Given that collision avoidance action is taken when a UAV detects an object within a certain range, a greater distance between UAVs clearly indicates that UAVs are likely to be cleared with less efforts for collision avoidance from both UAV operators and UTMs. The safety improvement by the zoning approach becomes clearer in
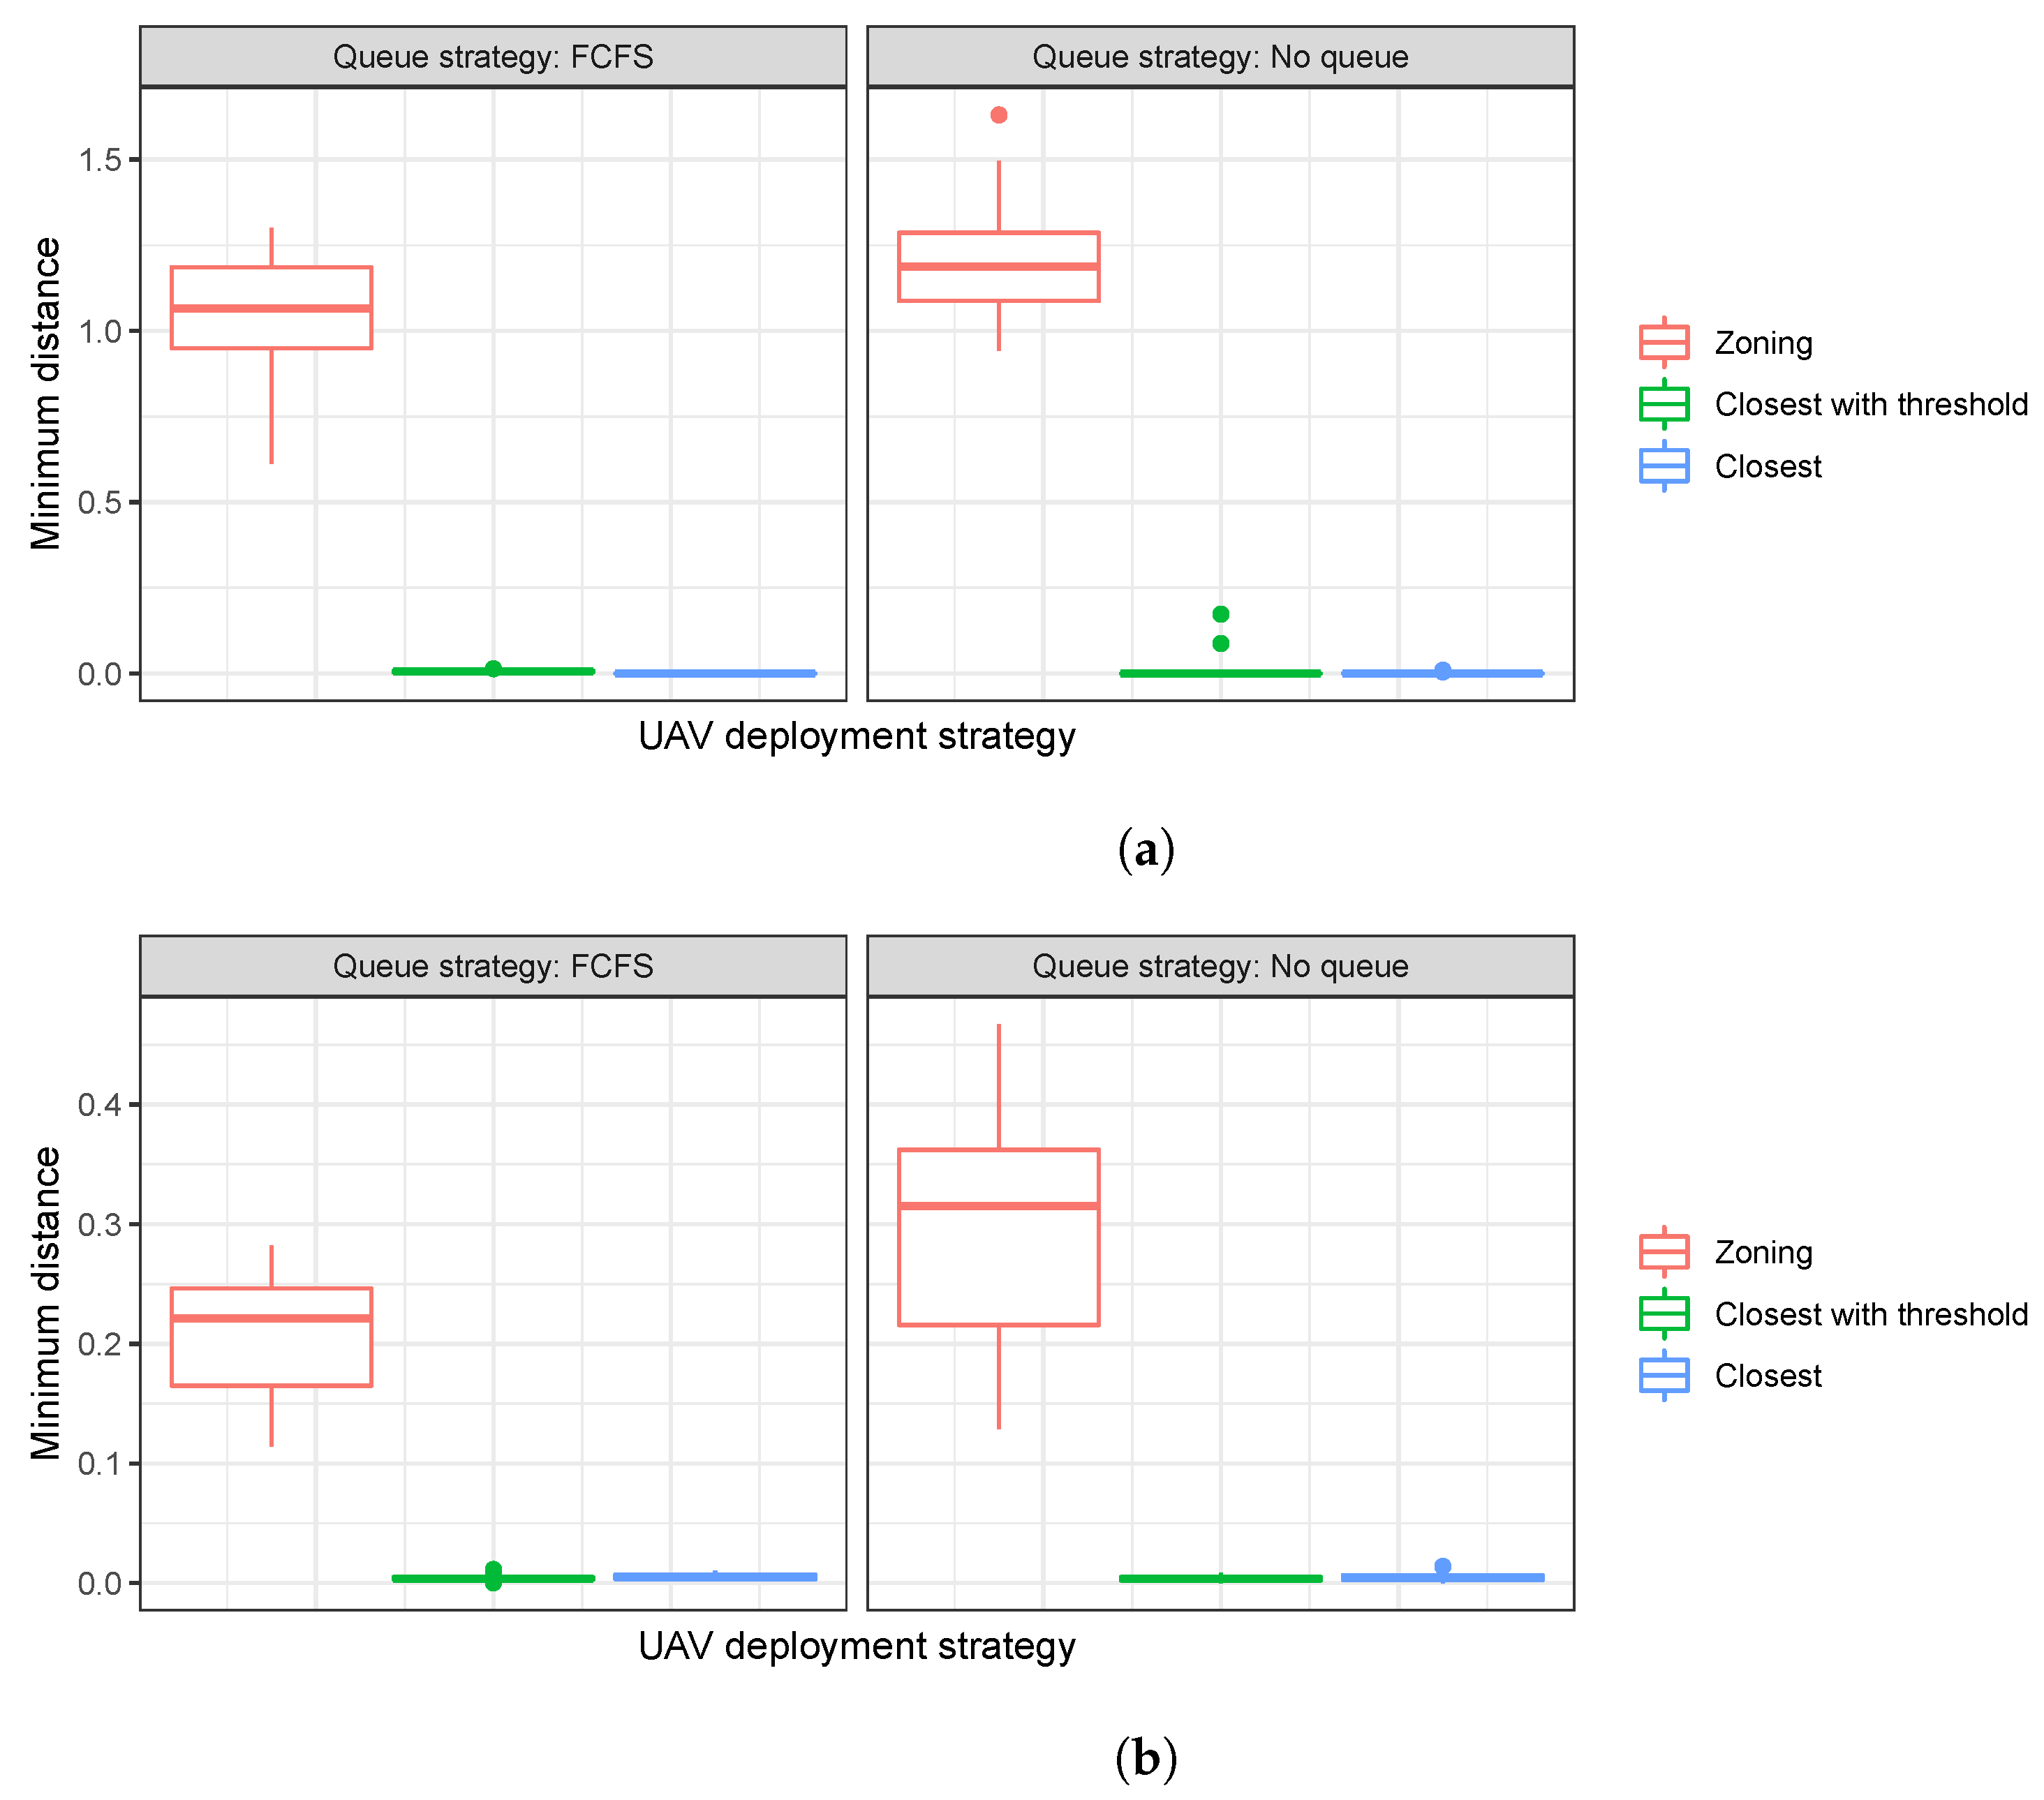
Figure 4, where distributions of the closest distance between two operating UAVs from the experiments are presented.
Figure 4 shows that the zoning approach always guarantees positive distance gaps between UAVs, which reduces the relevant collision avoidance efforts. On the other hand, the benchmark service strategies incur very close and even crossing UAV flights (i.e., zero distance gap). Recall that under the zoning approach, a flight path is generated within a zone, and thus it does not overlap with other paths in other zones. As collision avoidance is complex and might be infeasible when the distance between UAVs is tight, the safety net provided by the zoning approach is promising. In other words, the zoning approach can guarantee the safety of UAVs and the reliability of the UAV-based system, especially when large-scale UAV operations are considered.
4.3. Expected Service Quality to Demands by the Zoning Approach
The service quality for customers regarding UAV operations is another key factor that determines the success of a UAV-based service system. Given that immediate responses to demands determine service quality in many contexts, for emergency response in particular, we measure UAV response time to demands (i.e., the time interval between a service request receipt and a UAV arrival at the corresponding location).
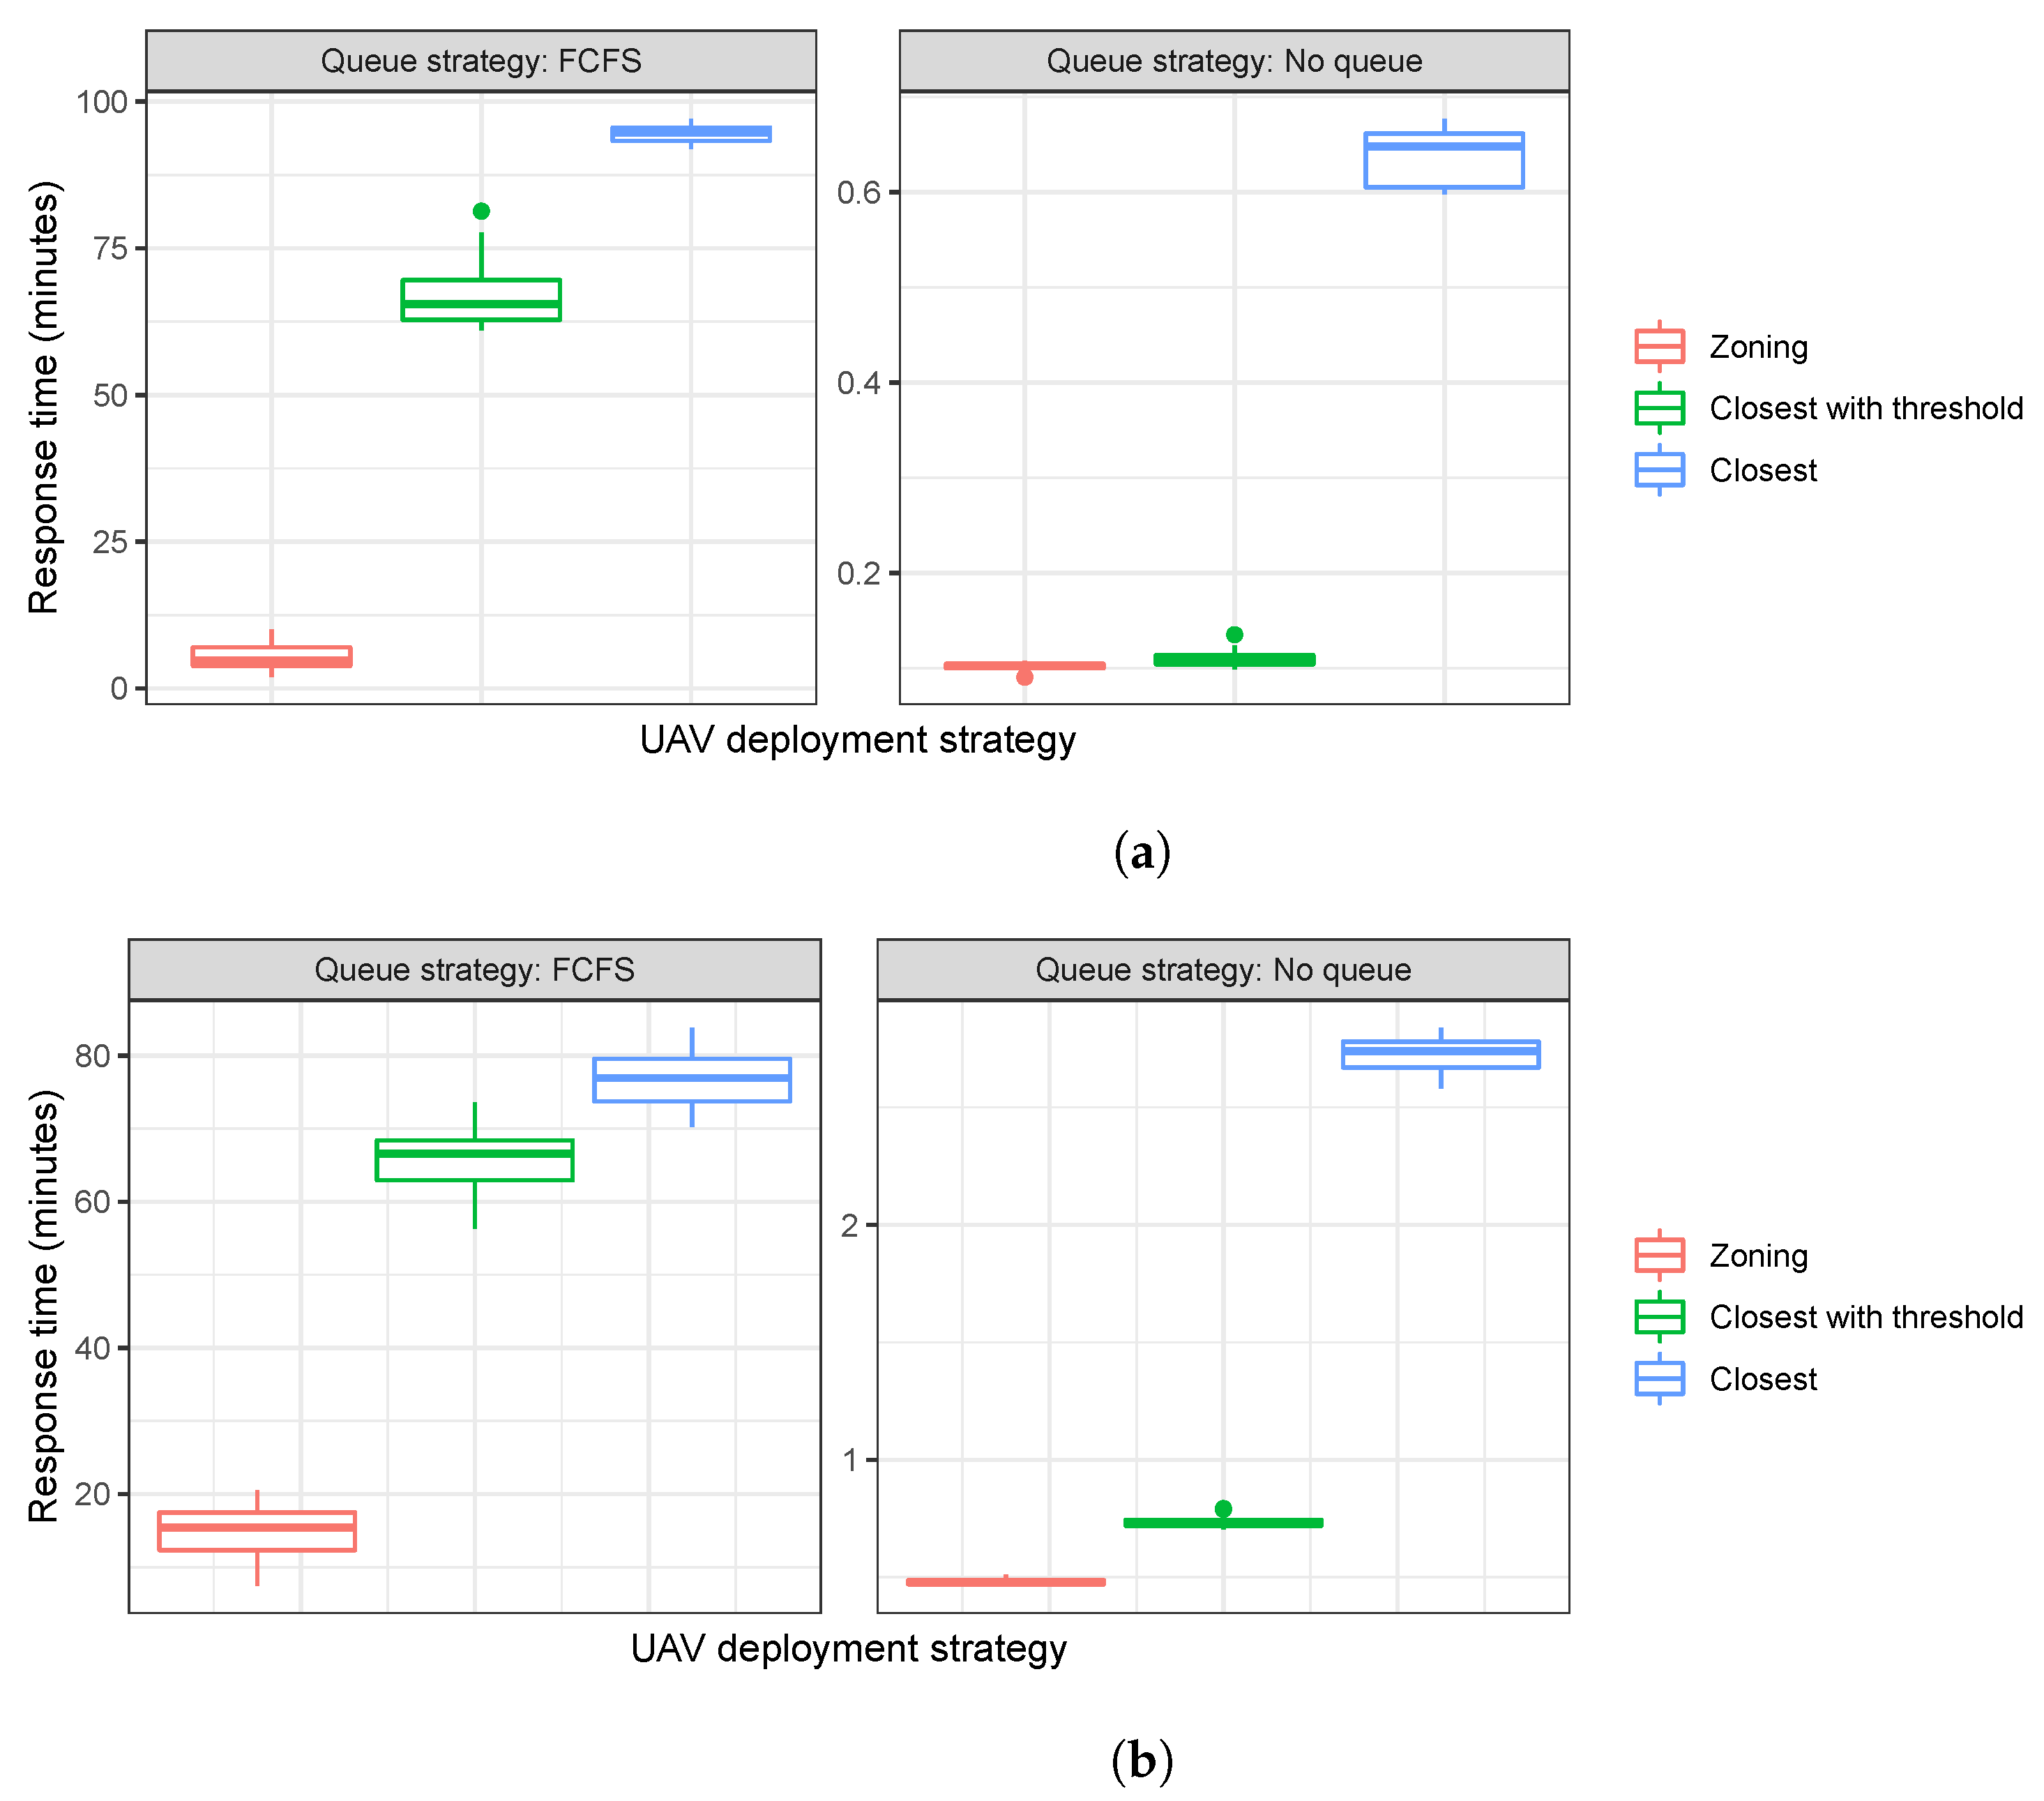
Figure 5 shows distributions of the mean response time over 20 simulations under the different problem classes and UAV deployment strategies.
The results shows that the zoning approach outperforms the other considered service strategies in terms of the mean response time for customers. This is because the benchmark strategies allow UAVs to serve distant demands, whereas the zoning approach restricts such behavior by limiting the UAV operation area. Naturally, long-distance travel increases the individual UAV workload and the likelihood of being busy. Under the scenario FCFS, where there is a waiting queue, such a practice significantly increases the response time for customers (see the response time differences between the FCFS and NQ scenarios).
It should be noted that while the zoning approach can avoid such long-distance and inefficient travels, it is true that a demand generated when the responsible UAV is busy will not be served under the zoning approach, even if there could be other UAVs available nearby. When there is no waiting queue, such a practice might result in many demand nodes being abandoned.
To verify this issue, we compute the percentage of demands that left the system without receiving service, with regard to the total number of demands generated in a simulation run.
Figure 6 shows the results for scenario
NQ. As shown in the figure, this negative impact by the zoning approach seems marginal, and interestingly, the zoning approach even serves more demands than the other strategies. This is due to the efficient use of UAVs and corresponding low utilization levels of the units.
4.4. Summary
For all the problem classes, the zoning approach outperforms the other considered UAV deployment strategies in terms of the safety of UAVs and the service quality for demands. The zoning approach shows that it can guarantee a sufficient gap between operating UAVs and that it can serve more demands at a faster rate than the other benchmark strategies. All of these findings are critical to implement a UTM with distributed workloads for collision avoidance and to provide acceptable service quality to customers.
6. Concluding Remarks
Considering that the zoning approach is initially proposed to guarantee the safety of UAVs during operations, the relevant service quality degradation for customers is expected due to the restricted movement of UAVs by the zoning approach. Unlike this concern, however, the zoning approach shows a dominant performance in our experiments compared to the other current UAV deployment strategies in terms of both the safety of UAVs and the service quality for customers. This is accordance with Sung and Nielsen [
18]’s observation, where they examine the zoning approach with a single UAV station.
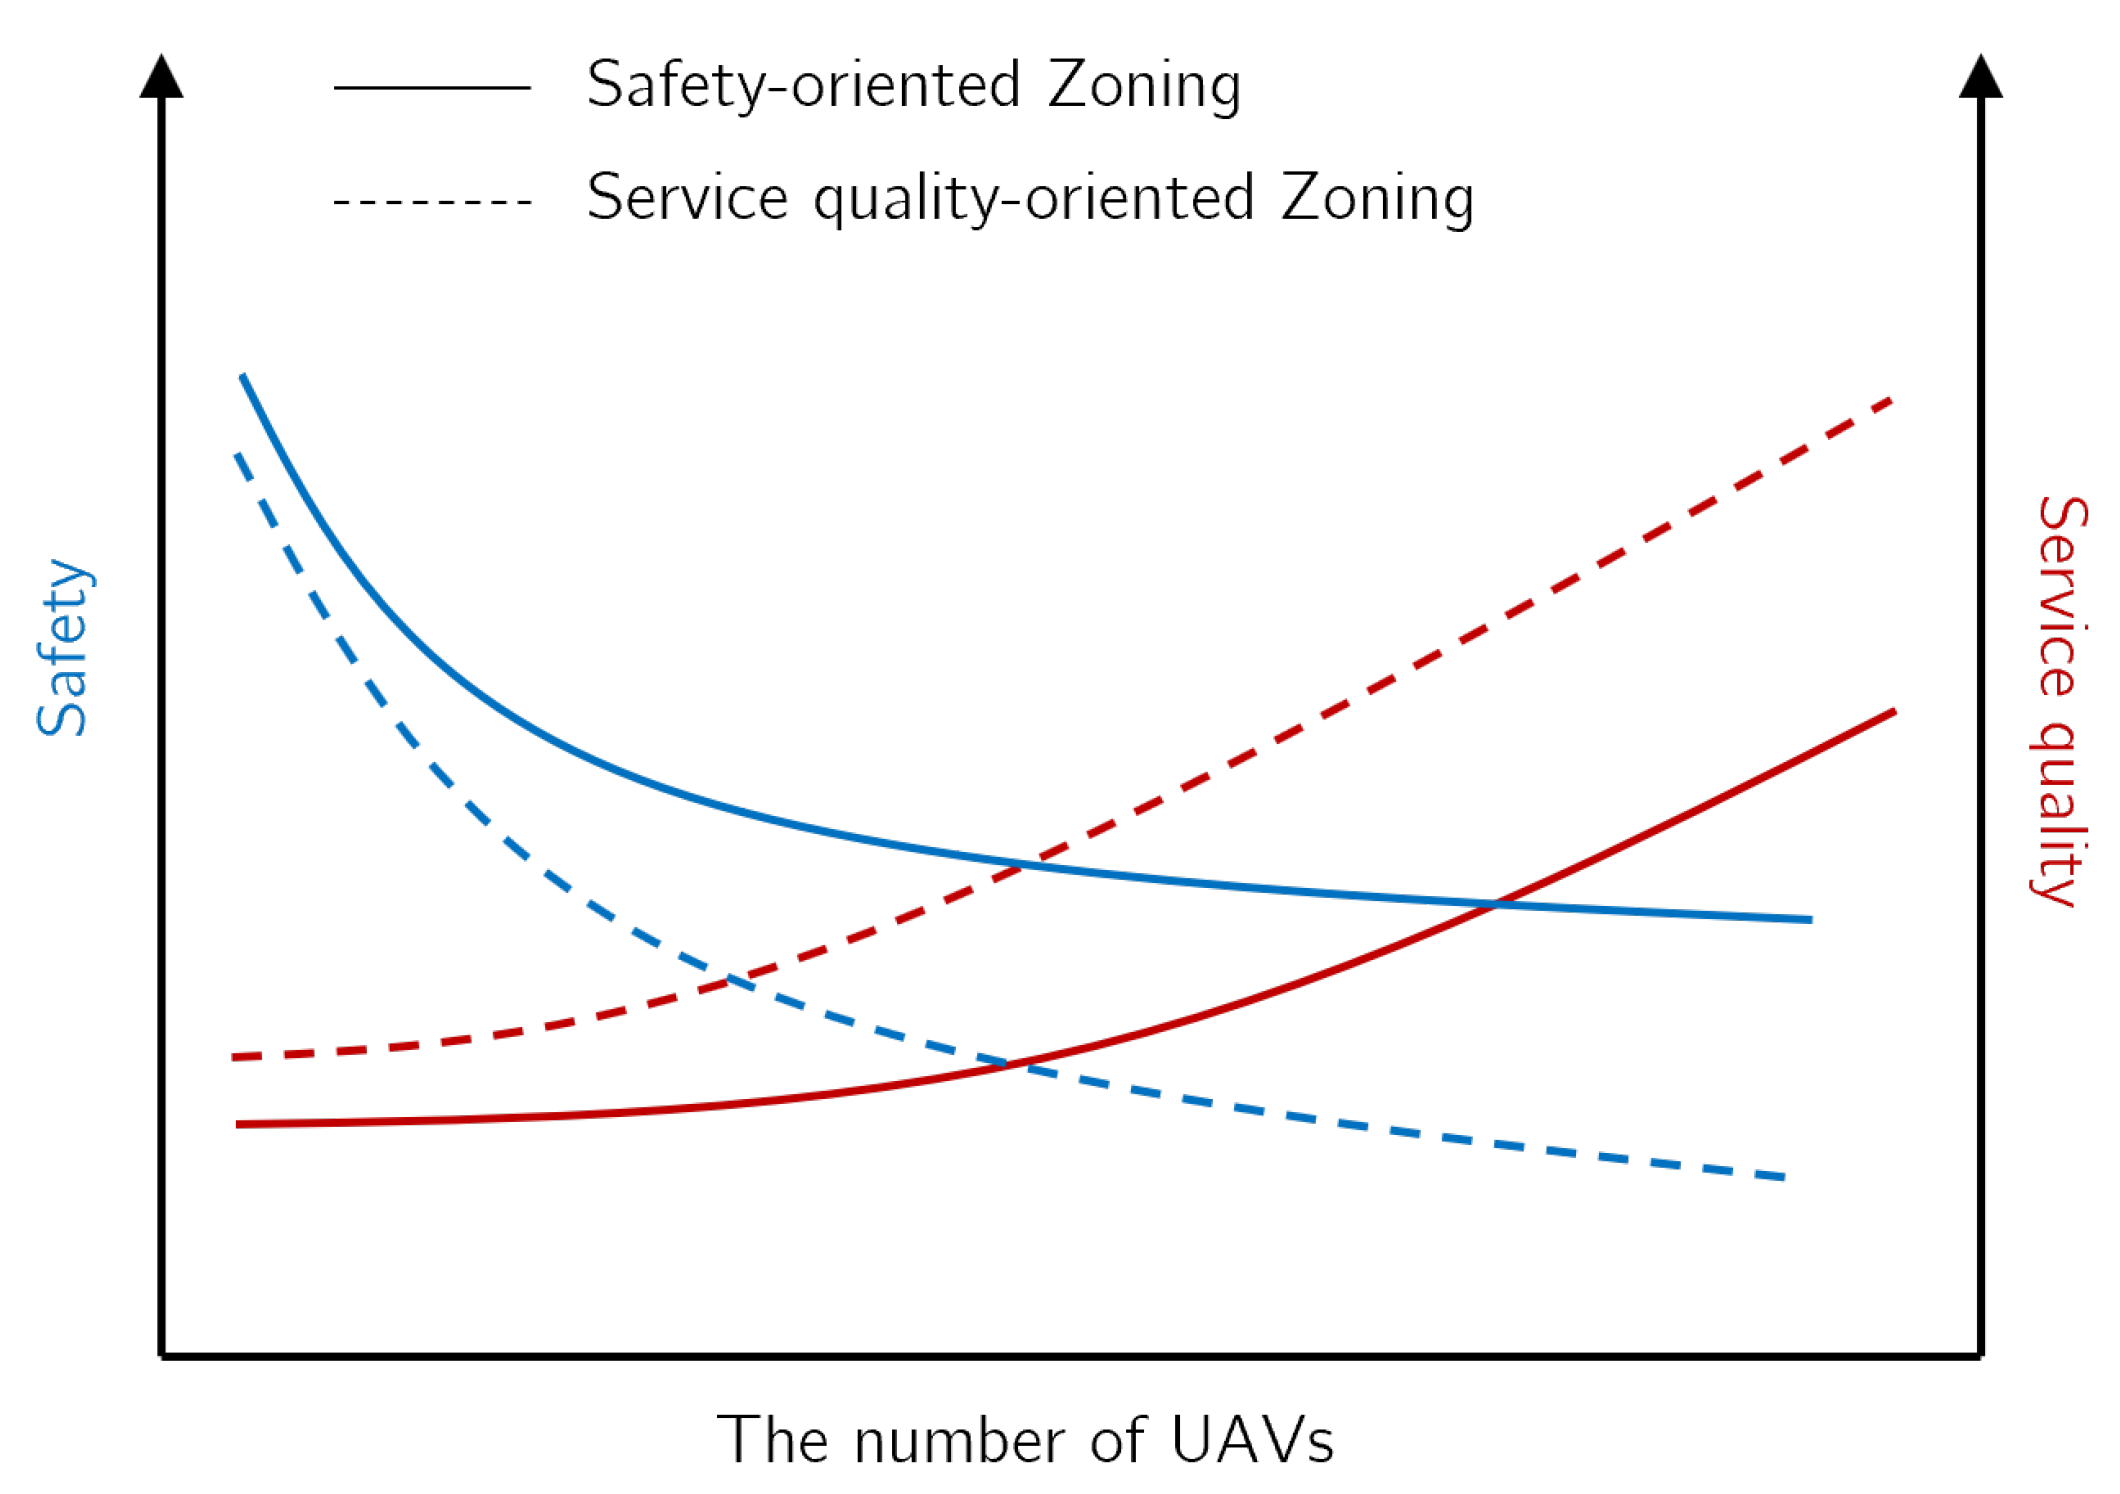
We also observed the trade-off between the performance criteria (safety vs. service quality) in the experiments, a natural phenomena of UAV-based service systems. To meet a desired service level of a UAV-based system while addressing this trade-off, further assistance from the tactical part of the UAV operation (e.g., UAV trajectory planning optimization) and a well-tuned zoning solution algorithm based on the system’s priorities are essential for successful implementation of the zoning approach for a UAV-based service system.
Finally, let us highlight that the proposed zoning approach is a systemic solution for a UAV-based service system, which includes a tactical and operational solution for UAV deployment. The proposed approach does not require significant investments for a UTM, nor dramatic advances in UAV navigation and control technologies. Therefore, based on the demonstrated performance of the zoning approach and its implementation simplicity for a UAV-based service system, we believe that the zoning approach is a breakthrough for currently limited UAV applications and their deployment at large scale.


