Abstract
The task of increasing the accuracy and stabilization of the flight of unmanned aerial vehicles (UAV) in the alpine environment is a complex problem. It is related to the evaluation of UAV flight parameters and control conditions for the operator’s place. The purpose of the UAV’s autonomous flight control is to ensure stable control of the UAV’s flight parameters. Flight control systems are affected by various disturbances caused by both internal and external conditions. In general, the number of autonomous control systems corresponds to the number of degrees of freedom, which determines the flight of an autonomous vehicle. An important factor in assessing the quality of such a UAV is its readiness for an autonomous flight together with the level of its safe guidance on the route. The presented article focuses on the analysis of UAV flight control and the quality of prediction and elimination of errors that exist during maneuvers toward the place of a successful UAV landing. The aim of the article is to point out the solvability of the complexities of such a flight procedure with the evaluation of the readiness for the descent phase of the autonomous UAV. The given problem is caused by the social demand for the creation of a way of providing health care in the mountain area of the High Tatras in Slovakia. The existing database of data obtained from the flying vehicles used in Slovakia was compared with the data obtained from the simulated flights, with their subsequent evaluation in the MATLAB software (Version R2021b) environment.
1. Introduction
The pandemic situation, which has affected almost every socio-economic sector in almost every country in recent months, has forced the population to change most of their habits. Formerly exotic tourism has been replaced by local measures, usually in outdoor activities [1,2]. The Slovak Republic, which is very mountainous, was no exception. Mountains are a very attractive location for both experienced and less experienced tourists for hikes. The most popular locality in Slovakia—the High Tatras, in case of distress situations (of injuries or health problems of tourists), is very difficult to reach for paramedics [3,4]. For this reason, the services of the helicopter rescue and search service are widely used. HEMS operations, aimed at saving human life, are based on increasing the number and continuous renewal of rescue helicopters [3,4,5,6,7]. This represents an increase in the financial burden on their operators. The efficiency of helicopters, which is reflected in the final cost of operation, can be improved by using UAVs for certain rescue operations, as these UAVs can cover some life-saving medical procedures [6,7]. Today, we are in the phase of the initial experimental deployments of such search and rescue equipment. This is creating the way to emerge a new air rescue industry—the Autonomous Rescue UAV [8].
The aim of this method of informative and primary medical rescue is to introduce a new style of operational assistance in life-saving interventions in cooperation with UAVs and ground rescue services. In these interventions, autonomous resources are usually controlled remotely by operators. As those UAVs will perform EMS (emergency medical service), conventional types of drones (quadcopters or hexacopters, which are available in various designs and price ranges) cannot be used. For such missions, a complex autonomous UAV with an additional payload must be used [8,9,10,11,12,13,14].
The price relation of such UAVs is in the hundreds of thousands of euros; therefore, it is necessary to create a sufficiently convincing and reliable method for statistical evaluation of flights of such UAVs in the local area. Only in this way can it persuade helicopter rescue operators to invest considerable money in innovating conventional methods of air intervention [6,7].
The flight of the helicopter itself in the mountain massif is accompanied by many specifics. These include the windward effects, dew point, precipitation, turbulence, and many other environmental impacts that adversely affect the flight mission [14]. The aim of this paper is not to analyze all these factors. However, it focuses on a model situation, where GNSS information is lost during the flight of a UAV vehicle on the desired path to the area of interest [15]. The UAV can perform some simple functions, such as delivering drugs (for example, a person forgets them at home—cardiovascular drugs or insulin), or it can determine the “status” of a person (alive/dead). In such “non-life threatening” cases, the take-off, rescue mission itself, and arrival of the helicopter and its crew back at the airbase is uneconomical (component life cycles, flight hours, time the rescue team was given to intervene, extension of convalescence and deployment options, etc.) and also non-ecological [3,4,5,6,7,8].
In addition to environmental problems, the operation of flights in a mountain environment also encounters a problem in the area of legislation—focusing on the protection of fauna and flora but especially on the safety of flight control in a specific environment. That opens up several possibilities for a scientific approach to the solution of mountain autonomous rescue of persons supported by the UAV flight control legislation [16,17].
Flight experiments in such a specific mountain area can be considered complex. The interest of experts who combine the actual state of flight with theoretical assumptions and practical implementation is growing [18,19,20,21]. Research to date on UAV management and air transport organization shows that there are inconsistencies among the following:
- Increased volume of tasks for drones, solved in the interest of the national economy and an insufficient regulatory framework for their use;
- The level of potential long-range UAVs and a ban on their use in the common airspace requirements to maintain the parity of the level of UAV development in technologically advanced countries, and the current state of development in civil aviation;
- Insufficient systemic legislation aimed at creating legislation rules for the use of UAVs and requirements for its creation [16,17].
The model situation used in the article takes into account the loss of the GNSS signal and points to a possible way of solving the automated guidance of the unmanned vehicle along the route line (with the deviation +c/−c representing a safe corridor). The Slovak High Tatras–The Little Cold Valley were chosen as the solution area. In the present case, attention is focused on the events associated with the management of the monitored unmanned vehicle under the influence of random (experimentally determined) influences that affect the dynamics of the control chain operator–UAV–environment. Achieving successful rescue interventions using UAV in a mountain environment is conditioned by the reliability of telemetry control in the selected local environment (Figure 1; route: 2–3), mountain massif, to a point situated in the n-space, which is different in height [22,23].
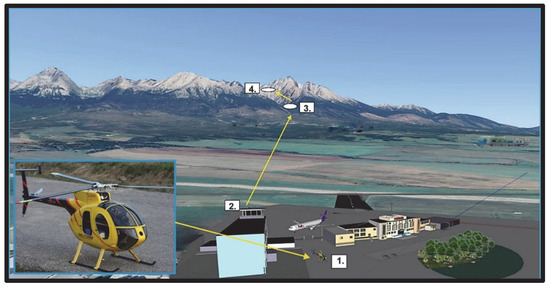
Figure 1.
Description of the model situation in the selected terrain area, Poprad Airport and the High Tatras landing point (3D visualization of the environment). Legend: 1. UAV and navigation data settings; 2. UAV control and management workplace; 3. Controlled UAV flight path; 4. ASS (Area of Successful Solution).
The chosen statistical methods—mathematical hope (known as the mean value) and statistical dispersion, the use of which will be presented in more detail in the second section—were selected based on their widespread use and accuracy, which are advantageous to us. In a figurative sense, we can understand mathematical hope as our chosen ideal route (ideal/planned route line) and dispersion as a variance that allows movement in a given flight corridor. In our case, it is ideally in the range +c/−c, i.e., ±2 m [24,25,26,27].
The evaluation of experimental flights’ success was carried out using known statistical methods—normal distribution and a histogram to determine the probability of deviation from the selected route [24,25,26,27].
The time period in which we assessed the flight mission as successfully completed was set at 30 min (considering external factors that directly affect the UAV’s flight—these are often adverse weather conditions). This was because the life-saving action provided within this time limit represents a high success rate. In the case of a mountain area, this is incomparably shorter than the time needed to send a helicopter rescue service or a ground rescue unit [3,4,5].
2. UAV’s Simulated Tasks in the Mountain Environment
The social requirement, presented in the introduction, was behind the emergence of a model situation, the aim of which was to simulate a UAV flight in specific mountain terrain (The Little Cold Valley). In addition to the severe environmental impact, this area is also specific for the frequent loss of GNSS navigation information. As this is a national park, it is impossible to carry out the flights by real means due to the applicable legislative restrictions. Such experiments would also be enormously costly. Using flight simulations in a virtual environment, the authors try to convince the authorities that controlled flights of UAVs in such a protected environment do not pose a threat even if there is a loss of navigation information or commands from ground operator. For this reason, we decided to use our previously created simulation workplace, where experimental flights of the ideal UAV device were performed. The collected data from the number of virtual flights were subsequently analyzed and statistically evaluated. The result is a statistical method of evaluating the success of UAV flight in a modeled but still realistic environment.
The workplace (Figure 2) allows working with various models of UAV resources, which are characterized by transfer functions. Then, these resources are inserted into a virtual environment, the characteristics of which (weather conditions, air pressure, temperature, air mass movements, etc.) can be defined according to the requirements of the scenario. The scenario also takes into account the impact of accidental (internal and external) faults, such as sensor faults, hardware faults, navigation equipment failures, and flight control systems. The workplace can also be used to evaluate the readiness of the UAV operator to control such a device.
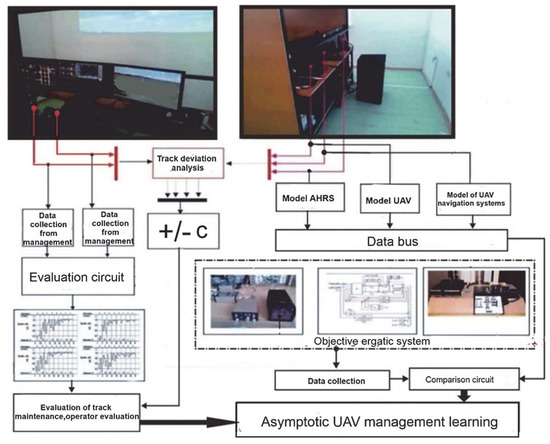
Figure 2.
Simulation and evaluation laboratory environment.
A series of UAV flights in a mountain environment (Figure 1) was simulated at this workplace according to the previously considered scenario (a flight lasting 30 min with a loss of GPS signal). Then, the collected data were evaluated using statistical methods in order to create a tool for objective evaluation of flight success in a mountain environment.
Kinematic Equations of Unmanned Vehicle Movement in the Mountain Environment of the High Tatras
The test flights (simulations) were performed according to the scenario illustrated in Figure 1. An operator-controlled flight in the first section (2–3) is followed by a section in which the loss of the GPS signal occurs (3). Then, the autonomous flight is performed as a programmed flight using instructions entered into a microcomputer unit located on a controlled UAV (4).
The second flight segment (Figure 3) of the UAV can be controlled by commands sent by the guidance station or performed autonomously. However, in the presented scenario, the loss of GPS signal will cause deviations from the ideal (planned) route line.
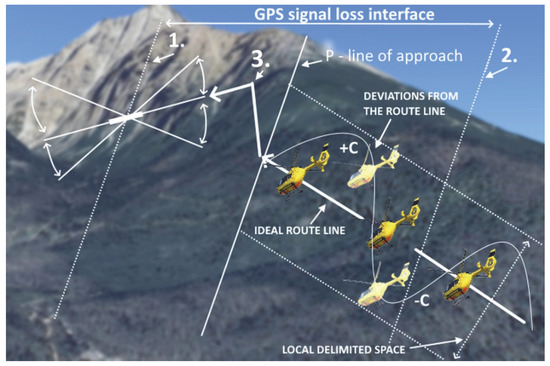
Figure 3.
The 3D visualization of the UAV line in the area of line P (final approach). Legend: (1) is the point where the loss of GPS connection ends; (2) is the point where the loss of GPS connection and other influences on UAV start to affect; (3) is the starting point of descent to ASS.
When the remote control system enters the guidance process, the controlled object is usually very far from the specified (calculated) route line. As a result, angular and line deviations (+c/−c) are usually so large that it takes a considerable amount of time to align with the calculated path (Figure 3).
It is possible to shorten this time using a time-optimal member. It is put into operation immediately after the end of the autonomous section of the air flight path control. After the time-optimal member is activated, it is achieved that the controlled UAV flies on the desired flight path in accordance with the commands sent by the guidance station. For some types of controlled objects, the transition to the self-guidance method is determined in the final phase of the flight. It is the self-implementation that will ensure the maximum approximation of the object to the target area of successful solution (ASS) [28,29].
To assume the loss of GPS and DGPS signal, it is necessary to guide the UAV to a precisely determined destination. For this purpose, the UAV will create a symbiotic line, which is crucial for the further signal processing method [15,30].
Absolute ASS coordinates are used, which are fixed. The coordinates of the controlled object are also used together with them. Kinematic equations are obtained by projecting the velocity vector “vc” of the controlled object in the direction of the distance vector “rc” (Figure 4—on the imaginary line from UAV to ASS). If the condition that we consider the ASS to be stationary at a given moment is met, they have the form:
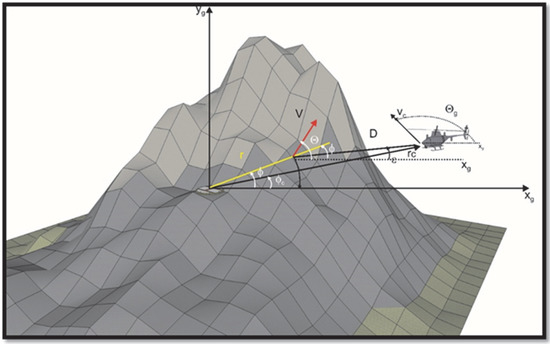
Figure 4.
Kinematic elements of remote control approach to the ASS as the final phase of UAV flight.
By deriving Equation (2) and including Equation (1) in the solution, a kinematic equation is obtained:
which binds the motion (of a controlled object) to its tangential and normal acceleration. Here, represents the total acceleration value of the controlled object UAV, which is projected on the line n of the vector r (Figure 4). Due to the acceleration j, a maneuver of the controlled object is performed, by which its angular position relative to the guidance station is adjusted [23]. These equations were inserted and used in the simulated scenario for obtaining flight data.
3. Unmanned Aerial Vehicle Readiness for Local Flight in a Mountain Environment
The complex structure of UAVs requires an overall reliability estimation to be performed before taking flight in difficult environmental conditions. Therefore, the first parameter examined was the monitoring of the success of the device’s flight under the control of an operator. We considered a successful flight to be a flight that took place in the specified flight corridor (+c/−c) and approached the ASS, regardless of the loss of GNSS information. An unsuccessful flight was one that did not approach the ASS or deviated excessively from the flight corridor. Based on the evaluation of successful and unsuccessful flights, we defined the UAV readiness coefficient for the flight (coefficient K).
The coefficient K can also be used to assess the readiness of other UAVs in other scenarios. For each take-off of an unmanned vehicle conducted along the route by telemetry control or autonomously, it is necessary to know the level of its readiness and landing options or short-term monitoring of the rescue area at the point of interest [30].
Assume that the readiness of our chosen pseudo-random UAV (with known parameters), with a defined number of avionics subsystems and the monitored navigation system (NS), is defined by the coefficient K(t) [13,18].
where
N(t), n(t) is the number of correct (successful) and the number of incorrect (unsuccessful) control interventions for the correction in the management and landing of the UAV on the specified route
N0 is the total number of test flights from point 3 to point 4 (Figure 5a).
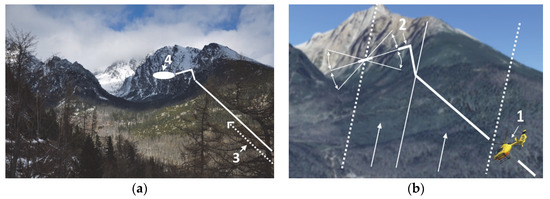
Figure 5.
Illustration of model situation: (a) The Little Cold Valley–High Tatras; (b) local 3D model of the selected research area.
The track/approach route we have chosen is located in the High Tatras (section (1–2) in Figure 5b). The transposition of exact points is transferred to the area of The Little Cold Valley (Figure 5a).
By analyzing the dynamics of the time change K(t) at the time t, there were in the total number of N0 test flights with NS usable for UAV N(t), where due to failures in the set time t + ∆t, the number of correct flights was:
where is the number of signal loss recovery (GPS) activities per time Δt and is the number of malfunctioning systems with a given UAV error. If, in moving in the previous relation (5) N(t) to the left and dividing both parts of it by , we obtain [15,20]:
With limiting of validity, we obtain the differential equation [31]:
In the right part, the first term is multiplied by the value n(t) and the second is multiplied by the value N(t):
where is the probability of incorrect operator reaction (condition) or failure of the UAV system to return on the track, is deriving the gain of systems and their functions according to (8), is the intensity of restoration of the function of the given avionic system UAV n-times attempted by simulation, and is the instantaneous value of failure intensity during experimental flights.
After introducing the appropriate designations in (8), a differential equation is obtained [31,32]:
When the probability of an incorrect operator response to a UAV control change command q (t) and to a UAV response is expressed by a readiness coefficient, when applicable:
q = 1 − K(t)
Then, Equation (9) can be expressed in the form:
Each flight experiment (simulation) was performed with a minimum number of “failures”—from external or internal influences. All these faults were generated in advance during simulation flights, so we consider that The intensity of the renewal is prescribed similarly:
Under the above assumptions, Equation (11) can be written in the form:
or in the following form:
For simplicity, the argument x is used to write the UAV readiness coefficient K(t). It follows that the differential Equation (7) will have a formal form, the form of which is even simplified if we determine:
So, Equation (11) will then be defined by notation:
The solution of the differential Equation (9) is:
where represents the integral constant of the descent control level, the value of which depends on the ambient conditions in the local airspace [14,20].
After adjusting the mathematical relation (16), we obtain:
from which:
Subsequently, a new designation is used for the integration constant:
Then, (18) will represent a mathematical relation:
Solving the differential Equation (11) by inserting (14) will lead to creation of equation:
The integration constant for an ideal UAV descent can be found using two conditions.
Let the experiment proceed as expected for t = 0, i.e., correctly. Then, according to (21), K(0) = 1.
Further:
Therefore:
If a malfunction is detected at time t = 0, i.e., the flight experiment did not meet expectations, then K = 0. Therefore, in the latter case, it applies:
The analysis of the UAV’s readiness coefficient for flight shows that the function is limited by time, i.e., the duration of the flight on the route. The nature of this relationship (operator fatigue, UAV operational wear, energy intensity, etc.) predetermines the need to determine the UAV flight limit. This statement can be graphically represented by the resulting course of the simulation with the monitored parameters [18].
Equations (20) and (21) determine the dynamics of the experiment readiness change at a time: t = 0, when the specified UAV readiness factor is set to return to the flight path, not to land, as in (16).
When —the prescribed possible state of fault conditions in the UAV (loss of GPS signal), —the experimental flight time (30 min).
Equations (22) and (21) are valid for the case where the UAV at time t = 0 is considered to be correctly or incorrectly controlled without failure. The instantaneous values of K(t) apply to the cases when µ = constant, i.e., it is a problem-free control.
The readiness of the UAV for the solved assigned flight task can be devalued by the time delay that the UAV operator will bring to the solution with his level of training (Figure 6). Variable time delays will affect proper function, especially in highly maneuverable UAVs. The delay has a character that can be described by the characteristics of the traffic delay or variable delay. The sequence of functions in the UAV operator skill learning technique is also taken into account, which can be considered as an important variable delay [28,33].
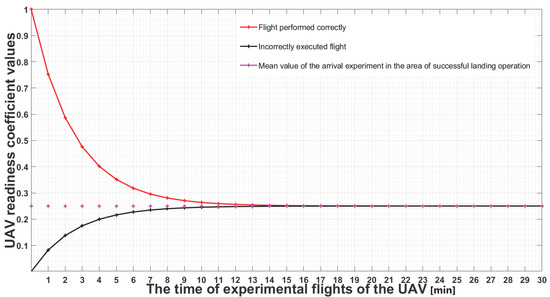
Figure 6.
Parameterization of UAV test flights with probability of readiness.
4. Statistic Evaluation of Deviation of the UAV from the Flight Trajectory
If in the simulated scenario, we consider that the sensors of the measured positional quantities represent a source of data that have a random manifestation and are also influenced by the turbulence of the atmosphere around the UAV. The physical manifestations of the deviations and the characteristics of the real properties of the UAV are replaced by a random signal generator with the following properties (Figure 2):
1. A UAV flight (altitude 100 m) takes place over specified points at a specific time with an error height ±H.
2. The flight through the specified points, located at the specified distances (Figure 3) from the starting point, must be realized at the time with a time variance .
The choice of one of the mentioned methods of programming the flight trajectory of the UAV allows characterizing the criterion of the accuracy of the descent of the UAV with a specified probability.
To illustrate the method used, the maintained flight altitude was determined: H = 100 m. In Equation (26), two moments are accepted—mathematical hope (mdH) and dispersion of the statistical distribution (σdH), representing an accurate estimate of the deviations to point 3 (Figure 3) [24,25,26,27].
Mathematic hope:
Deviation from descent line:
where is the value of the random variables observed in the i-th implementation and is the number of realizations.
Approximation of the statistical distribution was performed by the method of moments, according to which the parameters characterizing the theoretical distribution are calculated so that they are comparable with the normal probability distribution pdH.
The models subjected to the analysis are located at the instantaneous value of height H = 100 m.
In the syntax of the computational and simulation environment MATLAB–Simulink, it is possible to write:
n = (−100:10:0:10:100); where it is the number of simulated measurements during a UAV flight at an altitude of 100 m approaching the descent point (Figure 5a—point 3).
mdH = −1; (m), UAV deviation setpoint from the planned route line.
Process NK was used to measure UAV movement deviations within the mountain corridor of The Little Cold Valley (Figure 3) c = ± 0.2 km. Sensor errors were accepted during the measurement. The effects of the environment were ignored. The accuracy of the measured data was determined by the technological level of the systems [6,18]. Approximation of characteristics, their balancing was remitted by MATLAB methods.
sigmadH = 0.2; (km), as the standard deviation of the standard distribution from the selected line (−c; +c).
The last two data represent the statistics of individual measurements. The estimated length of the measured instantaneous height vector is written in syntax, which uses the computational and simulation environment MATLAB–Simulink:
deltah = (−8:0.5:0:0.5:6); (m), a linear deviation of 100 m from the route line to the approach point.
datah = normrnd (−1, 2, 100, 1); statistics of measured data of “UAV sensors” from the bus (Figure 2).
Distribution of the probability of deviation from the track to point 3 (Figure 3) at the specified height H = 100 m:
The graphical representation of the obtained data is created in the MATLAB programming environment (Figure 7, Figure 8 and Figure 9).
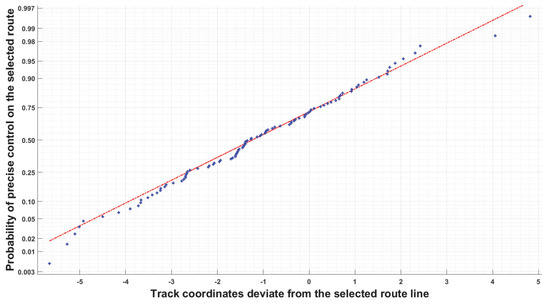
Figure 7.
Normal distribution of track deviation probabilities.
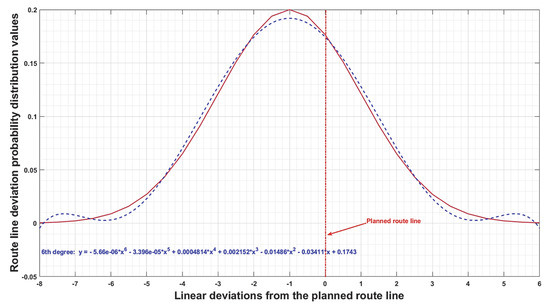
Figure 8.
Distribution of the probability of a linear deviation from the height of the descent line (0 indicates on track, negative values—deviation to the left from central axis, positive values—deviation to the right from central axis).
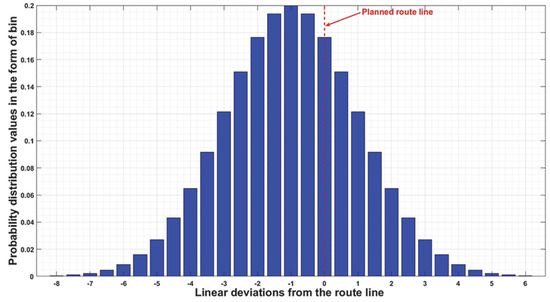
Figure 9.
Histogram of the distribution of probabilities of deviation from the height of approximation with ASS (area of successful solution).
The determined polynomial, which is expressed by the 6th degree, allows us to evaluate the accuracy of the UAV line guidance along the track. The data represent the statistics of individual measurements on the track to point 3 (Figure 5).
deltah = (−8:0.5:0:0.5:6); (m), is the linear deviation in height from the planned route line.
The distribution of the probability of deviation from the track at the point of height H = 100 m is also illustrated by the histogram (Figure 9).
The histogram shows the probability distribution of the deviation from the route line at the specified height H = 100 m (Figure 9). The highlighted red line of the planned route passes through the zero point—the center of the ideal normal distribution. In our case, negative values represent the probability of deviation from the ideal line to the left (in the direction of the observed flight), and positive numbers represent the probability of deviation to the right (in the direction of the observed flight) [6,18].
Accidental error compensation is performed by flight monitoring and justified intervention by the UAV operator and the monitoring member (Figure 2). According to the flight situation that occurred during the controlling of the UAV, as shown in Figure 10, the instantaneous value of the deviation from the route line at the monitored height (H = 100 m) is graphically expressed in Figure 10.

Figure 10.
Linear deviation from the selected route line.
In order to implement the guidance method, it was necessary to solve the gradients of the altitude, especially around the ideal route line (Figure 11, green course), to achieve the required values. In this case, the proportionality coefficient is a function expressing the flight path kinematics at the center of the route line. This function represents a line or approaches to the line.
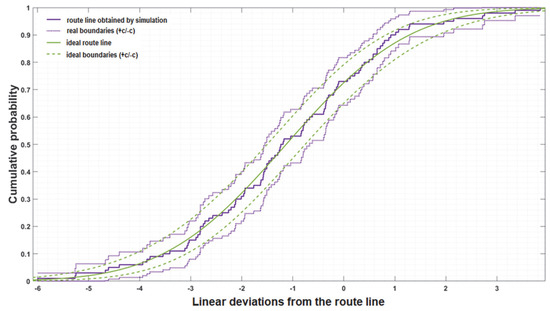
Figure 11.
Representation of the implemented route line and its corresponding corridor boundaries.
The main obstacle in implementing complex route line management laws is not the primary computational constraints but the increase in errors due to the number of systems used by UAVs.
The values in Figure 11 represent the accuracy characteristics of the UAV control system on the UAV route line in the lateral plane. This is for different values of the slope of the measured values, using autonomous systems. As can be seen from the calculated and graphically displayed characteristics, the UAV reaches the set limits with sufficient accuracy [34].
The outputs of the solution that are shown in Figure 11 indicate the expected alignment of the theoretical statistical distribution curves. This also confirms the hypothesis of a normal distribution of parameters at the selected height H = 100 m.
The aerometric data of sensors whose errors were analyzed separately are decisive for the successful solution (successful approach of UAV to ASS). Data (coordinates) about the landing or hovering point toward point 3 (Figure 5) were examined because we need to control the vertical speed and also lateral movement (Figure 9). The chosen approach methods accept the asymptotic learning of UAV control [18,29].
The aim of the used analysis method is to focus not only on the technical side of interacting avionic UAV systems but also on their mutual influence. In this context, the theoretical and practical use of statistical methods for UAV users in evaluating their flight is also pointed out.
Statistical criteria are based on the probabilistic principle of the manifestation of random variables, on which the accuracy of UAV systems depends, as well as the recoverability of its functions, especially in the border zones (lines) of the selected route line (+c/−c) (Figure 3), where a control correction is required. This means that when flying in a designated flight zone, the established criteria characterize the probability that the UAV will reach the approach point with possible errors. The significance of the stochastic method used also follows from this statement.
To calculate the position of the UAV in the area where the control signal does not penetrate (telemetry, GPS), this position will be estimated by calculation from the last connection to these systems using precision sensors carried by the object (vehicle).
The used navigation systems (NS) determine the selected navigation vector |N|, which is the integral resultant (sum of vectors) of the system functions [20,21]:
- Global Navigation Satellite System (GPS, GLONASS, Galileo, others);
- Aerometric system;
- Position coordinate measurement systems;
- On-board computers and correctors.
The quality of navigation information is determined by complex algorithms for processing output signals and their corrections.
Navigation system errors are usually:
(1) methodic—which are caused by imperfections in the used mathematical–physical models;
(2) constant—which will be reflected in the process of real calculation of the monitored section but have changed by moving to the next section;
(3) random—which are a timing function in the implementation of navigation information.
Focus requires attention to:
Lemma 1.
Errors are caused by the flat orthodromic coordinate system used in determining the local position of the UAV on the ground.
Lemma 2.
Errors are caused by course settings. In one embodiment, it may be characterized by a random variable, while it may be characterized by dispersions for a number of other embodiments.
Lemma 3.
Errors are caused by measuring the drift angle in a specific section where its calculation is performed and its stochastic character.
It follows from these claims that any system that measures the components of the vector |N| is a sensor that, by its errors, affects the accuracy of navigation. From this, the following can be concluded:
(a) It is desirable to correct (align) in the processing process the estimation of sensor errors that load their output. This type of error is common to the system and is therefore called “systemic”.
(b) Additional random errors, which are caused by the stochastic nature of the measurement process, are modulated on the system (systematic) navigation information in the calculation process.
Analysis of Random Error Dispersions during UAV Flight According to Correlation Functions
The character of vector error measurement |N| can be analyzed by random process theory, especially correlation theory. The most used is the exponential correlation function. Let us implement the following conventions when we cannot estimate the errors of the navigation sensor . Then, we describe the random error with an a priori correlation function:
where σ(x) is the error of the corresponding vector sensor |N|, a is the correlation constant and t2; t1 is a time period of measuring and processing time error information.
When the navigation sensor error of the vector |N| we estimate at time t and during the work of NS the error does not change, then the correlation function will be:
We call the correlation function (if the mean value of the random variable mx = x(t0) is valid) quasi-aposteriori with the abbreviation .
When the navigation sensor error x(t0) of the vector |N| we estimate at the time t0 and during the work of NS, it changes according to the law:
then the error correlation function is described by the a posteriori correlation function :
An estimate of the dispersion of the navigation vector |N| was obtained by calculation and simulation in the MATLAB software environment at the time when t = , where at = (a*t) is the product of the correlation constant and the processing time of the observation, which expresses the time required to calculate the navigation vector |N|.
Then, Equations (29)–(32) are in the form:
By comparing the obtained dispersions (Equations (35) and (37)) with the square of the deviation, we obtained:
The solutions are (arranged in order):
Let a, b, c represent errors (dispersions) caused by nominal random error processes from navigation systems. The common meaning of all errors is expressed by the symbol .
The result of the considerations are the expressions in the MATLAB program:
at = 0:0.2:3;
exp = 2.718;
ans1 = 1;
ans2 = 2 − 2./exp.^(at);
ans3 = 1 − 1./exp.^(2.*at).
By comparing the obtained dispersions with the deviation square, a graphical course of relative dispersions of three types of random error tracking processes from navigation systems was obtained.
Figure 12, as a result of our simulations, shows the relative dispersions of the three types of random processes in error detection of navigation systems. The above correlation functions were used in this process and the detected deviations were evaluated, while each of the deviations is presented in a separate course. Red course shows the solution of Equation (39)—solution a. Amber course shows the solution of Equation (40)—solution b, and purple course represents solution of Equation (41)—solution c.
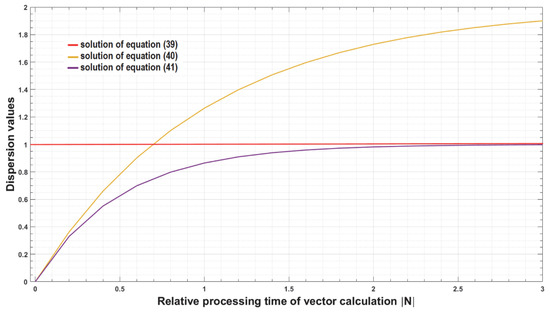
Figure 12.
Relative dispersions of three types of random error detection processes from navigation systems.
5. Conclusions
The search for an innovative solution for air rescue in a mountain environment has brought the initiative of helicopter rescue service operators to look for alternative ways of solving critical situations. While in a typical environment (urban area), it is possible to transport medical personnel and rescue equipment to the scene by conventional means of transport, in the mountain environment, we almost exclusively use helicopter transport or transfer by off-road vehicles, or even by feet. However, a helicopter flight is very expensive, while a pedestrian transfer considerably prolongs the rescue time. According to the latest research, the use of a partially autonomous device (UAV) could combine the benefits of a fast response and significantly lower the costs. This would reduce the number of unnecessary helicopter flights and, at the same time, reduce the time it takes for rescue equipment to be delivered to the emergency site. Such uses have been addressed in recent years by leading manufacturers and developers testing the possibility of using different UAVs for SAR purposes.
In the local area (Slovak Republic), the exclusive provider of helicopter rescue services is Air-Transport Europe, which has started to address the idea of using search and rescue UAVs as an additional service in rescue operations—especially in a specific alpine environment. Such UAVs could be used to deliver medicaments, defibrillators, or assess the potential emergency (health status of the injured person, number of involved people, location of distress situation). They can also be used to support a ground rescue unit in various matters.
The costs of developing and implementing such a UAV are not negligible. Therefore, the main aim of this article is to provide tools for the ATE’s final decision. The authors already created a series of articles dealing with the issue of successful management of the UAV in the defined corridor as well as its landing in the selected area of intervention (ASS). In the presented article, a reliable statistical method for evaluating the success of the flight in the defined corridor—the area of the High Tatras (The Little Cold Valley)—was designed and tested. For this purpose, a model situation was created, including a simulation of a problem with a local loss of GPS signal (Figure 3).
Methods of statistical variance (mathematical hope and dispersion of the statistical distribution) were used. For a better idea, mathematical hope ideologically illustrates the ideal route line that a UAV should take to its destination. Dispersion, i.e., the scatter around this route line, can be considered as a flight corridor—allowed in our case is the scatter 2 m on the left side and 2 m on the right side (Figure 7, Figure 8 and Figure 9 and Figure 11).
If the company decides on a specific UAV device (it is possible to create its simulation model through its transfer functions), a test facility (Figure 2) is prepared, where it is possible to simulate the flights of such a UAV in the selected environment. Environmental influences can be set in the simulation scenario. In addition, the data obtained in this way can be used to verify and evaluate the success of flights using the statistical tool presented in the article. Such a tool could also be used in the decision-making process within the selection of several available UAVs or to evaluate the skills of UAV operators.
Author Contributions
Conceptualization, P.K., M.Č. and N.G.; methodology, F.A., N.G. and P.K.; software, M.G. and N.G.; validation, F.A., P.K., M.Č., M.G. and N.G.; formal analysis, M.G. and N.G.; investigation, P.K., M.Č., N.G., M.G. and F.A.; resources, P.K. and M.Č.; data curation, M.Č., and N.G.; writing—original draft preparation, P.K., M.Č., N.G., F.A. and M.G.; writing—review and editing, P.K., M.Č., N.G., F.A. and M.G.; visualization, M.Č. and N.G.; supervision, F.A. and P.K.; project administration, P.K.; funding acquisition, P.K., M.G. and N.G. All authors have read and agreed to the published version of the manuscript.
Funding
The work of authors P.K., N.G. and M.G. was supported by the Scientific Grant Agency (VEGA) under the contract No. 1/0584/20.
Conflicts of Interest
The authors declare no conflict of interest.
References
- Claudio, M.; Koens, K. The paradox of tourism extremes. Excesses and restraints in times of COVID-19. Curr. Issues Tour. 2022, 25, 219–231. [Google Scholar] [CrossRef]
- Buckley, R.; Westaway, D. Women report that nature tourism provides recovery from psychological trauma. Tour. Recreat. Res. 2021, 46, 6. [Google Scholar] [CrossRef]
- Johnson, L. An introduction to mountain search and rescue. Emerg. Med. Clin. N. Am. 2004, 22, 511–524. [Google Scholar] [CrossRef] [PubMed]
- Pietsch, U.; Knapp, J.; Kreuzer, O.; Ney, L.; Strapazzon, G.; Lischke, V.; Albrecht, R.; Phillips, P.; Rauch, S. Advanced airway management in hoist and longline operations in mountain HEMS—considerations in austere environments: A narrative review This review is endorsed by the International Commission for Mountain Emergency Medicine (ICAR MEDCOM). Scand. J. Trauma. Resusc. Emerg. Med. 2018, 26, 23. [Google Scholar] [CrossRef]
- Taubenbock, S.; Lederer, W.; Kaufmann, M.; Kroesen, G. HEMS in Alpine Rescue for Pediatric Emergencies. Wilderness Environ. Med. 2016, 27, 409–414. [Google Scholar] [CrossRef]
- Tomazin, I.; Vegnuti, M.; Ellerton, J.; Reisten, O.; Sumann, G.; Kersnik, J. Factors impacting on the activation and approach times of helicopter emergency medical services in four Alpine countries. Scand. J. Trauma. Resusc. Emerg. Med. 2012, 20, 56. [Google Scholar] [CrossRef]
- Kaufmann, M.; Moser, B.; Lederer, W. Changes in injury patterns and severity in a helicopter air-rescue system over a 6-year period. Wilderness Environ. Med. 2006, 17, 8–14. [Google Scholar] [CrossRef]
- Wankmuller, C.; Kunovjanek, M.; Mayrgundter, S. Drones in emergency response-evidence from cross-border, multi-disciplinary usability tests. Int. J. Disaster Risk Reduct. 2021, 65, 102567. [Google Scholar] [CrossRef]
- Silvagni, M.; Tonoli, A.; Zenerino, E.; Chiaberge, M. Multipurpose UAV for search and rescue operations in mountain avalanche events. Geomat. Nat. Hazards Risk 2017, 8, 18–33. [Google Scholar] [CrossRef]
- Lygouras, E.; Santavas, N.; Taitzoglou, A.; Tarchanidis, K.; Mitropoulos, A.; Gasteratos, A. Unsupervised Human Detection with an Embedded Vision System on a Fully Autonomous UAV for Search and Rescue Operations. Sensors 2019, 19, 3542. [Google Scholar] [CrossRef]
- Northrop Grumman MQ-8C Fire Scout VTOL UAV Completes First Ship-Based Test Period with US Navy. Available online: https://www.navalnews.com/naval-news/2022/01/mq-8c-vtol-uav-makes-operational-deployment-with-the-us-navy/ (accessed on 5 January 2022).
- Gupta, S.G.; Ghonge, M.; Ghonge, M.; Jawandhiya, P.M. Review of Unmanned Aircraft System (UAS). Intern. J. Adv. Res. Comp. Eng. Tech. 2013, 2, 1646–1658. [Google Scholar] [CrossRef]
- Naidoo, Y.; Stopforth, R.; Bright, G. Development of an UAV for Search & Rescue Applications Mechatronic Integration for a Quadrotor Helicopter. In Proceedings of the 2011 IEEE Africon Conference, Livingstone, Zambia, 13–15 September 2011. [Google Scholar]
- Chen, J.P.; Wang, L.X. The Effect of Airflow over Mountains on Flight Safety. Proc. Eng. 2014, 99, 876–884. [Google Scholar] [CrossRef][Green Version]
- Vetrella, A.R.; Fasano, G.; Accardo, D.; Moccia, A. Differential GNSS and Vision-Based Tracking to Improve Navigation Performance in Cooperative Multi-UAV Systems. Sensors 2016, 16, 2164. [Google Scholar] [CrossRef] [PubMed]
- Sedláčková, A.N.; Lokaj, P. Comparative analysis of U-Fly and Value Alliance and global alliances. In Proceedings of the International Conference on Air Transport–INAIR 2017, Prague, Czech Republic, 14–16 November 2017. [Google Scholar] [CrossRef]
- Stöcker, C.; Bennett, R.; Nex, F.; Gerke, M.; Zevenbergen, J. Review of the Current State of UAV Regulations. Remote Sens. 2017, 9, 459. [Google Scholar] [CrossRef]
- Sedláčková, A.N.; Kurdel, P.K.; Labun, J. Simulation of Unmanned Aircraft Vehicle Flight Precision. Trans. Res. Proc. 2020, 44, 313–320. [Google Scholar] [CrossRef]
- Koksal, N.; Jalalmaab, M.; Fidan, B. Adaptive Linear Quadratic Attitude Tracking Control of a Quadrotor UAV Based on IMU Sensor Data Fusion. Sensors 2019, 19, 46. [Google Scholar] [CrossRef] [PubMed]
- Megyesi, D.; Bréda, R.; Schrötter, M. Adaptive Control and Estimation of the Condition of a Small Unmanned Aircraft Using a Kalman Filter. Energies 2021, 14, 2292. [Google Scholar] [CrossRef]
- Vaispacher, T.; Bréda, R.; Andoga, R. Integration architecture design for implementation of a vector magnetometer on board of unmanned vehicle. In Proceedings of the 2014 IEEE 15th International Symposium on Computational Intelligence and Informatics (CINTI), Budapest, Hungary, 19–21 November 2014. [Google Scholar] [CrossRef]
- Nagy, B.; Abuhmaidan, K. A Continuous Coordinate System for the Plane by Triangular Symmetry. Symmetry 2019, 11, 191. [Google Scholar] [CrossRef]
- Technical Facts About Dynamic Scalar Fields Underlying Algorithms of Mobile Robots Navigation for Tracking Environmental Boundaries and Extremum Seeking. Available online: https://arxiv.org/pdf/1608.04553 (accessed on 5 January 2022).
- Laplace, P.S. Philosophical Essay on Probabilities. In The History of Mathematics and Physical Sciences; Springer: New York, NY, USA, 1995; pp. 1–270. [Google Scholar] [CrossRef]
- Wasserman, L. All of Statistics. A Concise Course in Statistical Inference; Springer: New York, NY, USA, 2004; pp. 221–442. [Google Scholar] [CrossRef]
- Monahan, J. Numerical Methods of Statistics; Cambridge University Press: Cambridge, UK, 2011; pp. 257–302. [Google Scholar] [CrossRef]
- Bertrand, S.C.; Lincoln, J.L. Predictive Statistics. Analysis and Inference beyond Models; Cambridge University Press: Cambridge, UK, 2018; pp. 161–205. [Google Scholar] [CrossRef]
- Čatloš, M.; Kurdel, P.; Sedláčková, A.N.; Labun, J.; Češkovič, M. Continual Monitoring of Precision of Aerial Transport Objects. In Proceedings of the 2018 XIII International Scientific Conference—New Trends in Aviation Development (NTAD), Košice, Slovakia, 30–31 August 2018. [Google Scholar] [CrossRef]
- Lazar, T.; Novák Sedláčková, A.; Kurdel, P.; Čatloš, M. Precise efficiency of autonomous navigation ergatic transport complexes. In Proceedings of the 16th International Conference on Management, Enterprise and Benchmarking, Budapest, Hungary, 27–28 April 2018. [Google Scholar]
- So, H.; Lee, T.; Jeon, S.; Kim, C.; Kee, C.; Kim, T.; Lee, S. Implementation of a Vector-based Tracking Loop Receiver in a Pseudolite Navigation System. Sensors 2010, 10, 6324–6346. [Google Scholar] [CrossRef]
- Knowles, I.; Renka, R. Methods for numerical differentiation of noisy data. Electron. J. Differ. Equ. 2014, 21, 235–246. [Google Scholar]
- Ahnert, K.; Abel, M. Numerical differentiation of experimental data: Local versus global methods. Comput. Phys. Commun. 2007, 177, 764–774. [Google Scholar] [CrossRef]
- Kozaruk, V.V. Navigacionnyje Ergatičeskije Komplexy Samoletov; Mašinostrojenie: Moscow, Soviet Union, 1986; pp. 52–88. [Google Scholar]
- Matveev, A.S.; Hoy, M.C.; Ovchinnikov, K.; Anisimov, A.; Savkin, A.V. Robot navigation for monitoring unsteady environmental boundaries without field gradient estimation. Automatica 2015, 62, 227–235. [Google Scholar] [CrossRef]
Publisher’s Note: MDPI stays neutral with regard to jurisdictional claims in published maps and institutional affiliations. |
© 2022 by the authors. Licensee MDPI, Basel, Switzerland. This article is an open access article distributed under the terms and conditions of the Creative Commons Attribution (CC BY) license (https://creativecommons.org/licenses/by/4.0/).