Article

A Comparative Study of Bridge Inspection and Condition Assessment between Manpower and a UAS

1
Department of Civil Engineering, Kunsan National University, Gunsan 54150, Republic of Korea
2
Department of Artificial Intelligence, Hannam University, Daejeon 34430, Republic of Korea
3
Department of Civil and Environmental Engineering, Korea Advanced Institute of Science and Technology, Daejeon 34141, Republic of Korea
4
Autonomous IoT Research Center, Korea Electronics Technology Institute, Seongnam 13509, Republic of Korea
5
Department of Civil Engineering, University of Seoul, Seoul 02504, Republic of Korea
*
Author to whom correspondence should be addressed.
Drones 2022, 6(11), 355; https://doi.org/10.3390/drones6110355
Submission received: 20 September 2022 / Revised: 29 October 2022 / Accepted: 7 November 2022 / Published: 15 November 2022
(This article belongs to the Special Issue Advances of UAVs Assisted Mobile Robot Navigation System)

Abstract

:
As the number of old bridges increases, the number of bridges with structural defects is also increasing. Timely inspection and maintenance of bridges are required because structural degradation is accelerated after bridge damage. Recently, in the field of structural health monitoring, a bridge inspection using an unmanned aerial vehicle system (UAS) is receiving a lot of attention. In this paper, UAS-based automatic damage detection and bridge condition evaluation were performed on existing bridges. From the process of preparing for inspection to the management of inspection data, the entire bridge inspection process was performed through field tests. The necessary element techniques for each stage were explained and the results were confirmed. Finally, UAS-based results were compared with conventional human-based visual inspection results. As a result, it was confirmed that the UAS-based bridge inspection is faster and more objective than the existing technology. Therefore, it was confirmed that the automatic bridge inspection method based on unmanned aerial vehicles can be applied to the field as a promising technology.

1. Introduction

Bridges are core infrastructures directly connected to the safety of the people and require continuous maintenance and investment at the government level. In order to effectively maintain the bridge, it is necessary to prevent damage by preemptively taking precautions against factors affecting the common life of the bridge. Missing the golden time of bridge maintenance can cause a huge economic burden to repair and improve performance. Therefore, it is economical to respond early if defects, damages or deteriorations are found through bridge inspection. Recently, issues related to the safety problems of bridges have increased due to the aging and collapse of bridges, and a lot of the budget has been invested in solving them. In the U.S., the MAP-21 (Moving Ahead for Progress in the 21st Century) [1] policy was established to manage the infrastructures based on performance evaluation in 2012, and the FAST Act (Fixing America’s Surface Transportation Act) [2] policy was proposed in 2016. After implementing MAP-21, FAST Act consolidated transportation investment programs to reduce investment redundancy and increase efficiency, and increased investment in the maintenance of existing infrastructures. In Japan, maintenance guidelines for improving the safety and performance of bridges were developed through the ‘Management Council for Infrastructure Strategy’ in 2013, and ‘Infrastructure Systems Export Strategy [3]’ was proposed in 2014 to maintain bridges. In addition, In the UK and Germany, ‘National Infrastructure Plan (2010) [4]’ and ‘The 2030 Federal Transport Infrastructure Plan (2016) [5]’ were established for infrastructure improvement and management, respectively. In Korea, ‘Special Act on the Safety Control of Public Structures’ was established in 1997 to conduct safety inspections and maintenance of bridges. In this way, many countries are investing in managing infrastructures, and efficient bridge maintenance studies are being conducted.
Recently, the most active research in the field of bridge maintenance is to evaluate the condition of the bridge quickly and accurately using an unmanned aerial vehicle (UAV) and imaging devices. The unmanned aircraft system (UAS) which consists of a UAV, an imaging device for damage collection, and sensors for system operation, has many advantages and is expected to solve limitations of the conventional manpower-based bridge inspection method. In other words, a UAS makes the bridge inspection process safer and faster and makes it possible to efficiently manage the bridge. A UAS can approach the top of the tower, cables, and spot of members, which are difficult to reach, without vehicle control. In addition, collected images can be detected and objectively quantified using image processing techniques (IPTs) and deep learning to ensure the reliability of bridge inspection. The main advantage of IPTs is the ability to detect and classify most of the damages (e.g., crack, corrosion, and efflorescence) on the surface of the bridge. Damage detection using IPTs has been mainly studied for cracks, which are the most structurally influential indicators of concrete bridges among various damages. Cracks on the image represent a sharp change of image brightness and can be detected mathematically through edge-detection techniques [6,7]. In order to identify cracks in bridges, Abdel-Qader et al. [8] compared the performance by applying four edge-detection techniques, which are fast Haar transform (FHT), fast Fourier transform, Sobel, and Canny. Hutchinson et al. [9] detected the crack by statistically finding the optimal parameter set of the edge-detection algorithms and Nguyen et al. [10] proposed edge detection using 2D geometric features for cracks with tree-like branches. However, the traditional methods using IPTs require designing filters or finding optimal parameters for detecting cracks. Moreover, there is a limitation in that it is difficult to quickly analyze a large number of images collected from a vision sensor with a UAV. Therefore, recently, deep learning-based damage detections that can classify specific objects and estimate their location in the images without image filters and parameters have been widely used. Deep learning has already been found to exceed the performance of IPTs in detecting objects and estimating their location using images. Vision-based structure damage detection using deep architecture is accompanied by advances in the field of deep learning. Initially, convolutional neural networks (CNNs) using sliding windows were used for crack detection [11,12]. However, since CNN requires high computational costs, it was difficult to detect quickly. In addition, early research studies were time-consuming and required the cost to collect enough damage images for the training of deep learning. To overcome this problem, a deep learning technique based on transfer learning that can update a new object using a well-trained network from a large image set has been proposed [13]. After that, various damages were considered, and different deep learning networks were used depending on the purposes (i.e., high accuracy, fast speed, low computational cost, segmentation, etc.) [14,15,16,17].
The need for bridge maintenance efficiency and the improvement of image analysis performance has been an opportunity for the UAS-based bridge inspection research to be activated, and pilot tests have been conducted in many countries [18,19,20,21,22]. In the early stages, only a single image was captured with a vision sensor by approaching the UAS at a specific point where damage is suspected. In addition, Kim et al. [23] used a commercial drone to perform aging concrete bridge inspection according to a general procedure (i.e., background model generation through pre-flight, crack detection using deep learning, crack quantification using IPTs, and damage display). In recent years, bridge inspection studies have been conducted to build more complex and difficult tasks by using UAS equipped with various sensors. However, recent studies have faced major challenges that were unthinkable when inspecting bridges using a UAS. Jung et al. [24] divided UAV-based bridge inspection procedures into pre-inspection, main inspection, and post-inspection phases and considered the role of each phase. Other UAS-based bridge inspection studies include location estimation of a UAV in GPS-shaded areas, 3D background model generation, and image quality improvement [25,26,27]. However, there are not many studies comparing the results of the manpower-based inspection and UAS-based bridge inspection directly. Yoon et al. [28] conducted a study comparing UAS-based bridge inspection results and human visual inspection results through three-dimensional image coordinates, but focused only on comparing the location of the damage.
This paper deals with the results of UAS-based bridge inspection and condition assessment conducted in the research project. The UAS-based bridge inspection technologies developed in the research project were carried out as the basis of the UAS-based Bridge Management System (U-BMS) for the bridge management department of the government to perform bridge inspection tasks and make decisions. In this research project, hardware technologies such as a UAV for bridge inspection, a ground control system (GCS), an autonomous flying platform using various sensors (i.e., IMU, GPS, camera, 3D LiDAR), and an IoT-based image coordinate estimation system were developed. In addition, the software part developed damage detection and classification using IPTs and deep learning, 3D model generation using the point cloud method, image quality evaluation and improvement, and bridge condition assessment techniques. This paper focused more on the results of the bridge inspection than on the hardware part.
This paper has the following contributions in relation to UAS-based bridge inspection and condition assessment. One of the primary contributions is to carry out all stages of UAV-based bridge inspection procedures from the planning stage to the condition assessment stage. As bridge inspection using UAVs received attention, many studies were conducted and element technologies were developed. However, there are still limitations to putting the technologies into practical use in-service bridges [24,29,30,31]. This research project solved the challenge problems through field tests, and it has great meaning in automating and integrating the bridge inspection procedure. Another contribution is to compare the results of UAS-based automatic bridge inspection with human-based visual inspection results. For efficient bridge management, objective structural damage detection is required. In this study, the damage of the target member in the bridge was measured, and the results of UAS-based automatic damage detection and appearance damage map were compared with the existing visual inspection results. Through this, it was confirmed that the UAS-based bridge inspection and condition assessment method has objective results. It is judged that such research results can be utilized for practical inspection of UAS-based structures in the future. This study has novelty and contribution in that it derives the results of the entire inspection process while performing field tests for each stage of the UAS-based bridge inspection according to the inspection procedure. Additionally, by comparing the results of the UAS-based bridge inspection with the human-based inspection results, we were able to confirm the performance. Finally, there is a contribution in that it suggests a method to manage UAS-based bridge inspection data and utilize inspection history.
The rest of this paper is organized as follows. Section 2 briefly describes the UAS-based bridge inspection procedure and key techniques considered in this study. In Section 3, the results of the pilot test are presented. Comparison results with manpower inspection are discussed in Section 4. Finally, a conclusion of the findings is presented in Section 5.

2. UAS-Based Bridge Inspection Procedure and Developed Technologies

This section introduces the bridge inspection procedure and element technologies developed for UAS-based bridge inspection. The UAS-based bridge inspection procedure is not much different from the manpower-based method, but in this study, it was divided into pre-inspection, main inspection, and post-inspection. In addition, each phase is divided into detailed steps, and the contents of the mission are explained. It also explains which task uses U-BMS. Moreover, the developed technologies in this research project are briefly explained.

2.1. UAS-Based Bridge Inspection Procedure with U-BMS

The UAS-based bridge inspection procedure was divided into detailed tasks for each phase as shown in Figure 1. The pre-inspection phase is a process of planning and preparing before the main inspection. Therefore, the target bridge, inspection type (i.e., regular inspection, precise inspection, and precise safety diagnosis) and inspection date are determined. Then, the existing inspection information of the target bridge is analyzed. This step can be performed in the office through the U-BMS developed in this study. If there is no information, this step is to generate a 2D/3D background model of the bridge using preliminary flight. Finally, the inspection scenario and flight path are planned. The main inspection phase is performed at the site of the bridge, and the UAS-based bridge inspection including UAS setup and flight condition check is performed. In general, the post-processing of the collected inspection data is performed in the office, returning from the field of the bridge. If a missing inspection area is identified off-site, time and cost should be lost for re-inspection. Therefore, the main inspection in the field is considered to estimate image coordinates through multi-metric sensing and coordinate transformation for missing area detection in the field. Finally, in the post-inspection phase, the overall process for damage detection and visualization is performed. In addition, the condition of the member level and the bridge level is evaluated based on the results of damage identification. As shown in Figure 1, several steps are performed on the U-BMS for UAS-based bridge inspection. U-BMS consists of bridge video analytic (U-BVA), bridge information management (U-BIM), and bridge inspection (U-BI) modules. U-BMS can conduct cloud-based data management and visualization, real-time bridge condition assessment, and connecting with existing BMS. It can efficiently support bridge inspection in various mobile environments through responsive web technology.

2.2. UAS for Bridge Inspection

When using a commercial drone to inspect the bridge, there are many limitations in performing the mission. For bridge inspection, a UAS capable of flying for a long time (i.e., at least 30 min) with a high-performance camera and sensors is required. In addition, it is necessary to secure a communication distance (i.e., at least 3 km) for safety connection between a GCS and a UAS, and wind resistance capacity against gusts (i.e., maximum 10 m/s) is required. Therefore, a quad-rotor type UAV was developed to be suitable for bridge inspection in this study. Basically, a gimbal that can rotate 90 degrees up and down for checking the bridge deck was mounted, and the UAV was designed to reduce the interference between the gimbal and the propellers. The UAV’s flight controller used a Pixhawk 2, equipped with a mini PC (i.e., Intel i7 NUC), 3D LiDAR (i.e., Velodyne Puck lite), and LTE modem for location estimation and autonomous flight. Figure 2 shows a customized UAV equipped with various sensors. The location recognition algorithm was used by improving the graph-based SLAM algorithm. Graph-based SLAM expresses the position and movement of the UAV with nodes and edges like a graph. Here, the node means the pose of the UAV, and the edge between the two nodes is the odometry information between the positions of the UAV and is called a constraint. Therefore, the UAV moves and creates nodes and constraints using odometry information. It acquires information in 3D space through pre-flight and recognizes the same location through newly acquired data and information in the main flight. Moreover, the position is estimated by adding a constraint between non-contiguous nodes and optimizing the graph. It has been improved by constructing the visual inertial mileage using the camera and IMU and generating a normal distribution transformation using 3D LiDAR to generate the base node [32,33]. As a result, it was possible to secure the stability of the basic node generation and to perform autonomous flight on the bridge deck. In this study, a flight path was generated by converting 3D into 2.5 dimensions (i.e., 2D and height) in consideration of the speed and computational power of creating a path in a 3D environment. In addition, the Teensy board on the camera stores the GPS obtained from the location recognition algorithm, 1D LiDAR for measuring distance, and IMU from the gimbal. Therefore, the position coordinate of the image could be estimated through transformation for each coordinate system. This can be used for missing area detection, which will be described in the next subsection, as well as obtain information on each pixel size of the image. As a result, information on the size of the detected damage can be derived from the acquired images.

2.3. Missing Area Detection and Image Quality Assessment

The center coordinate of the images collected from the UAS can be calculated through the transformation of the homogeneous coordinate system. Figure 3 shows the schematic of the estimation method of image coordinates.
The first coordinate transformation can be conducted through the location information and the IMU data of UAS and can be moved to the gimbal considering the position of the sensor installation. After that, the camera coordinate connected with the gimbal is converted using another IMU data of the gimbal. Finally, the working distance information obtained from the 1D LiDAR enables coordinate conversion to an image center point [24,28]. The result of estimating the coordinates of the image can be utilized in the quantification of the detected damage as it allows us to determine the pixel size within the RoI (Region of Interest). In addition to missing area detection, there is another procedure that must be performed between bridge inspection and damage detection procedures. This is to evaluate the quality of the images obtained from the UAS. Image quality is affected not only by the stability of the UAV but also by various environments such as wind and light. In particular, when the UAS photographs the surface in close proximity to the bridge, the image quality problem is represented by motion blur due to UAS’s vibration, insufficient shutter speed, and errors in camera focus. Since motion blur causes a decrease in the sharpness of an RGB image, the level can be evaluated by checking the change in the gradient value of gray intensity. Therefore, an image quality assessment (IQA) index can be derived from considering characteristics of motion blur as follows [24]
S G V k = i = 1 M j = 1 N ( G k ( i , j ) G k ( i , j + 1 ) ) 2 + ( G k ( i , j ) G k ( i + 1 , j ) ) 2 M 2 + N 2
where S G V k denotes the quality assessment score of the k-th image, and M and N denote horizontal and vertical pixel numbers of the image, respectively. In addition, G k represents the gray-intensity function of the k-th image. This criterion can evaluate relatively low-quality image frames even if there is no reference image.

2.4. Deep Learning-Based Damage Identification

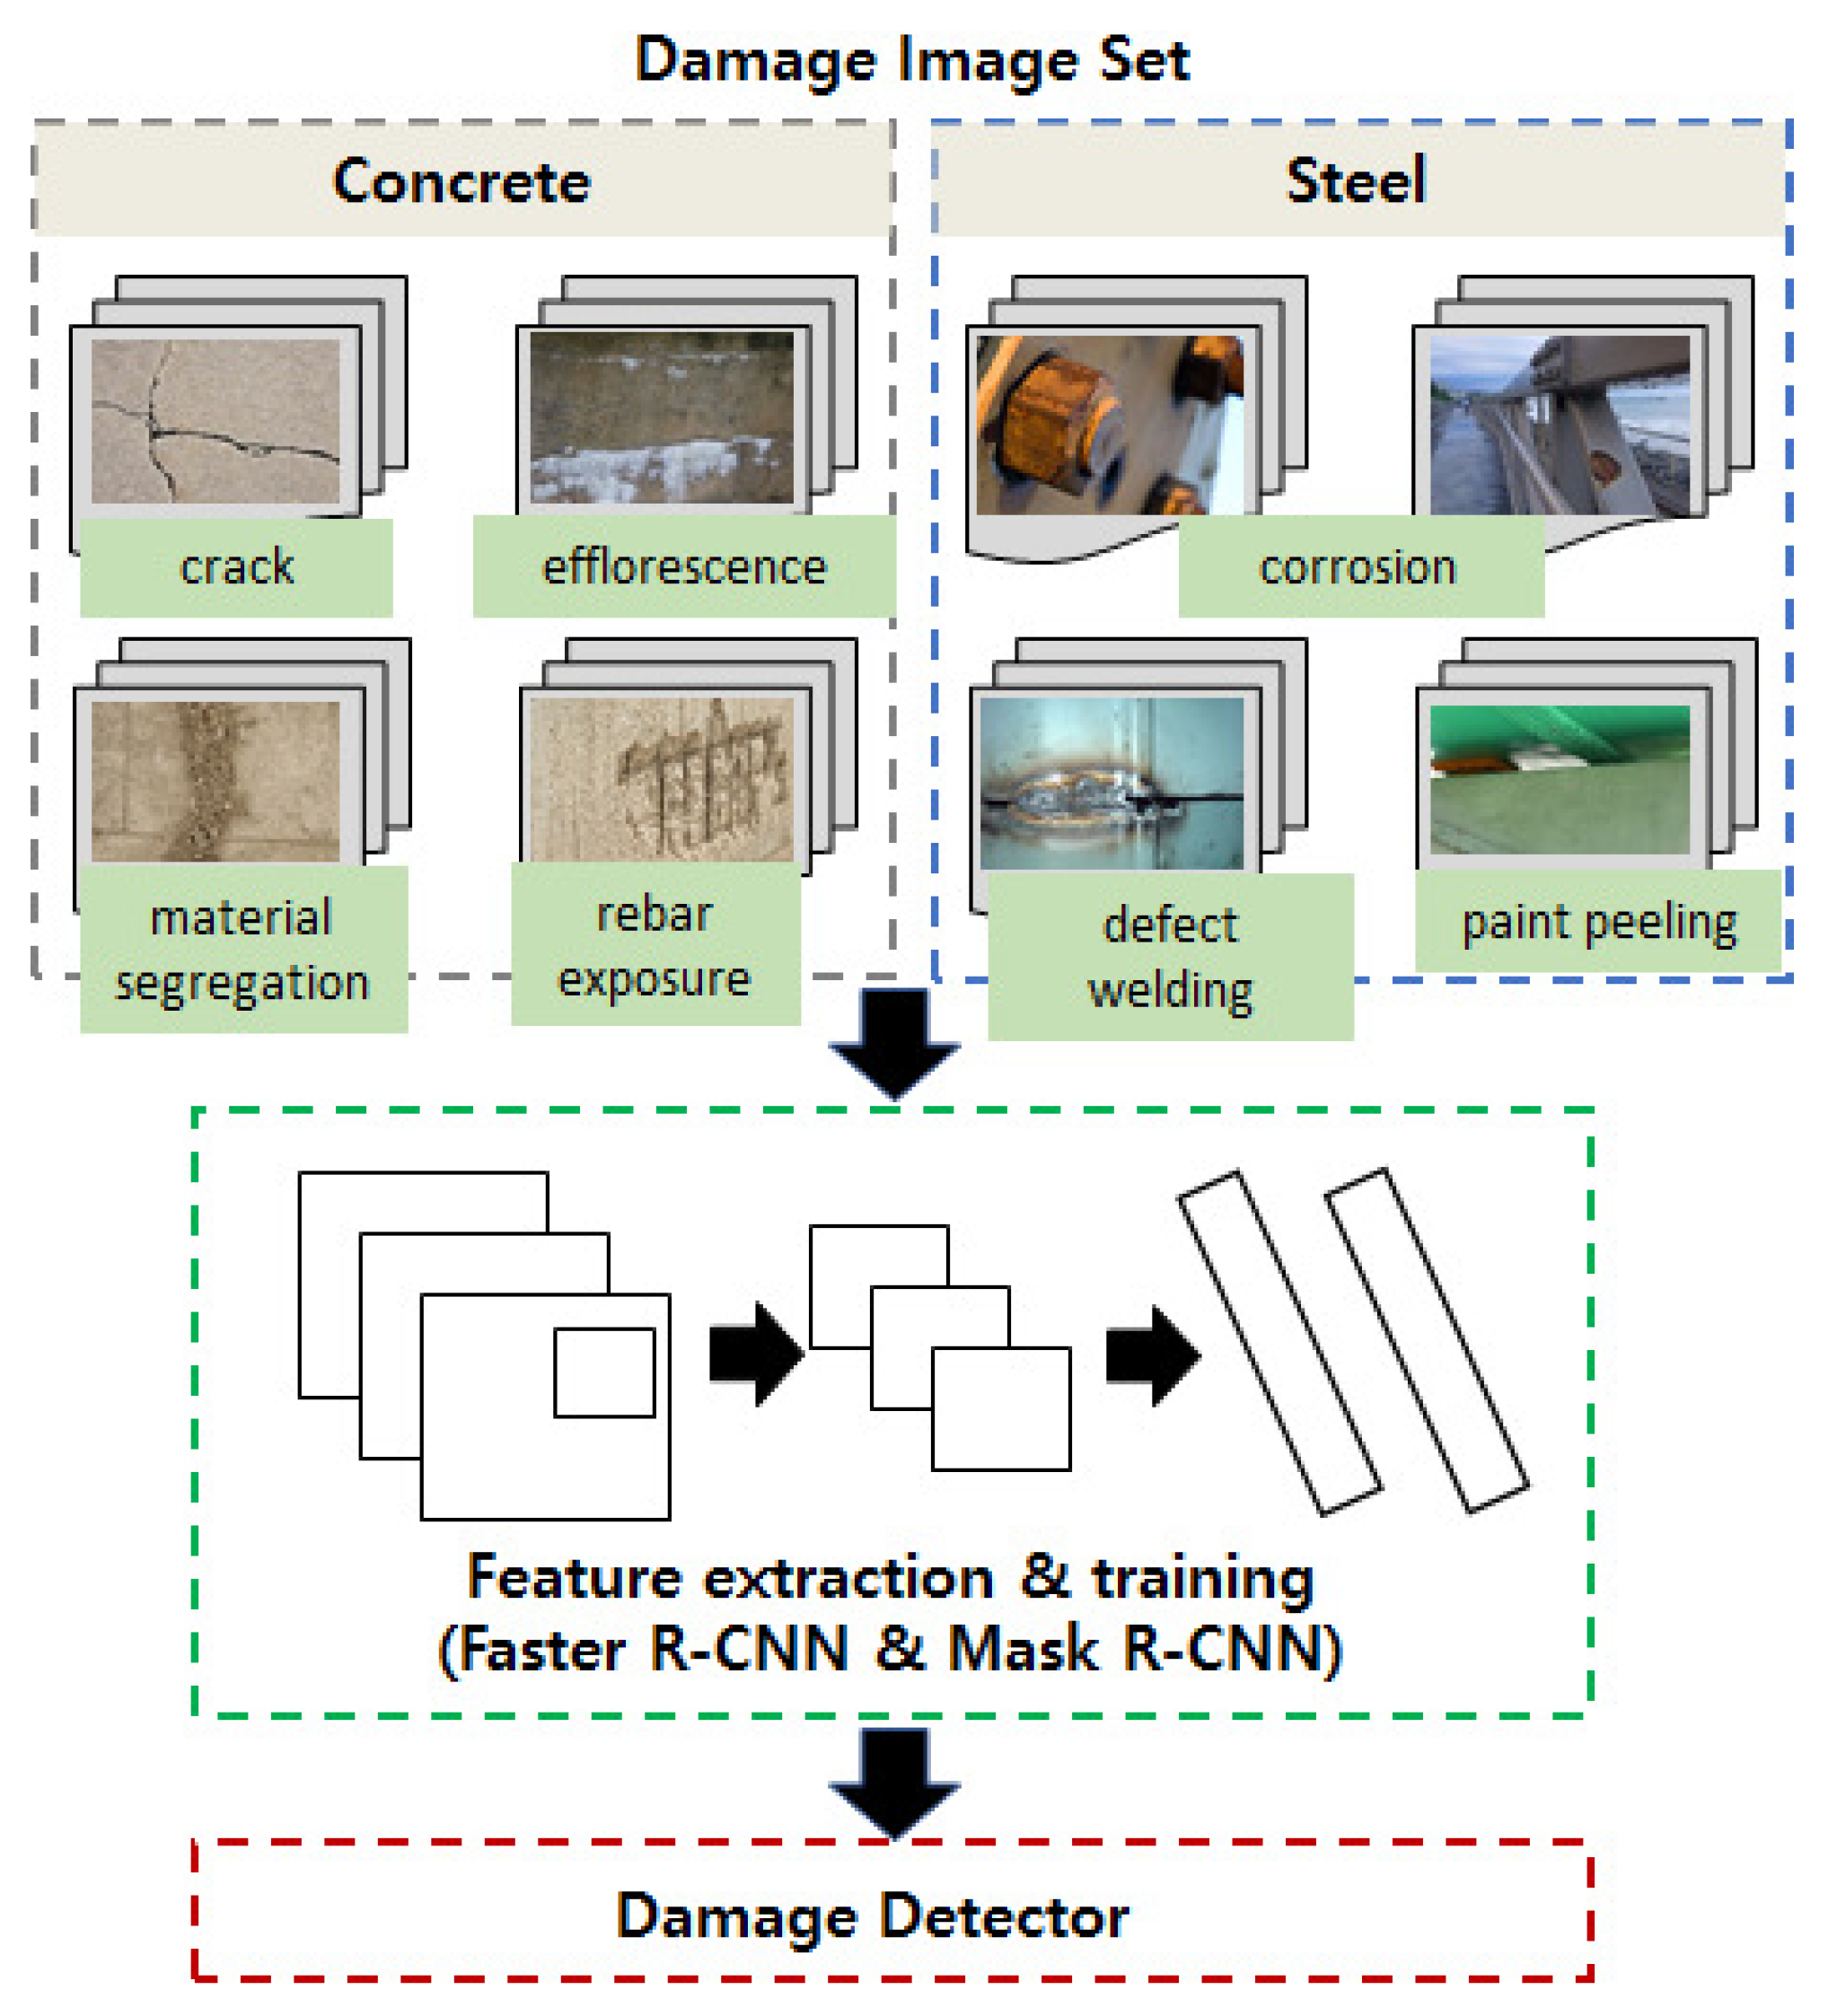
After the bridge inspection on-site, the next procedure is to identify damages including classification, localization, and quantification. As already mentioned, there are limitations to processing a huge amount of collected image data with IPTs only. Therefore, in this study, two deep learning algorithms were used. This is because the specific value and area for damages are simultaneously utilized in order to determine the condition grade of the member. Therefore, the Mask Region-based CNN (i.e., Mask R-CNN) [34] and the faster R-CNN [35] among deep learning algorithms were applied to classify the damage classes on concrete and steel bridges (Figure 4). First, a dataset for each type of damage can be obtained using all available resources to train various damages. The training image set for the concrete structure considered six damage classes such as crack, efflorescence, breakage, water leak, material segregation, and rebar exposure. In addition, five damage classes (i.e., corrosion, crack, bolt, defect welding and paint peeling) were considered in the steel element. The dataset for the deep learning was divided into approximately 4000 images for training and 700 images for validation, respectively. The next step is to label the damage. Faster R-CNN outputs the region for damage, and Mask R-CNN outputs in the form of masking damage. Mask R-CNN adds a mask branch that predicts a pixel-unit segmentation mask for each RoI based on Faster R-CNN. To identify the width or length of cracks, pixel-level masking of damage is very effective. This is because damage can be quantified in consideration of the pixel size calculated in the image coordinate estimation process. However, the area of damage in the case of a network crack should be calculated for evaluating bridge conditions, so it is advantageous to detect the box shape for the damage. The third step is to train the network with labeled images. In the training, feature extraction in the images and updating the weights in the network are conducted using the backpropagation method. Deep learning networks of the R-CNN family do not train only with prepared images. The damage classes can be added to well-trained networks using transfer learning. Transfer learning used a labeled dataset of various classes such as car, bird, house, etc. Therefore, the network can extract basic features such as line, shape, shadow, etc., and the entire network is updated to classify the damages by connecting the prepared damage images to the last fully connected layer in the network. This is efficient when the number of images for training is not sufficient. The transfer learning-based deep learning method is also quite good. The deep learning model learned in this study was evaluated to have an accuracy between 85% and 100% and a recall rate between 70% and 100% depending on the class of damage. Although it had high accuracy and recall for most of the damage, it was confirmed that the recall was lowered when several damage classes were in the same area.

2.5. Bridge Condition Assessment

When damages are identified, a condition assessment of structural members and bridges is performed. Depending on the condition grade of the bridge, the method and budget for reinforcing repairs will be different. Therefore, the condition status of the bridge is evaluated according to the criteria for each damage and the damage area compared to the total member area. Each country has criteria for classifying the status of bridges from 4 to 10 levels as shown in Table 1 [36]. The bridge condition class describes the damage and condition of the bridge, and it is used as a basis for making decisions on repair and reinforcement. In general, a deterioration evaluation should be included in order to finally determine the bridge condition. In the case of Korea, durability due to carbonation and chloride is included. This study shows that UAS can be used as an auxiliary role rather than performing all inspection procedures. Therefore, only surface damage using visual images was considered. In addition, superstructures (e.g., deck slabs, girders, cables, etc.) and substructures (e.g., piers, pylons, etc.) that can be inspected using UAS were considered. Although UAS plays a limited role in the bridge inspection procedure, positive effects can be expected in terms of time, cost, and safety.
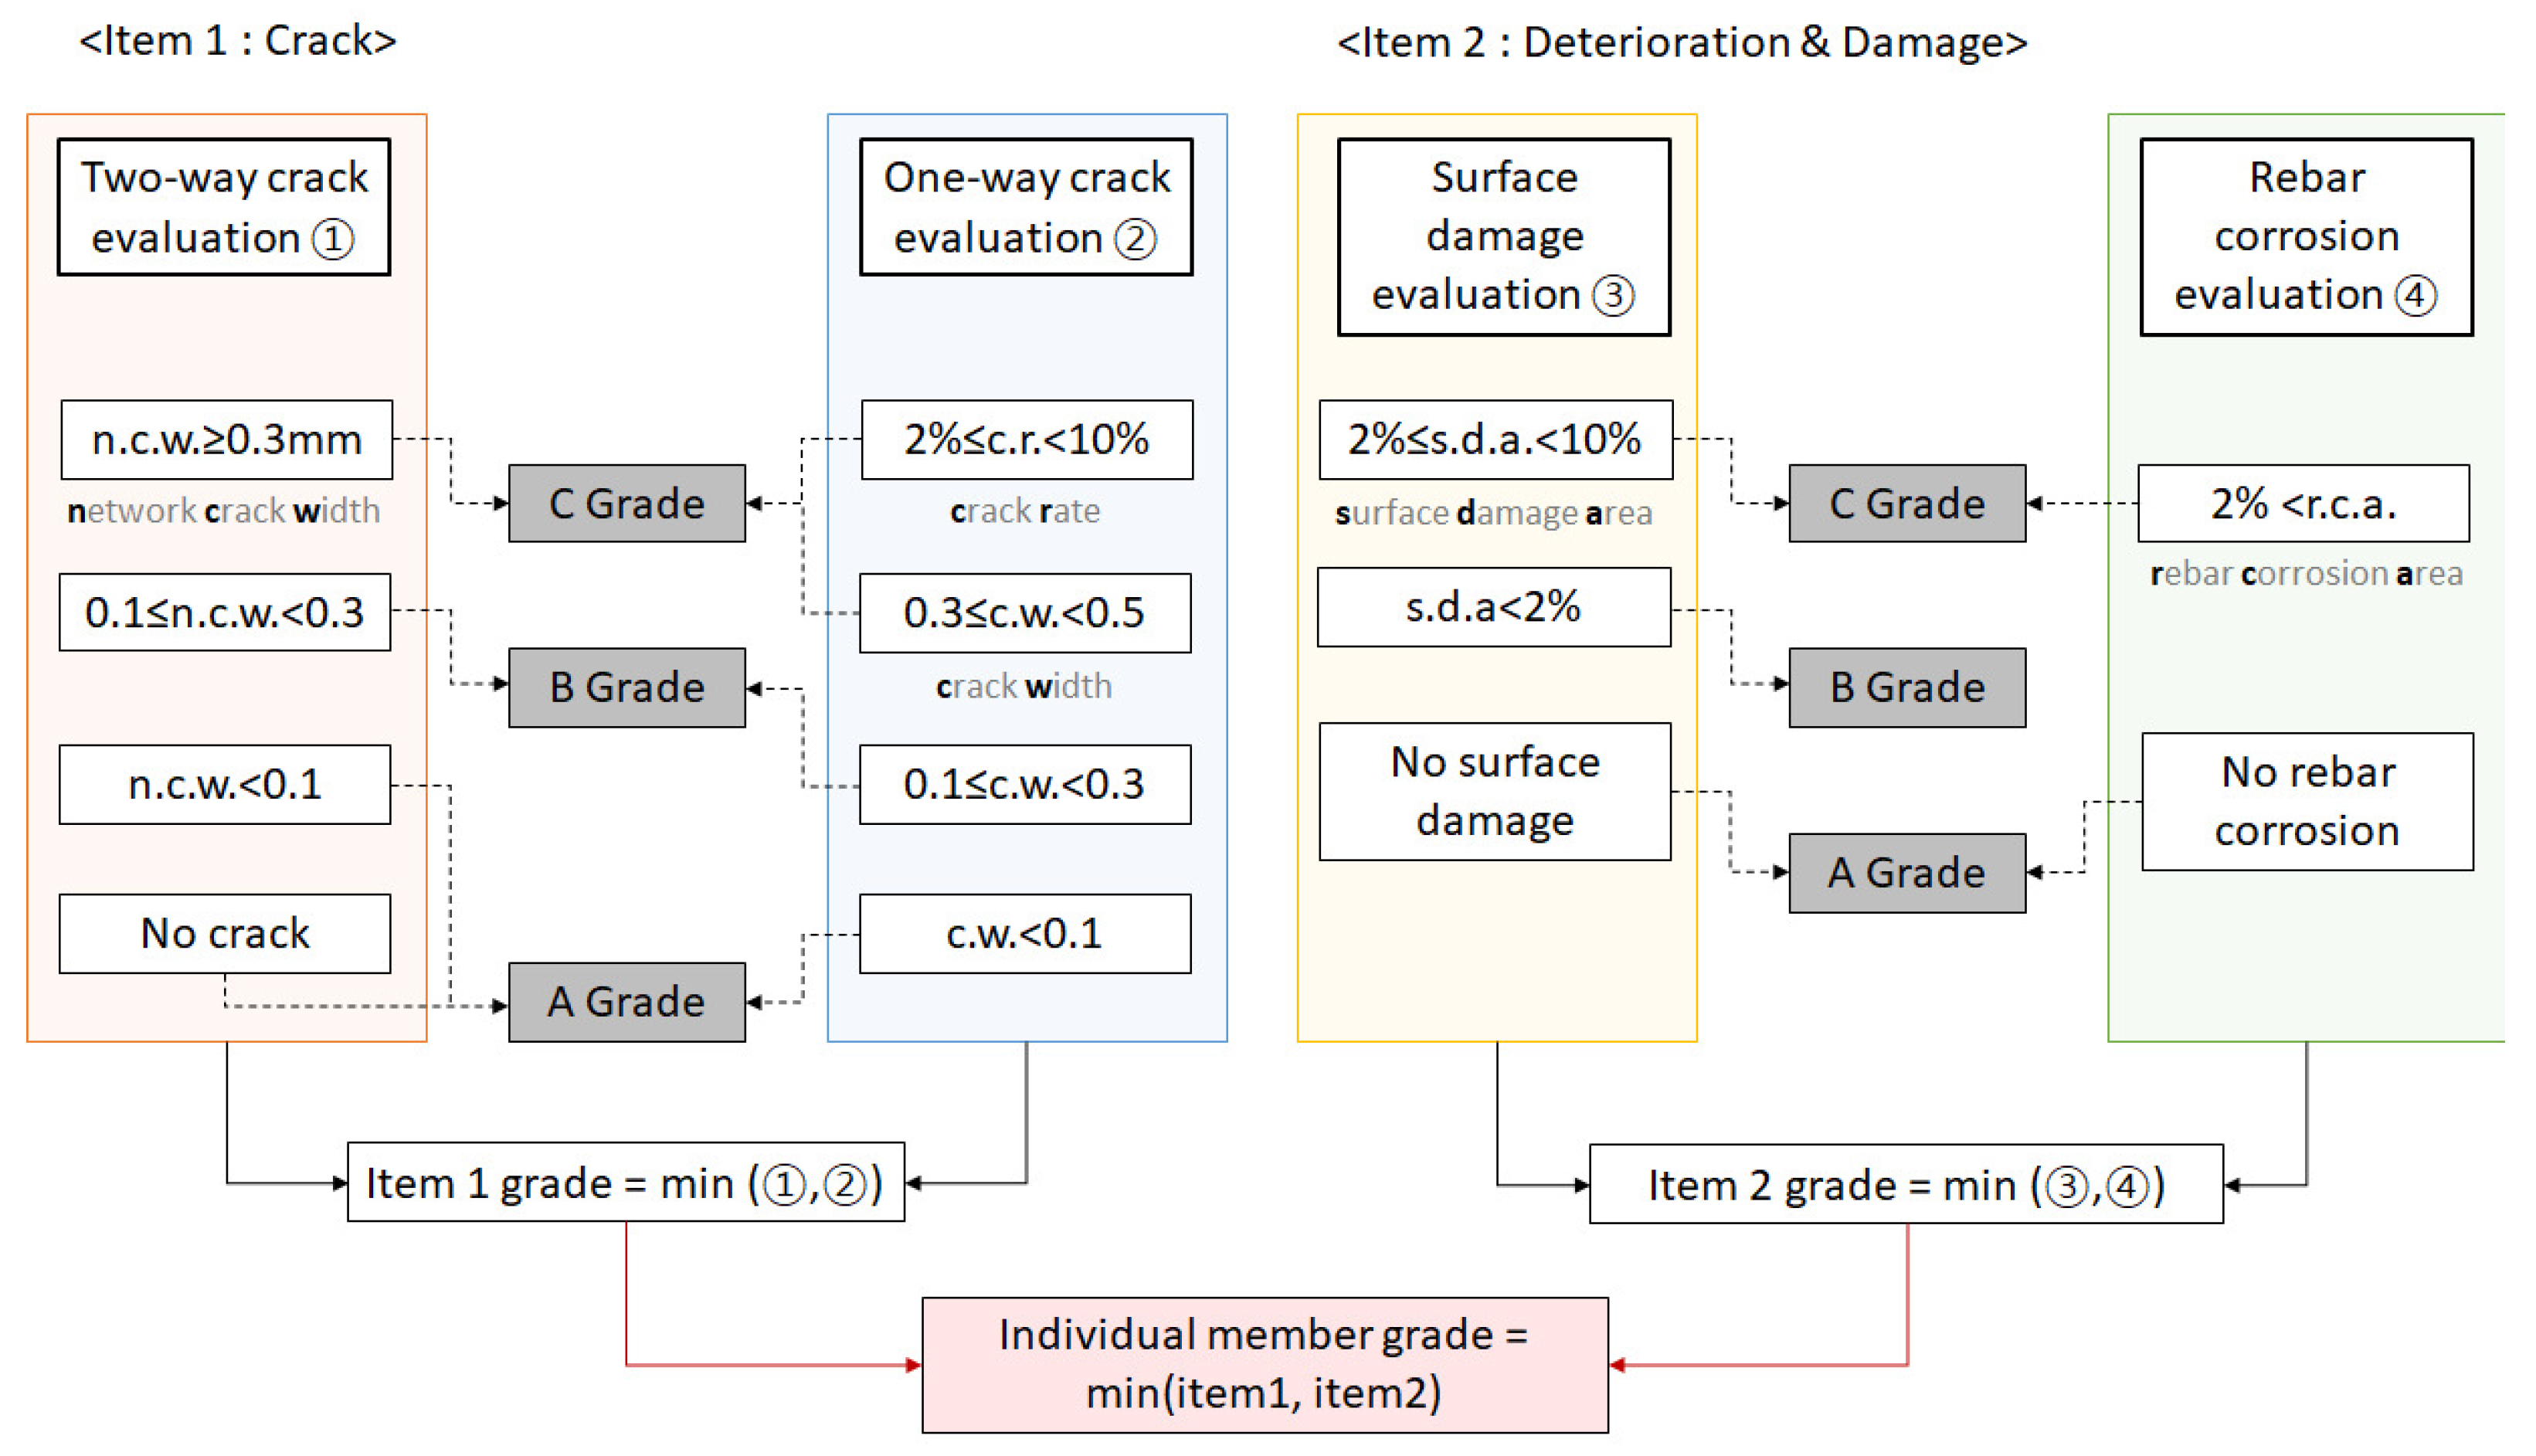
In general, bridge inspection is performed considering the importance of the structural element. Deck slabs are a structural element that directly affects the safety of bridges. In the case of concrete deck slabs, cracks are first divided into a one-way crack and a two-way crack (i.e., network crack). In addition, a second evaluation of deterioration and damage is performed. Finally, the lowest grade of the condition assessment for both damages is selected as the grade of the individual structural member. Figure 5 shows the procedure for condition assessment of concrete members (i.e., bridge deck slab). As shown in Table 1, in the case of Korea, the bridge condition grades are given from A to E grade. However, in this study, damage detection performance aimed to quantify the crack of approximately 0.3 mm, so both D and E grades were omitted from the flowchart. In fact, because the condition of the D-grade bridge is very serious, it is difficult to service. In addition, repair and reinforcement are urgently needed rather than visual inspection. For reference, the evaluation criterion for a crack in a PSC girder is more stringent because the probability of cracking is less than that of a concrete girder due to the effect of the tendon. When the width of the crack is more than 0.2 mm and less than 0.3 mm, grade C and less than 0.2 mm are considered grade B. However, in the case of piers, general concrete evaluation criteria are used. In the case of steel bridges, the grade is determined by taking the damage of the member and the connection part as the first evaluation item and the surface deterioration as the second item. Steel bridges, unlike concrete bridges, are considered to have structural defects when cracks are detected. Therefore, evaluation items for the condition of members are deformation, breakage, loosening and dropping of connecting bolts, defects in welds, corrosion, and paint peeling. Actually, the condition grade of structural members considered durability for the salt damage, but only the results of the appearance inspection were used in this study.

3. Field Test

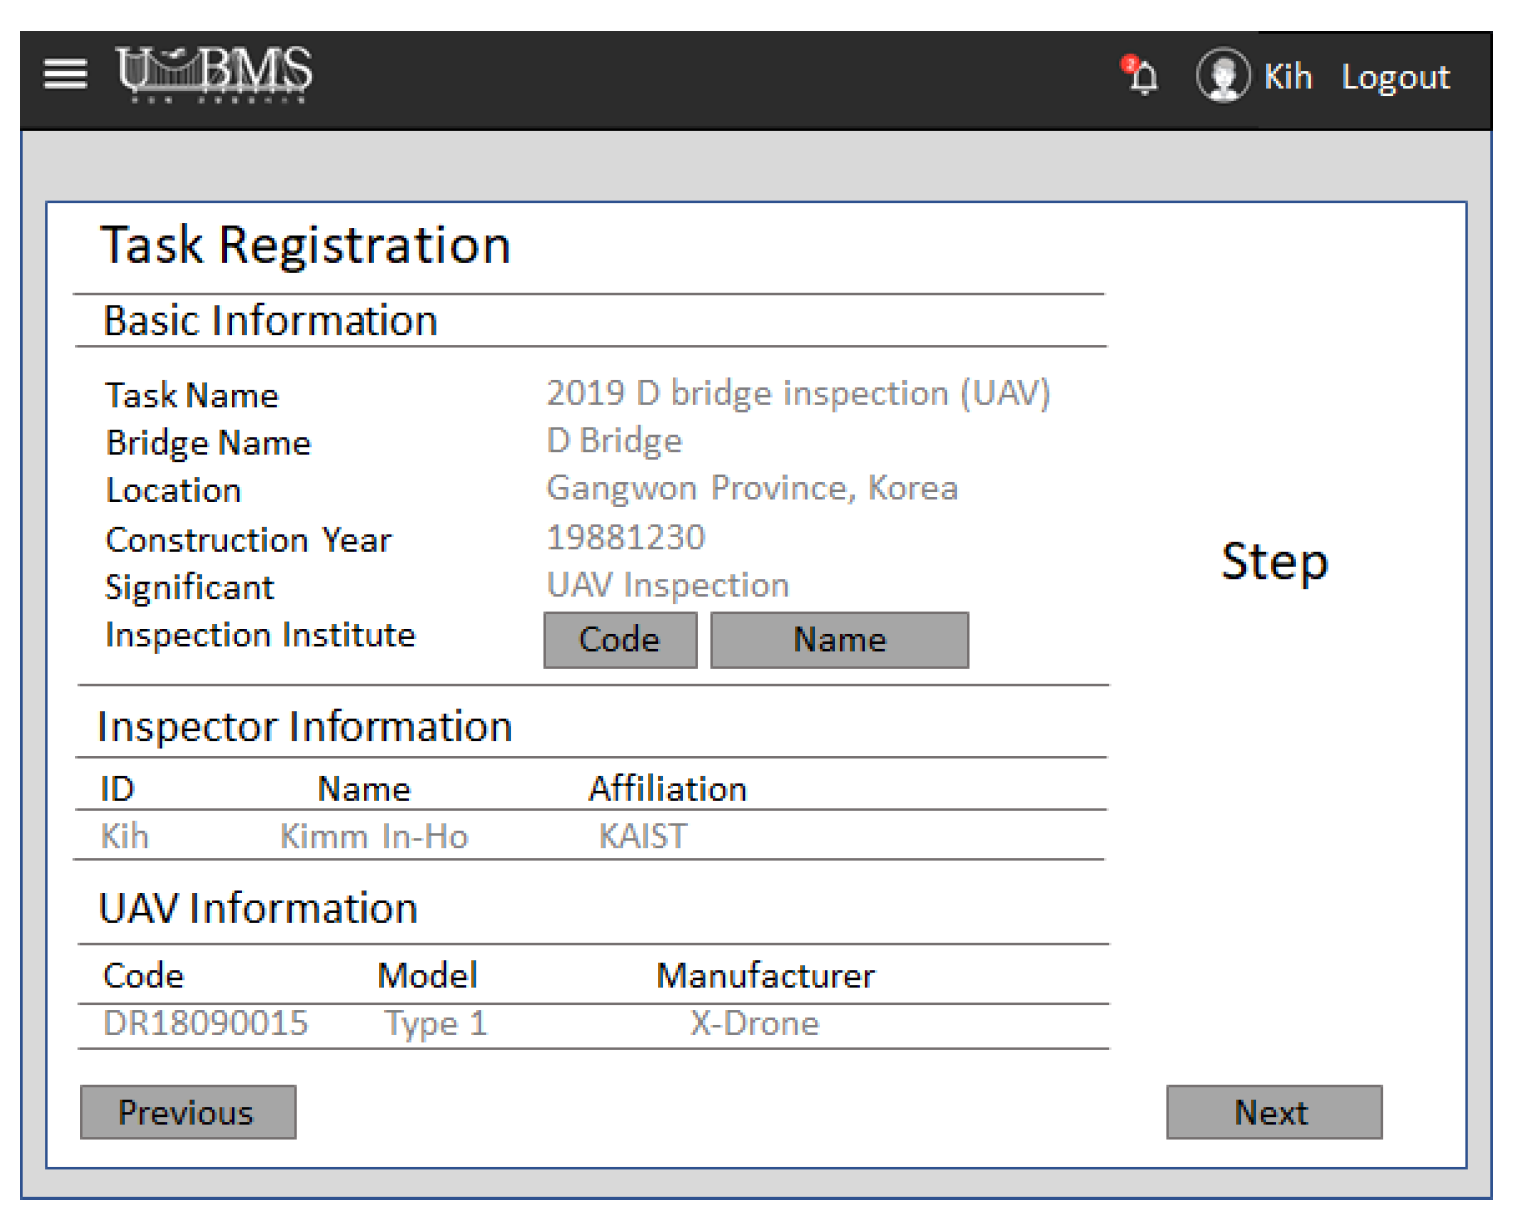
This section discusses the field test results performed in this study. In consideration of accessibility and safety, the target bridge was selected as the D Bridge in Gangwon province, Korea, as shown in Figure 6. The D bridge is a structure in which 10 steel boxes and 10 PSC box girders are combined, with a width of 11.0 m and a total span of 2000 m. The span of the test bed is the area where the PSC and steel box are connected as shown in the figure, and the corresponding piers (i.e., pier 29–31) were targeted. Task definition is performed on U-BMS and can input basic task information (i.e., target bridge, date, inspection type), inspector and UAS information, and inspection scope as shown in Figure 7. The preliminary information analysis and preparation step are carried out considering the existence of bridge information. In addition, the inspection scenario and flight path are planned.
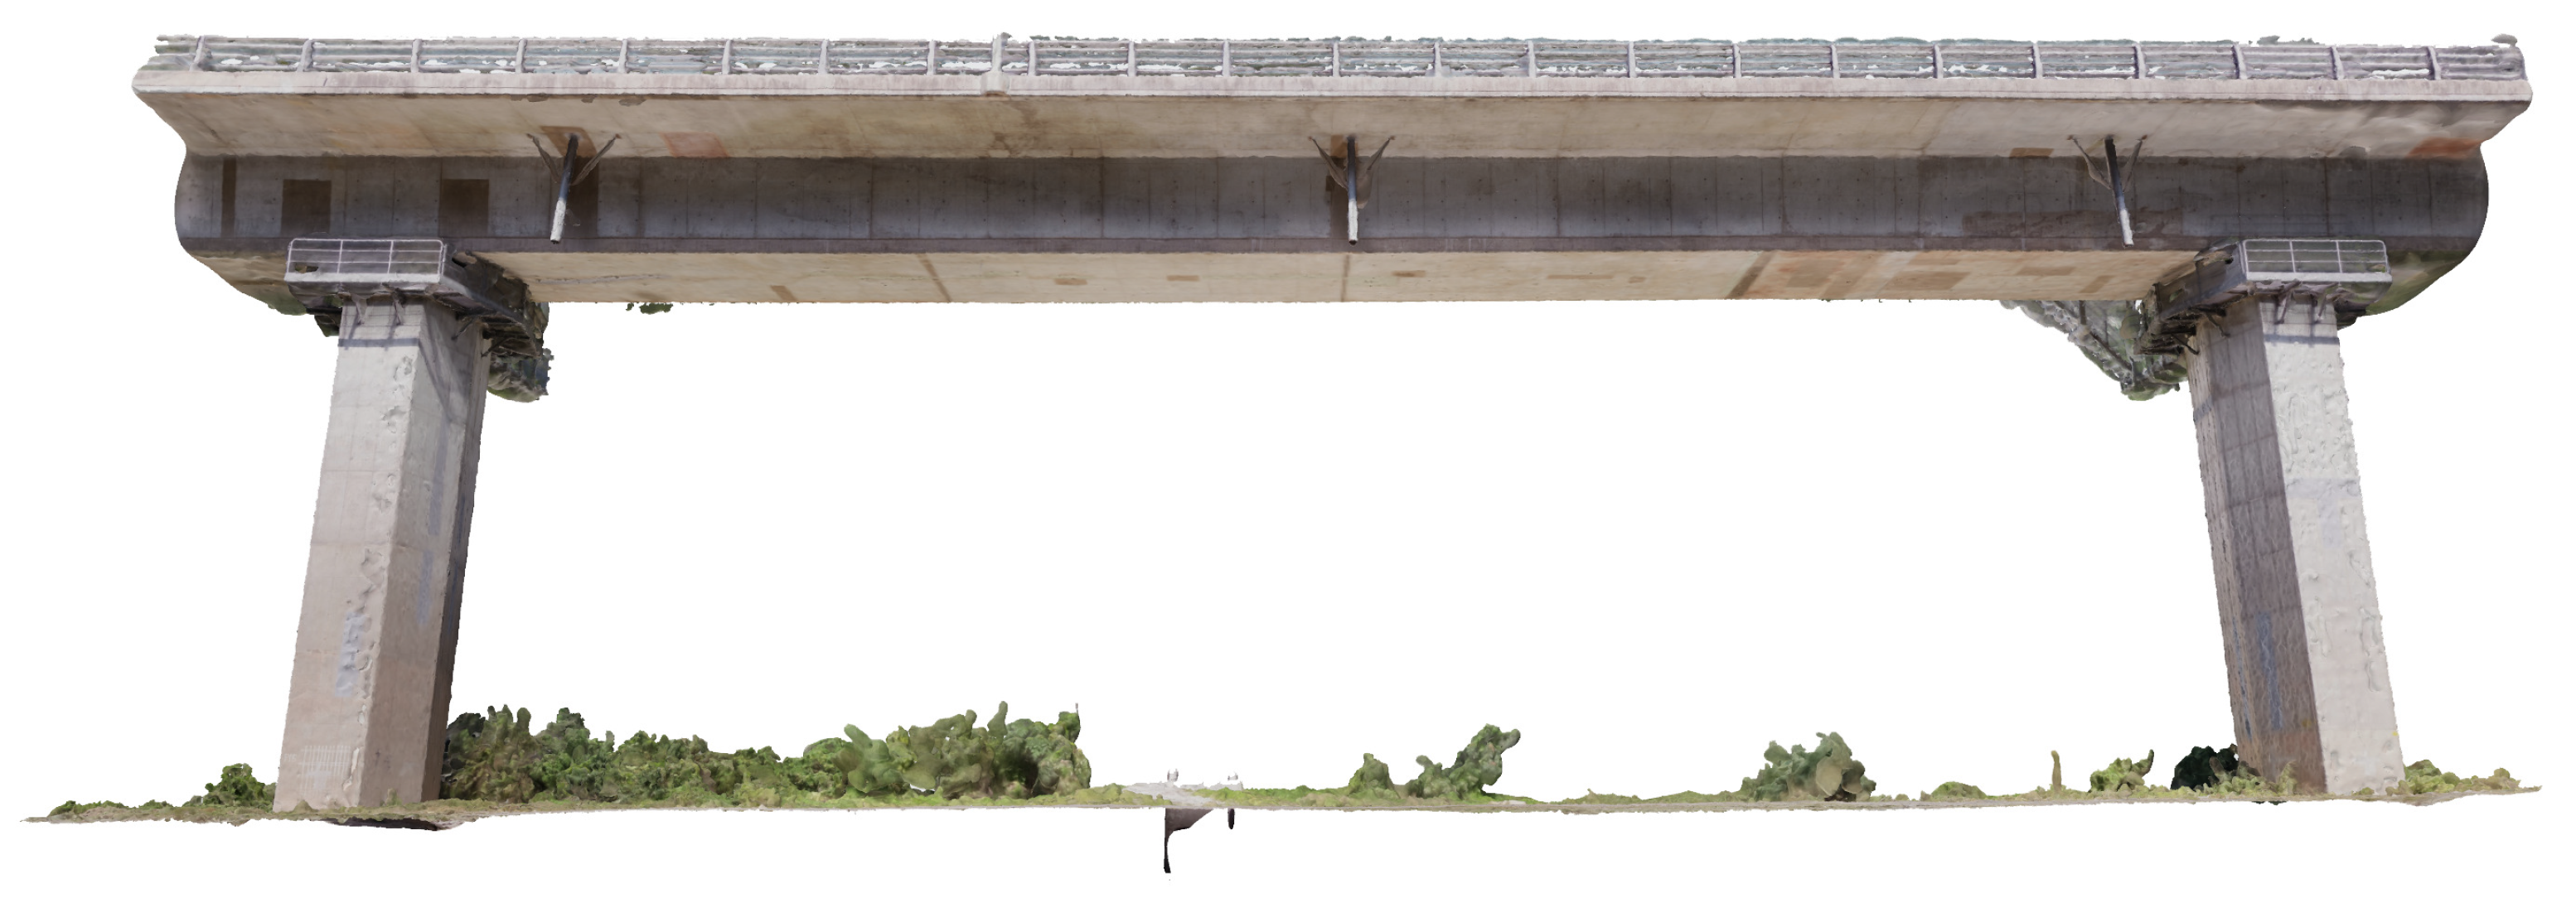
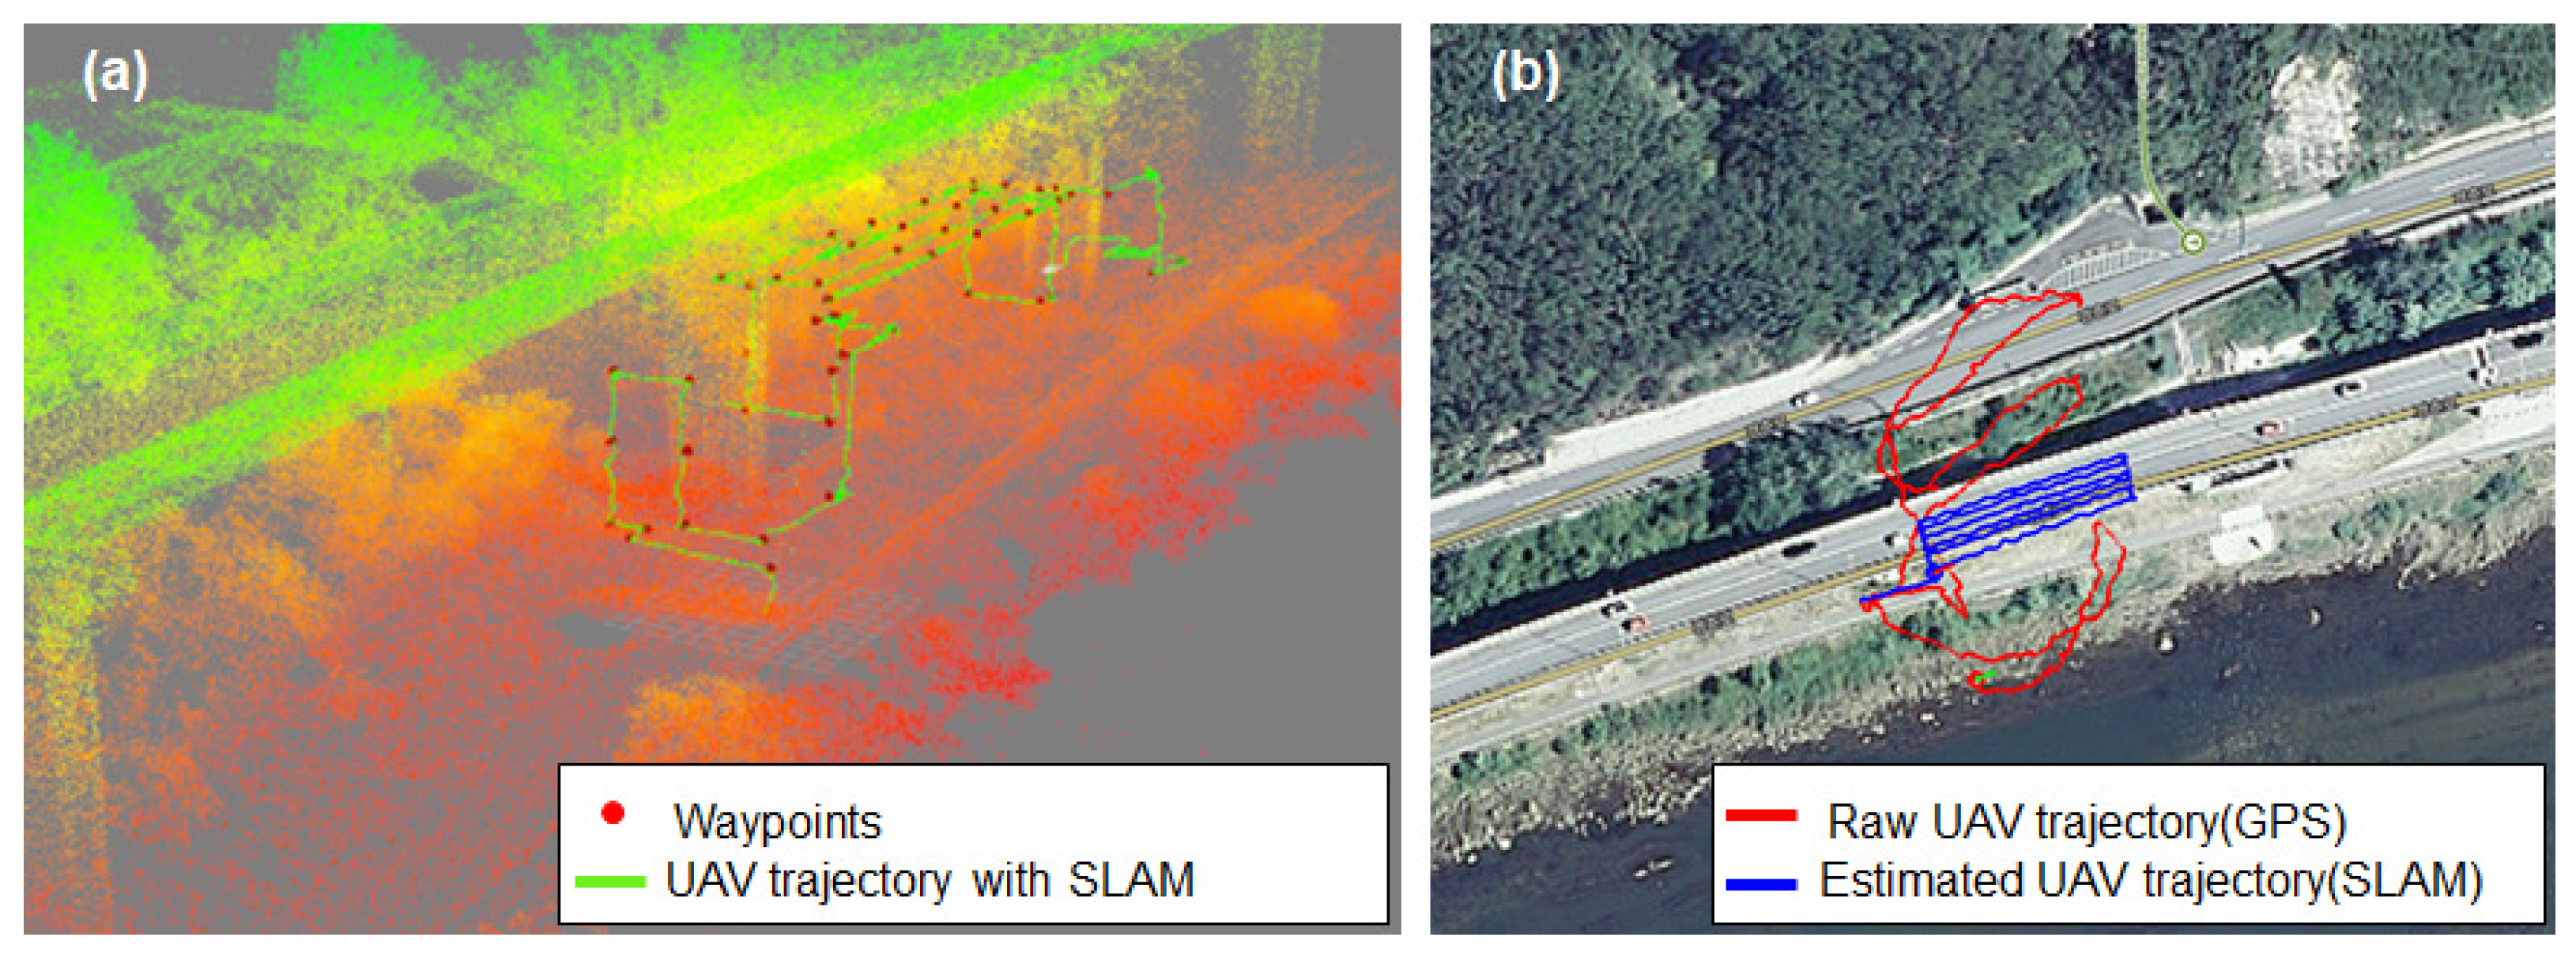
In the case of the D bridge, it was constructed approximately 30 years ago, but it is a well-managed B-grade bridge that has bridge information with appearance inspection results. Although there were drawings or damage information on the bridge, a preliminary flight was performed to obtain a 3D/2D model of the bridge considering that there was no bridge information. In the preliminary flight, images were collected for 3D model generation taking into account the longitudinal and lateral overlap, and as shown in Figure 8, a 3D point cloud-based background model of the bridge was generated using Pix4D. The 3D point cloud technique can extract and match feature points from geo-tagged images containing the UAS information (i.e., location, pose), and the 3D model is made by mesh and texture. Digitizing the 3D/2D background model of the bridge is an essential task to manage data and make decisions on the U-BMS. It can also be used to draw a bridge damage map. The final step in the pre-inspection phase is preparation for the main inspection. This step confirms the UAS-based bridge inspection scenario and flight path. If the record of performing UAS-based bridge inspection in the past is on the U-BMS, it can be used or modified, otherwise, a new record must be created. Lastly, the UAS setup and flight path setup are performed prior to the main flight for bridge inspection. UAS setup includes inspection of sensors installed on the UAV for flight and camera setup. In this study, a high-resolution DSLR camera (i.e., Sony alpha 9) with a lens (i.e., ZEISS Batis 85 mm f/1.8) was used. The camera and lens were determined considering the minimum pixel size that can be obtained when the distance between the target member and the UAS is 2 to 3 m. In addition, the JPEG format and RAW data were simultaneously stored on the high-speed SD memory card in order to improve the quality of the image in the future. For mapping and localization, the Robot Operating System (ROS) read the 3D point cloud map obtained from the preliminary flight with a 3D LiDAR. In addition, 3D path designation is performed considering the size of the UAS and obstacles. Finally, the flight preparation is completed after the inspection path is transmitted to the mini PC mounted on the UAS through the LTE network. The main flight proceeds according to the UAV location estimation technique mentioned in Section 2.2 and the optimal path set in advance. Figure 9 shows the UAV trajectory in the field test. Based on the 3D point cloud map, it can be confirmed that the UAV flight along the pre-considered waypoint in Figure 9a. In general, the lower part of the deck on a bridge is not well received by GPS. This can be confirmed through the red line in Figure 9b. Nevertheless, the reason why the UAV was able to fly under the deck stably was that the location of the UAV was estimated using SLAM technology. Figure 9b shows the trajectory comparison with raw GPS and estimated location using the SLAM under the deck slab of the D bridge. In the area where GPS is well received, the results of GPS raw data and SLAM-based location estimation are similar, and the error is small even with the pre-made graph construction. However, since GPS shading occurs under the bridge, the red line, which is the result of GPS mapping, appears to deviate from the flight path, and the blue line, indicating the location estimation result, shows the stable position of the UAV on the flight path.
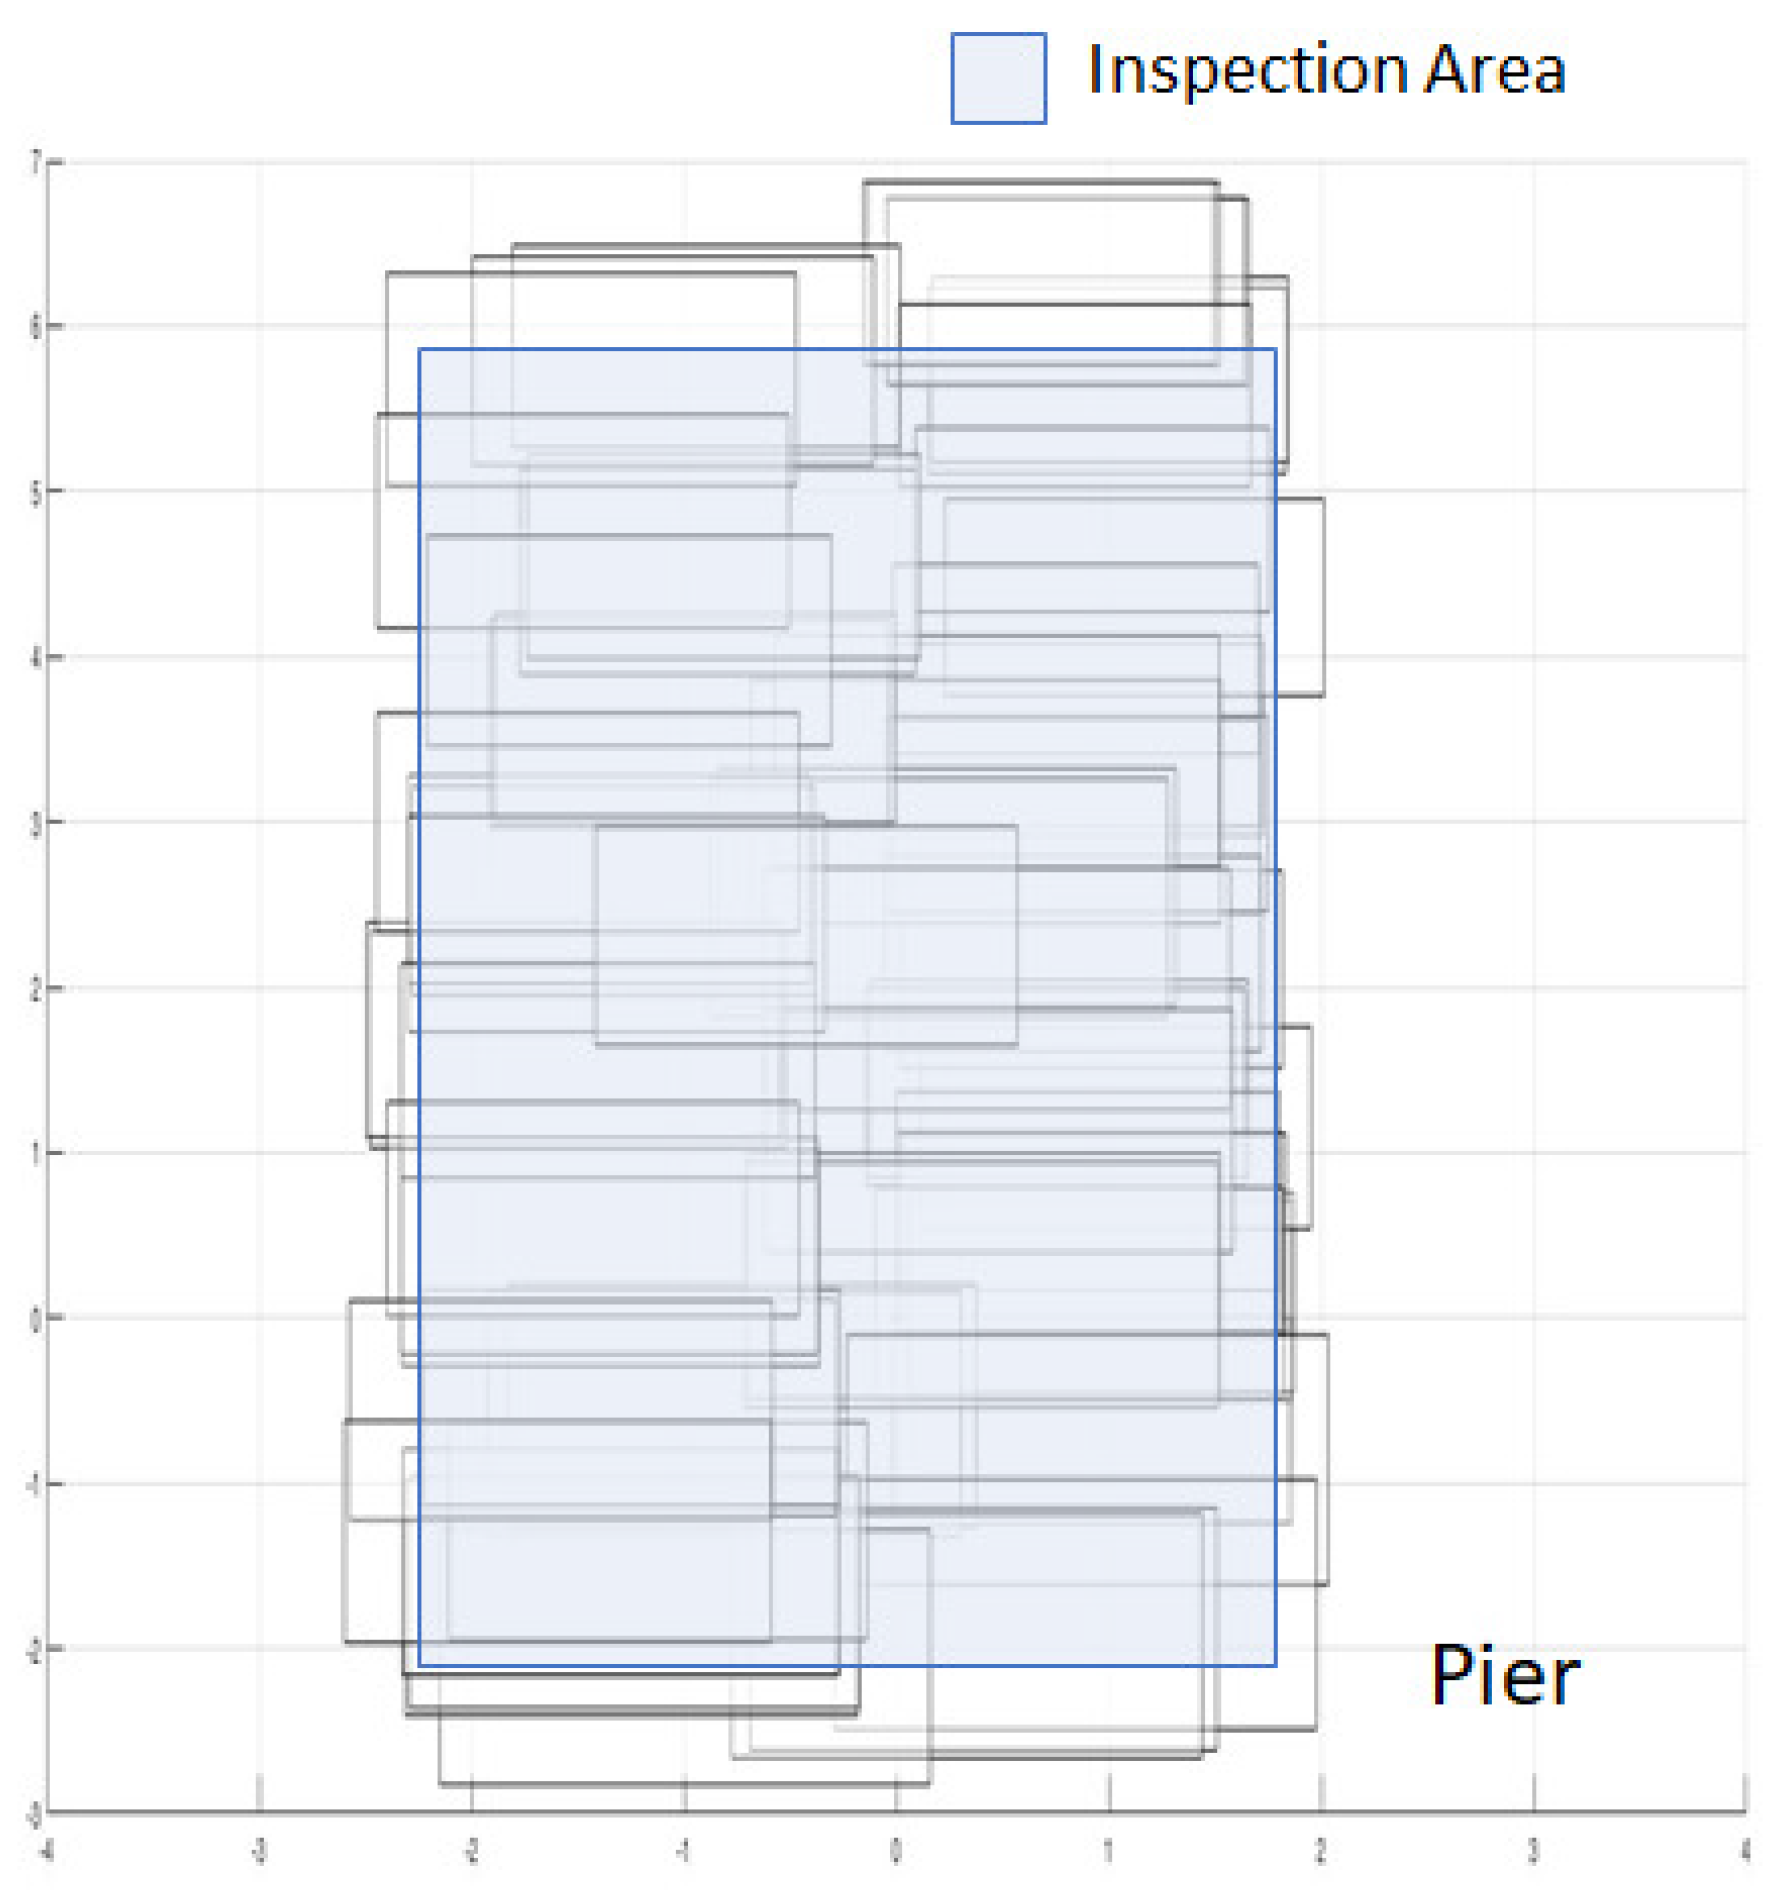
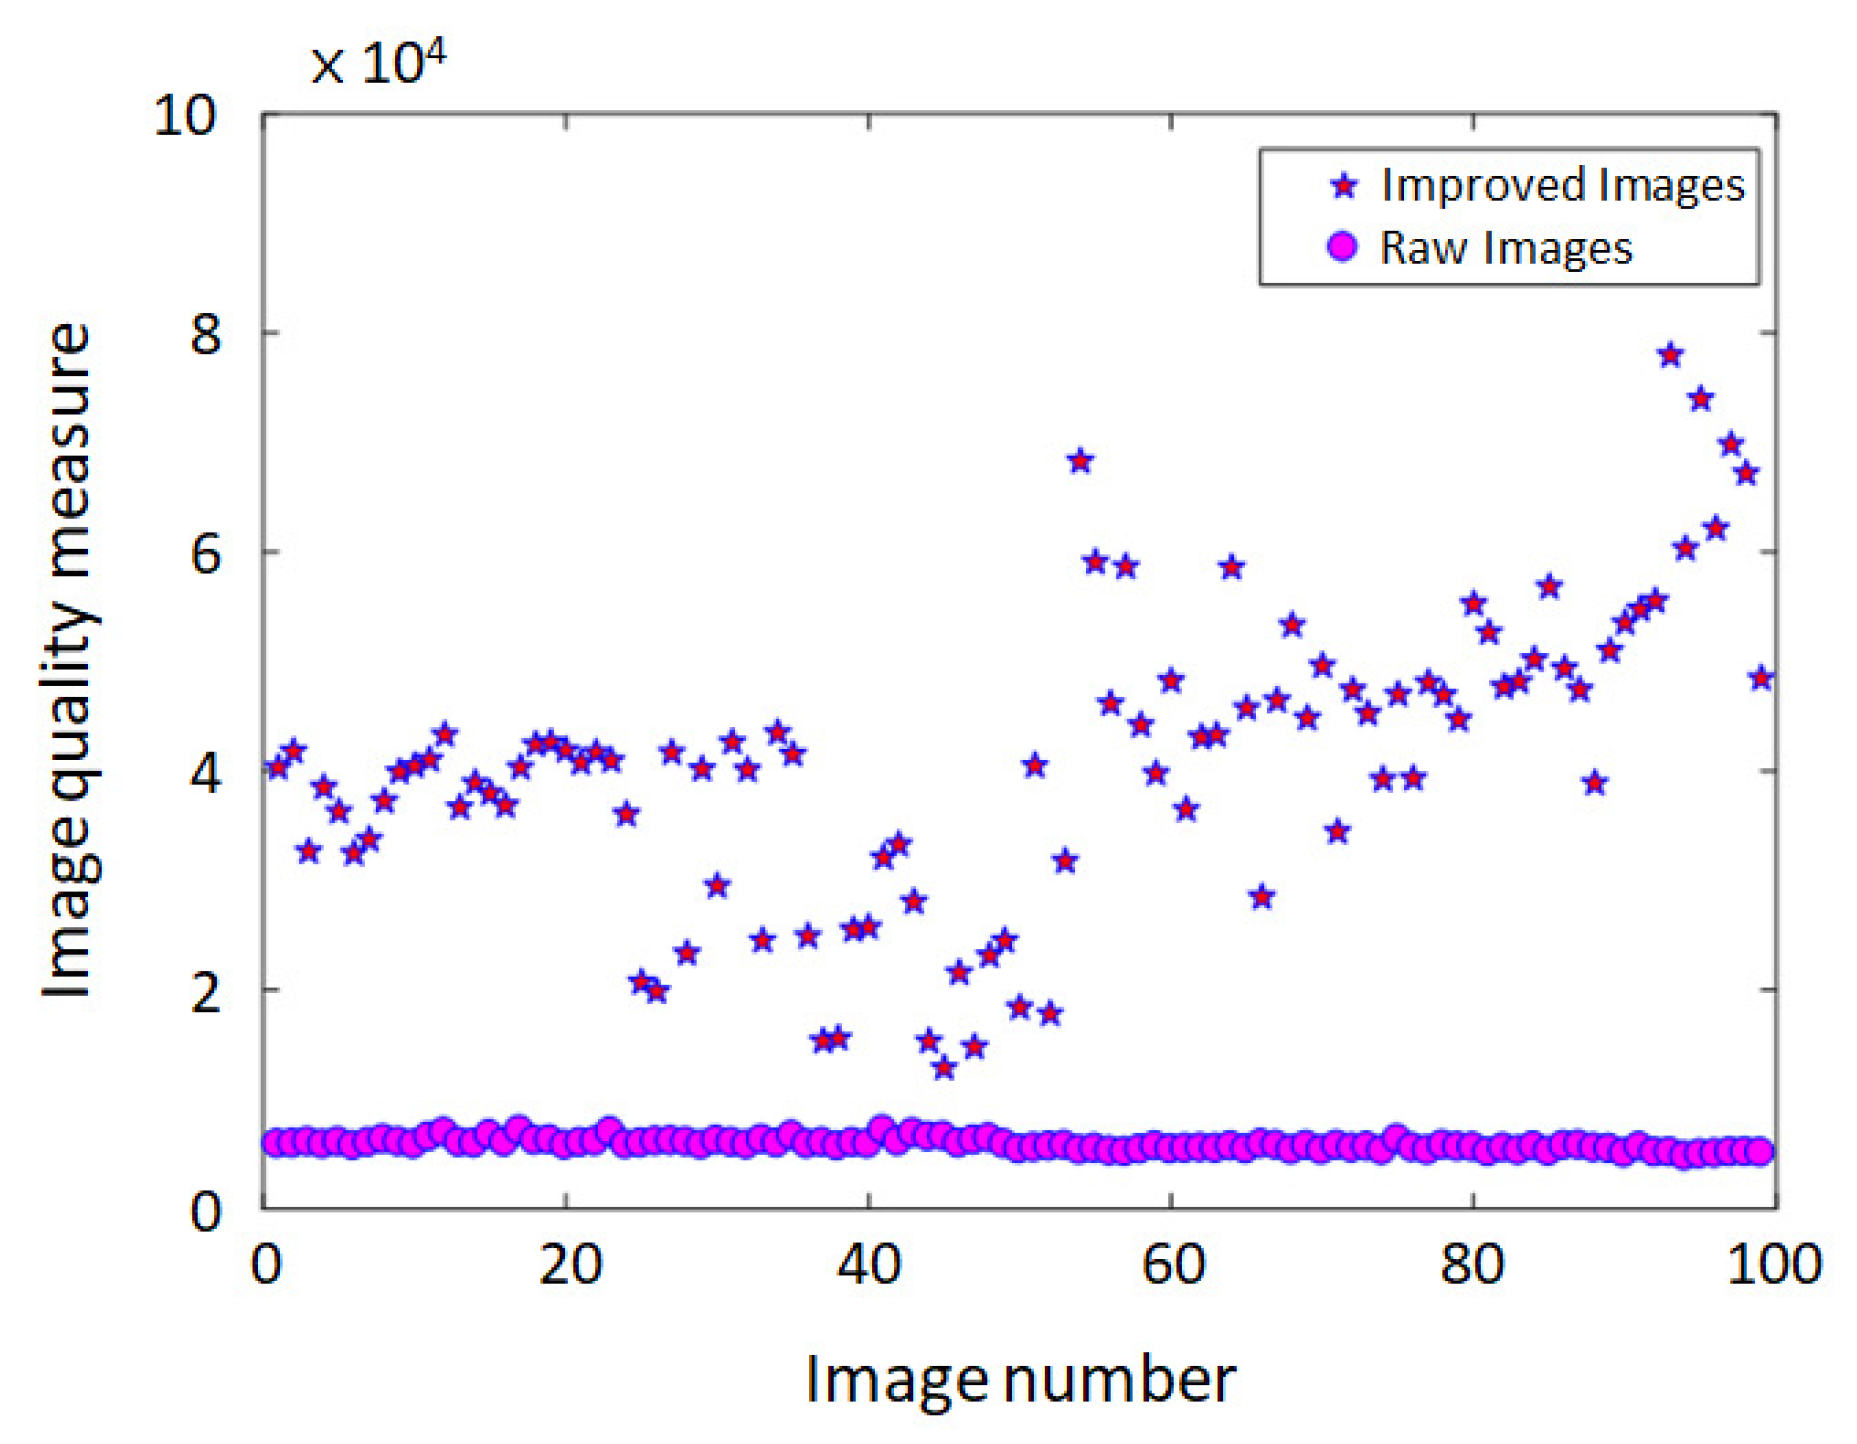
As a final phase of the main inspection phase, the missing area detection and image quality assessment mentioned in Section 2.3 were performed on-site. In most bridge inspection studies with UAS, this step is not considered. After returning from the field, if a missing area or low-quality image is found in the critical inspection area, a proper evaluation cannot be performed and the experiment must be repeated. Therefore, it is necessary to carry out the corresponding process on-site. In the experiment, considering the stable flight speed of the UAV, the frame per second (FPS) of the camera was set to 10, and the overlap rate between frames was 50%. Figure 10 shows the result of missing area detection using 270 images for the front side of the pier. By performing missing area detection based on image coordinate estimation at the field of the bridge, it was confirmed that UAS-based bridge inspection covered the target inspection area. If the missing area is detected, the supplementary inspection is performed by additional flying to cover the inspection range. Then, the image quality assessment is conducted for the improved images using IPTs. Figure 11 shows the image quality assessment results for 100 images acquired through UAS. Image enhancements in this step took into account motion blur, illumination, and noise, which frequently occur in UAS-based bridge inspection images. As a result of using the basic image processing algorithm, it was confirmed that the image was improved by three times or more compared to the original images. However, some images do not appear to have improved much because the image quality evaluation index developed in this study is related to motion blur affected by the vibrations of the UAS. In the image quality index, it was not possible to confirm the improvement of the image quality, but it was confirmed that the quality was improved by visually checking these images. These results demonstrate the need to diversify the index when evaluating the quality of images acquired from UAS.
After securing data for damage detection and bridge condition evaluation on-site, the post-inspection phase is carried out. This step is carried out in the office and consists of image quality improvement, automatic damage detection, damage expression and management, and bridge condition grading. First, an image processing algorithm is used to improve the quality of an image that has received an appropriate score in the image quality evaluation step, and deep learning-based automatic damage detection was performed to detect and quantify damage on the bridge surface. As mentioned in Section 2 for damage detection, six damage classes were considered for concrete and five damage classes for steel. However, no special damage other than small corrosion was found in the steel box span considered in this study. This is a result of strict standards and management for damage to steel box bridges in Korea, but in the case of steel, it is difficult to detect because the cracks appear bright and shiny as the cracks are filled with microcracks [37]. Therefore, it is very difficult to detect cracks in the steel box even with a visual inspection, so special equipment is used. This paper deals with PSC girders and piers as they compare visual inspections and UAV-based inspections. In this study, two deep learning algorithms were used to detect surface damage. First, Faster R-CNN was used to check the extent of two-way cracks and damage. Since this method represents a box for the detected object, the area for the range can be calculated. Another method used Mask R-CNN to detect damage. In this method, the detected object is displayed in masked form, and the corresponding pixel can be counted. Based on the information about the coordinates and pixel size of the image in Step 6, you can determine the number of pixels for the width and length of the damage in the masked damage. Thus, the detected damage can be quantified in mm. In this study, RoI was considered to detect a crack width of 200 mm, and the pixel size was obtained according to the distance between the UAS and the target structure. In this study, various types of damage that can occur in bridges were found by learning and it was confirmed that it can detect even the smallest damage well.

4. Validation and Discussions

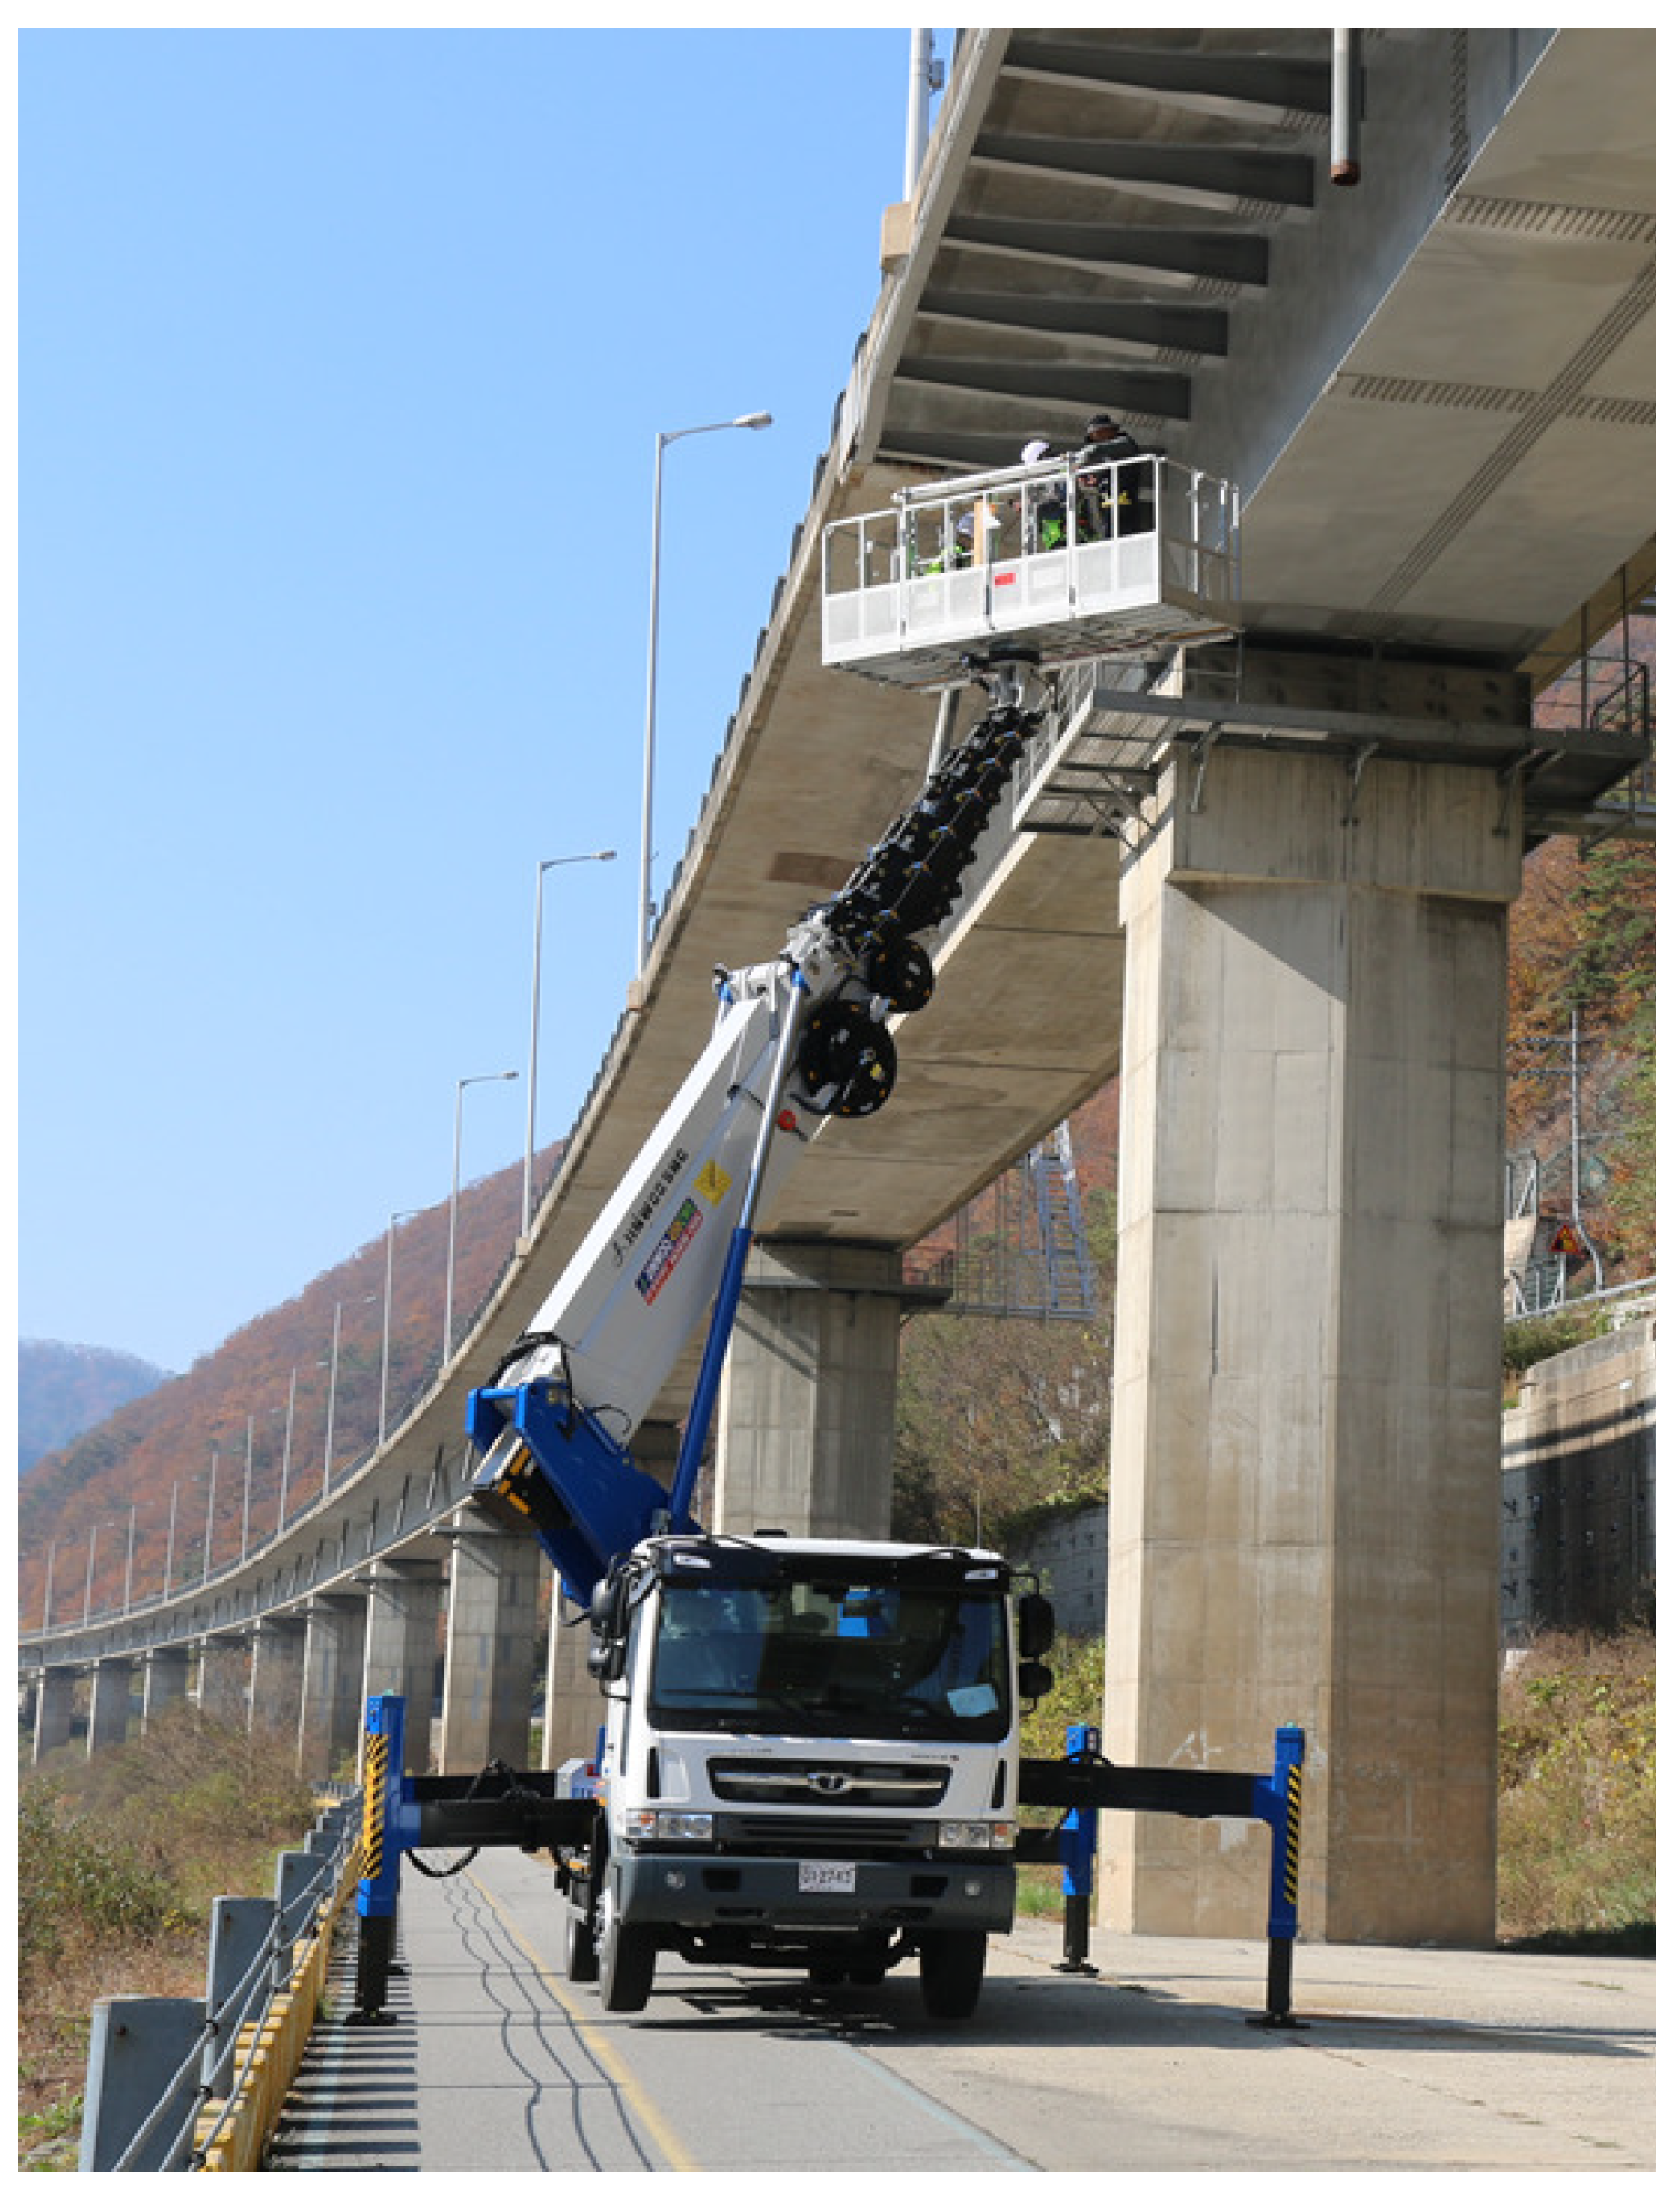
In order to perform the UAS-based inspection and the manpower-based appearance inspection on the target bridge, the manpower-based inspection was performed with a ladder truck as shown in Figure 12. The manpower inspection consisted of a ladder truck driver and two bridge inspection experts, and the bridge inspection was performed through visual inspection. In addition, the inspection of the UAS-based bridge was performed by a UAS pilot and co-pilot.
For comparison of the two inspection methods, an experiment was performed on the same member, and the area where the railing structure was installed above the pier was excluded from the inspection for safety reasons. Figure 13 and Figure 14 show examples of human-based visual inspection and UAS-based bridge inspection results for concrete piers and steel box spans, respectively. In the figure, the gray area indicates the inspection exclusion area, the green box indicates the damage that matches the human inspection result, and the blue box indicates the damage that was not found by the human inspection but was additionally detected by the UAS-based bridge inspection. As a result, the UAS-based inspection results found all damage detected through the human-based visual inspection results, and efflorescences were additionally detected. The reason for the additional detection of efflorescence was that the color of the concrete surface was changed and efflorescence was in progress, which was confirmed by bridge inspection experts. This shows that damage progress can be detected through UAS-based bridge inspection. In addition, it can be confirmed that the detailed shape of the crack, which was difficult to express specifically with the conventional visual inspection method, can be expressed as shown in Figure 13. In this study, the objective of this study was to quantify the 0.3mm crack corresponding to the C grade in the relative evaluation grade of the concrete bridge. This requires keeping the UAS close to the structure, which results in a small field of view (FOV). Therefore, it is difficult to confirm the shape of a long crack with only one image. Moreover, extracting feature points from multiple images and stitching them is not easy. In this study, to solve this problem, the damage was connected using the coordinates of the four vertices of the image. In the results of the UAS-based check-in Figure 13, the inset represents the results of this check. In steel box girder, corrosion of steel and bolts, painting peeling, and steel member deformation were detected as shown in Figure 14. However, since the steel member deformation was not included in the damage detection range in this study, it was not confirmed in the UAS-based bridge inspection results. In the results, both inspection methods did not detect cracks in the steel bridge. If a crack is found in the steel bridge, it is judged to have a significant structural defect and cannot be serviced. For this reason, most steel bridges in service are practically free of cracks. However, even if there are cracks, it will be difficult to detect fine cracks using general vision-based object detection. In addition, the steel member is coated by paint, so it is impossible to detect the cracks inside. To solve this problem, an attached-type UAV equipped with a laser module and a thermal imaging camera was developed and applied to apply active-thermography in this project. However, the results of these techniques are omitted because an attached-type UAS is not the scope of this paper.
In the results of the damage map, the damage to the steel box girder and the concrete span did not significantly affect the bridge damage grade. Therefore, only the damage detected in the pier was quantified and shown in Table 2. In the table, the same damage as the result of the manpower test is indicated by the same number as in Figure 13, and the damage additionally detected in the UAS test is indicated by an alphabet, and the width (mm) and length (mm) of the crack were denoted by cw and L, respectively. As can be seen in the table, the human-based visual inspection result has a rough value up to the first decimal place. However, UAS-based crack inspection results have more detailed values compared to human inspection. Additionally, UAS-based bridge inspections revealed four more damages (i.e., ⓐ, ⓑ, ⓒ, and ⓓ) more than the visual inspection for the same pier. One additional crack was found at the bottom of the pier, and the other three efflorescences were detected. Among them, efflorescence was calculated by multiplying the number of pixels and the size of the detected mask because it is calculated as the area (A, m) of damage corresponding to the evaluation of the bridge condition. In addition, the reason for the detection of efflorescence was confirmed to be due to the occurrence of discoloration on the concrete surface as mentioned above. However, efflorescence was confirmed by a bridge inspection expert, and it shows that maintenance can be performed in advance using the proposed damage detection method, although further studies may be needed. Other PSC girders, deck slabs and piers appeared similar to those shown in the damage maps and Table 2.
Finally, bridge condition assessment was performed targeting the area shown in Figure 6. The PSC girder is between piers 29 and 30, and the steel girder is between piers 30 and 31. Table 3 shows the bridge condition grade determined based on the results of the damage map for the target bridges. The PSC girder was graded as C due to cracks exceeding 0.3 mm, and the steel girder was graded as B due to corrosion and paint loss area, and the width of the cracks identified in the three piers including pier 31 showing the damage map in Figure 13 was 0.3 mm or less. Nevertheless, pier 30 and pier 31 were graded C because the surface damage area was between 2–10% as shown in Figure 5. In order to determine the bridge condition grade in the bridge maintenance manual and regulations, the durability evaluation of the structure should be included in South Korea. Therefore, it is difficult for UAS-based bridge inspection results to replace the existing manpower-based bridge maintenance system. However, it can replace visual inspection and is expected to be able to efficiently perform bridge inspection.

5. Conclusions

This paper compared the results of the UAS-based bridge inspection and the manpower-based inspection through the test bed. To this end, in consideration of the existing bridge inspection procedures, field tests and performance evaluations were performed in accordance with the UAS-based bridge inspection detailed procedures. As UAS-based bridge inspection received a lot of attention, many studies on key technologies have been conducted, but studies that performed the entire bridge inspection procedure are lacking, so this study has contributed. The bridge inspection procedure was roughly divided into pre-inspection, main inspection, and post-inspection, and detailed steps were considered for each phase. In the pre-inspection phase, necessary information for bridge inspection was secured and preparations were made for flight. In the main inspection phase, images of the bridge surface were collected using UAS, image coordinate estimation, missing area detection, and image quality evaluation were performed. Finally, in the post-inspection phase, image quality improvement, deep learning-based damage detection, and damage quantification were performed. Moreover, U-BMS was developed to visualize, store and manage the damage data obtained from the test. Finally, a bridge condition assessment was performed based on the results of the UAS-based bridge inspection. The UAS was developed to perform inspections in the GPS shadow area of the bridge, and stability was secured through position and posture estimation technology. In this study, manpower-based bridge inspection was performed using bridge inspection experts to verify and compare the results of UAS-based bridge inspection. As a result, the UAS-based test was able to quantify the damage with more accurate values compared to the human-based inspection, and it was possible to detect the early stage of the damage process. Due to this difference, some of the piers considered in this study had different bridge condition grades. As a result of performing an actual measurement to evaluate the difference between the two results, it was confirmed that the UAS-based bridge inspection has feasibility. However, bridge inspection and management are different, and it is difficult to determine the durability evaluation of a bridge with UAS. However, UAS-based bridge inspection is expected to be complementary to each other because it is fast, cost-effective, and enables objective damage detection.

Author Contributions

Conceptualization, I.-H.K. and H.-J.J.; methodology, I.-H.K.; software, S.Y., S.C. and S.J.; validation, I.-H.K. and S.J.; formal analysis, J.H.L.; investigation, I.-H.K., J.H.L. and S.J.; data curation, S.J.; writing—original draft preparation, I.-H.K.; writing—review and editing, H.-J.J.; visualization, I.-H.K.; supervision, H.-J.J.; project administration, I.-H.K. and H.-J.J.; funding acquisition, I.-H.K. and H.-J.J. All authors have read and agreed to the published version of the manuscript.

Funding

This research was supported by Basic Science Research Program through the National Research Foundation (NRF) funded by the Ministry of Education (No. NRF-2020R1I1A1A01073676), was supported by a grant (22CTAP-C164155-02) from Technology Advancement Research Program (TARP) funded by Ministry of Land, Infrastructure and Transport (MOLIT) and was supported by a grant (18SCIP-C116873-03) from Construction Technology Research Program funded by Ministry of Land, Infrastructure and Transport (MOLIT).

Data Availability Statement

Not applicable.

Conflicts of Interest

The authors declare no conflict of interest.

References

  1. MAP-21: Moving Ahead for Progress in the 21th Century. Available online: https://www.fhwa.dot.gov/map21/ (accessed on 14 June 2021).
  2. Fixing America’s Surface Transportation Act. Available online: https://en.wikipedia.org/wiki/Fixing_America%27s_Surface_Transportation_Act (accessed on 14 June 2021).
  3. Yoshimatsu, H. Japan’s export of infrastructure systems: Pursuing twin goals through developmental means. Pac. Rev. 2017, 30, 494–512. [Google Scholar] [CrossRef]
  4. Stewart, J. The uk national infrastructure plan 2010. Eur. Invest. Bank 2010, 15, 28–32. [Google Scholar]
  5. Walther, C.; Monse, J.; Haßheider, H. Revision of project evaluation as part of the german federal transport infrastructure plan. Trans. Res. Proc. 2015, 8, 41–49. [Google Scholar] [CrossRef] [Green Version]
  6. Canny, J. A computational approach to edge detection. IEEE Trans. Patt. Anal. Mach. Intel. 1986, 8, 679–714. [Google Scholar] [CrossRef]
  7. Ziou, D.; Tabbone, S. Edge detection techniques: An overview. Int. J. Pattern Recognit. Image Anal. 1998, 8, 537–559. [Google Scholar]
  8. Abdel-Qader, I.; Abudayyeh, O.; Kelly, M. Analysis of edge-detection techniques for crack identification in bridges. J. Comput. Civ. Eng. 2003, 17, 255–263. [Google Scholar] [CrossRef] [Green Version]
  9. Hutchinson, T.; Chen, Z. Improved image analysis for evaluating concrete damage. J. Comp. Civ. Eng. 2006, 20, 210–216. [Google Scholar] [CrossRef]
  10. Nguyen, H.; Kam, T.; Cheng, P. An automatic approach for accurate edge detection of concrete crack utilizing 2d geometric features of crack. J. Sign. Process Syst. 2014, 77, 221–240. [Google Scholar] [CrossRef]
  11. Cha, Y.; Choi, W.; Büyüköztürk, O. Deep learning-based crack damage detection using convolutional neural networks. Comput.-Aided Civ. Infrastruct. Eng. 2017, 32, 361–378. [Google Scholar] [CrossRef]
  12. Zhang, L.; Yang, F.; Zhang, Y.; Zhu, Y. Road crack detection using deep convolutional neural network. In Proceedings of the 2016 IEEE International Conference on Image Processing (ICIP), Phoenix, AZ, USA, 25–28 September 2016; pp. 3708–3712. [Google Scholar]
  13. Girshick, R.; Donahue, J.; Darrell, T.; Malik, J. Rich feature hierarchies for accurate object detection and semantic segmentation. In Proceedings of the 2014 IEEE Conference on Computer Vision and Pattern Recognition (CVPR14), Columbus, OH, USA, 23–28 June 2014; pp. 580–587. [Google Scholar]
  14. Cha, Y.; Choi, W.; Suh, G.; Mahmoudkhani, S.; Büyüköztürk, O. Autonomous structural visual inspection using region-based deep learning for detecting multiple damage types. Comput.-Aided Civ. Infrastruct. Eng. 2018, 33, 9–11. [Google Scholar] [CrossRef]
  15. Gao, Y.; Mosalam, K. Deep transfer learning for image-based structural damage recognition. Comput.-Aided Civ. Infrastruct. Eng. 2018, 33, 372–388. [Google Scholar] [CrossRef]
  16. Yu, Y.; Rashidi, M.; Samali, B.; Yousefi, A.M.; Wang, W. Multi-Image-Feature-Based Hierarchical Concrete Crack Identification Framework Using Optimized SVM Multi-Classifiers and D–S Fusion Algorithm for Bridge Structures. Remote Sens. 2021, 13, 240. [Google Scholar] [CrossRef]
  17. Kim, B.; Cho, S. Image-based concrete crack assessment using mask and region-based convolutional neural network. Struct. Control. Health Monit. 2019, 26, e2381. [Google Scholar] [CrossRef]
  18. Chen, S.; Laefer, D.; Mangina, E.; Zolanvari, S.; Byrne, J. Uav bridge inspection through evaluated 3d reconstructions. J. Brid. Eng. 2019, 24, 05019001. [Google Scholar] [CrossRef] [Green Version]
  19. Kim, H.; Lee, J.; Ahn, E.; Cho, S.; Shin, M.; Sim, S. Concrete crack identification using a uav incorporating hybrid image processing. Sensors 2017, 17, 2052. [Google Scholar] [CrossRef] [PubMed] [Green Version]
  20. Lovelace, B.; Zink, J. Unmanned Aerial Vehicle Bridge Inspection Demonstration Project; Research Project, Final Report; Office of Bridges & Structures: Oakdale, MN, USA, 2015; p. 40.
  21. Moller, S. Caltrans Bridge Inspection Aerial Robot (No. CA 08-0182); Research Project, Final Report; Califonia Department of Transportation Division of Research and Innovation: Sacramento, CA, USA, 2008.
  22. Otero, L.; Gagliardo, N.; Dalli, D.; Huang, W.; Cosentino, P. Proof of Concept for Using Unmanned Aerial Vehicles for High Mast Pole and Bridge Inspections (No. BDV28-977-02); Research Project, Final Report; Florida Department of Transportation Research Center: Tallahassee, FL, USA, 2015.
  23. Kim, I.; Jeon, H.; Baek, S.; Hong, W.; Jung, H. Application of crack identification techniques for an aging concrete bridge inspection using an unmanned aerial vehicle. Sensors 2018, 18, 1881. [Google Scholar] [CrossRef] [PubMed] [Green Version]
  24. Jung, H.; Lee, J.; Yoon, S.; Kim, I. Bridge inspection and condition assessment using unmanned aerial vehicles (uavs): Major challenges and solutions from a practical perspective. Smart Struct. Syst. 2019, 24, 669–681. [Google Scholar]
  25. Duque, L. Uav-Based Bridge Inspection and Computational Simulations. Master’s Thesis, South Dakota State University, Brookings, SD, USA, 2017. [Google Scholar]
  26. Morgenthal, G.; Hallermann, N.; Kersten, J.; Taraben, J.; Debus, P.; Helmrich, M.; Redehorst, V. Framework for automated uas-based structural condition assessment of bridges. Automat. Constr. 2019, 97, 77–95. [Google Scholar] [CrossRef]
  27. Sacks, R.; Kedar, A.; Borrmann, A.; Ma, L.; Brilakis, I.; Huthwohl, P.; Daum, S.; Kattel, U.; Yosef, R.; Liebich, T.; et al. Seebridge as next generation bridge inspection: Overview, information dilivery manual and model view definition. Automat. Constr. 2018, 90, 134–145. [Google Scholar] [CrossRef] [Green Version]
  28. Yoon, S.; Gwon, G.; Lee, J.; Jung, H. Three-dimensional image coordinate-based missing region of interest area detection and damage localization for bridge visual inspection using unmanned aerial vehicles. Struct. Health Monit. 2020, 20, 1462–1475. [Google Scholar] [CrossRef]
  29. Feroz, S.; Dabous, S.A. UAV-Based Remote Sensing Applications for Bridge Condition Assessment. Remote Sens. 2021, 13, 1809. [Google Scholar] [CrossRef]
  30. Yu, H.; Yang, W.; Zhang, H.; He, W. A uav-based crack inspection system for concrete bridge monitoring. In Proceedings of the 2017 IEEE International Geoscience and Remote Sensing Symposium (IGARSS), Fort Worth, TX, USA, 23–28 July 2017; pp. 3305–3308. [Google Scholar]
  31. Dorafshan, S.; Maguire, M.; Hoffer, N.V.; Coopmans, C.A. Challenges in bridge inspection using small unmanned aerial systems: Results and lessons learned. In Proceedings of the 2017 International Conference on Unmanned Aircraft Systems (ICUAS), Miami, FL, USA, 13–16 June 2017; pp. 1722–1730. [Google Scholar]
  32. Jung, S.; Choi, D.; Song, S.; Myung, H. Bridge inspection using unmanned aerial vehicle based on HG-SLAM: Hierarchical Graph-based SLAM. Remote Sens. 2020, 12, 3022. [Google Scholar] [CrossRef]
  33. Song, S.; Jung, S.; Kim, H.; Myung, H. A method for mapping and localization of quadrotors for inspection under bridges using camera and 3d-lidar. In Proceedings of the 7th Asia-Pacific Workshop on Structural Health Monitoring, Hong Kong, China, 12–15 November 2018. [Google Scholar]
  34. He, K.; Gkioxari, G.; Dollár, P.; Girshick, R. Mask R-CNN. In Proceedings of the International Conference on Computer Vision ICCV 2017, Venice, Italy, 22–29 October 2017; pp. 2961–2969. [Google Scholar]
  35. Ren, S.; He, K.; Girshick, R.; Sun, J. Faster R-CNN: Towards real-time object detection with region proposal networks. arXiv 2015, arXiv:1506.01497. [Google Scholar] [CrossRef]
  36. Oh, B.; Shin, K.; Kim, K.; Kim, J.; Lee, S. Improved criteria for condition assessment of bridges based on visual inspection. J. Korea Inst. Struct. Maint. Insp. 2001, 5, 205–213. [Google Scholar]
  37. Stress Corrosion Cracking. Available online: https://en.wikipedia.org/wiki/Stress_corrosion_cracking (accessed on 28 June 2021).
Figure 1. UAS-based bridge inspection procedure: (Step No.) indicates U-BMS utilization.
Drones 06 00355 g001
Figure 2. Developed UAS for bridge inspection (a) Front View (b) Rear View.
Drones 06 00355 g002
Figure 3. The schematic of the estimation method of image coordinates.
Drones 06 00355 g003
Figure 4. Deep learning-based damage detection.
Drones 06 00355 g004
Figure 5. Bridge condition assessment.
Drones 06 00355 g005
Figure 6. Inspection bridge.
Drones 06 00355 g006
Figure 7. Task definition on the U-BMS (re-produced image due to language).
Drones 06 00355 g007
Figure 8. Point cloud-based 3D modeling for target bridge.
Drones 06 00355 g008
Figure 9. UAV trajectory in field test (a) Flight trajectory along pre-considered waypoints (b) UAV trajectory comparison.
Drones 06 00355 g009
Figure 10. Missing area detection for the pier.
Drones 06 00355 g010
Figure 11. Image quality assessment of measured images.
Drones 06 00355 g011
Figure 12. Bridge inspection comparison experiment.
Drones 06 00355 g012
Figure 13. Comparison results in case of the pier (P-31).
Drones 06 00355 g013
Figure 14. Comparison results in the case of the steel box girder.
Drones 06 00355 g014
Table 1. Criteria for classification of bridge condition by domestic and foreign institutions.
CountryBridge Condition Classification
KoreaA, B, C, D, E
FHWA (USA)N, 0∼9
FranceA∼F
PWRI (Japan)I, II, III, IV, OK
Canada1∼6
Australia1∼4
Table 2. Damage quantification of the pier.
Manpower-Based InspectionUAS-Based Inspection
IDQuantificationIDQuantification
cw = 0.3 mm, L = 2000 mmcw = 0.26 mm, L = 916.5 mm
cw = 0.3 mm, L = 3000 mmcw = 0.29 mm, L = 2602.8 mm
cw = 0.3 mm, L = 4000 mmcw = 0.29 mm, L = 749.1 mm
cw = 0.3 mm, L = 500 mmcw = 0.29 mm, L = 3694.6 mm
cw = 0.3 mm, L = 1000 mmcw = 0.27 mm, L = 898.1 mm
cw = 0.2 mm, L = 1500 mmcw = 0.27 mm, L = 2011.8 mm
cw = 0.2 mm, L = 1000 mmcw = 0.29 mm, L = 1064.9 mm
cw = 0.3 mm, L = 1000 mmcw = 0.28 mm, L = 2893.5 mm
A = 0.2 m2
A = 0.8 m2
A = 0.04 m2
A = 0.98 m2
Table 3. Bridge condition assessment.
Manpower-Based InspectionUAS-Based Inspection
MemberGradeMemberGrade
PSC GirderCPSC GirderC
Steel GirderBSteel GirderB
Pier 29BPier 29B
Pier 30BPier 30C
Pier 31BPier 31C
Publisher’s Note: MDPI stays neutral with regard to jurisdictional claims in published maps and institutional affiliations.