Article

Assessing the Temporal and Spatial Variability of Coffee Plantation Using RPA-Based RGB Imaging

by
Maurício Martello
1,*,
José Paulo Molin
1,
Graciele Angnes
2 and
Matheus Gabriel Acorsi
3
1
Laboratory of Precision Agriculture, Department of Biosystems Engineering, Luiz de Queiroz College of Agriculture, University of São Paulo, Piracicaba 13418-900, SP, Brazil
2
Laboratory of Systemic Management and Sustainability, Department of Biosystems Engineering, Luiz de Queiroz College of Agriculture, University of São Paulo, Piracicaba 13418-900, SP, Brazil
3
Department of Biosystems Engineering, “Luiz de Queiroz” College of Agriculture, University of São Paulo, 11 Pádua Dias Avenue, Piracicaba 13418-900, SP, Brazil
*
Author to whom correspondence should be addressed.
Drones 2022, 6(10), 267; https://doi.org/10.3390/drones6100267
Submission received: 29 July 2022 / Revised: 4 September 2022 / Accepted: 17 September 2022 / Published: 21 September 2022
(This article belongs to the Special Issue Yield Prediction Using Data from Unmanned Aerial Vehicles)

Abstract

:
The biophysical parameters of coffee plants can provide important information to guide crop management. An alternative to traditional methods of sparse hand measurements to obtain this type of information can be the 3D modeling of the coffee canopy using aerial images from RGB cameras attached to remotely piloted aircraft (RPA). This study aimed to explore the use of RGB aerial images to obtain 3D information of coffee crops, deriving plant height and volume information together with yield data during three growing seasons in a commercial production area of 10.24 ha, Minas Gerais state, Brazil. Seven data acquisition campaigns were conducted during the years 2019, 2020 and 2021. The flights were made at 70 m above ground level, with lateral and longitudinal overlaps of 75% and 80%, respectively. The images were processed, obtaining canopy surface models (CSMs) derived into plant height and volume data for each campaign. The results showed that it is possible to extract the plant height of coffee plants with an R2 of 0.86 and an RMSE of 0.4 m. It was possible to monitor the temporal variability of coffee plant height and volume based on aerial images and correlate this information with yield data. The results of the modeling analysis demonstrated the possibility of using these variables to help understand the spatial variability of coffee yield within the field.

1. Introduction

Remote sensing applications in agriculture have been trending over recent decades, providing rapid and efficient insights for crop scouting based on the study of the spectral responses of soil, water and vegetation [1]. Sensors can be attached on different platforms, classified as proximal, aerial and satellite-based according to their distance in relation to the target object [2]. Reflecting recent technology advances, the use of remotely piloted aircraft systems (RPA) gained significant attention in agriculture; this was established as an effective tool for small-scale remote sensing [3,4,5].
The use of RPA has been considered a promising tool with easy data acquisition abilities and a higher operational flexibility in relation to classical platforms, providing reliable data [5,6]. The application of remote sensing analysis coupled with aerial platforms data provides an efficient, rapid and non-destructive assessment through the spectral response of plants and its relationship with various environmental factors [7,8], mainly because the spectral patterns of a crop vary due to several factors, such as the development stage, vegetative vigor and management practices [9,10].
Several studies have explored the use of RPA with different on-board sensors for crop monitoring. The applications vary from identifying the appropriate time to harvest grapes [11], estimating the canopy height of olive trees [12], monitoring the growth of rice and barley crops [13,14], determining the spatial variability of water stress assessments in vineyards [15] and estimating the biomass production of maize [16].
Some of these studies explore the use of consumer-grade red-green-blue (RGB) cameras for aerial imaging, in which centimeter spatial resolution images are obtained and processed to generate digital elevation models [17,18]. Based on structure from motion (SfM) algorithms, RGB aerial images are processed, exploring photogrammetric methods specifically developed for RPA imagery, resulting in 3D point clouds that can represent crop canopy height [19]. According to Hoffmeister et al. [20], crop height information is generated by subtracting a digital terrain model (DTM) from a digital surface model (DSM). As crop height information has been successfully used as an estimate of plant biomass in many crops, several studies have explored the use of crop surface model (CSM) data derived from RGB imagery as a non-destructive method to assess crop biomass, with successful results for onion, barley, wheat and maize [6,10,18,19].
In coffee production, the use of aerial imagery to explore spatial and temporal variability is highlighted in studies developed by [21,22,23], in which biophysical variables of coffee plants were estimated using RGB imagery data. Cunha et al. [21] sought to estimate the biophysical variables of coffee plants in order to improve pesticide application efficiency. Multispectral images obtained by RPAs have been also used for coffee [24,25,26]; however, this was for exploring fruit ripeness monitoring.
As highlighted by [21,22], the height and volume of the canopy of coffee plants could be determined in a practical and precise way through the digital processing of images captured by RPA, indicating that the determination of these variables is fundamental, since they can be related to coffee plant responses, such as biomass reduction, water stress, the occurrence of pests and diseases, nutritional deficiencies, changes in chlorophyll content and, ultimately, crop yield.
Mapping the yield of coffee plantations with a high level of detail is still a great challenge, unlike other crops such as grains, for example, which already have relatively consolidated yield monitoring methods [27]. In this sense, exploring alternative methods that allow for the estimation of the yield of coffee areas is relevant for the sector, as the yield map is considered the most complete and valid information to visualize the variability of the crop [28].
Although some studies have shown the potential to estimate yield using models based on the height and canopy diameter of coffee trees [29,30], none of them explored the use of RGB images to estimate the height and volume of plants.
In addition, when RGB images obtained by RPA were explored, biophysical characteristics correlated with coffee plant response variables, such as yield, were not assessed. Moreover, most of the studies that contemplate the coffee culture do not consider the spatial variability with high-density yield data within a coffee field but rather the average differences between the fields, besides being limited to the comparison of point sampling within a field over a single growing season.
Therefore, the objective of this study was to analyze the potential of RGB imagery data acquired over three growing seasons to monitor the spatial and temporal variability of the height and volume of coffee crops and their relation with high-density yield data.

2. Materials and Methods

2.1. Study Area

The area is located in the municipality of Patos de Minas, state of Minas Gerais, Brazil (Figure 1a), in the Cerrado biome. The local climate is classified as Aw, according to the Köppen classification [31], characterized by a tropical environment with dry winters and rainy summers. The study was conducted in a commercial coffee area of 10.24 ha, cultivated with the species Coffea arabica L., IAC Catuaí 144 variety. The coffee trees were spaced by 0.5 m between plants and by 4.0 m between rows, resulting in a density of approximately 5000 plants ha−1, with a drip irrigation system. In total, 35 rows of coffee, each approximately 760 m in length, were evaluated.

2.2. RPA Flight and Image Acquisition

Seven campaigns were carried out between 2019 and 2021 (Table 1) to capture aerial images, providing datasets at different growth stages throughout multiple growing seasons. All flights were conducted close to solar noon with sunny and calm-wind weather conditions.
A DJI Phantom 4 Advanced quadcopter (DJI, Shenzhen, Guangdong, China) was used during the campaigns to capture RGB images. The built-in camera has a spectral resolution within the visible spectrum (350~700 nm—RGB), featuring a 12.8 × 9.6 mm CMOS sensor (Complementary Metal Oxide Semiconductor) controlled by a mechanical shutter, which produces images with up to 20 megapixels (5472 × 3648 pixels). The flight campaigns were planned using DroneDeploy mobile software (DroneDeploy Inc., San Francisco, CA, USA). All the flights were conducted at 70 m above ground level, with side and forward overlaps of 75 and 80%, respectively. The camera was set to capture images with 4864 × 3648 pixels (4:3 aspect ratio). The aforementioned settings provided a ground sample distance (GSD) of around 0.02 m, with over 400 images captured (Table 1). To ensure positional accuracy during the georeferencing procedures, 13 ground control points (GCPs) were previously installed in the field (wooden sticks) and remained in the field throughout the collection period, with their coordinates measured by a pair of RTK GNSS receivers (Topcon GR-3, 0.01 m accuracy, Topcon Corporation, Tokyo, Japan). Before each flight, the points were highlighted with an agricultural lime in the shape of an “X”, approximately 2 m in diameter, as shown in Figure 1b.

2.3. Canopy Surface Model Generation

To produce the digital elevation models (DEM), the RGB images obtained were processed using Agisoft PhotoScan software (Agisoft LLC, São Peterburgo, Russia), which features a structure from motion algorithm (SfM) for the 3D digital reconstruction of scenes [32]. The workflow consists of importing the images into the software to perform image alignment, followed by the GCPs insertion to optimize the previously obtained image alignment, which provided a positional accuracy (root mean squared error—RMSE) ranging from 0.01 to 0.03 m in the horizontal axis and from 0.03 to 0.05 m in the vertical axis. Furthermore, the dense cloud can be generated and derived into a mesh surface that represents the above surface structures (DSM). In order to obtain the digital terrain model (DTM), the dense cloud previously generated needs to be filtrated, maintaining only ground-level points [19]. To define appropriate parameters for the filtering process, an empirical approach was implemented, testing different combinations of maximum angle, maximum distance and cell size, observing the correspondence to the features overlayed on the orthomosaic. Thus, the following parameters were defined: maximum angle of 1.5°; maximum distance of 0.25 m; cell size of 3 m. The selected points were then interpolated and derived into a smoothed mesh surface obtained with a five-point threshold that represents the DTM. Both the DSM and DTM were exported as a TIFF file with a 0.03 m pixel−1 fixed spatial resolution. Figure 2 presents a flowchart of image processing.
Using map algebra (Equation (1)) between the DSM and the DTM, the so-called crop surface model (CSM) was obtained, which represents the plant height information [19].
CSM = DSM − DTM

2.4. Extraction of Plant Height and Plant Volume Information

Before extracting plant height information from CSMs, we first developed a process aiming to individualize each coffee tree using QGIS (QGIS Development Team) (Figure 3). The first step consisted of clipping portions of the CSM with values ≥ 0.2 m, generating a mask feature layer separating each coffee row. Furthermore, a transversal clip at every 0.5 m (assuming regular spacing between plants) was applied to the previously obtained mask layer in order to separate each coffee plant within the row. This way, each plant was individualized based on a polygon feature maintaining the variable width metrics of every tree. Based on the obtained mask feature, zonal statistics were obtained, calculating the maximum plant height, average plant height and area within each polygon representing individual trees. By multiplying the average plant height (PH) by the area, the plant volume (PV) of each tree was then obtained.

2.5. Validation of Plant Height Derived from CSMs

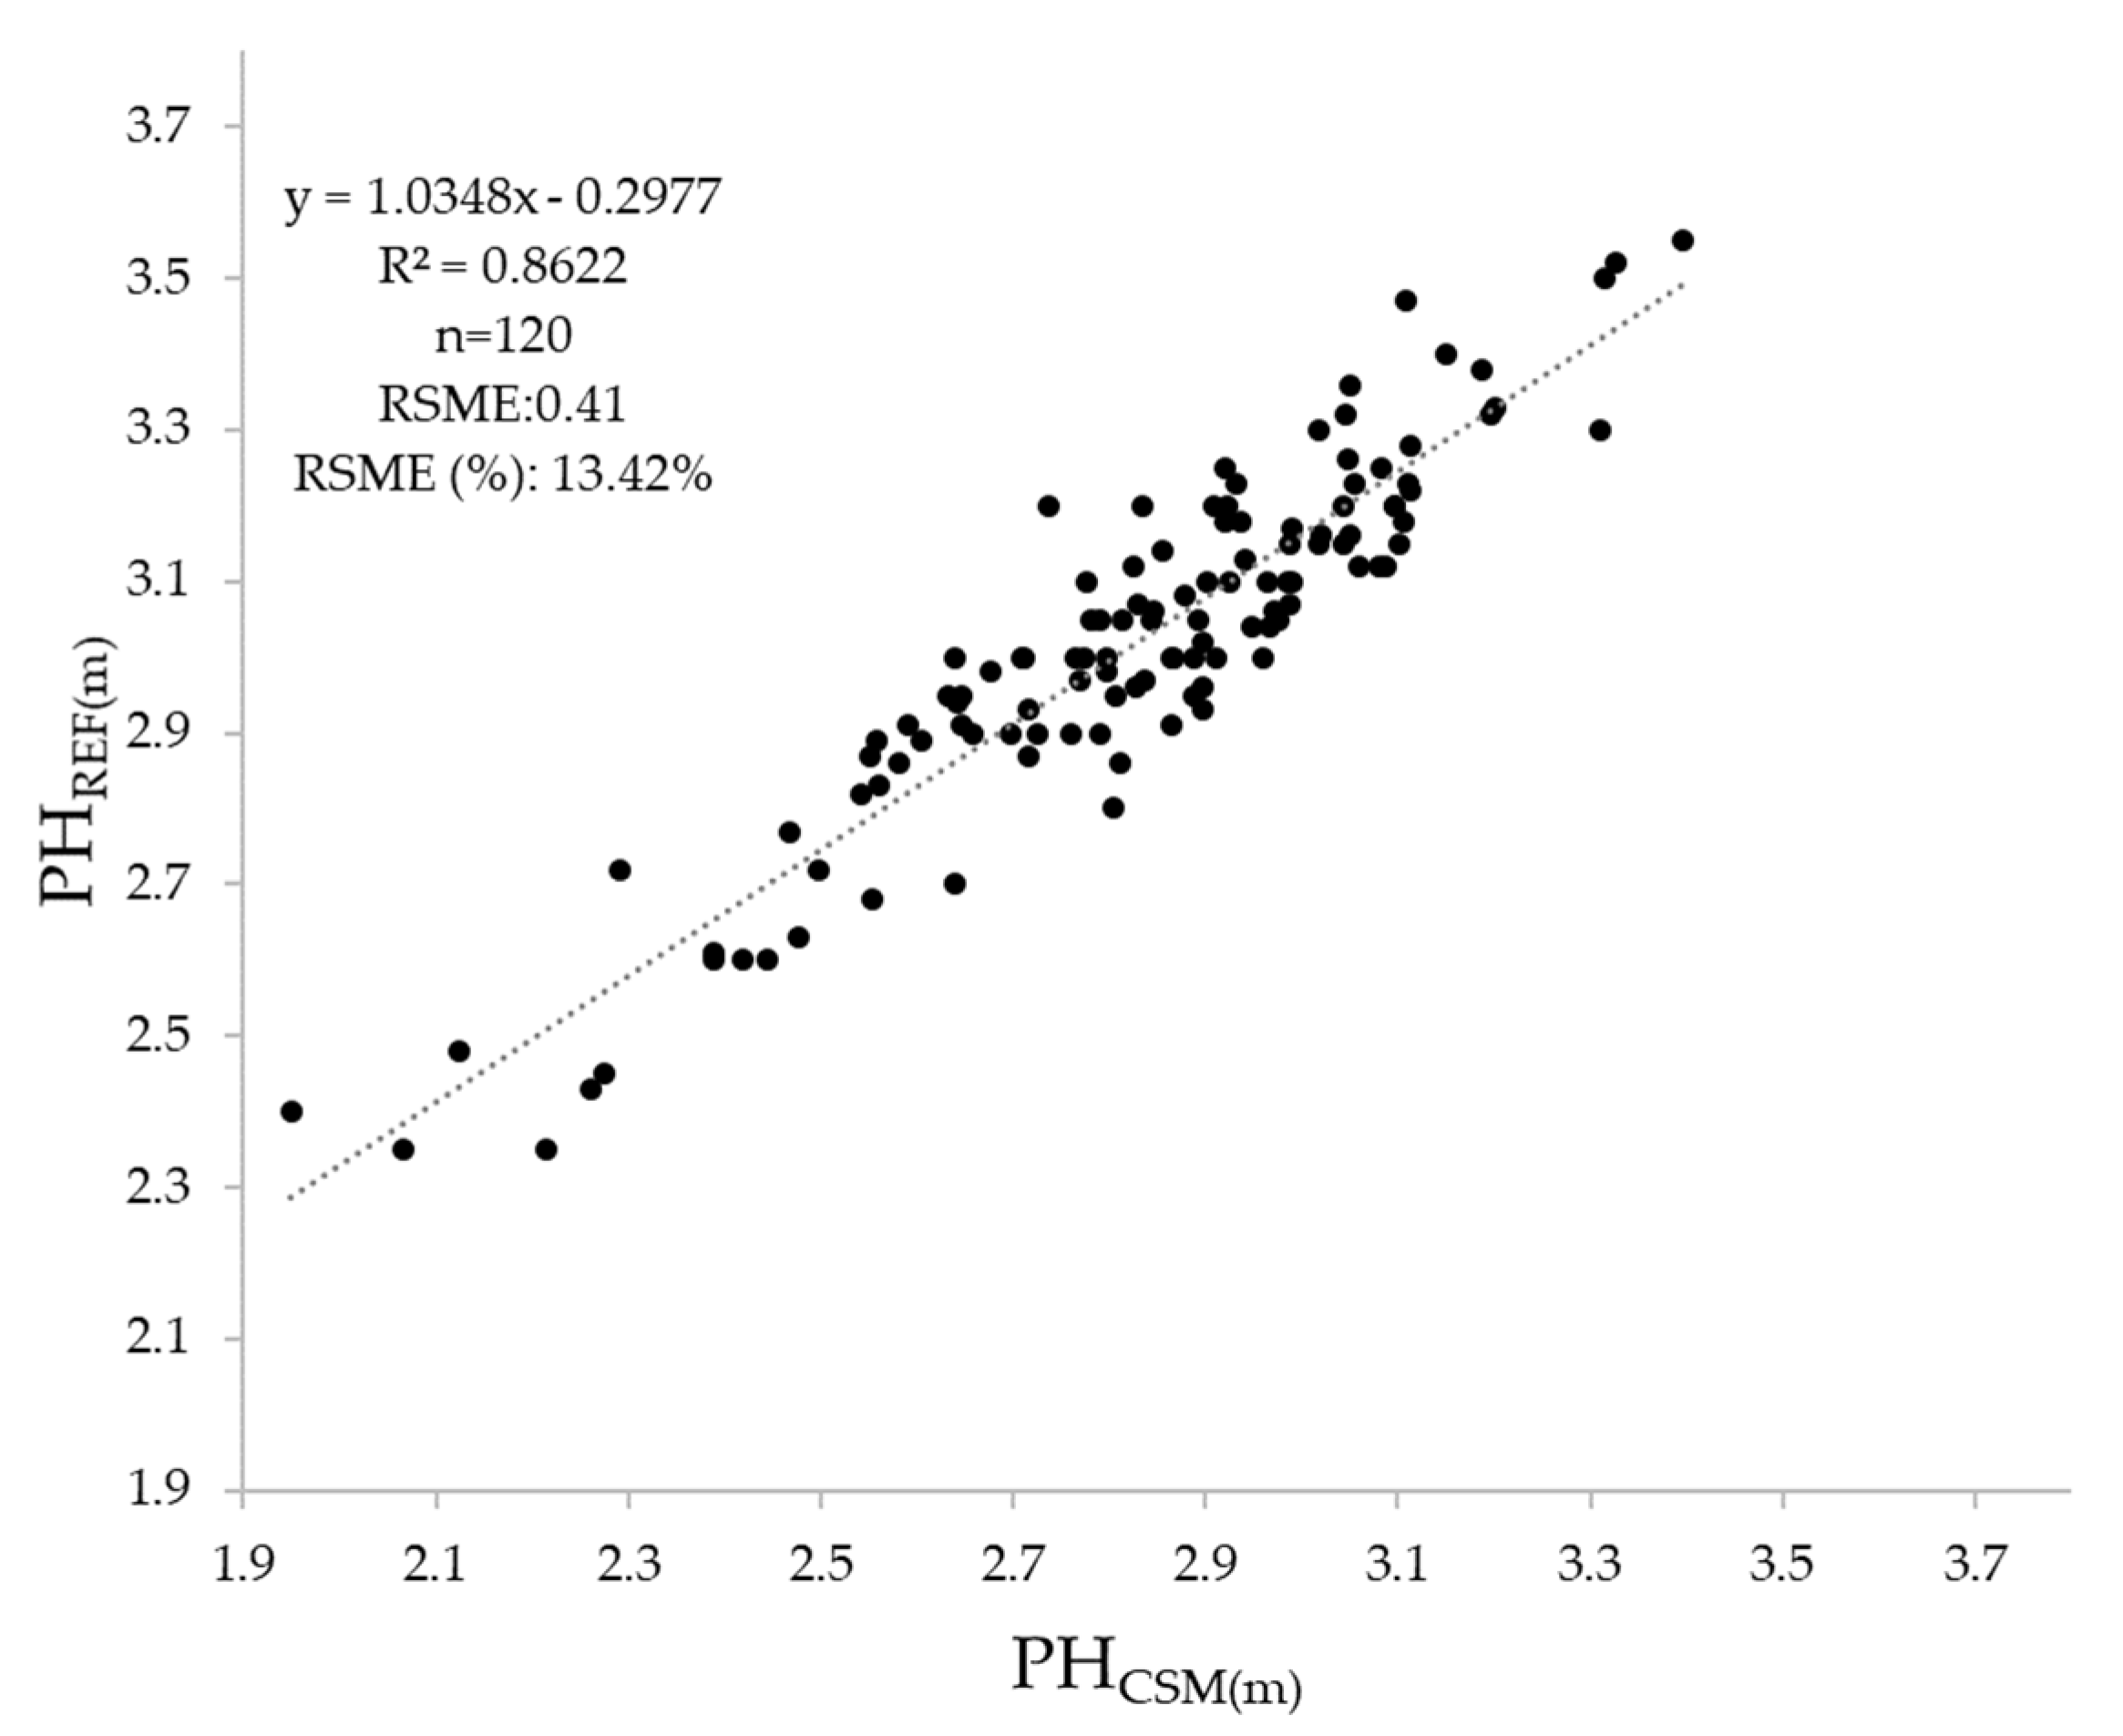
For the validation of plant height information, 20 sampling points were distributed across the field during C1 (Figure 1b). At each sampling location, six plants were selected and had their maximum height measured using a topographic ruler, with the value being compared to the CSM-based plant height. Based on the results of the 120 samples, a linear regression was obtained between the ground-based plant height and the CSM-based plant height, with the accuracy evaluated based on root mean squared error (RMSE).

2.6. Spatio-Temporal Relationship between Image Data and Coffee Crop Yield

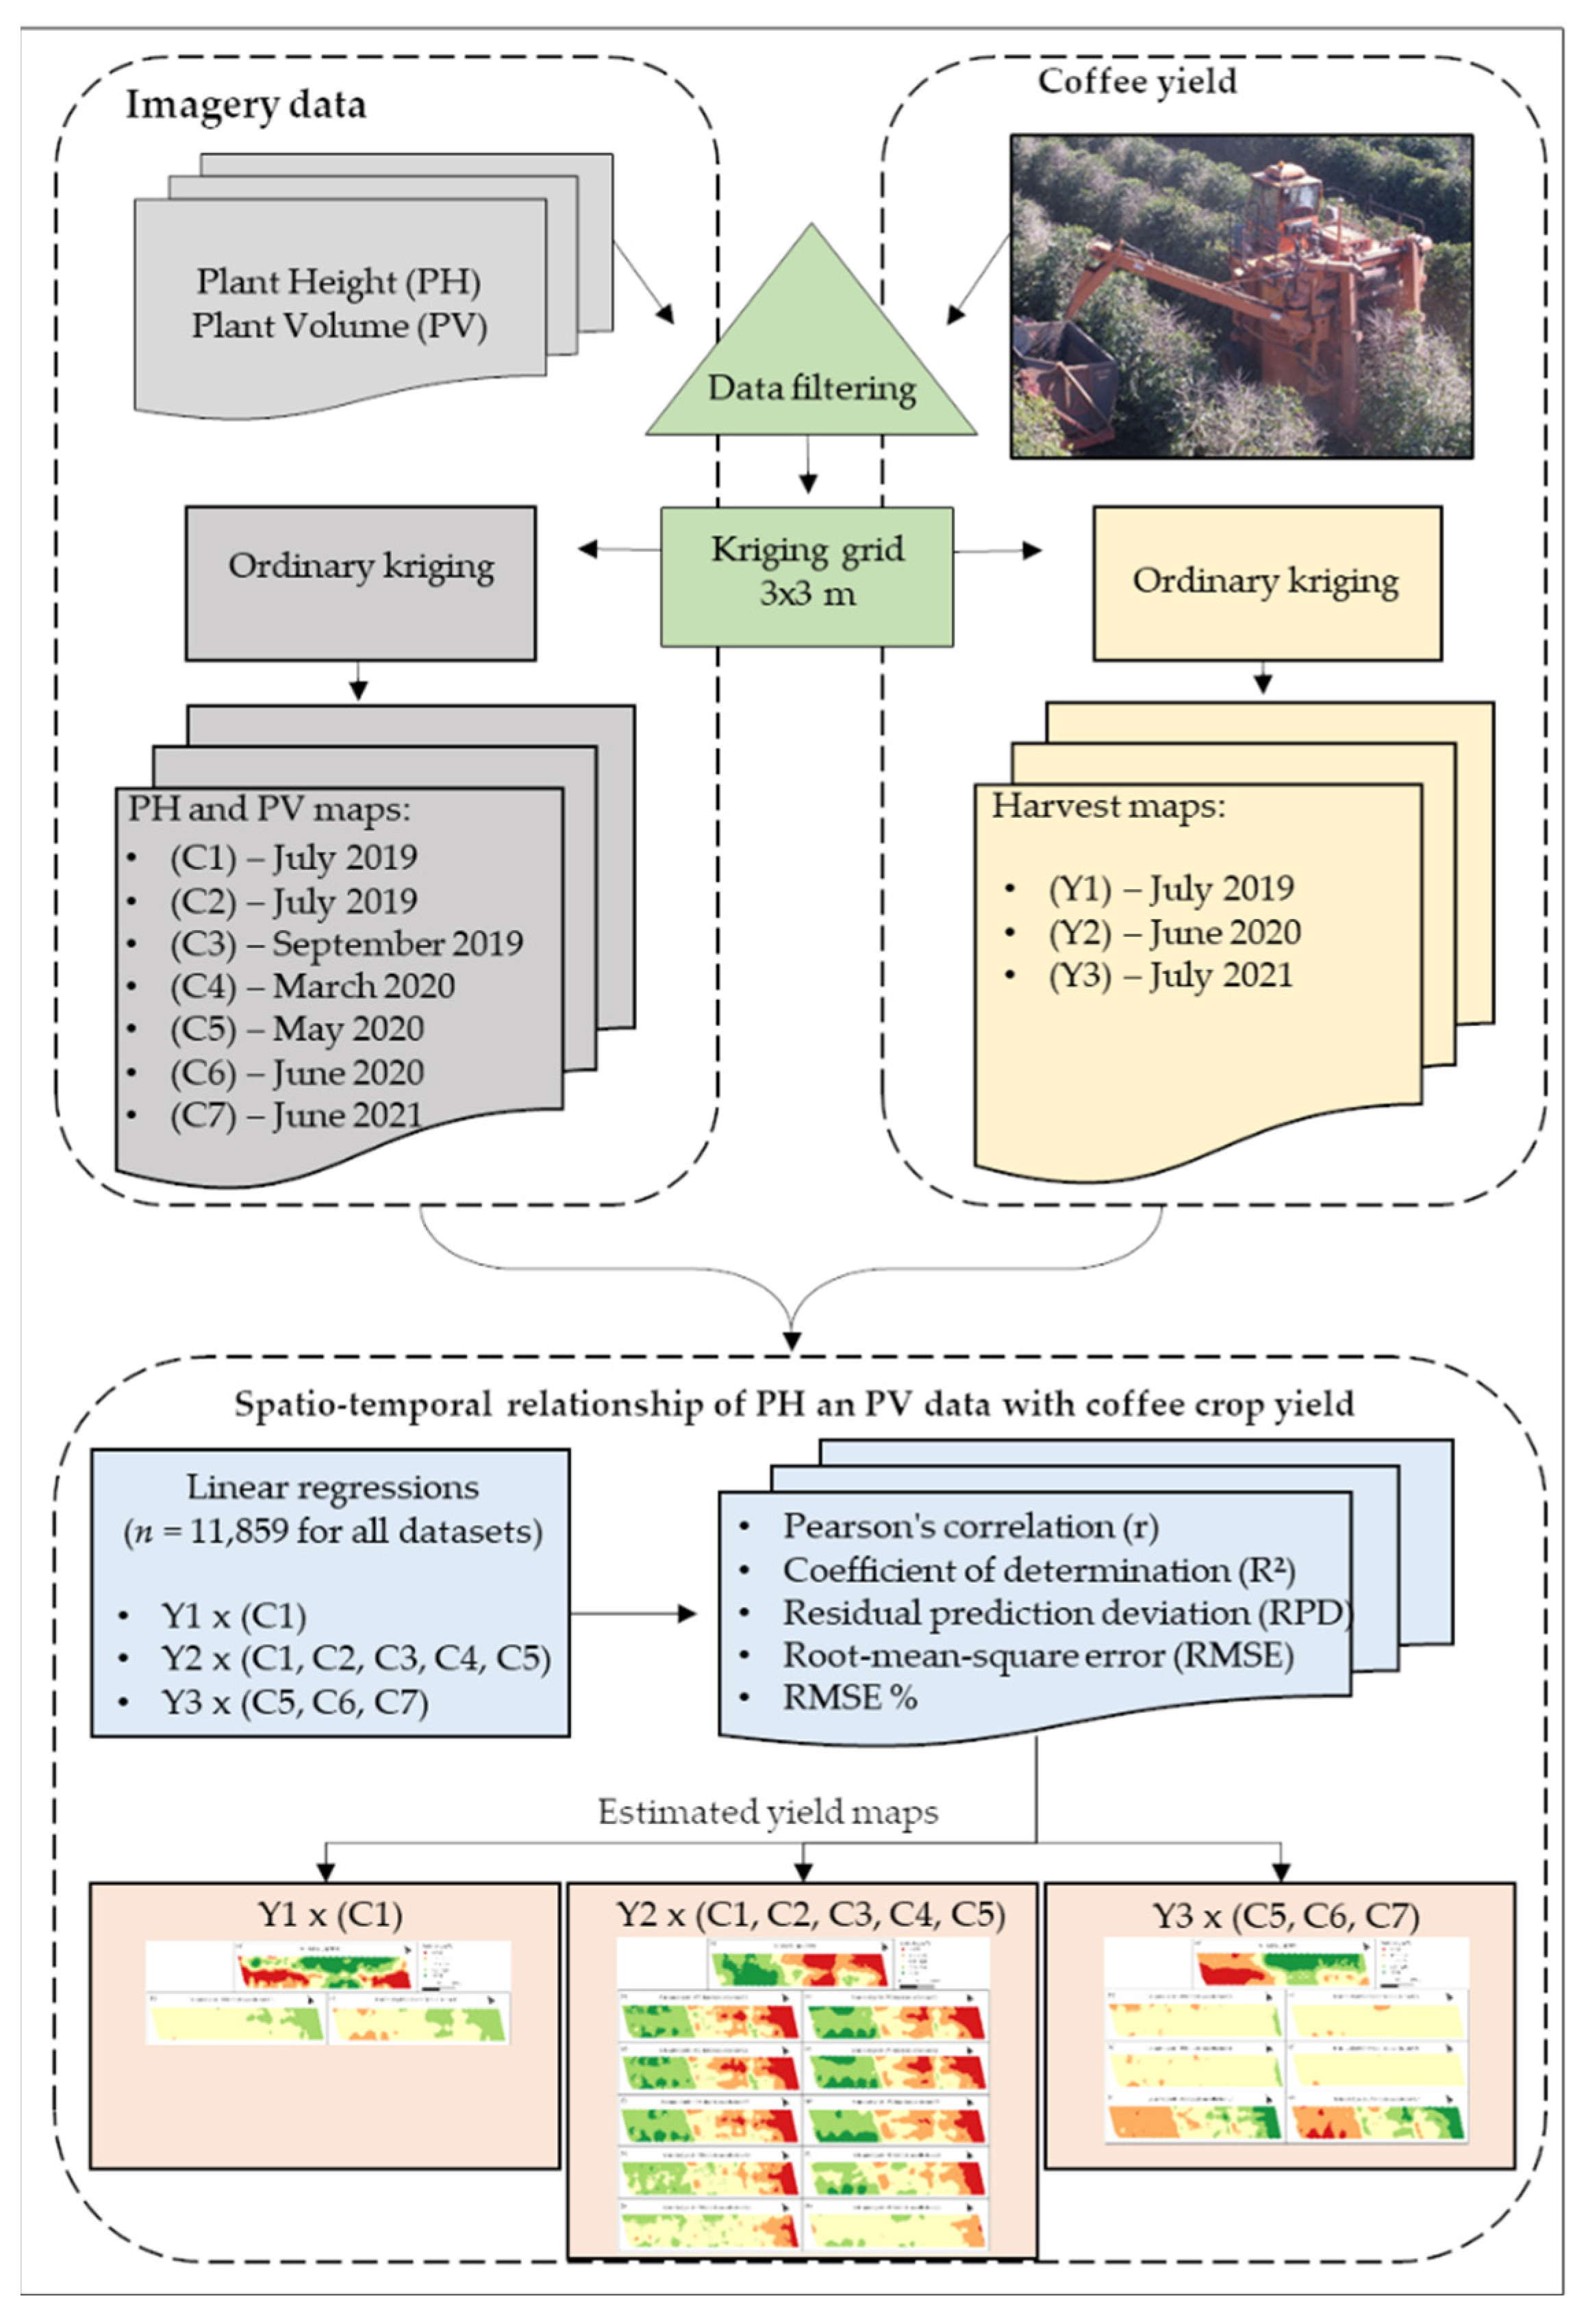
Yield data were obtained based on the yield monitor system installed on a K3 Millenium coffee harvester (Jacto, Pompeia, Brazil). The yield datasets were first filtered, eliminating headland maneuver data. Data close to roads that divide and cross the area and discrepant data were filtered using the MapFilter 2.0 software [33], employing global filtering with a threshold of 100%, and then interpolated using ordinary kriging with a spatial resolution of 3 m according to the methodology described by Martello et al. [27].
A similar filtering approach was applied to the PH and PV data derived from CSMs. Datasets obtained from C1 to C7 were filtered using the MapFilter 2.0 software [33], employing a global filtering with a threshold of 100% and a local filtering with a threshold of 10% and a search radius of 10 m, filtering discrepant data such as polygons that did not have coffee plants. To perform the interpolation, the semivariogram was calculated in the Vesper 1.6 software [34] with the following input parameters: 30 lags, 50% lag tolerance and 100 m maximum distance. These parameters were considered the best fit for calculating the semivariogram based on the exponential model (lower RMSE). The interpolation of the PH and PV data was performed in the same software using the ordinary kriging method with the same spatial resolution as the yield maps (3 m × 3 m).
The spatio-temporal relationship of the PH and PV data with the coffee crop yield was evaluated, comparing the PH and PV maps of C1 with the yield map of the first year (Y1); the PH and PV maps of collections C1, C2, C3, C4 and C5 were also compared with the yield map of the second year (Y2); and the yield map of the third year (Y3) was compared with the PH and PV maps of C5, C6, and C7 (Figure 4). These data were compared using Pearson’s correlation coefficient, and the ability of the PH and PV data to predict yield was verified (n = 11,859, for all datasets). These comparisons allow for the evaluation of the temporal relationship between the sensor data and the coffee yield.
The calibrations of the predictive models were validated with full cross validation using the following quality indicators: the coefficient of determination (R2), the residual prediction deviation (RPD), the root-mean-square error (RMSE) and RMSE%. The RPD was calculated as the ratio between the standard deviation of the measured yield and the RMSE obtained in the prediction. Four RPD classes adapted from Chang et al. [35] were used to evaluate the quality of models: poor models (RPD < 1.40), reasonable models (1.40 ≤ RPD < 2.00), good models (2.00 ≤ RPD < 3.00) and excellent models (RPD ≥ 3.00). The full cross validation results were used to create the predicted yield point maps.

3. Results and Discussion

3.1. Plant Height Validation

The regression model between the CSM-based plant height and reference measurements yielded an R2 of 0.86, with an RMSE = 0.41 m and an RMSE% = 13.42% (Figure 5). Some other studies that also employed RGB aerial images to assess plant height in coffee production achieved an R2 value 0.52, which is considered a moderate correlation [36], and 0.87, [22,23]. Other studies that explored the use of SfM algorithms to derive plant height information from RPA-based imagery obtained similar results in terms of precision for maize (R2 = 0.88) [16], black oat (R2 = 0.68–0.92) [37], wheat (R2 = 0.87–0.96) [6] and grassland (R2 = 0.56–0.70) [38].
In the coffee crop, Santos et al. [22] observed an RSME of 0.07 m, with height estimation errors ranging from −0.3 to 0.2 m. Although the RSME value found by Santos et al. [22] is smaller than that observed in Figure 5 (0.41 m), when we compare the RMSE% values observed in other studies that explored the use of SfM algorithms to derive plant height information from RPA-based imagery, values that ranged between 6% and 20% can be observed. Panagiotidis et al. [39] obtained an RMSE% in the range of 11.42–12.62% for tree height estimation. Zarco-Tejada et al. [40] compared the height data retrieved from high-resolution images and ground measurements similarly; they determined that the RMSE% ranged between 10 and 13, depending on the study area. In apple trees, Hobart et al. [41] used the mean absolute error (MAE) and observed tree heights between 0.18 m and 0.23 m, ranging from 9.2% to 15.3%. The correlations found in this study for coffee height estimates from an RPA point cloud and reference data can also be compared with the results obtained for olive plantations by Diaz-Varela [12], where the mean square errors of the root varied between 6% and 20%.

3.2. Exploratoy Analysis

The descriptive statistics for PH and PV from all datasets are presented in Table 2. The original PV data presented a coefficient of variation (CV) from 16.89 to 22.23%, while the CV for the PH data presented a variation from 8.52 to 13.47%. With the filtered datasets, the CV was smaller, presenting values from 8.5 to 15.79% for PV and values between 6.17 and 10.53% for PH. The reduction in the variation of values is a result of the filtering process, which aims to exclude discrepant values in order to improve the understanding of the real variability of the data. It is also noticeable that the filtering process removed more readings from PV than from PH. Since the estimation of PV uses two variables (average height and plant area), the variations found in the original values were greater, and, consequently, the filtering step eliminated more discrepant points.
The average plant height increased over time, starting from an average of 2.67 m (C2—year 2019) all the way to 2.99 m (C7—year 2021). The average PV also showed variations during the evaluation period, but in this case, the volume of the plant suffered a negative impact after harvest. The average values of the volume before harvest, C1 and C5 (2.31 m3 and 2.79 m3), are greater them the average values of the datasets after harvest, C2 and C6 (2.20 m3 and 2.75 m3), in which a decrease in the average volume of 0.11 and 0.04 m3 was observed. This negative variation can be explained by the impact that the coffee trees suffer during the mechanized harvest of the fruits. As observed by [42], during the harvest, the plant is exposed to constant vibrations to detach the fruits. These vibrations, combined with the traffic of machines in the area, can cause damages to branches and a loss of leaves, which can justify the decrease in the average volume of the plants. Despite that, in fully mechanized systems, farmers normally consider the PV and PH to be generally constant along the field, as shaped by the harvester and other mechanical operations.
From the end of harvest until the first rains, the plant remains in a vegetative resting stage, and the change in plant volume is small (C2 to C3), but as soon as the rainy season begins (C3), the plant moves to an active vegetative stage (C4), and this behavior can be noticed when comparing the average volume of the C3 collection, which was 2.25 m3 and changes to 2.80 in the C4 collection, an average increase of 0.55 m3.
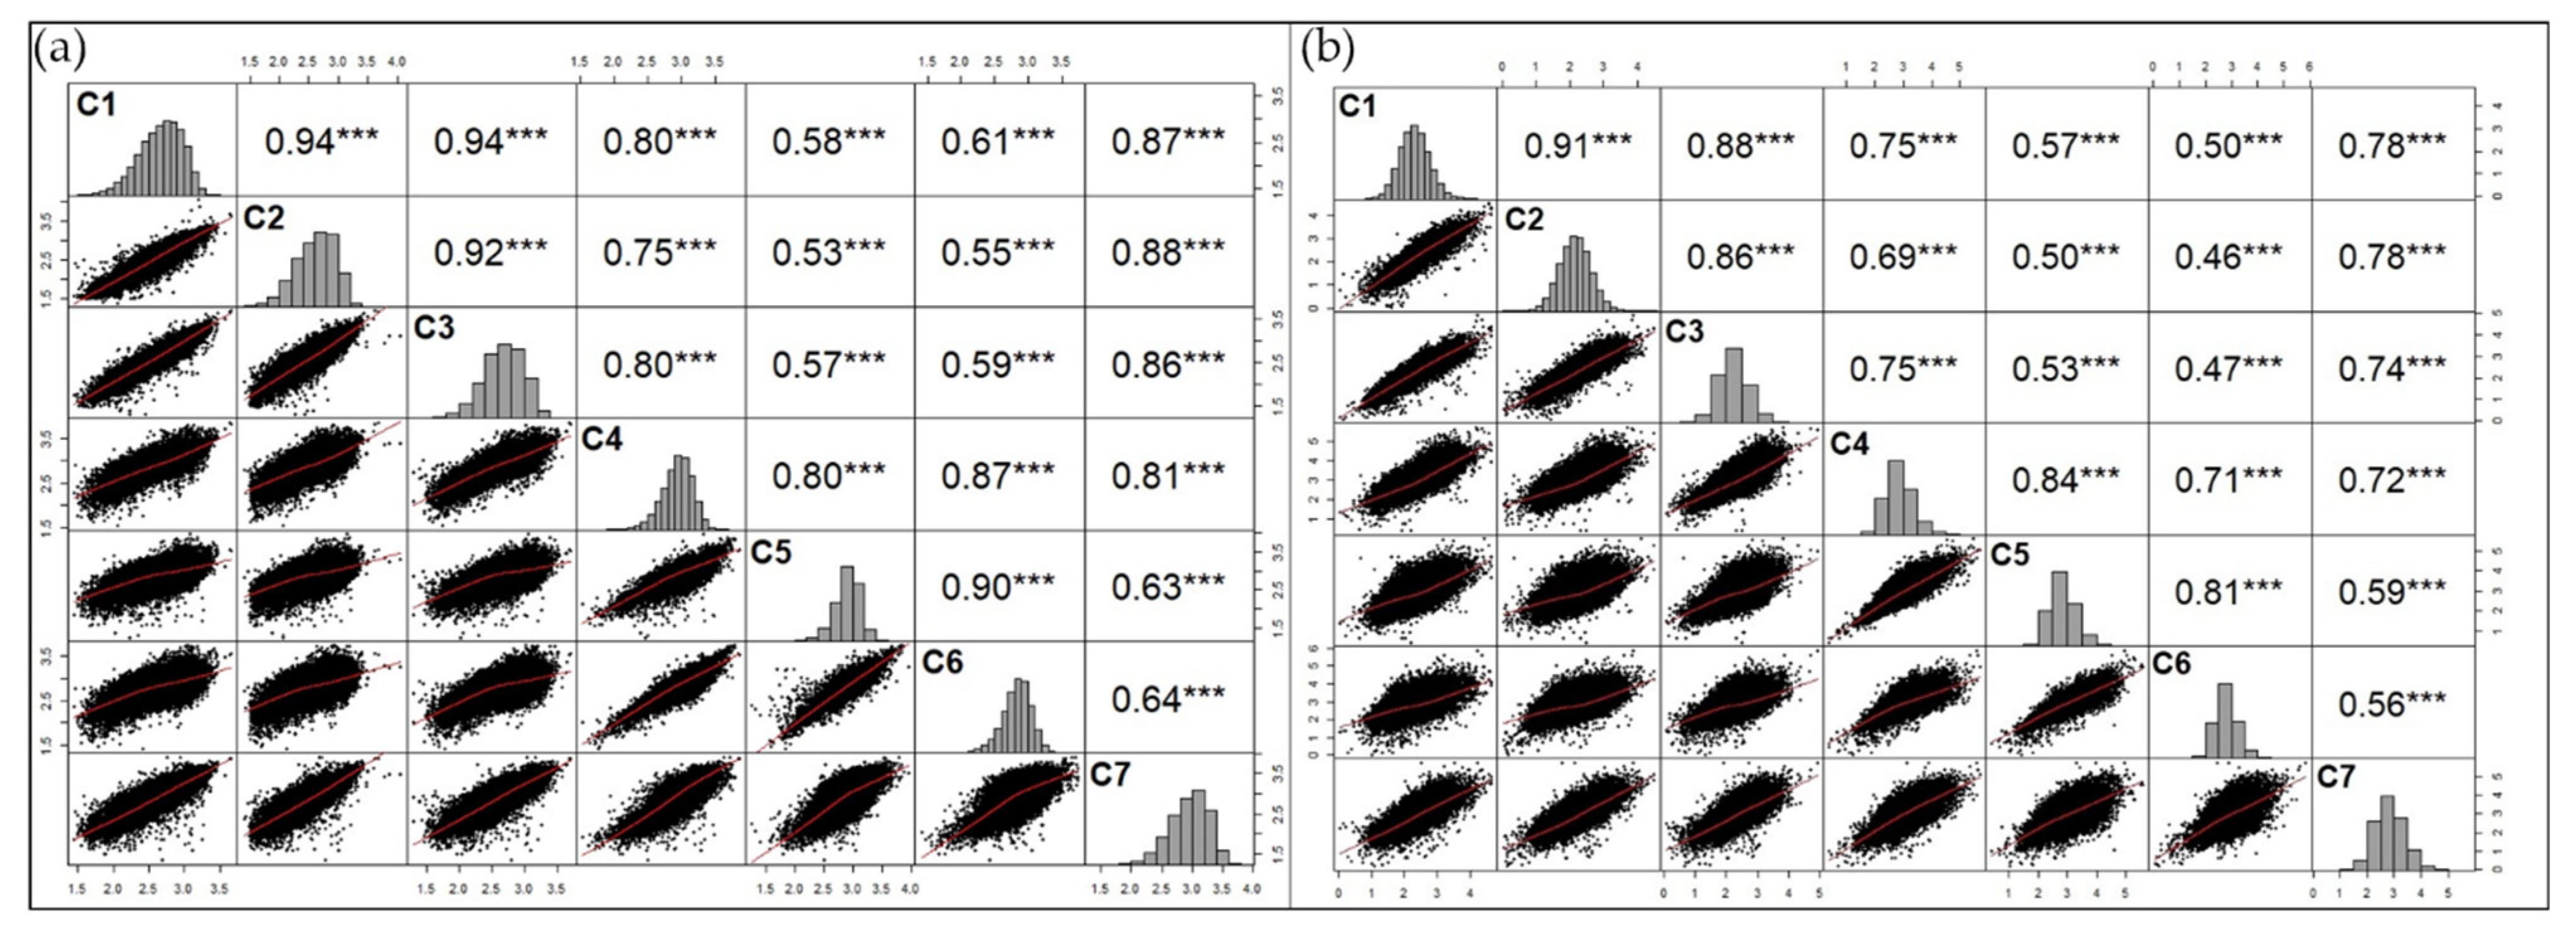
Figure 6 presents the correlation matrix between PH (Figure 6a) and PV (Figure 6b) over the seven campaigns. A positive correlation between the variables for all datasets can be observed, with r values ranging from 0.53 to 0.94 for PH and from 0.46 to 0.91 for PV. The lowest correlation values were found when comparing the data from C2 with those from C5 and C6, with r values of PH 0.53 and PV 0.46, respectively. This decrease in correlation can be explained by the physiological aspects of coffee plants, which need two years to produce the fruit, the first year being a vegetative stage and the second year being the reproductive stage. Therefore, when comparing the data with an interval of two years (C2–C7), the results show a higher correlation between datasets, with r values of 0.88 PH and 0.78 PV.

3.3. Spatio-Temporal Relationship between Image Data and Coffee Crop Yield

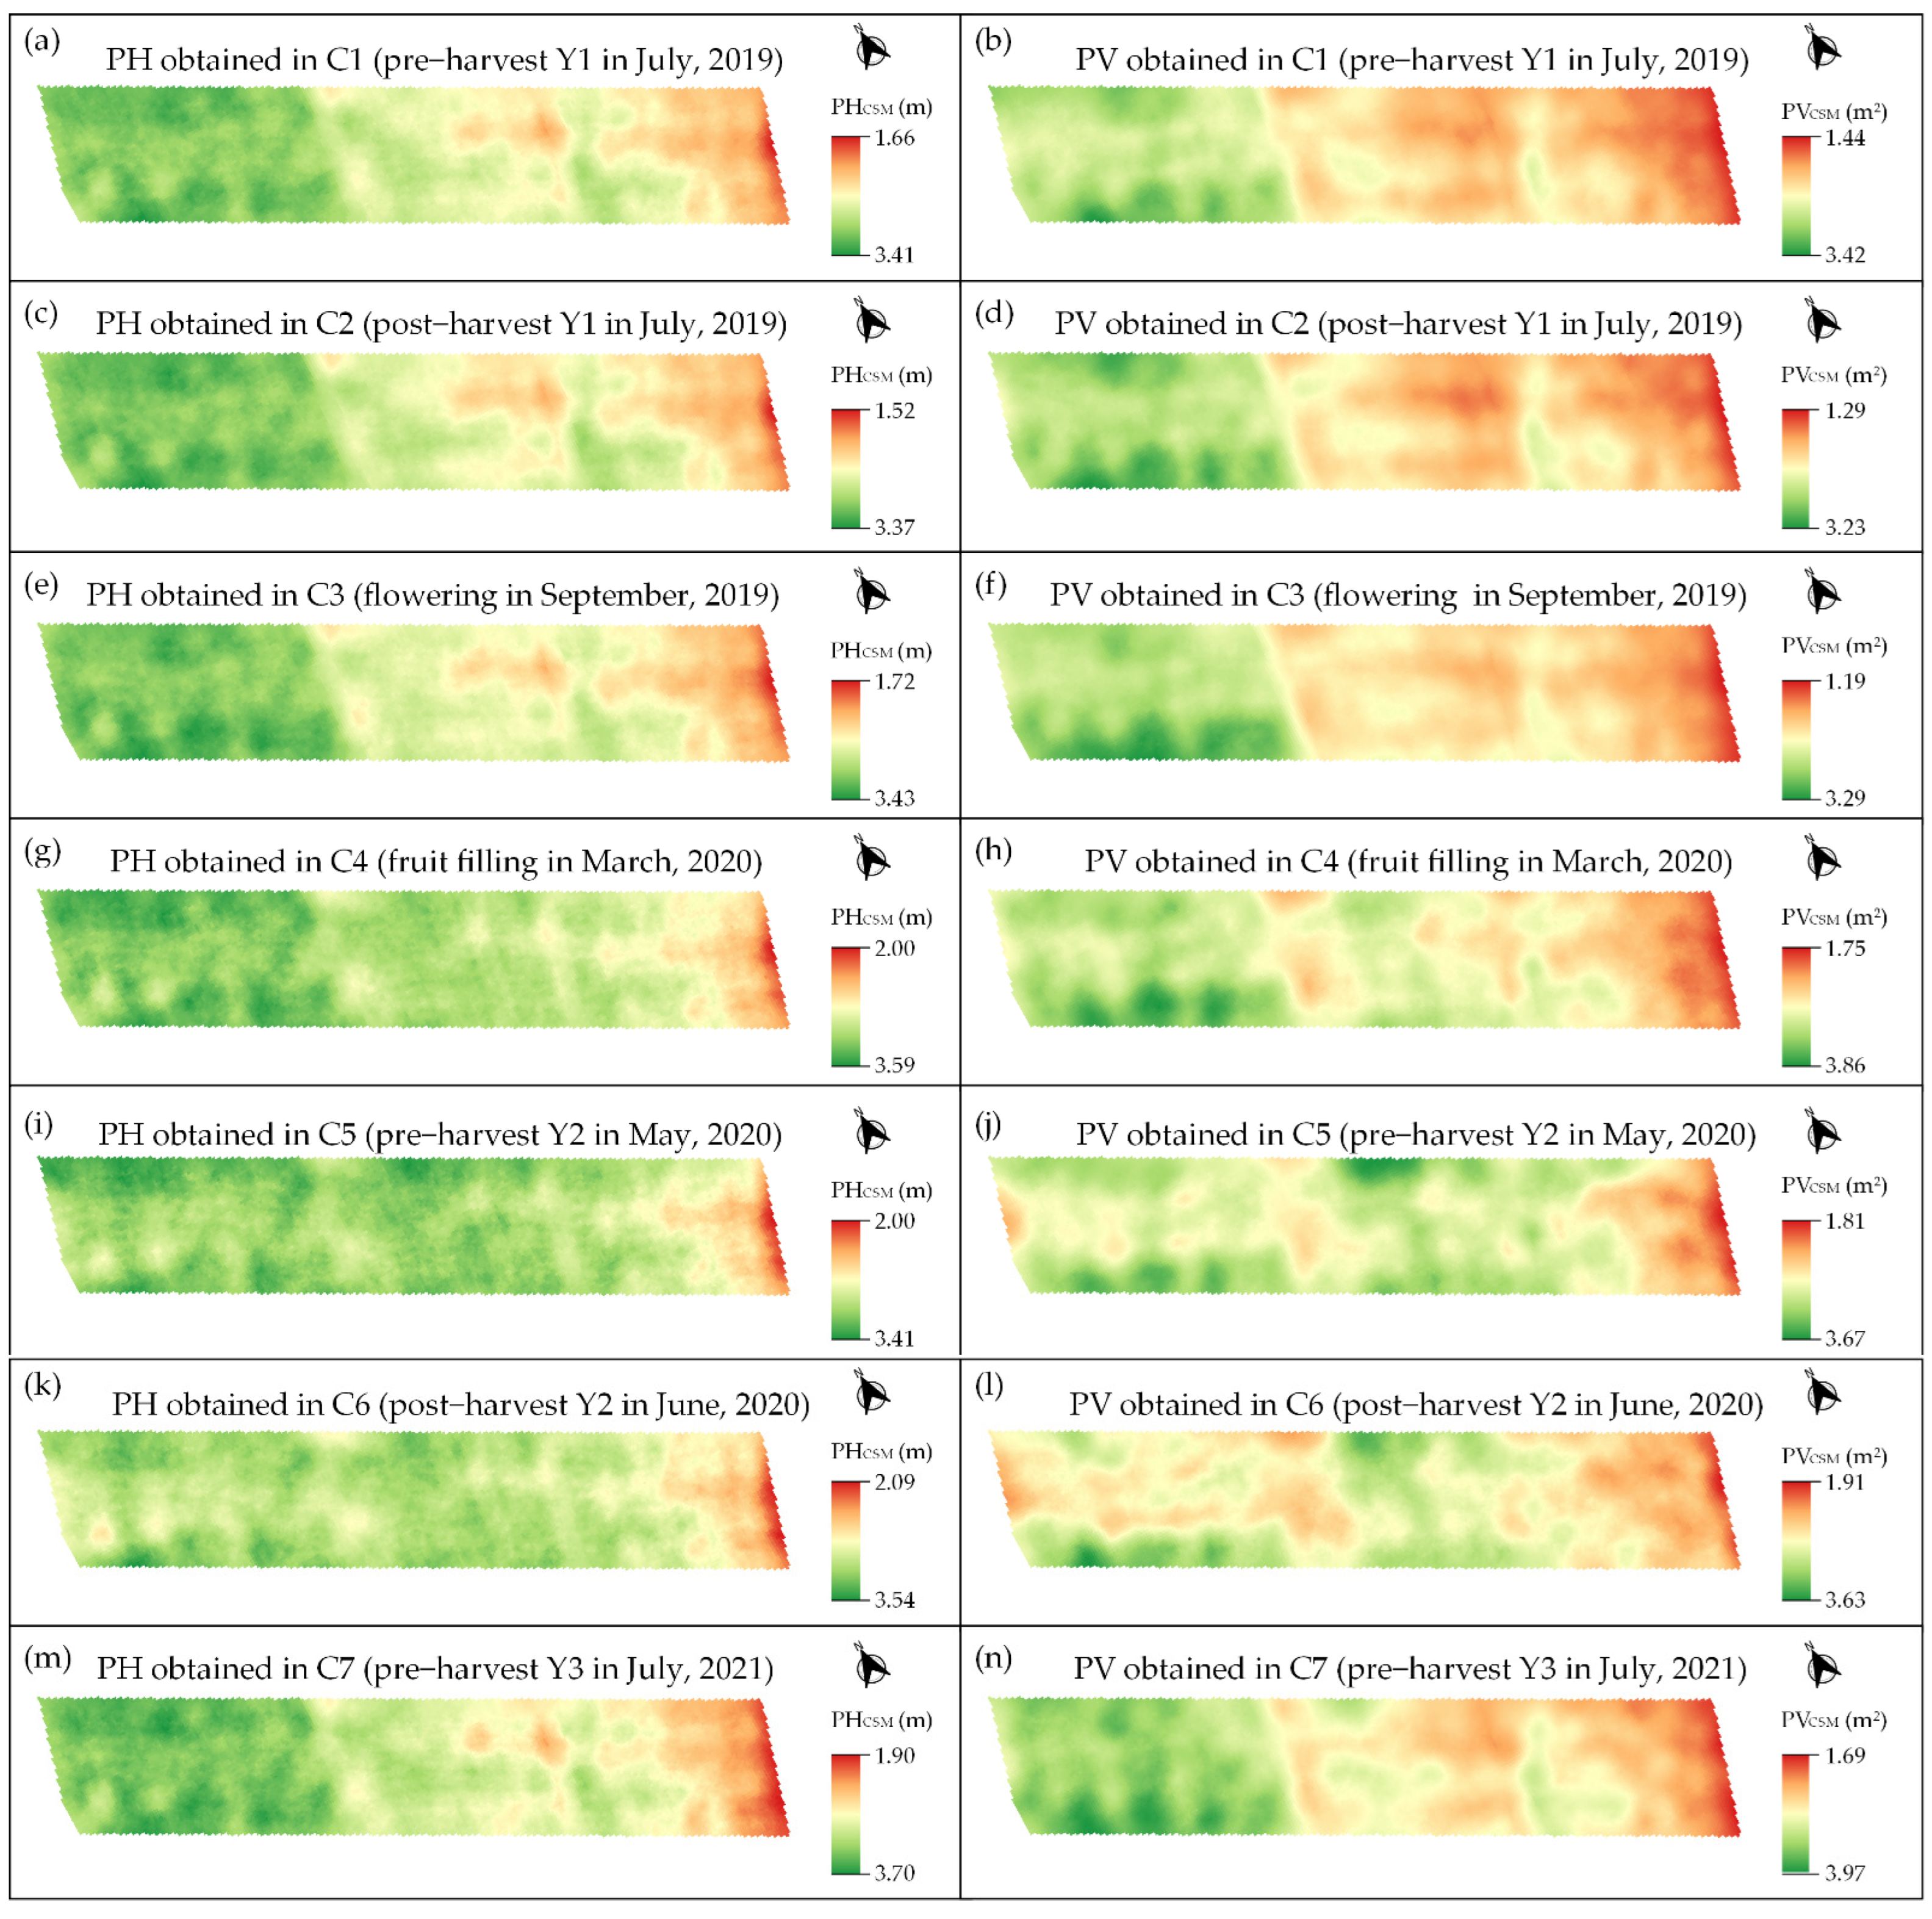
The interpolated maps of PH and PV from all campaigns (C1 to C7) are presented in Figure 7, in which the spatial behavior from all campaigns can be observed. The PV maps from C1, C2 and C3 present a similar spatial behavior, with the same regions of high (regions in green) and low (regions in red) plant volume. After collection C3 (Flowering), due to the beginning of the rainy season in the Cerrado region, the plants present an increase in vegetative vigor [43], which may influence the behavior of plant height, especially during C4, when the spatial pattern of PH begins to display differences in relation to previous collections (C1, C2 and C3). These differences increase in C5 and C6, because the area was showing less variations in height, with a predominance of greener regions (Figure 7i,k) and a with low CV (6.47 and 6.17%, respectively) (Table 2). During C7, once more, the area presents a similar behavior to collections C1, C2 and C3, with regions of high and low plant height well defined.
By comparing the PV and PH maps from the same campaign, it is possible to observe that they have some differences in spatial behavior. The PV data present a greater definition of areas with a high (regions in green) and low (regions in red) volume of plants, consequently presenting higher CV values (Table 2) in comparison with the PH datasets. The behavior observed in the PH maps is repeated in the PV maps. Starting with C4, it is possible to identify that the area presents a distinct behavior in comparison with collections C1, C2, C3 and C7, also presenting some isolated regions that previously presented a low volume (regions in red) in collections C1, C2, C3 and C7. During C4, C5 and C6, the same regions presented inverse behavior with a high volume (regions in green). This inversion may be linked to the biennial behavior of the plant, which presents opposite behaviors in years of high and low yield [44,45].
Another point that is important to highlight is the possibility that this PH and PV information can be used as a guide for the application of phytosanitary products that use plant volume and height as a factor for determining the application dose [46,47]. The results presented in Figure 7 generally present well-defined regions with PH and PV variation, indicating that it could be used to direct spraying at a variable rate.
Table 3 presents the spatio-temporal relationship of the PH and PV together with yield data obtained from harvests of 2019 (Y1) 2020 (Y2) and 2021 (Y3). When analyzing the correlation between PH and PV data and yield, we observe that the correlation shows negative values for yield data from Y1 and Y3 and a direct correlation (positive) with yield data from Y2. This result may indicate that the volume and plant height have a more static behavior, not following the reversal of yield, as shown in Figure 8, Figure 9 and Figure 10, and, therefore, they show a direct correlation with a year and an indirect correlation with the following year, when yield zones invert, as observed by [27].
Another interesting result observed in this study is the relationship of PH and PV data from a specific campaign (e.g., C1 and C5) with the Y2 dataset. The PH and PV from C5, during the pre-harvest of 2020, showed a low correlation (r = 0.43 and 0.28) with the yield of that same year (Y2), while it showed higher values when compared to the data from the C2 collection (one year earlier), with direct correlations of r = 0.90 for PV and r= 0.92 for PH. The C5 and C6 datasets showed low values of correlation for both the Y2 and Y3 yields. This might indicate that, for this area, the best time to conduct flight campaigns aiming to predict crop yield would be in the odd years, because when we observe the data of the Y3 yield, the highest values of correlation were found in collection C7 (pre-harvest 2021). Despite the inverse correlation, the predictive potential of using the volume data from C7 showed a reasonable performance (RPD = 1.56) in predicting the Y3 yield.
The performance of the models using PH and PV data for yield prediction showed distinct behavior, with the best models found for the C1 and C2 datasets when estimating the yield of Y2, with an RPD greater than 2.00. According to the classification proposed by [35], values of RPD between 2 and 3 indicate good models for prediction. The C3 dataset versus the yield of Y2 and the C7 dataset versus the yield of Y3 showed reasonable results (1.40 ≤ RPD < 2.00). In general, the performance of the PV data presented the lowest RMSE and RMSE% values for yield estimation in comparison with the PH data.
By observing the average annual yield data (Figure 8, Figure 9 and Figure 10), it is possible to identify the crop behavior, going from a year of low productivity in Y1 to a year of high productivity in Y2, again presenting low values of yield in the following season, Y3. In general, coffee productivity has a biennial behavior, alternating between a year of high productivity and a subsequent year of low productivity. This variation is explained by the morphophysiological behavior of the coffee tree [46,47].
Figure 8 shows the Y1 yield results, as well as the predicted yield maps obtained from the linear regression using PH and PV independent variables. The maps were generated using the same color scale, promoting a more reliable comparison. Visually, the estimated maps did not present spatial similarity with the measured yield data, which corroborates the results found in Table 3, with a low value of R2 and RPD; this behavior may be related to the productive bienniality of coffee, since the Y1 harvest is characterized as a year of low productivity due to the physiological characteristics of the plant [48]. The C1 collection, the plants had a high vegetative activity, already indicating the productive variability for the following year Y2, which is shown in Figure 9.
Unlike the result shown in Figure 8, the estimated yield maps in Figure 9 were obtained using datasets from C1 to C5, in which it is possible to observe changes in the spatial behavior of the estimated data, with C1 and C2 presenting a great spatial similarity with the observed yield data. After the collection C3, the maps began to present greater differences in comparison with Y2 due to the lower accuracies for yield prediction. This change in behavior may be linked to the beginning of the rainy season that starts in October in the Brazilian Cerrado region; in this sense, it is expected that the plants show an increase in vegetative vigor [43] and may affect the behavior of the PH and PV of the plants. In addition, the visual analysis indicates that the PV data presented smoother transitions between classes, unlike the PH results; in addition, the models using PV showed the best results in relation to the productivity estimate, with the lowest RMSE% values (10.93%, 9.77%, 12.75%) for collections C1, C2 and C3, respectively.
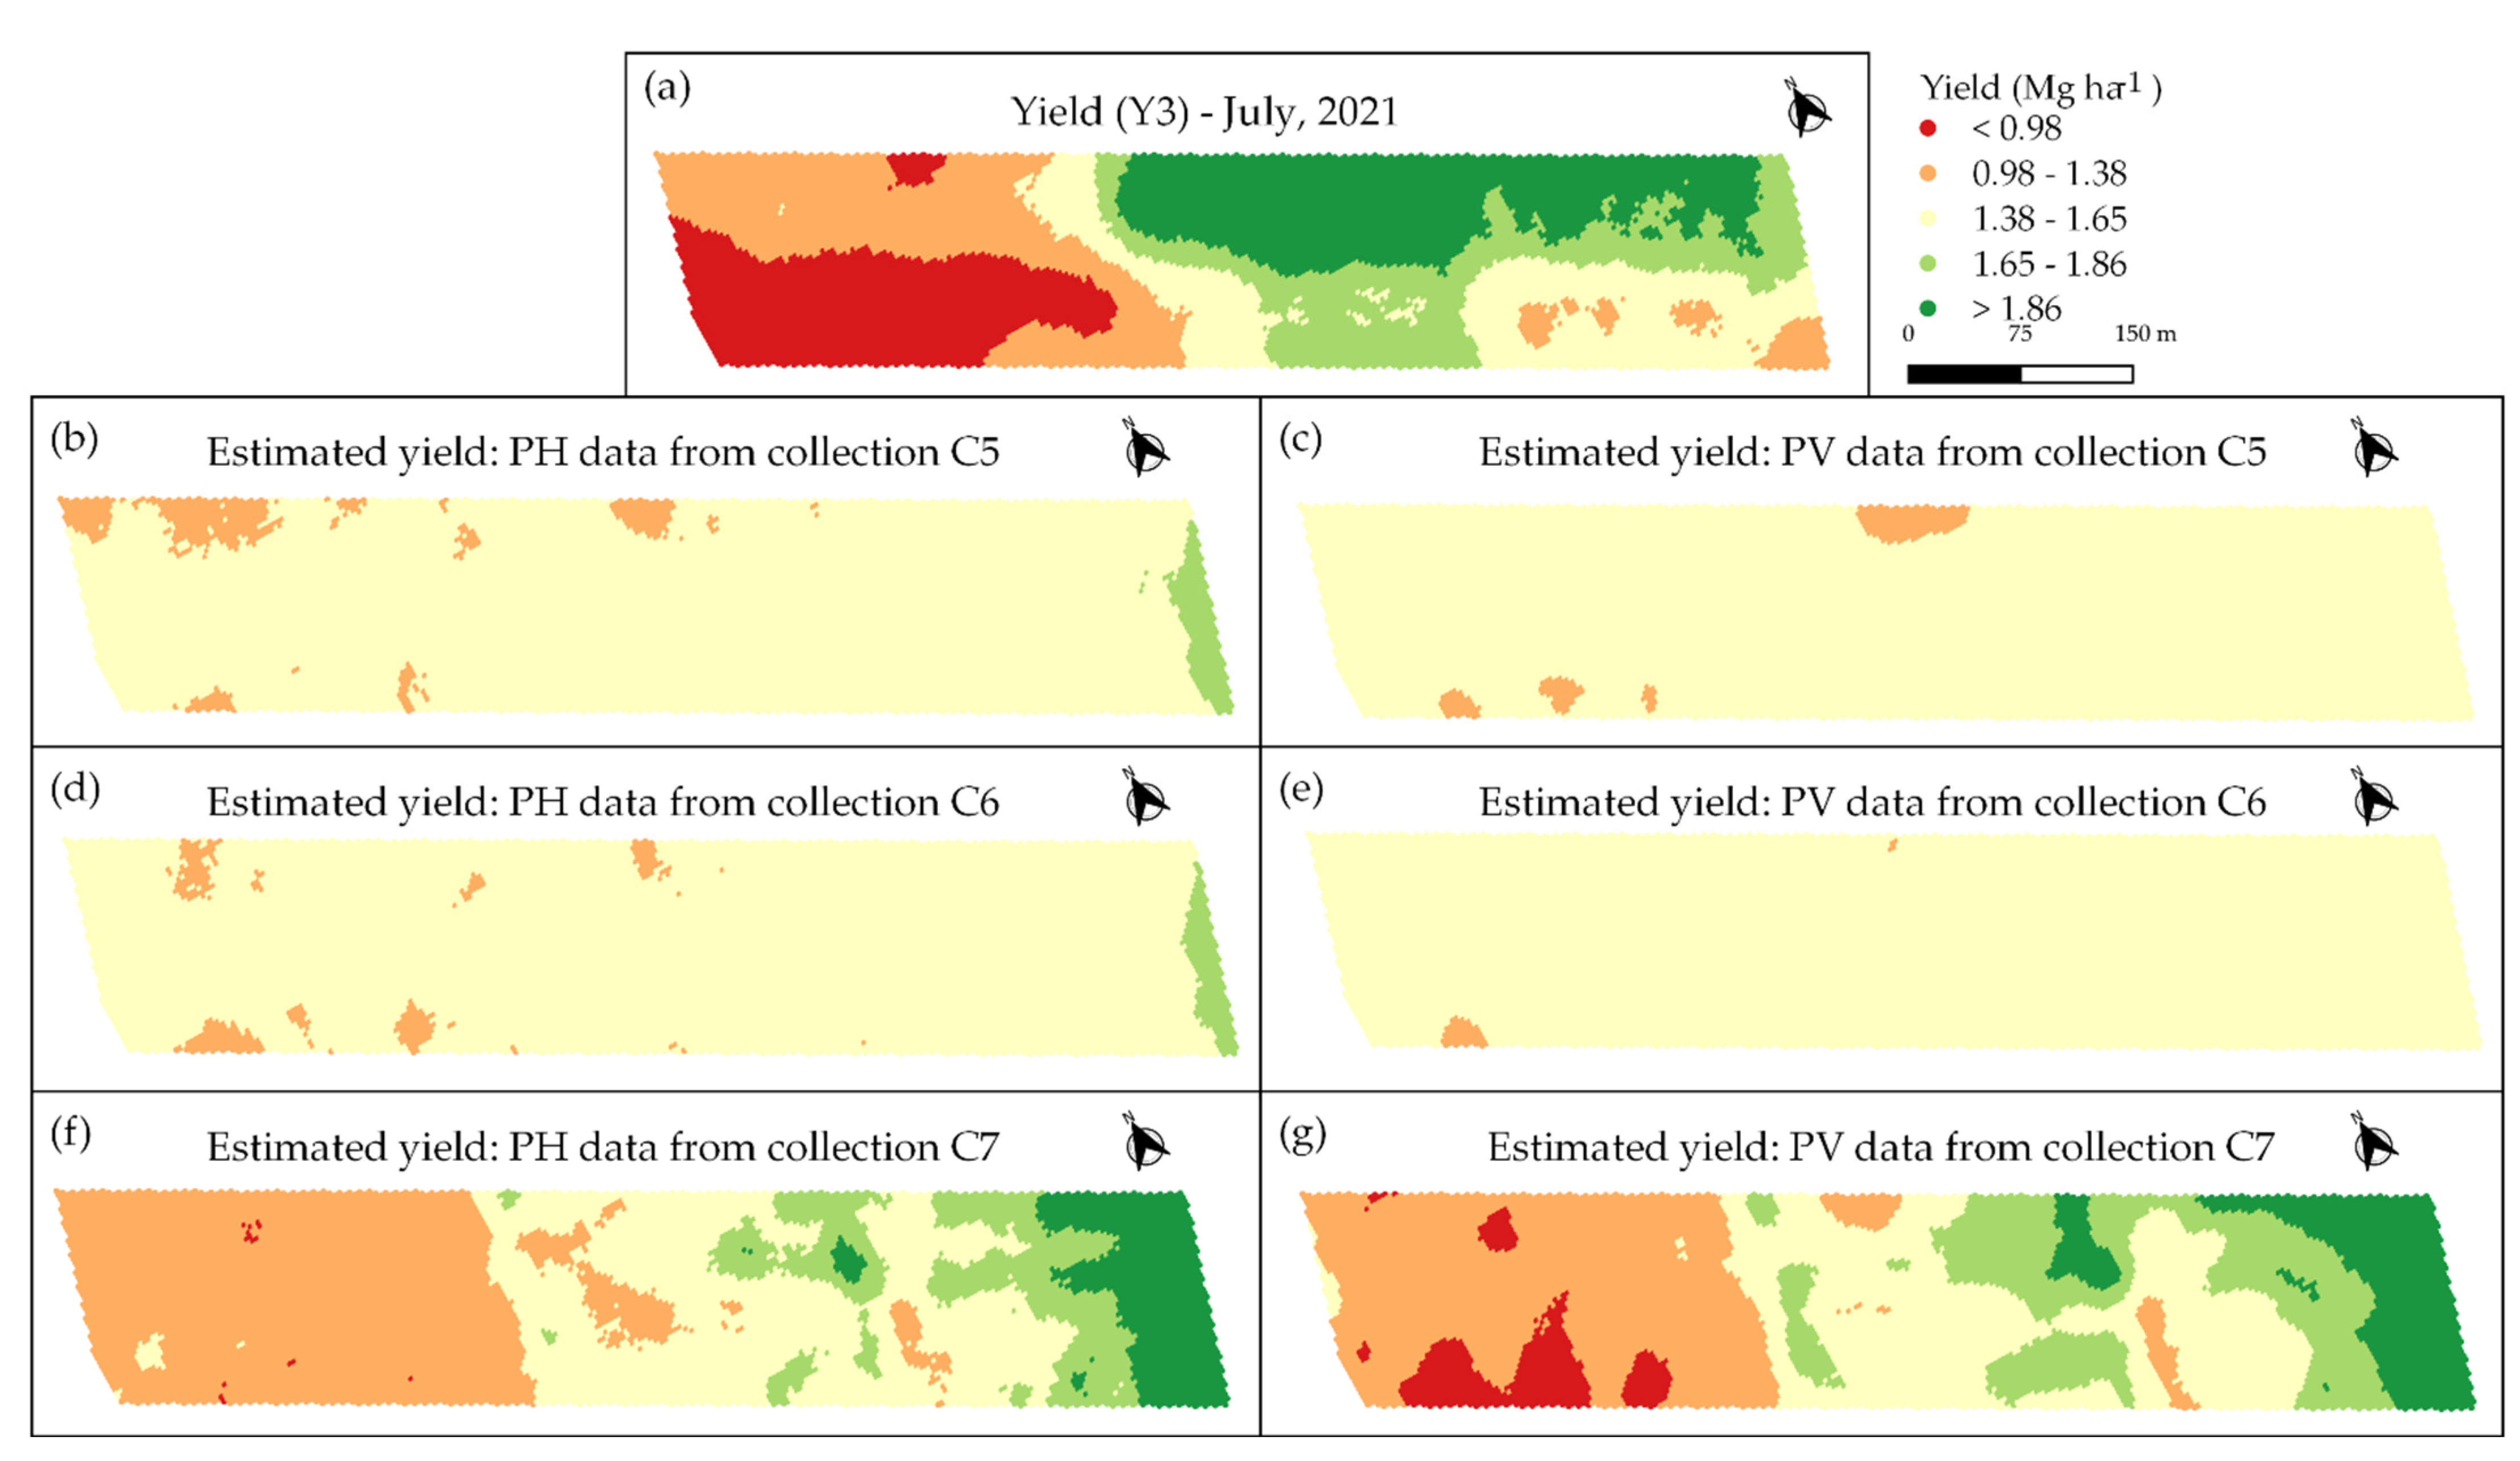
The yield data from Y3, along with the predicted yield results using datasets from C5, C6 and C7, are presented in Figure 10. Similar to the results discussed for the maps of Figure 8b,c and Figure 9j,k, the results from C5 and C6 presented a low spatial similarity with the observed yield data, whereas the results from C7 presented a greater similarity with the observed yield in comparison to other campaigns. The PV results found in C7 present a greater similarity with Y3 in comparison with the PH data. Nonetheless, even with the greater similarity, the PV results still have limitations for yield prediction.
For commercial orange groves, ref. [49] suggested that the canopy volume for a given yield can provide information on yield performance in recent years, although in some cases, some unexpected results were found, where the highest yield occurred in zones with medium or small trees.

3.4. Limitations and Future Aspects

Although the main objective of this work was to evaluate the PH and PV data extracted from aerial images and compared with yield maps, we believe that there are other approaches that can benefit from this information, which can be used to help understand several limitations in coffee crops, as highlighted previously by [22]. As an example, we can mention water deficit [50] and the solar radiation interception dynamics [51]. Moreover, it can also serve as a guideline for site-specific management practices, especially for spraying activities using variable rate systems based on plant height and volume information [46,47], and along with other layers to aid in determining management zones [49].
We emphasize that the present study sought to provide an initial approach to the potential use of aerial images for coffee fields, but more studies are still needed to explore new methods and new scenarios, thus allowing for a greater understanding of the application of data in understanding of spatial variability, as several factors can influence this variability, including biennial behavior [52], the occurrence of diseases, pests and weeds [53,54,55] and soil fertility and foliar nutrition [56,57], which were not addressed in this work.

4. Conclusions

In this study, we evaluated the spatio-temporal relationship of coffee productivity throughout its biennial cycle using plant height and volume data. To achieve this goal, we used RPA images and processing with the SfM technique.
The results of this study suggest that it is possible to map the height and volume of coffee plants using aerial images, with height validation results similar to those of other studies that also applied the SFM technique for other crops. It was also possible to map the spatial variability of the volume and height of the plants throughout three years and seven data collections. The volume data showed a greater spatial variability, with variations of high- and low-volume regions in the same collection.
It was possible to observe the temporal relationship of the height and volume data with the yield maps, in which collections carried out at the beginning of the coffee cycle (C1, C2 and C3), before the rainy season that begins in October, present a positive correlation with the coffee productivity of the same year (Y2). On the other hand, the following collections (C5 and C6) showed a different behavior after the beginning of the rains, when the vegetative activity of the plant increases.
This study presents the spatio-temporal variations in height and volume data in large coffee fields, as well as their relationship with coffee crop productivity. More studies are needed to deepen the practical applications of this data to support the optimized management of inputs through precision agriculture practices in coffee production

Author Contributions

Conceptualization, M.M. and J.P.M.; methodology, M.M., M.G.A., G.A. and J.P.M.; software, M.M. and M.G.A.; formal analysis, M.M., G.A. and M.G.A.; writing—original draft preparation, M.M., G.A., M.G.A. and J.P.M.; writing—review and editing, M.M., J.P.M. and G.A. All authors have read and agreed to the published version of the manuscript.

Funding

This research received no external funding.

Data Availability Statement

Not applicable.

Acknowledgments

We thank the Guima Café Group for allowing for the use of their plantations as experimental areas and for providing the people and machinery, Terrena Agronegócios for supporting the research and the Coordination for the Improvement of Higher Education Personnel (in Portuguese: Coordenação de Aperfeiçoamento de Pessoal de Nível Superior CAPES) for granting the scholarship of author 1—Finance Code 001.

Conflicts of Interest

The authors declare no conflict of interest.

References

  1. Mulla, D.J. Twenty five years of remote sensing in precision agriculture: Key advances and remaining knowledge gaps. Biosyst. Eng. 2013, 114, 358–371. [Google Scholar] [CrossRef]
  2. Florenzano, T.G. Imagens de Satélites para Estudos Ambientais; Oficina de Textos: São Paulo, Brazil, 2002. [Google Scholar]
  3. Gómez-Candón, D.; De Castro, A.I.; López-Granados, F. Assessing the accuracy of mosaics from unmanned aerial vehicle (UAV) imagery for precision agriculture purposes in wheat. Precis. Agric. 2014, 15, 44–56. [Google Scholar] [CrossRef]
  4. Sankaran, S.; Khot, L.R.; Espinoza, C.Z.; Jarolmasjed, S.; Sathuvalli, V.R.; Vandemark, G.J.; Miklas, P.N.; Carter, A.H.; PumphreY, M.O.; Knowles, R.R.N.; et al. Low-altitude, high-resolution aerial imaging systems for row and field crop phenotyping: A review. Eur. J. Agron. 2015, 70, 112–123. [Google Scholar] [CrossRef]
  5. Colomina, I.; Molina, P. Unmanned aerial systems for photogrammetry and remote sensing: A review. ISPRS J. Photogramm. Remote Sens. 2014, 92, 79–97. [Google Scholar] [CrossRef]
  6. Schirrmann, M.; Giebel, A.; Gleiniger, F.; Pflanz, M.; Lentschke, J.; Dammer, K.-H. Monitoring agronomic parameters of winter wheat crops with low-cost UAV imagery. Remote Sens. 2016, 8, 706. [Google Scholar] [CrossRef]
  7. Tilly, N.; Aasen, H.; Bareth, G. Fusion of plant height and vegetation indices for the estimation of barley biomass. Remote Sens. 2015, 7, 11449–11480. [Google Scholar] [CrossRef]
  8. Possoch, M.; Bieker, S.; Hoffmeister, D.; Bolten, A.; Schellberg, J.; Bareth, G. Multi-temporal crop surface models combined with the RGB vegetation index from UAV-based images for forage monitoring in grassland. Int. Arch. Photogramm. Remote Sens. Spat. Inf. Sci. 2016, 991–998. [Google Scholar] [CrossRef]
  9. Berni, J.; Zarco-Tejada, P.; Suarez, L.; Fererez, E. Thermal and narrow-band multispectral remote sensing for vegetation monitoring from an unmanned aerial vehicle. IEEE Trans. Geosci. Remote Sens. 2009, 47, 722–738. [Google Scholar] [CrossRef]
  10. Ballesteros, R.; Ortega, J.F.; Hernandez, D.; Moreno, M.A. Onion biomass monitoring using UAV-based RGB imaging. Precis. Agric. 2018, 19, 840–857. [Google Scholar] [CrossRef]
  11. Johnson, L.; Herwitz, S. Collection of ultra high spatial and spectral resolution image data over California vineyards with a small UAV. In Proceedings of the 30th International Symposium on Remote Sensing of Environment (ISRSE), Honolulu, HI, USA, 10–14 November 2003. [Google Scholar]
  12. Díaz-Varela, R.; De La Rosa, R.; León, L.; Zarco-Tejada, P. High-Resolution Airborne UAV Imagery to Assess Olive Tree Crown Parameters Using 3D Photo Reconstruction: Application in Breeding Trials. Remote Sens. 2015, 7, 4213–4232. [Google Scholar] [CrossRef] [Green Version]
  13. Bareth, G.; Aasen, H.; Bendig, J.; Gnyp, M.L.; Bolten, A.; Jung, A.; Michels, R.; Soukkamäki, J. Low-weight and UAV-based Hyperspectral Full-frame Cameras for Monitoring Crops: Spectral Comparison with Portable Spectroradiometer Measurements. Photogramm.—Fernerkund.—Geoinf. 2015, 1, 69–79. [Google Scholar] [CrossRef]
  14. Bendig, J.; Willkomm, M.; Tilly, N.; Gnyp, M.L.; Bennertz, S.; Qiang, C.; Miao, Y.; Bareth, G. Very high resolution crop surface models (CSMs) from UAV-based stereo images for rice growth monitoring in Northeast China. In Proceedings of the International Archives of the Photogrammetry, Remote Sensing and Spatial Information Sciences, Rostock, Germany, 4–6 September 2013; pp. 4–6. [Google Scholar]
  15. Santesteban, L.G.; DI Gennaro, S.F.; Herrero-Langreo, A.; Miranda, C.; Royo, J.B.; Matese, A. High-resolution UAV-based thermal imaging to estimate the instantaneous and seasonal variability of plant water status within a vineyard. Agric. Water Manag. 2017, 183, 49–59. [Google Scholar] [CrossRef]
  16. Li, W.; Niu, Z.; Chen, H.; Li, D.; Wu, M.; Zhao, W. Remote estimation of canopy height and aboveground biomass of maize using high-resolution stereo images from a low-cost unmanned aerial vehicle system. Ecol. Indic. 2016, 67, 637–648. [Google Scholar] [CrossRef]
  17. Verhoeven, G. Taking computer vision aloft Archaeological three-dimensional reconstructions from aerialphotographs with photoscan. Archaeol. Prospect. 2011, 18, 67–73. [Google Scholar] [CrossRef]
  18. Bendig, J.; Bolten, A.; Bennertz, S.; Broscheit, J.; Eichfuss, S.; Bareth, G. Estimating Biomass of Barley Using Crop Surface Models (CSMs) Derived from UAV-Based RGB Imaging. Remote Sens. 2014, 6, 10395–10412. [Google Scholar] [CrossRef]
  19. Bendig, J.; Yu, K.; Aasen, H.; Bolten, A.; Bennertz, S.; Broscheit, J.; Gnyp, M.L.; Bareth, G. Combining UAV-based plant height from crop surface models, visible, and near infrared vegetation indices for biomass monitoring in barley. Int. J. Appl. Earth Obs. 2015, 39, 79–87. [Google Scholar] [CrossRef]
  20. Hoffmeister, D.; Bolten, A.; Curdt, C.; Waldhoff, G.; Bareth, G. High-resolution Crop Surface Models (CSM) and Crop Volume Models (CVM) on field level by terrestrial laser scanning. Proc. SPIE 2010, 7840, 78400E. [Google Scholar] [CrossRef]
  21. Da Cunha, J.P.A.R.; Sirqueira, M.A.; Hurtado, S.M.C. Estimating vegetation volume of coffee crops using images from unmanned aerial vehicles. Eng. Agrícola 2019, 39, 41–47. [Google Scholar] [CrossRef]
  22. Santos, L.M.; Barbosa, B.D.D.S.; Diotto, A.V.; MacieL, D.T.; Xavier, L.A.G. Biophysical parameters of coffee crop estimated by UAV RGB images. Precis. Agric. 2020, 21, 1227–1241. [Google Scholar] [CrossRef]
  23. Bento, N.L.; Ferraz, G.A.S.; Barata, R.A.P.; Soares, D.V.; Santos, L.M.D.; Santana, L.S.; Ferraz, P.F.P.; Conti, L.; Palchetti, E. Characterization of Recently Planted Coffee Cultivars from Vegetation Indices Obtained by a Remotely Piloted Aircraft System. Sustainability 2022, 14, 1446. [Google Scholar] [CrossRef]
  24. Furfaro, R.; Ganapol, B.D.; Johnson, L.F.; Herwitz, S.R. Neural network algorithm for coffee ripeness evaluation using airborne images. Appl. Eng. Agric. 2007, 23, 379–387. [Google Scholar] [CrossRef]
  25. Rosas, J.T.F.; de Carvalho Pinto Fd de Queiroz, D.M.; de Melo Villar, F.M.; Valente, D.S.M.; Martins, R.N. Monitoramento da maturação do café usando uma câmera multiespectral de baixo custo montada em VANT. Precisão Agric. 2022, 23, 300–318. [Google Scholar] [CrossRef]
  26. Johnson, L.F.; Herwitz, S.R.; Lobitz, B.M.; Dunagan, S.E. Feasibility of monitoring coffee field ripeness with airborne multispectral imagery. Appl. Eng. Agric. 2004, 20, 845–849. [Google Scholar] [CrossRef]
  27. Martello, M.; Molin, J.P.; Bazame, H.C. Obtaining and Validating High-Density Coffee Yield Data. Horticulturae 2022, 8, 421. [Google Scholar] [CrossRef]
  28. Molin, J.P.; do Amaral, L.R.; Colaço, A. Agricultura de Precisão, 1st ed.; Oficina de Textos: São Paulo, Brazil, 2015; p. 224. [Google Scholar]
  29. Miranda, J.M.; Reinato, R.A.O.; da Silva, A.B. Modelo matemático para previsão da produtividade do cafeeiro. Rev. Bras. De Eng. Agrícola E Ambient. Camp. Gd. 2014, 18, 353–361. [Google Scholar] [CrossRef]
  30. Rocha, H.G.; Da Silva, A.B.; Nogueira, D.A.; Miranda, J.M.; Mantovani, J.R. Coffee productivity mapping from mathematical models for prediction of harvest. Coffee Sci. 2016, 11, 108–116. [Google Scholar]
  31. Alvares, A.C.; Stape, J.L.; Sentelhas, P.C.; Gonçalves, J.L.M.; Sparovek, G. Koppen’s climate classification map for Brazil. Meteorol. Z. 2013, 22, 711–728. [Google Scholar] [CrossRef]
  32. Malambo, L.; Popescu, S.C.; Murray, S.C.; Putman, E.; Pughna Horne, D.W.; Bishop, M. Multitemporal field-based plant height estimation using 3D point cloudsgenerated from small unmanned aerial systems high-resolution imagery. Int. J. Appl. EarthObservation Geoinf. 2018, 64, 31–42. [Google Scholar] [CrossRef]
  33. Maldaner, L.F.; Molin, J.P. Data processing within rows for sugarcane yield mapping. Sci. Agric. 2020, 77, e20180391. [Google Scholar] [CrossRef]
  34. Minasny, B.; Mcbratney, A.B.; Whelan, B.M. Vesper, Version 1.62. Australian Centre for Precision Agriculture, McMillan Building A05. The University of Sydney: Sydney, Australia, 2005.
  35. Chang, C.W.; Laird, D.A.; Mausbach, M.J.; Hurburgh, C.R. Near-infrared reflectance spectroscopy–principal components regression analyses of soil properties. Soil Sci. Soc. Am. J. 2011, 65, 480–490. [Google Scholar] [CrossRef]
  36. Barbosa, B.; Ferraz, G.A.S.; Dos Santos, L.M.; Santana, L.; Marin, D.B.; Rossi, G.; Conti, L. Application of RGB images obtained by uav in coffee farming. Remote Sens. 2021, 13, 2397. [Google Scholar] [CrossRef]
  37. Acorsi, M.G.; Miranda, F.D.A.; Martello, M.; Smaniotto, D.A.; Sartor, L.R. Estimating biomass of black oat using UAV-based RGB imaging. Agronomy 2019, 9, 344. [Google Scholar] [CrossRef]
  38. Grüner, E.; Astor, T.; Wachendor, F.M. Biomass prediction of heterogeneous temperate grasslands using an SfM approach based on UAV imaging. Agronomy 2019, 9, 54. [Google Scholar] [CrossRef]
  39. Panagiotidis, D.; Abdollahnejad, A.; Surový, P.; Chiteculo, V. Determining tree height and crown diameter from high-resolution UAV imagery. Int. J. Remote Sens. 2016, 38, 2392–2410. [Google Scholar] [CrossRef]
  40. Zarco-Tejada, P.J.; Diaz-Varela, R.; Angileri, V.; Loudjani, P. Tree Height Quantification Using Very High Resolution Imagery Acquired from an Unmanned Aerial Vehicle (UAV) and Automatic 3D Photo-Reconstruction Methods. Eur. J. Agron. 2014, 55, 89–99. [Google Scholar] [CrossRef]
  41. Hobart, M.; Pflanz, M.; Weltzien, C.; Schirrmann, M. Growth Height Determination of Tree Walls for Precise Monitoring in Apple Fruit Production Using UAV Photogrammetry. Remote Sens. 2020, 12, 1656. [Google Scholar] [CrossRef]
  42. Santinato, F. Inovações Tecnológicas para Cafeicultura de Precisão. Ph.D. Thesis, Faculdade de Ciências Agrárias e Veterinárias—UNESP, Jaboticabal, SP, Brazil, 2016; 125p. [Google Scholar]
  43. Cannell, M.G.R. Crop physiological aspects of coffee bean yield—A review. Kenya Coffee 1976, 41, 245–253. [Google Scholar]
  44. Pereira, S.O.; Bartholo, G.F.; Baliza, D.P.; Sogreira, F.M.; Guimarães, R.J. Productivity and coffee biannuality depending on the crop spacing. Pesqui. Agropecuária Bras. 2011, 46, 152–160. [Google Scholar] [CrossRef]
  45. Valadares, S.V.; Neves, J.C.L.; Rosa, G.N.G.P.; Martinez, H.E.P.; Venegas, V.H.A.; Lima, P.C. Productivity and biennial production of dense coffee plantations under different doses of N and K. Pesqui. Agropecuária Bras. 2013, 13, 96–303. [Google Scholar]
  46. Gil, E.; Escolà, A.; Rosell, J.R.; Planas, S.; Val, L. Variable rate application of plant protection products in vineyard using ultrasonic sensors. Crop Prot. 2007, 26, 1287–1297. [Google Scholar] [CrossRef]
  47. Siegfried, W.; Viret, O.; Huber, B.; Wohlhauser, R. Dosage of plant protection products adapted to leaf area index in viticulture. Crop Prot. 2007, 26, 73–82. [Google Scholar] [CrossRef]
  48. Rena, A.B.; Maestri, M. Fisiologia do cafeeiro. Inf. Agropecuário 1985, 11, 26–40. [Google Scholar]
  49. Colaço, A.F.; Molin, J.P.; Rosell-Polo, J.R.; Escolà, A. Spatial variability in commercial orange groves. Part 2: Relating canopy geometry to soil attributes and historical yield. Precis. Agric. 2019, 20, 805–822. [Google Scholar] [CrossRef]
  50. Peloso, A.F.; Tatagiba, S.D.; Amaral, J.F.T. Limitations of vegetative growth in arabica coffee plants promoted by water deficit. Rev. Eng. Na Agric. 2017, 25, 139–147. [Google Scholar]
  51. Pilau, F.G.; Angelocci, L.R. Patterns of interception of solar radiation by coffee trees as a function of leaf area. Coffee Sci. 2016, 11, 127–136. [Google Scholar]
  52. De Camargo, A.P.; de Camargo, M.B.P. Definition and outline for the phenological phases of arabic coffee under Brazilian tropical conditions. Bragantia 2001, 60, 65–68. [Google Scholar]
  53. Fialho, C.M.T.; Silva, G.R.; Freitas, M.A.M.; França, A.C.; Mello, C.A.D.; Silva, A.A. Competition of weeds with coffee plants, in two times of infestation. Planta Daninha 2011, 28, 969–978. [Google Scholar] [CrossRef]
  54. Carvalho, A.M.; Mendes, A.N.; Botelho, C.E.; Oliveira, A.C.; Rezende, J.C.; Rezende, R.M. Agronomic performance of coffee cultivars resistant to coffee rust in Minas Gerais state, Brazil. Bragantia 2012, 71, 481–487. [Google Scholar] [CrossRef]
  55. Lopes, P.R.; Araújo, K.C.S.; Ferraz, J.M.G.; Lopes, I.M.; Fernandes, L.G. Producing agroecological coffee in Southern Minas Gerais: Alternative systems forintensive production of agrochemicals. Rev. Bras. Agroecol. 2012, 7, 25–38. [Google Scholar]
  56. Wadt, P.G.S.; Dias, J.R.M. Regional and inter-regional DRIS norms for nutritional evaluation of Conilon coffee. Pesqui. Ag-Ropecuária Bras. 2012, 47, 822–830. [Google Scholar] [CrossRef]
  57. Scalco, M.S.; Alvarenga, L.A.; Guimarães, R.J.; Dominghetti, A.W.; Colombo, A.; Assis, G.A.; Abreu, G.F. Leaf contents of phosphorus and zinc, productivity, and growth of irrigated coffee. Pesqui. Agropecuária Bras. 2014, 49, 95–101. [Google Scholar] [CrossRef] [Green Version]
Figure 1. (a) General map of the study area; (b) map with details regarding the flight plan, ground control points and height validation points.
Drones 06 00267 g001
Figure 2. Flowchart of aerial image processing to obtain the DTM and DSM.
Drones 06 00267 g002
Figure 3. Flowchart of the plant individualization processing and extraction of PH and PV metrics.
Drones 06 00267 g003
Figure 4. Flowchart of the spatio-temporal relationship between image data and coffee crop yield.
Drones 06 00267 g004
Figure 5. Linear regression between plant heights deviated from CSM (PHCSM) and manual height measurements (PHREF).
Drones 06 00267 g005
Figure 6. Correlation matrix, *** means p-value < 0.001. (a) Among the PH data; (b) among the PV data.
Drones 06 00267 g006
Figure 7. PH and PV interpolated data. (a) PH obtained in C1; (b) PV obtained in C1; (c) PH obtained in C2; (d) PV obtained in the C2; (e) PH obtained in C3; (f) PV obtained in C3; (g) PH obtained in C4; (h) PV obtained in C4; (i) PH obtained in C5; (j) PV obtained in C5; (k) PH obtained in C6; (l) PV obtained in C6; (m) PH obtained in C7; (n) PV obtained in C7.
Drones 06 00267 g007
Figure 8. (a) Harvest yield data Y1 (July 2019); (b) yield estimated with PH-C1; (c) yield estimated with PV-C1.
Drones 06 00267 g008
Figure 9. (a) Harvest yield data Y2 (June 2020); (b) yield estimated with PH-C1; (c) yield estimated with PV-C1; (d) yield estimated with PH-C2; (e) yield estimated with PV-C2; (f) yield estimated with PH-C3; (g) yield estimated with PV-C3; (h) yield estimated with PH-C4; (i) yield estimated with PV-C4; (j) yield estimated with PH-C5; (k) yield estimated with PV-C5.
Drones 06 00267 g009
Figure 10. (a) Harvest yield data Y3 (July 2021); (b) yield estimated with PH-C5; (c) yield estimated with PV-C5; (d) yield estimated with PH-C6; (e) yield estimated with PV-C6; (f) yield estimated with PH-C7; (g) yield estimated with PV-C7.
Drones 06 00267 g010
Table 1. Details of each collection referring to date, phenological stages and number of images obtained.
CollectionStageDateLocal TimeImages
C1Pre-harvest9 July 201911:57407
C2Post-harvest13 July 201911:10406
C3Flowering29 September 201911:02401
C4Fruit filling20 March 202013:47401
C5Pre-harvest29 May 202013:15402
C6Post-harvest3 June 202012:15404
C7Pre-harvest24 June 202112:49405
Table 2. Descriptive statistics of raw and filtered PH and PV data.
Variable *UnitnMeanMinMaxSDCV (%)nMeanMinMaxSDCV (%)
Raw DataFiltered Data
PV-C1m351,1962.300.044.640.4821.1027,3292.311.443.420.3113.50
PV-C2m351,1962.160.024.500.4922.5926,2052.201.293.230.3214.59
PV-C3m351,1962.210.024.910.4922.2329,4412.251.193.290.3615.79
PV-C4m351,1962.860.105.710.5117.9629,0992.801.753.860.3010.86
PV-C5m351,1962.840.185.580.4917.4228,1432.791.813.670.269.31
PV-C6m351,1962.790.045.840.4716.8929,0022.751.913.630.238.50
PV-C7m351,1962.830.025.770.5820.5825,4952.811.693.970.3612.92
PH-C1m51,1962.660.443.660.3212.1342,3642.711.663.410.269.55
PH-C2m51,1962.600.364.060.3513.4740,1962.671.523.370.2810.53
PH-C3m51,1962.660.323.700.3312.5243,1602.711.723.430.279.98
PH-C4m51,1962.930.653.860.258.5246,9712.952.003.590.206.78
PH-C5m51,1962.820.483.750.248.5445,9822.852.003.410.186.47
PH-C6m51,1962.890.613.970.258.5945,7032.932.093.540.186.17
PH-C7m51,1962.940.333.900.3311.2942,8382.991.93.70.279.11
* PH is plant height, PV is plant volume and C is collections.
Table 3. Temporal relationship of the PH and PV data with the yields obtained in the 2019 (Y1), 2020 (Y2) and 2021 (Y3) crops. The results show the performance of yield prediction (obtained in the full cross-validation) using simple linear regression models.
In Comparison with Y1In Comparison with Y2In Comparison with Y3
C1C1C2C3C4C5C5C6C7
----------------------------------------------PHCSM---------------------------------------------
r−0.250.880.900.860.670.43−0.15−0.15−0.65
R20.060.770.810.750.450.180.020.020.42
RMSE0.280.240.220.250.370.450.430.430.33
RMSE%21.3811.8810.7212.3718.1822.2729.1029.1322.38
RPD1.032.072.301.991.351.111.011.011.32
----------------------------------------------PVCSM---------------------------------------------
r−0.320.900.920.860.690.28−0.10−0.07−0.77
R20.100.800.840.730.480.080.010.000.59
RMSE0.270.220.200.260.360.480.430.430.28
RMSE%20.9210.939.7712.7517.7723.6229.3029.3818.84
RPD1.052.252.521.931.391.041.011.001.56
Publisher’s Note: MDPI stays neutral with regard to jurisdictional claims in published maps and institutional affiliations.