
Large-Scale Earthwork Progress Digitalization Practices Using Series of 3D Models Generated from UAS Images


Abstract
:1. Introduction
2. Related Studies
2.1. 3D Construction Topographic Modeling
2.2. Earthwork Progress Digitalization Using UAS
3. Earthwork Progress Digitalization Practices Using UAS
3.1. Overall Framework
3.2. Cartography Using UAS Images for 3D Earthwork Construction Topographic Map
3.2.1. Summary
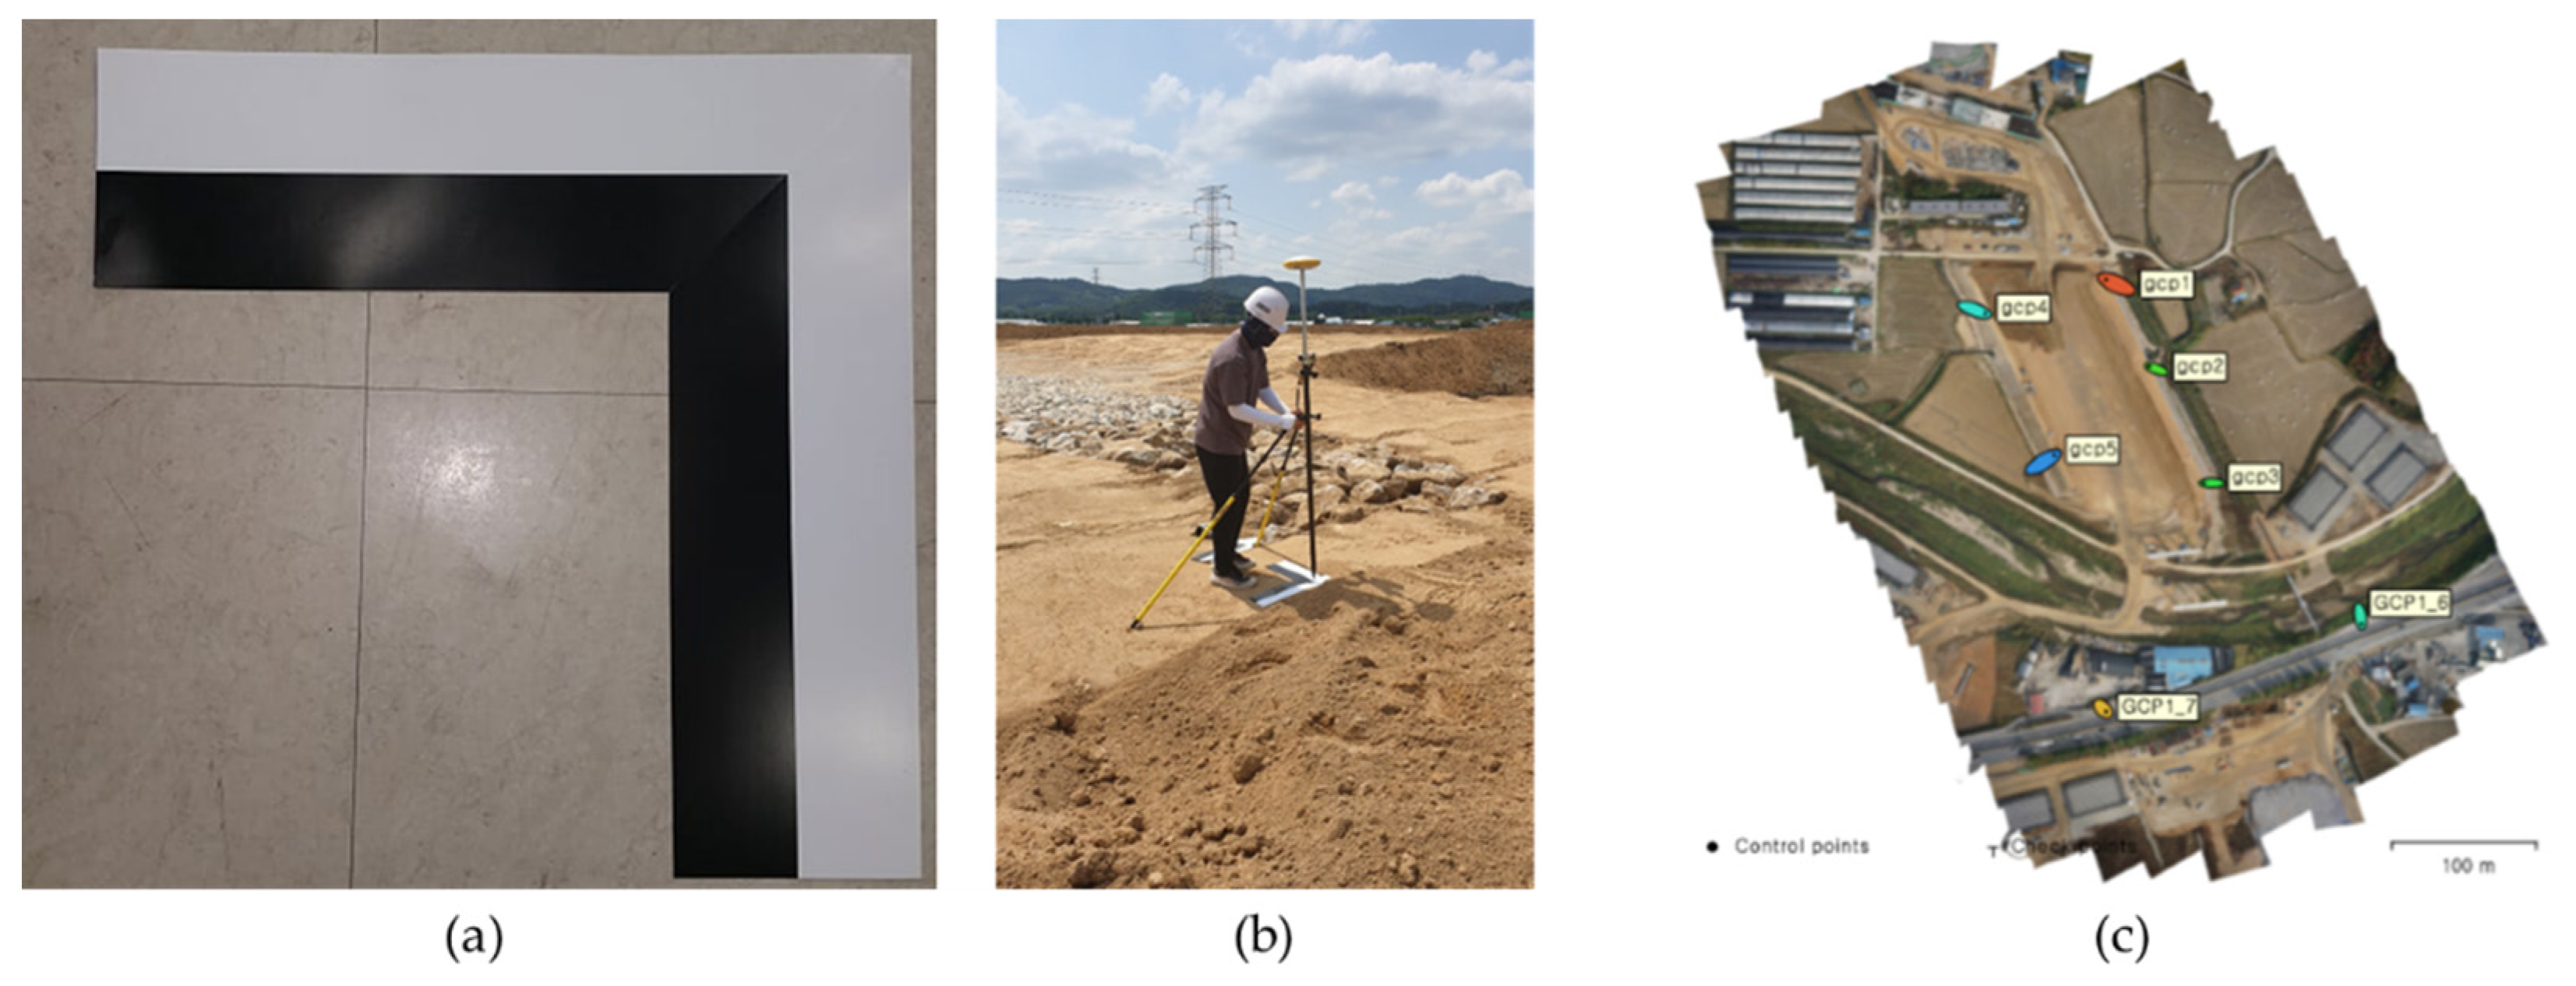
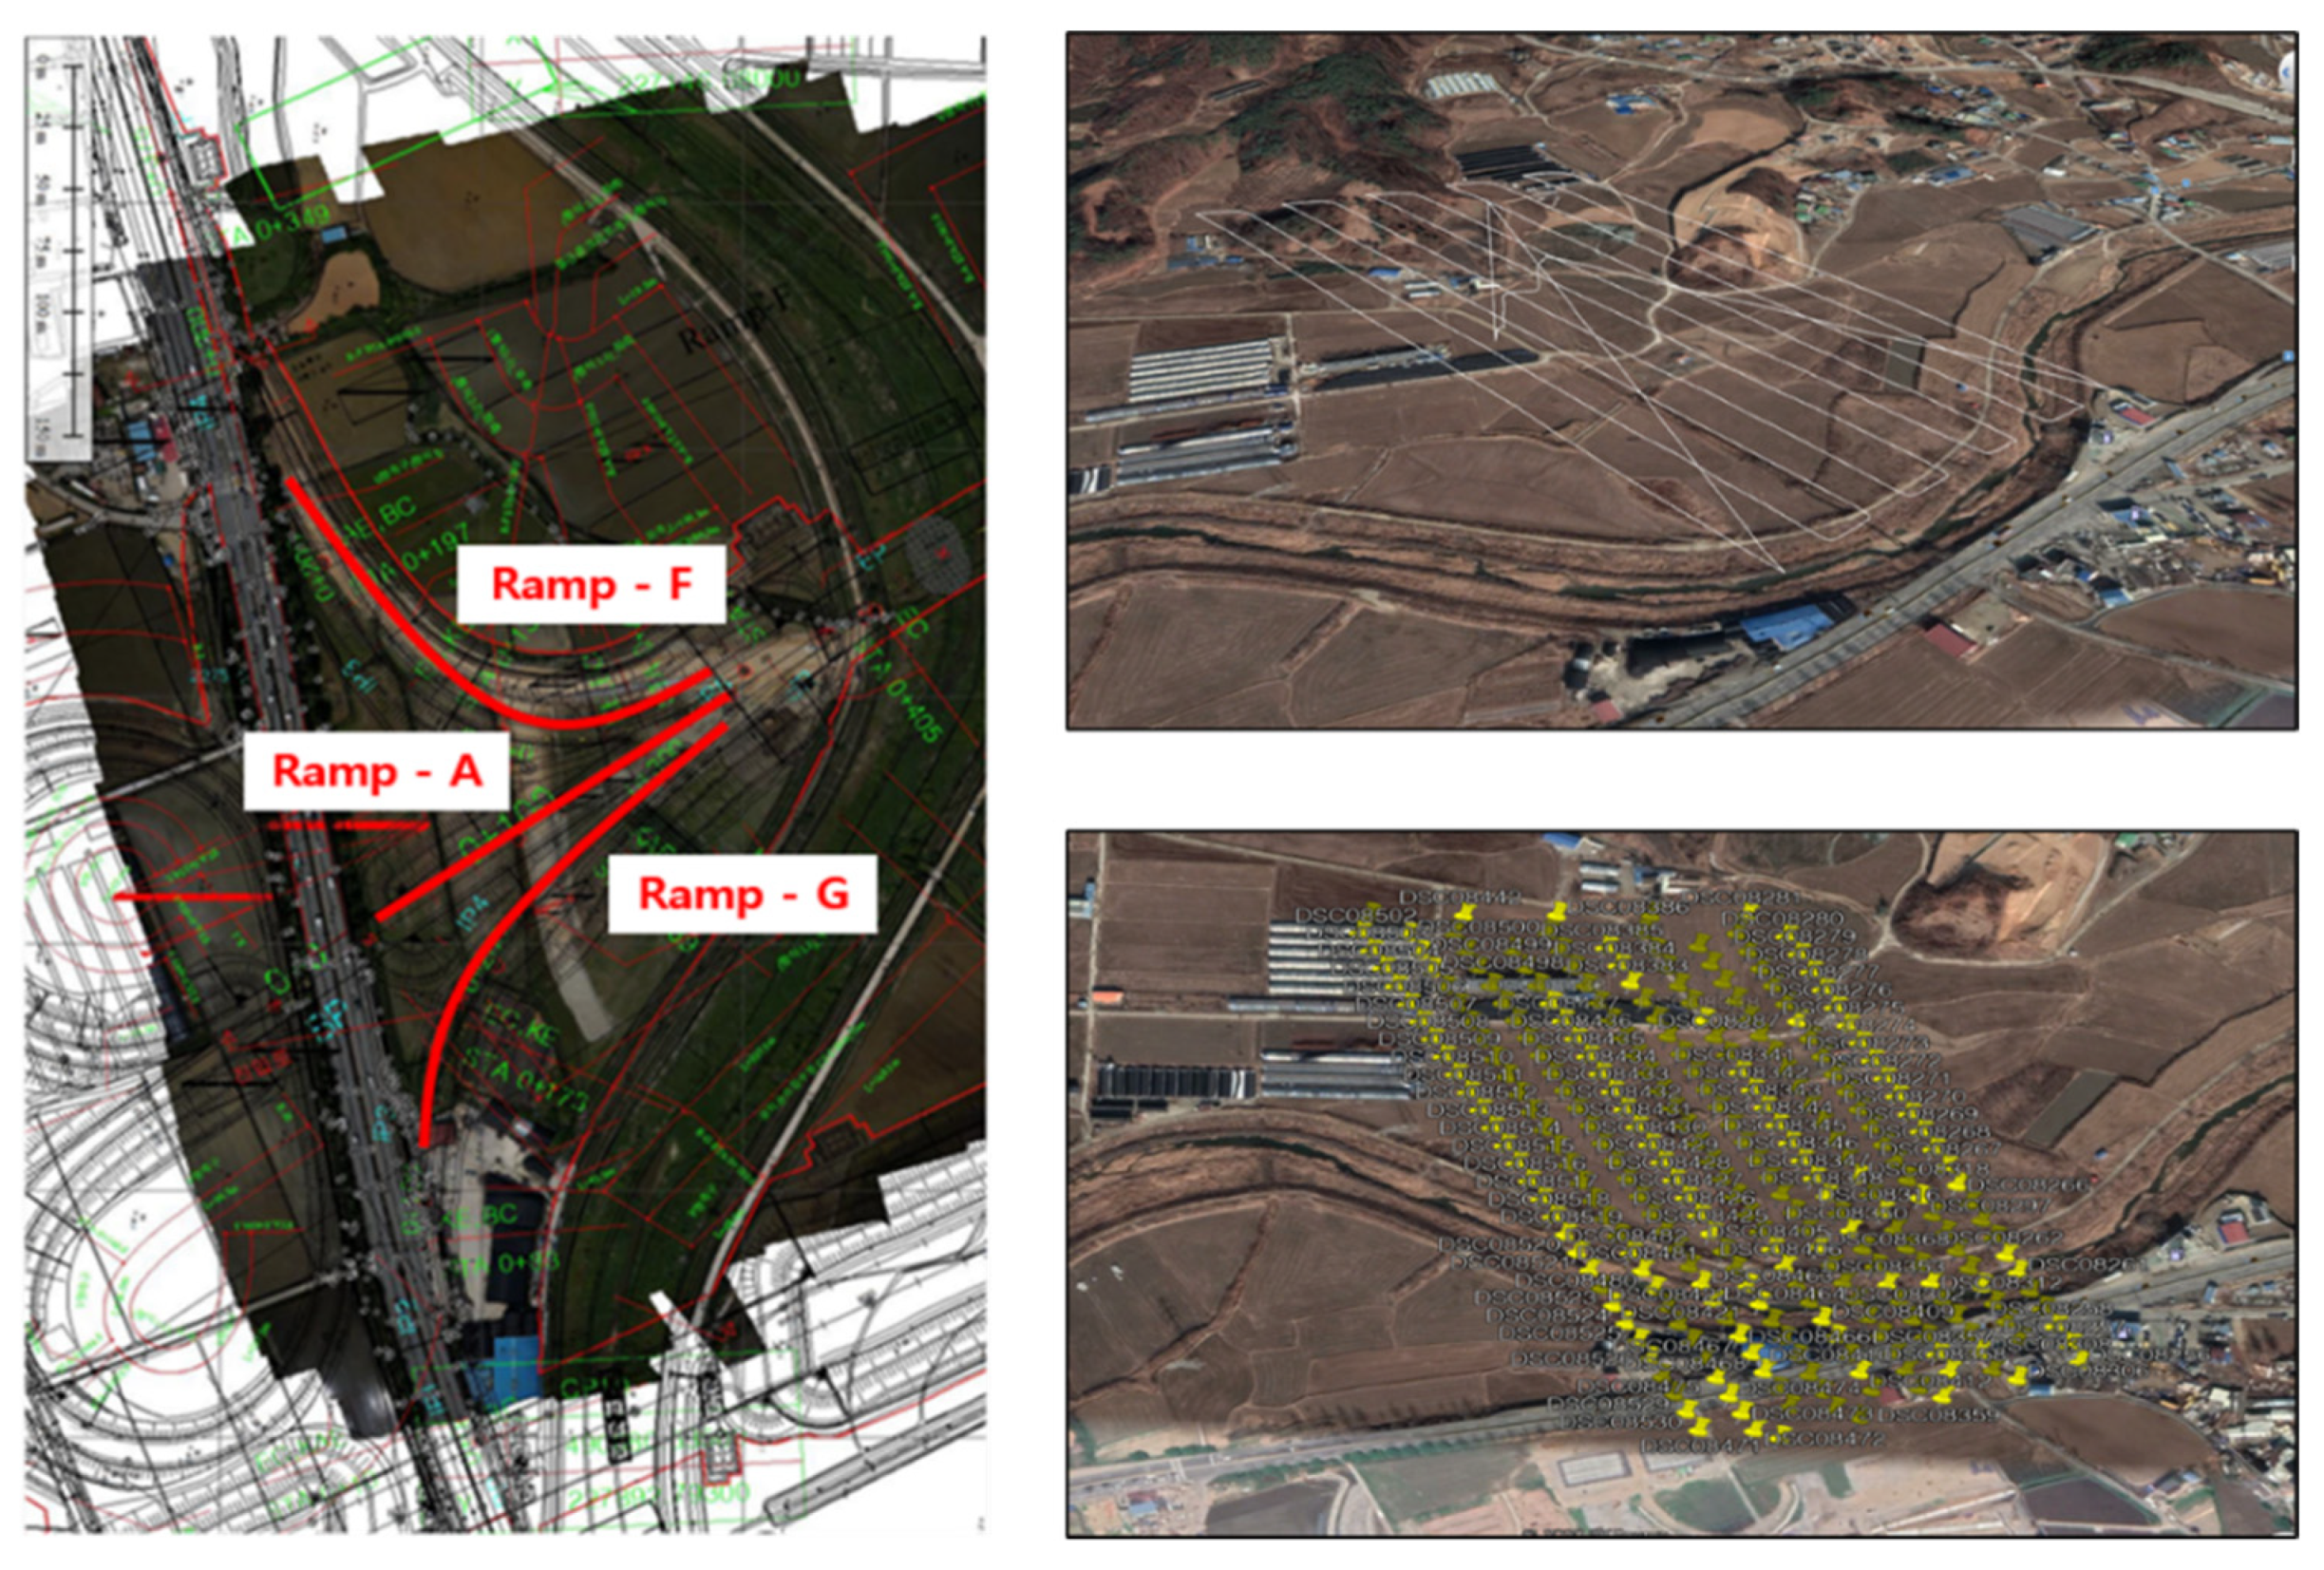
3.2.2. Path Planning and Georeferencing Considering Safety
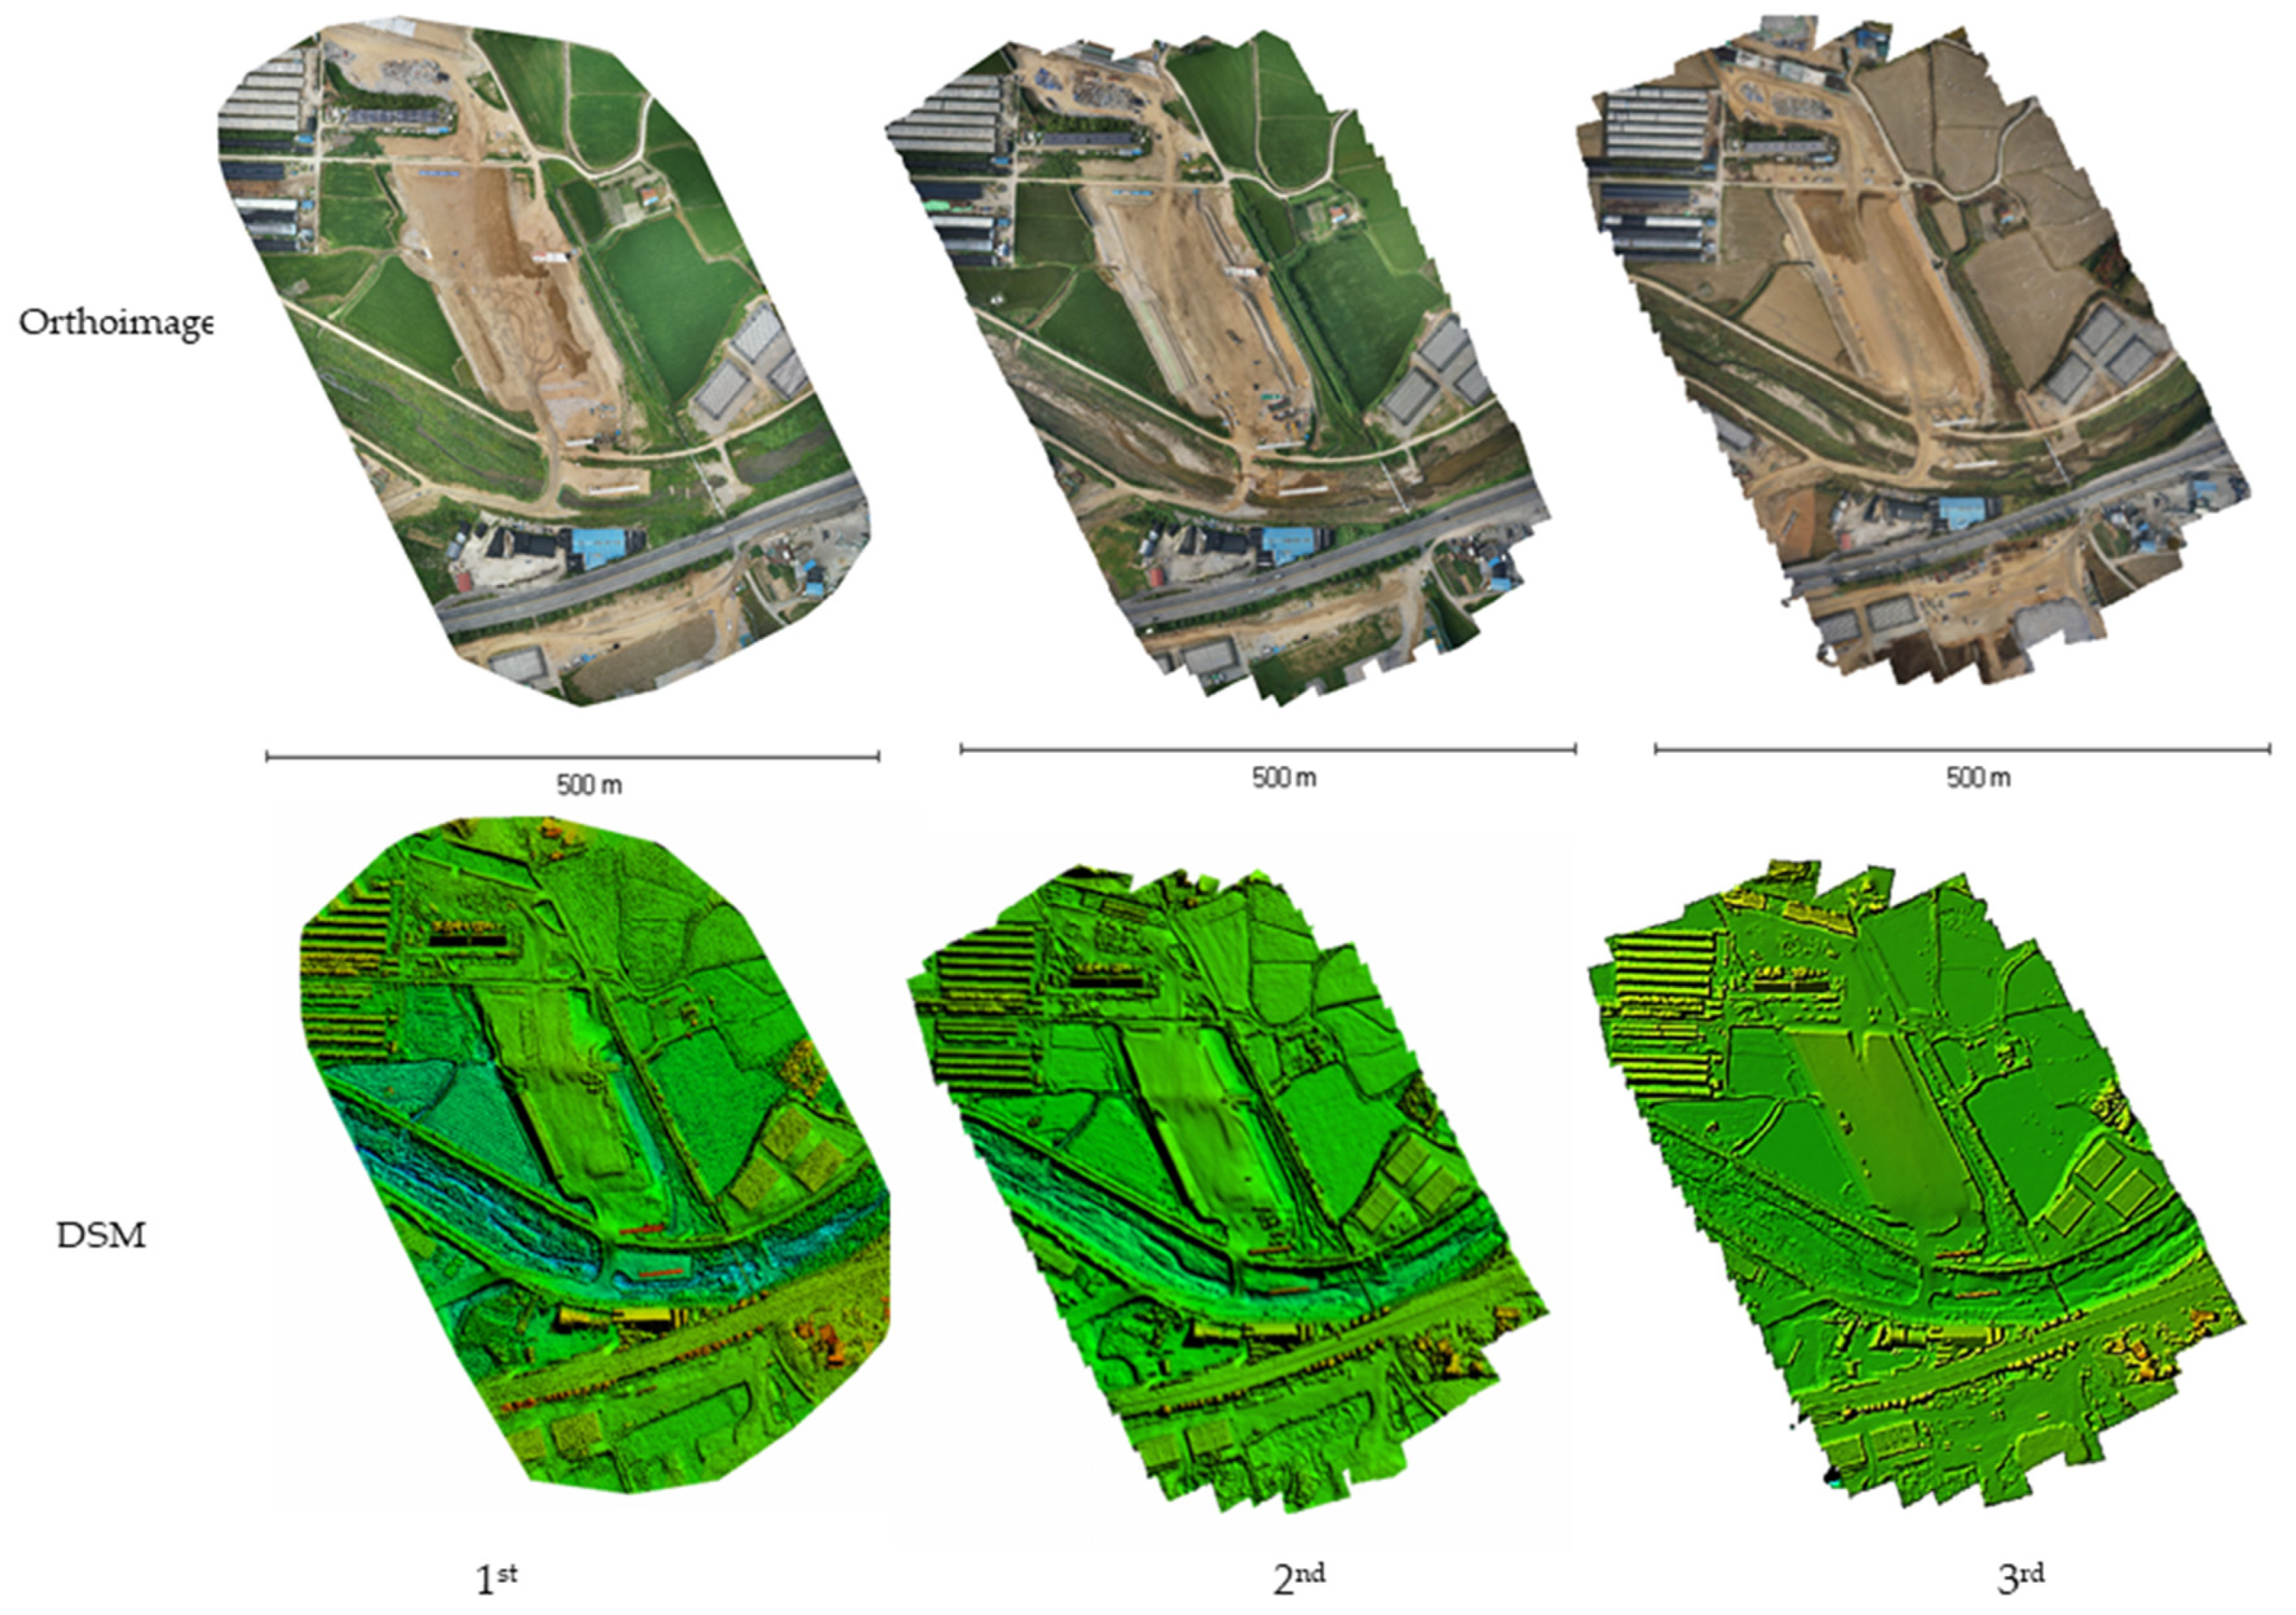
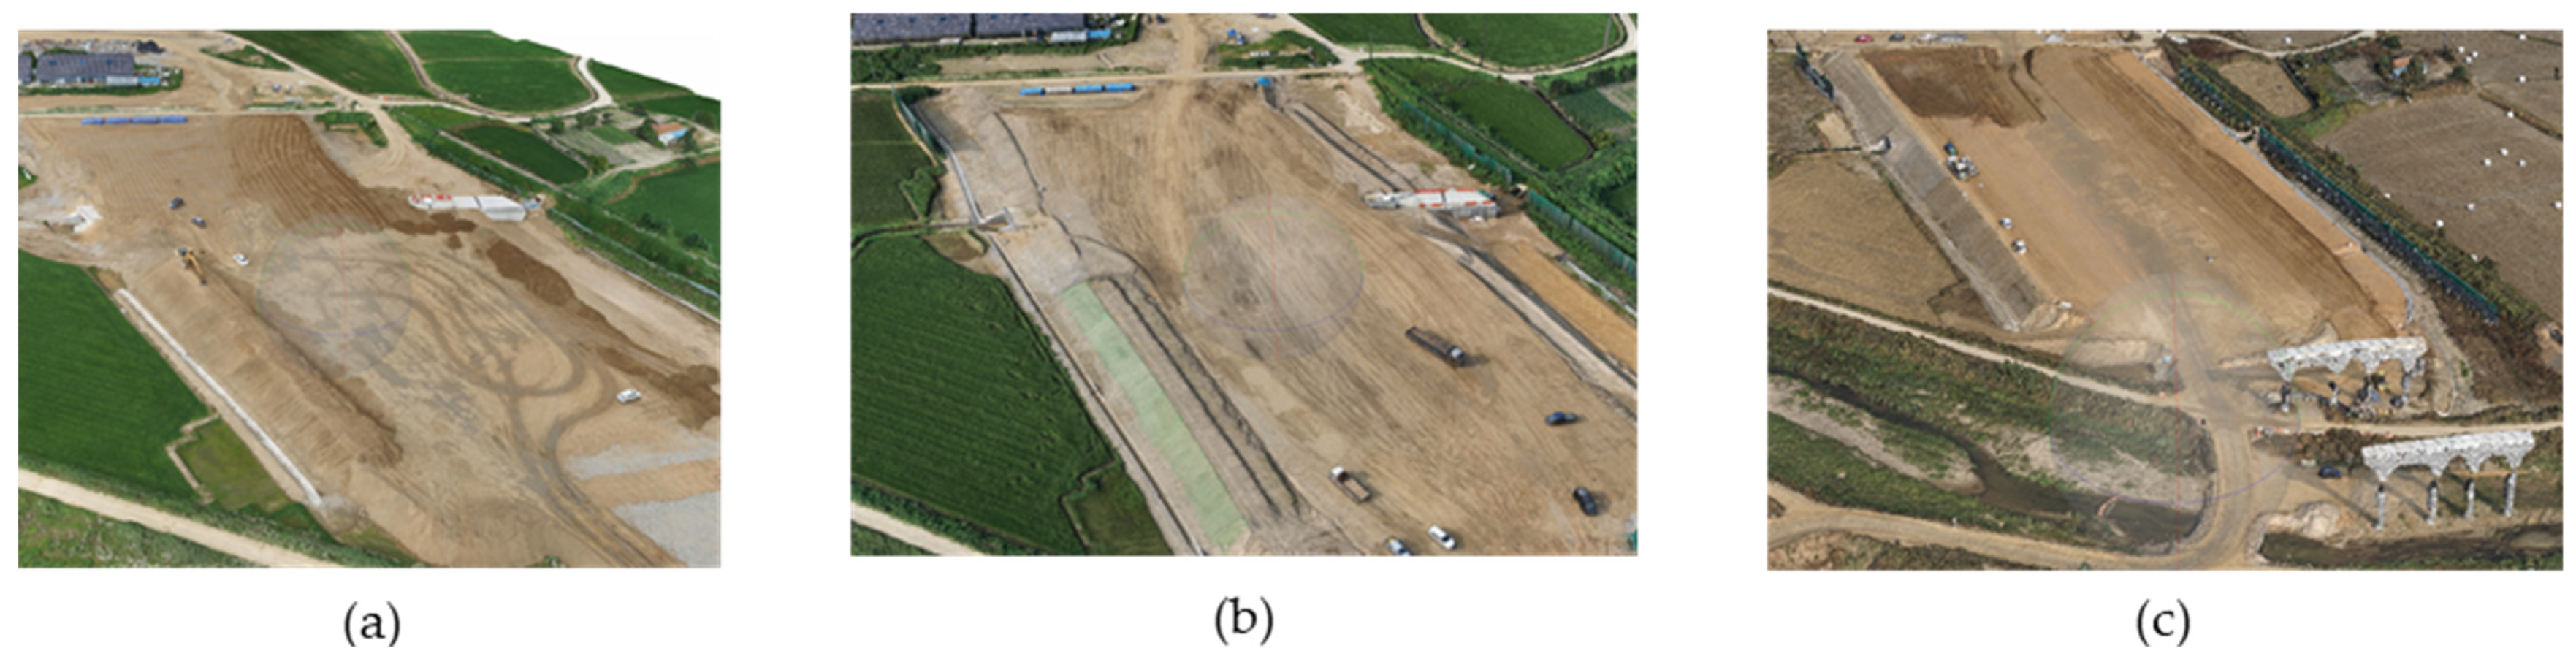
3.2.3. 3D Topographic Model Generation and Evaluation
3.3. Development of Earthwork Progress Digitalization System
- Importing UAS-generated point clouds;
- Aligning point clouds;
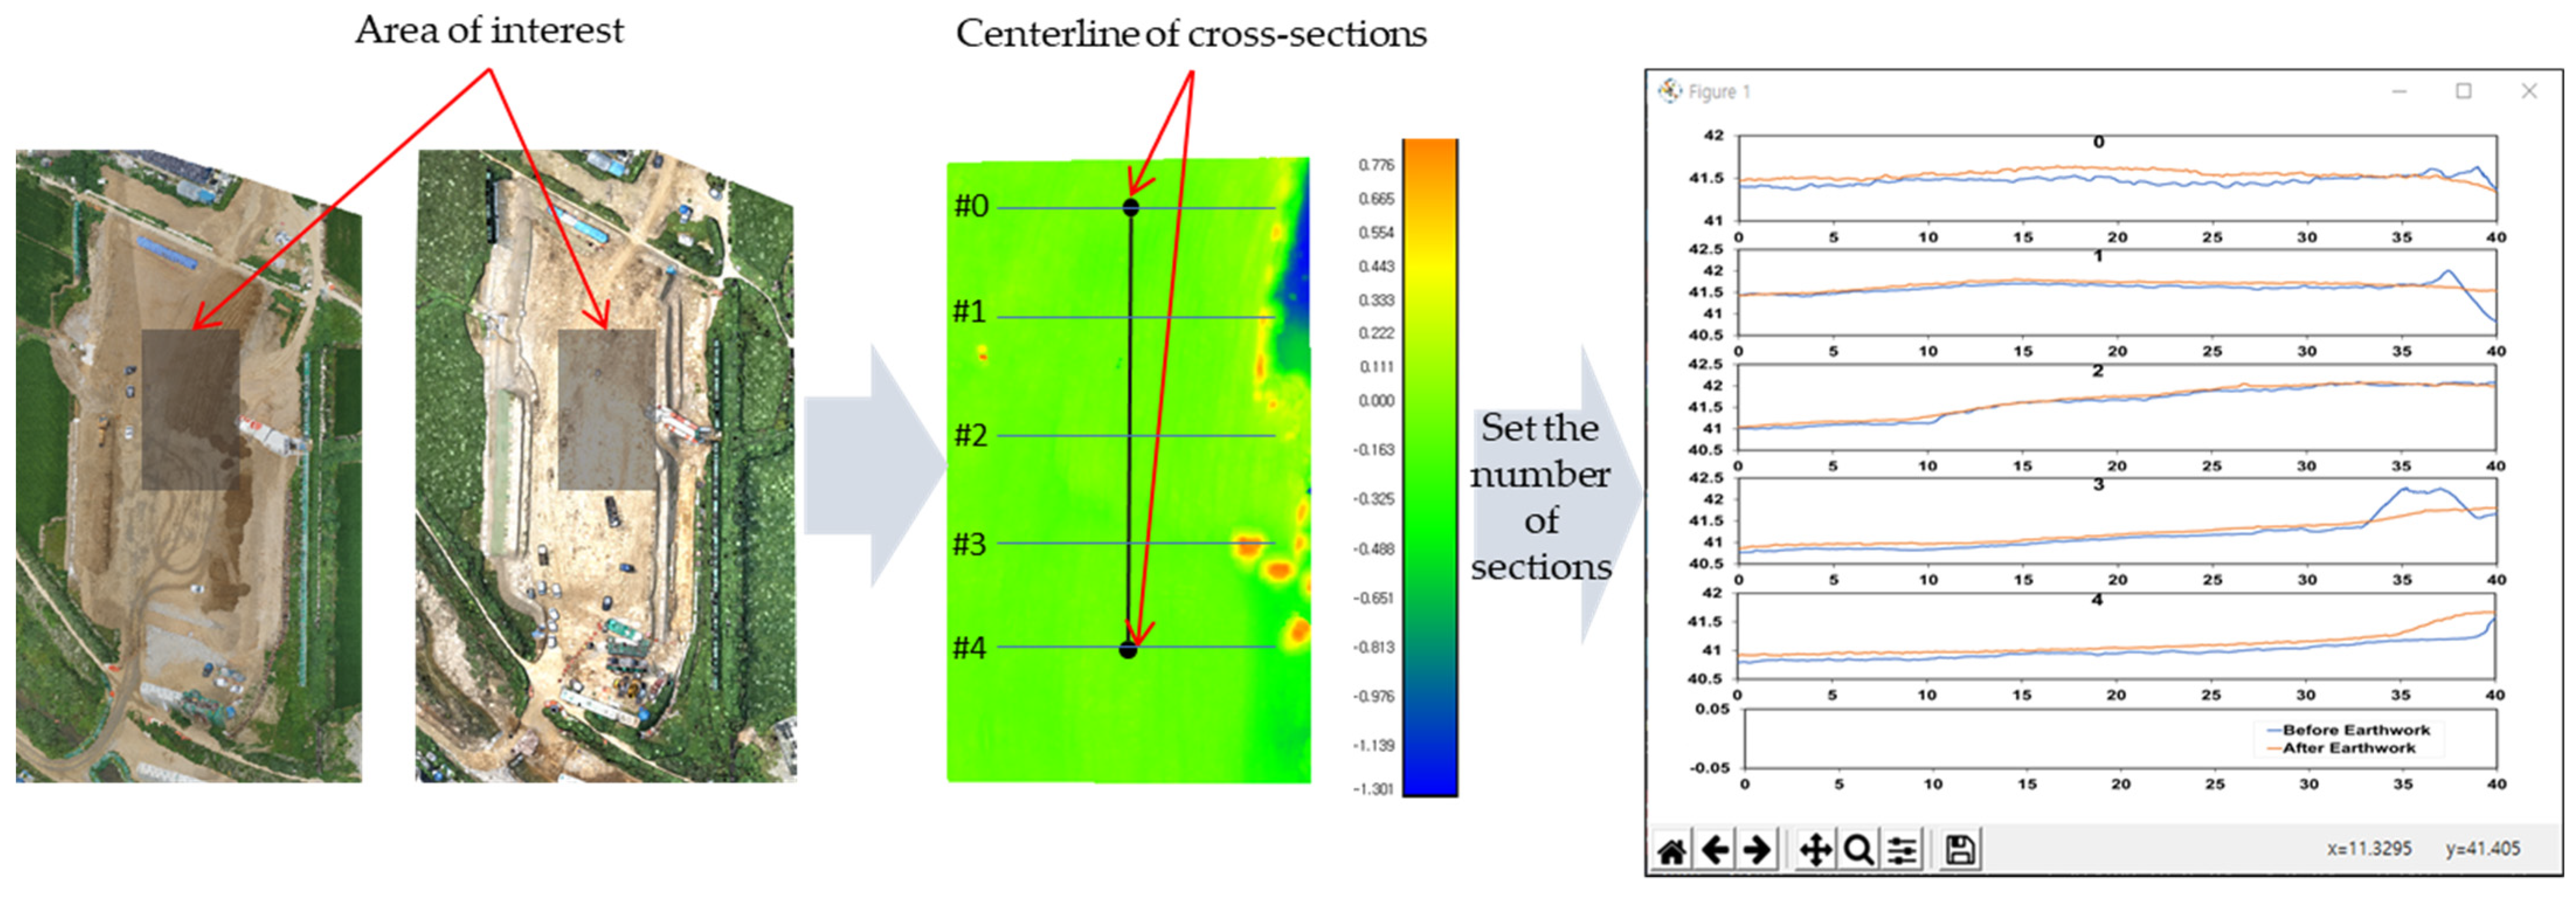
- Setting and extracting the area of interest;
- Estimating cut and fill volume;
- Generating cross-section views;
- Drawing geo-fencing.
3.3.1. Model Alignment
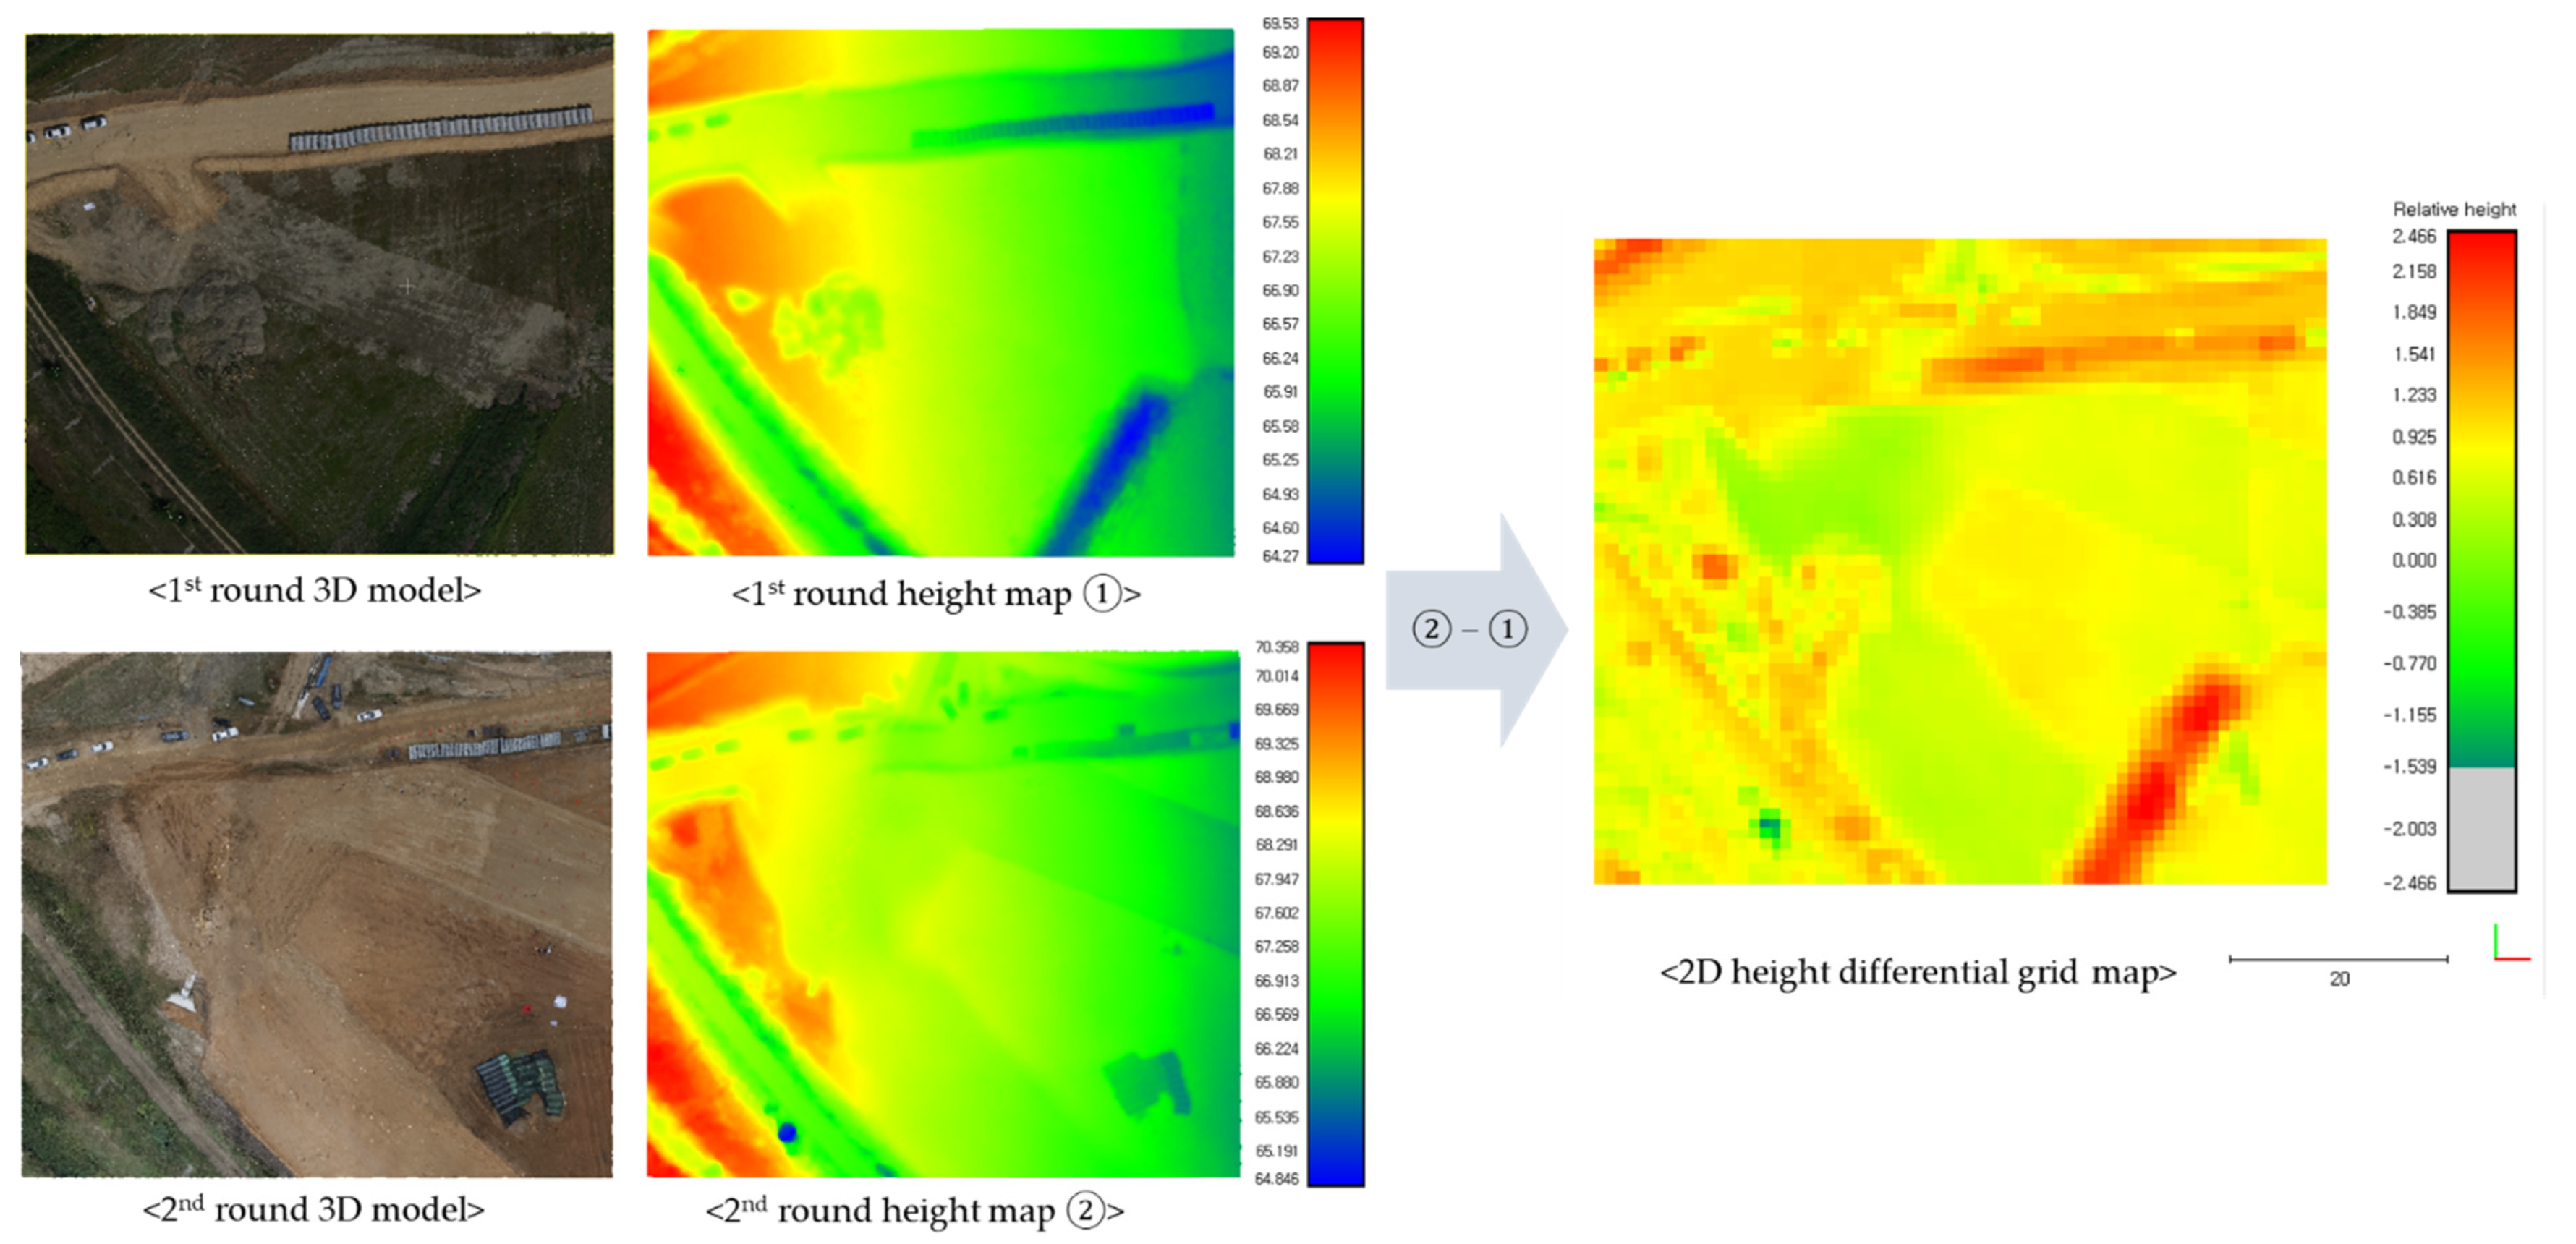
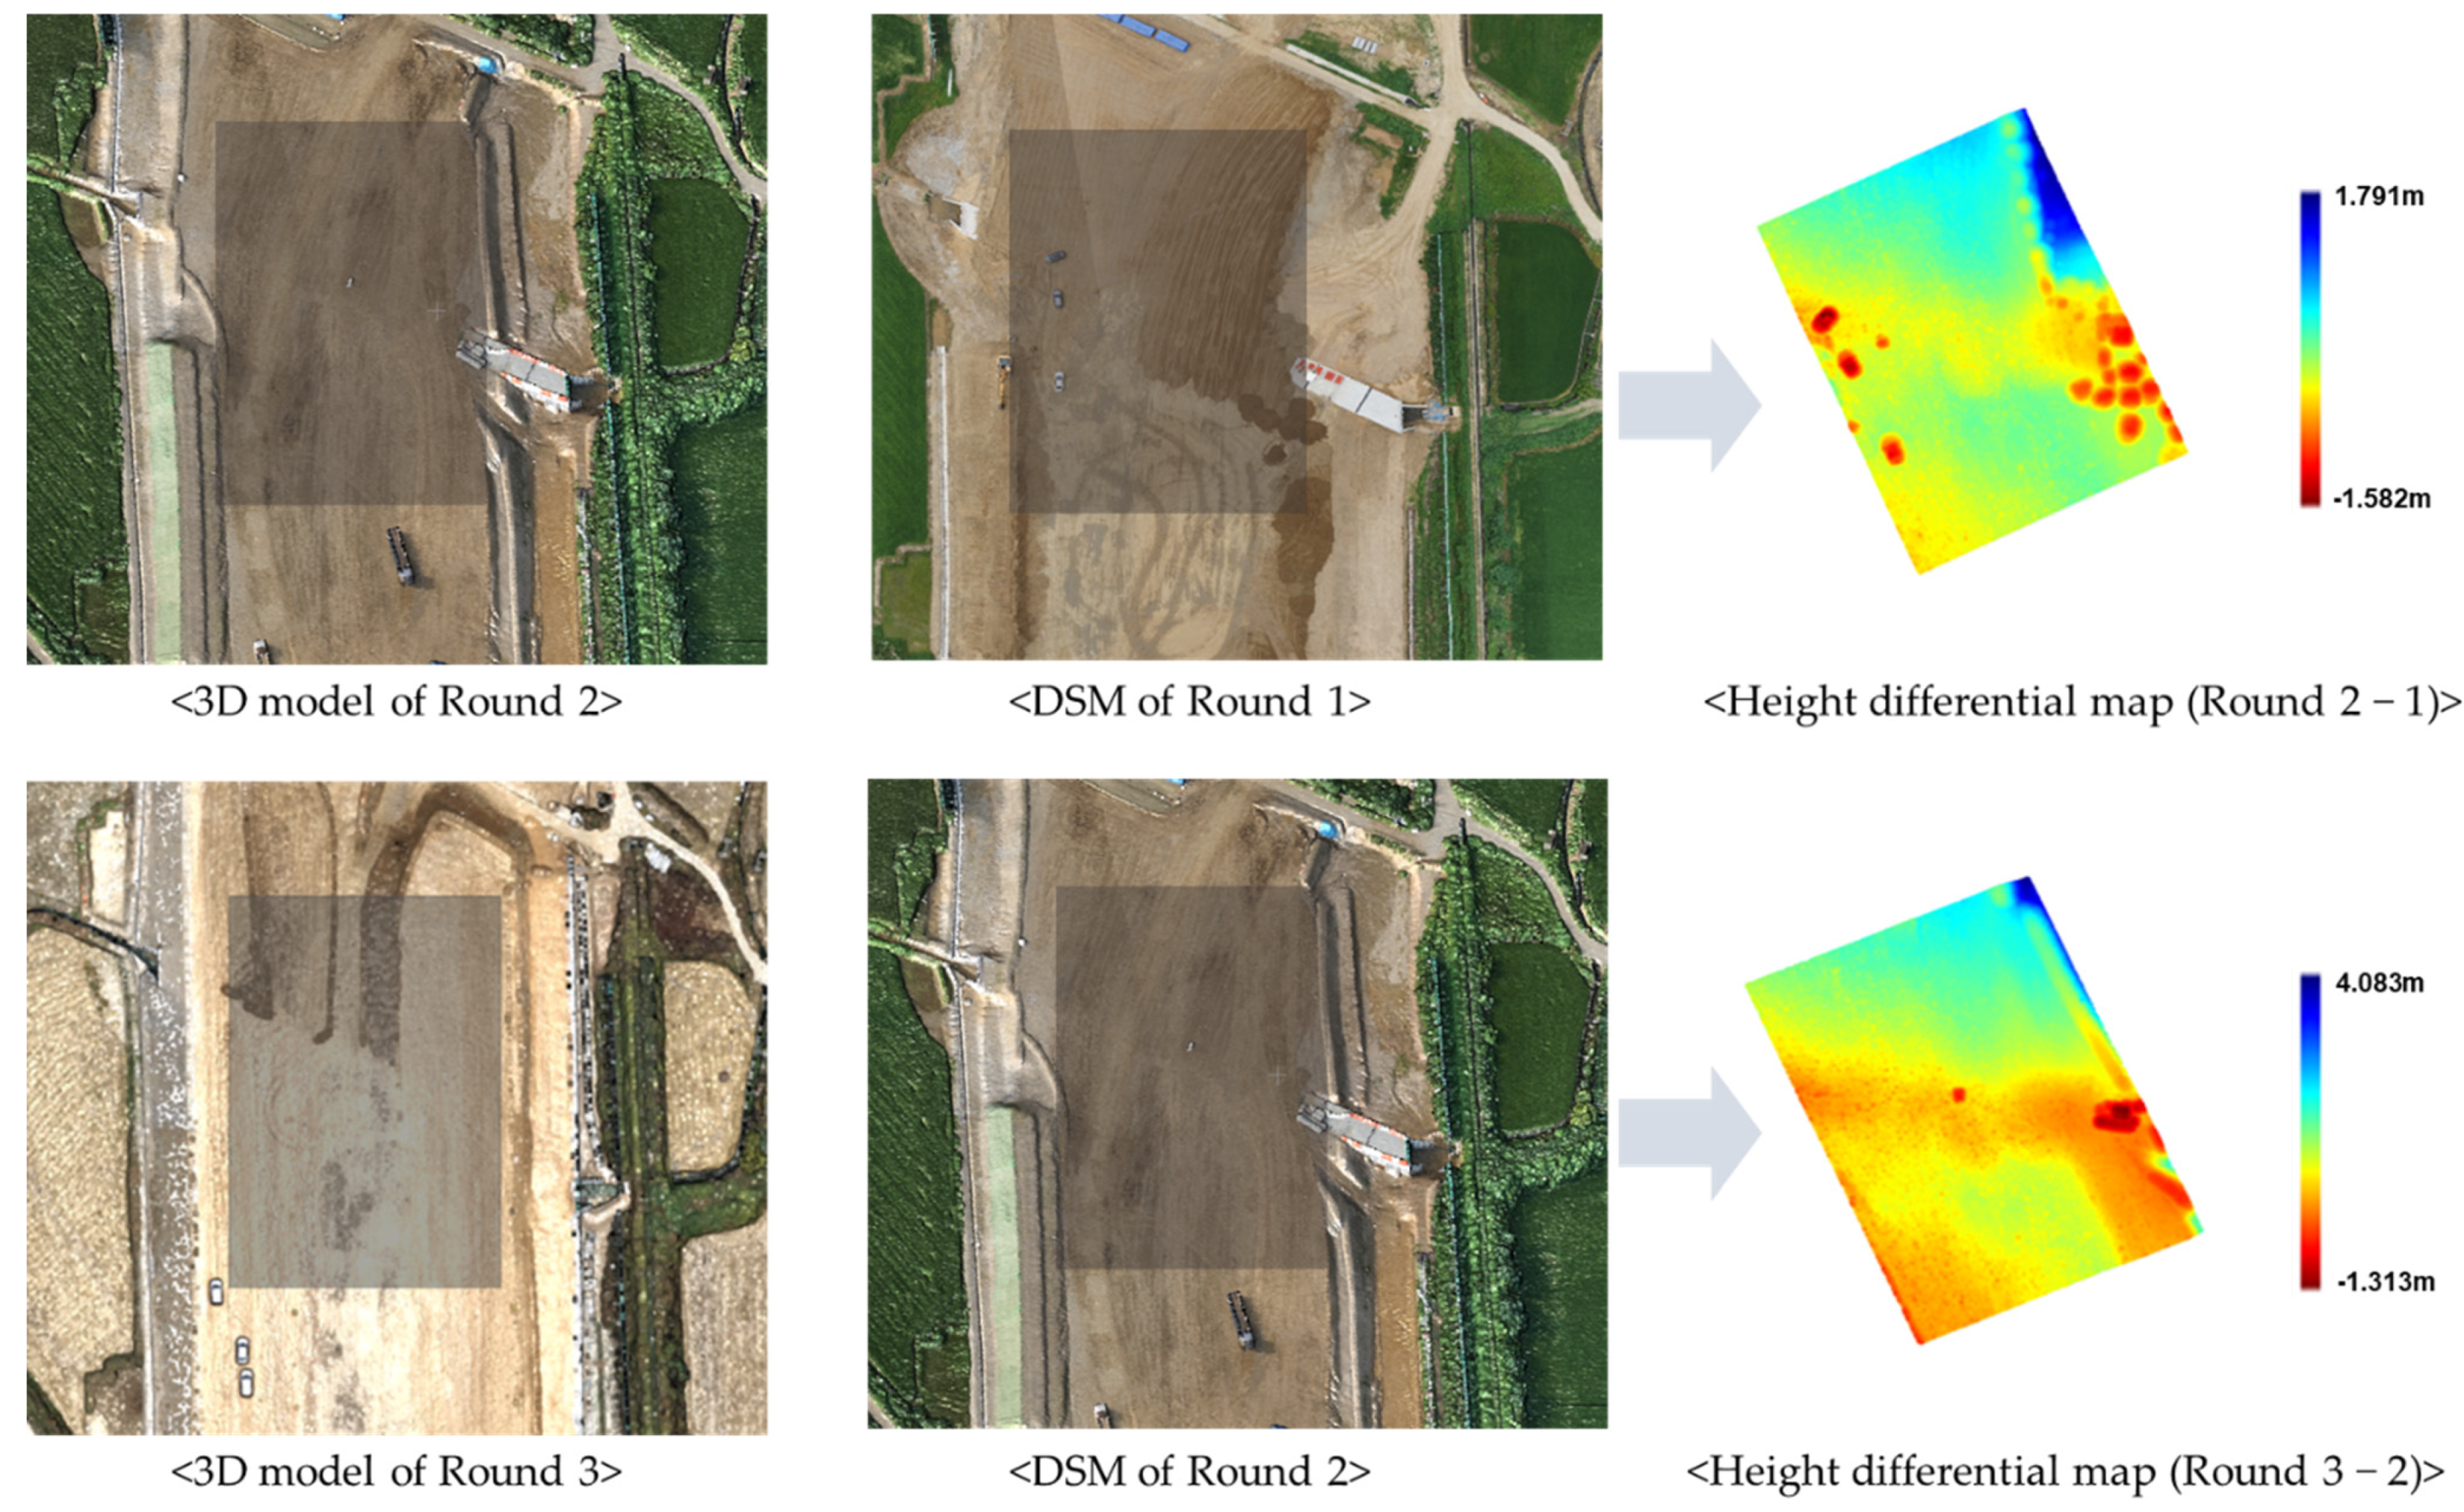
3.3.2. Volume Estimation
3.3.3. Cross-Section View Generation
3.3.4. Geo-Fencing
- Find the k number of nearest neighboring points;
- Set the initial normal ;
- Build triangles using points from and then compute the corresponding normal vectors .
4. Discussion
5. Conclusions
Author Contributions
Funding
Institutional Review Board Statement
Informed Consent Statement
Data Availability Statement
Acknowledgments
Conflicts of Interest
References
- Štefanič, M.; Stankovski, V. A review of technologies and applications for smart construction. In Proceedings of the Institution of Civil Engineers-Civil Engineering; Thomas Telford Ltd.: London, UK, 2018; pp. 83–87. [Google Scholar]
- Liu, D.; Lu, W.; Niu, Y. Extended technology-acceptance model to make smart construction systems successful. J. Constr. Eng. Manag. 2018, 144, 4018035. [Google Scholar] [CrossRef]
- Azar, E.R.; Kamat, V.R. Earthmoving equipment automation: A review of technical advances and future outlook. J. Inf. Technol. Constr. 2017, 22, 247–265. [Google Scholar]
- Han, S.-W.; Lee, S.-Y.; Halpin, D.W. Productivity evaluation of the conventional and GPS-based earthmoving systems using construction simulation. In Proceedings of the Construction Research Congress 2005: Broadening Perspectives, San Diego, CA, USA, 5–7 April 2005; pp. 1–9. [Google Scholar]
- Kim, S.-K.; Min, S.-G. Development of a work information model and a work path simulator for an intelligent excavation. J. Korean Soc. Civ. Eng. 2012, 32, 259–267. [Google Scholar]
- Park, J.S.; Seo, J.W. Application of Construction Equipment Fleet Management System through the Case Study of Air and Vessel Traffic Control Technology. J. Korean Soc. Civ. Eng. 2015, 35, 493–500. [Google Scholar] [CrossRef] [Green Version]
- Gwak, H.-S.; Seo, J.-W.; Lee, D.-E. Earthmoving haul-route searching method for energy saving based on evolutionary algorithm. J. Archit. Inst. Korea Struct. Constr. 2015, 31, 81–88. [Google Scholar] [CrossRef]
- Park, J.; Kim, S. Productivity analysis for the 3D digitization of earthwork sites based on scanning conditions. Int. J. Railw. 2018, 11, 1–9. [Google Scholar]
- Kim, S.; Irizarry, J.; Costa, D.B. Potential factors influencing the performance of unmanned aerial system (UAS) integrated safety control for construction worksites. In Proceedings of the Construction Research Congress 2016, San Juan, PR, USA, 31 May–2 June 2016; pp. 2614–2623. [Google Scholar]
- Gupta, L.; Jain, R.; Vaszkun, G. Survey of important issues in UAV communication networks. IEEE Commun. Surv. Tutor. 2015, 18, 1123–1152. [Google Scholar] [CrossRef] [Green Version]
- Rangel, J.M.G.; Gonçalves, G.R.; Pérez, J.A. The impact of number and spatial distribution of GCPs on the positional accuracy of geospatial products derived from low-cost UASs. Int. J. Remote Sens. 2018, 39, 7154–7171. [Google Scholar] [CrossRef]
- Oniga, V.-E.; Breaban, A.-I.; Pfeifer, N.; Chirila, C. Determining the Suitable Number of Ground Control Points for UAS Images Georeferencing by Varying Number and Spatial Distribution. Remote Sens. 2020, 12, 876. [Google Scholar] [CrossRef] [Green Version]
- Ronchi, D.; Limongiello, M.; Barba, S. Correlation among Earthwork and Cropmark Anomalies within Archaeological Landscape Investigation by Using LiDAR and Multispectral Technologies from UAV. Drones 2020, 4, 72. [Google Scholar] [CrossRef]
- Hanna, A.; Hintz, C.; Vonderohe, A. 3D Design Terrain Models for Construction Plans and GPS Control of Highway Construction Equipment; CFIRE: Madison, WI, USA, 2010. [Google Scholar]
- Lee, J.K.; Park, J.S.; Roberts, G.W.; Oluropo, O.; Moon, D.J. Study on Issues of Tilt-meters and Utilization of GPS in Bridge Monitoring System (BMS). In Proceedings of the Joint International Symposium on Deformation Monitoring, Hong Kong, China, 2–4 November 2011; pp. 2–4. [Google Scholar]
- Dampegama, K.P.; Abesinghe, A.; Dinusha, K.A.; Vandebona, R. Comparative Study on Methods For 3D Modelling with Traditional Surveying Technique and Total Station Technique. In Proceedings of the 11th International Research Conference, Rathmalana, Sri Lanka, 13–14 September 2018. [Google Scholar]
- Slattery, K.T.; Slattery, D.K.; Peterson, J.P. Road construction earthwork volume calculation using three-dimensional laser scanning. J. Surv. Eng. 2012, 138, 96–99. [Google Scholar] [CrossRef]
- Williams, K.E. Accuracy Assessment of LiDAR Point Cloud Geo-Referencing. Master’s Thesis, Oregon State University, Corvallis, OR, USA, June 2012. [Google Scholar]
- Cho, Y.K.; Park, J. Assessment of Construction Points for Grade Control and Reference in 3D; Georgia Dept. of Transportation: Atlanta, GA, USA, 2018. Available online: http://g92018.eos-intl.net/eLibSQL14_G92018_Documents/16-18.pdf (accessed on 10 November 2021).
- Kim, S.; Irizarry, J.; Costa, D.B. Field Test-Based UAS Operational Procedures and Considerations for Construction Safety Management: A Qualitative Exploratory Study. Int. J. Civ. Eng. 2020, 18, 919–933. [Google Scholar] [CrossRef]
- Park, J.; Kim, P.; Cho, Y.K. Automated collaboration framework of UAV and UGV for 3D visualization of construction sites. In Proceedings of the 18th International Conference on Construction Applications of Virtual Reality, Auckland, New Zealand, 22–23 November 2018. [Google Scholar]
- Kim, P.; Price, L.C.; Park, J.; Cho, Y.K. UAV-UGV Cooperative 3D Environmental Mapping. In Proceedings of the ASCE International Conference on Computing in Civil Engineering 2019: Data, Sensing, and Analytics, Atlanta, GA, USA, 17–19 June 2019; pp. 384–392. [Google Scholar] [CrossRef]
- Wang, X.; Al-Shabbani, Z.; Sturgill, R.; Kirk, A.; Dadi, G.B. Estimating earthwork volumes through use of unmanned aerial systems. Transp. Res. Rec. 2017, 2630, 1–8. [Google Scholar] [CrossRef]
- Kavaliauskas, P.; Židanavičius, D.; Jurelionis, A. Geometric Accuracy of 3D Reality Mesh Utilization for BIM-Based Earthwork Quantity Estimation Workflows. ISPRS Int. J. Geo-Inf. 2021, 10, 399. [Google Scholar] [CrossRef]
- Jeong, I.; Jang, Y.; Park, J.; Cho, Y.K. Motion Planning of Mobile Robots for Autonomous Navigation on Uneven Ground Surfaces. J. Comput. Civ. Eng. 2021, 35, 4021001. [Google Scholar] [CrossRef]
- Kim, P.; Park, J.; Cho, Y.K. As-is geometric data collection and 3D visualization through the collaboration between UAV and UGV. In Proceedings of the International Symposium on Automation and Robotics in Construction (ISARC 2019), Banff, AB, Canada, 21–24 May 2019. [Google Scholar] [CrossRef]
- Mandirola, M.; Casarotti, C.; Peloso, S.; Lanese, I.; Brunesi, E.; Senaldi, I.; Risi, F.; Monti, A.; Facchetti, C. Guidelines for the use of Unmanned Aerial Systems for fast photogrammetry-oriented mapping in emergency response scenarios. Int. J. Disaster Risk Reduct. 2021, 58, 102207. [Google Scholar] [CrossRef]
- Calantropio, A.; Chiabrando, F.; Sammartano, G.; Spanò, A.; Losè, L.T. UAV Strategies Validation and Remote Sensing Data for Damage Assessment in Post-Disaster Scenarios. In Proceedings of the International Archives of the Photogrammetry, Remote Sensing and Spatial Information Sciences, Istanbul, Turkey, 18–21 March 2018; pp. 121–128. [Google Scholar]
- Chiabrando, F.; Giulio Tonolo, F.; Lingua, A. UAV Direct Georeferencing Approach in an Emergency Mapping Context. The 2016 Central Italy Earthquake Case Study; International Society for Photogrammetry and Remote Sensing: Enschede, The Netherlands, 2019. [Google Scholar]
- Orych, A. Review of methods for determining the spatial resolution of UAV sensors. Int. Arch. Photogramm. Remote Sens. Spat. Inf. Sci. 2015, 40, 391–395. [Google Scholar] [CrossRef] [Green Version]
- Lee, T.Y. Spatial Resolution Analysis of Aerial Digital Camera. Ph.D. Thesis, Dong-A University, Busan, Korea, 2012. [Google Scholar]
- Lee, J.; Sung, S. Evaluating spatial resolution for quality assurance of UAV images. Spat. Inf. Res. 2016, 24, 141–154. [Google Scholar] [CrossRef]
- Zhou, Q.-Y.; Park, J.; Koltun, V. Open3D: A modern library for 3D data processing. arXiv 2018, arXiv:1801.09847. Available online: https://arxiv.org/abs/1801.09847v1 (accessed on 10 November 2021).
- Rusu, R.B.; Cousins, S. 3D is here: Point Cloud Library (PCL). In Proceedings of the 2011 IEEE International Conference on Robotics and Automation, Shanghai, China, 9–13 May 2011. [Google Scholar]
- Zhang, Z. Iterative point matching for registration of free-form curves and surfaces. Int. J. Comput. Vis. 1994, 13, 119–152. [Google Scholar] [CrossRef]
- Gonzalez, M.; Luaces, A.; Dopico, D.; Cuadrado, J. A 3d physics-based hydraulic excavator simulator. In Proceedings of the ASME World Conference on Innovative Virtual Reality, Chalon-sur-Saône, France, 25–26 February 2009; pp. 75–80. [Google Scholar]
- Ni, T.; Zhang, H.; Yu, C.; Zhao, D.; Liu, S. Design of highly realistic virtual environment for excavator simulator. Comput. Electr. Eng. 2013, 39, 2112–2123. [Google Scholar] [CrossRef]
- Qi, C.R.; Su, H.; Mo, K.; Guibas, L.J. PointNet: Deep learning on point sets for 3D classification and segmentation. In Proceedings of the IEEE Conference on Computer Vision and Pattern Recognition, Honolulu, HI, USA, 21–27 July 2017; pp. 77–85. [Google Scholar] [CrossRef] [Green Version]
- Qi, C.R.; Yi, L.; Su, H.; Guibas, L.J. PointNet++: Deep hierarchical feature learning on point sets in a metric space. arXiv 2017, arXiv:1706.02413. Available online: https://arxiv.org/abs/1706.02413 (accessed on 10 November 2021).
- Park, J.; Cho, Y.K. Point Cloud Information Modeling: Deep Learning–Based Automated Information Modeling Framework for Point Cloud Data. J. Constr. Eng. Manag. 2022, 148, 4021191. [Google Scholar] [CrossRef]
- Park, J.; Chen, J.; Cho, Y.K. Point Cloud Information Modeling (PCIM): An Innovative Framework for as-is Information Modeling of Construction Sites. In Proceedings of the Construction Research Congress 2020: Computer Applications, Tempe, AZ, USA, 8–10 March 2020; pp. 1319–1326. [Google Scholar] [CrossRef]


| Categories | Flight Parameter | Categories | Data Processing |
|---|---|---|---|
| Flight height | 100 m | # of images | 268–281 |
| ISO | 400 | Image resolution | 4000 × 6000 px |
| Shutter speeds | 1/1250 s | CPU | AMD 3.60 GHz |
| Flight time | 25 min | GPU | NVDIA RTX 2060 |
| Overlapping (HTZL/VERT) | 75%/80% | Processing time | 2.5 h |
| Round | # of GCP # | ∆X (m) | ∆Y (m) | ∆Z (m) | ∆XY (m) | Total Error (m) |
| 1st | 7 | 0.004 | 0.006 | 0.006 | 0.007 | 0.009 |
| 2nd | 7 | 0.007 | 0.012 | 0.014 | 0.014 | 0.020 |
| 3rd | 7 | 0.008 | 0.010 | 0.010 | 0.013 | 0.016 |
| Round | CP # | ∆X (m) | ∆Y (m) | ∆Z (m) | ∆XY (m) | Total Error (m) |
| 1st | 1 | 0.009 | 0.004 | 0.022 | 0.010 | 0.024 |
| 2 | 0.028 | 0.010 | 0.024 | 0.030 | 0.038 | |
| 2nd | 1 | 0.029 | 0.008 | 0.003 | 0.030 | 0.030 |
| 2 | 0.012 | 0.016 | 0.037 | 0.02 | 0.042 | |
| 3rd | 1 | 0.012 | 0.005 | 0.030 | 0.013 | 0.033 |
| 2 | 0.004 | 0.025 | 0.007 | 0.025 | 0.026 |
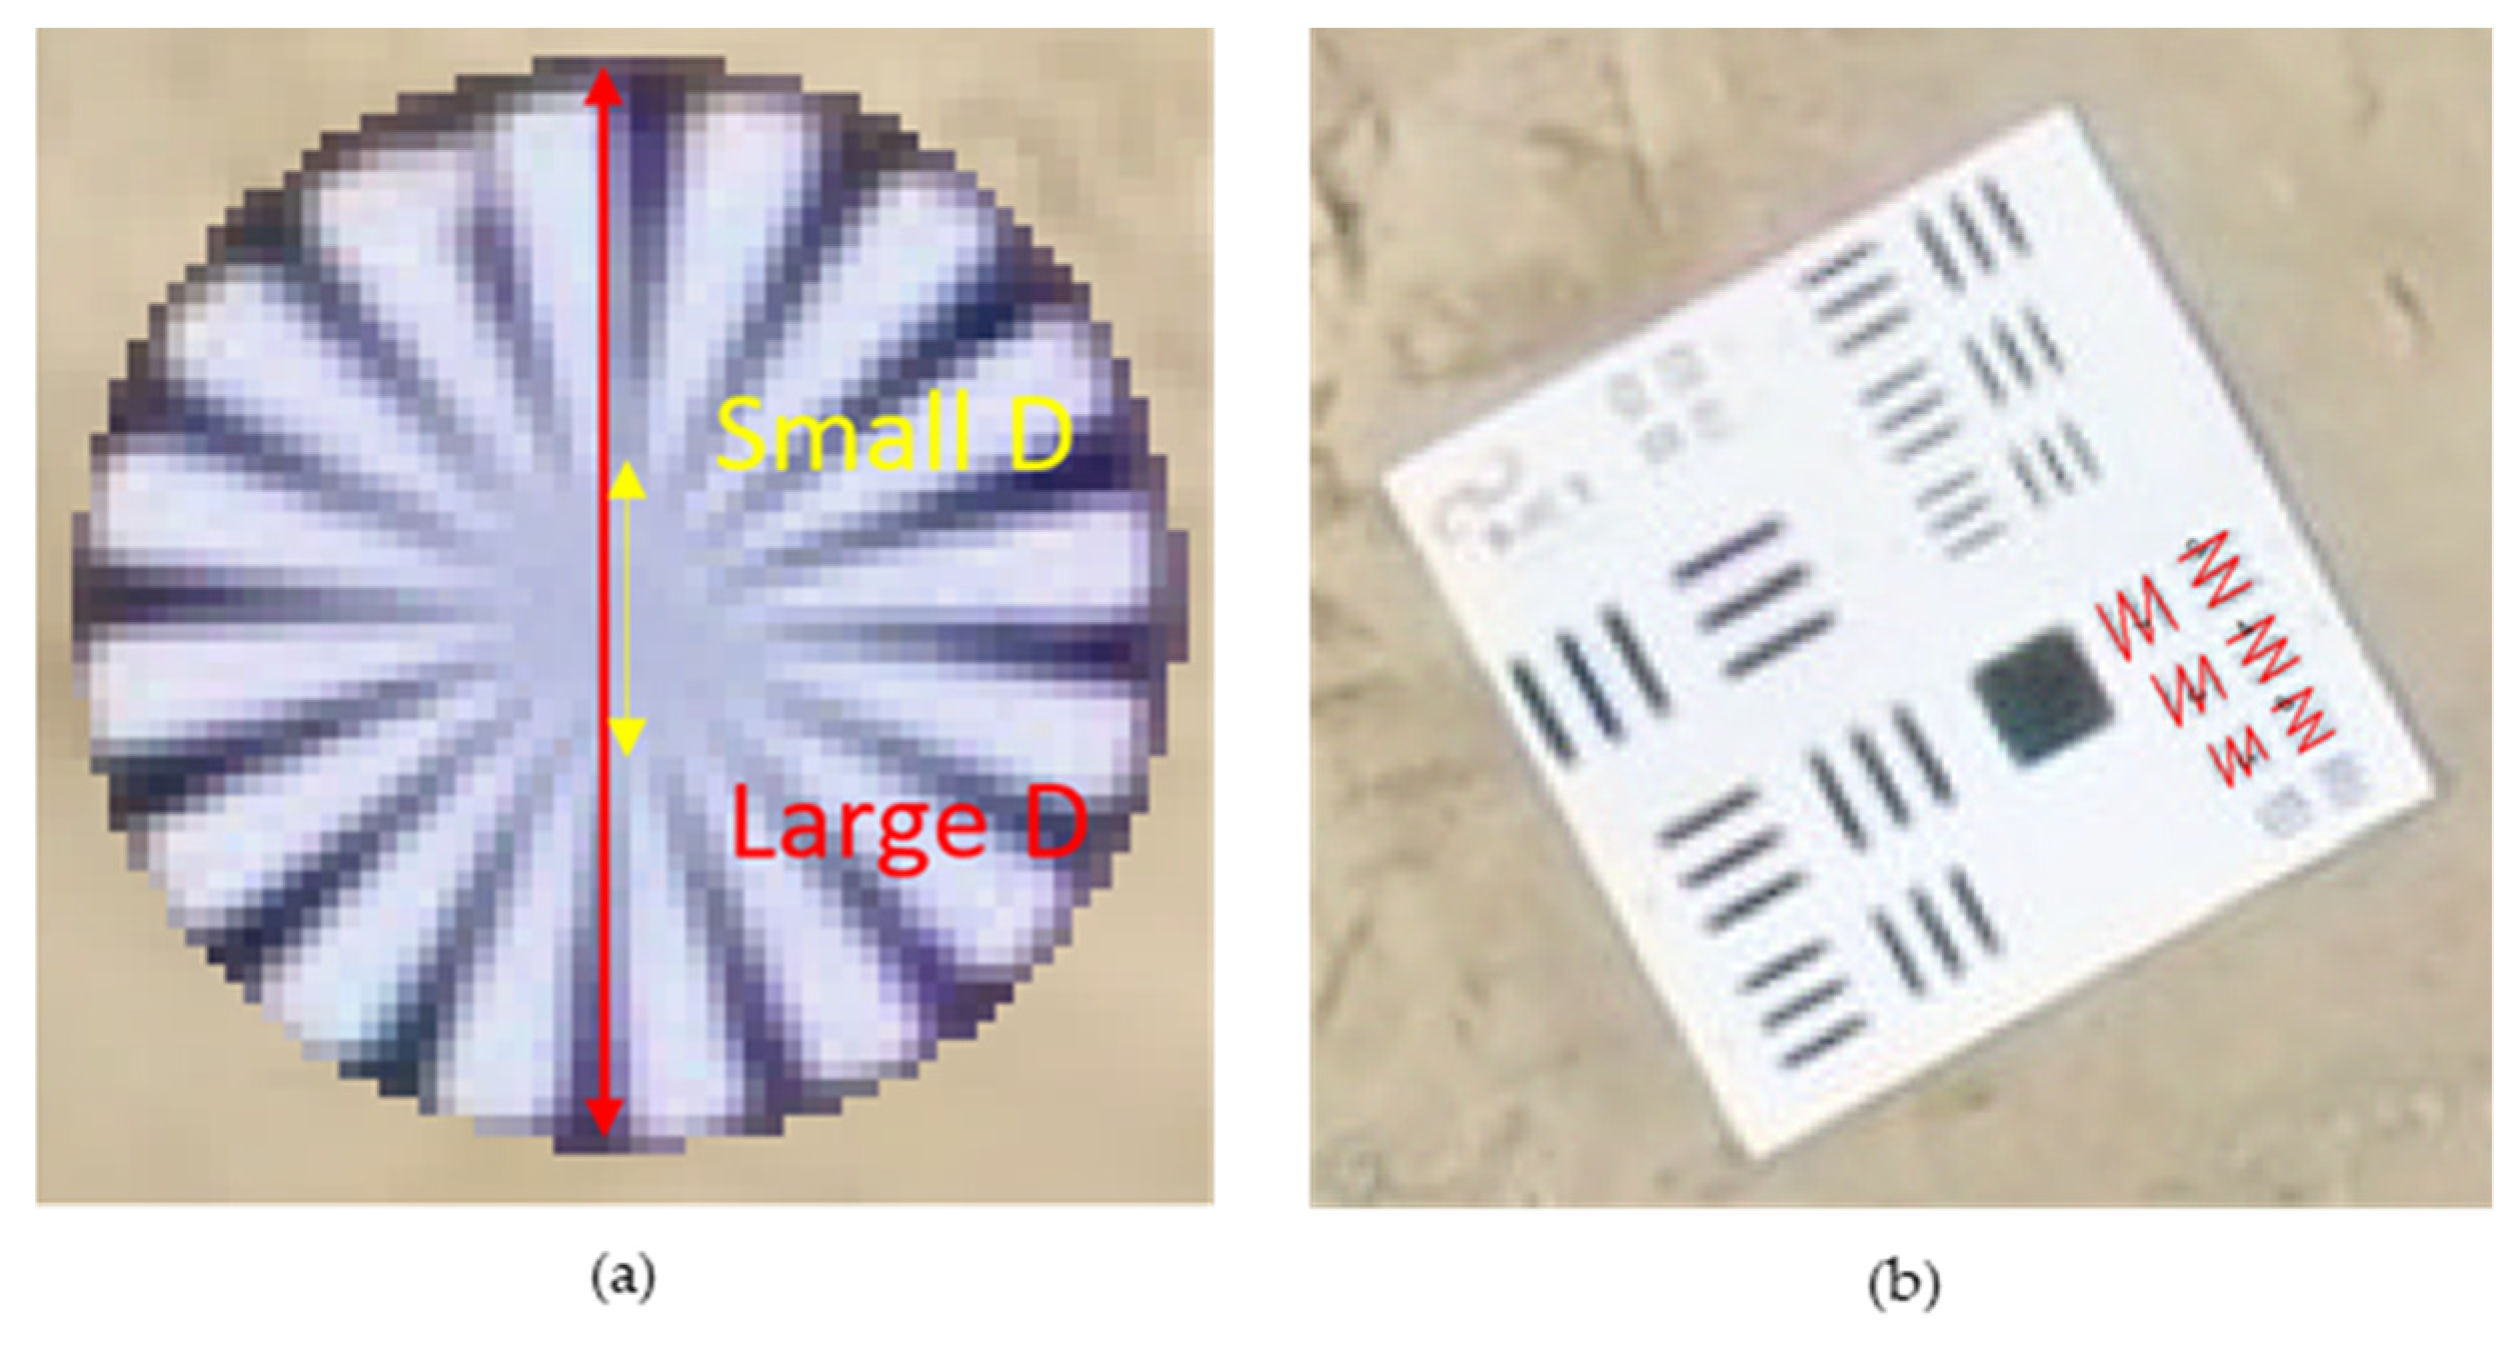
| Siemens StarCategories | Large D | Small d | Diameter Ratio | Result | |
| Visual resolution at 100 m altitude | 1.02 m | 0.267 m | 0.261 | 0.025 m | |
| Bar TargetCategories | No. 7 | No. 8 | No. 9 | No. 10 | Average |
| Spatial resolution at 100 m altitude | Recognized | Recognized | Recognized | Not recognized | 0.029 m |
| Round | Type | Cut Factor | Fill Factor | Area | Cut Volume | Fill Volume | Net Volume |
|---|---|---|---|---|---|---|---|
| Rounds 2-1 | fill | 1 | 1 | 5035 m2 | 161 m3 | 757 m3 | 596 m3 <Fill> |
| Rounds 3-2 | fill | 1 | 1 | 5035 m2 | 26 m3 | 8738 m3 | 8712 m3 <Fill> |
Publisher’s Note: MDPI stays neutral with regard to jurisdictional claims in published maps and institutional affiliations. |
© 2021 by the authors. Licensee MDPI, Basel, Switzerland. This article is an open access article distributed under the terms and conditions of the Creative Commons Attribution (CC BY) license (https://creativecommons.org/licenses/by/4.0/).
Share and Cite
Cho, J.-W.; Lee, J.-K.; Park, J. Large-Scale Earthwork Progress Digitalization Practices Using Series of 3D Models Generated from UAS Images. Drones 2021, 5, 147. https://doi.org/10.3390/drones5040147
Cho J-W, Lee J-K, Park J. Large-Scale Earthwork Progress Digitalization Practices Using Series of 3D Models Generated from UAS Images. Drones. 2021; 5(4):147. https://doi.org/10.3390/drones5040147
Chicago/Turabian StyleCho, Jin-Woo, Jae-Kang Lee, and Jisoo Park. 2021. "Large-Scale Earthwork Progress Digitalization Practices Using Series of 3D Models Generated from UAS Images" Drones 5, no. 4: 147. https://doi.org/10.3390/drones5040147
APA StyleCho, J.-W., Lee, J.-K., & Park, J. (2021). Large-Scale Earthwork Progress Digitalization Practices Using Series of 3D Models Generated from UAS Images. Drones, 5(4), 147. https://doi.org/10.3390/drones5040147