Article

Incorporating Geographical Scale and Multiple Environmental Factors to Delineate the Breeding Distribution of Sea Turtles

1
School of Biological and Behavioural Sciences, Queen Mary University of London, Mile End Road, London E1 4NS, UK
2
National Marine Park of Zakynthos, 1 El. Venizelou Str., 29100 Zakynthos, Greece
*
Author to whom correspondence should be addressed.
Drones 2021, 5(4), 142; https://doi.org/10.3390/drones5040142
Submission received: 26 October 2021 / Revised: 22 November 2021 / Accepted: 23 November 2021 / Published: 26 November 2021
(This article belongs to the Special Issue Ecological Applications of Drone-Based Remote Sensing)

Abstract

:
Temperature is often used to infer how climate influences wildlife distributions; yet, other parameters also contribute, separately and combined, with effects varying across geographical scales. Here, we used an unoccupied aircraft system to explore how environmental parameters affect the regional distribution of the terrestrial and marine breeding habitats of threatened loggerhead sea turtles (Caretta caretta). Surveys spanned four years and ~620 km coastline of western Greece, encompassing low (<10 nests/km) to high (100–500 nests/km) density nesting areas. We recorded 2395 tracks left by turtles on beaches and 1928 turtles occupying waters adjacent to these beaches. Variation in beach track and inwater turtle densities was explained by temperature, offshore prevailing wind, and physical marine and terrestrial factors combined. The highest beach-track densities (400 tracks/km) occurred on beaches with steep slopes and higher sand temperatures, sheltered from prevailing offshore winds. The highest inwater turtle densities (270 turtles/km) occurred over submerged sandbanks, with warmer sea temperatures associated with offshore wind. Most turtles (90%) occurred over nearshore submerged sandbanks within 10 km of beaches supporting the highest track densities, showing the strong linkage between optimal marine and terrestrial environments for breeding. Our findings demonstrate the utility of UASs in surveying marine megafauna and environmental data at large scales and the importance of integrating multiple factors in climate change models to predict species distributions.

1. Introduction

A major focus of ecological research is how environmental conditions affect the abundance and distribution of animals in both terrestrial and aquatic systems [1,2,3]. This information is frequently used to predict range shifts in species distributions and to inform management [4,5,6]. Temperature is often used as a proxy for modeling the current and future effects of climate on wildlife [7,8]. Yet, many other physical and climatic factors influence how wildlife are distributed, including precipitation, wind, habitat type, and land forms [9,10,11]. The separate and combined effects of those factors on wildlife distributions also vary with geographical scale [7,12]. Thus, it is important to identify the appropriate combinations of factors that drive the distributions and aggregation hotspots of wildlife and how these factors vary at different scales (from local to regional) to better predict distributions and optimize management strategies [3,13,14].
At the heart of assessing how the environment impacts the geographical range of species is the need for synoptic distribution surveys (i.e., broad distribution surveys over short timeframes). In some taxa, there are well-established systems for assessing distribution, such as plankton and fisheries surveys [3,15]. However, in other taxa, particularly marine mega-vertebrates, innovative technologies such as remote tracking or remote observation systems are continuously emerging and opening new opportunities [4,16]. For example, over the last 10 years, commercially available unoccupied aircraft systems (UASs) have emerged as a relatively inexpensive survey technique, facilitating the acquisition of landscape and ocean-scale information of many taxa [17,18,19]. Various studies have demonstrated the utility of this approach to capture large numbers of individuals within aggregations, in parallel to environmental information recorded on-board and from remotely sensed datasets [20,21,22]. Thus, UASs have the capacity to provide information on how marine animals are distributed in coastal environments at a variety of scales and in relation to a variety of biotic and abiotic factors [18,19].
Sea turtles are classic examples of marine mega-vertebrates that migrate from distant foraging grounds to form seasonal breeding aggregations in the vicinity of nesting beaches [23,24]. All seven species of sea turtles are considered threatened in the International Union for Conservation of Nature Red List of Threatened Species [25], with four being listed as vulnerable, two critically endangered, and one data-deficient [25]. Debate remains over the environmental and physical factors that determine the selection of nesting beaches by sea turtles and their nearshore distributions [26,27,28]. This is partly because multiple biotic and abiotic factors interact, leading to site-specific patterns. Such factors include offshore reefs, beach structure, predation, human pressure, local currents, wave action, and wind [29,30,31,32,33]. For example, sea turtles have been associated with nesting on wind-sheltered beaches at some sites [34,35,36] and wind-exposed beaches at other sites [37], with differences likely being linked to offshore (e.g., sandbanks versus reefs) and landward conditions (e.g., topography). Wind has been linked to the distribution of juvenile and adult turtles in subtropical regions [38] and the distribution of breeding sea turtles seeking optimal thermal conditions at suboptimal sites on the edge of the breeding range [30,39]. Thus, while temperature is typically used to predict the future distributions of sea turtles [32,40,41], the integration of other climatic factors might allow a more dynamic interpretation of the conditions required by a given species to enhance resilience, facilitating more informed policy decisions [12,42,43].
Here, we used UASs to explore how multiple environmental factors affect the geographical distribution of sea turtle breeding habitat, both terrestrial and marine, at a large geographical scale. Our study region was western Greece, which supports some of the highest nesting densities for loggerhead sea turtles (Caretta caretta) in the Mediterranean [44]. We hypothesized that sea turtles in the water and tracks on beaches would be widely distributed across the region but that the greatest densities would be associated with prevailing wind and optimal temperature conditions. Our results are expected to reinforce the importance of incorporating geographical scale and multiple parameters to enhance predictive models of species distributions under climate change.

2. Materials and Methods

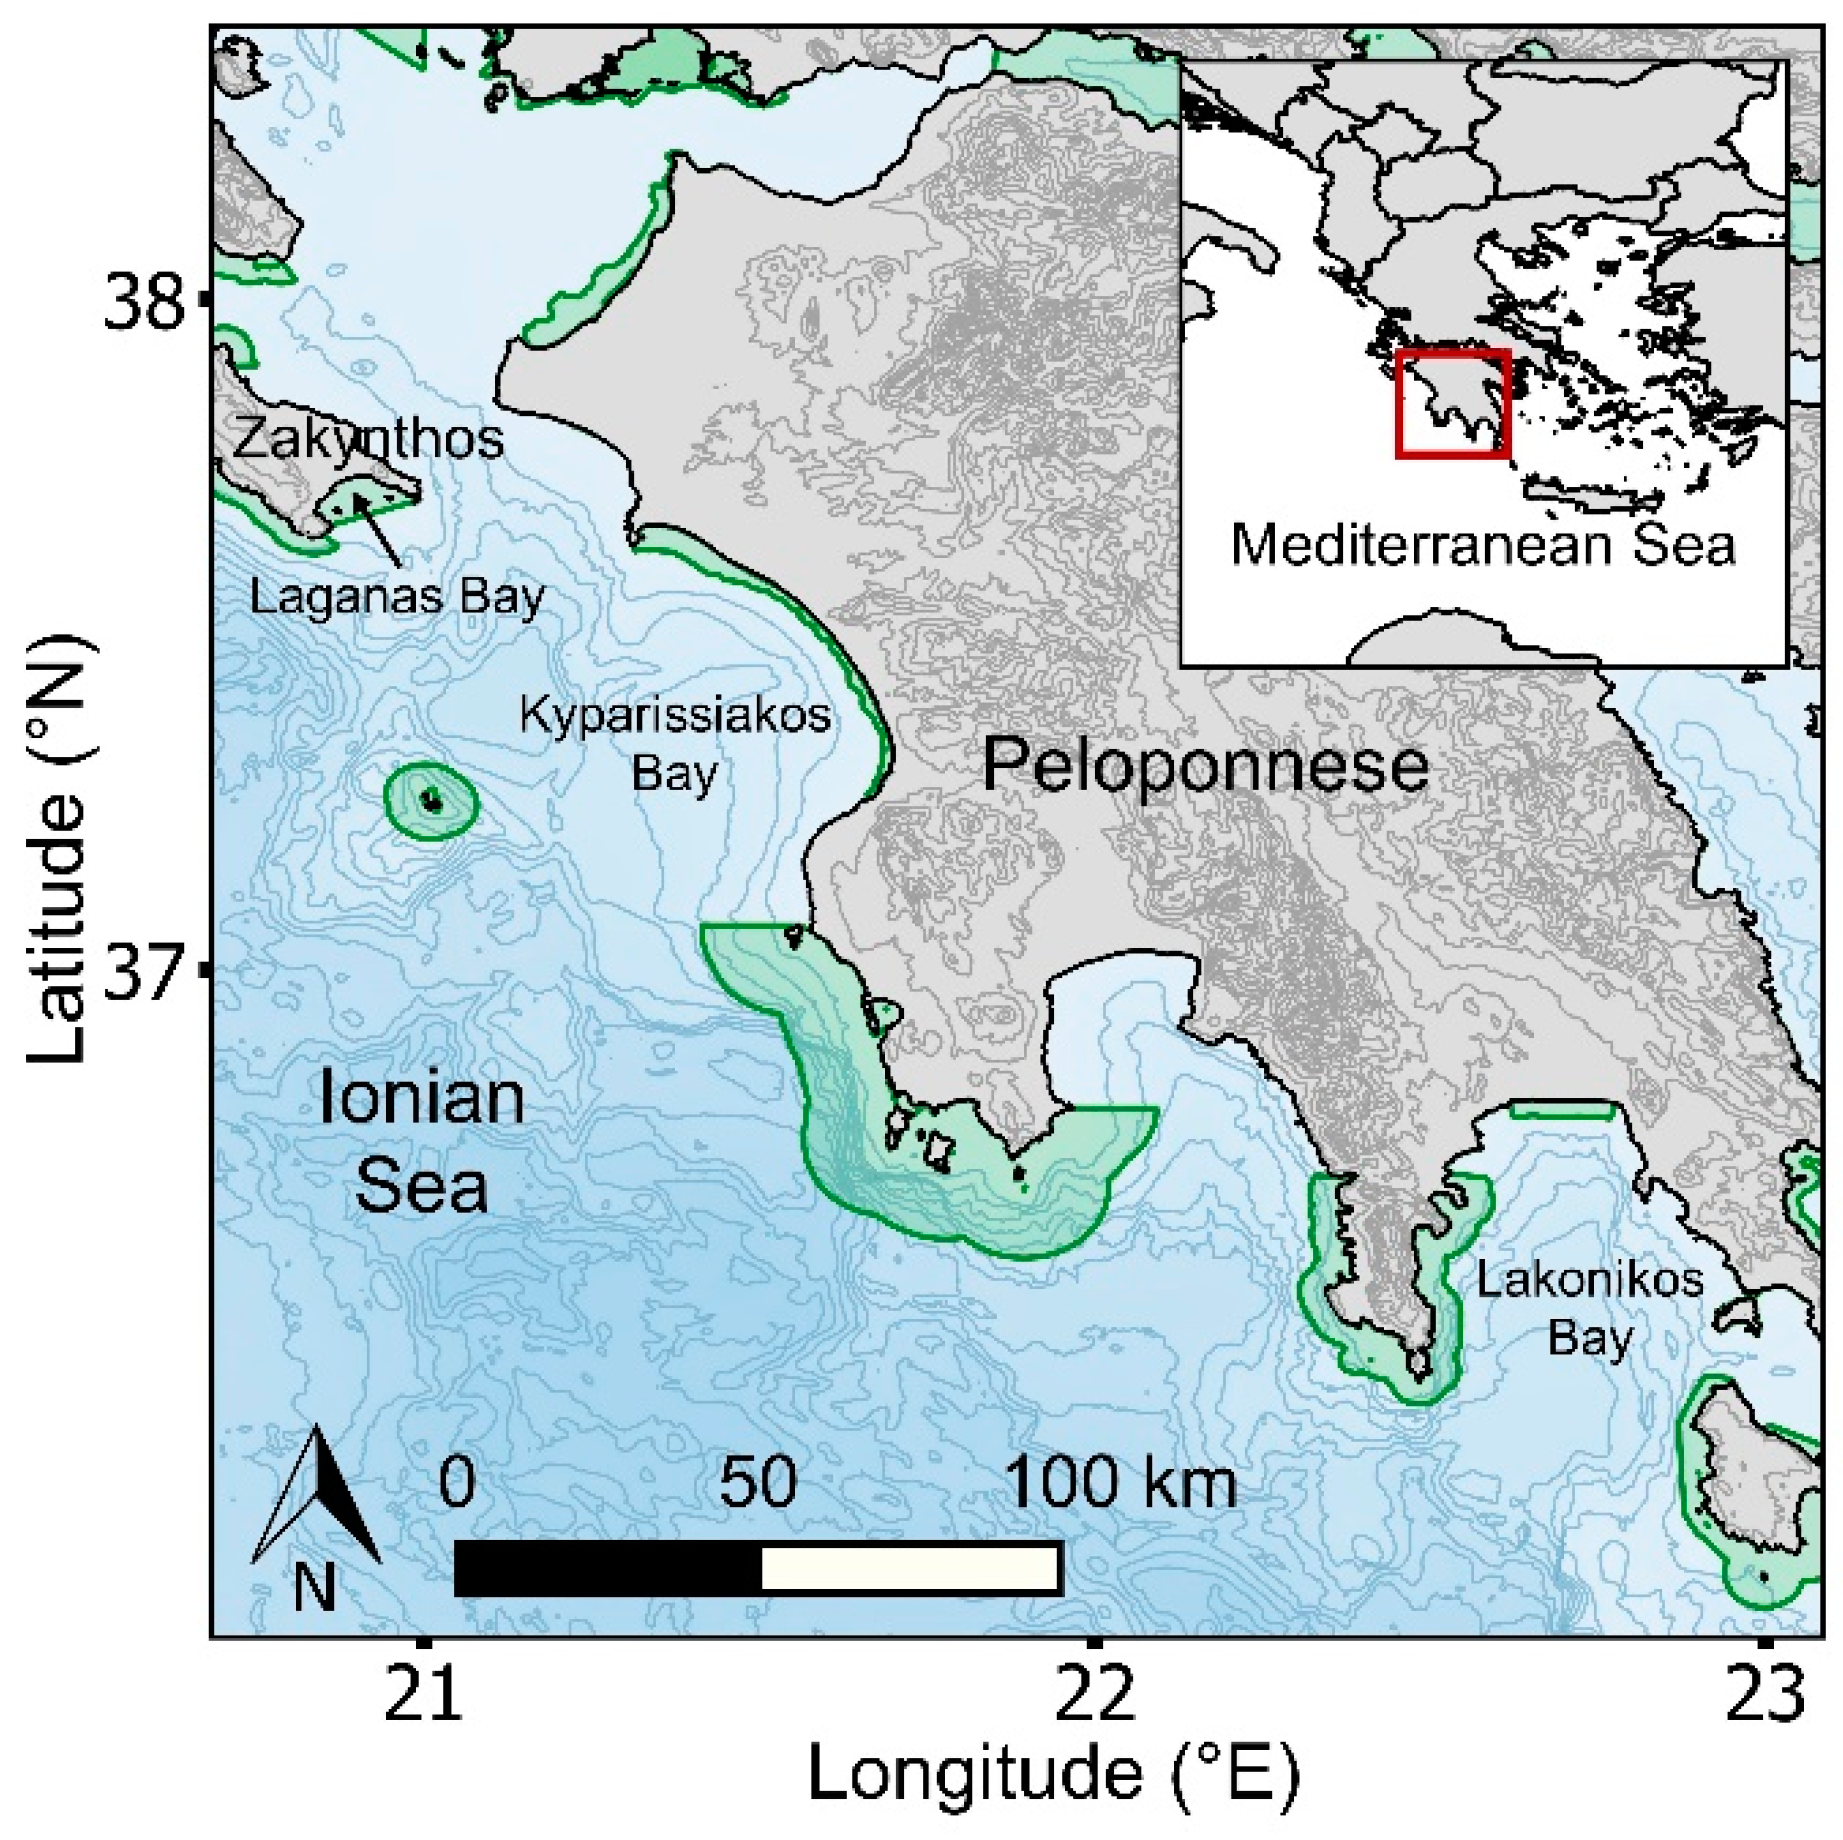
2.1. Study Region and Species

This study was conducted in western Greece (Zakynthos Island and the Peloponnese), which is situated in the Ionian Sea of the Mediterranean Sea (Figure 1). The Ionian Region encompasses at least 30 NATURA 2000 marine habitats [45], of which nine fall within our study area (Supplementary Materials Figure S1), including two managed national parks (National Marine Park of Zakynthos and Kotychi–Strofylia Wetlands National Park). In the Mediterranean, loggerhead sea turtles were recently listed as of least concern in the IUCN Red List of Threatened Species [46], due to positive trends in nest counts through focused conservation effort over the last 2–3 decades [44]. The study region encompasses a number of diffuse (<20 nests/season) to moderate rookeries (20–100 nests/season), and three major rookeries (>100 nests/season) where loggerhead sea turtles aggregate. The three major rookeries include Zakynthos (Laganas Bay; 1244 nests/season), the southern part of Kyparissiakos Bay (621 nests/season), and Lakonikos Bay (197 nests/season) [47] (Figure 1), representing 59% and 29% of nesting activity per season in Greece and the Mediterranean, respectively [47]. This region is at the latitudinal limits of the breeding range for loggerhead turtles globally [44,48]. Consequently, there is a very narrow window of opportunity for breeding [32,49,50], with temperature constraining the rate of egg maturation in females occupying coastal waters before each nesting event [51,52] and the viable incubation period of clutches on beaches [53]. Based on published data from Zakynthos Island, mating activity generally peaks in late April to mid-May, with females generally nesting from late May to early August, with peak nesting activity occurring in late June to early July [54]. Males generally depart the breeding grounds for foraging grounds (up to 1000 km distance) in late May, while females generally depart in early August, and they remigrate to breed at 1–2 and 1–3 year intervals, respectively [54].

2.2. UAS Surveys and Data Processing

Between 2016 and 2019, inwater UAS surveys were conducted along ~620 km coastline of the western Peloponnese (Kato Korogona, 36°38′ N, 22°52′ E; to Kalogria, 38°09′ N, 21°21′ E) and Zakynthos Island (37°41′ N, 20°52′ E to 37°44′ N, 20°55′ E). The UAS was flown in accessible areas generally fronting sandy beaches. In 2019, UAS surveys were conducted systematically across the entire region in May, which represented the key mating period of sea turtles [54,55], and late June/early July, which represented the peak nesting period of female turtles [54]. During the second survey period, beaches were also surveyed for evidence of the tracks of turtles. A DJI Phantom 3 Professional™ (Shenzhen, China; http://www.dji.com; accessed on 18 November 2021) UAS was flown at 60 m altitude (allowing a 100 m wide field of view), with 100 m intervals up to 400 m offshore (Figure 2c). We previously confirmed <2% error rate by independent observers for this altitude in our study region, with it being possible to detect sea turtles to seabed depths <7 m (with all surveys being conducted within this seabed depth range) and distinguish adults and juveniles [55]. Data were recorded in video format (3840 × 2160 pixels). All data were extracted using web-based software (AirData UAV™). For additional details, see [55].
The longitude and latitude of each turtle in the marine area were recorded [56]. Mating pairs were counted as a single datapoint. Beach survey footage was reviewed to document the tracks left by turtles on beaches. The density of tracks was calculated and validated against published information on nesting effort in the region [47,57] (Supplementary Materials Figure S1). To evaluate beach topography and slope, digital elevation models (DEMs) were created from drone imagery of the surveyed beaches using Agisoft Metashape Professional photogrammetry software [58]. Beach slope was defined as the elevation over the width of the beach in meters. Beach elevation was the increase in elevation of the beach from the water line until it stabilized and was measured at 100 m intervals along the beach (excluding the first and last 100 m) [57,59]. The Terrain Profile tool (Profile Tool plugin) in QGIS [60] was used. Coastline type (e.g., sandy beach) and substrate were determined from offshore and beach surveys and were validated with satellite imagery in Google Earth.

2.3. Temperature Records

HOBO TidbiT v2 UTBI-001 Data Loggers (Onset Computer Corp., Bourne, MA, USA) were used to monitor sea and sand temperature across the region. Loggers were placed in the sea (n = 16) and on the beach (n = 16) at regular intervals along the entire survey region, ensuring a mixture of no, diffuse, moderate, and high nested beaches were monitored for comparison. On beaches, loggers were placed at 50 cm depth, to reflect typical nest depth and at 1 m below the vegetation line to allow comparison across sites [61]. All inwater loggers were placed at 1 m below the sea surface at 3 m seabed depths to reflect the sea temperature experienced by a sea turtle in this region [29]. All loggers were set to record temperature at 15 min intervals. Validation experiments showed that all instruments consistently recorded the temperature to within 0.08 °C of one another. To complement the inwater loggers and confirm their representativeness, we also used Copernicus L4 Skin Sea Surface Temperature (SST) data [62]. These data are derived from night-time images collected by the Sentinel-3 satellite and are processed for initial quality and again to interpolate the data at ultra-high spatial resolution (0.01°). Mean monthly SST data were calculated in QGIS using daily L4 SST rasters and extracted from closest raster cell to the survey site. We found that empirical and SST datasets exhibited similar trends, but that SST was consistently 1.5–2 °C lower than field records, which was attributed to SST only being recorded at night. Bathymetry and land contours were extracted from raster data from the ETOPO1 Global Relief Model [63], and GADM shapefiles [64] were used for land masses.

2.4. Wind and Temperature Effects

Existing studies in the central Mediterranean basin (Ionian and Adriatic seas) have demonstrated that historical offshore prevailing winds over the last 40 years were north-west winds of intermediate speeds (20.5 km/h); however, while this trend is predicted to continue into the future (to 2100), direction and speed will become more variable [65,66,67]. We examined how changes to wind direction and speed would impact the location of sea turtle breeding areas, using Kyparissiakos Bay as a case study. Kyparissiakos Bay was selected because the 73 km coastline is primarily lined by sandy beaches and submerged sandbanks, but with 90% of sea turtles and nesting effort being primarily concentrated along a section of less than 10 km in the southern part of the bay at present. Using windy.com (accessed on 18 November 2021) [68], we collected records of wind direction and speed at 3 h intervals from 1 May to 30 September 2020. This resource was used in preference to other wind databases as it provided fine-scale wind patterns and sheltering effects. For each time interval, we recorded the prevailing offshore wind direction and wind speed (km/h using the website’s groupings of 0–10, 10–20, 20–35, and 35+), and the positioning of sheltered sections along the coastline. We used the E.U. Copernicus Marine Service Information L4 SST dataset [62] to obtain fine-scale sea surface temperature for the same period. We used this information to predict the optimal positioning of nesting sites for each wind direction and changes to wind exposure, as well as SST.

2.5. Statistical Analysis

We used Shapiro–Wilk tests to examine whether sand and sea temperature followed a normal distribution. As both followed a normal distribution, we used repeated measures ANOVA to investigate how sand and sea temperature associations changed over the three-month period (May, June, and July) in relation to the density of turtle tracks recorded for each site. We used the Mann–Whitney U test to determine if track density was linked to different beach parameters and location of sheltered areas. We used the Raleigh Test of Uniformity to evaluate the uniformity of wind direction. We used the Watson–Wheeler test for homogeneity to evaluate whether certain areas were consistently sheltered from the same wind direction, and Watson’s Two-Sample Test of Homogeneity to compare across areas (pairwise comparison). We used repeated measures ANOVA to investigate how changes to mean daily sea temperature were associated with beaches that were sheltered and exposed to the prevailing NW wind and submerged sandbanks. Lastly, we performed a variance component analysis (VCA) to determine the proportion of variation in track density and inwater turtle density contributed by the different abiotic factors recorded. The variables examined included air temperature, sea temperature, beach slope, beach orientation, sea surface temperature, site proximity to sandbanks, seabed substrate, prevailing wind direction, and the direction of wind from which each site was sheltered.

3. Results

Drone surveys of the marine and beach area captured 319 km coastline, from April to early July of 2016–2019, documenting 1928 location points of sea turtles. Beach surveys captured 70 km coastal beaches, with 2395 tracks of turtles being recorded.

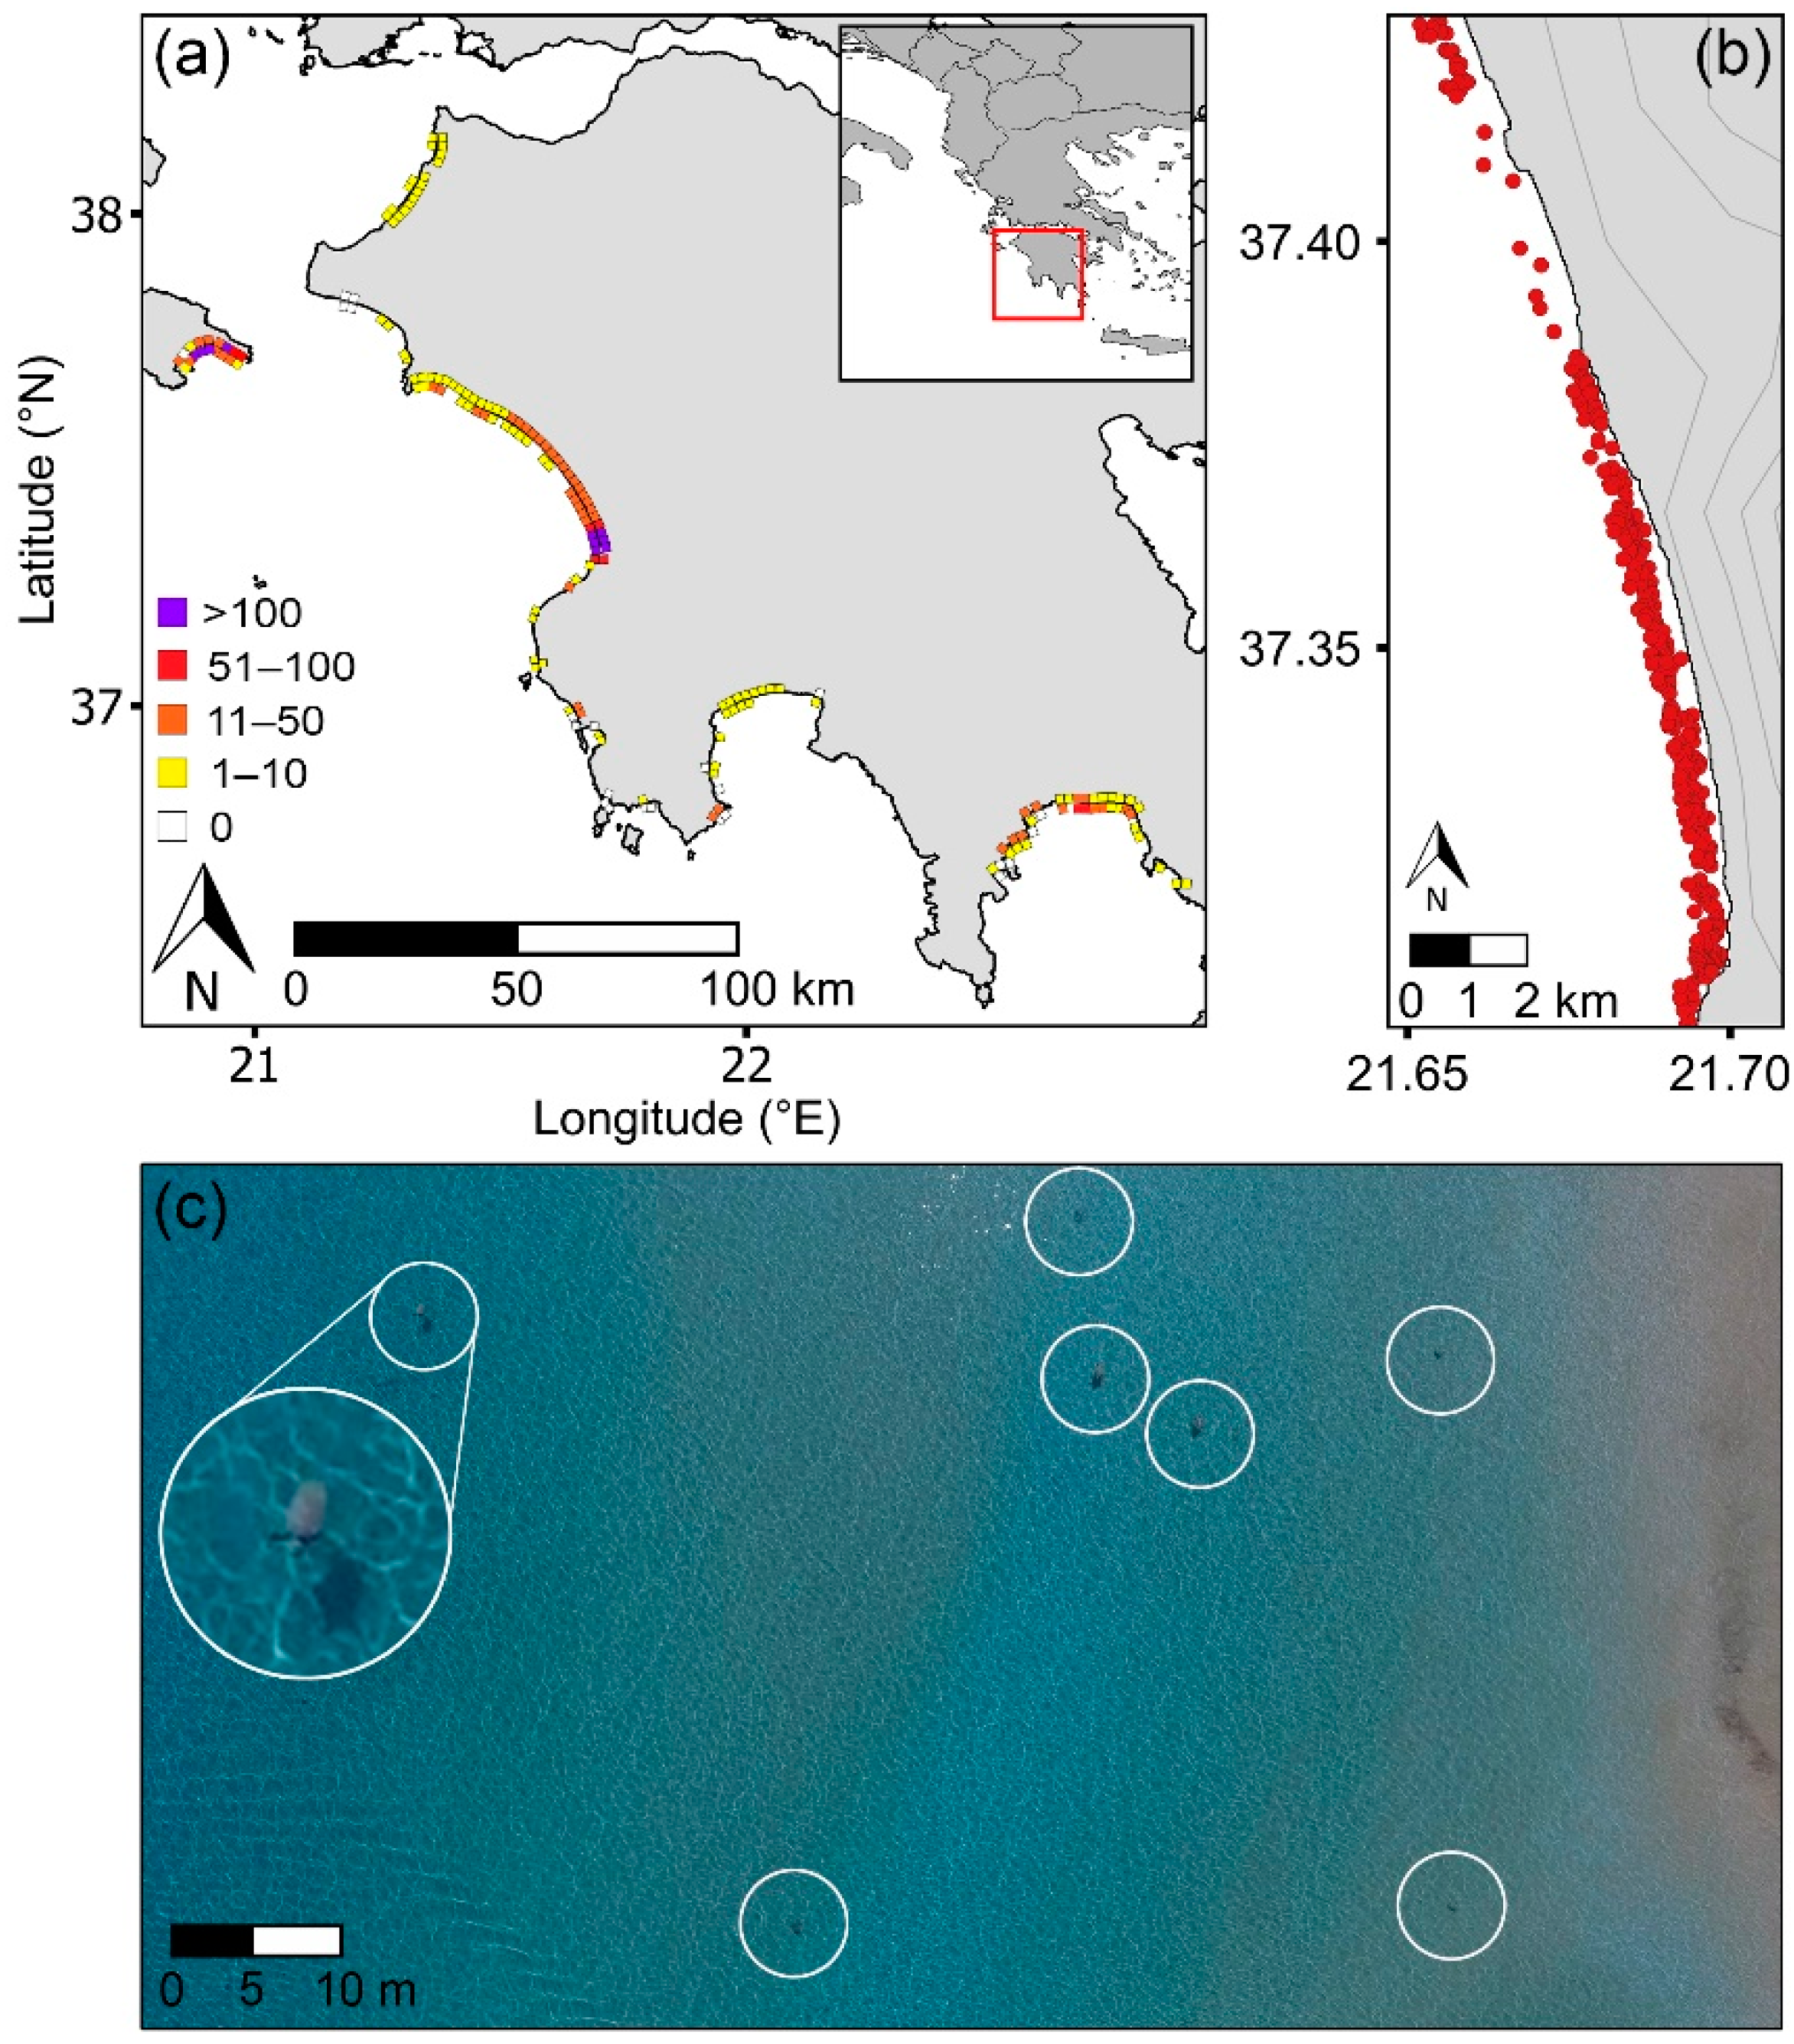
3.1. Regional Distribution of Sea Turtles and Nests

Regional surveys demonstrated that inwater turtles were not evenly distributed along the coastline (Figure 2a,b), with this pattern being consistent over the peak mating and nesting periods. In parallel, the number of turtle tracks recorded on beaches was not evenly distributed along the coastline, with the greatest densities of inwater and beach track turtles occurring in similar areas.
In the sea, 90% of turtles were found over submerged sandbanks, of which 89% were within 10 km of the areas with highest track density (F1,52 = 21.53, r2 = 0.28, p < 0.01) (Figure 2a). Laganas Bay (Zakynthos), southern Kyparissiakos Bay and north Lakonikos Bay had maximum inwater turtle densities of 273, 172, and 63 turtles/km, respectively, and maximum beach track densities of 227, 172, and 64 tracks/km (Figure 2a). Turtles in Kyparissiakos Bay aggregated directly in the waters in front of the major nesting area; however, at Laganas Bay (Zakynthos) and Lakonikos Bay, the major nesting sites were fronted by reefs, with turtles aggregating over shallow submerged sandbanks in adjacent areas (<10 km distant).

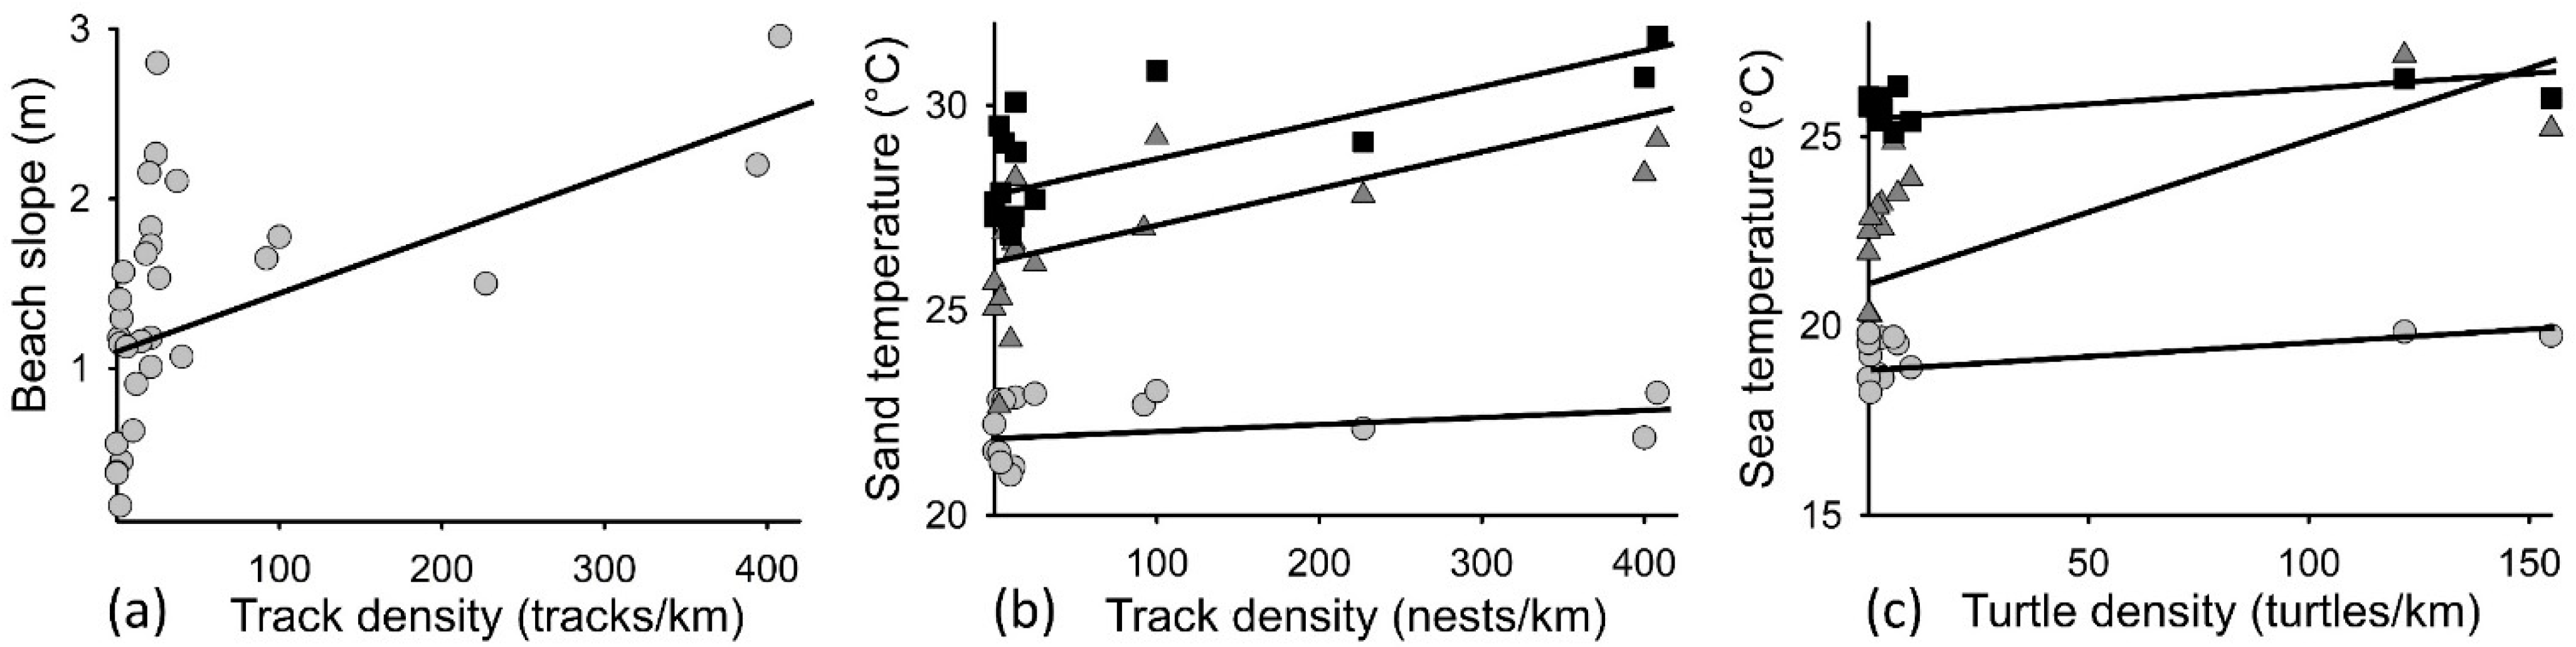
3.2. Inwater Turtle and Beach Track Densities Related to Temperature and Beach Slope

Beach slope was positively associated with beach track density, with nesting primarily occurring on beaches with slopes >1 m (Figure 3a; F1,28 = 9, r2 = 0.24, p < 0.04). Sand temperature was significantly associated with beach track density (F2,46 = 18, r2 = 0.7, p < 0.01), with time (month) having a significant effect (F2,46 = 121, r2 = 0.65, p < 0.01) (Figure 3b). Sea temperature was significantly associated with inwater turtle density (F1,35 = 11.611, r2 = 0.7, p < 0.01), with month having a significant effect (F2,35 = 139, r2 = 0.75, p < 0.01) (Figure 3c). These trends were corroborated when using SST data, but to a lesser extent (data not shown), due to night-time temperature values. VCA analysis showed that variance in both beach track density and inwater turtle density were primarily explained by June temperatures (SST and sand) and prevailing wind exposure (combined contribution of 78% and 48%, respectively), with beach slope also contributing to explaining track density (9%).

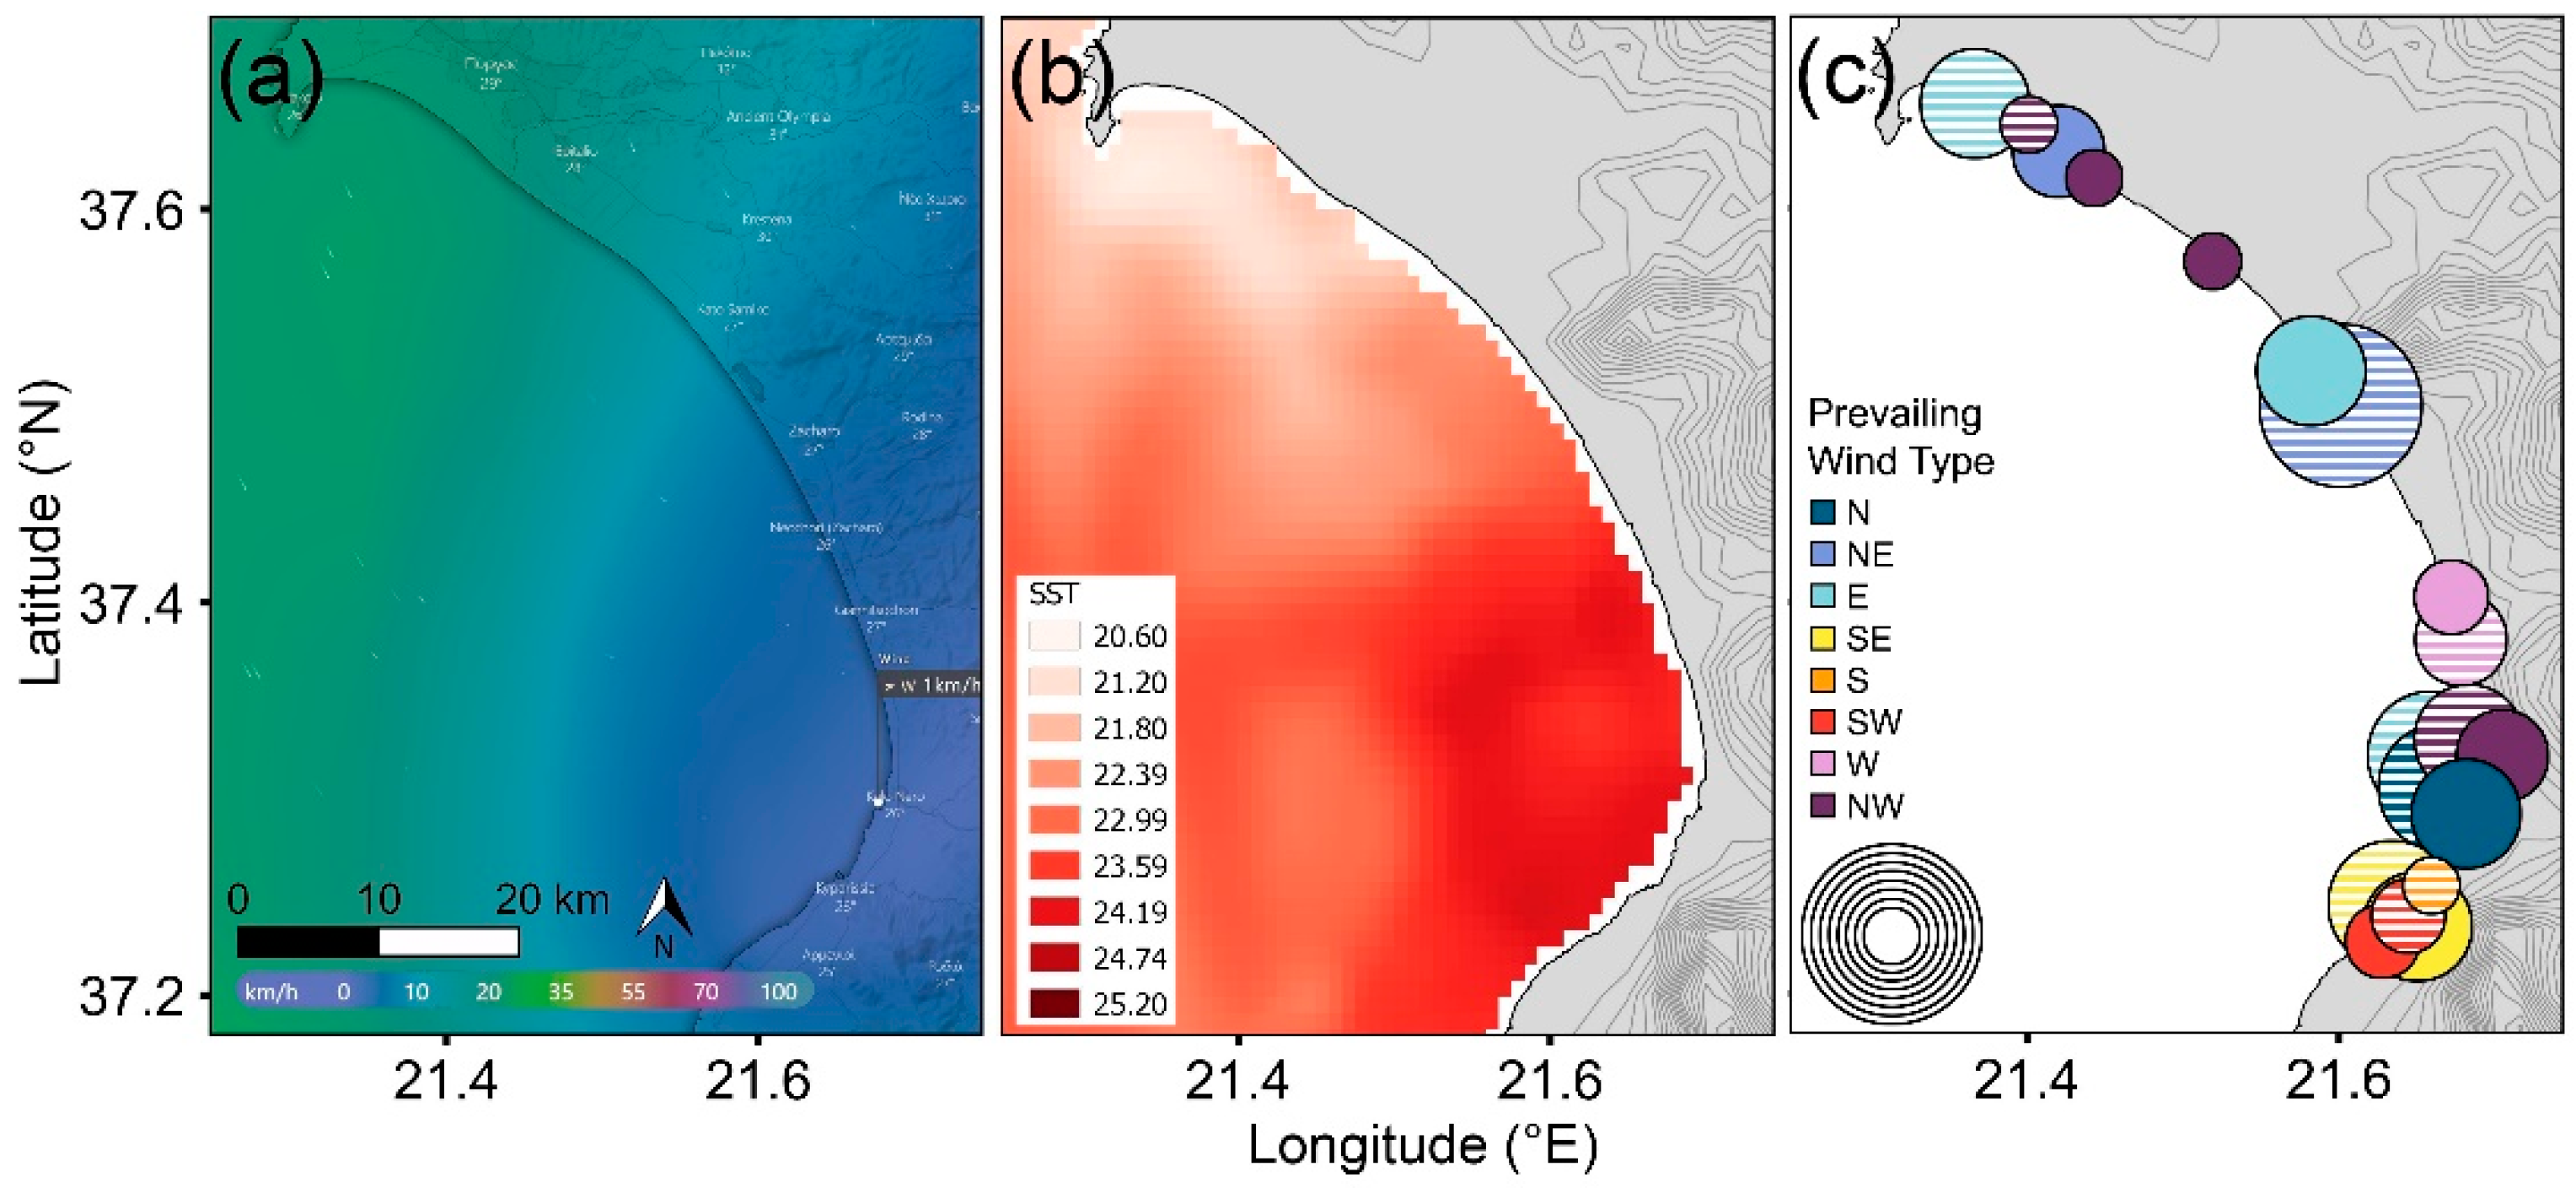
3.3. Rookery Locations Versus Wind and Sea Temperature

Of the 1224 offshore wind records, NW–N wind types prevailed (79% of all winds), with all remaining winds representing <6% records each. Coastal areas were sheltered from 0–10 km speeds of all offshore wind types, 10–35 km winds provided some sheltering depending on landmasses (islands) and topography, and there was no shelter from 35+ km/h speeds. Beaches sheltered from the prevailing offshore NW wind had significantly more tracks than exposed beaches (Mann–Whitney U test, W = 125; p < 0.01). Taking the example of Kyparissiakos Bay (Figure 4), we confirmed that different sections of the bay were sheltered depending on offshore wind direction (Watson–Wheeler test = 238.87; p < 0.01). SST was highest in the area sheltered from the prevailing offshore wind in Kyparissiakos Bay (Figure 4a,b) and was also strongly associated with nearshore submerged sandbanks at the regional scale (located within 10 km of beaches with the highest track density, see Section 3.2) (F1,46 = 83.106, p < 0.01), demonstrating the interaction of multiple parameters. In Kyparissiakos Bay, shelter from north-type winds was highest at both 10–20 and 20–35 km/h (46–76% and 34–36%, respectively), predominantly in the mid-lower areas (where turtle track density is currently highest). In contrast, only the southernmost part of the bay was sheltered from south-type winds, with lower and more varied effects (9–48% and 0–38%, respectively). Thus, if wind types other than NW–N gain frequency across the study region, the distribution of areas with high beach track densities would change (Figure 4c). For instance, Kotychi lagoon on the north coast of the Peloponnese currently has low nest densities under prevailing N–NW type winds, which might increase if prevailing winds shift to a south-type direction, from which the site would be sheltered.

4. Discussion

Through integrating UAS technology with remote sensing data, this study demonstrates how sea turtle breeding habitats on land and in the sea are linked by a variety of climatic and physical factors. We also demonstrate the capacity of UAS to evaluate sea turtle distributions (animals and their tracks) at varying scales, covering an entire region. In particular, June temperatures and exposure to offshore prevailing wind were indicators of current high-density breeding sites and could be used to inform future distributions. Submerged sandbanks in the water and beach slopes >1 m were also important factors associated with high inwater and beach track turtle densities. Our findings demonstrate that UAS technology can be effectively used to survey marine megafauna in relation to environmental data at large scales and could enhance predictions of the spatial responses of species to climate change and future marine protected area (MPA) delineations.
The geographical scale of our study allowed us to examine the suitability of a suite of sites supporting different environments and turtle/track densities. The use of big datasets and upscaling the geographical ranges of studies is being increasingly implemented to elucidate the ecology and management needs of wildlife [69,70]. Through evaluating animals and their environment at different scales, studies are increasingly showing that the strength of the effect of the same parameters differs depending on geographical scale, with many examples now emerging in the terrestrial environment [71,72]. For example, at the local scale in coastal dune communities, species composition is primarily driven by disturbance through sand burial, whereas at the regional scale, it is driven by a combination of wind, solar radiation, nutrients, and humidity, among other factors. Similar examples are also beginning to emerge in the marine environment [73,74,75]. For example, in intertidal ecosystems, while distributions of mussels and barnacles at local scales are mostly explained by wave splash, temperature and desiccation become more important as spatial scale increases [74]. The breeding habitat of sea turtles is unique compared to many wildlife, as it traverses both marine and terrestrial areas, with optimal conditions for breeding being required in both environments [26,30,76]. For instance, in the marine environment, sea temperature regulates the time females need to mature eggs before each nesting event [51,77,78], while on land, beach temperature regulates the development, survival, and sex of offspring [79,80]. Without evaluating how wildlife and associated habitats are distributed at relatively large scales, the connection between nesting and inwater areas would be missed.
We expected temperature to constrain the distribution of sea turtle breeding habitat, because our study region is on the edge of the breeding range for loggerhead turtles [30,48]. However, we demonstrated that, while both air and sea temperature were correlated with the distributions of sea turtles in the water and their tracks on beaches, other factors were also important. For instance, we showed that the highest inwater densities of turtles occurred within 10 km of beaches with the highest track densities. Where nesting beaches with the highest track density were fronted with submerged sandbanks, turtles were found in waters directly in front, supporting other studies [81,82]; however, where beaches with high track density were fronted with reefs, turtles were found in the nearest areas with submerged sandbanks, also supporting other studies [54,83,84]. This phenomenon might be explained by sandbanks retaining warmer temperatures better than reefs [85] but might also be associated with how winds and sea currents cause warm water to build alongshore [86,87,88]. There is a wealth of literature demonstrating how wildlife use wind to locate optimal thermal conditions in the marine environment (e.g., albatrosses, cetaceans, and penguins) [89,90,91], with sea turtles being no exception [30,52,92,93]. Sea temperature is actually influenced by many factors, including latitude, sea currents, wind, substrate, and other factors [94,95], while sand temperature is influenced by beach slope, the water table, and vegetation [96,97]. To overcome these multiple contributors, previous studies predicted the future distribution of sea turtle nesting sites, using air temperature as a proxy for climate adjusted predictions to be threshold-dependent [32,41], with similar approaches being used for other wildlife [9,90,98]. Furthermore, studies of marine, avian, and terrestrial wildlife are increasingly incorporating the effects of various climate and physical parameters (usually in combination) on distributions during breeding, foraging, and migration (e.g., albatrosses, cetaceans, and chipmunks) [89,99,100]. Our study highlighted the utility of UASs in coupling information on animals with the surrounding environment and could be used to enhance species distribution models and improve the placement of current and future protected areas [101,102,103].
We found that, while nesting activity was recorded throughout the entire region, the highest track densities occurred in areas that were generally sheltered from the offshore prevailing winds during summer. This spread of activity supports previous site-specific studies documenting sea turtles nesting on both wind-sheltered [34,35,36] and wind-exposed [37] beaches. However, our regional scale study allowed us to evaluate the factors driving this variation in relation to the relative densities of tracks under different physical conditions. Wind-sheltered beaches during the breeding period are logically more stable than wind-exposed beaches, which is important when considering that clutches incubate for around two months. Such areas of higher stability are predicted to be associated with higher fidelity [104], which, in the case of sea turtles, and combined with the effect of natal homing of offspring, would be associated with higher nesting densities [61,105]. In our study region, these areas also had steeper beach slopes and water and sand temperatures, similar to previous studies [61,76,105], which would lead to much greater female-biased offspring production, due to higher sand temperatures [79,106]. Thus, sites with lower track densities in our study might also reflect key zones for current protection as possible areas with greater male offspring production [53,107] but also for future protection, in the event of any changes to current prevailing winds [66,67,108]. While the offshore prevailing wind (north-westerly) in the Ionian region of the Mediterranean (our study region) has remained constant during summer over the last 40 years (1979 to date), intensification of wind speed and associated wave and storm surge events are predicted in the future [66,67]. This could be further compounded by the intensification of prevailing winds in the Aegean, which would increase the frequency of east-type winds (NE, E, and SE) [65]. Thus, wind patterns (direction, speed, and surge) should be consistently monitored with sea parameters (temperature and substrate) and beach parameters (temperature and slope) to anticipate potential impacts to nesting sites and implement appropriate responses.
Most nesting areas in our study region currently occur within unmanaged protected areas (i.e., Natura 2000 habitats; Supplementary Materials Figure S2). While the two major nesting sites are under the management of two national parks (e.g., National Marine Park of Zakynthos and Kotychi–Strofylia Wetlands National Park that also encompasses Kyparissiakos Bay; Supplementary Materials Figure S2), active management is limited to Zakynthos and the low-density nesting area fronting Kotychi–Strofylia Wetlands, currently excluding the growing breeding population in the southern part of Kyparissiakos Bay. Furthermore, the inwater habitats (shallow submerged sandbank areas) used by turtles in the northwest of Lakonikos Bay lack protection, despite fronting intermediate-density nesting beaches, while the beaches and marine area used by turtles in north Kalamata Bay are noticeably lacking protection (Supplementary Materials Figure S2). Our study reinforces the importance for policy decisions on the placement of protected areas considering both the current and potential future habitat needs of wildlife [4,109,110]. However, to accomplish this, the implementation of long-term monitoring programs at large scales and in relation to multiple biotic and abiotic variables are required, with UASs and remote sensing databases representing viable cost-effective tools [90,111,112,113]. Our surveys were based on data assimilated in a single year but supported by intermittent surveys across sites in preceding years and published data; thus, regular surveys (i.e., at key points across seasons) at this scale conducted over the long-term are expected to provide insights into inter-annual variability and, potentially, shifts in distributions and aggregation hotspots. Ultimately, the key combinations of variables driving current distributions of wildlife and how they might change in the future must be identified and evaluated [9,114], rather than just using temperature as a proxy for climate and physical factors as a whole, with this issue existing across plant and animal taxa [7,8].

5. Conclusions

This study showed that multiple environmental parameters influence the breeding distribution of sea turtles, with marine and terrestrial conditions being strongly interlinked. Through combining UAS technology, field data, and remotely sensed data, we were able to survey marine megafauna and environmental data in synchrony at large scales and under different real scenarios. Regional scale monitoring could provide a way of linking site-based monitoring efforts and evaluating their relative contributions both in the present (i.e., lower density nesting areas might produce more males, increasing value) and future (i.e., current low density nesting areas might become optimal in the future under certain environmental scenarios) [115,116,117]. In conclusion, UASs combined with remote sensing tools provide a powerful tool to inform the predictions and models on which protected area management and policy are based.

Supplementary Materials

The following are available online at https://www.mdpi.com/article/10.3390/drones5040142/s1, Supplementary Materials Figure S1: Relationship (logarithmic) between the relative density of turtle tracks/km on surveyed beaches during the peak nesting period (20 June to 10 July; Schofield et al., 2013) that correspond with the maximum density of nests/km based on published data [47] (F1,35 = 21.25, r2 = 0.58, p < 0.001), Supplementary Materials Figure S2: (a) Map of western Greece showing the density of loggerhead sea turtles (Caretta caretta) [see Figure 2]. Green lines represent designated protected areas. Track data were corroborated with existing nest data at intermediate to major nesting sites (see Supplementary Materials Figure S1).

Author Contributions

Conceptualization, G.S.; field work, L.C.D., K.A.K. and G.S.; formal analysis, L.C.D. and G.S.; writing—original draft preparation, L.C.D. and G.S.; writing—review and editing, L.C.D., G.S., K.A.K. and C.E.; supervision, G.S.; funding acquisition, G.S. All authors have read and agreed to the published version of the manuscript.

Funding

This research was funded by Queen Mary University of London (UK), Deakin University (Australia).

Institutional Review Board Statement

Not applicable.

Informed Consent Statement

Not applicable.

Data Availability Statement

Data will be made available in Dryad on acceptance for publication.

Acknowledgments

Permission for fieldwork was given by the Greek Ministry of Environment (Permit: 151503/162 and 181806/941). We also thank Kostas Poirazidis, Joshua Simcock, Kesten Laverty, and Liam Nash for providing fieldwork assistance.

Conflicts of Interest

The authors declare no conflict of interest. The funders had no role in the design of the study; in the collection, analyses, or interpretation of data; in the writing of the manuscript, or in the decision to publish the results.

References

  1. Harley, C.D.; Randall Hughes, A.; Hultgren, K.M.; Miner, B.G.; Sorte, C.J.; Thornber, C.S.; Rodriguez, L.F.; Tomanek, L.; Williams, S.L. The impacts of climate change in coastal marine systems. Ecol. Lett. 2006, 9, 228–241. [Google Scholar] [CrossRef] [Green Version]
  2. Parmesan, C.; Yohe, G. A globally coherent fingerprint of climate change impacts across natural systems. Nature 2003, 421, 37–42. [Google Scholar] [CrossRef]
  3. Chivers, W.J.; Walne, A.W.; Hays, G.C. Mismatch between marine plankton range movements and the velocity of climate change. Nat. Commun. 2017, 8, 1–8. [Google Scholar] [CrossRef]
  4. Hays, G.C.; Bailey, H.; Bograd, S.J.; Bowen, W.D.; Campagna, C.; Carmichael, R.H.; Casale, P.; Chiaradia, A.; Costa, D.P.; Cuevas, E.; et al. Translating marine animal tracking data into conservation policy and management. Trends Ecol. Evol. 2019, 34, 459–473. [Google Scholar] [CrossRef] [Green Version]
  5. Burrows, M.T.; Schoeman, D.S.; Buckley, L.B.; Moore, P.; Poloczanska, E.S.; Brander, K.M.; Brown, C.; Bruno, J.F.; Duarte, C.M.; Halpern, B.S.; et al. The pace of shifting climate in marine and terrestrial ecosystems. Science 2011, 334, 652–655. [Google Scholar] [CrossRef] [Green Version]
  6. Carr, M.H.; Neigel, J.E.; Estes, J.A.; Andelman, S.; Warner, R.R.; Largier, J.L. Comparing marine and terrestrial ecosystems: Implications for the design of coastal marine reserves. Ecol. Appl. 2003, 13, S90–S107. [Google Scholar] [CrossRef] [Green Version]
  7. Chen, I.C.; Hill, J.K.; Ohlemuller, R.; Roy, D.B.; Thomas, C.D. Rapid range shifts of species associated with high levels of climate warming. Science 2011, 333, 1024–1026. [Google Scholar] [CrossRef]
  8. Poloczanska, E.S.; Brown, C.J.; Sydeman, W.J.; Kiessling, W.; Schoeman, D.S.; Moore, P.J.; Brander, K.; Bruno, J.F.; Buckley, L.B.; Burrows, M.T.; et al. Global imprint of climate change on marine life. Nat. Clim. Chang. 2013, 3, 919–925. [Google Scholar] [CrossRef]
  9. Bates, A.E.; Helmuth, B.; Burrows, M.T.; Duncan, M.I.; Garrabou, J.; Guy-Haim, T.; Lima, F.; Queiros, A.M.; Seabra, R.; Marsh, R.; et al. Biologists ignore ocean weather at their peril. Nature 2018, 560, 299–301. [Google Scholar] [CrossRef] [Green Version]
  10. Siepielski, A.M.; Morrissey, M.B.; Buoro, M.; Carlson, S.M.; Caruso, C.M.; Clegg, S.M.; Coulson, T.; DiBattista, J.; Gotanda, K.M.; Francis, C.D.; et al. Precipitation drives global variation in natural selection. Science 2017, 355, 959–962. [Google Scholar] [CrossRef] [Green Version]
  11. VanDerWal, J.; Murphy, H.T.; Kutt, A.S.; Perkins, G.C.; Bateman, B.L.; Perry, J.J.; Reside, A.E. Focus on poleward shifts in species’ distribution underestimates the fingerprint of climate change. Nat. Clim. Chang. 2012, 3, 239–243. [Google Scholar] [CrossRef]
  12. Hoegh-Guldberg, O.; Bruno, J.F. The impact of climate change on the world’s marine ecosystems. Science 2010, 328, 1523–1528. [Google Scholar] [CrossRef] [PubMed]
  13. Gaillard, J.M.; Hebblewhite, M.; Loison, A.; Fuller, M.; Powell, R.; Basille, M.; Van Moorter, B. Habitat-performance relationships: Finding the right metric at a given spatial scale. Philos. Trans. R. Soc. B Biol. Sci. 2010, 365, 2255–2265. [Google Scholar] [CrossRef]
  14. Pullin, A.S.; Knight, T.M.; Stone, D.A.; Charman, K. Do conservation managers use scientific evidence to support their decision-making? Biol. Conserv. 2004, 119, 245–252. [Google Scholar] [CrossRef]
  15. Grüss, A.; Kaplan, D.M.; Guénette, S.; Roberts, C.M.; Botsford, L.W. Consequences of adult and juvenile movement for marine protected areas. Biol. Conserv. 2011, 144, 692–702. [Google Scholar] [CrossRef]
  16. Hussey, N.E.; Kessel, S.T.; Aarestrup, K.; Cooke, S.J.; Cowley, P.D.; Fisk, A.T.; Harcourt, R.G.; Holland, K.N.; Iverson, S.J.; Kocik, J.F.; et al. Aquatic animal telemetry: A panoramic window into the underwater world. Science 2015, 348, 1255642. [Google Scholar] [CrossRef] [PubMed] [Green Version]
  17. Johnston, D.W. Unoccupied Aircraft Systems in marine science and conservation. Annu. Rev. Mar. Sci. 2019, 11, 439–463. [Google Scholar] [CrossRef] [Green Version]
  18. Raoult, V.; Colefax, A.P.; Allan, B.M.; Cagnazzi, D.; Castelblanco-Martínez, N.; Ierodiaconou, D.; Johnston, D.W.; Landeo-Yauri, S.; Lyons, M.; Pirotta, V.; et al. Operational protocols for the use of drones in marine animal research. Drones 2020, 4, 64. [Google Scholar] [CrossRef]
  19. Schofield, G.; Esteban, N.; Katselidis, K.A.; Hays, G.C. Drones for research on sea turtles and other marine vertebrates—A review. Biol. Conserv. 2019, 238, 108214. [Google Scholar] [CrossRef]
  20. Kelaher, B.P.; Colefax, A.P.; Tagliafico, A.; Bishop, M.J.; Giles, A.; Butcher, P.A. Assessing variation in assemblages of large marine fauna off ocean beaches using drones. Mar. Freshw. Res. 2019, 71, 68–77. [Google Scholar] [CrossRef] [Green Version]
  21. Christie, K.S.; Gilbert, S.L.; Brown, C.L.; Hatfield, M.; Hanson, L. Unmanned aircraft systems in wildlife research: Current and future applications of a transformative technology. Front. Ecol. Environ. 2016, 14, 241–251. [Google Scholar] [CrossRef]
  22. Linchant, J.; Lisein, J.; Semeki, J.; Lejeune, P.; Vermeulen, C. Are unmanned aircraft systems (UASs) the future of wildlife monitoring? A review of accomplishments and challenges. Mammal. Rev. 2015, 45, 239–252. [Google Scholar] [CrossRef]
  23. Hays, G.C.; Hawkes, L.A. Satellite tracking sea turtles: Opportunities and challenges to address key questions. Front. Mar. Sci. 2018, 5, 432. [Google Scholar] [CrossRef]
  24. Mazaris, A.D.; Schofield, G.; Gkazinou, C.; Almpanidou, V.; Hays, G.C. Global sea turtle conservation successes. Sci. Adv. 2017, 3, e1600730. [Google Scholar] [CrossRef] [Green Version]
  25. Casale, P.; Tucker, A.D. Caretta Caretta (Amended Version of 2015 Assessment). 2017. Available online: https://www.biosfera1.com/wp-content/uploads/2021/01/Categoria-de-Amea%C3%A7a-Caretta-caretta-2017-10.2305_IUCN.UK_.2017-2.RLTS_.T3897A119333622.en_.pdf (accessed on 18 November 2021).
  26. Weishampel, J.F.; Bagley, D.A.; Ehrhart, L.M. Earlier nesting by loggerhead sea turtles following sea surface warming. Glob. Chang. Biol. 2004, 10, 1424–1427. [Google Scholar] [CrossRef]
  27. Rees, A.F.; Alfaro-Shigueto, J.; Barata, P.C.R.; Bjorndal, K.A.; Bolten, A.B.; Bourjea, J.; Broderick, A.C.; Campbell, L.M.; Cardona, L.; Carreras, C.; et al. Are we working towards global research priorities for management and conservation of sea turtles? Endanger. Species Res. 2016, 31, 337–382. [Google Scholar] [CrossRef] [Green Version]
  28. Culver, M.; Gibeaut, J.C.; Shaver, D.J.; Tissot, P.; Starek, M. Using LiDAR data to assess the relationship between beach geomorphology and Kemp’s Ridley (Lepidochelys kempii) nest site selection along Padre Island, TX, United States. Front. Mar. Sci. 2020, 7, 214. [Google Scholar] [CrossRef]
  29. Schofield, G.; Lilley, M.K.S.; Bishop, C.M.; Brown, P.; Katselidis, K.A.; Dimopoulos, P.; Pantis, J.D.; Hays, G.C. Conservation hotspots: Implications of intense spatial area use by breeding male and female loggerheads at the Mediterranean’s largest rookery. Endanger. Species Res. 2009, 10, 191–202. [Google Scholar] [CrossRef] [Green Version]
  30. Schofield, G.; Bishop, C.M.; Katselidis, K.A.; Dimopoulos, P.; Pantis, J.D.; Hays, G.C. Microhabitat selection by sea turtles in a dynamic thermal marine environment. J. Anim. Ecol. 2009, 78, 14–21. [Google Scholar] [CrossRef]
  31. Weishampel, J.F.; Bagley, D.A.; Ehrhart, L.M. Intra-annual Loggerhead and Green Turtle Spatial Nesting Patterns. Southeast. Nat. 2006, 5, 453–462. [Google Scholar] [CrossRef]
  32. Almpanidou, V.; Schofield, G.; Kallimanis, A.S.; Türkozan, O.; Hays, G.C.; Mazaris, A.D. Using climatic suitability thresholds to identify past, present and future population viability. Ecol. Indic. 2016, 71, 551–556. [Google Scholar] [CrossRef]
  33. Dunkin, L.; Reif, M.; Altman, S.; Swannack, T. A spatially explicit, multi-criteria decision support model for loggerhead sea turtle nesting habitat suitability: A remote sensing-based approach. Remote Sens. 2016, 8, 573. [Google Scholar] [CrossRef] [Green Version]
  34. Bannister, N.; Holland, J.; Farrelly, T. Nest site fidelity of Flatback Turtles (Natator depressus) on Bare Sand Island, Northern Territory, Australia. North. Territ. Nat. 2016, 27, 47–53. [Google Scholar]
  35. Koch, A.U.; Guinea, M.L.; Whiting, S.D. Effects of sand erosion and current harvest practices on incubation of the flatback sea turtle (Natator depressus). Aust. J. Zool. 2007, 55, 97–105. [Google Scholar] [CrossRef]
  36. Koch, A.U.; Guinea, M.L. Lower nesting success of flatback turtles caused by disorientation. Mar. Turt. Newsl. 2006, 114, 16. [Google Scholar]
  37. Garcon, J.S.; Grech, A.; Moloney, J.; Hamann, M. Relative Exposure Index: An important factor in sea turtle nesting distribution. Aquat. Conserv. Mar. Freshw. Ecosyst. 2010, 20, 140–149. [Google Scholar] [CrossRef]
  38. Fonseca, J.G.; Cordeiro, C.A.M.M.; Ferreira, C.E.L. Spatial distribution of sea turtles on South Atlantic subtropical reefs. Mar. Ecol. Prog. Ser. 2021, 678, 125–138. [Google Scholar] [CrossRef]
  39. Schofield, G.; Bishop, C.M.; MacLean, G.; Brown, P.; Baker, M.; Katselidis, K.A.; Dimopoulos, P.; Pantis, J.D.; Hays, G.C. Novel GPS tracking of sea turtles as a tool for conservation management. J. Exp. Mar. Biol. Ecol. 2007, 347, 58–68. [Google Scholar] [CrossRef]
  40. Hawkes, L.A.; Broderick, A.C.; Godfrey, M.H.; Godley, B.J. Climate change and marine turtles. Endanger. Species Res. 2009, 7, 137–154. [Google Scholar] [CrossRef] [Green Version]
  41. Witt, M.J.; Hawkes, L.A.; Godfrey, M.H.; Godley, B.J.; Broderick, A.C. Predicting the impacts of climate change on a globally distributed species: The case of the loggerhead turtle. J. Exp. Biol. 2010, 213, 901–911. [Google Scholar] [CrossRef] [Green Version]
  42. Dale, V.H.; Joyce, L.A.; McNulty, S.; Neilson, R.P.; Ayres, M.P.; Flannigan, M.D.; Hanson, P.J.; Irland, L.C.; Lugo, A.E.; Peterson, C.J.; et al. Climate change and forest disturbances. BioScience 2001, 51, 723–734. [Google Scholar] [CrossRef] [Green Version]
  43. Fuentes, M.M.P.B.; Maynard, J.A.; Guinea, M.; Bell, I.P.; Werdell, P.J.; Hamann, M. Proxy indicators of sand temperature help project impacts of global warming on sea turtles in northern Australia. Endanger. Species Res. 2009, 9, 33–40. [Google Scholar] [CrossRef] [Green Version]
  44. Casale, P.; Broderick, A.C.; Camiñas, J.A.; Cardona, L.; Carreras, C.; Demetropoulos, A.; Fuller, W.J.; Godley, B.J.; Hochscheid, S.; Kaska, Y.; et al. Mediterranean sea turtles: Current knowledge and priorities for conservation and research. Endanger. Species Res. 2018, 36, 229–267. [Google Scholar] [CrossRef] [Green Version]
  45. European Commission. Council Directive 92/43/EEC of 21 May 1992 on the conservation of natural habitats and of wild fauna and flora. Off. J. Eur. Union 1992, 206, 7–50. [Google Scholar]
  46. Casale, P. Loggerhead Turtle (Caretta caretta)—Mediterranean Subpopulation. 2015. Available online: https://www.google.com.hk/url?sa=t&rct=j&q=&esrc=s&source=web&cd=&cad=rja&uact=8&ved=2ahUKEwjts9bLgLX0AhXmrlYBHXitC40QFnoECAMQAQ&url=https%3A%2F%2Fwww.iucnredlist.org%2Fspecies%2Fpdf%2F83646294%2Fattachment&usg=AOvVaw2OD_PogM4JBFHcTK7HZDu6 (accessed on 18 November 2021).
  47. Casale, P.; Margaritoulis, D. Sea Turtles in the Mediterranean: Distribution, Threats and Conservation Priorities; International Union for Conservation of Nature (IUCN): Gland, Switzerland, 2010. [Google Scholar]
  48. Dodd, C.K. Synopsis of the Biological Data on the Loggerhead Sea Turtle Caretta Caretta (Linnaeus 1758); United States Fish and Wildlife Service: Washington, DC, USA, 1988.
  49. Margaritoulis, D. Nesting activity and reproductive output of loggerhead sea turtles, Caretta caretta, over 19 seasons (1984–2002) at Laganas Bay, Zakynthos, Greece: The largest rookery in the Mediterranean. Chelonian Conserv. Biol. 2005, 4, 916–929. [Google Scholar]
  50. Schofield, G.; Dimadi, A.; Fossette, S.; Katselidis, K.A.; Koutsoubas, D.; Lilley, M.K.S.; Luckman, A.; Pantis, J.D.; Karagouni, A.D.; Hays, G.C.; et al. Satellite tracking large numbers of individuals to infer population level dispersal and core areas for the protection of an endangered species. Divers. Distrib. 2013, 19, 834–844. [Google Scholar] [CrossRef]
  51. Hays, G.C.; Broderick, A.C.; Glen, F.; Godley, B.J.; Houghton, J.D.R.; Metcalfe, J.D. Water temperature and internesting intervals for loggerhead (Caretta caretta) and green (Chelonia mydas) sea turtles. J. Therm. Biol. 2002, 27, 429–432. [Google Scholar] [CrossRef]
  52. Fossette, S.; Schofield, G.; Lilley, M.K.S.; Gleiss, A.C.; Hays, G.C. Acceleration data reveal the energy management strategy of a marine ectotherm during reproduction. Funct. Ecol. 2012, 26, 324–333. [Google Scholar] [CrossRef]
  53. Katselidis, K.A.; Schofield, G.; Stamou, G.; Dimopoulos, P.; Pantis, J.D.; Katzner, T. Females first? Past, present and future variability in offspring sex ratio at a temperate sea turtle breeding area. Anim. Conserv. 2012, 15, 508–518. [Google Scholar] [CrossRef]
  54. Schofield, G.; Scott, R.; Dimadi, A.; Fossette, S.; Katselidis, K.A.; Koutsoubas, D.; Lilley, M.K.S.; Pantis, J.D.; Karagouni, A.D.; Hays, G.C. Evidence-based marine protected area planning for a highly mobile endangered marine vertebrate. Biol. Conserv. 2013, 161, 101–109. [Google Scholar] [CrossRef]
  55. Schofield, G.; Katselidis, K.A.; Lilley, M.K.S.; Reina, R.D.; Hays, G.C. Detecting elusive aspects of wildlife ecology using drones: New insights on the mating dynamics and operational sex ratios of sea turtles. Funct. Ecol. 2017, 31, 2310–2319. [Google Scholar] [CrossRef]
  56. Dujon, A.M.; Ierodiaconou, D.; Geeson, J.J.; Arnould, J.P.Y.; Allan, B.M.; Katselidis, K.A.; Schofield, G.; Scales, K.; Bouchet, P. Machine learning to detect marine animals in UAV imagery: Effect of morphology, spacing, behaviour and habitat. Remote. Sens. Ecol. Conserv. 2021, 7, 341–354. [Google Scholar] [CrossRef]
  57. Katselidis, K.A.; Schofield, G.; Stamou, G.; Dimopoulos, P.; Pantis, J.D. Employing sea-level rise scenarios to strategically select sea turtle nesting habitat important for long-term management at a temperate breeding area. J. Exp. Mar. Biol. Ecol. 2014, 450, 47–54. [Google Scholar] [CrossRef]
  58. Agisoft Metashape, 1.6.5; Agisoft LLC: Saint Petersburg, Russia, 2021.
  59. Carvalho, R.C.; Kennedy, D.M.; Niyazi, Y.; Leach, C.; Konlechner, T.M.; Ierodiaconou, D. Structure-from-motion photogrammetry analysis of historical aerial photography: Determining beach volumetric change over decadal scales. Earth Surf. Process. Landf. 2020, 45, 2540–2555. [Google Scholar] [CrossRef]
  60. QGIS Geographic Information System, 3.16.8; QGIS Association. 2021. Available online: https://www.qgis.org/en/site/getinvolved/governance/charter/index.html (accessed on 18 November 2021).
  61. Katselidis, K.A.; Schofield, G.; Stamou, G.; Dimopoulos, P.; Pantis, J.D. Evidence-based management to regulate the impact of tourism at a key marine turtle rookery on Zakynthos Island, Greece. Oryx 2013, 47, 584–594. [Google Scholar] [CrossRef] [Green Version]
  62. Buongiorno Nardelli, B.; Tronconi, C.; Pisano, A.; Santoleri, R. High and ultra-high resolution processing of satellite sea surface temperature data over southern European seas in the framework of MyOcean project. Remote Sens. Environ. 2013, 129, 1–16. [Google Scholar] [CrossRef]
  63. Amante, C.; Eakins, B.W. ETOPO1 arc-minute global relief model: Procedures, data sources and analysis. NOAA technical memorandum NESDIS NGDC-24. Natl. Geophys. Data Cent. NOAA 2009, 10, V5C8276M. [Google Scholar]
  64. GADM Database of Global Administrative Areas, Version 2.0. Available online: www.gadm.org (accessed on 15 May 2020).
  65. Androulidakis, Y.S.; Kombiadou, K.D.; Makris, C.V.; Baltikas, V.N.; Krestenitis, Y.N. Storm surges in the Mediterranean Sea: Variability and trends under future climatic conditions. Dyn. Atmos. Ocean 2015, 71, 56–82. [Google Scholar] [CrossRef]
  66. Makris, C.; Galiatsatou, P.; Tolika, K.; Anagnostopoulou, C.; Kombiadou, K.; Prinos, P.; Velikou, K.; Kapelonis, Z.; Tragou, E.; Androulidakis, Y.; et al. Climate change effects on the marine characteristics of the Aegean and Ionian Seas. Ocean Dyn. 2016, 66, 1603–1635. [Google Scholar] [CrossRef]
  67. Vagenas, C.; Anagnostopoulou, C.; Tolika, K. Climatic study of the marine surface wind field over the Greek seas with the use of a high resolution RCM focusing on extreme winds. Climate 2017, 5, 29. [Google Scholar] [CrossRef] [Green Version]
  68. Windyty, S.E. Available online: www.windy.com (accessed on 30 September 2020).
  69. Hernandez, P.A.; Graham, C.H.; Master, L.L.; Albert, D.L. The effect of sample size and species characteristics on performance of different species distribution modeling methods. Ecography 2006, 29, 773–785. [Google Scholar] [CrossRef]
  70. Grenyer, R.; Orme, C.D.; Jackson, S.F.; Thomas, G.H.; Davies, R.G.; Davies, T.J.; Jones, K.E.; Olson, V.A.; Ridgely, R.S.; Rasmussen, P.C.; et al. Global distribution and conservation of rare and threatened vertebrates. Nature 2006, 444, 93–96. [Google Scholar] [CrossRef] [PubMed]
  71. Sirami, C.; Seymour, C.; Midgley, G.; Barnard, P. The impact of shrub encroachment on savanna bird diversity from local to regional scale. Divers. Distrib. 2009, 15, 948–957. [Google Scholar] [CrossRef]
  72. Forey, E.; Chapelet, B.; Vitasse, Y.; Tilquin, M.; Touzard, B.; Michalet, R. The relative importance of disturbance and environmental stress at local and regional scales in French coastal sand dunes. J. Veg. Sci. 2008, 19, 493–502. [Google Scholar] [CrossRef]
  73. Lowen, J.B.; McKindsey, C.W.; Therriault, T.W.; DiBacco, C. Effects of spatial resolution on predicting the distribution of aquatic invasive species in nearshore marine environments. Mar. Ecol. Prog. Ser. 2016, 556, 17–30. [Google Scholar] [CrossRef]
  74. Harley, C.D.G.; Helmuth, B.S.T. Local- and regional-scale effects of wave exposure, thermal stress, and absolute versus effective shore level on patterns of intertidal zonation. Limnol. Oceanogr. 2003, 48, 1498–1508. [Google Scholar] [CrossRef]
  75. Fauchald, P.; Erikstad, K.E.; Skarsfjord, H. Scale-dependent predator–prey Interactions: The hierarchical spatial distribution of seabirds and prey. Ecology 2000, 81, 773–783. [Google Scholar] [CrossRef]
  76. Wood, D.W.; Bjorndal, K.A.; Ross, S.T. Relation of temperature, moisture, salinity, and slope to nest site selection in loggerhead sea turtles. Copeia 2000, 2000, 119. [Google Scholar] [CrossRef] [Green Version]
  77. Hamel, M.A.; McMahon, C.R.; Bradshaw, C.J.A. Flexible inter-nesting behaviour of generalist olive ridley turtles in Australia. J. Exp. Mar. Biol. Ecol. 2008, 359, 47–54. [Google Scholar] [CrossRef]
  78. Sato, K.; Matsuzawa, Y.; Tanaka, H.; Bando, T.; Minamikawa, S.; Sakamoto, W.; Naito, Y. Internesting intervals for loggerhead turtles, Caretta caretta, and green turtles, Chelonia mydas, are affected by temperature. Can. J. Zool. 1998, 76, 1651–1662. [Google Scholar] [CrossRef]
  79. Laloe, J.O.; Esteban, N.; Berkel, J.; Hays, G.C. Sand temperatures for nesting sea turtles in the Caribbean: Implications for hatchling sex ratios in the face of climate change. J. Exp. Mar. Biol. Ecol. 2016, 474, 92–99. [Google Scholar] [CrossRef] [Green Version]
  80. Godley, B.J.; Broderick, A.C.; Glen, F.; Hays, G.C. Temperature-dependent sex determination of Ascension Island green turtles. Mar. Ecol. Prog. Ser. 2002, 226, 115–124. [Google Scholar] [CrossRef]
  81. Hughes, D.A.; Richard, J.D. The nesting of the Pacific Ridley Turtle Lepidochelys olivacea on Playa Naneite, Costa Rica. Mar. Biol. 1974, 24, 97–107. [Google Scholar] [CrossRef]
  82. Godley, B.J.; Broderick, A.C.; Frauenstein, R.; Glen, F.; Hays, G.C. Reproductive seasonality and sexual dimorphism in green turtles. Mar. Ecol. Prog. Ser. 2002, 226, 125–133. [Google Scholar] [CrossRef] [Green Version]
  83. Arendt, M.D.; Segars, A.L.; Byrd, J.I.; Boynton, J.; Whitaker, J.D.; Parker, L.; Owens, D.W.; Blanvillain, G.; Quattro, J.M.; Roberts, M.A. Distributional patterns of adult male loggerhead sea turtles (Caretta caretta) in the vicinity of Cape Canaveral, Florida, USA during and after a major annual breeding aggregation. Mar. Biol. 2011, 159, 101–112. [Google Scholar] [CrossRef]
  84. Hays, G.C.; Luschi, P.; Papi, F.; del Seppia, C.; Marsh, R. Changes in behaviour during the inter-nesting period and post-nesting migration for Ascension Island green turtles. Mar. Ecol. Prog. Ser. 1999, 189, 263–273. [Google Scholar] [CrossRef]
  85. Kaplan, D.M.; Largier, J.L.; Navarrete, S.; Guiñez, R.; Castilla, J.C. Large diurnal temperature fluctuations in the nearshore water column. Estuar. Coast. Shelf Sci. 2003, 57, 385–398. [Google Scholar] [CrossRef]
  86. Barnes, R.S.K.; Mann, K.H. Fundamentals of Aquatic Ecology; John Wiley & Sons: Hoboken, NJ, USA, 2009; ISBN 1444314106. [Google Scholar]
  87. Narváez, D.A.; Navarrete, S.A.; Largier, J.; Vargas, C.A. Onshore advection of warm water, larval invertebrate settlement, and relaxation of upwelling off central Chile. Mar. Ecol. Prog. Ser. 2006, 309, 159–173. [Google Scholar] [CrossRef] [Green Version]
  88. Tapia, F.J.; Pineda, J.; Ocampo-Torres, F.J.; Fuchs, H.L.; Parnell, P.E.; Montero, P.; Ramos, S. High-frequency observations of wind-forced onshore transport at a coastal site in Baja California. Cont. Shelf Res. 2004, 24, 1573–1585. [Google Scholar] [CrossRef]
  89. Weimerskirch, H.; Louzao, M.; de Grissac, S.; Delord, K. Changes in wind pattern alter albatross distribution and life-history traits. Science 2012, 335, 211–214. [Google Scholar] [CrossRef] [Green Version]
  90. Barlow, D.R.; Klinck, H.; Ponirakis, D.; Garvey, C.; Torres, L.G. Temporal and spatial lags between wind, coastal upwelling, and blue whale occurrence. Sci. Rep. 2021, 11, 1–10. [Google Scholar] [CrossRef]
  91. Dehnhard, N.; Ludynia, K.; Poisbleau, M.; Demongin, L.; Quillfeldt, P. Good days, bad days: Wind as a driver of foraging success in a flightless seabird, the southern rockhopper penguin. PLoS ONE 2013, 8, e79487. [Google Scholar] [CrossRef] [PubMed] [Green Version]
  92. Whiting, S.D.; Long, J.L.; Hadden, K.M.; Lauder, A.D.K.; Koch, A.U. Insights into size, seasonality and biology of a nesting population of the Olive Ridley turtle in northern Australia. Wildl. Res. 2007, 34, 200–210. [Google Scholar] [CrossRef]
  93. Shaver, D.J.; Tissot, P.E.; Streich, M.M.; Walker, J.S.; Rubio, C.; Amos, A.F.; George, J.A.; Pasawicz, M.R. Hypothermic stunning of green sea turtles in a western Gulf of Mexico foraging habitat. PLoS ONE 2017, 12, e0173920. [Google Scholar] [CrossRef] [Green Version]
  94. Perry, A.L.; Low, P.J.; Ellis, J.R.; Reynolds, J.D. Climate change and distribution shifts in marine fishes. Science 2005, 308, 1912–1915. [Google Scholar] [CrossRef] [PubMed]
  95. Rodwell, M.J.; Rowell, D.P.; Folland, C.K. Oceanic forcing of the wintertime North Atlantic Oscillation and European climate. Nature 1999, 398, 320–323. [Google Scholar] [CrossRef]
  96. Brown, A.C.; McLachlan, A. The Ecology of Sandy Shores; Elsevier: Amsterdam, The Netherlands, 2006; ISBN 978-0-12-372569-1. [Google Scholar]
  97. McLachlan, A. Sandy beach ecology—A review. In Sandy Beaches as Ecosystems. Developments in Hydrobiology; Springer: Dordrecht, The Netherlands, 1983; Volume 19, pp. 321–380. ISBN 978-90-481-8521-4. [Google Scholar]
  98. Babcock, R.C.; Bustamante, R.H.; Fulton, E.A.; Fulton, D.J.; Haywood, M.D.E.; Hobday, A.J.; Kenyon, R.; Matear, R.J.; Plagányi, E.E.; Richardson, A.J.; et al. Severe continental-scale impacts of climate change are happening now: Extreme climate events impact marine habitat forming communities along 45% of Australia’s coast. Front. Mar. Sci. 2019, 6, 411. [Google Scholar] [CrossRef]
  99. Gill, P.C.; Morrice, M.G.; Page, B.; Pirzl, R.; Levings, A.H.; Coyne, M. Blue whale habitat selection and within-season distribution in a regional upwelling system off southern Australia. Mar. Ecol. Prog. Ser. 2011, 421, 243–263. [Google Scholar] [CrossRef] [Green Version]
  100. Rubidge, E.M.; Monahan, W.B.; Parra, J.L.; Cameron, S.E.; Brashares, J.S. The role of climate, habitat, and species co-occurrence as drivers of change in small mammal distributions over the past century. Glob. Chang. Biol. 2011, 17, 696–708. [Google Scholar] [CrossRef]
  101. Guillera-Arroita, G.; Lahoz-Monfort, J.J.; Elith, J.; Gordon, A.; Kujala, H.; Lentini, P.E.; McCarthy, M.A.; Tingley, R.; Wintle, B.A. Is my species distribution model fit for purpose? Matching data and models to applications. Glob. Ecol. Biogeogr. 2015, 24, 276–292. [Google Scholar] [CrossRef]
  102. Guisan, A.; Tingley, R.; Baumgartner, J.B.; Naujokaitis-Lewis, I.; Sutcliffe, P.R.; Tulloch, A.I.; Regan, T.J.; Brotons, L.; McDonald-Madden, E.; Mantyka-Pringle, C.; et al. Predicting species distributions for conservation decisions. Ecol. Lett. 2013, 16, 1424–1435. [Google Scholar] [CrossRef]
  103. Yates, K.L.; Bouchet, P.J.; Caley, M.J.; Mengersen, K.; Randin, C.F.; Parnell, S.; Fielding, A.H.; Bamford, A.J.; Ban, S.; Barbosa, A.M.; et al. Outstanding challenges in the transferability of ecological models. Trends Ecol. Evol. 2018, 33, 790–802. [Google Scholar] [CrossRef] [Green Version]
  104. Switzer, P.V. Site fidelity in predictable and unpredictable habitats. Evol. Ecol. 1993, 7, 533–555. [Google Scholar] [CrossRef]
  105. Weishampel, J.F.; Bagley, D.A.; Ehrhart, L.M.; Rodenbeck, B.L. Spatiotemporal patterns of annual sea turtle nesting behaviors along an East Central Florida beach. Biol. Conserv. 2003, 110, 295–303. [Google Scholar] [CrossRef]
  106. Hays, G.C.; Ashworth, J.S.; Barnsley, M.J.; Broderick, A.C.; Emery, D.R.; Godley, B.J.; Henwood, A.; Jones, E.L. The importance of sand albedo for the thermal conditions on sea turtle nesting beaches. Oikos 2001, 93, 87–94. [Google Scholar] [CrossRef] [Green Version]
  107. Patrício, A.R.; Marques, A.; Barbosa, C.; Broderick, A.C.; Godley, B.J.; Hawkes, L.A.; Rebelo, R.; Regalla, A.; Catry, P. Balanced primary sex ratios and resilience to climate change in a major sea turtle population. Mar. Ecol. Prog. Ser. 2017, 577, 189–203. [Google Scholar] [CrossRef]
  108. Long, T.M.; Angelo, J.; Weishampel, J.F. LiDAR-derived measures of hurricane- and restoration-generated beach morphodynamics in relation to sea turtle nesting behaviour. Int. J. Remote Sens. 2011, 32, 231–241. [Google Scholar] [CrossRef]
  109. Dawson, T.P.; Jackson, S.T.; House, J.I.; Prentice, I.C.; Mace, G.M. Beyond predictions: Biodiversity conservation in a changing climate. Science 2011, 332, 53–58. [Google Scholar] [CrossRef] [Green Version]
  110. Hawkes, L.A.; Broderick, A.C.; Godfrey, M.H.; Godley, B.J. Investigating the potential impacts of climate change on a marine turtle population. Glob. Chang. Biol. 2007, 13, 923–932. [Google Scholar] [CrossRef]
  111. Edgar, G.J.; Stuart-Smith, R.D.; Willis, T.J.; Kininmonth, S.; Baker, S.C.; Banks, S.; Barrett, N.S.; Becerro, M.A.; Bernard, A.T.; Berkhout, J.; et al. Global conservation outcomes depend on marine protected areas with five key features. Nature 2014, 506, 216–220. [Google Scholar] [CrossRef] [Green Version]
  112. Fernandes, L.; Day, J.O.N.; Lewis, A.; Slegers, S.; Kerrigan, B.; Breen, D.A.N.; Cameron, D.; Jago, B.; Hall, J.; Lowe, D.; et al. Establishing representative no-take areas in the Great Barrier Reef: Large-scale implementation of theory on Marine Protected Areas. Conserv. Biol. 2005, 19, 1733–1744. [Google Scholar] [CrossRef]
  113. Margules, C.R.; Pressey, R.L. Systematic Conservation Planning. Nature 2000, 405, 243–253. [Google Scholar] [CrossRef] [PubMed]
  114. Pike, D.A. Climate influences the global distribution of sea turtle nesting. Glob. Ecol. Biogeogr. 2013, 22, 555–566. [Google Scholar] [CrossRef]
  115. Parmesan, C.; Ryrholm, N.; Stefanescu, C.; Hill, J.K.; Thomas, C.D.; Descimon, H.; Huntley, B.; Kaila, L.; Kullberg, J.; Tammaru, T.; et al. Poleward shifts in geographical ranges of butterfly species associated with regional warming. Nature 1999, 399, 579–583. [Google Scholar] [CrossRef]
  116. Opdam, P.; Wascher, D. Climate change meets habitat fragmentation: Linking landscape and biogeographical scale levels in research and conservation. Biol. Conserv. 2004, 117, 285–297. [Google Scholar] [CrossRef]
  117. Oliver, T.A.; Palumbi, S.R. Distributions of stress-resistant coral symbionts match environmental patterns at local but not regional scales. Mar. Ecol. Prog. Ser. 2009, 378, 93–103. [Google Scholar] [CrossRef]
Figure 1. Map showing the study region in western Greece and its location within the Mediterranean Sea (inset). Natura 2000 habitats are delineated in green; the National Marine Park of Zakynthos is the only managed MPA within our study area and is also a Natura 2000 habitat. Isobaths are delineated at 300 m intervals; topographic contours are delineated at 100 m intervals.
Drones 05 00142 g001
Figure 2. (a) Western Greece showing the density of loggerhead sea turtles (Caretta caretta) in the nearshore waters (turtles/km, outer squares) and turtle tracks on beaches (tracks/km, inner squares) based on UAS surveys conducted between 2016 and 2019. Each inwater square represents a composite 2 km stretch of shoreline by 400 m offshore to present data at a scale for viewing visually. Track data were corroborated with published data on nesting activity (see Section 2.2). (b) Example showing the distribution of loggerhead sea turtles (red dots) in the nearshore area along a 19 km section of coastline. Topographic contours are delineated at 50 m intervals. (c) Snapshot of seven loggerhead sea turtles (Caretta caretta) (inside white circles) captured along the path of one UAS survey conducted at 60 m altitude (large white circle: 5× enlarged image of one turtle).
Drones 05 00142 g002
Figure 3. Associations detected between: (a) beach slope and turtle track density at each surveyed site (tracks/km); (b) mean sand temperature (°C) and turtle track density at each surveyed site (tracks/km); and (c) mean sea temperature and in-water turtle density at each surveyed site (turtles/km). Track density and turtle density reflect the maximum track/turtle density recorded at each surveyed site during the peak nesting period (May = grey circles; June = dark grey triangles; July = black squares).
Drones 05 00142 g003
Figure 4. Examples of (a) offshore prevailing NW wind with sheltered area (purple shading; source: windy.com; accessed on 24 November 2021) and (b) skin sea surface temperature [62] in Kyparissiakos Bay, Greece, on 27 June 2020. (c) Distribution and frequency of sheltered sites for the eight key wind directions (e.g., N, NE, E, etc.) from May to September 2020. The circles represent 10–20 (striped fill) and 20–35 km/h (solid fill) winds, with 10% increments in size ranging from 1–10% circles to 71–80% circles.
Drones 05 00142 g004
Publisher’s Note: MDPI stays neutral with regard to jurisdictional claims in published maps and institutional affiliations.

