Abstract
Migratory birds have the ability to save energy during flight by arranging themselves in a V-formation. This arrangement enables an increase in the overall efficiency of the group because the wake vortices shed by each of the birds provide additional lift and thrust to every member. Therefore, the aerodynamic advantages of such a flight arrangement can be exploited in the design process of micro air vehicles. One significant difference when comparing the anatomy of birds to the design of most micro air vehicles is that bird wings are not completely rigid. Birds have the ability to actively morph their wings during the flapping cycle. Given these aspects of avian flight, the objective of this work is to incorporate active bending and torsion into multiple pairs of flapping wings arranged in a V-formation and to investigate their aerodynamic behavior using the unsteady vortex lattice method. To do so, the first two bending and torsional mode shapes of a cantilever beam are considered and the aerodynamic characteristics of morphed wings for a range of V-formation angles, while changing the group size in order to determine the optimal configuration that results in maximum propulsive efficiency, are examined. The aerodynamic simulator incorporating the prescribed morphing is qualitatively verified using experimental data taken from trained kestrel flights. The simulation results demonstrate that coupled bending and twisting of the first mode shape yields the highest propulsive efficiency over a range of formation angles. Furthermore, the optimal configuration in terms of propulsive efficiency is found to be a five-body V-formation incorporating coupled bending and twisting of the first mode at a formation angle of 140 degrees. These results indicate the potential improvement in the aerodynamic performance of the formation flight when introducing active morphing and bioinspiration.
1. Introduction
Some species of birds arrange themselves in a V-formation during flight [1]. It is well established that such a group arrangement is helpful to improve flight efficiency and save energy [2,3]. This enables them to fly over long distances without stopping and feeding. The saving of energy is mainly attributed to the interactions between the shed wake vortices and the flapping wings. These wake vortices may increase the lift produced by each of the birds in the group, which leads to a greater overall group efficiency when compared to a bird in solo flight [4]. Furthermore, avian wings are not completely rigid. Birds have flexible wrists which allow the wings to bend and twist throughout the flapping cycle [5]. This morphing can be achieved actively, through muscular contractions, or passively, through the aerodynamic forces acting on the flexible wing [6]. The primary muscles responsible for the downstroke and upstroke of the wings are the pectoralis and supracoracoideus muscles, respectively. Furthermore, these muscles are used in the supination and pronation (i.e., twisting and rotation) of the wings [7,8]. Supination and pronation refer to the change in the angle of attack along the length of the wing, where the aforementioned terms denote either an increase or a decrease in this angle, respectively [5]. Figure 1 illustrates supination and pronation in a bird’s wing.
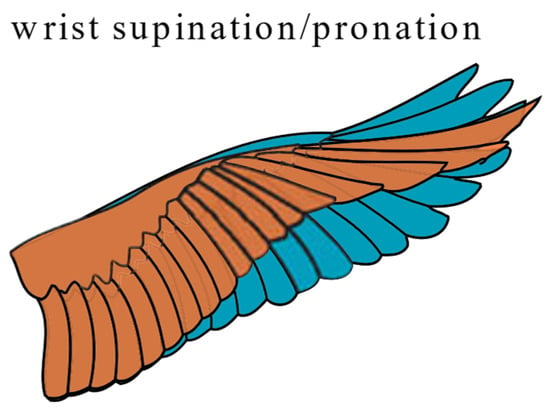
Figure 1.
Illustration of supination and pronation in a bird’s wing: adapted from [9].
Additionally, wing morphing has been observed to provide birds the ability to control pitch through unsteady maneuvers. For example, a gliding-perching maneuver studied by Carruthers et al. [10] demonstrated how an eagle rapidly morphs its wings during an unsteady maneuver to maintain control. In the captured sequence, the eagle flexed its wings inward near the bottom of its approach, which was hypothesized to move the center of pressure forward to initiate an upward pitch. Then, the wings extended with a high angle of attack to initiate stall and generate drag for slowing the maneuver [8,10]. This technique illustrates the eagle’s innate ability to control its wings throughout rapid unsteady maneuvers in contrast to drones, which may require sophisticated control algorithms to maintain stability [11,12,13]. Another study by Harvey et al. [14] combined observations of living seagulls along with results obtained from wind tunnel tests of cadavers to propose that flexing of the elbow allows the gull to change the position of its aerodynamic center relative to the center of gravity, influencing static pitch stability. This control over static pitch stability is useful for recovering after an unsteady occurrence, such as a gust of wind [14].
Several computational investigations have been conducted to study the aerodynamic benefits of wing morphing. For example, Le et al. [15] carried out a study involving the simulation of a NACA 0012 airfoil exhibiting simultaneous plunging and chord flexure. These simulations were conducted using the KFLOW solver incorporating the Navier-Stokes equations. A phase angle was introduced to offset the plunging motion from the chord flexure and was varied to observe the changes in lift and thrust over the plunging cycle. Operating at constant reduced frequency, plunging amplitude, and dimensionless flexural amplitude, the authors found that the highest average coefficient of thrust occurs at a phase angle of 0 degrees, which exceeded the value achieved by the rigid airfoil [15]. Several studies have also been conducted in order to analyze the aerodynamic effects of wing morphing for a pair of flapping wings. Han [16] used a technique based on the low-order unsteady panel method discussed in [17] to simulate the flapping behavior of a seagull using published kinematic parameters. Combinations of flapping, lead and lag, and wing folding were considered along with variation in the flapping frequency in order to determine the unsteady aerodynamic effects. The results indicated that flapping combined with lead and lag helps to increase the produced lift, while flapping combined with wing folding results in higher thrust. Furthermore, the advance ratio was observed to be inversely proportional to lift and drag. This advance ratio is defined in the referenced work as the ratio of the freestream velocity to the wing-tip velocity.
Stanford and Beran [18] reported that bending is more beneficial for increasing thrust at low reduced frequencies, while twisting is more influential at higher reduced frequencies. The reduced frequency is defined as the ratio of the flapping frequency multiplied by the chord length over the freestream velocity. Another optimization study conducted by Ghommem et al. [19] concluded that the morphing effects of bending and torsion do not significantly improve the average coefficient of lift over the flapping cycle when compared to non-morphing flapping wings. In addition, it was shown that the implementation of the second mode shapes for bending and torsion allowed for a significant increase in the propulsive efficiency when compared to the case when only the first mode shapes were utilized. It should be noted that the morphing representation used in [19] incorporated the same method as Stanford and Beran [18], which is different than the morphing implementation utilized in the present work. It should be noted that wing morphing can be achieved in the physical design of a micro air vehicle through the use of shape memory alloys, piezoelectric actuators, or servo-activated wing segments [20,21,22]. In conjunction with the morphing mechanism, a primary mechanism is also needed to flap the wings. In general, this mechanism may be constructed using one or more crankshafts along with connecting rods to convert rotational motion from the electric motor to linear actuation for flapping the wings. The design and implementation of one such mechanism in a multi-flapping-wing drone is discussed in further detail in [23]. In addition, flapping-wing drones may require an additional mechanism to become airborne before initiating the flapping cycle in order to avoid contact of the wings with the ground. One such mechanism was presented in [24], which incorporated a four-bar linkage in the design to mimic the leg extension employed by birds during takeoff.
Several research studies have been conducted to investigate the aerodynamic characteristics of formation flights. First, Lissaman and Schollenberger [2] reported that a V-formation consisting of 25 members could potentially achieve an increase in range of up to 71% compared to a bird in solo flight. Thien et al. [25] simulated three rectangular, rigid wings in V-formation flight using a Navier-Stokes-based solver. Their results indicated that the follower achieves an increase in lift and a decrease in drag as the angle of attack of the leader is increased [25]. Furthermore, Ghommem and Calo [4] conducted an aerodynamic study on flapping wings arranged in a V-formation using the unsteady vortex lattice method. They found that a V-formation of seven members results in a propulsive efficiency increase of 55.8% in the last two trailing birds compared to a bird in solo flight [4].
Given these features, a numerical study is conducted to investigate the combined effects of active bending and torsion as well as group arrangement flight on the aerodynamic performance of flapping wings. To simulate this, the unsteady vortex lattice method (UVLM) is employed to compute the aerodynamic loads generated in a V-formation of both three-member and five-member sizes. The first and second mode shapes of bending and torsion of a cantilever beam are utilized to actively control the wing morphing. Finally, a range of formation angles is tested to determine the optimal formation angle and morphing configuration that maximize the propulsive efficiency of the follower.
2. Aerodynamic Modeling and Active Morphing
2.1. The Unsteady Vortex Lattice Method
UVLM is a method that has been extensively used to conduct aerodynamic analyses of thin wings subject to unsteady conditions [4,18,19]. These unsteady conditions may be caused by several factors, such as fluctuating airflow speed, wake vortices, and variable wing shapes and kinematics. Therefore, UVLM has been widely implemented for analyzing not only fixed wings, but also to examine the aerodynamic behavior of flapping wings [26,27,28]. UVLM is based on solving a system of equations for the bound and wake vortex strengths at each time step within a specified time domain. In order to do this, the wing must first be divided into a specified number of panels.
To create the panels, a wing shape is specified, and the chord and span are divided into the desired number of respective segments. The total number of panels is equal to the product of the chordwise segments and the spanwise segments. Each panel is placed on the surface of the camber line, assuming a thin airfoil is used [27]. Next, a vortex ring is introduced, which is a collection of four, straight vortex segments. A bound vortex ring is superimposed on each of the panels, with the leading edge of the vortex ring being coincident with the quarter-chord line of the panel. In addition, a collocation point is placed at the center of each of the vortex rings and is aligned with the three-quarter-chord line of each panel. At the first time step, only the bound vortex rings are present on the wing surface. Each segment of the bound vortex rings will induce a velocity on each of the collocation points according to the Biot-Savart law [29]. At the end of the first time step, the bound vortex rings at the trailing edge of the wing are shed and moved at the local velocity to create the first row of the wake. The velocity induced on each of the collocation points is again determined using the Biot-Savart law while accounting for both the bound vortex rings and the wake vortex rings (except for the first time step, at which the wake has not been created yet) [17]. Next, the no-penetration condition is imposed by equating the normal component of the velocity induced on each collocation point by the bound vortex rings and the wake vortex rings to the normal component of the velocity at each collocation point due to the motion of the wing. Enforcing the no-penetration condition at each collocation point and accounting for the effect of the wake leads to the linear system shown in the following equation:
where the matrix contains the influence coefficients created by the bound vortex rings, the vector includes the unknown bound vortex strengths, the matrix contains the influence coefficients created by the wake vortex rings, the vector contains the known wake vortex strengths for the current time step (computed from the previous time steps), and the vector contains the normal component of the velocity at each collocation point due to the motion of the wing. Equation (1) may then be rearranged to solve the linear system of equations for the bound vortex strengths of the current time step, which may then be used for calculating the aerodynamic loads applied on the wing using the unsteady Bernoulli equation [18].
2.2. Active Morphing through Bending and Torsion
In this work, the first mode shapes for bending and torsion of a cantilever beam are used to simulate prescribed morphing during the flapping cycle. The choice of the mode shapes of a cantilever beam is made given the aspect ratio of the wing. Furthermore, the prescribed deformation of the wing (active morphing) is achieved using the simple bending and twisting modes of a cantilever beam for the sake of ease of implementation and control during the operation of a bio-inspired drone.
The equation for the nth bending-mode shape of a cantilever beam is given by [30,31]:
where n is the desired mode shape, is an arbitrary constant, and is given by:
in which is the length of the beam and the value for corresponding to each mode shape is obtained by numerically solving the characteristic equation given by:
Finally, the bending response is obtained using Equation (5) as:
where is the actuation frequency for the bending mode.
Furthermore, the torsional-mode shape equation is given by [32]:
where is an arbitrary constant and is obtained by solving the following characteristic equation:
The resulting equation for the torsional response is expressed as:
where is the actuation frequency of the torsion mode.
As for the implementation of active morphing in the UVLM-based solver, the length of the beam is set equal to half of the span and a single prescribed morphing frequency is used for both bending and torsion modes to ensure synchronized kinematics. In addition, a phase angle is included in the bending and torsional responses in order to make the responses either in phase or out of phase with respect to each other. Furthermore, for simulations involving combined modes, the first and second mode shapes are added together before calculating the response. Finally, the leading edge of the wing is specified as the elastic axis for the torsional motion. As an example of this implementation, Figure 2 illustrates the first mode, second mode, and combined modes for bending, torsion, and coupled morphing in a rectangular wing. The flapping amplitude is set to 0 degrees in this example to clearly demonstrate the morphing effects.
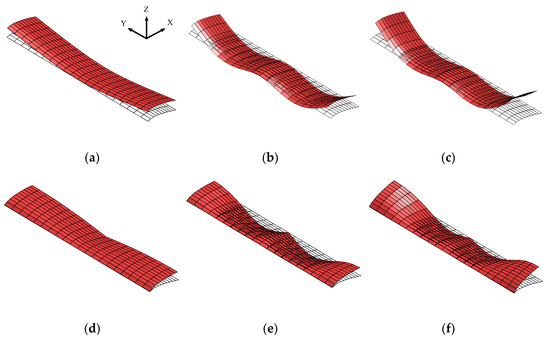

Figure 2.
Bending (a–c), torsion (d–f), and coupled (g–i) morphing in a rectangular wing. Columns from left to right correspond to the first, second, and combined mode shapes, respectively. The wireframe serves as the reference for the undeformed, rigid wing.
3. Qualitative Computational Model Verification
A qualitative study is conducted to simulate a bird in flapping flight using actual experimental data obtained in [33]. In the referenced work, trained kestrels were directed to fly down a corridor, which included a mirror to allow a high-speed camera to capture different angles of the birds. This camera was used to determine the kinematic parameters of each bird over a single flapping cycle and for multiple sequences of flights down the corridor. Masses were attached to the birds to determine the change in flight behavior with the addition of 0.3 N and 0.6 N payloads. For the sequences involving different payloads, the birds were noted to exhibit different flight characteristics. For the purposes of this study, only the observations for the female kestrel are used for conducting simulations. Furthermore, only two cases are considered, namely, one without a payload and another with the 0.6 N payload.
In order to conduct the UVLM simulations, the average recorded values are implemented for each of the two cases. These values are velocity, flapping frequency, total inclination angle, and wing-stroke angle, which are listed in Table 1 for both the unloaded and loaded cases.

Table 1.
Average flight characteristics reported in [33] for the female kestrel, both with and without an added payload.
Furthermore, the wingspan is approximated as 0.5 m for these simulations, as the authors note that the kestrel never reached its maximum wingspan of 0.72 m but remained between 60% and 80% of this value. In addition, the approximate wing shape is extracted using a top-down view of the wing outline shown in their work. Multiple points are selected along this outline and the Image Processing Toolbox in Matlab [34] is used to fit a third-order polynomial to the leading and trailing edges. The Selig 1223 is selected to assign a camber line to the kestrel wing shape, as this avian-like airfoil is noted as being similar to both seagull and merganser airfoils [35].
In the absence of active morphing, the average difference in lift produced over the flapping cycle between the two cases is calculated as 0.86 N. It should be noted that the difference in lift should be greater than or equal to the added payload in order for the kestrel to maintain a stable altitude, which is indeed observed from these simulations. However, it is unlikely that the wings were perfectly rigid throughout the actual flights recorded in the experiments. Therefore, a parametric morphing study is also conducted to determine how wing morphing may influence the difference in lift between the two scenarios. To do this, the first bending and torsional modes of a cantilever beam are implemented into the UVLM code to prescribe morphing during the flapping cycle. This prescribed morphing is implemented as described in Section 2.2. Constant bending and twisting amplitudes are used, while the bending phase and the twisting phase are each varied between 0 and 2π radians to see which combination of phases and which morphing type yields the greatest difference in lift between the unloaded and loaded cases. The results of this study are shown in Figure 3 and Figure 4.

Figure 3.
Difference in lift between the unloaded and loaded cases when only bending (a) or only twisting (b) contributes to wing morphing.
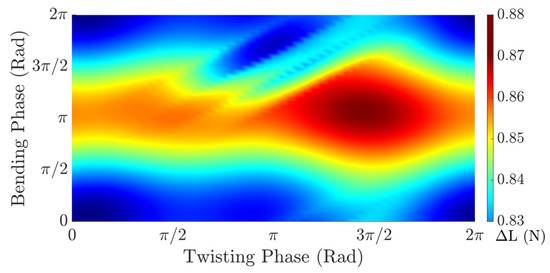
Figure 4.
Difference in lift between the unloaded and loaded cases when coupled bending and twisting are used for wing morphing. The color denotes the difference in lift (N).
Figure 3a demonstrates the difference in lift between the loaded and unloaded cases with variation in the bending phase. In this case, the bending amplitude is set to 2 cm and the twisting amplitude is set to 0 degrees. Variation in the bending phase demonstrates that the highest difference in lift is achieved at a bending phase of 3.39 radians (194.4 degrees). Figure 3b shows the difference in lift when the bending amplitude is set to 0 cm but the twisting angle amplitude is set to 15 degrees. Varying the twisting phase results in the highest difference in lift at 4.52 radians (259.2 degrees).
Figure 4 illustrates the results for the coupled bending and twisting case. Here, the bending and twisting phases are both varied, and both have an effect on the lift generation. This figure demonstrates that the maximum difference in lift is achieved when the bending phase is 3.39 radians (194.4 degrees) and the twisting phase is 4.52 radians (259.2 degrees).
Table 2 shows the maximum difference in lift achieved by each morphing type at the optimal phase angle and reveals that the morphing involving only bending resulted in the greatest difference in lift of 0.88 N. This value corresponds to a 2.1% increase compared to the 0.86 N difference in lift achieved by the rigid wing. The twisting case resulted in a 0.5% decrease in the lift difference, while the coupled case showed a 1.4% increase, indicating that twisting is not beneficial for increasing the difference in lift for this specific scenario. Figure 5 shows the wake generated by the coupled bending and twisting throughout the flapping cycle for the kestrel wing shape in both the unloaded and loaded cases. In each case, the wake illustrates the history of the vortices generated over the specified time domain. Between the two cases, Figure 5b, considering the added payload, resulted in a shorter wake due to the reduced velocity. Furthermore, both wakes illustrate that the highest vorticity is generated during the downstroke of the wings, while negative values are generated during the upstroke.

Table 2.
Difference in lift between the loaded (0.6 N payload) and unloaded simulations for each morphing type at the optimal combination of bending and twisting phases.
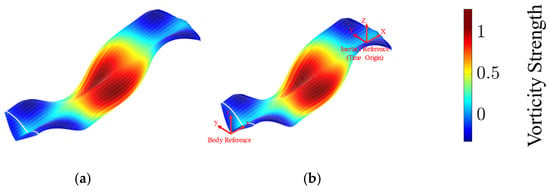
Figure 5.
Wake plots for kestrel simulations of the (a) unloaded case and (b) 0.6 N payload case. These simulations utilized coupled morphing with a bending phase of 3.39 radians and a twisting phase of 4.52 radians. The color bar denotes the vorticity strength and corresponds to both cases.
4. Results and Discussion
4.1. Effect of Active Morphing on the Solo Configuration for Rectangular Wings
Simulations are first conducted using a rectangular wing shape for a single pair of flapping wings. Simulations include a rigid baseline case along with bending, twisting, and coupled cases. Moreover, the wing morphing is implemented in two different ways. First, only the first mode shape of bending and twisting is utilized. Then, the first mode shape is combined with the second mode shape (for bending and twisting, individually) to determine their associated effects on the aerodynamic performance of the flapping wing in forward flight. The simulated wing specifications and morphing parameters are shown in Table 3 and Table 4, respectively. All input parameters listed in Table 3 and Table 4 remain constant for all simulations, regardless of group size. However, the amplitude of the bending and twisting alternates between 0 and the listed value depending on the morphing type (bending, twisting, coupled, or rigid).

Table 3.
Simulation parameters.

Table 4.
Morphing parameters.
Figure 6 and Figure 7 show the variations in the coefficients of lift, thrust, and power over the flapping cycle for a single pair of wings (without any interactions with other wings) for the single-mode case and the combined-mode case, respectively.
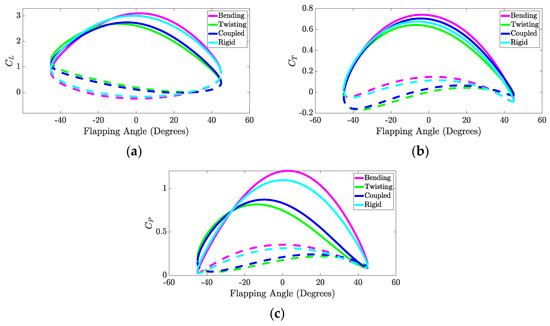
Figure 6.
Variation in coefficients of (a) lift, (b) thrust, and (c) power over the flapping cycle for mode-1 morphing. The solid and dashed lines correspond to the downstroke and upstroke, respectively.
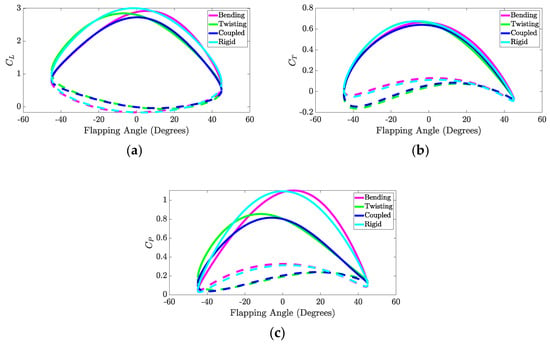
Figure 7.
Variation in coefficients of (a) lift, (b) thrust, and (c) power over the flapping cycle for combined-mode morphing. The solid and dashed lines correspond to the downstroke and upstroke, respectively.
It is noted that the resulting aerodynamic coefficients are highest during the downstroke of the wings, which is noticeably more significant than the upstroke for all morphing cases. Figure 6a shows that the bending case exhibits nearly the same lift behavior as the rigid case for both the downstroke and the upstroke. However, the twisting and coupled cases show a lower coefficient of lift during the downstroke and a higher coefficient of lift during the upstroke compared to the bending and rigid cases. In Figure 6b, the bending case shows only a slight improvement over the rigid case during the downstroke and the upstroke in terms of the coefficient of thrust. On the other hand, the coupled and twisting cases show a decrease in the coefficient of thrust during the downstroke. Figure 6c demonstrates that the bending and rigid cases result in a noticeably higher power coefficient over the downstroke compared to the other morphing types. It should be mentioned that the power coefficient is expressed as:
Here, refers to the aerodynamic power, is the density of the air, denotes the freestream velocity, and is the surface area of the wing [4]. A lower power coefficient is desired for better aerodynamic performance. The expression of aerodynamic power is given by:
where is the pressure, represents the area, is the normal vector, and denotes the velocity due to the unsteady motion of the wing for each panel on the wing surface, respectively [19]. It should be recalled that the pressure is computed from the unsteady Bernoulli equation after computing the circulations of the wing vortex rings.
Considering the combined-mode morphing, Figure 7a shows that the rigid case achieves the highest peak coefficient of lift during the downstroke compared to the other morphing cases. On the other hand, the twisting and coupled cases generally achieve a higher coefficient of lift during the upstroke compared to the bending and rigid cases. Next, each morphing case in Figure 7b shows generally the same behavior during the downstroke, but the rigid and bending cases result in higher coefficients of thrust during the upstroke compared to the twisting and coupled cases. Finally, Figure 7c shows that the bending and rigid cases result in significantly higher power coefficients over the downstroke compared to the other cases, as was previously observed for the mode-one morphing.
Table 5 presents the results obtained for each morphing type in the solo configuration. First, it should be noted that the rigid case performs best in terms of the coefficient of lift. This observation is consistent with the findings of [19], in which the authors noted that wing morphing may not be beneficial for improving lift compared to the baseline, rigid case. The first bending mode achieves the highest coefficient of thrust, while the first twisting mode results in the lowest coefficient of power. Finally, the coupled case (combining the first bending and twisting modes) results in the highest propulsive efficiency compared to the other cases. We note that the propulsive efficiency is defined as the ratio of the power consumed to move the wing in the forward direction over the aerodynamic power [19]. By implementing coupled morphing using the first bending and twisting modes, a 13.3% increase in propulsive efficiency is achieved compared to the rigid case. Indeed, all morphing cases achieve a greater propulsive efficiency than the rigid case with the exception of combined-mode twisting.

Table 5.
Mean coefficient of lift, thrust, power, and propulsive efficiency for each morphing case.
The wake plots for each of the morphing cases are shown in Figure 8, where the wake constitutes the history of vorticity generation over the specified time domain. The downstroke of the wings results in higher values of vorticity, while the upstroke results in lower values. It should be mentioned that, near the end of the flapping cycle, the twisting and coupled cases utilizing both mode-one and combined-mode morphing show lower values of vorticity on the outer surfaces of the wing compared to the bending case. Furthermore, the twisting and coupled cases using combined-mode morphing result in higher wake vorticities near the root of the wings throughout the downstroke.
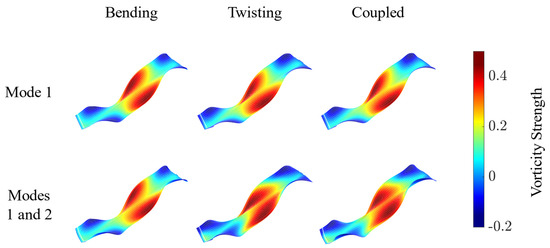
Figure 8.
Wakes generated in each of the morphing configurations in solo flight.
4.2. Three-Body V-Formation for Rectangular Wings: Influence of Active Morphing and Optimal Performance
In this section, the effect of active morphing on the aerodynamic performance of flapping wings in three-body V-formation flight is investigated. A schematic illustrating this flight configuration is shown in Figure 9.
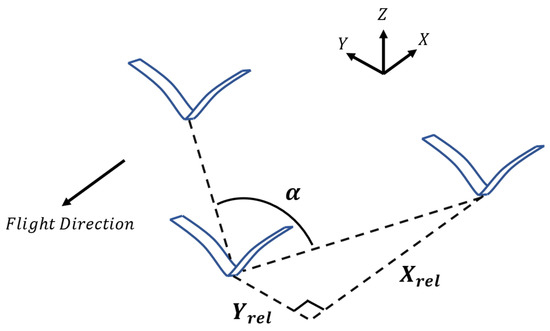
Figure 9.
A schematic illustrating a 3-body V-formation, where denotes the following distance, denotes the lateral spacing distance, and is the formation angle. The difference in height (-direction) between the members is assumed to be zero.
Figure 10 depicts the variations in the aerodynamic coefficients and the propulsive efficiency with the formation angle for each morphing case when only the first mode shapes of bending and twisting are used for the prescribed morphing. It should be noted that in the subsequent analyses, the results are smoothened using a moving mean with a five-degree sliding window. Furthermore, the obtained aerodynamic coefficients are averaged over one flapping cycle. Figure 10a shows the average coefficient of lift for the leader and the follower row in the three-body configuration and demonstrates that the rigid case achieves the highest average coefficient of lift over the considered range of formation angles. Additionally, the follower row achieves its peak lift at a formation angle of 127 degrees. The leader outperforms the follower for lower formation angles in each of the morphing cases. As for the rigid-wing case, the follower outperforms the leader between the formation angles of 134 and 149 degrees. Similarly, the follower row in the bending case outperforms the leader when the formation angle is between 134 and 148 degrees. The performance of the follower row and the leader for all morphing cases merge at higher formation angles due to the minimal influence of the shed wake vortices on each of the wings in the group.
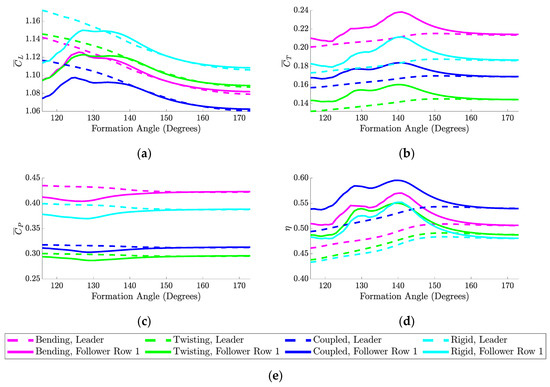
Figure 10.
Three-body V-formation results for each morphing type when only mode 1 is used. Results are presented over a range of formation angles for average (a) coefficient of lift, (b) coefficient of thrust, (c) coefficient of power, and (d) propulsive efficiency. The legend is shown in (e).
Figure 10b demonstrates that the bending case outperforms the rigid case in terms of thrust produced by both the leader and the follower row. It is clear that for each of the morphing cases, the follower is able to produce more thrust than the leader throughout all of the tested formation angles. The follower row produces its peak coefficient of thrust at a formation angle of 141 degrees for the bending, rigid, and coupled cases and at 140 degrees for the twisting case. It should be noted that the leader has an increasing thrust trend as the formation angle increases. This observation is in contrast to Figure 10a, in which the leader demonstrates a decreasing trend in lift as the formation angle increases. Finally, it is noted that the leader and the follower row produce the same thrust for higher formation angles due to the high separation of the members.
Figure 10c shows the power coefficient results for each morphing case. Here, the twisting case conserves the most power over the flapping cycle in terms of both the leader and the follower compared to the other morphing types. Furthermore, the twisting case achieves peak power savings in the follower at a formation angle of 130 degrees. It should be mentioned that the twisting and coupled cases conserve more power than the baseline rigid case, while the bending case results in a higher power coefficient than that obtained for the rigid wings. Finally, the resulting propulsive efficiencies for each morphing case are illustrated in Figure 10d. Here, the coupled morphing case outperforms all other morphing cases in terms of propulsive efficiency and the follower row achieves its peak efficiency at a formation angle of 140 degrees. At this angle, the follower in the coupled case shows a 4.5% increase in propulsive efficiency compared to the rigid-wing case.
As mentioned previously, Figure 10 illustrates the performance of each morphing type when only the first mode shapes of bending and twisting are prescribed for the wing morphing. Next, the first and second mode shapes are added together for both the bending and twisting (individually). The obtained results are displayed in Figure 11. Figure 11a shows the average lift coefficient achieved by each morphing type over the whole range of tested formation angles. Here, the rigid case outperforms the other morphing cases in terms of both the leader and the follower row. The follower row in the rigid case achieves its peak in the lift coefficient at a formation angle of 127 degrees (as noted previously in the mode-one simulations). Figure 11b illustrates the thrust coefficient results obtained for each morphing type over the tested range of formation angles. It is observed that the bending and rigid cases achieve nearly the same peak for the thrust coefficient with a 0.3% difference at a formation angle of 141 degrees. Furthermore, the twisting and the coupled cases achieve nearly the same thrust peak with a 0.5% difference at formation angles of 137 and 136 degrees, respectively.
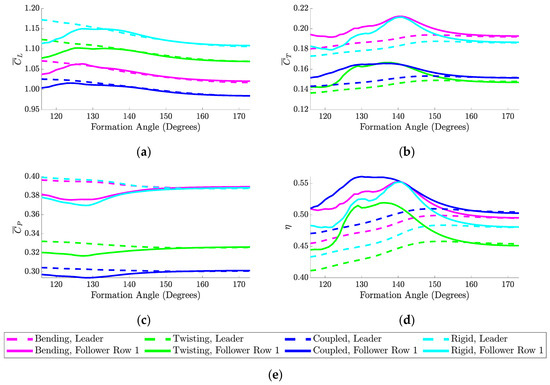
Figure 11.
Three-body V-formation results for each morphing type when mode 1 is combined with mode 2. Results are presented over a range of formation angles for average (a) coefficient of lift, (b) coefficient of thrust, (c) coefficient of power, and (d) propulsive efficiency. The legend is shown in (e).
Figure 11c shows the resulting power coefficient for each morphing type. The coupled morphing case is observed to conserve the most power over the range of tested formation angles. This observation is in contrast to the first-mode morphing simulations, in which the twisting case resulted in the least power consumed. Besides, the rigid-wing case shows nearly the same trend observed when introducing the bending, with only a 1.6% difference in the peak power savings. Given the large difference in minimum follower power coefficient between the rigid and the coupled case at 128 degrees, the pressure distribution on each of the wings is shown in Figure 12 over a single flapping cycle. Near the beginning and end of this flapping cycle, lower pressures are generally observed near the outer surfaces of the wings in the coupled morphing case compared to the rigid case. Finally, Figure 11d reveals that the coupled case still achieves the highest propulsive efficiency at a formation angle of 130 degrees (different from the rigid-wing case). This is in contrast to the first-mode simulations, in which the coupled case produced its peak propulsive efficiency at a formation angle of 140 degrees. Of interest, the bending case shares a nearly identical peak propulsive efficiency with the rigid-wing case with a difference of only 0.1%.
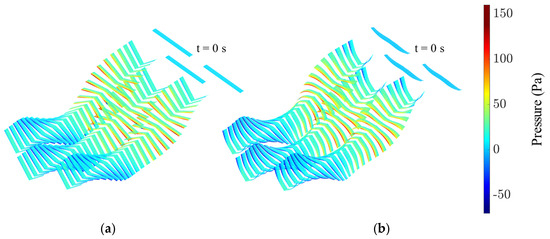
Figure 12.
Pressure distribution across the surface of the wings in a 128-degree V-formation for the (a) rigid wing and (b) morphed wing (coupled combined-mode case). The formation angle corresponds to the minimum power coefficient achieved by the follower row in the coupled, combined-mode case. The starting position of the wings is indicated by the formation at “t = 0 s.” A delay is added before computing the average coefficients over the flapping cycle to avoid transient effects near the beginning of the simulation.
In Table 6, the percent change in peak aerodynamic performance of the follower for the combined-mode morphing in comparison to the first-mode morphing is summarized. It follows from this table that the prescribed morphing, combining the first and second mode shapes, generally results in a decrease in the aerodynamic performance of the follower at the optimal formation angle corresponding to the individual morphing cases. However, there are a few exceptions to this observation. The combined-mode twisting case shows a 3.9% increase in the peak of the thrust coefficient compared to the first twisting mode. Furthermore, the combined-mode bending and coupled cases achieve a 7.0% and 3.1% decrease in minimum aerodynamic power, respectively, compared to the first-mode cases.

Table 6.
Percent change in peak follower row 1 performance for morphing involving modes 1 and 2 compared to only mode 1. Table corresponds to a 3-body V-formation.
4.3. Five-Body V-Formation for Rectangular Wings: Optimal Morphing Configuration and Performance
After investigating the impacts of active morphing on the aerodynamic performance of the leader and followers for the three-body V-formation, the focus is next shifted to analyze the aerodynamic effectiveness when five members are included in the V-formation. The effects of active morphing using the first bending and twisting modes are first explored. The plots in Figure 13 depict the variations in the aerodynamic coefficients and propulsive efficiency with the formation angle. Figure 13a shows that the rigid-wing case outperforms the morphed-wing cases in terms of lift generation, and follower row one outperforms follower row two in all of the different morphing cases across all formation angles tested. The peak of the lift coefficient produced by the rigid follower row one occurs at a formation angle of 129 degrees. The plotted curves in Figure 13b present the resulting thrust coefficient for each morphing case. Again, morphing the wing through bending leads to superior performance in terms of thrust coefficient over the considered range of formation angles in comparison to the other morphing cases. The second follower row outperforms the first one for each morphing type until a formation angle of approximately 140 degrees is reached. Beyond this angle, both of the follower rows show generally the same performance until they merge with the leader’s performance at high formation angles. The peak of the thrust coefficient produced by follower row two in the bending case is found at a formation angle of 140 degrees.
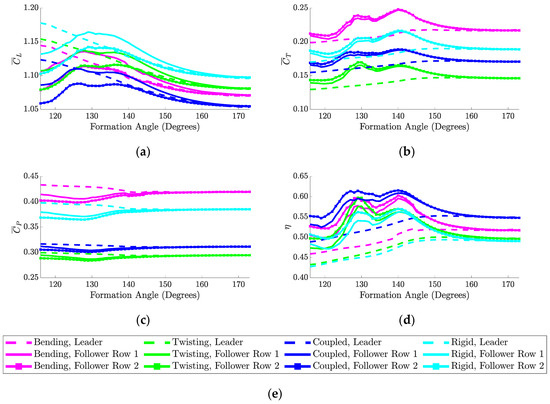
Figure 13.
Five-body V-formation results for each morphing type when only mode 1 is used. Results are presented over a range of formation angles for average (a) coefficient of lift, (b) coefficient of thrust, (c) coefficient of power, and (d) propulsive efficiency. The legend is shown in (e).
Figure 13c shows that the twisting case conserves the most power per flapping cycle over the entire range of formation angles. Furthermore, follower row two conserves more aerodynamic power than follower row one for each morphing type and for lower formation angles. For higher formation angles, the results for both of the follower rows merge with those of the leader due to the reduced aerodynamic interactions of the wings with each other and their shed vortices. The minimum aerodynamic power coefficient achieved by follower row two in the twisting case is obtained at a formation angle of 129 degrees. Finally, Figure 13d shows the resulting propulsive efficiencies for each morphing case. Clearly, the coupled case outperforms all of the other morphing cases over the range of tested formation angles. The peak of the propulsive efficiency of follower row two in the coupled case is located at a formation angle of 140 degrees. Of interest, the leader experiences a decreasing trend in terms of lift and power coefficients and shows an increasing trend in terms of the thrust coefficient and propulsive efficiency. Furthermore, the leader results always merge with those of the follower at higher formation angles due to the high separation between the group members. This characteristic trend of the leader is also evident in Figure 10, Figure 11, and Figure 14.
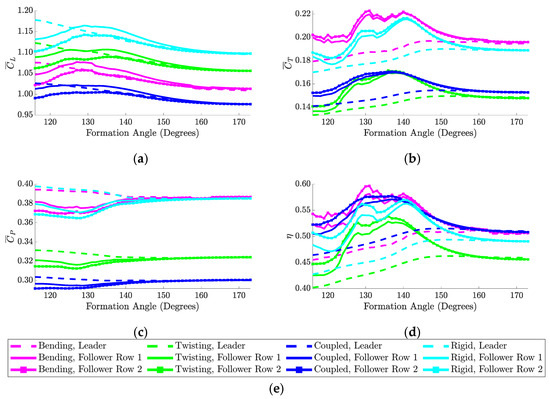
Figure 14.
Five-body aerodynamic performance for each morphing type when mode 1 is combined with mode 2. Results are presented over a range of formation angles for average (a) coefficient of lift, (b) coefficient of thrust, (c) coefficient of power, and (d) propulsive efficiency. The legend is shown in (e).
Figure 14 shows the simulation results for all aerodynamic coefficients and the propulsive efficiency when the first and second modes are combined for active morphing. The plotted curves in Figure 14a present the lift coefficient results and illustrate that the rigid-wing case again outperforms the other morphing cases. Additionally, the peak for follower row one in the rigid-wing case is found at a formation angle of 129 degrees, which is close to the peak location of 127 degrees found in Figure 11a. Next, Figure 14b shows that the bending case outperforms the other morphing cases in terms of thrust coefficient, although the advantage is not as pronounced compared to when only the first mode was used. Figure 14c demonstrates that the coupled case achieves the lowest power coefficient for both the leader and the follower rows. Furthermore, the local minima corresponding to the follower rows show a decrease compared to the first-mode results for both the bending and coupled cases, as noted in Table 7 and Table 8. Furthermore, the second follower row outperforms the first one over the considered range of formation angles. The plots in Figure 14d show the propulsive efficiency results. Of interest, the coupled case shares a similar trend with the bending case. However, the bending case has the highest peak for follower row two, corresponding to a formation angle of 131 degrees.

Table 7.
Percent change in peak follower row 1 performance for morphing involving modes 1 and 2 compared to only mode 1.

Table 8.
Percent change in peak follower row 2 performance for morphing involving modes 1 and 2 compared to only mode 1.
Table 7 and Table 8 present the change in the aerodynamic performance when transitioning from mode-one morphing to combined-mode morphing for the first and second follower rows, respectively, in the five-body formation. Of interest, the only noticeable advantage of using combined-mode morphing is to improve the peak in the thrust when activating only the twisting, or to decrease the minimum power coefficient for the bending and coupled cases.
4.4. Group Size Considerations: Efficient Design
As different group sizes and various morphing types are considered in this work, the optimal combination is selected based on the highest peak propulsive efficiency obtained by the followers. This optimal selection is found to be the five-body V-formation at a formation angle of 140 degrees, which incorporates single-mode coupled morphing. This selection is based on the results shown previously in Figure 13d.
In order to compare the results of the solo configuration with those obtained for the three-body and five-body V-formations, global aerodynamic performance, defined as the average aerodynamic coefficient or propulsive efficiency of the leader and follower row (or rows) at a specific formation angle, is introduced. The formation angle selected for this comparative study is 140 degrees based on the identified superior performance at that angle from the previous analysis.
Figure 15 compares the solo performance against the global aerodynamic performance of the three-body and five-body V-formations at a formation angle of 140 degrees for all of the morphing cases utilizing only the first mode shapes. Figure 15a shows that the global lift coefficient is higher for the three-body and five-body V-formations compared to the solo configuration results. The five-body configuration utilizing only twisting shows the greatest improvement of 1.9% over the solo lift coefficient. It is noted that the global coefficient of lift values for all group sizes for the rigid-wing case outperforms those obtained by the other morphing cases. Figure 15b demonstrates that, for all of the morphing cases, the global thrust coefficient increases as the number of members in the V-formation increases. The bending case shows an increase of 11% for the five-body V-formation compared to a solo flight. Furthermore, the bending case shows the highest global thrust coefficient for all tested group sizes compared to the other morphing cases. Figure 15c demonstrates the decrease in the global power coefficient as the group size of the V-formation increases. The five-body bending case achieves the greatest power savings with a 2.9% reduction in the power coefficient compared to the solo bending case. Finally, Figure 15d demonstrates that as the number of members in the V-formation increases, the global propulsive efficiency increases as well. The coupled morphing case shows the highest global propulsive efficiency for each group size, while the bending case achieves the greatest increase of 14.4% for the five-body group size in comparison to the solo-flight bending case.
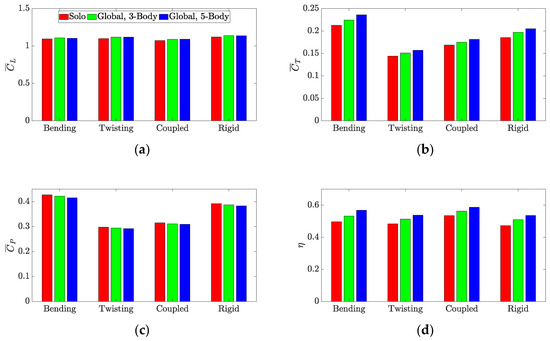
Figure 15.
Comparison of global aerodynamic performance for different group sizes when mode-1 morphing is implemented. Results are compared in terms of (a) coefficient of lift, (b) coefficient of thrust, (c) coefficient of power, and (d) propulsive efficiency.
Figure 16 presents the global performance metrics when considering the combined-mode morphing. The obtained trend of the thrust and power coefficients along with the propulsive efficiency is similar to that observed when using the first mode shapes. Moreover, the global lift coefficient is found higher in the V-formations than in the solo configuration (although there is not a clear trend with increasing group size). Of interest, the rigid case outperforms the other morphing cases in terms of the global lift coefficient for all group sizes. This observation was also noted previously for the mode-one global lift coefficient, as shown in Figure 15a.
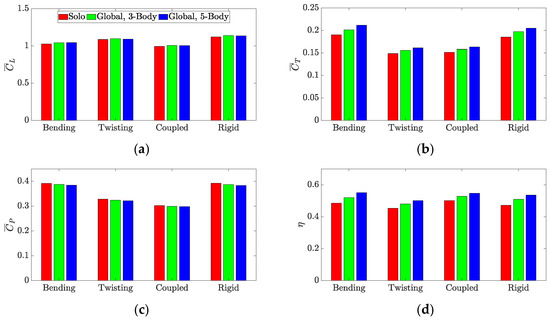
Figure 16.
Comparison of global aerodynamic performance for different group sizes when combined-mode morphing is implemented. Results are compared in terms of (a) coefficient of lift, (b) coefficient of thrust, (c) coefficient of power, and (d) propulsive efficiency.
The global aerodynamic performance is generally lower for the combined-mode morphing compared to the mode-one morphing. To gain further insight into the impact of the different types of morphing on the global aerodynamic performance of the five-body formation, Table 9 presents the change in the global aerodynamic performance metrics when using combined-mode morphing instead of mode-one morphing. Clearly, the main advantage of the deployment of combined-mode morphing in a V-formation is to improve the global thrust coefficient in the twisting case or to decrease the global power coefficient in the bending and coupled cases.

Table 9.
Percent change in global performance of the 5-body V-formation for morphing involving combined-modes compared to only mode 1.
5. Conclusions
In this work, an aerodynamic analysis was conducted to determine the formation angle and morphing type that lead to the optimal aerodynamic performance of the followers in V-formation flight using a rectangular wing shape. The prescribed morphing used in this work was based on the first two mode shapes for the bending and twisting of a thin cantilever beam, where this bending and twisting were either coupled or prescribed separately. Furthermore, the morphing in this work used either the first mode or a combination of the first and second modes for the bending and twisting, respectively. This morphing approach was implemented in the unsteady aerodynamic simulator, which was qualitatively verified against experimental data of trained kestrel flights. The optimal configuration in terms of maximum propulsive efficiency of the follower rows was achieved when morphing the wings by the combination of the first bending and twisting modes in a five-body V-formation. The simulation results also demonstrated an improvement in the global thrust and power coefficients as well as the propulsive efficiency when increasing the number of members in the V-formation. Finally, the aerodynamic analysis revealed that the active morphing using the first mode shape of bending and twisting is more beneficial for improving the performance of the formation compared to combined-mode morphing including the second mode shapes. Furthermore, the wing morphing was observed to improve the thrust coefficient and reduce the power coefficient in both solo and V-formation flights. This indicates that wing morphing enables faster forward flight and less power consumption. On the other hand, wing morphing did not provide any noticeable aerodynamic benefit in terms of lift generation.
Author Contributions
Conceptualization, E.B., M.G., R.V. and A.A.; methodology, E.B., M.G. and A.A.; software, E.B. and M.G.; investigation, E.B.; formal analysis, E.B.; visualization, E.B. and M.G.; writing—original draft, E.B.; writing—review and editing, M.G., R.V. and A.A.; supervision, M.G., R.V. and A.A.; project administration, A.A. All authors have read and agreed to the published version of the manuscript.
Funding
R. Vasconcellos acknowledges the financial support of the Brazilian agency CAPES, grant number 88881.302889/2018-01.
Data Availability Statement
The data that supports the findings of this study are available upon reasonable request from the authors.
Acknowledgments
This work utilized resources from the New Mexico State University High Performance Computing Group, which is directly supported by the National Science Foundation (OAC-2019000), the Student Technology Advisory Committee, and New Mexico State University, and benefits from being included in various grants (DoD ARO-W911NF1810454; NSF EPSCoR OIA-1757207; and the Partnership for the Advancement of Cancer Research, supported in part by NCI grant U54 CA132383 (NMSU)).
Conflicts of Interest
The authors declare that they have no conflict of interest.
References
- Cutts, C.J.; Speakman, J.R. Energy saving in formation flight of pink-footed geese. J. Exp. Biol. 1994, 189, 251–261. [Google Scholar] [CrossRef] [PubMed]
- Lissaman, P.B.S.; Shollenberger, C.A. Formation flight of birds. Science 1970, 168, 1003–1005. [Google Scholar] [CrossRef] [PubMed]
- Weiderkehr, H.; Martin, J.; Clerquin, Y.; Alexandre, P.; Jiraskova, S. Energy saving in flight formation. Nature 2001, 413, 697–698. [Google Scholar]
- Ghommem, M.; Calo, V.M. Flapping wings in line formation flight: A computational analysis. Aeronaut. J. 2014, 118, 485–501. [Google Scholar] [CrossRef]
- Altshuler, D.; Bahlman, J.; Dakin, R.; Gaede, A.; Goller, B.; Lentink, D.; Segre, P.; Skandalis, D. The biophysics of bird flight: Functional relationships integrate aerodynamics, morphology, kinematics, muscles, and sensors. Can. J. Zool. 2015, 93, 961–975. [Google Scholar] [CrossRef] [Green Version]
- Gopalakrishnan, P.; Tafti, D.K. Effect of wing flexibility on lift and thrust production in flapping flight. AIAA J. 2010, 48, 865–877. [Google Scholar] [CrossRef]
- Tobalske, B.W. Biomechanics of bird flight. J. Exp. Biol. 2007, 210, 3135–3146. [Google Scholar] [CrossRef] [Green Version]
- Taylor, G.K.; Carruthers, A.C.; Hubel, T.Y.; Walker, S.M. Wing morphing in insects, birds and bats: Mechanism and function. In Morphing Aerospace Vehicles and Structures; Wiley: Chichester, UK, 2012; pp. 11–40. [Google Scholar] [CrossRef]
- Chin, D.D.; Matloff, L.Y.; Stowers, A.K.; Tucci, E.R.; Lentink, D. Inspiration for wing design: How forelimb specialization enables active flight in modern vertebrates. J. R. Soc. Interface 2017, 14, 20170240. [Google Scholar] [CrossRef] [Green Version]
- Carruthers, A.C.; Thomas, A.L.; Taylor, G.K. Automatic aeroelastic devices in the wings of a steppe eagle Aquila nipalensis. J. Exp. Biol. 2007, 210, 4136–4149. [Google Scholar] [CrossRef] [PubMed] [Green Version]
- Orsag, M.; Cesic, J.; Haus, T.; Bogdan, S. Spincopter wing design and flight control. J. Intell. Robot. Syst. 2013, 70, 165–179. [Google Scholar] [CrossRef]
- Bulka, E.; Nahon, M. Automatic control for aerobatic maneuvering of agile fixed-wing UAVs. J. Intell. Robot. Syst. 2019, 93, 85–100. [Google Scholar] [CrossRef]
- Aboelezz, A.; Mohamady, O.; Hassanalian, M.; Elhadidi, B. Nonlinear Flight Dynamics and Control of a Fixed-Wing Micro Air Vehicle: Numerical, System Identification and Experimental Investigations. J. Intell. Robot. Syst. 2021, 101, 64. [Google Scholar] [CrossRef]
- Harvey, C.; Baliga, V.B.; Lavoie, P.; Altshuler, D.L. Wing morphing allows gulls to modulate static pitch stability during gliding. J. R. Soc. Interface 2019, 16, 20180641. [Google Scholar] [CrossRef]
- Le, T.Q.; Ko, J.H.; Byun, D.; Park, S.H.; Park, H.C. Effect of chord flexure on aerodynamic performance of a flapping wing. J. Bionic Eng. 2010, 7, 87–94. [Google Scholar] [CrossRef]
- Han, C. Investigation of unsteady aerodynamic characteristics of a seagull wing in level flight. J. Bionic Eng. 2009, 6, 408–414. [Google Scholar] [CrossRef]
- Katz, J.; Plotkin, A. Low-Speed Aerodynamics, 2nd ed.; Cambridge University Press: Cambridge, UK, 2010. [Google Scholar]
- Stanford, B.K.; Beran, P.S. Analytical sensitivity analysis of an unsteady vortex-lattice method for flapping-wing optimization. J. Aircr. 2010, 47, 647–662. [Google Scholar] [CrossRef]
- Ghommem, M.; Hajj, M.R.; Mook, D.T.; Stanford, B.K.; Beran, P.S.; Snyder, R.D.; Watson, L.T. Global optimization of actively morphing flapping wings. J. Fluids Struct. 2012, 33, 210–228. [Google Scholar] [CrossRef]
- Bil, C.; Massey, K.; Abdullah, E.J. Wing morphing control with shape memory alloy actuators. J. Intell. Mater. Syst. Struct. 2013, 24, 879–898. [Google Scholar] [CrossRef]
- Vos, R.; Breuker, R.D.; Barrett, R.; Tiso, P. Morphing wing flight control via postbuckled precompressed piezoelectric actuators. J. Aircr. 2007, 44, 1060–1068. [Google Scholar] [CrossRef]
- Abdulrahim, M.; Lind, R. Flight testing and response characteristics of a variable gull-wing morphing aircraft. In Proceedings of the AIAA Guidance, Navigation, and Control Conference and Exhibit, Providence, RI, USA, 16–19 August 2004. [Google Scholar]
- Billingsley, E.; Ghommem, M.; Vasconcellos, R.; Abdelkefi, A. On the Aerodynamic Analysis and Conceptual Design of Bioinspired Multi-Flapping-Wing Drones. Drones 2021, 5, 64. [Google Scholar] [CrossRef]
- Hudson, O.A.; Fanni, M.; Ahmed, S.M.; Sameh, A. Autonomous Flight Take-off in Flapping Wing Aerial Vehicles. J. Intell. Robot. Syst. 2020, 98, 135–152. [Google Scholar] [CrossRef]
- Thien, H.P.; Moelyadi, M.A.; Muhammad, H. Effects of leaders position and shape on aerodynamic performances of V flight formation. arXiv 2008, arXiv:0804.3879. [Google Scholar]
- Nguyen, A.T.; Kim, J.-K.; Han, J.-S.; Han, J.-H. Extended unsteady vortex-lattice method for insect flapping wings. J. Aircr. 2016, 53, 1709–1718. [Google Scholar] [CrossRef]
- Roccia, B.A.; Preidikman, S.; Massa, J.C.; Mook, D.T. Modified unsteady vortex-lattice method to study flapping wings in hover flight. AIAA J. 2013, 51, 2628–2642. [Google Scholar] [CrossRef] [Green Version]
- Nguyen, A.T.; Han, J.S.; Han, J.H. Effect of body aerodynamics on the dynamic flight stability of the hawkmoth Manduca sexta. Bioinspiration Biomim. 2016, 12, 016007. [Google Scholar] [CrossRef]
- Bertin, J.J.; Cummings, R.M. Aerodynamics for Engineers, 6th ed.; Pearson: Boston, MA, USA, 2014. [Google Scholar]
- Parks, D.; Anand, L. Lab 1: Elastic Behavior in Tension, Bending, Buckling, and Vibration; Mechanics and Materials II; Massachusetts Institute of Technology: Cambridge, MA, USA, 2004. [Google Scholar]
- Talukdar, S. Vibration of Continuous Systems; Indian Institute of Technology: Guwahati, India, 2016. [Google Scholar]
- Abdelkefi, A.; Najar, F.; Nayfeh, A.H.; Ayed, S.B. An energy harvester using piezoelectric cantilever beams undergoing coupled bending–torsion vibrations. Smart Mater. Struct. 2011, 20, 115007. [Google Scholar] [CrossRef]
- Videler, J.J.; Groenewegen, A.; Gnodde, M.; Vossebelt, G. Indoor flight experiments with trained kestrels: II. The effect of added weight on flapping flight kinematics. J. Exp. Biol. 1988, 134, 185–199. [Google Scholar] [CrossRef]
- MathWorks. Image Processing Toolbox. 2021. Available online: https://mathworks.com/help/images (accessed on 4 September 2021).
- Liu, T.; Kuykendoll, K.; Rhew, R.; Jones, S. Avian wing geometry and kinematics. AIAA J. 2006, 44, 954–963. [Google Scholar] [CrossRef]
Publisher’s Note: MDPI stays neutral with regard to jurisdictional claims in published maps and institutional affiliations. |
© 2021 by the authors. Licensee MDPI, Basel, Switzerland. This article is an open access article distributed under the terms and conditions of the Creative Commons Attribution (CC BY) license (https://creativecommons.org/licenses/by/4.0/).